Embed Size (px)
Citation preview

EPA’s Office of Enforcement Compliance Assurance Initiatives
1
Assurance Initiatives

Question 1
� Who is this guy and where is Adam?
2

EPA Administrator’s Budget
� Taking Action on Climate Change
� Cleaning Up Our Communities
� Improving Air Quality
� Expanding the Conversation on
3
� Expanding the Conversation on Environmentalism and Working for Environmental Justice
� Protecting America’s Waters
� Building Strong State and Tribal Partnerships
� Assuring the Safety of Chemicals
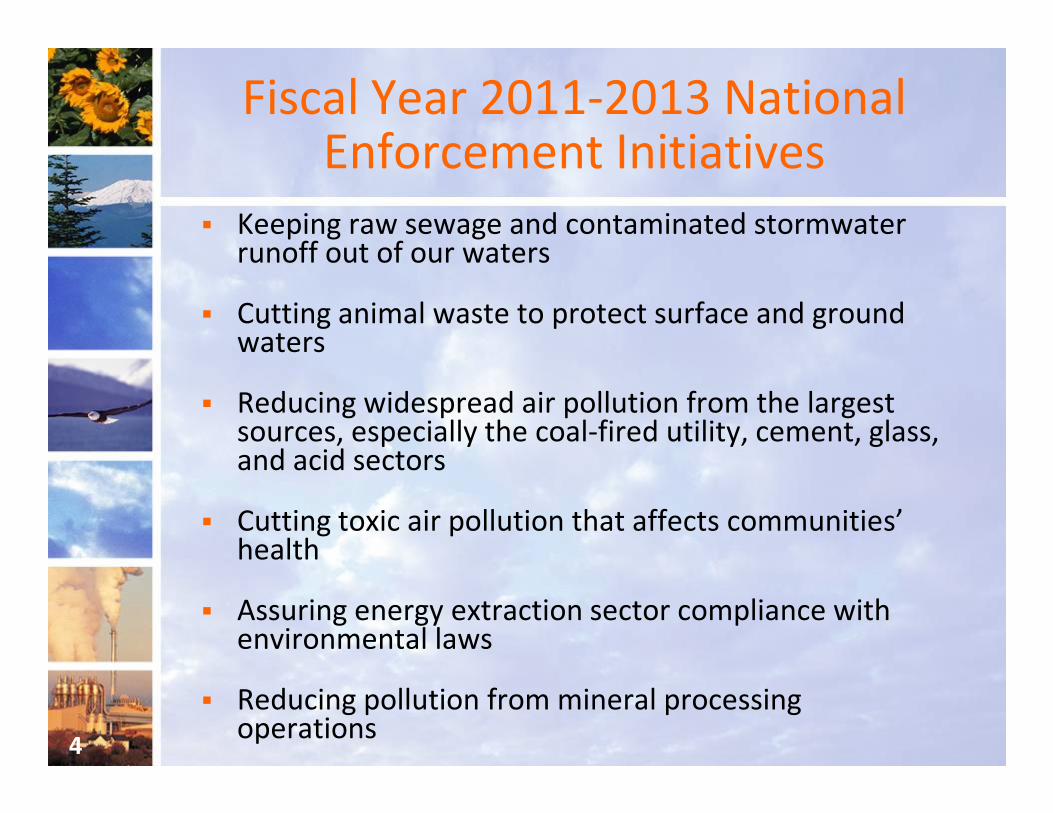
Fiscal Year 2011-2013 National Enforcement Initiatives
� Keeping raw sewage and contaminated stormwater runoff out of our waters
� Cutting animal waste to protect surface and ground waters
� Reducing widespread air pollution from the largest
4
� Reducing widespread air pollution from the largest sources, especially the coal-fired utility, cement, glass, and acid sectors
� Cutting toxic air pollution that affects communities’ health
� Assuring energy extraction sector compliance with environmental laws
� Reducing pollution from mineral processing operations

Process
� Initiatives selection based on three criteria
– a history of noncompliance with
environmental laws
5
– the potential for significant environmental
or human health benefits
– an appropriate Federal role

Air Toxics Initiative
� Focus Areas
– Flares
– Leak detection and repair (LDAR)
– Benzene/HAPs
6
– Benzene/HAPs
– Community Based Approach
– Excess Emissions
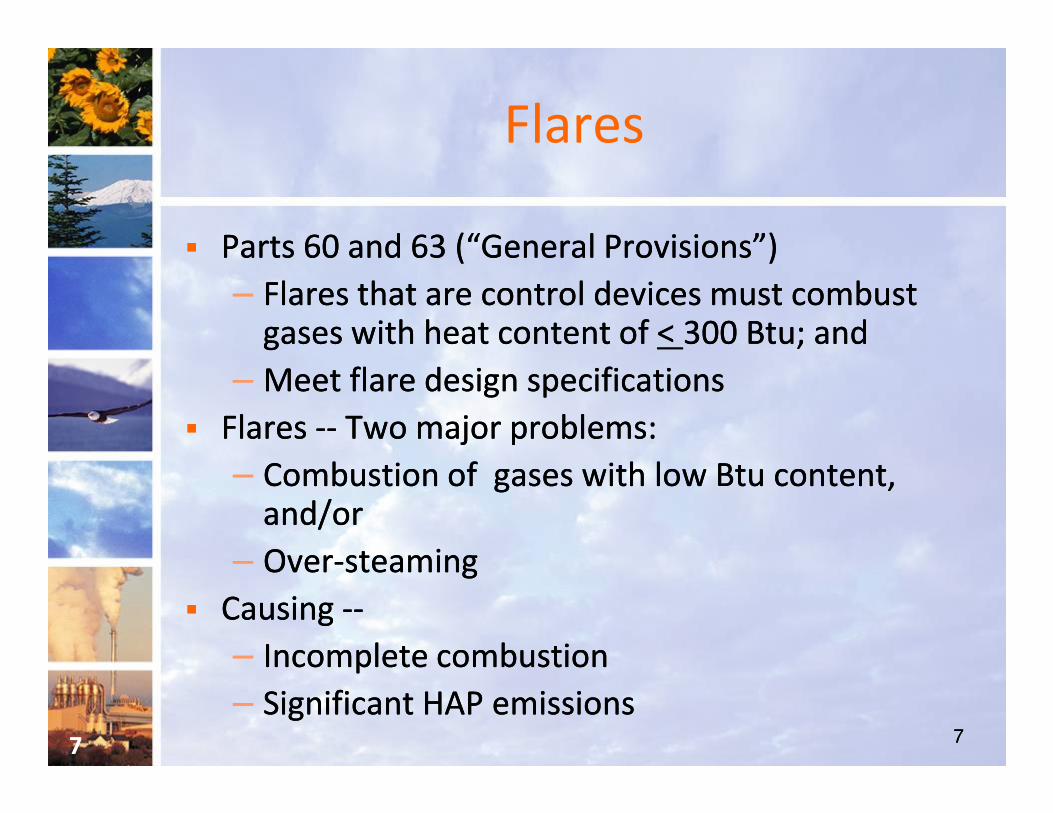
Flares
�� Parts 60 and 63 (“General Provisions”) Parts 60 and 63 (“General Provisions”)
–– Flares that are control devices must combust Flares that are control devices must combust gases with heat content of gases with heat content of < < 300 Btu; and 300 Btu; and
–– Meet flare design specificationsMeet flare design specifications
Flares Flares ---- Two major problems: Two major problems:
777
�� Flares Flares ---- Two major problems: Two major problems:
–– Combustion of gases with low Btu content, Combustion of gases with low Btu content, and/orand/or
–– OverOver--steaming steaming
�� Causing Causing ----
–– Incomplete combustionIncomplete combustion
–– Significant HAP emissionsSignificant HAP emissions

Steam UseSteam Use
Good Combustion:Good Combustion:
Turbulent, Hot FlameTurbulent, Hot Flame
8
Excess Steam:Excess Steam:
Dilution andDilution and
Cooling of FlameCooling of Flame
Insufficient Steam:Insufficient Steam:
Smoke due to poor mixingSmoke due to poor mixing--
Not enough oxygenNot enough oxygen

OversteamingOversteaming
�� Range of Proper Steam AdditionRange of Proper Steam Addition
–– Low End Low End –– Just enough to supply sufficient oxygen Just enough to supply sufficient oxygen
and avoid smoke (termed: incipient smoke)and avoid smoke (termed: incipient smoke)
–– Recommended (or design) Parameter Recommended (or design) Parameter –– Suggested Suggested
999
optimum by manufacturer, APIoptimum by manufacturer, API
•• Stated in lb steam/lb vent gas, norms near 0.5 lb/lbStated in lb steam/lb vent gas, norms near 0.5 lb/lb
–– High End High End –– Flame quenching by lowering Flame quenching by lowering
temperaturetemperature
–– Operating between “incipient smoke point” and Operating between “incipient smoke point” and
“recommended ratio” results in good combustion, “recommended ratio” results in good combustion,
andand
–– Reduces steam use, saving moneyReduces steam use, saving money

Rationale for Steam/Vent Rationale for Steam/Vent Gas MultipleGas Multiple
Report Comparing Steam/Vent Gas Ratio to Efficiency
Compound Tested API 521 Recommended Ratio for the Compounds Tested
Highest Steam/Gas Ratio while Maintaining High Efficiency
Multiple of Recommended Ratio
Column A Column B Column B/A
10
Mellqvist Ethylene 0.45 2 4.4
1983 CMA/EPA Propylene 0.55 3.5 6.4
Castineira Methane 0.1 0.47 4.7
Pohl
Marathon Tests
Propane
Various
0.275
0.3 - 0.56
1
1 - 2
3.7
2 to 4

Steam and Combustion Efficiency Steam and Combustion Efficiency from EPA/CMA Studyfrom EPA/CMA Study
(API(API--521 recommended steam521 recommended steam--toto--gas ratio 0.5 gas ratio 0.5 –– 0.6)0.6)
1983 EPA/CMA Report
85
90
95
100
Co
mb
usti
on
Eff
cie
ncy .
111111
50
55
60
65
70
75
80
85
0 1 2 3 4 5 6 7 8
Steam to Gas Ratio (lb/lb)
Co
mb
usti
on
Eff
cie
ncy .

Company XCompany X
12

Company XCompany X
13

INEOS / Lanxess Facility
14
INEOS / Lanxess Settlement
� The Meredith Hitchens Elementary School is located across the street from the Lanxess/INEOS facility. – Monitoring: Ohio initiated ambient air monitoring on
the school’s roof after malfunctions in late 2004 and early 2005 caused releases of BD and AN.
15
early 2005 caused releases of BD and AN.
– School’s Temporary Closure: Due in part to concerns about children’s exposure to the facility’s emissions, the elementary school closed and its 370 students were moved.
– Impact of Settlement: This settlement results in the reduction of air toxics at a facility whose emissions were previously identified as a potential risk to school children.

INEOS / Lanxess Settlement
Injunctive Relief
� Flare Injunctive Relief – meet a steam-to-total gas ratio of 3.6:1 in the
combustion zone
16
combustion zone – meet 200 BTU after steam addition after the
flame– meet 385 BTU/scf in the waste gas prior to
steam addition before the flame– monitor the flare’s operating parameters– perform Passive Fourier Transform Infra Red
spectroscopy (PFTIR)

INEOS / Lanxess Settlement
Injunctive Relief (cont’d)
� Enhanced Leak Detection and Repair Relief
� Install a biofilter system at the wastewater treatment facility to capture and control AN
17
� Install a biofilter system at the wastewater treatment facility to capture and control AN emissions.
� Install a scrubber and route the emissions from the scrubber to the facility’s existing thermal oxidizer, if a process line currently shut down reopens.
� Implement CERCLA/EPCRA relief to prevent future reporting violations

INEOS / Lanxess Settlement
� Reductions– 360 TPY of BD reductions from the flare
controls – ~1.1 TPY of AN reductions from the
Biofilter Project
18
Biofilter Project– ~ 59.6 TPY of HAP reductions from the
enhanced LDAR relief � Penalty: $3.1 million dollars� State Partner: Ohio

Leak Detection and Repair (LDAR)
�� Leaking equipment Leaking equipment -- largest source of largest source of hazardous air pollutant emissions in the hazardous air pollutant emissions in the petroleum refinery and chemical petroleum refinery and chemical manufacturing sectors manufacturing sectors
Noncompliance and the potential for Noncompliance and the potential for
191919
�� Noncompliance and the potential for Noncompliance and the potential for significant emission reductionssignificant emission reductions
–– EPA’s LDAR compliance evaluations reveal EPA’s LDAR compliance evaluations reveal
higher leak rates than industry’shigher leak rates than industry’s
–– EPA EPA -- 5% leak rate 5% leak rate
–– Industry Industry -- 1% leak rate1% leak rate

Formosa Plastics (PVC) Point Comfort, Texas
202020

Formosa Plastics (PVC) E. Baton Rouge
21

Formosa Consent Decree(Lodged September 30, 2009)
� Comprehensive Enhanced LDAR Program corrective actions, including
– Employee training
– 3rd party LDAR audits
– Lower leak definition for initiating repair
22
– Lower leak definition for initiating repair
– Reduced “delay of repair” listing
– Replace leaking equipment with newer technology
– Include 160,000 connectors in LDAR program
� Annual emissions reduced: 6,570,000 lbs of VOCs, including HAPs such as vinyl chloride
� Civil Penalty $2,800,000

New Source Review Initiative
� National NSR Areas
– Coal-fired Utilities
– Acid Manufacturing
23
– Acid Manufacturing
– Glass
– Cement

Coal-Fired Utilities
24

Coal-Fired Utilities: Current Litigation
� Alabama Power Company
� Cinergy (now Duke Energy Indiana and Duke Energy Ohio)
Duke Energy Corporation
25
� Duke Energy Corporation
� Louisiana Generating – Big Cajun 2 (filed February 2009)
� Midwest Generation (filed August 2009)

Midwest Generation
� Illinois fleet (6 plants, 13 units)
� Motion to Dismiss granted March 9, 2010, as to:
– liability for alleged modifications of prior
26
– liability for alleged modifications of prior
owner
– penalty claims for the one alleged
modification performed by Midwest
Generation

Duke Wabash River
�� On appeal to the Seventh CircuitOn appeal to the Seventh Circuit
�� Issues appealed:Issues appealed:–– Statute of LimitationsStatute of Limitations
–– Expert witness testimonyExpert witness testimony
27
–– Expert witness testimonyExpert witness testimony
–– Jury instructions/emissions testJury instructions/emissions test

Coal-Fired Utilities: Results
� 18 Settlements
– > 2 million tpy of reductions of SO2 and NOx
(upon full implementation)
– > $11.9 billion – injunctive relief
28
– > $11.9 billion – injunctive relief
– > $65 million – civil penalties
– > $239 million –mitigation projects

Westar – Jeffrey Energy Station
� Complaint filed February 2009
� Settled January 2010
� Injunctive Relief – $500 million
78,600 tons of SO and NO emission
29
� 78,600 tons of SO2 and NOx emission reductions
� $3 million civil penalty
� $6 million for mitigation
Duke Gallagher Settlement
� Complaint filed November 1999
� Settled December 2009
� Injunctive Relief -- $85 million
� 35,000 tons of SO2 emission reductions
30
� 35,000 tons of SO2 emission reductions
� $1.75 million civil penalty
� $6.25 million for mitigation
Coal-Fired Utilities: Other Litigation
� Otter Tail Citizen Suit (Big Stone)
– On appeal before Eighth Circuit
– Statute of Limitations and Collateral Attack
– United States filed amicus brief and
31
– United States filed amicus brief and
participated at oral argument
� TVA Citizen Suit (Bull Run)
– Routine Maintenance Decision (March
2010)

Acid Manufacturing Sector
32

Acid Sector Enforcement
� Notices of Violations- 13
– Agrifos, Pasadena, TX
– Big River Zinc, Sauget, IL
(NSPS)
– Marsulex, Toledo, OH
– PCS Nitrogen, Geismar, LA
– PVS Chemical, Chicago, IL
33
(NSPS)
– Chemtrade, Cairo, OH
– DuPont, James River, VA
– DuPont, North Bend, OH
– Dyno Nobel, Donora, PA
– Lucite, Belle, WV
– PVS Chemical, Chicago, IL
(NSPS)
– Royster-Clark, North
Bend, OH
– J.R. Simplot, Pocatello, ID
– PCS Nitrogen, Geismar, LA

Acid Sector - Results to Date
Six Settlements Covering 25 Acid Plants– Agrium/Royster Clark
• single facility nitric acid settlement (Feb ‘07)
– Rhodia Inc. • eight plant global sulfuric acid settlement (Apr ‘07)
34
• eight plant global sulfuric acid settlement (Apr ‘07)
– DuPont • four plant global sulfuric acid settlement (July ‘07)
– Chemtrade/Marsulex • eight plant global sulfuric acid settlement (Jan ‘09)
– DuPont/Lucite • single facility sulfuric acid settlement (April ‘09)
– Mosaic • single facility sulfuric acid settlement (Oct ‘09)

Acid Sector - Results to Date (con’t)
� Nationwide in 9 States– California, Indiana, Kentucky, Louisiana, Ohio,
Oklahoma, Texas, Virginia, and Wyoming
� Emission Reduction– SO2 > 44,340 tpy – NOx, acid mist, VOC, CO and PM > 610 tpy
35
– NOx, acid mist, VOC, CO and PM > 610 tpy
� Injunctive Relief – “Set the Bar” on Rates– Sulfuric acid: 1.0-2.5 lb/ton (from 3.5 lb/ton)– Nitric acid: 0.6 lb/ton (down from 3.0 lb/ton)– $224 million in control technologies
� $11.775 Million Civil Penalties
� $48,000 in Supplemental Environmental Projects

Glass Manufacturing Sector
36

Glass Sector
� Notices of Violation (8)– Saint Gobain Containers inc., global, (2009)
– Durand Glass, Millville, NJ (2007)
– Owens Brockway, Clarion, PA (2008)
– Owens Brockway, Crenshaw, PA (2008)
37
– Owens Brockway, Crenshaw, PA (2008)
– Owens Brockway, Waco, TX (2009)
– Owens Brockway, Muskogee, OK (2009)
– AFG Industries, Church Hill, TN (2008)
– Saint Gobain, Madera, CA (2003)
� Federal Complaints (2)– Saint Gobain, Madera, CA (2005)
– Saint Gobain, Global (2010)

Glass Sector - Results to Date
Case Results � Saint Gobain; single facility, Madera, CA
(Apr 2005)
� Saint Gobain Containers, Inc., global, 15 plants (January 2010)
38
(January 2010)
Emissions Reductions � NOx reduced by 4,388 tpy
� SO2 reduced by 1,533 tpy
� PM reduced by 397 tpy

Saint-Gobain Containers, Inc.
� Global Settlement Covers– 15 glass-manufacturing facilities in 13 states
– 31 total furnaces
� The first SCR at a glass furnace in the U.S.� All furnaces will install controls for NOx, SO2
39
� All furnaces will install controls for NOx, SO2and PM emissions – NOx controls are oxyfuel, SCRs and oxygen-
enriched air staging
– SO2 controls are scrubbers (dry and wet and also cloud chamber scrubbers)
– PM controls are electrostatic precipitators and cloud chamber scrubbers
� Injunctive Relief -- $112 million

Saint-Gobain Containers, Contd.
All furnaces will accept enforceable emissions limits:– NOx: 1.3 pounds per ton of glass produced
for furnaces getting top-tier controls, and 3.8 pounds per ton for units getting second-
40
3.8 pounds per ton for units getting second-tier controls
– SO2: approximately 0.8 pounds per ton for top-tier controls; second-tier units will be controlled to approximately 2.25 pounds per ton.
– PM: the CD includes limits for both filterable particulates and total particulates

Saint-Gobain Containers, Contd.
� The settlement will result in the following emissions reductions, once all injunctive relief is fully implemented:– NOx: 4,162 tons per year (tpy)
– SO : 1,386 tpy
41
– SO2: 1,386 tpy
– Particulate Matter: 364 tpy
� Saint-Gobain is paying a $2.25 million civil penalty, with $1.15 million to the United States and $1.1 million to the 10 states and two local regulatory agencies that are co-plaintiffs in the case

Saint-Gobain Containers, Contd.
� Participating States
– Illinois, Indiana, Louisiana, Commonwealth
of Massachusetts, Missouri, North Carolina,
Oklahoma, Commonwealth of Pennsylvania,
Washington, and Wisconsin, as well as the
42
Washington, and Wisconsin, as well as the
Puget Sound Clean Air Agency and the San
Joaquin Valley Unified Air Pollution Control
District

Saint-Gobain Containers, Contd.
� Saint-Gobain will perform two SEPs as part of the settlement, one federal and one state
– The federal SEP will require Saint-Gobain to
surrender permanently, and request that New
Jersey retire, all remaining NOx, SO2 and PM credits
43
Jersey retire, all remaining NOx, SO2 and PM credits
at the closed SG glass plant in Millville, New Jersey
– The state SEP will require Saint-Gobain to pay
$250,000 into a fund established by the Oklahoma
Department of Environmental Quality for the
purpose of reducing NOx emissions in the Tulsa air
shed, which is adjacent to the company’s Sapulpa,
Oklahoma facility

Cement Manufacturing Sector
44

Cement Sector
� Notices of Violation (12)– California Portland Cement, Rillito, AZ
– Capitol Cement, San Antonio, TX
– Cemex, Victorville, CA*
– Cemex, Lyons, CO
– Cemex, Fairborn, OH
– Cemex, Knoxville, TN
45
– Cemex, Knoxville, TN
– Cemex, Ponce, PR
– Dragon Products, Thomaston ME
– Essroc, Bessemer, PA
– Holcim, Hagerstown, MD
– St. Mary’s Cement, Dixon, IL*
– California Portland Cement, Mojave, CA
� Federal Complaints (2)– Cemex, Victorville, CA (2007)*
– Cemex, Lyons, CO (2009)
* Resolved via consent decree
Cement Sector - Results to Date
� Three Settlements for 15 Cement Plants– St Mary’s Cement (Sept ‘08)– CEMEX Victorville California (Jan ’09)– Lafarge Global (Jan ‘10)
� Fourteen States
46
� Fourteen States– CA, AL, MI, GA, IA, IL, KS, SC, OH, NY, WA,
MO, OK, PA
� Emissions Reduction– NOx - 14,490 tons/yr– SO2 - 26,000 tons/yr
� Civil Penalties - $7.875 million

Lafarge
Lafarge Injunctive Relief� install and implement control technologies at an
expected cost of up to $170 million to reduce emissions of NOx by more than 9,000 tons each year and SO2 by more than 26,000 tons per year at their
47
and SO2 by more than 26,000 tons per year at their cement plants.
� In addition, as part of the settlement, Lafarge has agreed to pay a $5 million civil penalty to resolve alleged violations of the Clean Air Act’s new source review regulations.
� Of the $5 million civil penalty, Lafarge will pay $3.4 million to the United States and $1.7 million to the 13 participating states and agencies.

Lafarge
Lafarge Injunctive Relief (con’t)� Install and operate a selective catalytic reduction (SCR)
system at Joppa Kiln 1;
� Install and operate selective non-catalytic reduction (SNCR) systems to control NOx on 17 of their 23 kilns;
48
(SNCR) systems to control NOx on 17 of their 23 kilns;
� Install and operate wet gas scrubbers (WGS) to control SO2 at 4 of their 23 kilns;
� Install and operate dry absorbent addition (DAA) systems to control SO2 at 13 of the 23 kilns; and
� Operate continuous emission monitors (CEMs) on all U.S. operating kilns.

Lafarge
Participating States and Agencies
� Alabama, Illinois, Iowa, Kansas, Michigan, Missouri, New York, Ohio, Pennsylvania, South Carolina,
49
Pennsylvania, South Carolina, Washington, Oklahoma and the Puget Sound Clean Air Agency

Other PSD/NSR Activity
� Polystyrene Foam
� Landfills
� Industrial Boilers
� Iron and Steel
� Municipal Waste Combustors
� Carbon Black Production
50
� Iron and Steel
� Natural Gas Transmission
� Elevated Flares
� Aluminum
� PVC Manufacturers
� Oil and Gas producers
� Ethanol producers
� Wood Products
� Pulp and Paper

U.S. v. Pep Boys and Baja
� Largest vehicle and engine importation case in CAA history
� Defendants imported almost 250,000 Chinese-manufactured non-compliant vehicles and engines
� Over 45 vehicle and generator models imported and sold by Pep Boys and Baja were not certified to meet federal emission standards
51
sold by Pep Boys and Baja were not certified to meet federal emission standards
� $5 Million penalty paid by Pep Boys� Mitigate excess emissions: 620 tons of HC + NOx and
6,520 tons of CO� Remediate, export or destroy over 15,000 vehicles and
engines� Implement rigorous compliance plans� Offer extended emission system warranties.� Cost of Injunctive Relief: Over $5 Million

High Priority Violations Policy
52

The High Priority Violations (HPV) Policy
� The Policy Purpose– To provide a tool for prioritizing which violations
receive the highest scrutiny and oversight
� The Goals of 1998 Revision
53
� The Goals of 1998 Revision– Encourage a greater degree of team-building and
cooperative resolution of HPVs by all responsible agencies
– To encourage agencies to give priority attention to those violations that they believe are most environmentally important
– To permit an increased degree of agency flexibility in identifying and resolving all HPVs

Scope of the HPV Policy
� The Policy applies to EPA as well as State and Local Agencies
� The Policy Generally Covers
54
� The Policy Generally Covers
– Definition/Identification of HPVs
– Timely and Appropriate Enforcement
Response
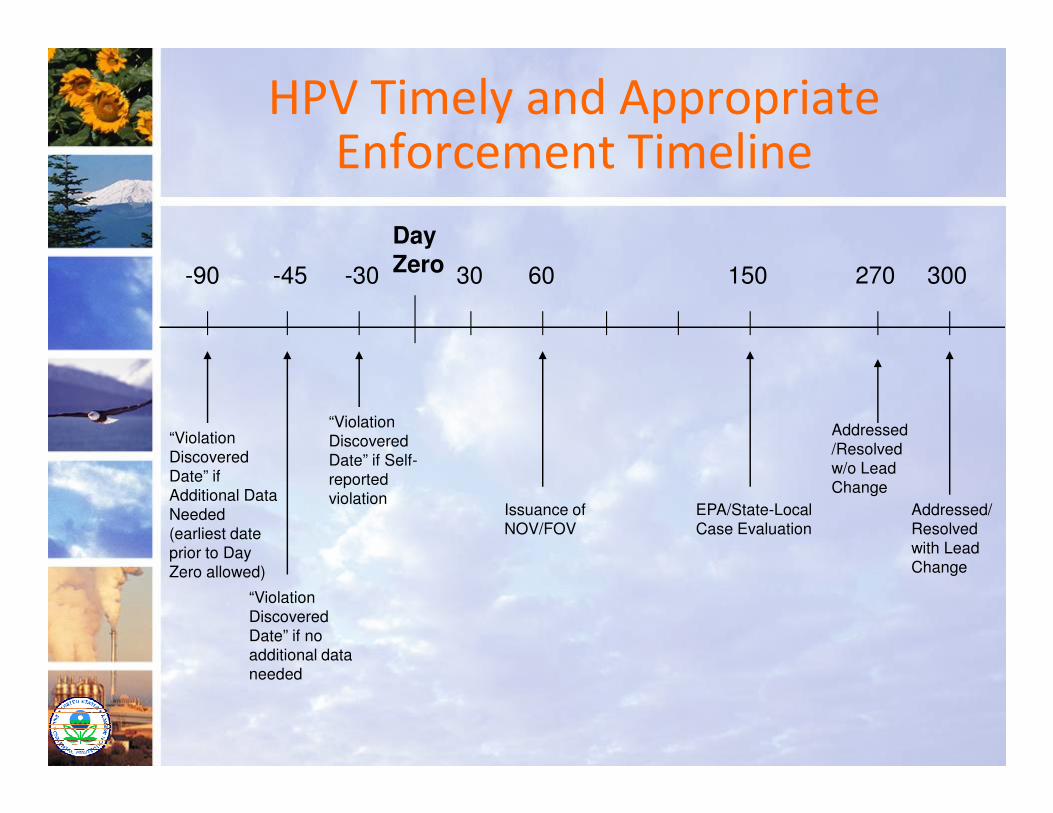
HPV Timely and Appropriate Enforcement Timeline
Day Zero-90 -45 -30 30 60 150 300270
55
“Violation
Discovered
Date” if
Additional Data
Needed
(earliest date
prior to Day
Zero allowed)
“Violation
Discovered
Date” if no
additional data
needed
“Violation
Discovered
Date” if Self-
reported
violationIssuance of
NOV/FOV
EPA/State-Local
Case Evaluation
Addressed
/Resolved
w/o Lead
Change
Addressed/
Resolved
with Lead
Change

The Office of the Inspector General’s (OIG) Report on the HPV Policy
On October 14, 2009, OIG issued a report finding:
1. HPVs were not being addressed in a
timely manner because regions and states
did not follow the HPV policy; and
56
did not follow the HPV policy; and
2. EPA Headquarters did not oversee
regional and state HPV performance.
OIG’s Recommendations
� To improve oversight over HPVs, OIG recommended that EPA:
1. Direct regions to comply with the HPV policy;
2. Make needed revisions to the policy to ensure the
timelines are met; and
57
timelines are met; and
3. Implement proper management controls over
HPVs.
� OECA issued its response to the OIG Report on January 19, 2010; some minor revisions are being made to this response and it will be re-issued in the near future.

OECA’s Response to the OIG’s Recommendations
� OECA issued a memo on March 1, 2010 requesting the regions to implement the HPV Policy and reiterating the roles for EPA Headquarters, EPA Regions and State/Local agencies.
58
� OECA has begun quarterly staff calls with the regions to monitor the regions’ compliance with the HPV policy beginning.
� OECA will also hold semi-annual management calls with each region beginning in July 2010.
HPV Reporting Requirements
� In December 2009, OECA began and it will continue to do annual data verification of AFS data.
� Annually, OECA will issue the HPV Identification Report.
59
Identification Report.
� OECA will continue to follow the Watch List SOP and will modify the semi-annual and annual reports using updated metrics, currently available tools and other evaluation mechanisms.
EPA’s Reevaluation of the HPV Policy
� AED formed an inter-agency workgroup to evaluate the HPV policy, which includes regional members, OC and SLPD.
� OECA plans to complete its evaluation of the HPV policy by March 2011.
60
HPV policy by March 2011.
� OECA agreed to revise the HPV policy according to the evaluation results by September 2012.
� State participation is key; OECA looks forward to NACAA input in its evaluation and revision efforts.

Permitting and Enforcement Training Schedule
� Atlanta, GA: September 2008� Dallas, TX: February 2009� Philadelphia, PA: June 2009� Seattle, WA: July 2009 � Kansas City, KS: October 2009
61
� Kansas City, KS: October 2009� Chicago, IL: November 2009� Denver, CO: March 2010 � Region 1 – Summer/Fall 2010?� Region 9 – TBD� Region 2 – TBD� Beyond? --

Questions
62


![l>lf·· E ·B; -I,:,C-·-1·1V · cat. no.i bd lj.657 bd lj.6]5 bd 4630 bd 4·627 bd 4628 bd 4886 bd 4546 bd 4·545 bd 4544 bd 4542 bd lj,588 bd lj.593 bd 0102 bd 4636 bd 4632 bd](https://img.pdfslide.us/doc/110x75/5f7c69bb7d840d18665ab1e6/llf-e-b-ic-11v-cat-noi-bd-lj657-bd-lj65-bd-4630-bd-4627-bd-4628-bd.jpg)