Embed Size (px)
Citation preview

Journal website: http://epaa.asu.edu/ojs/ Manuscript received: 11/15/2011 Facebook: /EPAAA Revisions received: 6/19/2012 Twitter: @epaa_aape Accepted: 7/13/2012
education policy analysis archives A peer-reviewed, independent, open access, multilingual journal
Arizona State University
Volume 20 Number 41 December 17th, 2012 ISSN 1068-2341
Factor Structure of Opportunity to Learn for Students
with and without Disabilities Stephanie W. Cawthon, S. Natasha Beretvas,
Alyssa D. Kaye, & L. Leland Lockhart The University of Texas at Austin
USA
Citation: Cawthon, S.W., Beretvas, S.N., Kaye, A.D., & Lockhart, L.L. (2012). Factor structure of opportunity to learn for students with and without disabilties. Education Policy Analysis Archives, 20(41). Retrieved [date], from http://epaa.asu.edu/ojs/article/view/1043 Abstract: Opportunity to Learn (OTL) stems from the basic premise that there is an important relationship between the quality and intensity of classroom instruction and students’ levels of academic success. For many students with disabilities, an emphasis on OTL has become national priority, yet measuring its impact is a complex challenge. The first purpose of this study was to explore the factorial validity of OTL using indicators found in the 2005 4th grade National Assessment of Educational Progress (NAEP). The study entailed confirmatory factor analyses for potential OTL factors including teacher preparation, professional development, classroom activities, and access to technology. Separate factor analyses were conducted using the reading and mathematics datasets. The authors then looked at the degree to which OTL factors influenced NAEP estimates of ability for both students with disabilities and their non-disabled peers. The following three OTL factors differentially predicted student scores: classroom activities (reading), student constructed projects (reading), and using calculators for instruction (mathematics). For the remaining three reading factors and seven mathematics factors, there were no differences in the relationship between the factors and scores for students with and without disabilities. Keywords: Opportunity to Learn; NAEP; Assessment; Students with Disabilities
epaa aape
Education Policy Analysis Archives Vol. 20 No. 41 2
Estructura de los factores de oportunidades de aprendizaje para estudiantes con y sin discapacidades. Resumen: Oportunidad para Aprender (OPA) se deriva de la premisa básica de que existe una relación importante entre la calidad y la intensidad de la instrucción en el aula y los niveles de los estudiantes de éxito académico. Para muchos estudiantes con discapacidad, un énfasis en la comunicación cara a cara se ha convertido en prioridad nacional, sin embargo, la medición de su impacto es un desafío complejo. El primer objetivo de este estudio fue explorar la validez factorial de la comunicación cara a cara con los indicadores se encuentran en el 2005 4 º grado de la Evaluación Nacional del Progreso Educativo (NAEP). El estudio implicó el análisis factorial confirmatorio para posibles factores de comunicación cara a cara, incluyendo la formación docente, desarrollo profesional, las actividades del aula, y el acceso a la tecnología. Análisis factoriales separados se realizaron utilizando la lectura y las matemáticas conjuntos de datos. Los autores observaron luego el grado en que los factores de influencia cara a cara las estimaciones de la capacidad de NAEP para los estudiantes con discapacidades y sus compañeros no discapacitados. Los siguientes tres factores de comunicación cara a cara diferente predijo resultados de los estudiantes: actividades en el aula (lectura), proyectos estudiantiles construidas (lectura), y utilizando una calculadora para la enseñanza (matemáticas). Para leer el resto de los factores tres y siete factores de matemáticas, no hubo diferencias en la relación entre los factores y las calificaciones de los estudiantes con y sin discapacidad. Palabras clave: oportunidad para aprender; NAEP, evaluación, Estudiantes con Discapacidades Estrutura dos fatores de oportunidades de aprendizagem para alunos com e sem deficiência. Resumo: Oportunidade para Aprender (OTL) deriva da premissa básica de que existe uma relação importante entre a qualidade e a intensidade da sala de aula e os níveis dos alunos de sucesso escolar. Para muitos estudantes com deficiência, uma ênfase na OTL tornou-se prioridade nacional, ainda medir o seu impacto é um desafio complexo. O primeiro objetivo deste estudo foi explorar a validade fatorial do OTL usando indicadores encontrados em 2005 na 4 ª série Avaliação Nacional de Progresso Educacional (NAEP). O estudo envolveu análises fatoriais confirmatórias para potenciais fatores de OTL incluindo a preparação de professores, desenvolvimento profissional, atividades de sala de aula e acesso à tecnologia. Análises fatoriais separadas foram realizados utilizando a leitura e matemática conjuntos de dados. Os autores, em seguida, olhou para o grau em que fatores influenciaram OTL estimativas NAEP de capacidade para estudantes com deficiência e seus pares não deficientes. Os seguintes três fatores OTL diferencialmente previu as notas dos alunos: atividades de sala de aula (leitura), projetos de estudantes construídos (leitura), e calculadoras utilizando para instrução (matemática). Para os restantes três fatores de leitura e sete fatores de matemática, não houve diferenças na relação entre os fatores e os escores para os alunos com e sem deficiência. Palavras-chave: oportunidade de aprender; NAEP, Avaliação; Estudantes com Deficiência
Factor Structure of Opportunity to Learn for Students with and without Disabilities
The purpose of this study was to identify Opportunity to Learn (OTL) factors in the National Assessment of Educational Progress (NAEP) and to investigate the potential differential impact of OTL on students with and without disabilities. For all students, but especially for students

Factor structure of opportunity to learn for students with and without disabilities 3 with special needs, school performance is a result of the interaction between students’ abilities and the instructional environment (Ysseldyke & Christenson, 1987). Yet measuring OTL across classrooms, districts, and states is a challenging and often elusive process (Porter, 1993, 1995; Schmidt & Maier, 2009). In its role as “The Nation’s Report Card,” the NAEP is a valuable resource in looking at OTL because of the national scope of its data collection process and the broad range of student, teacher, and school variables brought together into one data set.
To date no study has identified a measure of OTL within the NAEP framework nor analyzed the impact of OTL on NAEP scores for students with and without disabilities. Using confirmatory factor analysis, this study investigated OTL factor structures using teacher and student background variables within the NAEP dataset. In an analysis of impact on students with and without Individualized Education Program (IEP) plans, we considered the potential relevance of OTL factors in understanding differential levels of academic performance for students with disabilities (SWD). This work complements OTL studies that address the effects of curricular alignment (Porter, 2002) or the impact of tracking systems on student achievement (Oakes, 1985). The strength and weaknesses of this factor analysis approach as well as areas for future research are discussed in the context of the need for adequate measures of OTL in our understanding of predictors of academic success for both students with and without disabilities (Ysseldyke & Christenson, 1987).
Opportunity to Learn
In a broad sense, OTL refers to a student’s level of access to educational resources. Because the United States does not have a national curriculum and because funding is primarily received through local sources, levels of OTL can fluctuate substantially from classroom to classroom and from school to school (McDonnell, 1995). The current Common Core Standards initiative seeks to provide states with a common set of academic standards (Council of Chief State School Officers, 2010), partly in an effort to reduce variance between states and to raise the consistency and quality of accountability measures of teachers, schools, and districts. The focus of the OTL discussion has shifted over the past few decades. Original conceptualizations of OTL during the civil rights era were linked to concerns about educational inequity and access to resources and funding (e.g., the Coleman Report, 1966). Carroll’s (1984) model of OTL focused mainly on the amount of time dedicated to instruction, whereas more recent models have emphasized student exposure to content via standards-based instruction (e.g., McDonnell, 1995; Schmidt & Maier, 2009). These shifts parallel new language found in the current Individuals with Disabilities Education Improvement Act (IDEIA, 2004) guidelines over previous versions of the law. A central component of IDEIA involves linking IEPs for eligible students with disabilities to the standards-based instruction and assessment framework in a far more explicit manner than 20 years ago.
OTL has been defined in various ways throughout the research literature and in educational policy (Porter 1988, 1991, 1993, 1995; Schmidt & Maier, 2009). OTL is sometimes used to refer to the inputs, such as teacher quality and fiscal resources, or to system processes, such as implementation of class size reduction programs or standards-based reforms (Herman, Klein, & Abedi, 2000; Scherff & Piazza, 2008-09). At a descriptive level, OTL has become an important consideration when determining how well schools are translating inputs into positive student outcomes (McDonnell, 1995). In its role within the US educational policy arena, OTL is an important construct in discussing educational gaps – whether related to gaps between races, classes, linguistic status, or disability category (Abedi, Leon, & Kao, 2008; Herman et al., 2000). In a striking statement about the relationship between socio-economic status and education, Haberman (1991) referred to inadequate OTL core curriculum as the “pedagogy of poverty.” There is a general

Education Policy Analysis Archives Vol. 20 No. 41 4
concern that inequities in OTL may explain, in part, the significant achievement gaps seen in US public education.
OTL and Students with Disabilities
A key issue in OTL for SWD is whether or not they have access to the regular education core curriculum, or as has sometimes been the case, a less rigorous or even separate curriculum. The concern about access to grade-level content is based, in part, on a history of placements outside of the regular education classroom and an education philosophy that did not require that all students be taught and assessed based on the same content standards. However beginning with the inclusion movement of the 1980s (Osgood, 2005), the standards-based reform movement of the 1990s and continuing through the current accountability reforms (Kornhaber & Orfield, 2001), educational structures and policies have increasingly emphasized the need for higher levels of OTL. Both the No Child Left Behind Act of 2001 (NCLB) and IDEIA include provisions that seek to ensure that students with disabilities are provided services that best meet their educational needs. According to IDEIA, schools are required to provide all students with disabilities an IEP that explicitly lays out what services the school will provide to ensure that students are receiving appropriate education in the least restrictive environment (LRE). In turn, placement in a LRE is to facilitate higher levels of OTL for students with disabilities.
For some students, particularly those with more significant disabilities, higher levels of OTL are not necessarily the result of placement in regular education classrooms but of changes in instructional approach (Cawthon, 2004; O’Sullivan, Ysseldyke, Christenson, & Thurlow, 1990). Classroom level variables, such as the intensity of instruction and use of IEPs to reach academic goals, have become a major focus of OTL-related research (Roach & Elliott, 2006). Using test scores on an alternate assessment as a marker of effectiveness, Roach and Elliott investigated factors that led to higher academic outcomes for students with significant disabilities. Using structural equation modeling, they found that access to content area curriculum significantly predicted student performance on standards-based alternate assessments. In an extension of this work, Roach et al. (2009) discussed the importance not only of more instructional time for students with significant disabilities, but also of raising student engagement to ensure that they access the general education curriculum. These two studies mark a new era in research on the impact of OTL on outcomes for SWD within accountability reform.
Measuring OTL
Just as there are multiple meanings of OTL, there are also varied approaches to its measurement (Herman et al., 2000; McPartland & Schneider, 1996). In a broad sense, OTL describes the system of education that predicts student performance, including the teacher, school, and larger contextual level variables (Scherff & Piazza, 2008-09). Wang (1998) asserts that the complexity of OTL necessitates multiple approaches to its measurement; however developing valid indicators in research has been difficult (Herman et al., 2000). Ideally, OTL should, at minimum, describe students’ access to resources, school conditions, school curriculum, and level and intensity of instruction (Herman et al., 2000; Wang, 1998). Alternative definitions have described OTL as a measure of content coverage (e.g., whether or not students are exposed to the appropriate content curriculum), content exposure (e.g., time-on-task and depth of teaching provided to students), content emphasis (e.g., what topics are selected for emphasis), and quality of instructional design (e.g., classroom teaching practices) (Schmidt & Maier, 2009). Depending on the study, OTL can be as concrete as whether or not students have access to college preparatory courses or as broad as whether they have received the “full benefit” of reforms aimed at closing achievement gaps (Wang & Goldschmidt, 2003).

Factor structure of opportunity to learn for students with and without disabilities 5
Much of the research on efficacy of education, in general, focuses on student performance on standardized assessments as the primary outcome variable. Previous research has provided limited explicit consideration of a student’s OTL test content in analyses of test performance for students with and without disabilities. The current study sought to measure OTL and its impact on test scores using a set of teacher and classroom variables available in the NAEP. Although not developed with a specific framework of OTL in mind, the NAEP is a large-scale, nationally representative dataset that focuses both on student outcomes and on a wide range of contextual factors. Further information about the NAEP dataset and the variable selection process for this study is provided in the methods section, below. Two research questions guided this study: (a) What is the factor structure of NAEP variables that appear to measure facets of OTL? and (b) Is there a differential impact of OTL factors on reading and mathematics scores for students with and without disabilities?
Methods
NAEP Dataset
Without a national K-12 curriculum and assessment framework, there are few benchmarks for overall student achievement in the United States (the Common Core Standards under development is a move towards greater commonality in academic standards). The NAEP is one assessment that draws on a nationally representative sample of students in public and private education. Because each state’s standardized assessments vary and are based on different content and proficiency standards, NAEP seeks to provide an objective, national yardstick by which to measure student achievement. This study utilized the 2005 4th grade NAEP datasets for reading and mathematics.
Variable Selection
The conceptualization of OTL in this article is multi-faceted and draws upon literature from a number of areas of research on school factors that affect student achievement. This study utilizes OTL factors that are conceptually linked to previous definitions of OTL and that can be operationalized using variables found in the NAEP dataset; as such, this study was limited by what NAEP collects and carries with it all of the challenges of a secondary data analysis design. Furthermore, selecting OTL variables relevant to both students with and without disabilities is a challenging task. Specific variables that are relevant to special education populations are not always available in large-scale datasets designed for a broader population, even when students with disabilities are included in data collection process. OTL factors present in NAEP and discussed further below include teacher preparation, teacher professional development, content and intensity of instruction, and technology resources. Although the research often cuts across subject areas and student populations, distinctions are made between reading and mathematics content areas, where applicable.
Teacher preparation. As the primary facilitator of classroom learning experiences, a teacher’s pedagogy and practice should influence on student learning. In other words, students of a teacher with greater content expertise and pedagogical skills should see higher levels of learning than the same students who have a teacher without strong background or skills (Darling-Hammond & Youngs, 2002). Overall, there are mixed findings regarding the importance of a traditional teacher preparation background, usually associated with a bachelor’s degree program, and the sufficiency of an alternative certification program that is typically shorter and relies more on in situ training experiences. Whereas Darling-Hammond and her colleagues found data to support the conclusion
Education Policy Analysis Archives Vol. 20 No. 41 6
that traditional programs are necessary for successful teaching (e.g., Darling-Hammond, 2000; Darling-Hammond & Youngs, 2002; Darling-Hammond & Sykes, 2003), work looking at a teacher’s “value added” to student performance downplays support for traditional teacher certification (Wright, Horn, & Sanders, 1997). At issue here is the strength of the connection between what a teacher brings to the classroom (either via training or other teacher characteristics) and measurable outcomes in student performance (Rowan, Chaing, & Miller, 1996; Wilson, Floden, & Ferrini-Mundy, 2001).
Findings about the effects of types of certification are often confounded with other factors, especially content area (i.e., mathematics, science, reading). One of the most consistent and robust overall findings is that students of teachers who hold a degree in mathematics demonstrate higher performance on mathematics assessments than students of teachers without a mathematics content area degree (Goldhaber & Anthony, 2003). In contrast with English and history, mathematics and science teachers holding a degree in their subject area is a significant predictor of student achievement (Goldhaber & Brewer, 1997). Yet this overall finding is also complex and does not tease apart differences in instructional approach or in student population. For example, Gimbert, Bol, and Wallace (2007) assert that in hard-to-staff, urban settings, alternatively-certified mathematics teachers may be as effective as mathematics teachers with traditional training in raising student achievement.
Inclusion of essential teacher variables is important if teacher effects are a contributing factor to learning, particularly for students who may not have other resources to help them towards academic success. It may be, however, that individual factors cannot be meaningfully teased apart. For example, teachers may have a college degree in the subject area (such as mathematics) with certification obtained through multiple routes, ranging from the traditional bachelors to master’s degree to alternative programs. Because the teacher preparation and qualification literature is complex and has not drawn clear conclusions as to active ingredients in effective teaching, this study’s model of OTL included as many of the above variables as possible in a Teacher Preparation factor, but did not emphasize the primacy of one variable over another. The list of NAEP variables included in the Teacher Preparation factor is found in Table 4 for mathematics and Table 9 for reading.
Professional development. Professional development obtained during one’s teaching career serves as a resource for continuing education and skill acquisition (Cohen & Hill, 2001). Many teachers are required to participate annually in a minimum number of professional development hours to maintain their credentials. The effects of professional development on teacher knowledge, instruction, and ultimately, student achievement are thus a critical area of research in education. To the extent that teacher capacity affects student learning, a teacher’s level and type of professional development is a potential source of OTL resources for his or her students (Trimble, 2003).
Research on the effectiveness of professional development points to a great diversity in the quality of programs and a corresponding mixed set of results on changes for teachers or their students (Supovitz, 2001). There are two common critiques of teacher professional development: shortcomings in the format of training sessions and the importance of content area specificity in program effectiveness (Garet, Porter, Desimone, Birman, & Yoon, 2001; Thibodeau, 2008). In terms of training session formats, most workshops are delivered in lecture format and are not embedded in teachers’ practices. When provided in this manner, professional development does not connect with the life and learning in a classroom (Polk, 2006). Guskey (2000) characterizes effective professional development as sustained, interactive, job-embedded and collaborative in nature. Active learning opportunities within professional development, such as collaborative study groups, lead to more changes in teacher practices than passive instruction (Desimone, Porter, Birman, Garet, &
Factor structure of opportunity to learn for students with and without disabilities 7 Yoon, 2002; Desimone, Porter, Garet, Yoon, & Birman, 2002; Thibodeau, 2008). When implemented in conjunction with traditional workshop formats, follow-up activities within a teacher’s classroom have been found to be essential to cement newly learned skills into active practice (Bauer, Reese, & McAllister, 2003).
Professional development may contribute to student learning as a direct influence on teacher knowledge (and expectations or attitudes), but the extent to which these translate into measurable effects on student achievement remains questionable. Inevitably, any professional development program must show its beneficial impact on student achievement to be viable as an evidence-based program (Porter, Blank, Smithson, & Osthoff, 2005; Resnick, 2005). When a professional development program contains the sustained, collaborative, and system-supported components described above, large-scale assessments can provide one picture of its impact on student achievement. The list of NAEP variables for Professional Development is found in Table 5 for mathematics; there was not a comparable set of variables for reading.
Content and intensity of instruction. Teacher preparation and professional development experiences provide educators with tools to provide students with quality learning experiences. How students come into contact with the outcome of teacher training falls under the general constructs of content and intensity of instruction. Content of instruction can include how an educator presents the information outlined on curricular standards, specific classroom activities, the rigor of student assignments, and how educators provide feedback to students during the learning process. Content of instruction is perhaps the most salient component of OTL that is present in different models in the literature. For example, Porter (2002) describes exposure to curricular content along two dimensions. The first dimension is the specific topic areas covered within the general domain, such as the relationship of planets and the sun within our solar system. These topics are typically listed as rows in a table and represent curricular standards and material aligned to content area assessments. Once the range of topics taught over the time frame (typically a semester or a year) is finished, teachers complete information about the classroom activities for each of the individual topics. The columns of the grid represent the depth of knowledge taught. For each specific topic, the teacher rates the activities along a continuum of cognitive rigor, such as memorize, apply, and extend. By including this dimension, the concept of what students are learning is tied not only to the topic area (e.g., planets) but also to the intellectual depth of learning demands (e.g., knowing the names of the planets vs. knowing which planets are inhabitable and why).
Intensity of instruction, at its most basic level, refers to the amount of time a student spends on a particular topic. For example, some schools operate on a year-round schedule with short breaks, resulting in more hours of instruction than students who are in a traditional nine-month calendar. Intensity can also be increased by focusing on a specific subject, such as reading, for more minutes within the school day. In this approach, time-on-task becomes the primary metric by which to measure OTL. In the NAEP, the variables in this study are mainly teacher self-report; only mathematics has a “time on task” measure, and only using one item instead of on individual content areas. However, many of the categories of activities in mathematics are coupled with the instructional technology variables listed in the next section below. Reading did not have a time on task variable, but had many variables that related to classroom activities. The list of NAEP variables for Content and Intensity of Instruction are found in Table 6 for mathematics and Tables 10 and 11 for reading.
Instructional technology resources. The fourth main area of OTL measured in this article is the use of technology within elementary and secondary instruction. In this discussion we focus on the study of technology-rich environments, e.g., classrooms that utilize computers, internet resources, multi-media, and/or software packages specifically designed to increase student learning or construction of
Education Policy Analysis Archives Vol. 20 No. 41 8
knowledge. Technology-rich can also refer to wholly online learning environments (i.e., virtual schools) that use web-based classroom platforms, video streaming, or other distance-learning tools (Barbour & Reeves, 2009). Although diverse in the approach and specific use of technology resources, what this body of literature has in common is the goal of studying if, how, and why technology use benefits students. Much of the focus in education reform has been on improving learning outcomes in science, technology, engineering, and mathematics (STEM) fields. The goal is to use technology as part of pedagogy that facilitates conceptual understanding over rote knowledge. In a meta-analysis that included technology use in science, Schroeder, Scott, Tolson, Huang, and Lee (2007) found an overall effect size of Cohen’s d = .48, which is higher than meta-analyses of technology and reading (Knezek & Christensen, 2008). This study hints at some impact on students, but combined studies that included a wide range of technology-rich environments and measures of student knowledge. A similar overall effect size (d = .45) was found in a study of technology-rich learning in Taiwan, where there was a great national push for the development of critical thinking skills through the use of technology (Liao, Chang, & Chen, 2008).
More targeted research indicates that students may benefit from contexts where the technology resource is matched with a particular content area or cognitive skill (Tuzun, Yilmaz-Soylu, Karakus, Inal, & Kizilkaya, 2009). For example, a study investigating the impact of using Microsoft Excel within a high school Algebra class found no effect on the overall mean score of students on their final exam, but found that the variability in scores decreased and that students indicated feeling more positive about algebra as a subject area (Neurath & Stephens, 2006). Some schools use software as a way to help students study material for state exams. Use of a software program in Florida had a small impact on the reading and mathematics skills for students in late elementary grades, but no impact on student performance in middle or high school (Martindale, Pearson, Curda, & Pilcher, 2005). Software-specific studies, particularly those used for test preparation, have the advantage of an identifiable technology component, but are limited in their scope and in how they encompass the intent of a technology-rich environment. To the extent that technology integration represents best practices and incorporates pedagogical strategies that seek to increase self-efficacy and student engagement, quality technology use in teaching is one of the ways in which we can conceptualize a student’s OTL. NCLB, with its focus on closing the achievement gaps between low socioeconomic status (SES) and high SES students, also includes special emphasis on increasing student access to technology-rich environments (Maninger, 2006; Rigeman & McIntire, 2005). Inequities in this investment for students from different backgrounds or with different educational needs represent a malleable component of OTL. The list of NAEP variables for Technology Resources in mathematics is found in Tables 6, 7 and 8; there were not comparable variables for reading in the NAEP dataset.
Study Sample
A stratified random sample was extracted from the 2005 4th grade NAEP datasets (one for reading, one for mathematics) that consisted of one randomly selected student within each teacher, and all teachers within all schools. This eliminated the need to account for classroom level nesting in the analysis. Teachers and schools with missing values on their identifying variables were eliminated from analysis datasets. For the OTL factor analysis, we first ran a series of constrained models for each factor. In order to provide a cross-validation sub-sample, this dataset was randomly split into two sub-samples: a calibration sub-sample (n = 14,270 and 14,220 for reading and mathematics, respectively) and a cross-validation sub-sample (n = 14,270 and 14,220 for reading and mathematics, respectively).
To capture differences between OTL for students with and without disabilities, students with IEPs were compared with students without IEPs in this analysis. Although not all students with
Factor structure of opportunity to learn for students with and without disabilities 9 disabilities had an IEP, the IEP variable captured students who received in special education services.. The focus in this study was therefore more specific than the general umbrella of students with disabilities and was specifically on those who had a service plan in place to meet their educational needs. If the student’s disability did not require a plan to address academic needs, they would not be a part of the IEP group. There were a total of 3,330 students with an IEP in the reading sample and 4,160 students with an IEP in the mathematics sample (across both validation and calibration subsets).
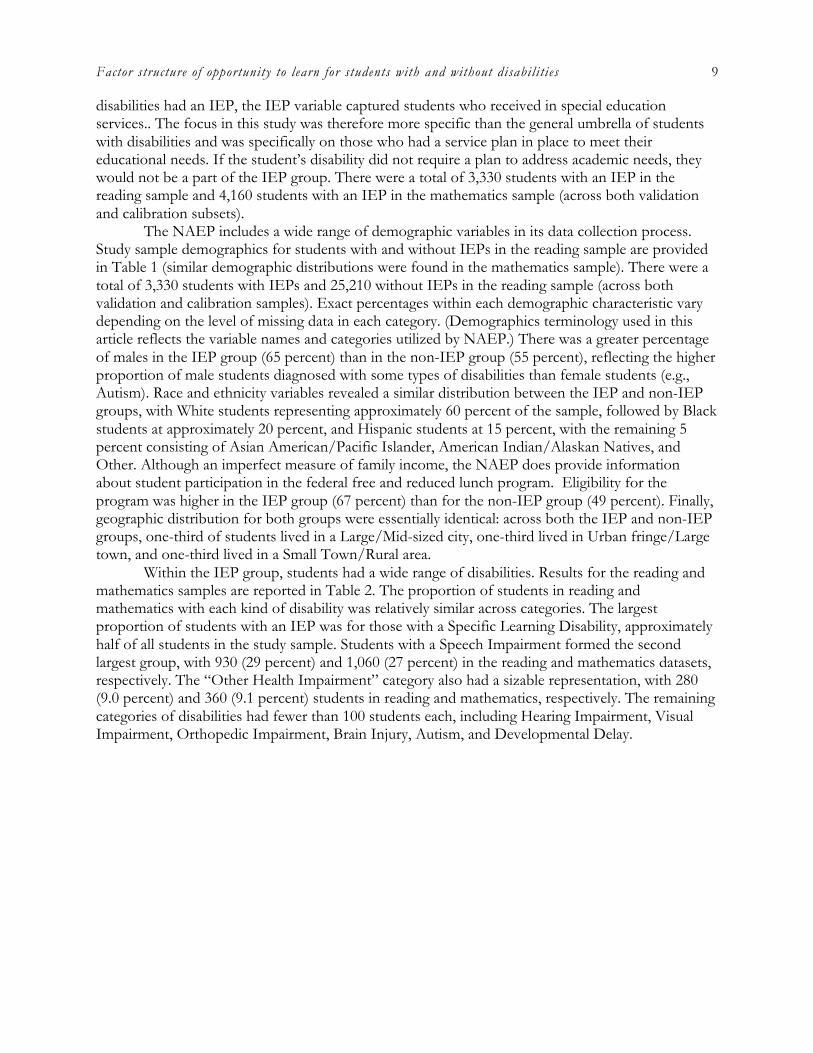
The NAEP includes a wide range of demographic variables in its data collection process. Study sample demographics for students with and without IEPs in the reading sample are provided in Table 1 (similar demographic distributions were found in the mathematics sample). There were a total of 3,330 students with IEPs and 25,210 without IEPs in the reading sample (across both validation and calibration samples). Exact percentages within each demographic characteristic vary depending on the level of missing data in each category. (Demographics terminology used in this article reflects the variable names and categories utilized by NAEP.) There was a greater percentage of males in the IEP group (65 percent) than in the non-IEP group (55 percent), reflecting the higher proportion of male students diagnosed with some types of disabilities than female students (e.g., Autism). Race and ethnicity variables revealed a similar distribution between the IEP and non-IEP groups, with White students representing approximately 60 percent of the sample, followed by Black students at approximately 20 percent, and Hispanic students at 15 percent, with the remaining 5 percent consisting of Asian American/Pacific Islander, American Indian/Alaskan Natives, and Other. Although an imperfect measure of family income, the NAEP does provide information about student participation in the federal free and reduced lunch program. Eligibility for the program was higher in the IEP group (67 percent) than for the non-IEP group (49 percent). Finally, geographic distribution for both groups were essentially identical: across both the IEP and non-IEP groups, one-third of students lived in a Large/Mid-sized city, one-third lived in Urban fringe/Large town, and one-third lived in a Small Town/Rural area.
Within the IEP group, students had a wide range of disabilities. Results for the reading and mathematics samples are reported in Table 2. The proportion of students in reading and mathematics with each kind of disability was relatively similar across categories. The largest proportion of students with an IEP was for those with a Specific Learning Disability, approximately half of all students in the study sample. Students with a Speech Impairment formed the second largest group, with 930 (29 percent) and 1,060 (27 percent) in the reading and mathematics datasets, respectively. The “Other Health Impairment” category also had a sizable representation, with 280 (9.0 percent) and 360 (9.1 percent) students in reading and mathematics, respectively. The remaining categories of disabilities had fewer than 100 students each, including Hearing Impairment, Visual Impairment, Orthopedic Impairment, Brain Injury, Autism, and Developmental Delay.
Education Policy Analysis Archives Vol. 20 No. 41 10
Table 1. Study Sample Demographics
With IEP No IEP Characteristic N % N %
Sex Male 2,170 65% 12,170 55% Female 1,160 35% 12,970 45% Race White 2,030 61% 14,940 59% Black 600 18% 4,280 17% Hispanic 450 14% 3,890 15% Asian-Am/Pacific Islander 100 3% 1,190 5% American Indian/Alaskan 120 4% 610 2% Other 30 1% 240 1% School Lunch Not Eligible 1,450 43% 12,770 51% Location Large/mid-size city 1,070 32% 7,950 32% Urban Fringe-Large Town 1,180 36% 8,930 36% Small Town/Rural 1,060 32% 8,020 32%
Note: Sample demographics are provided together for both calibration and validation samples used with the reading assessment outcome. All values rounded to the nearest ten as per restricted data use guidelines. Table 2. Disability Classifications in Sample of Students with IEPs by Outcome
Reading Mathematics Type of Disability N (%) N %
Specific Learning Disability 1670 52.8% 2190 55.7% Hearing Impairment 40 1.3% 40 1.0% Visual Impairment 25 0.8% 20 0.5% Speech Impairment 930 29.5% 1060 27.0% Mental Retardation 90 2.8% 170 4.2% Emotional Disturbance 200 6.3% 290 7.3% Orthopedic Impairment 20 0.7% 20 0.6% Brain Injury ** < .5 % ** < .5 % Autism 60 1.8% 60 1.5% Developmental Delay ** < .5% ** < .5% Other Health Impairment 280 9.0% 360 9.1% Other 190 6.2% 200 5.2%
Total 3,160 3,930 Note: A total of 3,160 reported a disability category in the reading dataset and a total of 3,930 reported a disability category in the mathematics dataset of students with IEPs. All values rounded to the nearest ten as per restricted data use guidelines. **Indicates a total number that represents less than 0.5 percent of the dataset and are thus not reported to maintain confidentiality.

Factor structure of opportunity to learn for students with and without disabilities 11
Analyses
Confirmatory Factor Analyses
The first research question focused on the factor structure of a conceptually meaningful measure of OTL based on NAEP variables. Confirmatory factor analyses (CFAs) were conducted to test the fit of each content-specific category of measures (i.e., mathematics or reading). It would have been possible to estimate a single model containing all factors; however the resulting model fit indices describe the global fit and would have been less helpful in terms of identifying factor-specific misfit. Mplus software’s weighted least-squares mean and variance adjusted estimation (WLSMV) procedure was used to estimate each model to handle the categorical indicators. In addition the Huber-White covariance adjustment was used (by requesting TYPE=COMPLEX) to provide sandwich estimators of model parameters that corrected the associated standard errors for the dependence resulting from multiple teachers’ responses per school. Last, we used Hu and Bentler’s (1999) criteria for good model fit when assessing models’ fit. This included a minimum of 0.95 for the CFI and TLI indices and of 0.05 for the RMSEA. CFI and TLI values greater than 0.90 were considered supportive of adequate model fit. For models that did not fit the data, indicators with standardized loadings lower than 0.3 were scrutinized for possible removal. Some indicators were removed due to lack of variability in responses. Others were removed based on substantive reasons in that the low loadings validly indicated misfit of the item with other items measuring the same factor. Last, some indicators were re-coded due to low frequencies in some of the scoring categories.
The final factor models resulting from the first set of calibration CFAs were next cross-validated using the second, independent cross-validation sub-sample. The same estimation procedure and software were used. Factor loadings, factor variances and indicator thresholds were constrained equal across calibration and cross-validation samples. These analyses were conducted to assess the invariance of the calibration sample’s results.
IRT Ability Estimates
Once the final OTL factor models were selected, the factors were used to predict NAEP’s composite IRT ability estimates for both mathematics and reading. The NAEP dataset is designed to provide strong group-level estimates of achievement. In order to estimate individual achievement, the NAEP creates a multiply imputed score using five estimates of an individual’s ability. We used the composites to create ability estimates based on student responses to assessment items corresponding to IRT theta values (Mislevy, Beaton, Kaplan, & Sheehan, 1992). The overall average theta values for the IEP group was M = -.804 (SE = .025) for mathematics and M = -.897 (SE = .026) for reading. The average theta values for the non-IEP group was M = .067 (SE = .009) for mathematics and M = .053 (SE = .008) for reading.
The last step in the analysis was to measure the differences in the impact of OTL factors on ability estimates of students with and without IEPs. While the individual factor structures were constrained to be equal across the two groups consisting of students with and without IEPs, the regression of each outcome on each OTL factor was allowed to vary across groups. This analysis approach thus assumed that the OTL factor structures and loadings were the same across the two groups, but that their impact on student outcomes were not assumed to be equal.

Education Policy Analysis Archives Vol. 20 No. 41 12
Results
OTL Factor Structure
The results of the CFAs supported the assumption that there are several factors underlying the hypothesized measures of OTL using NAEP student and teacher variables. Results for the mathematics factor models will be described first, followed by the reading factor models.
Mathematics factor models. There were four mathematics factor models in this analysis: Subject Area Teacher Preparation, Professional Development, Technology, and Content-based Technology. The fit index results (Table 3) for the Subject Area Teacher Preparation factor for mathematics indicated only adequate data-model fit in the calibration sample. Table 4 contains the standardized factor loadings for the six measures of subject area mathematics preparation. We selected these items based on their description of a teacher’s mathematics-specific subject area credentials at either the undergraduate or graduate level. The loadings are consistently strong ranging from 0.754 up to 0.932. Strong support was found for the invariance of this model across both the calibration and validation sub-samples. Both the CFI and TLI supported data-model fit, although the RMSEA value (RMSEA = 0.07) did not quite meet criterion for good model fit. Table 3 Fit Indices for Mathematics and Reading Factor Models
Factor Model χ2 CFI TLI RMSEA WRMR Mathematics Subject Area Teacher Preparation 292.1 0.94 0.94 0.07 3.62 Professional Development 7046.0 0.95 0.98 0.07 4.76 Technology 367.6 0.99 0.99 0.04 2.38 Content-Based Technology 1611.6 0.96 0.98 0.05 3.05 Reading Subject Area Teacher Preparation 164.9 0.97 0.95 0.07 2.84 Student Classroom Activity 760.0 0.98 0.98 0.04 2.84 Student-Constructed Assessment 175.9 0.99 0.98 0.03 1.70
Note: Degrees of freedom removed as per restricted data use guidelines. Table 4 Standardized Factor Loadings for Mathematics Subject Area Teacher Preparation Factor
NAEP Variable
Item Description Standardized Loading
T077309 Undergrad major/minor mathematics education .817 T077310 Undergrad major/minor mathematics .819 T087301 Undergrad major/minor other mathematics .754 T077409 Grad major/minor mathematics education .835 T077410 Grad major/minor mathematics .932 T077411 Grad major/minor other mathematics .838
The second factor model in mathematics was for Professional Development. The CFI and
TLI fit index results supported good model fit for the mathematics professional development factor (see Table 3). The RMSEA value, again, did not quite meet the criterion for good model fit (RMSEA
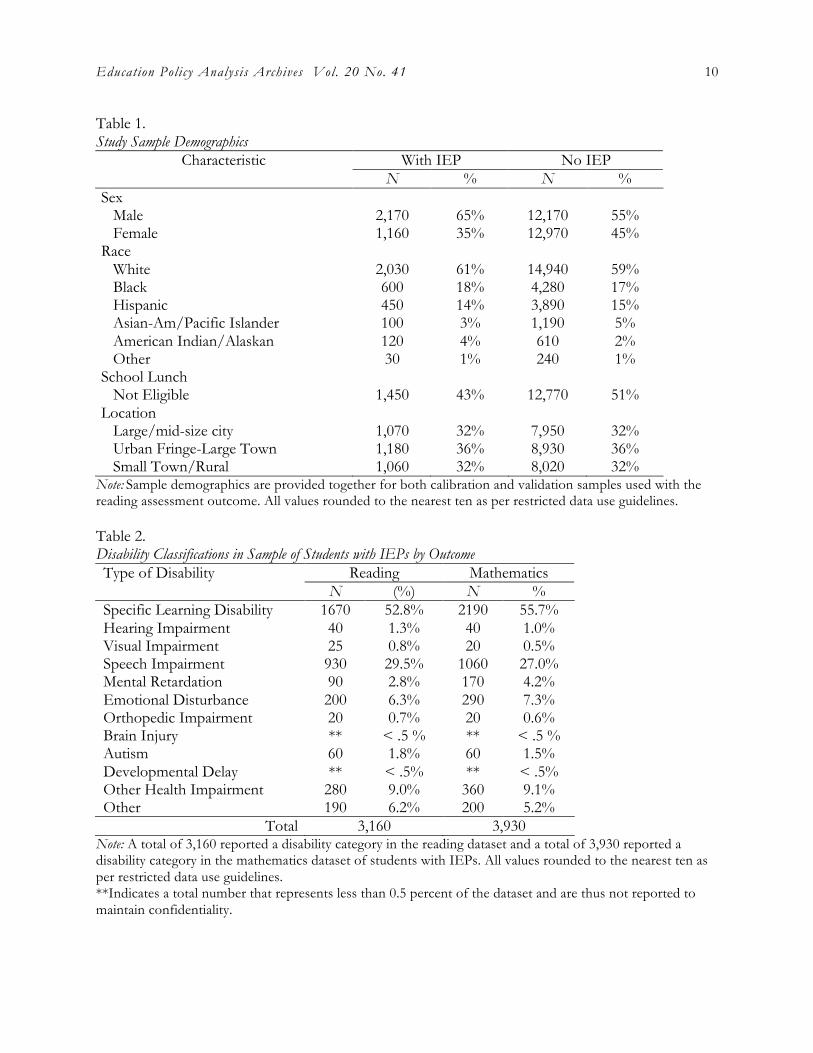
Factor structure of opportunity to learn for students with and without disabilities 13 =.06). This pattern of fit index results matched those found for the cross-validation model for this factor model. There were two factors in this model: Professional Development Format (PD-Format) and Professional Development Content (PD-Content) (Table 5). The PD-Format items relate to the structure and location of the training sessions. For example, items describe opportunities ranging from a workshop to collaboration with a colleague. The second factor in this model relates to the content of professional development. For example, teachers described whether they learned about content standards, how to use manipulatives in instruction, or how to teach students from diverse backgrounds. Consistently moderate factor loading values were found on the PD-Format factor ranging from 0.443 up to 0.823. Strong loadings were found on the PD-Content factor with values ranging from 0.606 up to 0.923. A reasonably strong correlation was found between the Format and Content factors (r = 0.625). Table 5 Standardized Factor Loadings for Mathematics Professional Development Factors NAEP Variable
Item Description Standardized Loading
F1 F2 T087807 PD – workshop or training session – math .823 0 T087811 PD – conference or assoc meeting – math .609 0 T087815 PD – visit to another school – math .443 0 T087819 PD – formal mentoring, coaching – math .499 0 T087823 PD – committee on curriculum – math .561 0 T087827 PD – discussion or study group – math .636 0 T087831 PD – teacher collaborative/ network - math .566 0 T087835 PD – individual/collab research – math .553 0 T087839 PD – independent reading – math .541 0 T087843 PD –co-teaching/team teaching – math .456 0 T087847 PD – consult subject specialist – math .677 0 T087701 PD – how students learn math 0 .882 T087702 PD – math theory or applications 0 .847 T087703 PD – content standards in math 0 .810 T087704 PD – curricular materials available 0 .807 T087705 PD – instructional methods for math 0 .923 T087706 PD – effective use of manipulatives 0 .886 T087707 PD – effective use of calculators 0 .757 T087708 PD – use of computers or other technology 0 .606 T087709 PD – method for assessing students in math 0 .838 T087710 PD – prep for district, state assessments 0 .640 T087711 PD – issues related to ability grouping 0 .759 T087712 PD – students from diverse backgrounds 0 .728
Note. PD = professional development; F1 = Mathematics PD – Format Factor; F2 = Mathematics PD – Content Factor. Correlation between factors was 0.625.
The third factor model in mathematics was the General Technology model. The two-factor Mathematics Technology (MT) factor model fit the data well for the calibration sample (see Table 3). There were two factors in this model: Calculator Use and Digital Device Use (see Table 6). The items in the Calculator Use factor related to ways in which a teacher integrates calculators into mathematics instruction and classroom activities. Time on instruction as a single variable was

Education Policy Analysis Archives Vol. 20 No. 41 14
included in this factor because it most closely aligned with the classroom instruction described in this factor. The Digital Devise Use factor items describe whether students use a range of other technology such as a geometry sketchbook or a symbolic manipulator. These tools were deemed different enough from calculators in how they are used and in their availability to warrant a separate factor. With the exception of time on instruction, the MT-Calculator Use and MT-Digital Device Use factors had moderately to very strong standardized loadings ranging in value from 0.566 up to 0.923. The two factors were not strongly related with a correlation of 0.207. Table 6 Standardized Factor Loadings for Mathematics Technology Factors NAEP Variable
Item Description Standardized Loading
F1 F2 T089201 Use calc for math lessons 0.687 0 T089501 Use calc to work with whole-class lessons 0.838 0 T089502 Use calc to check work on problems 0.841 0 T089503 Use calc to answer problems on their own 0.923 0 T089504 Use calc to graph mathematical functions 0.592 0 T089601 Use calc for math tests-teacher 0.715 0 T088001 Time per week on math instruction 0.094 0 T089701 Use personal digital devices for math lessons 0 0.566 T089702 Use symbolic manipulator for math lessons 0 0.793 T089703 Use geometry sketchbook for math lessons 0 0.899 T089704 Use data collection devices for math lessons 0 0.829
Note. Calc = calculator; F1 = Mathematics technology – calculator use factor; F2 = Mathematics technology – digital device use factor. Correlation between factors is .207.
The last factor model for mathematics was Content-Based Technology Use (Table 7). The activities described in this factor model require access to a computer or the internet, resources typically available in a computer lab but not ubiquitously in each classroom. Many of these factors describe a specific instructional purpose for the use of computer-based technology in mathematics classroom activities. This factor is in contrast with the calculator-based activities in the previous Technology factor. The CFI, TLI, and RMSEA results supported the fit of the calibration and cross-validation models of the four correlated Mathematics Content-Based Technology (MCT) factors (see Table 3). The first three MCT factors (MCT-Assessment, MCT-Instruction, and MCT-Software) are based on teachers’ descriptions of their classroom activities. For example, the MCT-Assessment items include testing strategies such as using a computer for mathematics tests to the whole class or for individual students. MCT-Instruction describes ways in which computers are integrated into instruction of mathematics content, such as presenting concepts or playing mathematics games. Finally, MCT-Software describes specific kinds of computer software used in class, such as graphing programs or word processing. Inter-correlations between the three factors are shown in Table 8. With the exception of using computers to make charts, standardized loadings on these factors are consistently strong, ranging from 0.631 up to 0.919.

Factor structure of opportunity to learn for students with and without disabilities 15 Table 7 Standardized Factor Loadings for Mathematics Content-based Technology Factors
NAEP Variable
Item Description Standardized Loading
F1 F2 F3 F4 T088601 Use comp for math tests to whole class .873 0 0 0 T088602 Use comp for make-up tests to individuals .919 0 0 0 T088603 Use comp for math tests to individuals .858 0 0 0 T088701 Use comp to practice or review math topics 0 .851 0 0 T088702 Use comp to extend math learning 0 .903 0 0 T088710 Use comp to play math games 0 .732 0 0 T088801 Use comp to present math concepts 0 .683 0 0 T088703 Use comp to research math on internet or CD 0 0 .791 0 T088704 Use comp to work with a spreadsheet 0 0 .729 0 T088705 Use comp for word processing 0 0 .798 0 T088706 Use comp for drawing program 0 0 .763 0 T088707 Use comp for graphing program 0 0 .801 0 T088708 Use comp for e-mail about math 0 0 .663 0 T088709 Use comp for chat groups about math 0 0 .631 0 M814501 Use comp to make charts/graphs for math 0 0 0 .499 M814601 Use comp to practice or drill on math 0 0 0 .715 M814701 Use comp to play math games 0 0 0 .721 M814901 Use the Internet to learn things about math 0 0 0 .686
Note. Comp = computer. F1 = assessment use factor; F2 = technology use factor; F3 = software specific technology use factor; F4 = Student-Reported technology activities. Table 8 Inter-factor Correlation Matrix among Mathematics Content-based Technology Factors: Factor Factor F1 F2 F3 F4 F1 1 F2 .500 1 F3 .462 .622 1 F4 .082 .217 .171 1
Note. F1 = Mathematics Content-based Technology – assessment use factor; F2 = Mathematics Content-based Technology – technology use factor; F3 = Mathematics Content-based Technology – software specific technology use factor; F4 = Student Reported of Mathematics Technology Activities.
Reading factor models. There were three main factor models within the reading subject area: Subject Area Teacher Preparation, Classroom Activities, and Assessment. The TLI and CFI met criteria for good model fit for the Reading Teacher Preparation (RTP) factor, although the RMSEA’s value (RMSEA = 0.06) did not meet criteria (see Table 3) for the calibration sample. The standardized factor loadings for the RTP factor were consistently strong, ranging from 0.697 up to 0.970 (see Table 9).

Education Policy Analysis Archives Vol. 20 No. 41 16
Table 9 Standardized Factor Loadings for Reading Subject Area Teacher Preparation Factor
NAEP Variable
Item Description
Standardized Loading
T077305 Undergrad major/minor reading, lang arts 0.721 T077306 Undergrad major/minor English 0.729 T077307 Undergrad major/minor other language arts 0.673 T077405 Grad major/minor reading, lang arts 0.697 T077406 Grad major/minor English 0.970
Strong evidence was found supporting the fit of the two-factor Student Reading Activities
(SRA) factor model to the calibration sample’s data (see Table 3). There were two factors in this model: Teacher-reported activities and Student-reported reading activities. Some of the standardized loadings (see Table 10) on the two factors were moderate whereas others were quite strong, with values ranging from 0.366 up to 0.934. The correlation between the teacher-measured and student-based factors was again low (r = 0.101). Table 10 Standardized Factor Loadings for Reading Classroom Activities Factor
Standardized Loading NAEP Variable
Item Description F1 F2
T089905 Students read silently 0.389 0 T089907 Students do group activity/project 0.366 0 T089909 Students explain/support what is read 0.660 0 T089911 Help students understand new words 0.560 0 T089912 Students answer questions in writing 0.566 0 T089913 Students predict outcome of reading 0.884 0 T089914 Students make generalizations 0.934 0 T089915 Students describe style/structure 0.674 0 R830601 Learn a lot when reading books 0 0.504 R831601 Read to learn about real things 0 0.547 R831801 Class discussion about something class had read 0 0.459 R832401 Read books or magazines for reading 0 0.421 R831901 Work in groups to talk about something read 0 0.418
Note. F1 = Teacher reported student reading activities factor; F2 = Student reported reading activities. Correlation between factors is 0.101.
Strong support was found for the Reading – Student-Constructed Assessment factor model consisting of two sub-factors: Teacher-reported classroom assessment and Student-reported classroom projects. Teacher responses were modeled as indicators of the first factor while student responses were used as indicators of the second factor. Moderately strong standardized loadings (values ranging from 0.437 to 0.715) were found across the two factors (see Table 11). Only a low correlation (r = 0.186) was detected between the teacher and student factors.
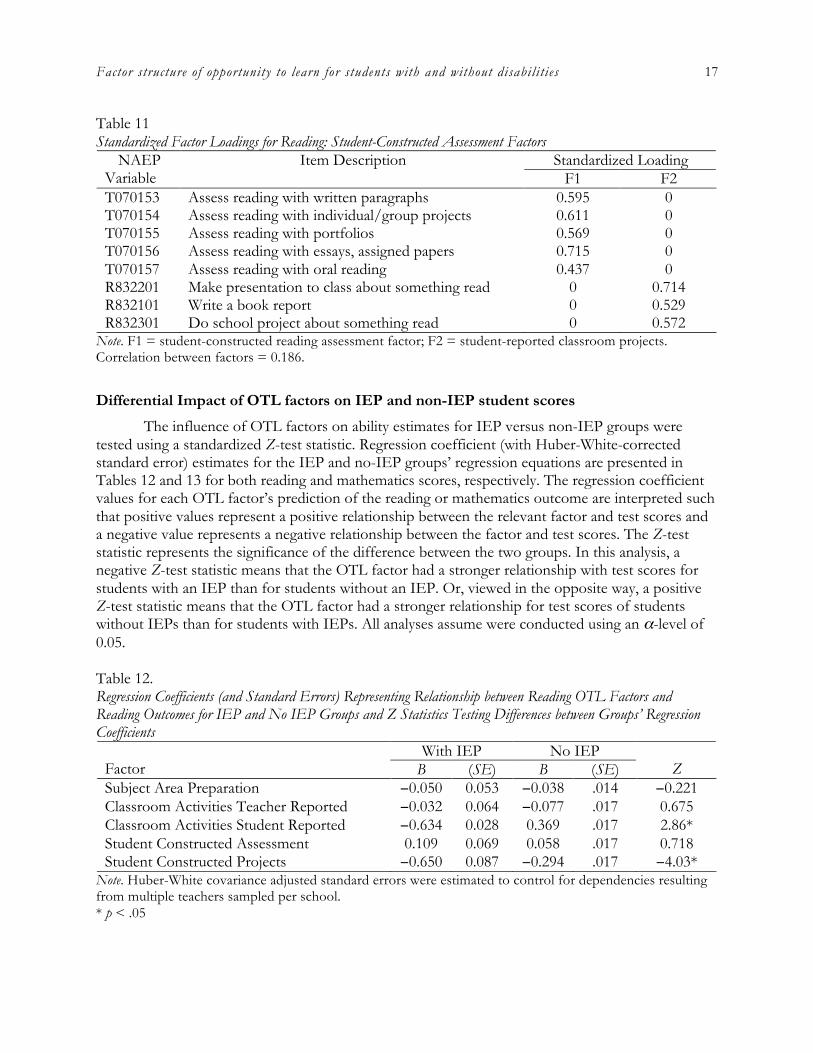
Factor structure of opportunity to learn for students with and without disabilities 17 Table 11 Standardized Factor Loadings for Reading: Student-Constructed Assessment Factors
Standardized Loading NAEP Variable
Item Description F1 F2
T070153 Assess reading with written paragraphs 0.595 0 T070154 Assess reading with individual/group projects 0.611 0 T070155 Assess reading with portfolios 0.569 0 T070156 Assess reading with essays, assigned papers 0.715 0 T070157 Assess reading with oral reading 0.437 0 R832201 Make presentation to class about something read 0 0.714 R832101 Write a book report 0 0.529 R832301 Do school project about something read 0 0.572
Note. F1 = student-constructed reading assessment factor; F2 = student-reported classroom projects. Correlation between factors = 0.186.
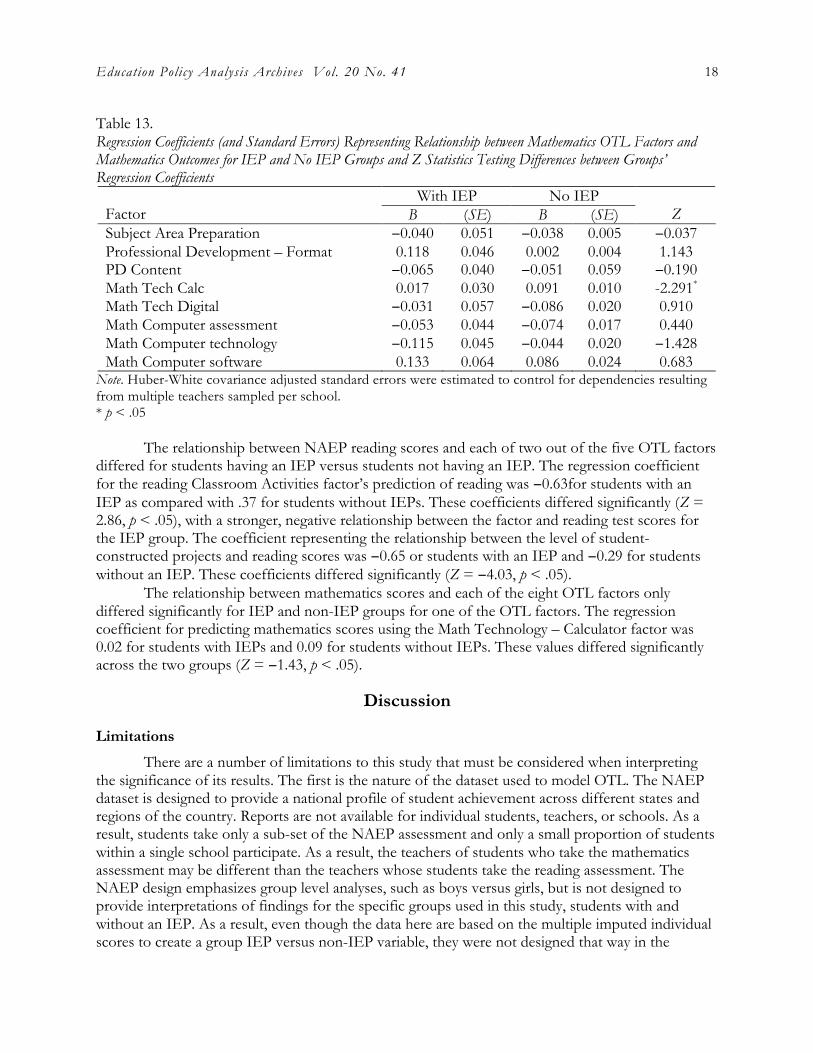
Differential Impact of OTL factors on IEP and non-IEP student scores
The influence of OTL factors on ability estimates for IEP versus non-IEP groups were tested using a standardized Z-test statistic. Regression coefficient (with Huber-White-corrected standard error) estimates for the IEP and no-IEP groups’ regression equations are presented in Tables 12 and 13 for both reading and mathematics scores, respectively. The regression coefficient values for each OTL factor’s prediction of the reading or mathematics outcome are interpreted such that positive values represent a positive relationship between the relevant factor and test scores and a negative value represents a negative relationship between the factor and test scores. The Z-test statistic represents the significance of the difference between the two groups. In this analysis, a negative Z-test statistic means that the OTL factor had a stronger relationship with test scores for students with an IEP than for students without an IEP. Or, viewed in the opposite way, a positive Z-test statistic means that the OTL factor had a stronger relationship for test scores of students without IEPs than for students with IEPs. All analyses assume were conducted using an α-level of 0.05. Table 12. Regression Coefficients (and Standard Errors) Representing Relationship between Reading OTL Factors and Reading Outcomes for IEP and No IEP Groups and Z Statistics Testing Differences between Groups’ Regression Coefficients
With IEP No IEP Factor B (SE) B (SE)
Z
Subject Area Preparation −0.050 0.053 −0.038 .014 −0.221 Classroom Activities Teacher Reported −0.032 0.064 −0.077 .017 0.675 Classroom Activities Student Reported −0.634 0.028 0.369 .017 2.86* Student Constructed Assessment 0.109 0.069 0.058 .017 0.718 Student Constructed Projects −0.650 0.087 −0.294 .017 −4.03*
Note. Huber-White covariance adjusted standard errors were estimated to control for dependencies resulting from multiple teachers sampled per school. * p < .05
Education Policy Analysis Archives Vol. 20 No. 41 18
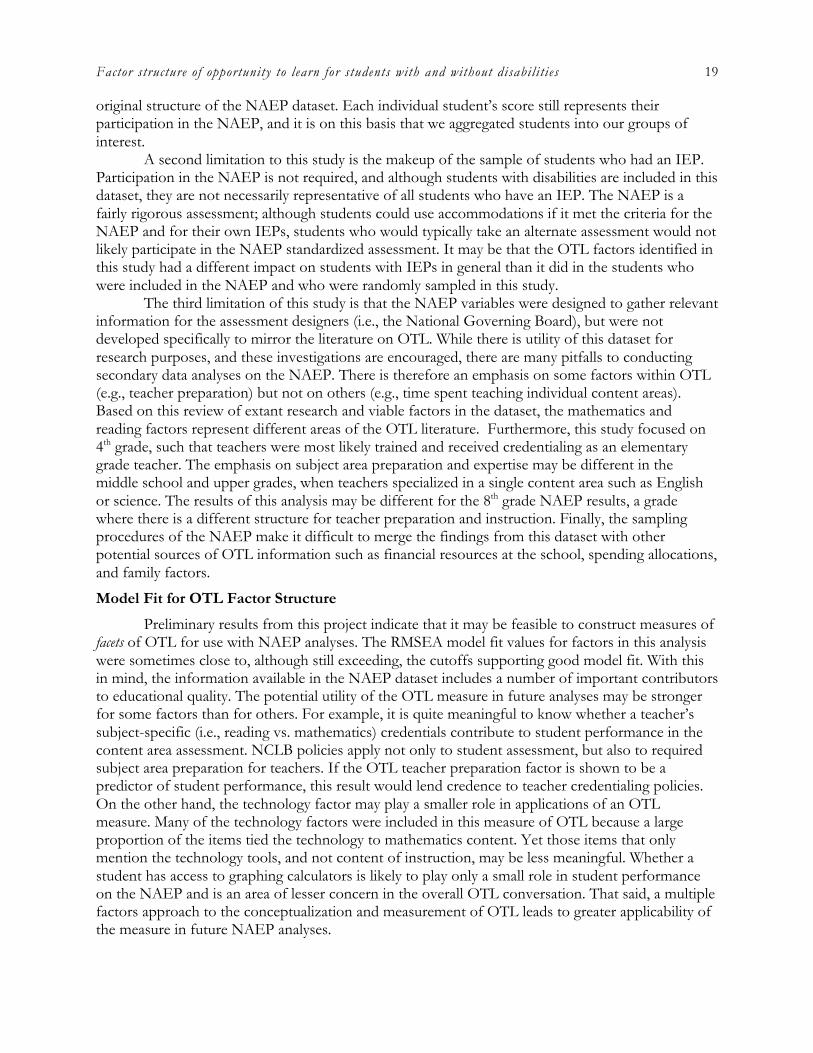
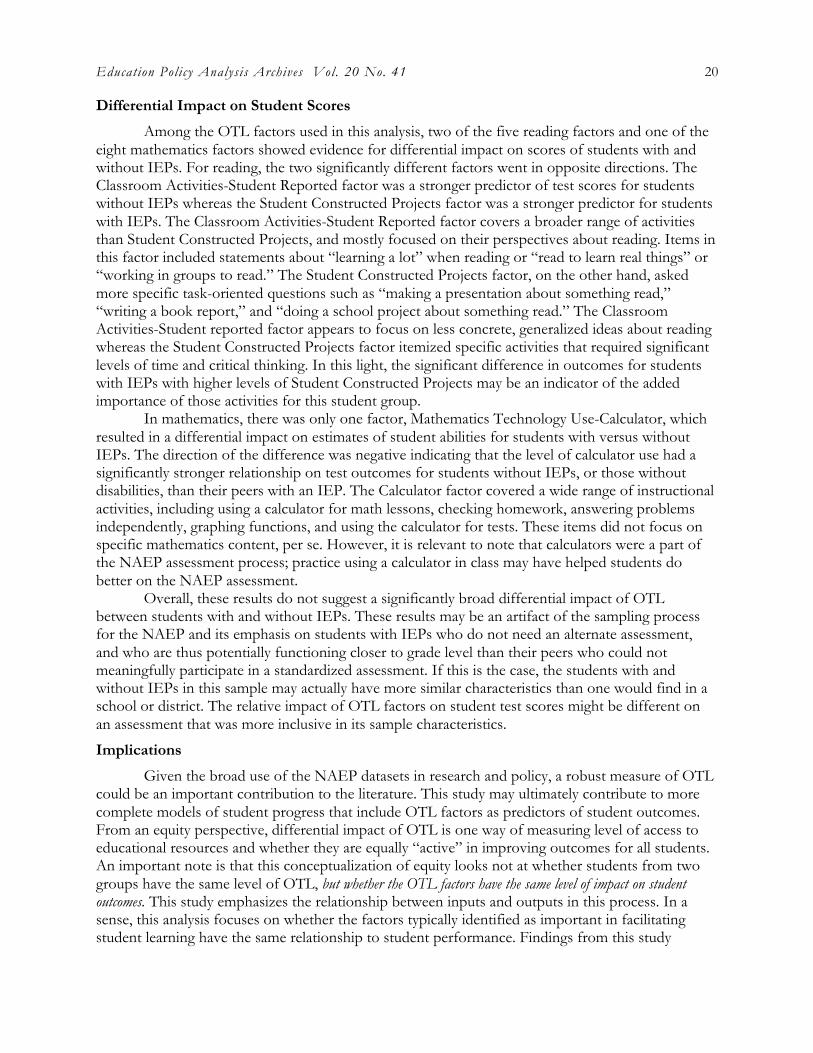
Table 13. Regression Coefficients (and Standard Errors) Representing Relationship between Mathematics OTL Factors and Mathematics Outcomes for IEP and No IEP Groups and Z Statistics Testing Differences between Groups’ Regression Coefficients
With IEP No IEP Factor B (SE) B (SE)
Z
Subject Area Preparation −0.040 0.051 −0.038 0.005 −0.037 Professional Development – Format 0.118 0.046 0.002 0.004 1.143 PD Content −0.065 0.040 −0.051 0.059 −0.190 Math Tech Calc 0.017 0.030 0.091 0.010 -2.291* Math Tech Digital −0.031 0.057 −0.086 0.020 0.910 Math Computer assessment −0.053 0.044 −0.074 0.017 0.440 Math Computer technology −0.115 0.045 −0.044 0.020 −1.428 Math Computer software 0.133 0.064 0.086 0.024 0.683
Note. Huber-White covariance adjusted standard errors were estimated to control for dependencies resulting from multiple teachers sampled per school. * p < .05 The relationship between NAEP reading scores and each of two out of the five OTL factors differed for students having an IEP versus students not having an IEP. The regression coefficient for the reading Classroom Activities factor’s prediction of reading was −0.63for students with an IEP as compared with .37 for students without IEPs. These coefficients differed significantly (Z = 2.86, p < .05), with a stronger, negative relationship between the factor and reading test scores for the IEP group. The coefficient representing the relationship between the level of student-constructed projects and reading scores was −0.65 or students with an IEP and −0.29 for students without an IEP. These coefficients differed significantly (Z = −4.03, p < .05). The relationship between mathematics scores and each of the eight OTL factors only differed significantly for IEP and non-IEP groups for one of the OTL factors. The regression coefficient for predicting mathematics scores using the Math Technology – Calculator factor was 0.02 for students with IEPs and 0.09 for students without IEPs. These values differed significantly across the two groups (Z = −1.43, p < .05).
Discussion
Limitations
There are a number of limitations to this study that must be considered when interpreting the significance of its results. The first is the nature of the dataset used to model OTL. The NAEP dataset is designed to provide a national profile of student achievement across different states and regions of the country. Reports are not available for individual students, teachers, or schools. As a result, students take only a sub-set of the NAEP assessment and only a small proportion of students within a single school participate. As a result, the teachers of students who take the mathematics assessment may be different than the teachers whose students take the reading assessment. The NAEP design emphasizes group level analyses, such as boys versus girls, but is not designed to provide interpretations of findings for the specific groups used in this study, students with and without an IEP. As a result, even though the data here are based on the multiple imputed individual scores to create a group IEP versus non-IEP variable, they were not designed that way in the
Factor structure of opportunity to learn for students with and without disabilities 19 original structure of the NAEP dataset. Each individual student’s score still represents their participation in the NAEP, and it is on this basis that we aggregated students into our groups of interest. A second limitation to this study is the makeup of the sample of students who had an IEP. Participation in the NAEP is not required, and although students with disabilities are included in this dataset, they are not necessarily representative of all students who have an IEP. The NAEP is a fairly rigorous assessment; although students could use accommodations if it met the criteria for the NAEP and for their own IEPs, students who would typically take an alternate assessment would not likely participate in the NAEP standardized assessment. It may be that the OTL factors identified in this study had a different impact on students with IEPs in general than it did in the students who were included in the NAEP and who were randomly sampled in this study.
The third limitation of this study is that the NAEP variables were designed to gather relevant information for the assessment designers (i.e., the National Governing Board), but were not developed specifically to mirror the literature on OTL. While there is utility of this dataset for research purposes, and these investigations are encouraged, there are many pitfalls to conducting secondary data analyses on the NAEP. There is therefore an emphasis on some factors within OTL (e.g., teacher preparation) but not on others (e.g., time spent teaching individual content areas). Based on this review of extant research and viable factors in the dataset, the mathematics and reading factors represent different areas of the OTL literature. Furthermore, this study focused on 4th grade, such that teachers were most likely trained and received credentialing as an elementary grade teacher. The emphasis on subject area preparation and expertise may be different in the middle school and upper grades, when teachers specialized in a single content area such as English or science. The results of this analysis may be different for the 8th grade NAEP results, a grade where there is a different structure for teacher preparation and instruction. Finally, the sampling procedures of the NAEP make it difficult to merge the findings from this dataset with other potential sources of OTL information such as financial resources at the school, spending allocations, and family factors.
Model Fit for OTL Factor Structure
Preliminary results from this project indicate that it may be feasible to construct measures of facets of OTL for use with NAEP analyses. The RMSEA model fit values for factors in this analysis were sometimes close to, although still exceeding, the cutoffs supporting good model fit. With this in mind, the information available in the NAEP dataset includes a number of important contributors to educational quality. The potential utility of the OTL measure in future analyses may be stronger for some factors than for others. For example, it is quite meaningful to know whether a teacher’s subject-specific (i.e., reading vs. mathematics) credentials contribute to student performance in the content area assessment. NCLB policies apply not only to student assessment, but also to required subject area preparation for teachers. If the OTL teacher preparation factor is shown to be a predictor of student performance, this result would lend credence to teacher credentialing policies. On the other hand, the technology factor may play a smaller role in applications of an OTL measure. Many of the technology factors were included in this measure of OTL because a large proportion of the items tied the technology to mathematics content. Yet those items that only mention the technology tools, and not content of instruction, may be less meaningful. Whether a student has access to graphing calculators is likely to play only a small role in student performance on the NAEP and is an area of lesser concern in the overall OTL conversation. That said, a multiple factors approach to the conceptualization and measurement of OTL leads to greater applicability of the measure in future NAEP analyses.
Education Policy Analysis Archives Vol. 20 No. 41 20
Differential Impact on Student Scores
Among the OTL factors used in this analysis, two of the five reading factors and one of the eight mathematics factors showed evidence for differential impact on scores of students with and without IEPs. For reading, the two significantly different factors went in opposite directions. The Classroom Activities-Student Reported factor was a stronger predictor of test scores for students without IEPs whereas the Student Constructed Projects factor was a stronger predictor for students with IEPs. The Classroom Activities-Student Reported factor covers a broader range of activities than Student Constructed Projects, and mostly focused on their perspectives about reading. Items in this factor included statements about “learning a lot” when reading or “read to learn real things” or “working in groups to read.” The Student Constructed Projects factor, on the other hand, asked more specific task-oriented questions such as “making a presentation about something read,” “writing a book report,” and “doing a school project about something read.” The Classroom Activities-Student reported factor appears to focus on less concrete, generalized ideas about reading whereas the Student Constructed Projects factor itemized specific activities that required significant levels of time and critical thinking. In this light, the significant difference in outcomes for students with IEPs with higher levels of Student Constructed Projects may be an indicator of the added importance of those activities for this student group. In mathematics, there was only one factor, Mathematics Technology Use-Calculator, which resulted in a differential impact on estimates of student abilities for students with versus without IEPs. The direction of the difference was negative indicating that the level of calculator use had a significantly stronger relationship on test outcomes for students without IEPs, or those without disabilities, than their peers with an IEP. The Calculator factor covered a wide range of instructional activities, including using a calculator for math lessons, checking homework, answering problems independently, graphing functions, and using the calculator for tests. These items did not focus on specific mathematics content, per se. However, it is relevant to note that calculators were a part of the NAEP assessment process; practice using a calculator in class may have helped students do better on the NAEP assessment.
Overall, these results do not suggest a significantly broad differential impact of OTL between students with and without IEPs. These results may be an artifact of the sampling process for the NAEP and its emphasis on students with IEPs who do not need an alternate assessment, and who are thus potentially functioning closer to grade level than their peers who could not meaningfully participate in a standardized assessment. If this is the case, the students with and without IEPs in this sample may actually have more similar characteristics than one would find in a school or district. The relative impact of OTL factors on student test scores might be different on an assessment that was more inclusive in its sample characteristics.
Implications
Given the broad use of the NAEP datasets in research and policy, a robust measure of OTL could be an important contribution to the literature. This study may ultimately contribute to more complete models of student progress that include OTL factors as predictors of student outcomes. From an equity perspective, differential impact of OTL is one way of measuring level of access to educational resources and whether they are equally “active” in improving outcomes for all students. An important note is that this conceptualization of equity looks not at whether students from two groups have the same level of OTL, but whether the OTL factors have the same level of impact on student outcomes. This study emphasizes the relationship between inputs and outputs in this process. In a sense, this analysis focuses on whether the factors typically identified as important in facilitating student learning have the same relationship to student performance. Findings from this study

Factor structure of opportunity to learn for students with and without disabilities 21 indicate that for the NAEP, factors developed from internal variables do not indicate a broad differential impact of OTL factors on student scores for students with and without IEPs. In other words, OTL factors measured here appear to have similar relationships to outcomes across both groups. In a program or policy focused on one of these factors, such as increasing technology use in mathematics, one would generally expect to see similar impact on student scores.
One fundamental assumption to this approach is that the same OTL factors are important for both students with and without disabilities. Although NCLB and similar accountability reforms are limited in how they differentiate student groups in expectations about content area standards or definitions of adequate progress, IDEIA is centered on the premise that students with disabilities require specialized services that are tailored to meet their educational needs. Even when in a full inclusion setting, a student with an IEP may receive different levels of instruction than their peers, with additional supports for classroom participation and a range of accommodations for assessment. Analysis in this study used the same OTL factor structure for students with and without IEPs because the purpose of this investigation was to see whether the relationships between these factors and student outcomes were the same for both groups. A more in-depth look at OTL for students with IEPs, apart from the OTL factors identified for both groups, could include factors such as the special education teacher preparation, intensity of services and match to student needs, implementation of accommodations in instruction and assessment, to name a few. The factor structure for students with and without IEPs would be different, with additional variables included for students with disabilities. In a confirmatory factor analysis, separate factor structures limit the ability to compare across groups; but if targeting an individual group, this approach could provide helpful context when interpreting student outcomes.
On an assessment policy level, NCLB’s emphasis on assessment outcomes may eventually refocus the education reform discussion on OTL. Student performance on standardized tests is currently the primary indicator of school success. The Common Core Initiative will be an opportunity to further explore how the factor structures identified here may differentially (or not) affect students from different backgrounds, be it students with and without disabilities, students who are native English speakers and those who are English Language Learners, or those from different cultural and ethnic backgrounds. If information about OTL in a school is taken in conjunction with student performance on state assessments, policy makers may have a clearer understanding of efforts schools have made to improve student outcomes. For example, a school with high levels of OTL may receive recognition of those efforts to improve student outcomes. State NAEP results are already poised to become a more visible component of school reports cards. Results from this project may encourage more nuanced assessment policies that consider student and school OTL when interpreting the significance of standardized test results.
NAEP analysis is a growing area of both primary and secondary data analyses. Understanding the relationship between OTL and student test scores could enrich research on educational outcomes, particularly those studies that use NAEP assessment results or similar large-scale datasets. Several of the highest rated NAEP Validity Research Priorities focus on how states would like to use NAEP data to support state results and to determine how well NAEP aligns with state goals (NAEP, 2003, p. 72). This begs the question regarding OTL: What exposure to NAEP test content is necessary for NAEP to be a useful benchmark of school success for states? Currently states vary widely not only in the curricula prescribed for students, but on alignment of state standards with the NAEP content. While it is not necessary for states to show perfect alignment, a reasonable match between classroom instruction and NAEP state assessment is necessary for there to be meaningful interpretations of NAEP results. OTL measures embedded within the NAEP dataset may be one way to complement alignment studies of test content. If states are measured, in
Education Policy Analysis Archives Vol. 20 No. 41 22
part, based on their NAEP performance, links between curriculum, instruction, and NAEP outcomes may become a part of a more comprehensive conceptualization of OTL (Porter, 2002).
On a broader level, research using an OTL measure could provide a more nuanced understanding of the factors that contribute to the outcomes of educational reform, particularly those that hope to close historic achievement gaps. It may be useful to perform similar comparisons for other student groups to see if findings are corroborated with other research on the differential impact of OTL (Schmidt & Maier, 2009). The assessments that are being developed for the Common Core will also have the potential to gain more sophisticated understanding of the impact of large-scale reforms. For example, policies that seek to address malleable factors such as teacher preparation or types of classroom activities might look to an OTL measure within the Common Core Assessment framework as a check for impact of implemented changes on student achievement. This would be particularly useful when evaluating the potential for multiple changes in a system from a broad reform initiative, such as NCLB, Race to the Top, charter school initiatives, etc.. In contrast with intervention designs where there is a single, often experimentally manipulated factor such as a new curriculum, education reforms are often implemented without the kinds of control groups and isolation of variables that might confound or co-occur with the intended reform. Unintended effects of a new initiative, such as reduction in instructional activities in another subject area, or co-occurring effects, such as the “value added” contribution of teacher preparation in the subject area, are important to measure when monitoring the potential effects of instructional change on student achievement. An OTL measure that tracks the context of learning, particularly when comparing outcomes for groups of students, may be a useful metric in understanding educational change on a large scale. Research and policy guided by a valid and reliable measure of OTL measure will have a more complete view of “what works” in education, for whom, and why.
References
Abedi, J., Leon, S. & Kao, J. (2008). Examining differential item functioning in reading assessments for students with disabilities. Los Angeles: University of California, Center for the Study of Evaluation/National Center for Research on Evaluation, Standards, and Student Testing (CSE Report 744).
Barbour, M. K., & Reeves, T. C. (2009). The reality of virtual schools: A review of the literature. Computers and Education, 52(2), 402-416
Bauer, W. I., Reese, S., & McAllister, P. A. (2003). Transforming music teaching via technology: The role of professional development. Journal of Research in Music Education, 51(4), 289–301.
Carroll, J. B. (1984). The model of school learning: Progress on an idea. In C. Fisher & D. Berliner (Eds.) Perspective on instructional time (pp. 29-58). New York: Longman.
Cawthon, S. (2004b). Schools for the deaf and the no child left behind act. American Annals of the Deaf, 149(4), 314 – 323
Cohen, D. K. & Hill, H. C. (2001). Learning policy: When state education reform works. New Haven, CT: Yale University Press.
Coleman, J. S., Campbell, E.Q., Hobson, C. J., Mc Partland, J. Mood, A., & Weinfeld, F. et al. (1966). Equality of educational opportunity. Washington DC: U.S. Government Printing Office.
Council of Chief State School Officers (2010). Common core standards. Retrieved June 1, 2012 from http://www.corestandards.org/
Darling-Hammond, L. (2000). Teacher quality and student achievement. Education Policy Analysis Archives, 8, 1. Retrieved from http://epaa.asu.edu/ojs/article/view/392
Factor structure of opportunity to learn for students with and without disabilities 23 Darling-Hammond, L., & Sykes, G. (2003). Wanted, a national teacher supply policy for education:
The right way to meet the "highly qualified teacher" challenge. Education Policy Analysis Archives, 11, 33. Retrieved from http://epaa.asu.edu/ojs/article/view/261
Darling-Hammond, L. & Youngs, P. (2002). Defining “highly qualified teachers:” What does “scientifically-based research” actually tell us? Educational Researcher, 31(9), 13-25.
Desimone, L., Porter, A. C., Birman, B. F., Garet, M. S., & Yoon, K. S. (2002). How do district management and implementation strategies relate to the quality of the professional development that districts provide to teachers? Teachers College Record, 104(7), 1265 - 1312.
Desimone, L. M., Porter, A. C., Garet, M. S., Yoon, K. S., & Birman, B. F. (2002). Effects of professional development on teachers’ instruction: Results from a three-year longitudinal study. Educational Evaluation and Policy Analysis, 24(2), 81 - 112.
Garet, M. S., Porter, A. C., Desimone, L., Birman, B. F., & Yoon, K. S. (2001). What makes professional development effective? Results from a national sample of teachers. American Educational Research Journal, 38(4), 915 – 945.
Gimbert, B., Bol, L., & Wallace, D. 2007. The influence of teacher preparation on student achievement and the application of national standards by teachers of mathematics in urban secondary schools. Education and Urban Society, 40(1), 91-117.
Goldhaber, D. D. & Anthony, E. (2003). Indicators of teacher quality. ERIC Educational Reports, Retrieved July 1, 2009 from: http://findarticles.com/p/articles/mi_pric/is_200307/ai_1884594033/
Goldhaber, D. D., & Brewer, D. J. (1997). Why don’t schools and teachers seem to matter? Assessing the impact of unobservables on educational productivity. Journal of Human Resources, 32(3), 505-523.
Guskey, T. R. (2000). Evaluating Professional Development. Thousand Oaks, CA: Corwin Press. Haberman, M. (1991). The pedagogy of poverty versus good teaching. Phi Delta Kappan, 73(4), 290-
294. Herman, J. L.; Klein, D.C. & Abedi, J. (2000). Assessing students’ opportunity to learn: Teacher and
student perspectives. Educational Measurement: Issues and Practice, 19(4), 16-24. Hu, L. & Bentler, P. (1999). Cutoff criteria for fit indexes in covariance structure analysis:
Conventional criteria versus new alternatives. Structural Equation Modeling: A Multidisciplinary Journal, 6, 1-55. DOI:10.1080/10705519909540118
Individuals with Disabilities Education Improvement Act of 2004, P.L. 108-446 Knezek, G., & Christensen, R. (2007) Effect of technology-based programs on first- and second-
grade reading achievement. Computers in Schools, 24(3/4), 23-41. Kornhaber M., & Orfield, G. (2001). Raising standards or raising barriers: Inequality and high stakes testing
in public education. New York: Century Foundation Press. Liao, Y.-K. C., Chang, H.-W., Chen, Y.-W. (2007) Effects of computer applications in elementary
school students’ achievement: A meta-analysis of students in Taiwan. Computers in the Schools 24(3/4), 43-64.
Maninger, R.M., (2006). Successful technology integration: Student test scores improved in an English literature course through the use of supportive devices. Tech Trends: Linking Research and Practice to Improve Learning, 50(5), 37-45.
Martindale, T., Pearson, C., Curda, L.K., & Pilcher, J. (2005) Effects of an online instructional application on reading and mathematics standardized test scores. Journal of Research on Technology in Education, 37(4), 349-360.
McDonnell, L. (1995). Opportunity to learn as a research concept and a policy instrument. Educational Evaluation And Policy Analysis, 21(17), 305-322.
Education Policy Analysis Archives Vol. 20 No. 41 24
McPartland, J. M. & Schneider, B. (1996). Opportunities to learn and student diversity: Prospects and pitfalls of a common core curriculum. Sociology of Education, 69, 66-81.
Mislevy, R.J., Beaton, A.E., Kaplan, B., and Sheehan, K.M. (1992). Estimating population characteristics from sparse matrix samples of item responses. Journal of Educational Measurement, 29(2), 133–161.
Neurath, R. A., & Stephens, L.J. (2006). The effect of using Microsoft Excel in a high school algebra class. International Journal of Mathematicsematical Education in Science and Technology, 37(6), 721-756.
Oakes, J. (1985). Keeping track: How schools structure inequality. New Haven, CT: Yale University Press. O'Sullivan, P. J., Ysseldyke, J. E., Christenson, S. L., & Thurlow, M. L. (1990). Mildly handicapped
elementary students' opportunity to learn during reading instruction in mainstream and special education settings. Reading Research Quarterly, 25, 131-46.
Osgood, R. (2005). The history of inclusion in the United States. Gallaudet University Press. Polk, J. (2006). Traits of effective teachers. Arts Education Policy Review, 107(4), 23-29. Porter, A. (1993). Defining and measuring opportunity to learn. Paper prepared for the National
Governor’s Association. Porter, A. C. (1991). Creating a system of school process indicators. Educational Evaluation and Policy
Analysis, 13(1), 13-29. Porter, A. C. (1988). Indicators: Objective data or political tool? Phi Delta Kappan, 67(9), 503-508. Porter, A. (1995). The uses and misuses of opportunity to learn standards. Educational Researcher, 1,
21-27. Porter, A.C. (2002). Measuring the content of instruction: Uses in research and practice. Educational
Researcher, 31, 13-29. Porter, A. C., Blank, R., Smithson, J., & Osthoff, E. (2005). Place-based randomized trials to test the
effects on instructional practices of a mathematics/science professional development program for teachers. Annals of the American Academy of Political and Social Science, 599, 147-175.
Resnick, L. B. (2005). Teaching teachers: Professional development to improve student achievement. Research Points, 3(1), 1–4.
Rigeman, S., & McIntire, N. (2005). Enhancing curriculum and instruction through technology. T H E Journal, 32(12), 31-34.
Ross, J.A., & Bruce, C.D. (2009) Student achievement effects of technology-supported remediation of understanding of fractions. International Journal of Mathematicsematical Education in Science and Technology, 40(6), 713-727.
Roach, A. T., & Elliott, S. N. (2009). Consultation to support inclusive accountability and standards-based reform: Facilitating access, equity, and empowerment. Journal of Educational and Psychological Consultation, 19, 61-81.
Roach, A. E., Chilungu, N., LaSalle, T. P., Talapatra, D. Vignieri, M. J., & Kurz A. (2009). Opportunities and options for facilitating and evaluating access to the general curriculum for students with disabilities. Peabody Journal of Education: Issues of Leadership, Policy, and Organizations, 84, 511-528.
Rowan, B., Chiang, F.S., & Miller, R. J. (1997). Using research on employee's performance to study the effects of teacher on students' achievement. Sociology of Education, 70, 256-284.
Scherff, L. & Piazza, C. L. (2008-2009). Why now, more than ever, we need to talk about opportunity to learn. Journal of Adolescent and Adult Literacy, 52(4), 343-352.
Schmidt, W. H. & Maier, A. (2009). Opportunity to Learn. In Sykes, G., Schneider, B., & Plank, D. (Eds.). Handbook of Education Policy Research. Routledge: NY, NY.

Factor structure of opportunity to learn for students with and without disabilities 25 Schroeder, C. M., Scott, T. P., Tolson, H., Huang, T.-Y. & Lee, Y.-H. (2007). A meta-analysis of
national research: Effects of teaching strategies on student achievement in science in the United States. Journal of Research in Science Teaching, 44, 1436–1460. doi: 10.1002/tea.20212
Supovitz, J. A. (2001). Translating teaching practice into improved student achievement. In From the Capital to the Classroom: Standards-based Reform in the States. S. Fuhrman (eds.). Chicago: University of Chicago Press, p 81-98.
Thibodeau, G. M. (2008). A content literacy collaborative study group: High school teachers take charge of their professional learning. Journal of Adolescent & Adult Literacy, 52, 54–64. doi: 10.1598/JAAL.52.1.6
Trimble, S. (2003). Research-based classroom practices and student achievement. Middle School Journal, 35(1), 52-58.
Tuzun, H., Yilmaz-Soylu, M., Karakus, T., Inai, Y., & Kizilkaa, G. (2009). The effects of computer games on primary school students’ achievement and motivation in geography learning. Computers & Education, 52, 68-77.
Wang, J. & Goldschmidt, P. (2003). Importance of middle school mathematics on high school students’ mathematics achievement. The Journal of Educational Research, 91(1), 3-19.
Wilson, S., Floden R., & Ferrini-Mundy, J. (2001). Teacher preparation research: Current knowledge, gaps, and recommendations. Center for the Study of Teaching and Policy.
Wright, P., Horn, S., & Sanders, W. (1997). Teachers and classroom heterogeneity: Their effects on educational outcomes. Journal of Personnel Evaluation in Education, 11(1), 57–67.
Ysseldyke J.E. & Christenson, S.L. (1987). Evaluating students' instructional environments. Remedial and Special Education, 8, 17-24. doi:10.1177/074193258700800305

Education Policy Analysis Archives Vol. 20 No. 41 26
About the Authors
Stephanie W. Cawthon The University of Texas at Austin Email: [email protected] Stephanie Cawthon is an assistant professor in the School Psychology Program in the Department of Educational Psychology at The University of Texas at Austin. Her expertise is in policy to practice issues related to students with disabilities, particularly in the areas of assessment accommodations and accountability reforms. Natasha Beretvas The University of Texas at Austin Natasha Beretvas is a professor in the Quantitative Methods Area of the Department of Educational Psychology at The University of Texas at Austin. Her expertise is in innovative application of psychometric and statistical models; multilevel modeling with a focus on extensions to the conventional multilevel model to handle student mobility and other sources of data structure complexities; and meta-analytic techniques. Alyssa Kaye The University of Texas at Austin Alyssa Kaye is a doctoral candidate in the School Psychology Program in the Department of Educational Psychology at The University of Texas at Austin. Her interests are in educational interventions for students with learning disabilities. Leland Lockhart The University of Texas at Austin Leland Lockhart is a doctoral candidate in the Quantitative Methods area in the Department of Educational Psychology at The University of Texas at Austin. His interest are in multi-level modeling techniques for large-scale datasets.

Factor structure of opportunity to learn for students with and without disabilities 27
education policy analysis archives Volume 20 Number 41 December 17th, 2012 ISSN 1068-2341
Readers are free to copy, display, and distribute this article, as long as the work is attributed to the author(s) and Education Policy Analysis Archives, it is distributed for non-commercial purposes only, and no alteration or transformation is made in the work. More details of this Creative Commons license are available at http://creativecommons.org/licenses/by-nc-sa/3.0/. All other uses must be approved by the author(s) or EPAA. EPAA is published by the Mary Lou Fulton Institute and Graduate School of Education at Arizona State University Articles are indexed in CIRC (Clasificación Integrada de Revistas Científicas, Spain), DIALNET (Spain), Directory of Open Access Journals, EBSCO Education Research Complete, ERIC, Education Full Text (H.W. Wilson), QUALIS A2 (Brazil), SCImago Journal Rank; SCOPUS, SOCOLAR (China).
Please contribute commentaries at http://epaa.info/wordpress/ and send errata notes to Gustavo E. Fischman [email protected] Join EPAA’s Facebook community at https://www.facebook.com/EPAAAAPE and Twitter feed @epaa_aape.
Education Policy Analysis Archives Vol. 20 No. 41 28
education policy analysis archives editorial board
Editor Gustavo E. Fischman (Arizona State University) Associate Editors: David R. Garcia (Arizona State University), Stephen Lawton (Arizona State University)
Rick Mintrop, (University of California, Berkeley) Jeanne M. Powers (Arizona State University) Jessica Allen University of Colorado, Boulder Christopher Lubienski University of Illinois, Urbana-
Champaign Gary Anderson New York University Sarah Lubienski University of Illinois, Urbana-
Champaign Michael W. Apple University of Wisconsin, Madison Samuel R. Lucas University of California, Berkeley Angela Arzubiaga Arizona State University Maria Martinez-Coslo University of Texas, Arlington David C. Berliner Arizona State University William Mathis University of Colorado, Boulder Robert Bickel Marshall University Tristan McCowan Institute of Education, London Henry Braun Boston College Heinrich Mintrop University of California, Berkeley Eric Camburn University of Wisconsin, Madison Michele S. Moses University of Colorado, Boulder Wendy C. Chi* University of Colorado, Boulder Julianne Moss University of Melbourne Casey Cobb University of Connecticut Sharon Nichols University of Texas, San Antonio Arnold Danzig Arizona State University Noga O'Connor University of Iowa Antonia Darder University of Illinois, Urbana-
Champaign João Paraskveva University of Massachusetts,
Dartmouth Linda Darling-Hammond Stanford University Laurence Parker University of Illinois, Urbana-
Champaign Chad d'Entremont Strategies for Children Susan L. Robertson Bristol University
John Diamond Harvard University John Rogers University of California, Los Angeles Tara Donahue Learning Point Associates A. G. Rud Purdue University Sherman Dorn University of South Florida Felicia C. Sanders The Pennsylvania State University Christopher Joseph Frey Bowling Green State
University Janelle Scott University of California, Berkeley
Melissa Lynn Freeman* Adams State College Kimberly Scott Arizona State University Amy Garrett Dikkers University of Minnesota Dorothy Shipps Baruch College/CUNY Gene V Glass Arizona State University Maria Teresa Tatto Michigan State University Ronald Glass University of California, Santa Cruz Larisa Warhol University of Connecticut Harvey Goldstein Bristol University Cally Waite Social Science Research Council Jacob P. K. Gross Indiana University John Weathers University of Colorado, Colorado
Springs Eric M. Haas WestEd Kevin Welner University of Colorado, Boulder Kimberly Joy Howard* University of Southern
California Ed Wiley University of Colorado, Boulder
Aimee Howley Ohio University Terrence G. Wiley Arizona State University Craig Howley Ohio University John Willinsky Stanford University Steve Klees University of Maryland Kyo Yamashiro University of California, Los Angeles Jaekyung Lee SUNY Buffalo * Members of the New Scholars Board

Factor structure of opportunity to learn for students with and without disabilities 29
archivos analíticos de políticas educativas consejo editorial
Editor: Gustavo E. Fischman (Arizona State University) Editores. Asociados Alejandro Canales (UNAM) y Jesús Romero Morante (Universidad de Cantabria)
Armando Alcántara Santuario Instituto de
Investigaciones sobre la Universidad y la Educación, UNAM México
Fanni Muñoz Pontificia Universidad Católica de Perú
Claudio Almonacid Universidad Metropolitana de Ciencias de la Educación, Chile
Imanol Ordorika Instituto de Investigaciones Economicas – UNAM, México
Pilar Arnaiz Sánchez Universidad de Murcia, España Maria Cristina Parra Sandoval Universidad de Zulia, Venezuela
Xavier Besalú Costa Universitat de Girona, España Miguel A. Pereyra Universidad de Granada, España Jose Joaquin Brunner Universidad Diego Portales,
Chile Monica Pini Universidad Nacional de San Martín,
Argentina Damián Canales Sánchez Instituto Nacional para la
Evaluación de la Educación, México Paula Razquin UNESCO, Francia
María Caridad García Universidad Católica del Norte, Chile
Ignacio Rivas Flores Universidad de Málaga, España
Raimundo Cuesta Fernández IES Fray Luis de León, España
Daniel Schugurensky Universidad de Toronto-Ontario Institute of Studies in Education, Canadá
Marco Antonio Delgado Fuentes Universidad Iberoamericana, México
Orlando Pulido Chaves Universidad Pedagógica Nacional, Colombia
Inés Dussel FLACSO, Argentina José Gregorio Rodríguez Universidad Nacional de Colombia
Rafael Feito Alonso Universidad Complutense de Madrid, España
Miriam Rodríguez Vargas Universidad Autónoma de Tamaulipas, México
Pedro Flores Crespo Universidad Iberoamericana, México
Mario Rueda Beltrán Instituto de Investigaciones sobre la Universidad y la Educación, UNAM México
Verónica García Martínez Universidad Juárez Autónoma de Tabasco, México
José Luis San Fabián Maroto Universidad de Oviedo, España
Francisco F. García Pérez Universidad de Sevilla, España
Yengny Marisol Silva Laya Universidad Iberoamericana, México
Edna Luna Serrano Universidad Autónoma de Baja California, México
Aida Terrón Bañuelos Universidad de Oviedo, España
Alma Maldonado Departamento de Investigaciones Educativas, Centro de Investigación y de Estudios Avanzados, México
Jurjo Torres Santomé Universidad de la Coruña, España
Alejandro Márquez Jiménez Instituto de Investigaciones sobre la Universidad y la Educación, UNAM México
Antoni Verger Planells University of Amsterdam, Holanda
José Felipe Martínez Fernández University of California Los Angeles, USA
Mario Yapu Universidad Para la Investigación Estratégica, Bolivia

Education Policy Analysis Archives Vol. 20 No. 41 30
arquivos analíticos de políticas educativas conselho editorial
Editor: Gustavo E. Fischman (Arizona State University) Editores Associados: Rosa Maria Bueno Fisher e Luis A. Gandin
(Universidade Federal do Rio Grande do Sul) Dalila Andrade de Oliveira Universidade Federal de
Minas Gerais, Brasil Jefferson Mainardes Universidade Estadual de Ponta
Grossa, Brasil Paulo Carrano Universidade Federal Fluminense, Brasil Luciano Mendes de Faria Filho Universidade Federal
de Minas Gerais, Brasil Alicia Maria Catalano de Bonamino Pontificia
Universidade Católica-Rio, Brasil Lia Raquel Moreira Oliveira Universidade do Minho,
Portugal Fabiana de Amorim Marcello Universidade Luterana
do Brasil, Canoas, Brasil Belmira Oliveira Bueno Universidade de São Paulo,
Brasil Alexandre Fernandez Vaz Universidade Federal de
Santa Catarina, Brasil António Teodoro Universidade Lusófona, Portugal
Gaudêncio Frigotto Universidade do Estado do Rio de Janeiro, Brasil
Pia L. Wong California State University Sacramento, U.S.A
Alfredo M Gomes Universidade Federal de Pernambuco, Brasil
Sandra Regina Sales Universidade Federal Rural do Rio de Janeiro, Brasil
Petronilha Beatriz Gonçalves e Silva Universidade Federal de São Carlos, Brasil
Elba Siqueira Sá Barreto Fundação Carlos Chagas, Brasil
Nadja Herman Pontificia Universidade Católica –Rio Grande do Sul, Brasil
Manuela Terrasêca Universidade do Porto, Portugal
José Machado Pais Instituto de Ciências Sociais da Universidade de Lisboa, Portugal
Robert Verhine Universidade Federal da Bahia, Brasil
Wenceslao Machado de Oliveira Jr. Universidade Estadual de Campinas, Brasil
Antônio A. S. Zuin Universidade Federal de São Carlos, Brasil