Embed Size (px)
Citation preview

Journal website: http://epaa.asu.edu/ojs/ Manuscript received: 9/22/2011 Facebook: /EPAAA Revisions received: 4/20/2012 Twitter: @epaa_aape Accepted: 5/17/2012
education policy analysis archives A peer-reviewed, independent, open access, multilingual journal
Arizona State University
Volume 20 Number 33 October 23rd, 2012 ISSN 1068-2341
Trends in mathematics and science performance in 18
countries: Multiple regression analysis of the cohort effects of TIMSS 1995-2007
Hee Kyung Hong Hong Kong Institute of Education
Hong Kong, SAR Citation: Hong, H.K. (2012). Trends in mathematics and science performance in 18 countries: Multiple regression analysis of the cohort effects of TIMSS 1995-2007. Education Policy Analysis Archives, 20(33). Retrieved [date], from http://epaa.asu.edu/ojs/article/view/1012 Abstract: The purpose of this study was to simultaneously examine relationships between teacher quality and instructional time and mathematics and science achievement of 8th grade cohorts in 18 advanced and developing economies. In addition, the study examined changes in mathematics and science performance across the two groups of economies over time using data from the TIMSS 1995-2007 assessments. While economy did not account for variation in mathematics and science achievement, findings from regression analyses indicated significant relationships between school inputs and achievement in both groups of countries across the years. Teaching experience was a strong indicator of mathematics performance in developing countries, while instructional time was mildly related to achievement in both subjects in advanced economies. Keywords: TIMSS; advanced economies; developing economies; school resources; student achievement Tendencias en el desempeño en matemáticas y ciencias en 18 países: Análisis de regresión múltiple de los efectos de cohorte en TIMSS 1995-2007 Resultados usando TIMSS 1995-2007.
epaa aape

Trends in mathematics and science performance in 18 countries 2
Resumen: El objetivo de este estudio fue examinar simultáneamente las relaciones entre la calidad docente y el tiempo de instrucción y los logros en matemáticas y ciencias de una cohorte de 8° grado en 18 economías avanzadas y en desarrollo. Además, el estudio examinó los cambios en el rendimiento en matemáticas y ciencias entre dos grupos de economías a lo largo del tiempo utilizando los datos de las evaluaciones de TIMSS de 1995-2007. Aunque la variable “economía” no mostró variación en los resultados de logros de aprendizaje en matemáticas y ciencias, los análisis de regresión muestran relaciones significativas entre los insumos escolares y logros de aprendizaje en los dos tipos de países a lo largo de los años. La experiencia docente fue un fuerte indicador del rendimiento en matemáticas en los países en desarrollo, mientras que el tiempo de instrucción se relaciona medianamente con el rendimiento en ambas materias en las economías avanzadas. Palabras clave: TIMSS; economías avanzadas; economías en desarrollo; recursos escolares; aprendizaje estudiantil. Tendências no desempenho em matemáticas e ciências em 18 países: análise de regressão múltipla de efeitos de coorte no TIMSS 1995-2007 Resumo: O objetivo deste estudo foi examinar, simultaneamente, as relações entre a qualidade do professor e o tempo de instrução e os resultados em matemática e ciências de grupos do último ano do ensino básico (8th grade) em 18 economias avançadas e em desenvolvimento. Para além disso, o estudo examinou as mudanças no desempenho em matemática e em ciências entre os dois grupos de economia ao longo do tempo, usando dados das avaliações do TIMSS 1995-2007. Embora a economia não conte para a variação nos resultados em matemática e ciências, os resultados das análises de regressão indicam relações significativas entre as condições das escolas e os resultados em ambos os grupos de países, ao longo dos anos. A experiência de ensino foi um forte indicador do desempenho em matemática em países em desenvolvimento, enquanto o tempo de instrução relacionou-se moderadamente com os resultados alcançados em ambas as disciplinas em economias avançadas. Palavras-chave: TIMSS; economias avançadas; economias em desenvolvimento; recursos das escolas; resultados dos estudantes
Introduction
As greater emphasis is placed on mathematics and science in national education systems as a means of generating a high rate of return to the economy (Schofer, Ramirez, & Meyer, 2000), there has been an increasing focus on cross-national comparisons of student performance in the two subject areas. The aim of these comparisons is to assess the quality and educational efficiency of such programs in relation to the financial reforms driven by the national economy. International donor agencies such as the World Bank and International Monetary Fund (IMF) have offered prescriptions for improving efficiency and quality of education systems, while international organizations such as the Organisation for Economic Co-operation and Development (OECD) and the International Evaluation of Educational Achievement (IEA) have emphasized measurement and comparison of school outcomes, with better education outcomes considered integral to economic and social productivity (Arnove, 2007).
The purpose of this study is to explore the relationship between levels of economic performance and mathematics and science achievement in international education systems. This is important as one influences the other in meaningful ways. On the one hand, research that examined the impact of mathematics and science on development have concluded that better education outcomes, particularly in mathematics and science, are considered integral to economic and social

Education Policy Analysis Archives Vol. 20 No. 33 3
productivity (Schofer, Ramirez, & Meyer, 2000). This is especially salient in the globalized era in which the world economy is becoming increasingly integrated, and proficiency in the two subject areas is deemed necessary to respond to technological and scientific changes.
On the other hand, and more importantly, national school systems can also focus on extending the school inputs necessary to develop the essential sets of mathematics and science skills to produce an optimal achievement outcome that corresponds to economic growth. In addition to assessing the relationship between national economy and mathematics and science achievement, other within-school factors that enhance achievement in these subject areas are explored. One role of international studies such as the IEA is to provide individual countries with the impetus to improve students’ academic achievement in different subject areas through information derived from cross-national scales of comparison. Studies that have examined mathematics and science achievement have reported that differences in national curricula – in the extent to which the intended, potentially implemented and implemented curricula reflect the culture of a country – explained much of the variation in achievement outcomes (Cogan & Schmidt, 2002; Papanastasiou, 2000). Other studies have shown that school resources contribute to variations in student achievement in developing countries, and are better predictors of mathematics than other achievement measures (Marks, Cresswell, & Ainley, 2006; Reddy, 2005).
In this study, the relationship between Gross Domestic Product (GDP) per capita and achievement in mathematics and science is examined. GDP per capita is often used as an indicator of national economy, especially in cross-national achievement studies, based on the assumption that advanced economies also tend to be high performers in mathematics and science (Baker, Goesling, & LeTendre, 2002; Chudgar & Luschei, 2009; Ramirez et al., 2006). Two research questions are raised. First, is there an increase in mathematics and science achievement over time across the different countries, and if so, does the increase in achievement correlate with GDP per capita across the years? Second, how do school level factors – such as instructional time spent in school, teacher’s formal education, and teaching experience – affect mathematics and science achievement across the two groups of economies? Additionally, do these effects vary over time?
Theoretical Framework This study subscribes to the education production function model in establishing the
possible relationship between national economy and achievement in mathematics and science. The production function framework of economics explains the production of education as a function of different inputs that are important for a given context or country (Chudgar & Luschei, 2009). Most production function studies measure educational outcomes in terms of student achievement, although some studies have used alternative quantitative measures to assess outcomes, such as attendance rates and attitudinal scales. Among them, student performance is considered the most direct and measurable indicator of school outcomes. Measured achievement has been employed as a reasonable predictor of success in the labor market, as well as a plausible indicator of economically relevant skills. Educational inputs range from economic to sociological inputs such as investment into school resources, student’s family background, and curricular contents. Although Hanushek and Kimko (2000) disputed the impact of direct spending on student achievement, Heyneman and Loxley (1983) found that both school and teacher qualities are key factors that influence student learning in numerous advanced and developing countries. This study examines school factors as educational inputs in relation to mathematics and science achievement.
Criticisms of the education production function model have pointed to the limitations of identifying reliable production functions in education based on three grounds. The first highlights

Trends in mathematics and science performance in 18 countries 4
the conceptual limitation of the underlying productivity model as it fails to capture the complex and dynamic nature of education production processes (Monk, 1992). The second criticism is directed at the outcomes-as-standards strategy used to identify the properties of the relevant production functions. Again, the issues focus on the conceptualization of the standards as well as their measurement, which obscure the implications for policy-making by the central authority as knowledge about the precise factors contributing to improved school effects are lacking. The third factor critiques the deficiency of the model that bases productivity on tangible and non-simultaneous possession of material goods, without factoring non-material resources into the production function model (Hodas, 1993).
Modernization and human capital theories, on the other hand, focus on the role of education in advancing economic growth. They specifically examine the effect of human capital on economic growth, which this study does not intend to cover. The premise of their arguments also acknowledges the importance of mathematics and science as core subjects that contribute to the expansion of industrial production (Kamens, Meyer, & Benavot, 1996), and to the improvement of individual and national productivity (Schofer, Ramirez, & Meyer, 2000). A more recent study (Ramirez et. al., 2006), however, empirically supports that the established confidence of the positive effects of educational attainment on economic growth is unwarranted. Nonetheless, the study demonstrates that there is a positive relationship between national economy and mathematics and science achievement in the four Asian Tigers (South Korea, Taiwan, Hong Kong, and Singapore) that have achieved remarkable economic growth between the 1960s and 1990s. It is not surprising, therefore, that mathematics and science have been the most prevalent school subjects in reform efforts, especially in the lower secondary levels, to educate a more technically and scientifically literate population. Since the 1960s, developing nations have also adopted policy reforms incorporating mathematics and science into their primary school curricula as a means to achieve economic prosperity (Benavot, 2004).
School factors. School resources explain a larger proportion of variance in achievement for developing than for advanced economies. Heyneman and Loxley (H-L) (1983) proposed that variations in school resource quality can matter more than variations in family SES in affecting overall student achievement in less-developed nations, while the reverse holds true for developed nations. While the H-L findings have specifically been disputed in replicated studies on school effects (Baker, Goesling, & LeTendre, 2002; Hanushek & Luque, 2003), the literature on production function studies generally indicate that school resources are important and significant for student achievement in developing countries (Hanushek, 1995; Buchmann & Hannum, 2001).
Raising teacher quality was found to be critical to improving student learning outcomes (Rockoff, 2005), as student achievement is affected more by the teacher than by other factors such as class size or composition (Darling-Hammond & Sykes, 2003). This has been affirmed early on by the Coleman Report that highlighted teacher characteristics to account for more variance in student achievement than any other school resources (Coleman et al., 1966). Evidence from the U.S. showed that indicators of teacher quality, such as teacher certification and degree in the field to be taught, were the strongest predictors of student outcomes; while uncertified teachers were a weak predictor of student achievement (Darling-Hammond, 2000). Beginning teachers also performed significantly worse than more experienced teachers, which implied important gains in teaching quality for novice teachers in their first years of teaching (Rivkin, Hanushek, & Kain, 2005). Teacher qualifications and teaching experience were also positively associated with student achievement, especially in the lower grades (Hanushek & Luque, 2003). Teacher certification in science, that trained teachers to present scientific concepts and acquire mastery of content knowledge, was also highly correlated to student achievement in TIMSS (Vlaardingerbroek & Taylor, 2003).

Education Policy Analysis Archives Vol. 20 No. 33 5
In developing countries, teachers in general lack adequate academic qualifications, training and mastery of content compared to teachers in advanced economies (UNESCO, 2004). Research has shown mixed evidence on the relationship between teacher quality and student achievement in developing contexts. Students performed better in mathematics and English when taught by qualified teachers than otherwise in rural Kenya (Oneri & Goll, 2008), while students tended to score lower in science if the teachers majored in the subject in Romanian schools (Istrate et al., 2006). However, teacher education in developing countries was found to be effective in enhancing student performance as evidenced in 35 out of 63 studies conducted in the 1980s and early 1990s (Hanushek, 1995). This also supports the argument that achievement in developing nations is less affected by socioeconomic differences than by within-school factors. Furthermore, there was a notable difference in the way trained teachers taught more advanced grades and more difficult subjects, mainly in mathematics and science (Heyneman & Loxley, 1983).
When school systems allocated a greater amount of time on any given subject, Inkeles (1979) reported that it yielded national differences in academic performance. Subsequent studies have affirmed the positive effects of instructional time on student achievement, especially time spent on subject-specific instructions (Frederick & Walberg, 1980; Benavot & Gad, 2004). Instructional time is often discussed in conjunction with instructional quality and content, and is an essential component of school resources (Baker et al., 2004a). According to the economic analysis of time spent on school learning (Millot & Lane, 2002), instructional time is optimal as an educational input when it produces classroom learning as output, as measured by achievement tests. A comprehensive review of school effectiveness studies cited length of instructional time to be an important factor in influencing student achievement (Lewin, 1993). The actual amount of instructional time the students receive, as opposed to the intended instructional time that is often reported in large data surveys, matters more for learning outcomes, given the discrepancy between the intended and enacted curriculum in both developed and developing countries (Benavot & Gad, 2004).
In earlier studies, the length of time spent on subject content in developing countries was a consistent predictor of student achievement, with instructional time being comparable in magnitude to other school factors (Fuller, 1987). Subsequent studies (Baker, Goesling, & LeTendre, 2002; Baker et al., 2004a) have critiqued this on two grounds: the findings pertain to a period when the discrepancies in educational resources were greater than they are at present among developing economies, with the overall association between instructional time and achievement across countries being relatively small. Nonetheless, instructional time did account for more variances in science than in mathematics achievement (Baker et al., 2004a). In addition, developing nations allocated an extensive amount of instructional time to both subjects for their relevance to economic development (Kamens, Meyer, & Benavot, 1996). Cross-national research conducted between 1925 and 1985 showed that expanded time was given to mathematics in developing countries (Kamens & Benavot, 1991), but this trend was ambiguous between 1985 and 2000 with mathematics emphasized only in selected parts of the world, such as Latin America and the Caribbean (Benavot, 2004).
Methodology
Data
For the TIMSS data collection, 42, 38, 48 and 59 countries participated in the eighth grade test-taking in 1995, 1999, 2003 and 2007, respectively (Beaton et al., 1996; Olsen et al., 2008; see Table 1). In addition to the mathematics and science tests, TIMSS also collected extensive information about home and school factors that influenced students’ learning in these subjects. The database contains student achievement scores in mathematics and science, as well as large-scale

Trends in mathematics and science performance in 18 countries 6
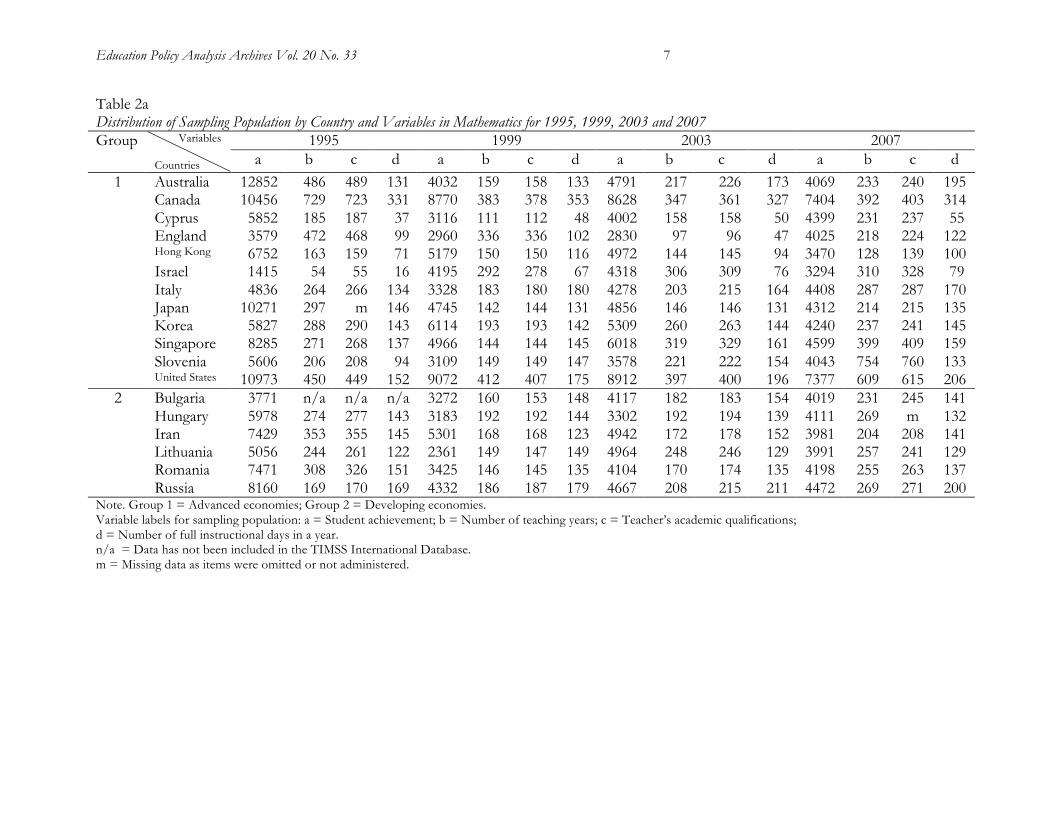
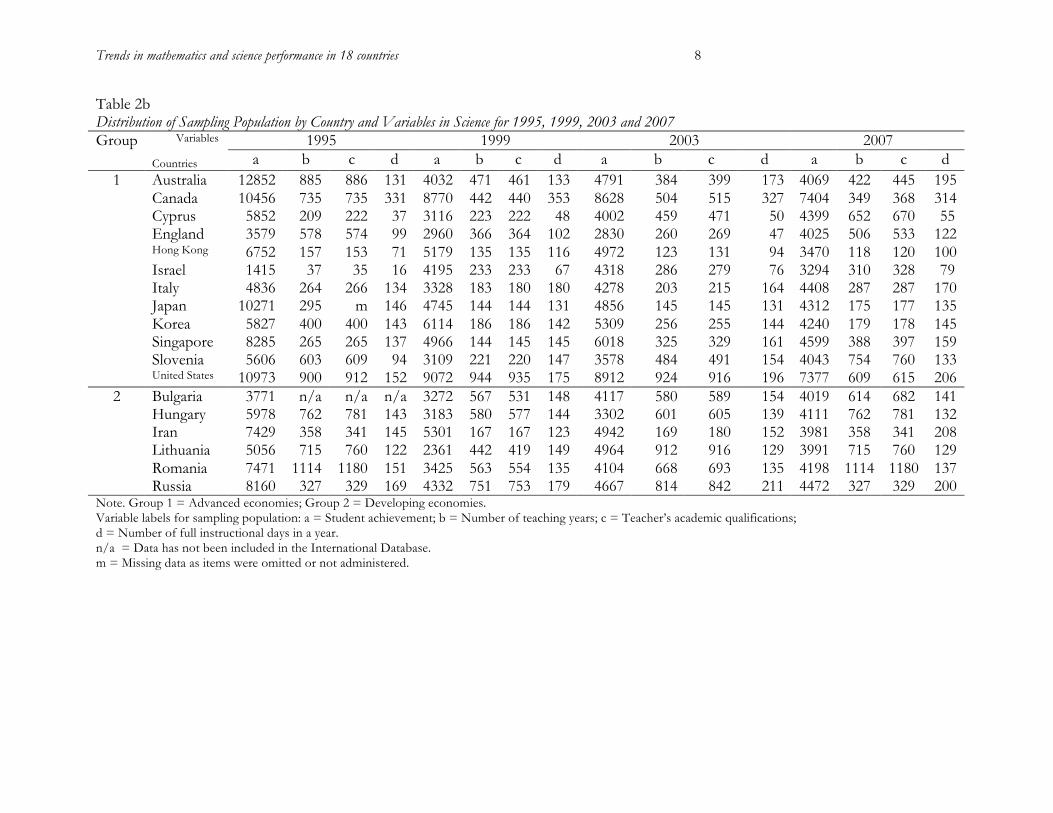
responses to background questionnaires from students, mathematics and science teachers, and school principals in the participating countries (Gonzalez & Miles, 2001; Olsen et al., 2008). Table 1 shows the number of items in eighth grade mathematics and science assessment across the four years. To ensure reliable measurement of trends over time, items that had been used in 1995 and 1999 were also included in the 2003 and 2007 assessments (Olsen et al., 2008). The data used in this study was aggregated by country as the measurement unit in the analyses. The sampling population included all the data available for the 18 countries for the four variables examined (student achievement, teaching experience, academic qualification, instructional days; see Tables 2a and 2b). In the 8th grade sampling population for Korea in TIMSS 1995 (Table 2a), for example, 5827 students participated in the mathematics assessments (variable a); 288 mathematics teachers indicated the number of years they had taught (variable b) and 290 mathematics teachers had academic qualifications (variable c). There was an average of 143 full instructional days in the school year (variable d). Table 1 Number of Participating Countries and Items in Mathematics and Science in Grade 8 for 1995, 1999, 2003 and 2007 Year Data Type
1995
1999 2003 2007
Countries 42 38 48 59 Mathematics 151 162 194 215 Science 135 146 189 214
Education Policy Analysis Archives Vol. 20 No. 33 7
Table 2a Distribution of Sampling Population by Country and Variables in Mathematics for 1995, 1999, 2003 and 2007
1995 1999 2003 2007 Group Variables Countries a b c d a b c d a b c d a b c d Australia 12852 486 489 131 4032 159 158 133 4791 217 226 173 4069 233 240 195 Canada 10456 729 723 331 8770 383 378 353 8628 347 361 327 7404 392 403 314 Cyprus 5852 185 187 37 3116 111 112 48 4002 158 158 50 4399 231 237 55 England 3579 472 468 99 2960 336 336 102 2830 97 96 47 4025 218 224 122 Hong Kong 6752 163 159 71 5179 150 150 116 4972 144 145 94 3470 128 139 100 Israel 1415 54 55 16 4195 292 278 67 4318 306 309 76 3294 310 328 79 Italy 4836 264 266 134 3328 183 180 180 4278 203 215 164 4408 287 287 170 Japan 10271 297 m 146 4745 142 144 131 4856 146 146 131 4312 214 215 135 Korea 5827 288 290 143 6114 193 193 142 5309 260 263 144 4240 237 241 145 Singapore 8285 271 268 137 4966 144 144 145 6018 319 329 161 4599 399 409 159 Slovenia 5606 206 208 94 3109 149 149 147 3578 221 222 154 4043 754 760 133
1
United States 10973 450 449 152 9072 412 407 175 8912 397 400 196 7377 609 615 206 Bulgaria 3771 n/a n/a n/a 3272 160 153 148 4117 182 183 154 4019 231 245 141 Hungary 5978 274 277 143 3183 192 192 144 3302 192 194 139 4111 269 m 132 Iran 7429 353 355 145 5301 168 168 123 4942 172 178 152 3981 204 208 141 Lithuania 5056 244 261 122 2361 149 147 149 4964 248 246 129 3991 257 241 129 Romania 7471 308 326 151 3425 146 145 135 4104 170 174 135 4198 255 263 137
2
Russia 8160 169 170 169 4332 186 187 179 4667 208 215 211 4472 269 271 200 Note. Group 1 = Advanced economies; Group 2 = Developing economies. Variable labels for sampling population: a = Student achievement; b = Number of teaching years; c = Teacher’s academic qualifications; d = Number of full instructional days in a year. n/a = Data has not been included in the TIMSS International Database. m = Missing data as items were omitted or not administered.
Trends in mathematics and science performance in 18 countries 8
Table 2b Distribution of Sampling Population by Country and Variables in Science for 1995, 1999, 2003 and 2007
1995 1999 2003 2007 Group Variables Countries a b c d a b c d a b c d a b c d Australia 12852 885 886 131 4032 471 461 133 4791 384 399 173 4069 422 445 195 Canada 10456 735 735 331 8770 442 440 353 8628 504 515 327 7404 349 368 314 Cyprus 5852 209 222 37 3116 223 222 48 4002 459 471 50 4399 652 670 55 England 3579 578 574 99 2960 366 364 102 2830 260 269 47 4025 506 533 122 Hong Kong 6752 157 153 71 5179 135 135 116 4972 123 131 94 3470 118 120 100 Israel 1415 37 35 16 4195 233 233 67 4318 286 279 76 3294 310 328 79 Italy 4836 264 266 134 3328 183 180 180 4278 203 215 164 4408 287 287 170 Japan 10271 295 m 146 4745 144 144 131 4856 145 145 131 4312 175 177 135 Korea 5827 400 400 143 6114 186 186 142 5309 256 255 144 4240 179 178 145 Singapore 8285 265 265 137 4966 144 145 145 6018 325 329 161 4599 388 397 159 Slovenia 5606 603 609 94 3109 221 220 147 3578 484 491 154 4043 754 760 133
1
United States 10973 900 912 152 9072 944 935 175 8912 924 916 196 7377 609 615 206 Bulgaria 3771 n/a n/a n/a 3272 567 531 148 4117 580 589 154 4019 614 682 141 Hungary 5978 762 781 143 3183 580 577 144 3302 601 605 139 4111 762 781 132 Iran 7429 358 341 145 5301 167 167 123 4942 169 180 152 3981 358 341 208 Lithuania 5056 715 760 122 2361 442 419 149 4964 912 916 129 3991 715 760 129 Romania 7471 1114 1180 151 3425 563 554 135 4104 668 693 135 4198 1114 1180 137
2
Russia 8160 327 329 169 4332 751 753 179 4667 814 842 211 4472 327 329 200 Note. Group 1 = Advanced economies; Group 2 = Developing economies. Variable labels for sampling population: a = Student achievement; b = Number of teaching years; c = Teacher’s academic qualifications; d = Number of full instructional days in a year. n/a = Data has not been included in the International Database. m = Missing data as items were omitted or not administered.

Education Policy Analysis Archives Vol. 20 No. 33 9
Hypotheses
There are two hypotheses in this study. The first hypothesis assumes there is a relationship between GDP per capita and mathematics and science achievement, with corresponding changes in the relationship between the two variables across time.
The second hypothesis posits that school factors – teaching experience, teachers’ academic qualification, and time spent on instruction – are predictors of student achievement in the two subject areas.
Variables
Dependent variable. The TIMSS International Database contains achievement data for students in mathematics and science and related background data for 1995, 1999, 2003 and 2007. As dependent variables, student achievement in mathematics and science are taken from the 18 countries across the years. Each subject has five sets of plausible values based on which analyses are replicated five times per subject in this study. Plausible values are derived from five imputed values per student response to account for the error inherent in the multiple imputation process (Martin et al., 2004).
Independent variables. The TIMSS International Database includes data for school and student level variables. Teacher quality and instructional time variables are pertinent to this study at the school level. The data used to indicate teacher quality are teaching experience and teachers’ academic qualification. For both subjects in 1999, teaching experience was expressed in terms of the number of years taught (open-ended numerical response) and academic qualification in terms of four categorical responses:
1 = Did not complete secondary school; 2 = Secondary school only; 3 = BA or equivalent; and 4 = MA/PhD
In some cases, the variable for teacher’s academic qualification expanded to six categories: 1=Did not complete ISCED 3; 2=Finished ISCED 3; 3=Finished ISCED 4; 4=Finished ISCED 5B; 5=Finished ISCED 5A, first degree; and 6=Finished ISCED 5A, second degree or higher.
ISCED denotes International Standard Classification of Education and the levels indicate the following (UNESCO, 1997): ISCED 3=Upper secondary education;
ISCED 4=Post-secondary non-tertiary education; ISCED 5A=Tertiary programs that are largely theoretically based and intended to provide sufficient qualifications for gaining entry into advanced research programs and professions with high skills requirements, last 3-4 years full-time (e.g. higher education); ISCED 5B=Tertiary programs that are shorter than 5A that focus on occupationally specific skills geared for entry into the labor market.
For the purpose of consistency across the years, the six categories were collapsed into 1, 2-4, 5 and 6 to correspond to the four categorical responses used in 1999.
Instructional time is measured in terms of the number of full instructional days in the school year.
Trends in mathematics and science performance in 18 countries 10
Analyses
Consistent with the first hypothesis, repeated measures was used to determine the relationship between GDP per capita and 8th grade mathematics and science achievement across the years. Repeated measures analysis provides information on the time trend of the dependent variable under different conditions, with the responses to individual conditions over time an important element of analysis (Kuehl, 1994). This study used a quasi-repeated measures design since the mathematics and science tests were cross-nationally administered to a cohort group of 8th grade students across the four years. As dependent variables, mathematics and science achievement were measured for all 18 countries that participated in TIMSS studies in 1995, 1999, 2003 and 2007. Hence, the five plausible scores for each subject were observed at each time point. The 18 countries were categorized into advanced and developing economies, with changes in both categories assessed over time. The two categories were derived from the classification of advanced and developing economies used by the IMF World Economic Outlook (IMF, October 2010): Bulgaria, Hungary, Iran, Lithuania, Romania and Russia are categorized as the six developing economies, while the remaining 12 are advanced economies.
For the second hypothesis, multiple regression was conducted to test the relationship between the school factors and student achievement. As the TIMSS 1995 data for Bulgaria was missing, a total of 17 countries were examined in the regression analysis for 1995. The regression model conveyed the level of significance of each variable on mathematics and science achievement across the two groups of countries over time.
Results
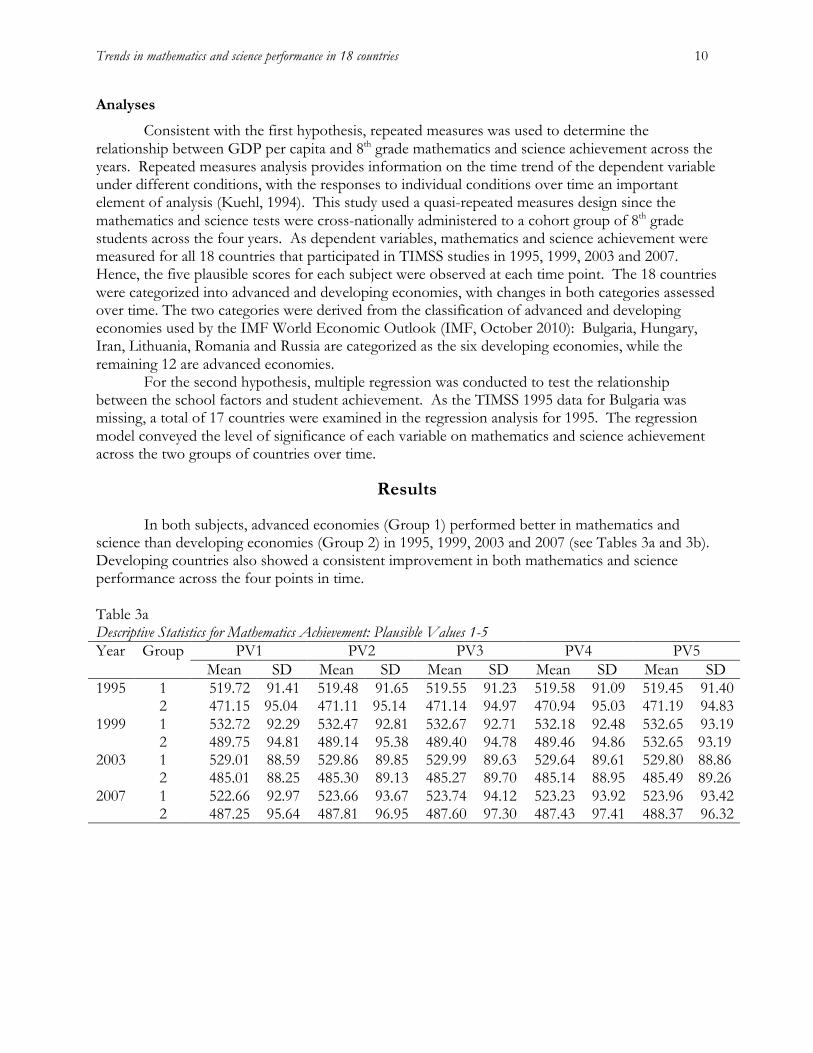
In both subjects, advanced economies (Group 1) performed better in mathematics and science than developing economies (Group 2) in 1995, 1999, 2003 and 2007 (see Tables 3a and 3b). Developing countries also showed a consistent improvement in both mathematics and science performance across the four points in time. Table 3a Descriptive Statistics for Mathematics Achievement: Plausible Values 1-5
PV1 PV2 PV3 PV4 PV5 Year Group Mean SD Mean SD Mean SD Mean SD Mean SD
1 519.72 91.41 519.48 91.65 519.55 91.23 519.58 91.09 519.45 91.40 1995 2 471.15 95.04 471.11 95.14 471.14 94.97 470.94 95.03 471.19 94.83 1 532.72 92.29 532.47 92.81 532.67 92.71 532.18 92.48 532.65 93.19 1999 2 489.75 94.81 489.14 95.38 489.40 94.78 489.46 94.86 532.65 93.19 1 529.01 88.59 529.86 89.85 529.99 89.63 529.64 89.61 529.80 88.86 2003 2 485.01 88.25 485.30 89.13 485.27 89.70 485.14 88.95 485.49 89.26 1 522.66 92.97 523.66 93.67 523.74 94.12 523.23 93.92 523.96 93.42 2007 2 487.25 95.64 487.81 96.95 487.60 97.30 487.43 97.41 488.37 96.32

Education Policy Analysis Archives Vol. 20 No. 33 11
Table 3b Descriptive Statistics for Science Achievement: Plausible Values 1-5
PV1 PV2 PV3 PV4 PV5 Year Group Mean SD Mean SD Mean SD Mean SD Mean SD
1 507.62 93.21 507.66 93.34 507.78 93.27 507.56 93.26 507.58 93.25 1995 2 477.65 95.19 477.43 94.98 477.49 95.13 477.55 95.03 477.13 95.36 1 524.34 91.81 523.43 92.05 523.17 91.16 523.27 91.92 523.35 91.70 1999 2 500.97 97.07 499.08 96.05 500.84 96.45 500.24 96.55 500.64 95.35 1 527.22 82.71 527.47 83.30 527.72 82.07 527.76 82.97 527.96 82.24 2003 2 496.71 84.99 496.95 85.41 497.47 84.23 496.80 85.51 497.62 84.72 1 520.40 88.13 520.92 87.50 520.58 87.45 520.23 88.32 520.85 87.81 2007 2 505.10 89.63 504.42 89.60 505.61 88.37 504.63 89.91 505.70 88.30
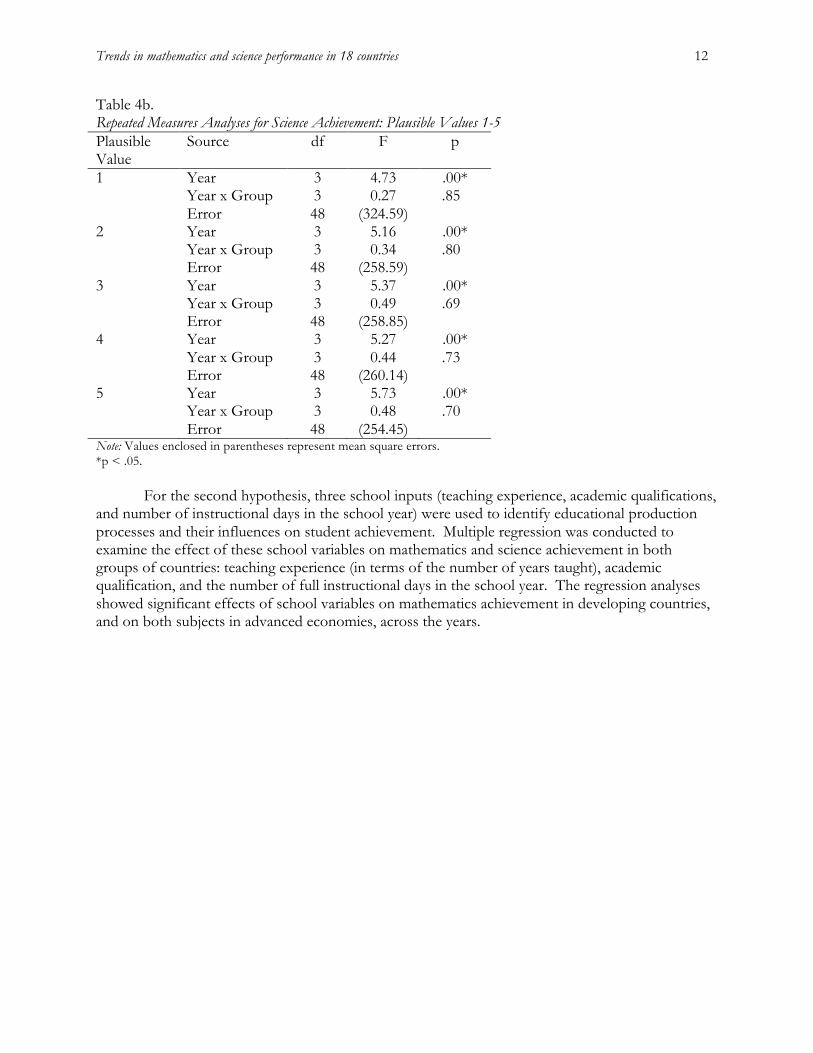
For the first hypothesis, repeated measures analysis indicated that there was considerable
growth in achievement within the two groups of countries from 1995 to 2007 even though the variation in the mean scores was small between the two groups. As shown in Tables 4a and 4b, the interaction effect was not statistically significant between GDP per capita and 8th grade mathematics and science achievement. However, achievement was significant across the years for all mathematics plausible scores, F(3, 88) = 3.96, 4.08, 3.93, 4.02 and 3.92, p < 0.05 (see Table 4a); and all science plausible scores, F(3, 88) = 4.73, 5.16, 5.37, 5.27 and 5.73, p < 0.05 (see Table 4b). Table 4a Repeated Measures Analyses for Mathematics Achievement: Plausible Values 1-5 Plausible Value
Source df F p
1 Year 3 3.96 .01* Year x Group 3 0.38 .77 Error 48 (170.90) 2 Year 3 4.08 .01* Year x Group 3 0.33 .80 Error 48 (173.66) 3 Year 3 3.93 .01* Year x Group 3 0.33 .80 Error 48 (176.50) 4 Year 3 4.02 .01* Year x Group 3 0.41 .74 Error 48 (171.72) 5 Year 3 3.92 .01* Year x Group 3 0.31 .82 Error 48 (174.35) Note: Values enclosed in parentheses represent mean square errors. *p < .05.
Trends in mathematics and science performance in 18 countries 12
Table 4b. Repeated Measures Analyses for Science Achievement: Plausible Values 1-5 Plausible Value
Source df F p
1 Year 3 4.73 .00* Year x Group 3 0.27 .85 Error 48 (324.59) 2 Year 3 5.16 .00* Year x Group 3 0.34 .80 Error 48 (258.59) 3 Year 3 5.37 .00* Year x Group 3 0.49 .69 Error 48 (258.85) 4 Year 3 5.27 .00* Year x Group 3 0.44 .73 Error 48 (260.14) 5 Year 3 5.73 .00* Year x Group 3 0.48 .70 Error 48 (254.45) Note: Values enclosed in parentheses represent mean square errors. *p < .05.
For the second hypothesis, three school inputs (teaching experience, academic qualifications, and number of instructional days in the school year) were used to identify educational production processes and their influences on student achievement. Multiple regression was conducted to examine the effect of these school variables on mathematics and science achievement in both groups of countries: teaching experience (in terms of the number of years taught), academic qualification, and the number of full instructional days in the school year. The regression analyses showed significant effects of school variables on mathematics achievement in developing countries, and on both subjects in advanced economies, across the years.

Education Policy Analysis Archives Vol. 20 No. 33 13
Table 5a Summary of Regression Analysis for Variables Predicting Mathematics Achievement for Group 1 (Developed Economies) from 1995 to 2007: Plausible Values 1-5
PV Variable B SE B β A -33.08 19.04 -.25 B -6.47 2.33 -.43*
1
C 1.01 0.44 .33* A -33.49 19.24 -.25 B -6.57 2.36 -.43*
2
C 1.03 0.45 .34* A -32.78 19.20 -.25 B -6.46 2.35 -.42*
3
C 1.01 0.45 .33* A -32.98 19.14 -.25 B -6.47 2.34 -.42*
4
C 1.02 0.45 .34* A -32.53 19.19 -.25 B -6.42 2.35 -.42*
5
C 1.02 0.45 .33* Note. Variable labels: A = Teacher’s academic qualifications; B = Number of years taught; C = Number of full instructional days. R² = .14 for all Plausible Values 1 to 5. *p < .05. Table 5b Summary of Regression Analysis for Variables Predicting Mathematics Achievement for Group 2 (Developing Economies) from 1995 to 2007: Plausible Values 1-5
PV Variable B SE B β A 8.97 12.52 .15 B 7.40 2.76 .68*
1
C 0.18 0.78 .06 A 8.46 12.58 .14 B 7.62 2.77 .69*
2
C 0.21 0.78 .07 A 8.34 12.68 .13 B 7.60 2.80 .68*
3
C 0.18 0.79 .06 A 8.57 12.62 .14 B 7.62 2.78 .69*
4
C 0.20 0.79 .06 A 8.78 12.51 .14 B 7.50 2.76 .68*
5
C 0.18 0.78 .06 Note. Variable labels: A = Teacher’s academic qualifications; B = Number of years taught; C = Number of full instructional days. R² = .46, .47, .47, .47, .47 respectively for Plausible Values 1 to 5. *p < .05.
Trends in mathematics and science performance in 18 countries 14
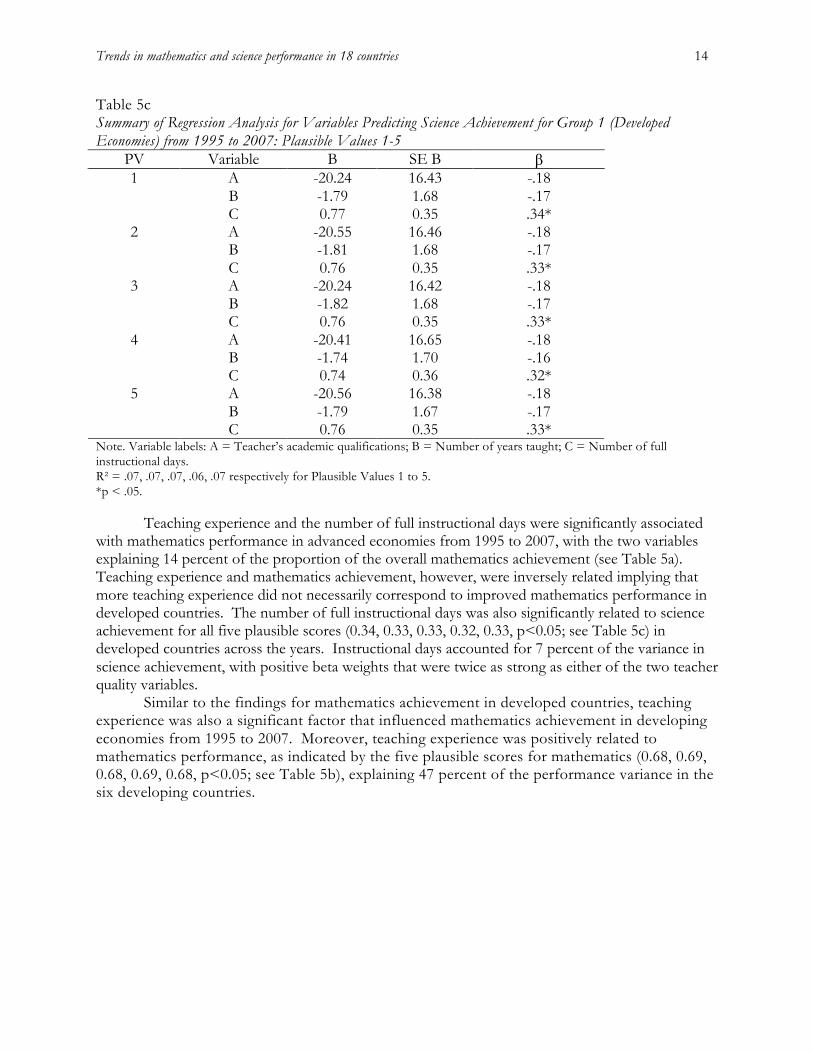
Table 5c Summary of Regression Analysis for Variables Predicting Science Achievement for Group 1 (Developed Economies) from 1995 to 2007: Plausible Values 1-5
PV Variable B SE B β A -20.24 16.43 -.18 B -1.79 1.68 -.17
1
C 0.77 0.35 .34* A -20.55 16.46 -.18 B -1.81 1.68 -.17
2
C 0.76 0.35 .33* A -20.24 16.42 -.18 B -1.82 1.68 -.17
3
C 0.76 0.35 .33* A -20.41 16.65 -.18 B -1.74 1.70 -.16
4
C 0.74 0.36 .32* A -20.56 16.38 -.18 B -1.79 1.67 -.17
5
C 0.76 0.35 .33* Note. Variable labels: A = Teacher’s academic qualifications; B = Number of years taught; C = Number of full instructional days. R² = .07, .07, .07, .06, .07 respectively for Plausible Values 1 to 5. *p < .05.
Teaching experience and the number of full instructional days were significantly associated with mathematics performance in advanced economies from 1995 to 2007, with the two variables explaining 14 percent of the proportion of the overall mathematics achievement (see Table 5a). Teaching experience and mathematics achievement, however, were inversely related implying that more teaching experience did not necessarily correspond to improved mathematics performance in developed countries. The number of full instructional days was also significantly related to science achievement for all five plausible scores (0.34, 0.33, 0.33, 0.32, 0.33, p<0.05; see Table 5c) in developed countries across the years. Instructional days accounted for 7 percent of the variance in science achievement, with positive beta weights that were twice as strong as either of the two teacher quality variables.
Similar to the findings for mathematics achievement in developed countries, teaching experience was also a significant factor that influenced mathematics achievement in developing economies from 1995 to 2007. Moreover, teaching experience was positively related to mathematics performance, as indicated by the five plausible scores for mathematics (0.68, 0.69, 0.68, 0.69, 0.68, p<0.05; see Table 5b), explaining 47 percent of the performance variance in the six developing countries.
Education Policy Analysis Archives Vol. 20 No. 33 15
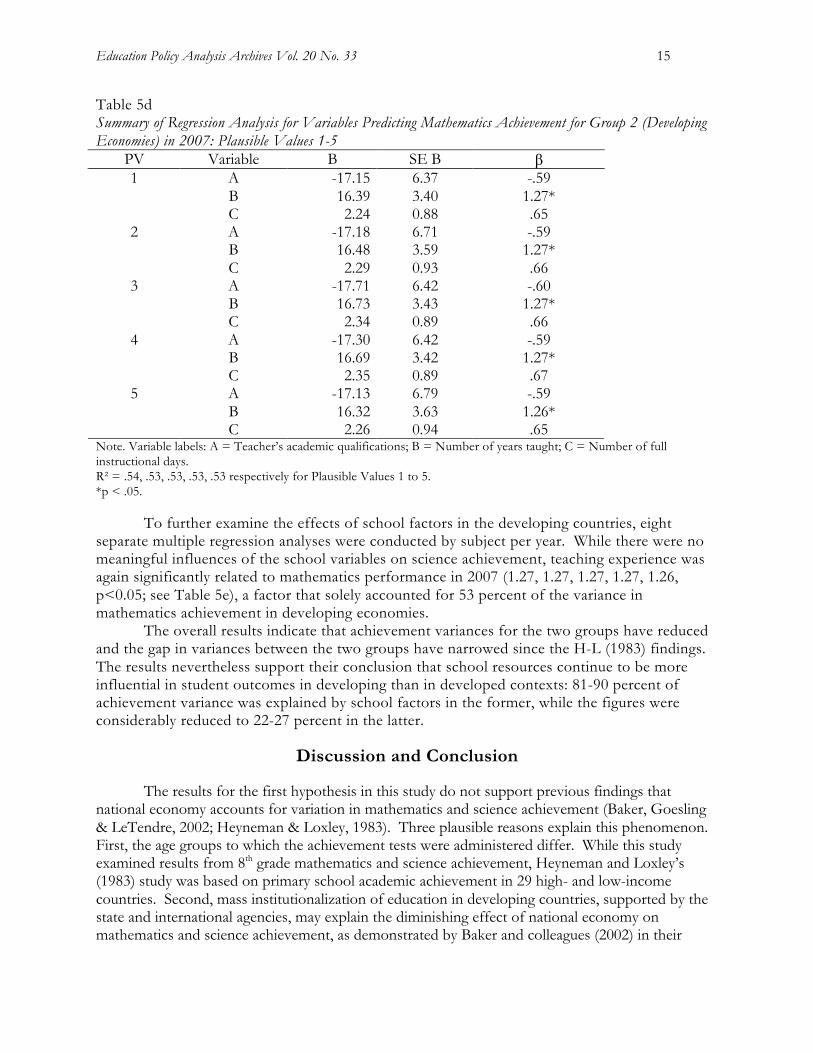
Table 5d Summary of Regression Analysis for Variables Predicting Mathematics Achievement for Group 2 (Developing Economies) in 2007: Plausible Values 1-5
PV Variable B SE B β A -17.15 6.37 -.59 B 16.39 3.40 1.27*
1
C 2.24 0.88 .65 A -17.18 6.71 -.59 B 16.48 3.59 1.27*
2
C 2.29 0.93 .66 A -17.71 6.42 -.60 B 16.73 3.43 1.27*
3
C 2.34 0.89 .66 A -17.30 6.42 -.59 B 16.69 3.42 1.27*
4
C 2.35 0.89 .67 A -17.13 6.79 -.59 B 16.32 3.63 1.26*
5
C 2.26 0.94 .65 Note. Variable labels: A = Teacher’s academic qualifications; B = Number of years taught; C = Number of full instructional days. R² = .54, .53, .53, .53, .53 respectively for Plausible Values 1 to 5. *p < .05.
To further examine the effects of school factors in the developing countries, eight separate multiple regression analyses were conducted by subject per year. While there were no meaningful influences of the school variables on science achievement, teaching experience was again significantly related to mathematics performance in 2007 (1.27, 1.27, 1.27, 1.27, 1.26, p<0.05; see Table 5e), a factor that solely accounted for 53 percent of the variance in mathematics achievement in developing economies.
The overall results indicate that achievement variances for the two groups have reduced and the gap in variances between the two groups have narrowed since the H-L (1983) findings. The results nevertheless support their conclusion that school resources continue to be more influential in student outcomes in developing than in developed contexts: 81-90 percent of achievement variance was explained by school factors in the former, while the figures were considerably reduced to 22-27 percent in the latter.
Discussion and Conclusion
The results for the first hypothesis in this study do not support previous findings that national economy accounts for variation in mathematics and science achievement (Baker, Goesling & LeTendre, 2002; Heyneman & Loxley, 1983). Three plausible reasons explain this phenomenon. First, the age groups to which the achievement tests were administered differ. While this study examined results from 8th grade mathematics and science achievement, Heyneman and Loxley’s (1983) study was based on primary school academic achievement in 29 high- and low-income countries. Second, mass institutionalization of education in developing countries, supported by the state and international agencies, may explain the diminishing effect of national economy on mathematics and science achievement, as demonstrated by Baker and colleagues (2002) in their

Trends in mathematics and science performance in 18 countries 16
follow-up analysis of Heyneman and Loxley’s (1983) study. Third, TIMSS does not cover a wide range of economies as the tests were administered to countries that had sufficient available resources to participate in TIMSS. This eliminated countries at the lowest end of the economic spectrum while largely including those from the upper-middle- and high-income economies.
The mean group differences in student achievement indicate that developed countries performed better than developing countries overall, although interesting observations can be made at the country level. Advanced economies like the U.S. and England (mean plausible scores 474, 495, 504, 506 for the U.S. and 484, 500, 507, 515 for England for 1995, 1999, 2003 and 2007 respectively) consistently scored lower in mathematics than developing nations such as Hungary and Russia (mean plausible scores 513, 537, 532, 523 for Hungary and 506, 528, 510, 520 for Russia for 1995, 1999, 2003 and 2007 respectively) across time. Although the two cases from each group are anomalous to the overall group findings, it is evident that Hungary and Russia are cross-nationally better in 8th grade mathematics and science than the U.S. and England, with the pattern persistent across the four years. This can be attributed to the traditionally heavy emphasis placed on mathematics and science education in the former communist states. Conceptions of teaching mathematics were also substantially different in Bulgaria as compared to the conventional pedagogical beliefs and practices found in England (Andrews & Hatch, 2000).
The results for the second hypothesis examining the effects of school variables validate previous research that school factors still exert significant effects on variance in student achievement (Hanushek, 2006). In this study, teaching experience was the strongest predictor of mathematics achievement in developing countries across all years (Tables 5b). This is consistent with the H-L findings in which the impact of teaching experience on student achievement was proportionately greater for developing countries than for developed countries. Teaching experience remained the strongest predictor of mathematics achievement for developing economies in 2007 (Table 5e) explaining slightly more than the achievement variance for all years combined. One possible explanation for the predominance of teaching experience as a predictor of student performance is that at the primary and lower secondary levels, teachers gain greater competence over the years in the subject matter and teaching skills, which contribute to better teaching outcomes as evident in student achievement (Rivkin, Hanushek, & Kain, 2005). In addition, mathematics is a cumulative subject in which the effects of teacher’s prior content knowledge on student performance becomes stronger at the advanced levels (Whitehurst, 2002).
The number of full instructional days in a year was significantly related to mathematics and science achievement in developed countries across the years (Tables 5a and 5c). While this concurs with studies that found quantity of instructional time to be a common indicator to assess student achievement (Millot & Lane, 2002; Benavot & Gad, 2004), the strength of the association between the two variables was low indicating that instructional time is a weak predictor of student performance. A plausible explanation may be that the quality of instruction matters more than the quantity of instructional hours, and that time on task is more effective in enhancing student outcomes. Research that studied the percentage of instructional time utilized in various countries found that the actual number of days engaged in learning was considerably lower than the number of days in the school year (Abadzi, 2007).
Teaching experience, in contrast, was negatively associated with mathematics performance in the same group of advanced economies across the four time points. Research on mathematics teaching in three developed countries – U.S., Germany and Japan – has shown the positive effects of teaching experience on student performance when a system of research-and-development has been established within the schools. For example, Japanese mathematics teachers reported that their individual lessons improved gradually as they participated in
Education Policy Analysis Archives Vol. 20 No. 33 17
developing and sharing knowledge based on their own teaching practices (Stigler & Hiebert, 1999).
This study confirms that school resources continue to play an influential role on mathematics and science achievement in both advanced and developing economies. In view of the findings, two policy implications are made. First, teaching experience was a consistent and strong predictor of student performance in mathematics over time in developing economies, which implies that governments in these countries should not only provide teacher training in the subject – whether in the form or pre-service or on-the-job training – but also ensure that the trained teachers stay on in the school system through incentives and continuous professional development. These measures can prevent the attrition rate of teachers that commonly occurs in their first years of teaching. Second, the number of full instructional days was a positive and significant predictor of mathematics and science achievement over time in developed economies. The association, however, was weak implying that the amount of instructional time allocated in the curriculum may not necessarily be critical to achievement. Instead, and more importantly, the effective use of time spent on learning tasks may be a more accurate indicator of student performance. Educational policymakers can, therefore, consider strategies to reduce the gap between the intended and actual time spent on learning tasks in the curriculum to maximize learning outcomes. A few concrete measures may be to train teachers in effective mathematics and science instructional techniques; and to increase teacher accountability through systematic teacher evaluations and regular meetings in which teaching practices are developed and shared during the school year.
References
Abadzi, H. (2007). Instructional time loss and local-level governance. Prospects, 37(1), 3-16. Andrews, P., & Hatch, G. (2000). A comparison of Hungarian and English teachers’ conceptions of
mathematics and its teaching. Educational Studies in Mathematics, 43, 31-64. Arnove, R.F. (2007). Introduction: Reframing comparative education. In R.F. Arnove & C.A. Torres
(Eds.), Comparative education: The dialectic of the global and the local (pp.1-20) (3rd ed.). Lanham, MD: Rowman & Littlefield Publishers.
Baker, D.P., Goesling, B., & LeTendre, G.K. (2002). Socioeconomic status, school quality, and national economic development: A cross-national analysis of the Heyneman-Loxley effect on mathematics and science achievement. Comparative Education Review, 46(3), 291-312.
Baker, D.P., R. Fabrega, C. Galindo, & J. Mishook. (2004a). Instructional time and national achievement: Cross-national evidence. Prospects, 34(3), 311-334.
Baker, D.P., Riegle-Crumb, C. Wiseman, A.W., & LeTendre, G.K. (2004b). Shifting gender effects: Opportunity structures, mass education, and cross-national achievement in mathematics. In D.P. Baker, & A.W. Wiseman (Eds.), International perspectives on education and society, v.10: Gender, equality and education from international and comparative perspectives (pp. 395-422). Bingley, UK: Emerald Group Publishing.
Beaton, A. E., Martin, M.O., Mullis, I.V.S., Gonzalez, E.J., Smith, T.A., & Kelly, D.L. (1996). Science achievement in the middle school years: IEA’s Third International Mathematics and Science Study (TIMSS). Chestnut Hill, MA: Boston College.
Benavot, A. (2004). A global study of intended instructional time and official school curricula, 1980-2000. Background paper commissioned by the International Bureau of Education for the UNESCO- EFA Global Monitoring Report (2005): The Quality Imperative. Geneva: International Bureau of Education.

Trends in mathematics and science performance in 18 countries 18
Benavot, A., & Gad. L. (2004). Actual instructional time in African primary schools: Factors that reduce school quality in developing countries. Prospects, 34(3), 291-310.
Buchmann, C., & Hannum. E. (2001). Education and stratification in developing countries: A review of theories and research. Annual Review of Sociology, 27, 77-102.
Chudgar, A., & Luschei, T.F. (2009). National income, income inequality, and the importance of schools: A hierarchical cross-national comparison. American Educational Research Journal, 46(3), 626-658.
Cogan, L.S., & Schmidt, W.H. (2002). “Culture shock” – Eighth-grade mathematics from an international perspective. Educational Research and Evaluation, 8(1), 13-39.
Coleman, J.S., Campell, E.Q., Hobson, C.J., McPartland, J., Mood, A.M., Weinfeld, F.D., & York, R.L. (1966). Equality of educational opportunity. Washington, DC: U.S. Government Printing Office.
Darling-Hammond, L. (2000). Teacher quality and student achievement: A review of state policy evidence. Education Policy Analysis Archives, 8(1). Retrieved February 5, 2012, from http://epaa.asu.edu/ojs/article/view/392.
Darling-Hammond, L., & Sykes, G. (2003). Meeting the “highly qualified” teacher challenge. Teacher Education and Practice, 16(4), 331-354.
Fuller, B. (1987). What school factors raise achievement in the Third World? Review of Educational Research, 57(3), 255-292.
Frederick, W.C., & Walberg, H.J. (1980). Learning as a function of time. Journal of Educational Research, 73, 183-194.
Gonzalez, E.J. (1997). Reporting student achievement in mathematics and science. In M.O. Martin, & D.L. Kelly (Ed.), Third International Mathematics and Science Study technical report, Volume II: Implementation and analysis -- Primary and middle school years (pp. 147-174). Chestnut Hill, MA: Boston College.
Gonzalez, E.J., & Miles, J.A. (Ed.) (2001). TIMSS 1999 User guide for the international database: IEA’s repeat of the Third International Mathematics and Science Study at the eighth grade (Chapter 6). Chestnut Hill, MA: Boston College.
Hanushek, E.A. (1995). Education production functions. In M. Carnoy (Ed.), International Encyclopedia of Economics of Education (pp. 277-282). New York: Pergamon.
Hanushek, E.A. (2006). Teacher compensation. In P.E. Peterson (Ed.), Reforming Education in Florida (pp. 149-163). Palo Alto: Hoover Institution Press.
Hanushek, E.A., & Kimko, D.D. (2000). Schooling, labor-force quality, and the growth of nations. American Economic Review, 90(5), 1184-1208.
Hanushek, E.A., & Luque, J.A. (2003). Efficiency and equity in schools around the world Economics of Education Review, 20(5), 481-502.
Heyneman, S.P., & Loxley, W.A. (1983). The effect of primary-school quality on academic achievement across twenty-nine high- and low-income countries. American Journal of Sociology, 88(6), 1162-1194.
Hodas, S. (1993). Is water an input to a fish? Problems with the production-function model in education. Education Policy and Analysis Archives, 1(12), 1-7.
Inkeles, A. (1979). National differences in scholastic performance. Comparative Education Review, 23, 386-407.
International Monetary Fund [IMF] (2010). IMF World Economic Outlook. Retrieved January 10, 2012, from http://www.imf.org/external/pubs/ft/weo/2010/02/weodata/index.aspx.
Kamens, D.H., & Benavot, A. (1991). Elite knowledge for the masses: The origins and spread of mathematics and science education in national curricula. American Journal of Education, 99, 137-180.
Education Policy Analysis Archives Vol. 20 No. 33 19
Kamens, D.H., Meyer, J.W., & Benavot, A. (1996). Worldwide patterns in academic secondary education curricula. Comparative Education Review, 40(2), 116-138.
Kuehl, R.O. (1994). Statistical principles of research design and analysis. Belmont: Duxbury Press. Lewin, K.M. (1993). Education and development: The issues and the evidence. Education Research Serial No.
6, London: Overseas Development Administration. Marks, G.N., Cresswell, J., & Ainley, J. (2006). Examining socioeconomic inequalities in student
achievement: The role of home and school factors. Educational Research and Evaluation, 12(2), 105-128.
Martin, M.O. (Ed.) (2003). TIMSS 2003 User guide for the international database. Chestnut Hill, MA: Boston College.
Martin, M.O., Mullis, I.V.S., & Chrostowski, S.J. (2004). TIMSS 2003 Technical report. Chestnut Hill, MA: Boston College.
Millot, B., & Lane, J. (2002). The efficient use of time in education. Education Economics, 10(2), 209-228.
Monk, D.H. (1992). Education productivity research: An update and assessment of its role in education finance reform. Educational Evaluation and Policy Analysis, 14(4), 307-322.
Olson, J.F., Martin, M.O., & Mullis, I.V.S. (Eds.) (2008). TIMSS 2003 Technical report. Chestnut Hill, MA: Boston College.
Oneri, H., & Goll, P. (2008). Factors associated in differential school performance in the Gucha district of Kenya. Research in Education, 80, 15-25.
Papanastasiou, C. (2000). Internal and external factors affecting achievement in mathematics: Some findings from TIMSS. Studies in Educational Evaluation, 26, 1-7.
Ramirez, F.O., Luo, X., Schofer, E., & Meyer, J. (2006). Student achievement and national economic growth. American Journal of Education, 113, 1-29.
Rivkin, S., Hanushek, E., & Kain, J. (2005). Teachers, schools and academic achievement. Econometrica, 73, 417-458.
Rockoff, J.E. (2005). The impact of individual teachers on student achievement: Evidence from panel data. Teacher Quality, 94(2), 247-252.
Schofer, E., Ramirez, F.O., & Meyer, J. (2000). The effects of science on national economic development, 1970 to 1990. American Sociological Review, 65, 866-887.
Stigler, J.W., & Hiebert, J. (1999). The teaching gap: Best ideas from the world’s teachers for improving education in the classroom. New York, NY: The Free Press.
UNESCO (1997). International Standard Classification of Education, ISCED 1997. Retrieved Januray 10, 2011, from http://www.unesco.org/education/information/nfsunesco/doc/isced_1997.htm.
UNESCO (2004). EFA Global Monitoring Report 2005, Education for all: The quality imperative. Paris: UNESCO.
Vlaardingerbroek, B., & Taylor, T.G.N. (2003). Teacher education variables as correlatesof primary science ratings in thirteen TIMSS systems. International Journal of Educational Development, 23, 429-438.
Whitehurst, G.J. (2002, June). Improving teacher quality. Spectrum: The Journal of State Government, 75(3), 12-15.
Trends in mathematics and science performance in 18 countries 20
About the Author
Hee Kyung Hong Hong Kong Institute of Education Email: [email protected] Hee Kyung Hong is an assistant professor in the Department of Education Policy and Leadership at the Hong Kong Institute of Education. Her research interests include achievement studies, and school finance and policy.
education policy analysis archives Volume 20 Number 33 October 23rd, 2012 ISSN 1068-2341
Readers are free to copy, display, and distribute this article, as long as the work is attributed to the author(s) and Education Policy Analysis Archives, it is distributed for non-commercial purposes only, and no alteration or transformation is made in the work. More details of this Creative Commons license are available at http://creativecommons.org/licenses/by-nc-sa/3.0/. All other uses must be approved by the author(s) or EPAA. EPAA is published by the Mary Lou Fulton Institute and Graduate School of Education at Arizona State University Articles are indexed in CIRC (Clasificación Integrada de Revistas Científicas, Spain), DIALNET (Spain), Directory of Open Access Journals, EBSCO Education Research Complete, ERIC, Education Full Text (H.W. Wilson), QUALIS A2 (Brazil), SCImago Journal Rank; SCOPUS, SOCOLAR (China). Please contribute commentaries at http://epaa.info/wordpress/ and send errata notes to Gustavo E. Fischman [email protected] Join EPAA’s Facebook community at https://www.facebook.com/EPAAAAPE and Twitter feed @epaa_aape.

Education Policy Analysis Archives Vol. 20 No. 33 21
education policy analysis archives editorial board
Editor Gustavo E. Fischman (Arizona State University) Associate Editors: David R. Garcia (Arizona State University), Stephen Lawton (Arizona State University)
Rick Mintrop, (University of California, Berkeley) Jeanne M. Powers (Arizona State University) Jessica Allen University of Colorado, Boulder Christopher Lubienski University of Illinois, Urbana-
Champaign Gary Anderson New York University Sarah Lubienski University of Illinois, Urbana-
Champaign Michael W. Apple University of Wisconsin, Madison Samuel R. Lucas University of California, Berkeley Angela Arzubiaga Arizona State University Maria Martinez-Coslo University of Texas, Arlington David C. Berliner Arizona State University William Mathis University of Colorado, Boulder Robert Bickel Marshall University Tristan McCowan Institute of Education, London Henry Braun Boston College Heinrich Mintrop University of California, Berkeley Eric Camburn University of Wisconsin, Madison Michele S. Moses University of Colorado, Boulder Wendy C. Chi* University of Colorado, Boulder Julianne Moss University of Melbourne Casey Cobb University of Connecticut Sharon Nichols University of Texas, San Antonio Arnold Danzig Arizona State University Noga O'Connor University of Iowa Antonia Darder University of Illinois, Urbana-
Champaign João Paraskveva University of Massachusetts,
Dartmouth Linda Darling-Hammond Stanford University Laurence Parker University of Illinois, Urbana-
Champaign Chad d'Entremont Strategies for Children Susan L. Robertson Bristol University
John Diamond Harvard University John Rogers University of California, Los Angeles Tara Donahue Learning Point Associates A. G. Rud Purdue University Sherman Dorn University of South Florida Felicia C. Sanders The Pennsylvania State University Christopher Joseph Frey Bowling Green State
University Janelle Scott University of California, Berkeley
Melissa Lynn Freeman* Adams State College Kimberly Scott Arizona State University Amy Garrett Dikkers University of Minnesota Dorothy Shipps Baruch College/CUNY Gene V Glass Arizona State University Maria Teresa Tatto Michigan State University Ronald Glass University of California, Santa Cruz Larisa Warhol University of Connecticut Harvey Goldstein Bristol University Cally Waite Social Science Research Council Jacob P. K. Gross Indiana University John Weathers University of Colorado, Colorado
Springs Eric M. Haas WestEd Kevin Welner University of Colorado, Boulder Kimberly Joy Howard* University of Southern
California Ed Wiley University of Colorado, Boulder
Aimee Howley Ohio University Terrence G. Wiley Arizona State University Craig Howley Ohio University John Willinsky Stanford University Steve Klees University of Maryland Kyo Yamashiro University of California, Los Angeles
Jaekyung Lee SUNY Buffalo * Members of the New Scholars Board

Trends in mathematics and science performance in 18 countries 22
archivos analíticos de políticas educativas consejo editorial
Editor: Gustavo E. Fischman (Arizona State University) Editores. Asociados Alejandro Canales (UNAM) y Jesús Romero Morante (Universidad de Cantabria)
Armando Alcántara Santuario Instituto de
Investigaciones sobre la Universidad y la Educación, UNAM México
Fanni Muñoz Pontificia Universidad Católica de Perú
Claudio Almonacid Universidad Metropolitana de Ciencias de la Educación, Chile
Imanol Ordorika Instituto de Investigaciones Economicas – UNAM, México
Pilar Arnaiz Sánchez Universidad de Murcia, España Maria Cristina Parra Sandoval Universidad de Zulia, Venezuela
Xavier Besalú Costa Universitat de Girona, España Miguel A. Pereyra Universidad de Granada, España Jose Joaquin Brunner Universidad Diego Portales,
Chile Monica Pini Universidad Nacional de San Martín,
Argentina Damián Canales Sánchez Instituto Nacional para la
Evaluación de la Educación, México Paula Razquin UNESCO, Francia
María Caridad García Universidad Católica del Norte, Chile
Ignacio Rivas Flores Universidad de Málaga, España
Raimundo Cuesta Fernández IES Fray Luis de León, España
Daniel Schugurensky Universidad de Toronto-Ontario Institute of Studies in Education, Canadá
Marco Antonio Delgado Fuentes Universidad Iberoamericana, México
Orlando Pulido Chaves Universidad Pedagógica Nacional, Colombia
Inés Dussel FLACSO, Argentina José Gregorio Rodríguez Universidad Nacional de Colombia
Rafael Feito Alonso Universidad Complutense de Madrid, España
Miriam Rodríguez Vargas Universidad Autónoma de Tamaulipas, México
Pedro Flores Crespo Universidad Iberoamericana, México
Mario Rueda Beltrán Instituto de Investigaciones sobre la Universidad y la Educación, UNAM México
Verónica García Martínez Universidad Juárez Autónoma de Tabasco, México
José Luis San Fabián Maroto Universidad de Oviedo, España
Francisco F. García Pérez Universidad de Sevilla, España
Yengny Marisol Silva Laya Universidad Iberoamericana, México
Edna Luna Serrano Universidad Autónoma de Baja California, México
Aida Terrón Bañuelos Universidad de Oviedo, España
Alma Maldonado Departamento de Investigaciones Educativas, Centro de Investigación y de Estudios Avanzados, México
Jurjo Torres Santomé Universidad de la Coruña, España
Alejandro Márquez Jiménez Instituto de Investigaciones sobre la Universidad y la Educación, UNAM México
Antoni Verger Planells University of Amsterdam, Holanda
José Felipe Martínez Fernández University of California Los Angeles, USA
Mario Yapu Universidad Para la Investigación Estratégica, Bolivia

Education Policy Analysis Archives Vol. 20 No. 33 23
arquivos analíticos de políticas educativas conselho editorial
Editor: Gustavo E. Fischman (Arizona State University) Editores Associados: Rosa Maria Bueno Fisher e Luis A. Gandin
(Universidade Federal do Rio Grande do Sul) Dalila Andrade de Oliveira Universidade Federal de
Minas Gerais, Brasil Jefferson Mainardes Universidade Estadual de Ponta
Grossa, Brasil Paulo Carrano Universidade Federal Fluminense, Brasil Luciano Mendes de Faria Filho Universidade Federal
de Minas Gerais, Brasil Alicia Maria Catalano de Bonamino Pontificia
Universidade Católica-Rio, Brasil Lia Raquel Moreira Oliveira Universidade do Minho,
Portugal Fabiana de Amorim Marcello Universidade Luterana
do Brasil, Canoas, Brasil Belmira Oliveira Bueno Universidade de São Paulo,
Brasil Alexandre Fernandez Vaz Universidade Federal de
Santa Catarina, Brasil António Teodoro Universidade Lusófona, Portugal
Gaudêncio Frigotto Universidade do Estado do Rio de Janeiro, Brasil
Pia L. Wong California State University Sacramento, U.S.A
Alfredo M Gomes Universidade Federal de Pernambuco, Brasil
Sandra Regina Sales Universidade Federal Rural do Rio de Janeiro, Brasil
Petronilha Beatriz Gonçalves e Silva Universidade Federal de São Carlos, Brasil
Elba Siqueira Sá Barreto Fundação Carlos Chagas, Brasil
Nadja Herman Pontificia Universidade Católica –Rio Grande do Sul, Brasil
Manuela Terrasêca Universidade do Porto, Portugal
José Machado Pais Instituto de Ciências Sociais da Universidade de Lisboa, Portugal
Robert Verhine Universidade Federal da Bahia, Brasil
Wenceslao Machado de Oliveira Jr. Universidade Estadual de Campinas, Brasil
Antônio A. S. Zuin Universidade Federal de São Carlos, Brasil