Embed Size (px)
Citation preview
EPA Pretreatment 101CWEA P3S Conference
February 3, 2015
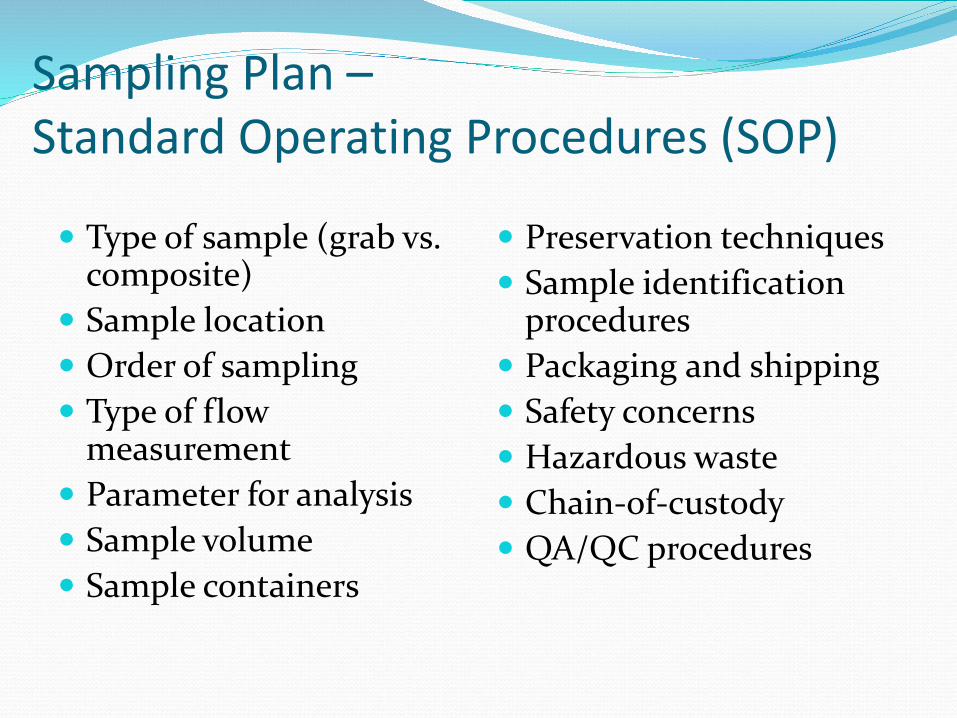
Sampling Plan –Standard Operating Procedures (SOP)
Type of sample (grab vs. composite)
Sample location Order of sampling Type of flow
measurement Parameter for analysis Sample volume Sample containers
Preservation techniques Sample identification
procedures Packaging and shipping Safety concerns Hazardous waste Chain-of-custody QA/QC procedures
Overlooked Items Field Log Book
pH meter calibration & documentation
Other measuring equipment? Conductivity meter Thermometers
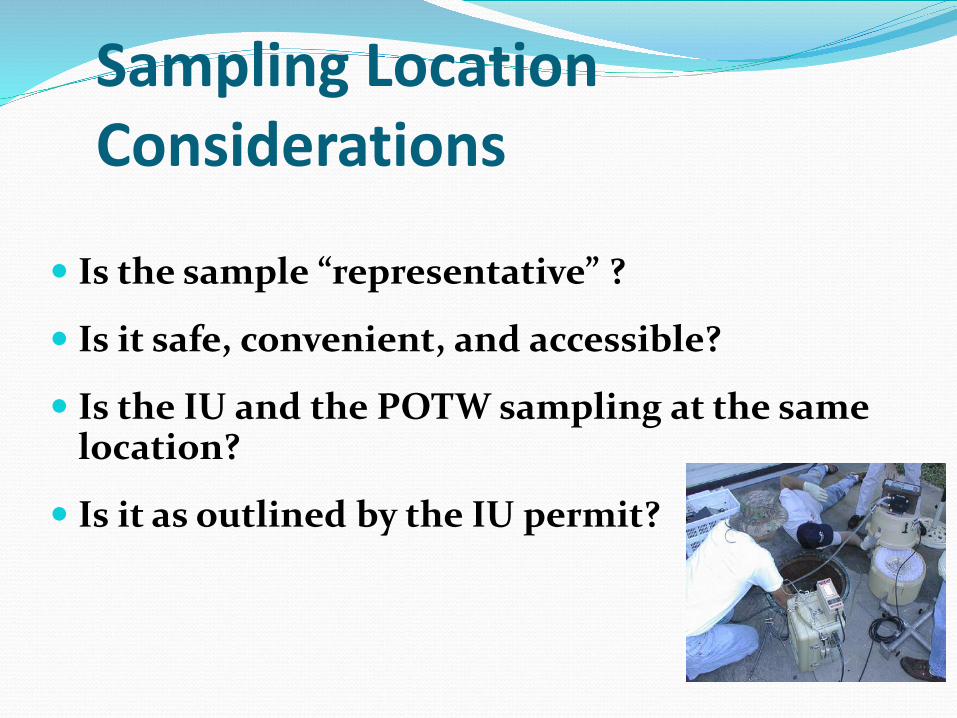
Sampling Location Considerations
Is the sample “representative” ?
Is it safe, convenient, and accessible?
Is the IU and the POTW sampling at the same location?
Is it as outlined by the IU permit?
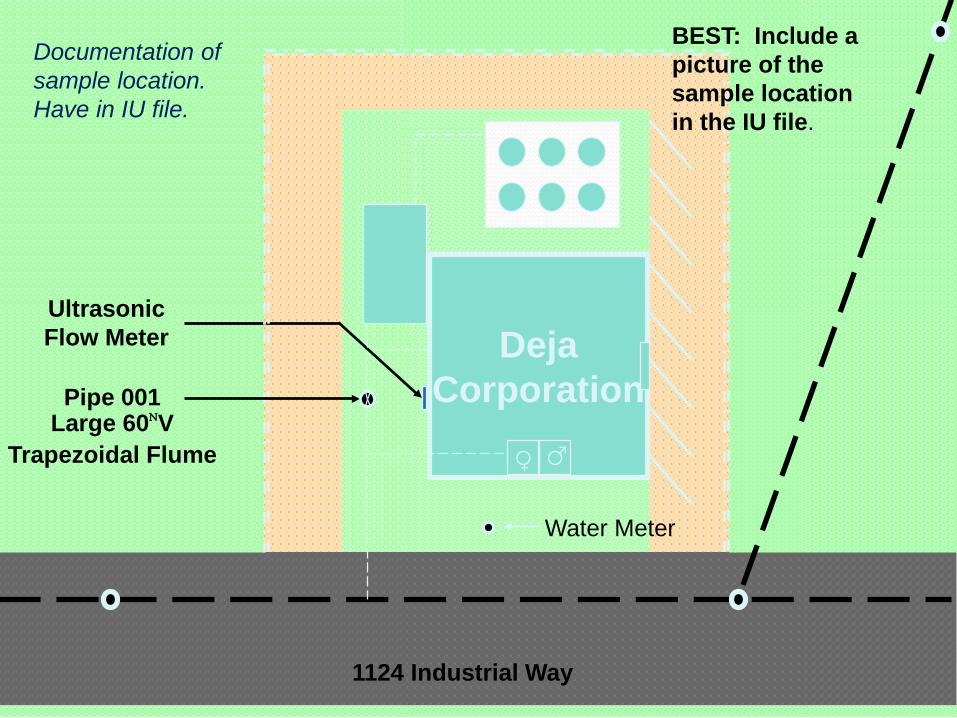
1124 Industrial Way
UltrasonicFlow Meter
Pipe 001Large 60NV
Trapezoidal Flume
DejaCorporation
Water Meter
+
Documentation of sample location. Have in IU file.
BEST: Include a picture of the sample location in the IU file.
Categorical Limit vs Local Limit
Categorical sample location is END OF PROCESS
Local Limit sample location is END OF PIPE
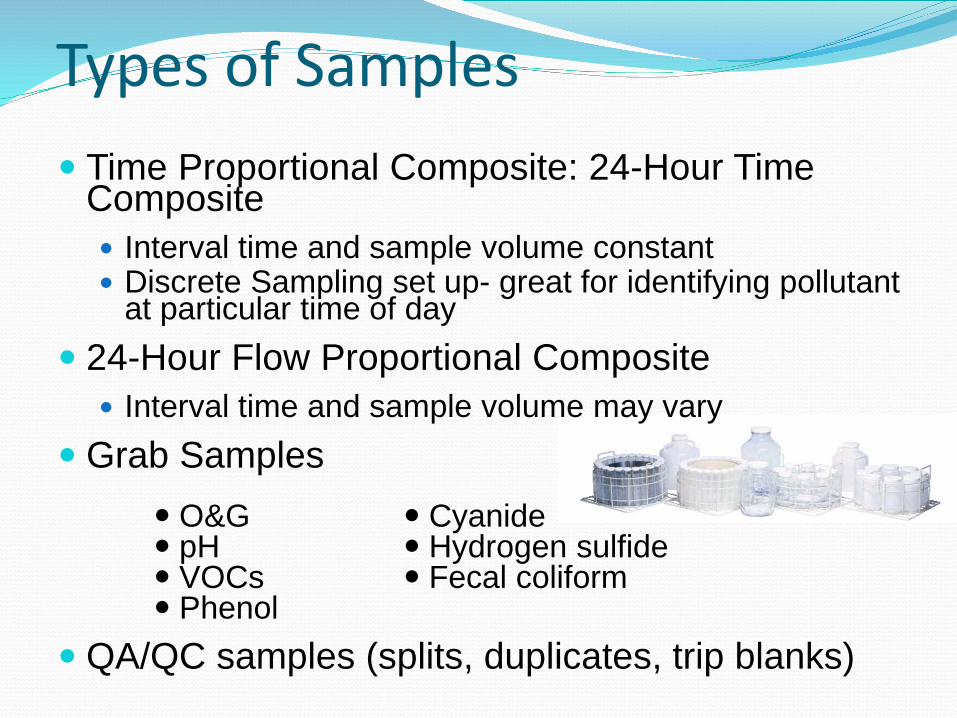
Types of Samples Time Proportional Composite: 24-Hour Time
Composite Interval time and sample volume constant Discrete Sampling set up- great for identifying pollutant
at particular time of day 24-Hour Flow Proportional Composite
Interval time and sample volume may vary Grab Samples
QA/QC samples (splits, duplicates, trip blanks)
Cyanide Hydrogen sulfide Fecal coliform
O&G pH VOCs Phenol
Continuous SampleAutomated collection and analysis of a parameter in a discharge
Typically used for pH and flow
Permit should define the conditions for a violation, significant noncompliance, etc…
Permit should define calibration requirements
Grab SamplesTaken from a wastestream on a one-time basis without consideration of the flow rate of the wastestream and without consideration of time
Compliance with instantaneous maximum Limits
Checking for extreme conditions.
Must be used to monitor certain pollutants (e.g., pH, volatile organics, oil & grease, cyanide)
On a case-by-case basis – may be used for monitoring batch discharges (is holding tank well mixed?)
Compositing Grab Samples
Pro Con
Does not identify the extreme conditions that exist
Lowers the analysis costs
Cyanide, total phenols, sulfides may be composited in the lab or in the field. VOCs and Oil & Grease may be composited in the lab.
When to use composite samples
Highly variable effluent (flow or pollutants) Categorical standards (generally) Permit that specifies daily maximum limits
Minimum volume of each sample? US EPA sampling guidance documents state that a
minimum of 100 mls. should be collected per individual aliquot
0
20
40
60
80
100
1 2 3 4 5 6 7 8
HOURS
FLOW
, gal
X 1
00
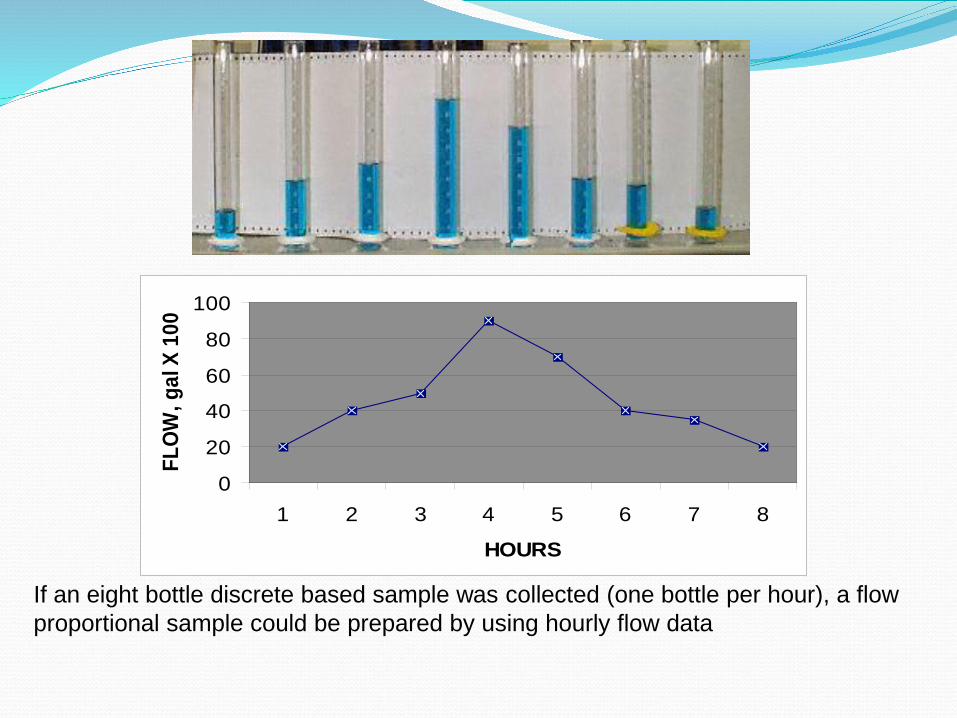
If an eight bottle discrete based sample was collected (one bottle per hour), a flow proportional sample could be prepared by using hourly flow data
24-Hour Flow Proportional Composite Sample Preferred!
Example…SIU discharges 70,000 gpd, however the flow varies. Some days 35,000 gallons of flow is discharged within 2 hour period. If time composite used (i.e. 100 ml every 15 minutes) then 8% of samples represented 50% of discharge.
Documentation of sample type used Sample type must be designated in the SIU permit If time composite is used, why is Control Authority
allowing this instead of flow proportional composite?
Time-Proportional vs. Flow-Proportional
40 CFR 403.12(g)(3):…Where time-proportional composite sampling or grab sampling is authorized by the Control Authority, the samples must be representative of the Discharge and the decision to allow the alternative sampling must be documented in that Industrial User file for that facility or facilities.
Document in the IU file why an IU is allowed to use time-proportional composite sample.
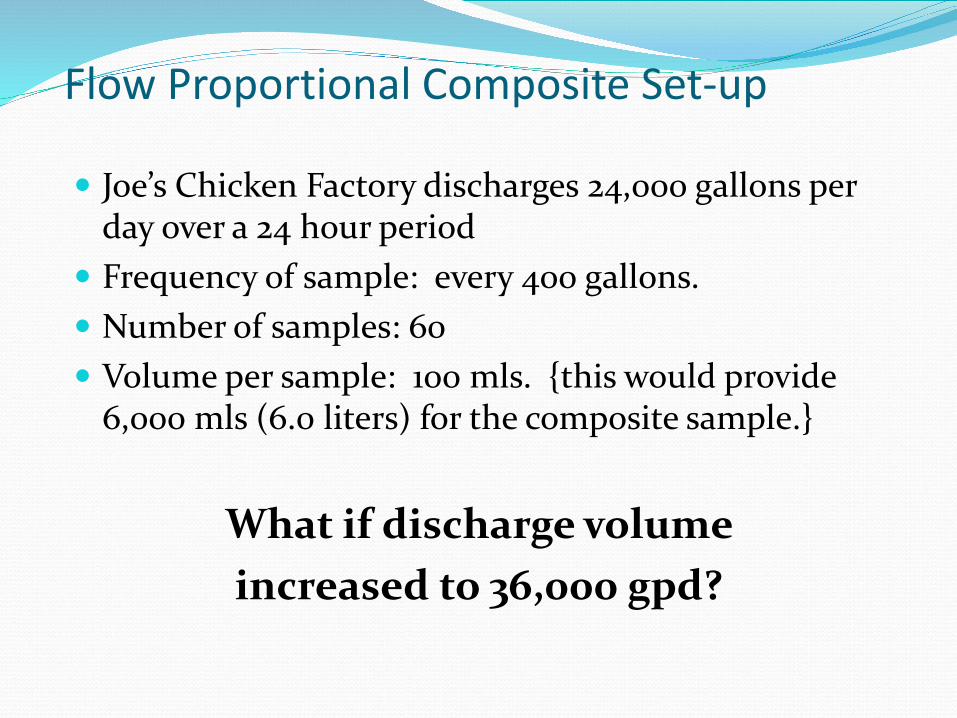
Flow Proportional Composite Set-up
Joe’s Chicken Factory discharges 24,000 gallons per day over a 24 hour period
Frequency of sample: every 400 gallons. Number of samples: 60 Volume per sample: 100 mls. {this would provide
6,000 mls (6.0 liters) for the composite sample.}
What if discharge volume increased to 36,000 gpd?
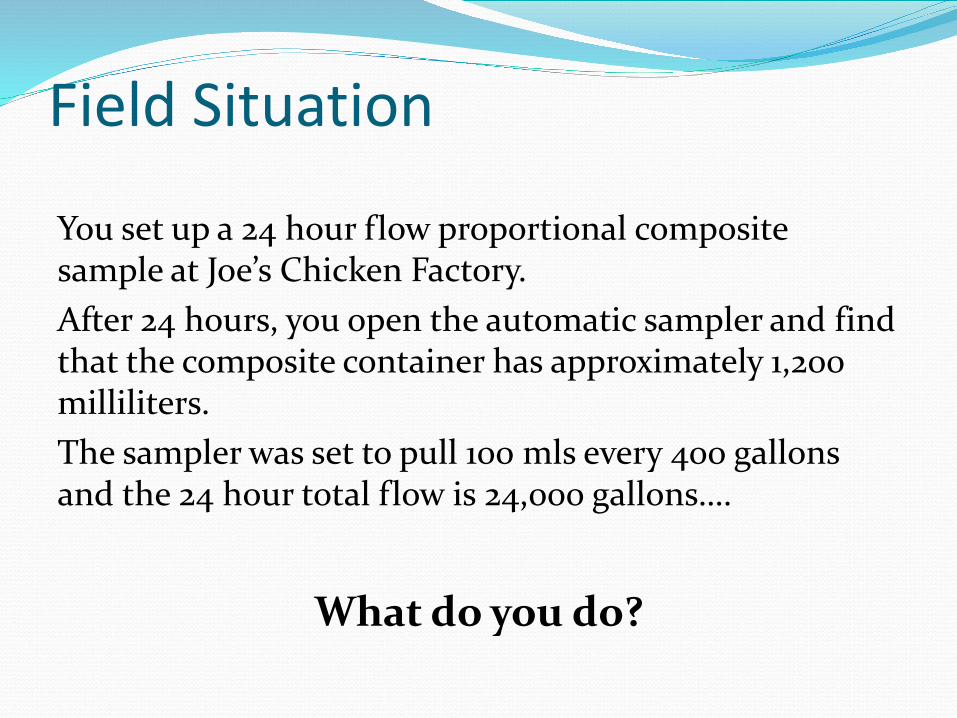
Field Situation
You set up a 24 hour flow proportional composite sample at Joe’s Chicken Factory. After 24 hours, you open the automatic sampler and find that the composite container has approximately 1,200 milliliters. The sampler was set to pull 100 mls every 400 gallons and the 24 hour total flow is 24,000 gallons….
What do you do?
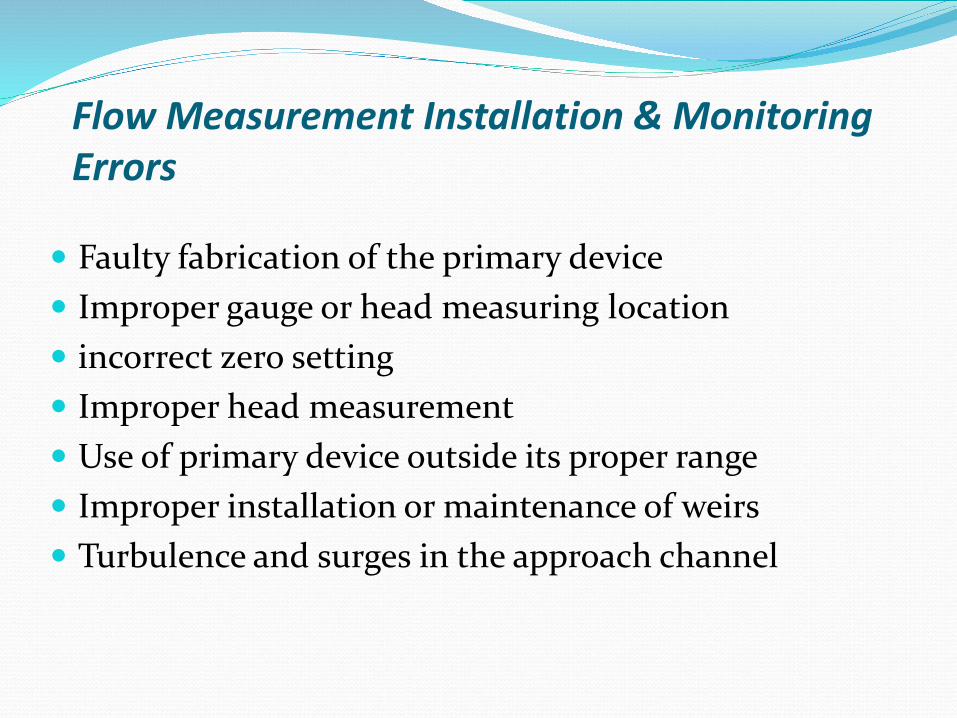
Flow Measurement Installation & Monitoring Errors
Faulty fabrication of the primary device Improper gauge or head measuring location incorrect zero setting Improper head measurement Use of primary device outside its proper range Improper installation or maintenance of weirs Turbulence and surges in the approach channel
Calibration of Flow Measurement Equipment
IU Permit should have requirement on flow meter calibration
3rd Party calibration frequency and recordkeeping
Report all calibration procedures to Control Authority
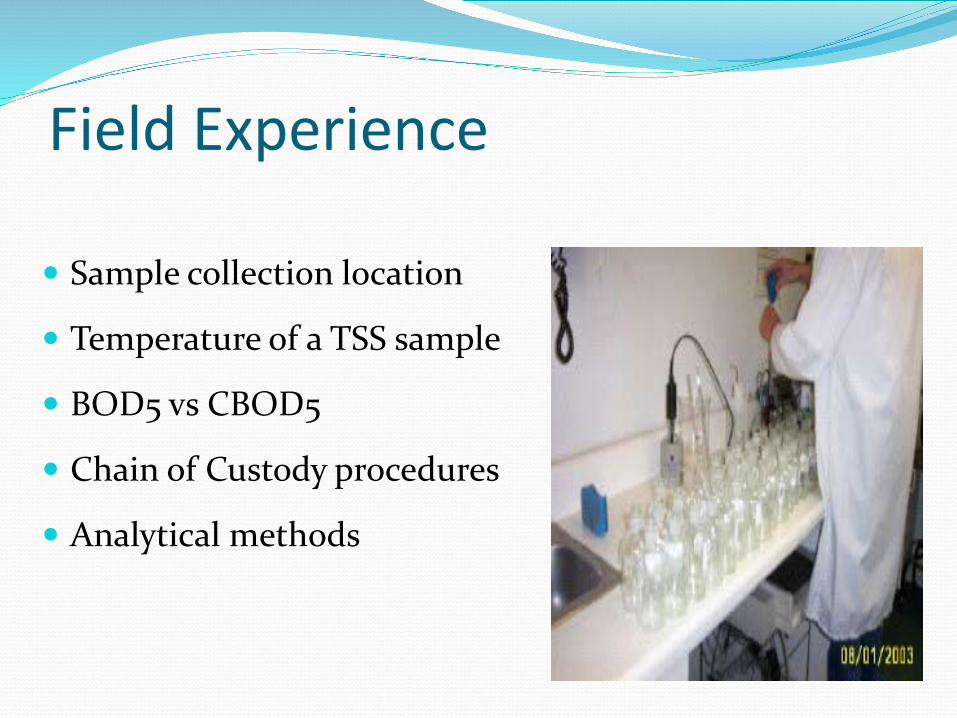
Field Experience
Sample collection location
Temperature of a TSS sample
BOD5 vs CBOD5
Chain of Custody procedures
Analytical methods
Food Service Establishment
Average pH from Interceptor: 4.9 std. units (range 1.2 to 11.5)
BOD5 from monthly pumped interceptor with all components can be 500 to 1,000 mg/L
O&G from 20 to 2,500 mg/L
Violations…Of course it may be a violation, but some SIU’s may say “Lab error, the analysis result is wrong”;
but you need to investigate, it may be…
Chemical by-products New materials used New Supplier of raw materials or product Maintenance, cooling water, boiler chemicals Domestic Sources
Pollutant Sources• Review Industrial Waste Survey Results
– Chemicals known present, Chemicals suspected present• During Industrial User Inspections
– What chemicals are used and stored– What areas are chemicals used and why?
• Be familiar with chemical by-products• Be familiar with laboratory analysis interferences
Copper• Plumbing/piping
– Example: New copper water line at aquarium. Several rare fish species killed. Copper concentrations 4 mg/L to 6 mg/L
– Takes several months for residential copper piping to form biofilm to prevent high Cu leaching
– Hot water can cause more leaching (boilers, steam, industrial laundries)
• Controlling algae and aquatic plant growth• Paints, dyes – mildew resistance, biological control• Water resistant adhesives• Consider increased safety factor for Copper (& Zinc)
when doing local limits.
Zinc• National Avg Domestic Background: 0.231 mg/L• Oils, lubricants, greases• City water corrosion inhibitor (Zn polyphosphate)• Medicines, cosmetics
– One septic tank from residence had Zn concentrations > 1,000 mg/L
• Plumbing, piping• Anti-sticking agent (Zn stearate)
– Windshield wiper IU had increased Zn concentrations and ask if any processed changed, they said no. However, eventually found out that new rubber supplier had recently started.
Arsenic Wood preservatives Glass manufacturing Agricultural Products
Example: Arsenic product used to defoliate cotton. Problems at clothing mfr. Problems with corrugated box mfr. (potatoes – starch
contamination)
Molybdenum Lubricating oils Smoke suppressant, used in some plastics Foods (nitrogen fixing agent assisters- beans, peas,
etc..) Corrosion Inhibitor
Cooling water additive Different forms, look for sodium molybdate. Concentrations may range from 2 to 20 mg/L
Total Phenols• Resins used in Plywood adhesives, wood preservatives
– Landfills can have elevated phenols• Disinfectants, deodorizers
– Automobile mfr had chronic phenol violations. Over 1 yr of research and sampling conducted. Identified disinfectant/deodorizer.
• Air Masking Agents– Sweet smelling aroma. Pentachlorophenol
contamination in WWTP sludge• Antiseptics, Lotions, Lozenges
Organics Chloroform
IU did not use chloroform but had concentrations > 14 mg/L
By-product of chlorination Phthalates
Do not use plastic containers when sampling, and use Teflon tubing not Tygon
Other Volatile Organic Compounds
Toluene, Benzene, Trichloroethylene, MEK, and other solvents or cleaners Industrial laundries can have clients that send them
solvent rags to be cleaned Identify the source of the solvent rags sent to the
industrial laundry, this may identify another Industrial User.
Ammonia Seasonal Variation
Expect significantly higher concentrations of ammonia in the summer (temp, urea, etc…)
Septic conditions can lead to higher concentrations Sewage pumping stations
Cooling additive At higher pH, ammonia is more toxic, and ammonia
can be stripped from wastewater.
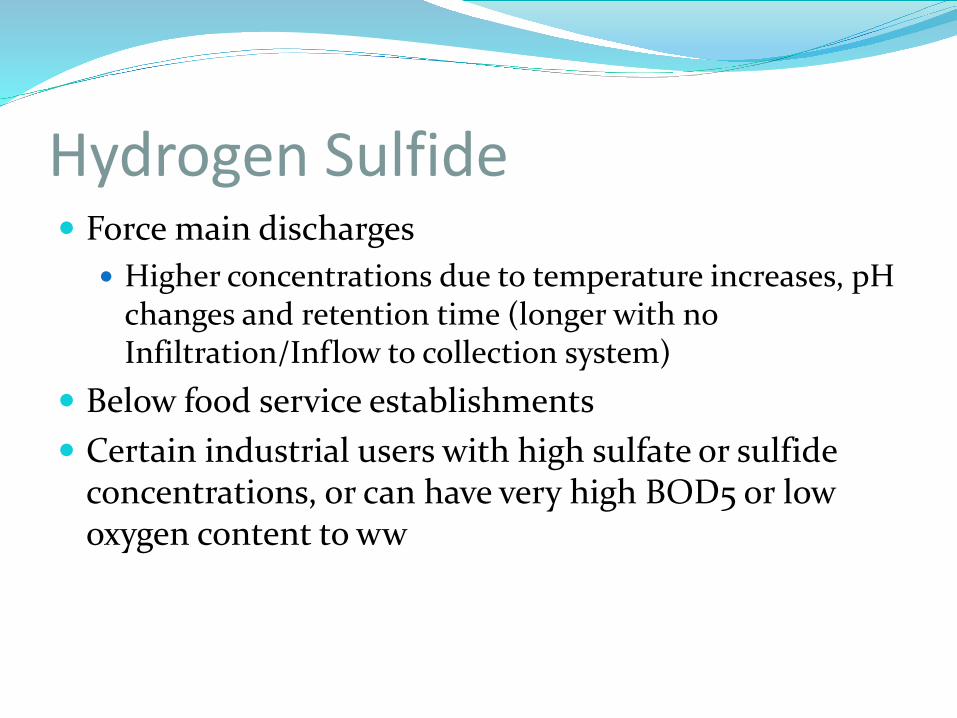
Hydrogen Sulfide Force main discharges
Higher concentrations due to temperature increases, pH changes and retention time (longer with no Infiltration/Inflow to collection system)
Below food service establishments Certain industrial users with high sulfate or sulfide
concentrations, or can have very high BOD5 or low oxygen content to ww
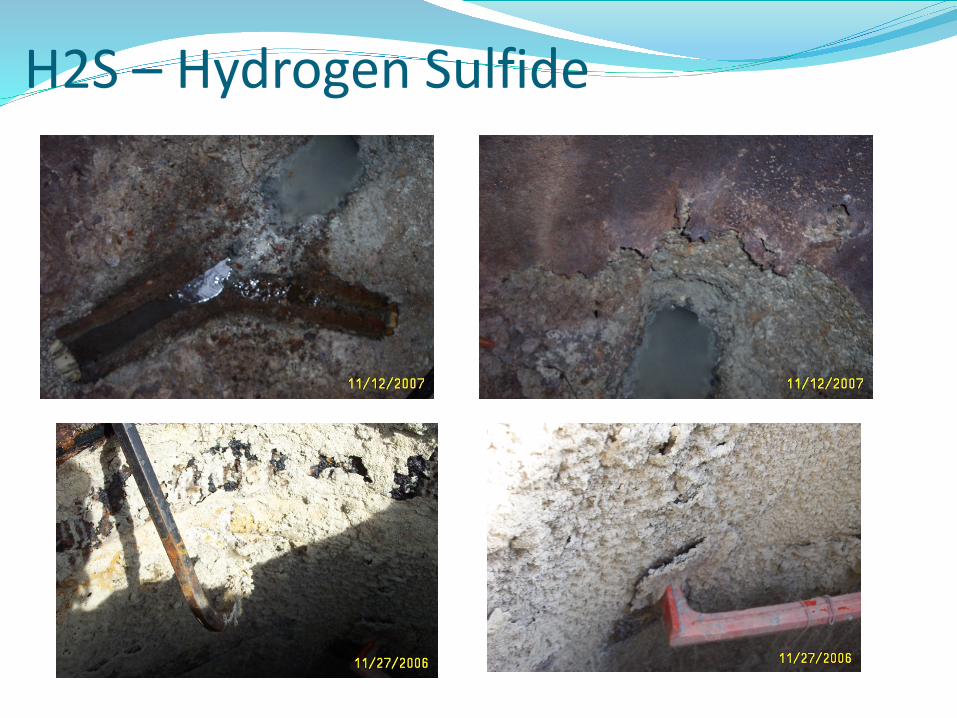
H2S – Hydrogen Sulfide
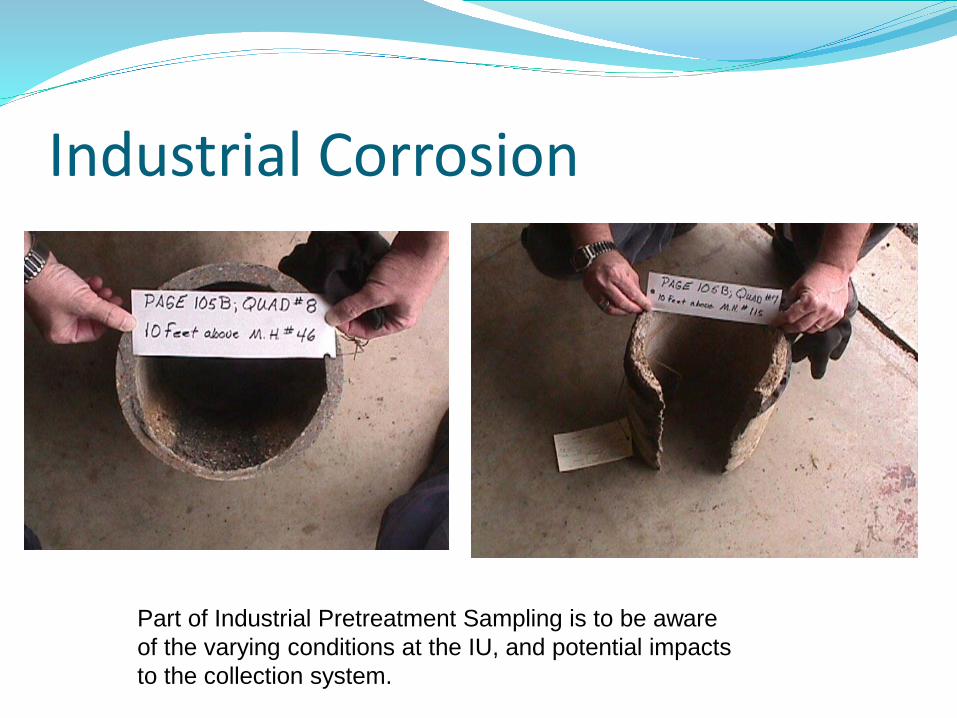
Industrial Corrosion
Part of Industrial Pretreatment Sampling is to be aware of the varying conditions at the IU, and potential impacts to the collection system.
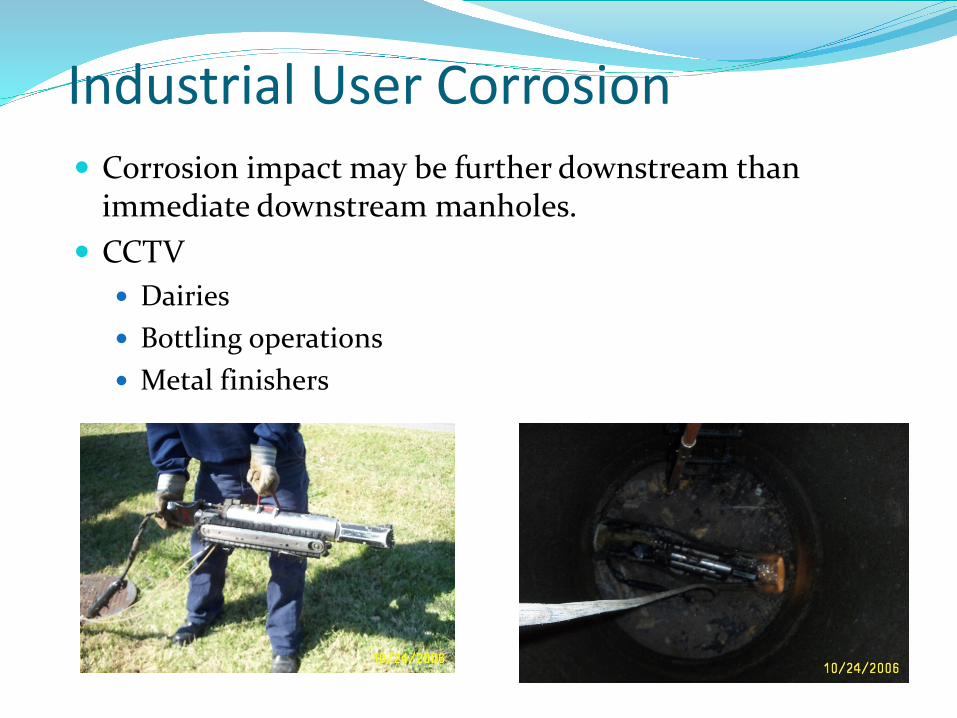
Industrial User Corrosion Corrosion impact may be further downstream than
immediate downstream manholes. CCTV
Dairies Bottling operations Metal finishers
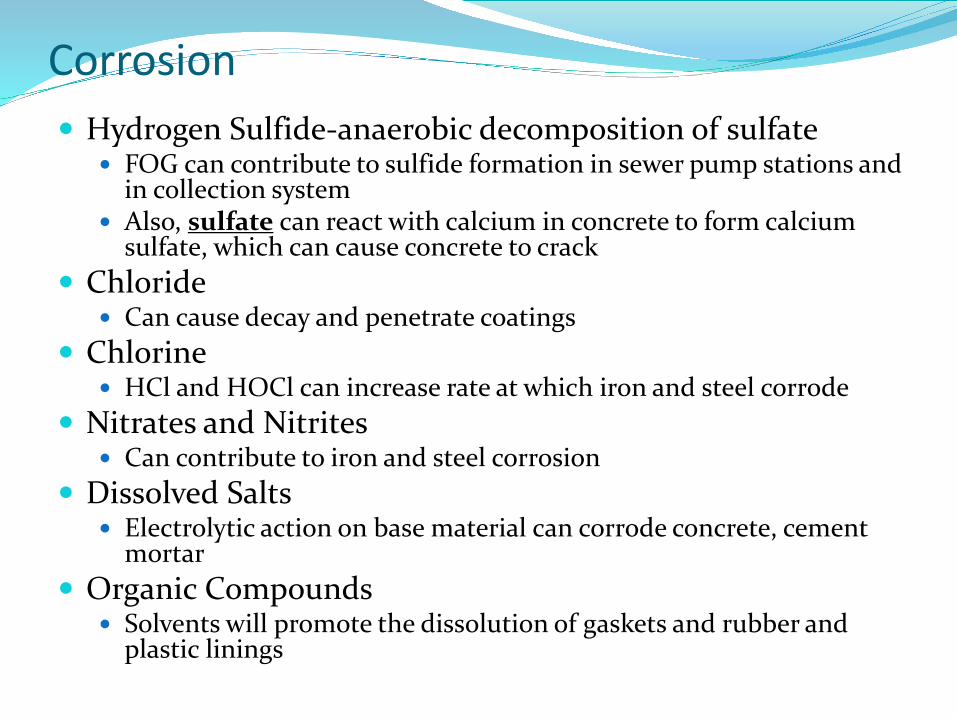
Corrosion Hydrogen Sulfide-anaerobic decomposition of sulfate
FOG can contribute to sulfide formation in sewer pump stations and in collection system
Also, sulfate can react with calcium in concrete to form calcium sulfate, which can cause concrete to crack
Chloride Can cause decay and penetrate coatings
Chlorine HCl and HOCl can increase rate at which iron and steel corrode
Nitrates and Nitrites Can contribute to iron and steel corrosion
Dissolved Salts Electrolytic action on base material can corrode concrete, cement
mortar Organic Compounds
Solvents will promote the dissolution of gaskets and rubber and plastic linings
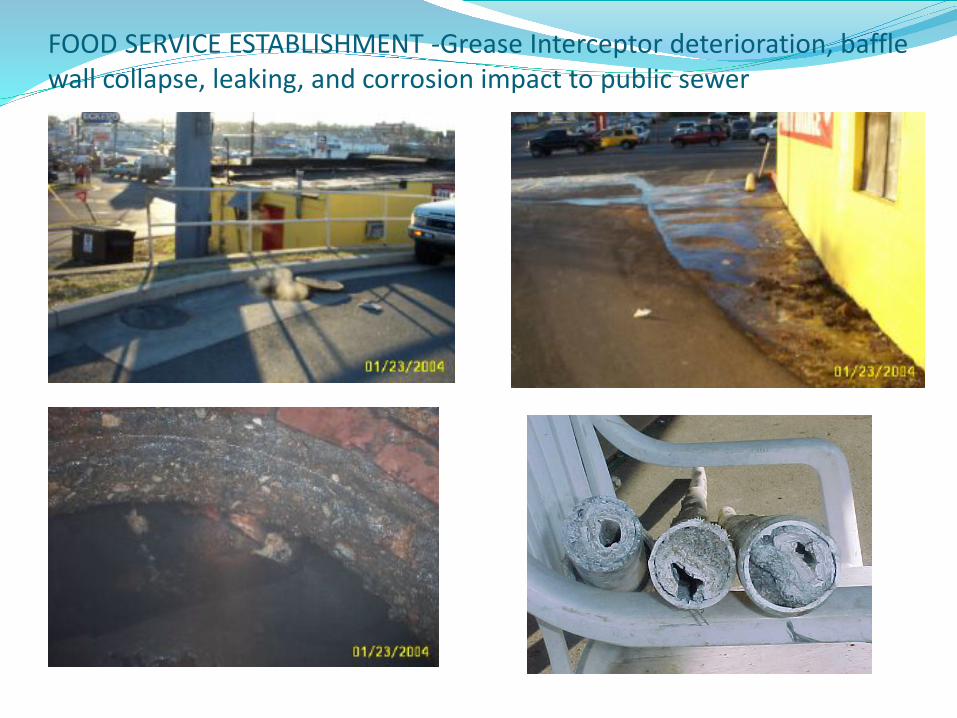
FOOD SERVICE ESTABLISHMENT -Grease Interceptor deterioration, baffle wall collapse, leaking, and corrosion impact to public sewer
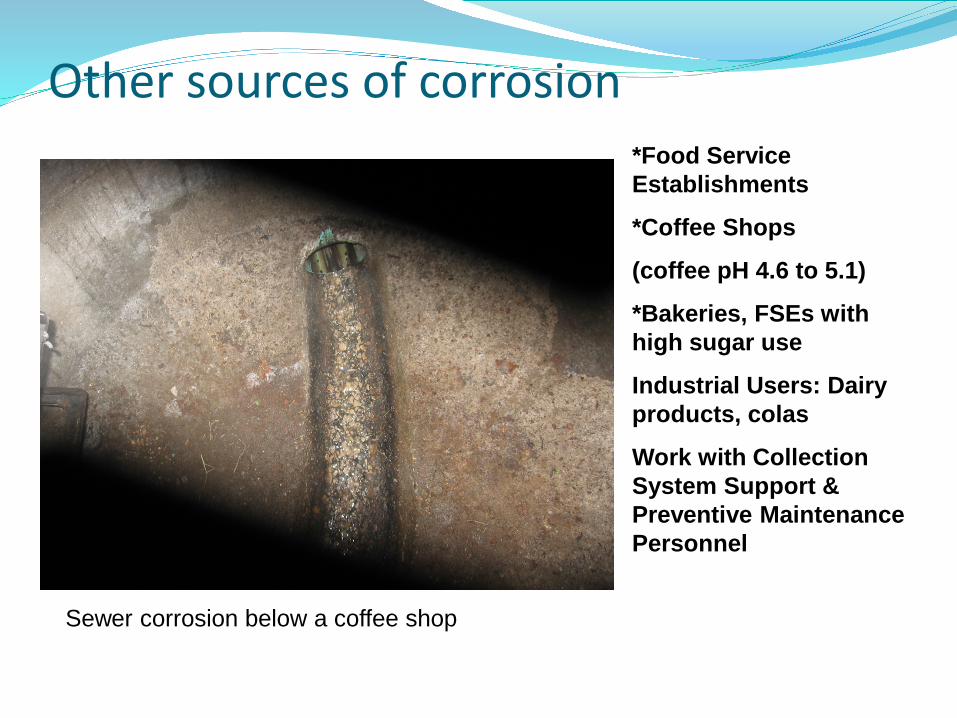
Other sources of corrosion*Food Service Establishments
*Coffee Shops
(coffee pH 4.6 to 5.1)
*Bakeries, FSEs with high sugar use
Industrial Users: Dairy products, colas
Work with Collection System Support & Preventive Maintenance Personnel
Sewer corrosion below a coffee shop
Infiltration & Inflow Prevention Effects
Some WWTPs have experienced a dramatic increase in pollutant concentrations when the collection system has been repaired to prevent I & I.
In some cases, the WWTP has blamed an IU for the elevated concentrations in pollutants, so recommend doing some residential and commercial background sampling to identify pollutant concentrations.

Questions, Comments?