Embed Size (px)
Citation preview

527-1
EPA Document #: 815-R-05-005 METHOD 527 DETERMINATION OF SELECTED PESTICIDES AND FLAME
RETARDANTS IN DRINKING WATER BY SOLID PHASE EXTRACTION AND CAPILLARY COLUMN GAS CHROMATOGRAPHY/ MASS SPECTROMETRY (GC/MS)
Revision 1.0 April 2005
Ed K. Price, Brahm Prakash, Mark M. Domino, and Barry V. Pepich (Shaw Environmental, Inc.) David J. Munch (U.S. EPA, Office of Ground Water and Drinking Water)
TECHNICAL SUPPORT CENTER OFFICE OF GROUND WATER AND DRINKING WATER
U. S. ENVIRONMENTAL PROTECTION AGENCY CINCINNATI, OHIO 45268

527-2
METHOD 527.0
DETERMINATION OF SELECTED PESTICIDES AND FLAME RETARDANTS IN DRINKING WATER BY SOLID PHASE EXTRACTION AND CAPILLARY COLUMN GAS
CHROMATOGRAPHY/ MASS SPECTROMETRY (GC/MS) 1. SCOPE AND APPLICATION
1.1 This is a gas chromatography/mass spectrometry (GC/MS) method for the determination of selected semivolatile organic compounds in drinking waters. Accuracy and precision data have been generated in reagent water, finished ground and surface water for the compounds listed in the table below. The single laboratory Lowest Concentration Minimum Reporting Level (LCMRL) has also been determined in reagent water. (1)
AnalyteChemical Abstract Services Registry Number (CASRN)
Atrazine 1912-24-9 Bifenthrin 82657-04-3 Bromacil 314-40-9 Chlorpyrifos Dimethoate
2921-88-2 60-51-5
Esbiol 28434-00-6 Esfenvalerate* 66230-04-4 Fenvalerate* 51630-58-1 Hexabromobiphenyl 59080-40-9 2,2',4,4',5,5'-Hexabromodiphenyl ether (BDE-153) 68631-49-2 Hexazinone 51235-04-2 Kepone* 143-50-0 Malathion 121-75-5 Mirex 2385-85-5 Norflurazon* 27314-13-2 Nitrofen* 1836-75-5 Oxychlordane 27304-13-8 Parathion* 56-38-2 2,2',4,4',5-Pentabromodiphenyl ether (BDE-99) 60348-60-9 2,2',4,4',6-Pentabromodiphenyl ether (BDE-100) 189084-64-8 Prometryne 7287-19-6 Propazine 139-40-2 Terbufos-sulfone 56070-16-7
527-3
AnalyteChemical Abstract Services Registry Number (CASRN)
2,2',4,4'-Tetrabromodiphenyl ether (BDE-47) 5436-43-1 Thiobencarb 28249-77-6 Vinclozolin 50471-44-8
*These are potential problem compounds (Sect. 13.2). 1.2 The Minimum Reporting Level (MRL) is the lowest analyte concentration that meets Data
Quality Objectives (DQOs) that are developed based on the intended use of this method. The single laboratory lowest concentration MRL (LCMRL) is the lowest true concentration for which the future recovery is predicted to fall, with high confidence (99 percent), between 50 and 150 percent recovery. The procedure used to determine the LCMRL is described elsewhere.1
1.3 Laboratories using this method will not be required to determine the LCMRL for this method,
but will need to demonstrate that their laboratory MRL for this method meets the require-ments described in Section 9.2.4.
1.4 Determining the Detection Limit (DL) for analytes in this method is optional (Sect. 9.2.6).
Detection limit is defined as the statistically calculated minimum concentration that can be measured with 99% confidence that the reported value is greater than zero.2 The DL is compound dependent and is dependent on extraction efficiency, sample matrix, fortification concentration, and instrument performance.
1.5 This method is intended for use by analysts skilled in solid phase extractions, the operation of
GC/MS instruments, and the interpretation of the associated data. 2. SUMMARY OF METHOD
2.1 A 1-liter water sample is fortified with surrogates and passed through a solid phase extraction (SPE) disk containing polystyrenedivinylbenzene (SDVB) to extract the target analytes and surrogates. The compounds are eluted from the solid phase with a small amount of ethyl acetate (EtOAc) and methylene chloride (MeCl2). The extract is dried by passing it through a column of anhydrous sodium sulfate, concentrated with nitrogen, and then adjusted to a 1-mL volume with ethyl acetate after adding the internal standard. A 1-µL, splitless injection is made into a GC equipped with a high-resolution fused silica capillary column that is interfaced to a MS. The analytes are separated and identified by comparing the acquired mass spectra and retention times to reference spectra and retention times for calibration standards acquired under identical GC/MS conditions. The concentration of each analyte is determined by using the internal standard technique. Surrogate analytes are added to all Field and Quality Control (QC) Samples to monitor the extraction efficiency of the target analytes.
527-4
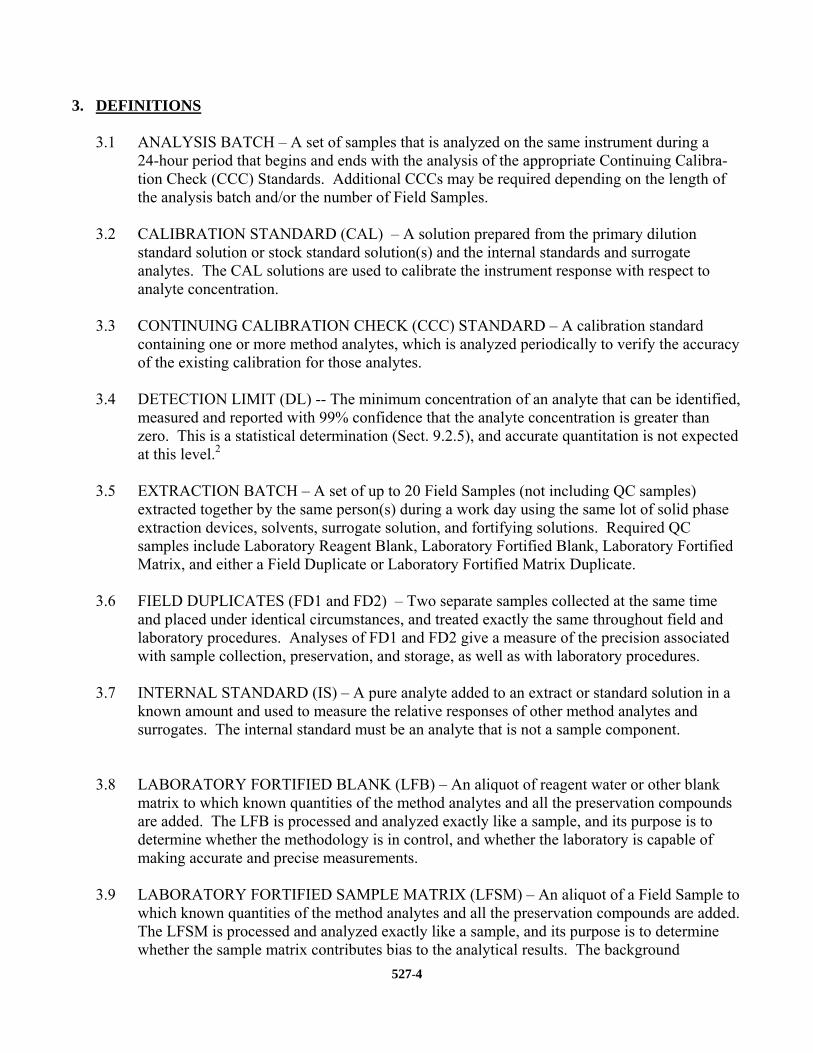
3. DEFINITIONS
3.1 ANALYSIS BATCH – A set of samples that is analyzed on the same instrument during a 24-hour period that begins and ends with the analysis of the appropriate Continuing Calibra-tion Check (CCC) Standards. Additional CCCs may be required depending on the length of the analysis batch and/or the number of Field Samples.
3.2 CALIBRATION STANDARD (CAL) – A solution prepared from the primary dilution
standard solution or stock standard solution(s) and the internal standards and surrogate analytes. The CAL solutions are used to calibrate the instrument response with respect to analyte concentration.
3.3 CONTINUING CALIBRATION CHECK (CCC) STANDARD – A calibration standard
containing one or more method analytes, which is analyzed periodically to verify the accuracy of the existing calibration for those analytes.
3.4 DETECTION LIMIT (DL) -- The minimum concentration of an analyte that can be identified,
measured and reported with 99% confidence that the analyte concentration is greater than zero. This is a statistical determination (Sect. 9.2.5), and accurate quantitation is not expected at this level.2
3.5 EXTRACTION BATCH – A set of up to 20 Field Samples (not including QC samples)
extracted together by the same person(s) during a work day using the same lot of solid phase extraction devices, solvents, surrogate solution, and fortifying solutions. Required QC samples include Laboratory Reagent Blank, Laboratory Fortified Blank, Laboratory Fortified Matrix, and either a Field Duplicate or Laboratory Fortified Matrix Duplicate.
3.6 FIELD DUPLICATES (FD1 and FD2) – Two separate samples collected at the same time
and placed under identical circumstances, and treated exactly the same throughout field and laboratory procedures. Analyses of FD1 and FD2 give a measure of the precision associated with sample collection, preservation, and storage, as well as with laboratory procedures.
3.7 INTERNAL STANDARD (IS) – A pure analyte added to an extract or standard solution in a
known amount and used to measure the relative responses of other method analytes and surrogates. The internal standard must be an analyte that is not a sample component.
3.8 LABORATORY FORTIFIED BLANK (LFB) – An aliquot of reagent water or other blank
matrix to which known quantities of the method analytes and all the preservation compounds are added. The LFB is processed and analyzed exactly like a sample, and its purpose is to determine whether the methodology is in control, and whether the laboratory is capable of making accurate and precise measurements.
3.9 LABORATORY FORTIFIED SAMPLE MATRIX (LFSM) – An aliquot of a Field Sample to
which known quantities of the method analytes and all the preservation compounds are added. The LFSM is processed and analyzed exactly like a sample, and its purpose is to determine whether the sample matrix contributes bias to the analytical results. The background

527-5
concentrations of the analytes in the sample matrix must be determined in a separate aliquot and the measured values in the LFSM corrected for background concentrations.
3.10 LABORATORY FORTIFIED SAMPLE MATRIX DUPLICATE (LFSMD) – A second
aliquot of the Field Sample used to prepare the LFSM, which is fortified, extracted and analyzed identically to the LFSM. The LFSMD is used instead of the Field Duplicate to access method precision and accuracy when the occurrence of a target analyte is infrequent.
3.11 LABORATORY REAGENT BLANK (LRB) – An aliquot of reagent water or other blank
matrix that is treated exactly as a sample including exposure to all glassware, equipment, solvents, reagents, sample preservatives, internal standards, and surrogates that are used in the extraction batch. The LRB is used to determine if method analytes or other interferences are present in the laboratory environment, the reagents, or the apparatus.
3.12 MATERIAL SAFETY DATA SHEET (MSDS) – Written information provided by vendors
concerning a chemical’s toxicity, health hazards, physical properties, fire, and reactivity data including storage, spill, and handling precautions.
3.13 LOWEST CONCENTRATION MINIMUM REPORTING LEVEL (LCMRL) – The single-
laboratory LCMRL is the lowest true concentration for which the future recovery is predicted to fall, with high confidence (99 percent), between 50 and 150 percent recovery.(1)
3.14 MINIMUM REPORTING LEVEL (MRL) – The minimum concentration that can be reported
by a laboratory as a quantitated value for a target analyte in a sample following analysis. This defined concentration must meet the criteria defined in Section 9.2.2 and must not be any lower than the concentration of the lowest continuing calibration check standard for that analyte.
3.15 PRIMARY DILUTION STANDARD SOLUTION (PDS) – A solution containing method
analytes prepared in the laboratory from stock standard solutions and diluted as needed to prepare calibration solutions and other analyte solutions.
3.16 QUALITY CONTROL SAMPLE (QCS) –A sample prepared using a PDS of method analytes
that is obtained from a source external to the laboratory and different from the source of calibration standards. The second source PDS and the surrogate PDS are used to fortify the QCS at a known concentration. The QCS is used to check calibration standard integrity.
3.17 STOCK STANDARD SOLUTION (SSS) – A concentrated solution containing one or more
method analytes prepared in the laboratory using assayed reference materials or purchased from a reputable commercial source.
3.18 SURROGATE ANALYTE (SUR) – A pure analyte, which is extremely unlikely to be found
in any sample, and which is added to a sample aliquot in a known amount before extraction or other processing, and is measured with the same procedures used to measure other sample components. The purpose of the SUR is to monitor method performance with each sample.

527-6
4. INTERFERENCES 4.1 All glassware must be meticulously cleaned. Wash glassware with detergent and tap water,
rinse with tap water, followed by reagent water. Non-volumetric glassware can be heated in a muffle furnace at 400 °C for 2 hours as a substitute for a solvent rinse. Volumetric glassware should not be heated in an oven above 120 °C.
4.2 Method interferences may be caused by contaminants in solvents, reagents (including reagent
water), sample bottles and caps, and other sample processing hardware that lead to discrete artifacts and/or elevated baselines in the chromatograms. All items such as these must be routinely demonstrated to be free from interferences (less than 1/3 the MRL for each target analyte) under the conditions of the analysis by analyzing laboratory reagent blanks as described in Section 9.3.1. Subtracting blank values from sample results is not permitted.
4.3 Matrix interferences may be caused by contaminants that are co-extracted from the sample.
The extent of matrix interferences will vary considerably from source to source, depending upon the nature of the water. Water samples high in total organic carbon (TOC) may have elevated baseline or interfering peaks.
4.4 Relatively large quantities of the buffer and preservatives (Sect. 8.1.1) are added to sample
bottles. The potential exists for trace-level organic contaminants in these reagents. Interfer-ences from these sources should be monitored by analysis of laboratory reagent blanks, par-ticularly when new lots of reagents are acquired.
4.5 Solid phase extraction disks have been observed to be a source of interferences. The analysis
of field and laboratory reagent blanks can provide important information regarding the presence or absence of such interferences. Brands and lots of solid phase extraction devices should be tested to ensure that contamination does not preclude analyte identification and quantitation.
4.6 Analyte carryover may occur when a relatively “clean” sample is analyzed immediately after
a sample containing relatively high concentrations of compounds. Syringes and splitless injection port liners must be cleaned carefully or replaced as needed. After analysis of a sample containing high concentrations of compounds, a laboratory reagent blank should be analyzed to ensure that accurate values are obtained for the next sample.
4.7 Silicone compounds may be leached from punctured autosampler vial septa, particularly when
particles of the septa sit in the vial. This can occur after repeated injections of the same autosampler vial. These silicone compounds, which appear as regularly spaced chromatographic peaks with similar fragmentation patterns, can unnecessarily complicate the total ion chromatograms and may cause interferences at high levels.
4.8 Quantitation of bromacil should be reviewed for potential common interferences. The
quantitation ion suggested in Table 2 (205 m/z) can be found in the SDVB solid phase, and so method blanks should be carefully examined for this potential interference. The ion at 207 m/z may be used as an alternate quantitation ion; however, this ion is associated with column bleed.
527-7
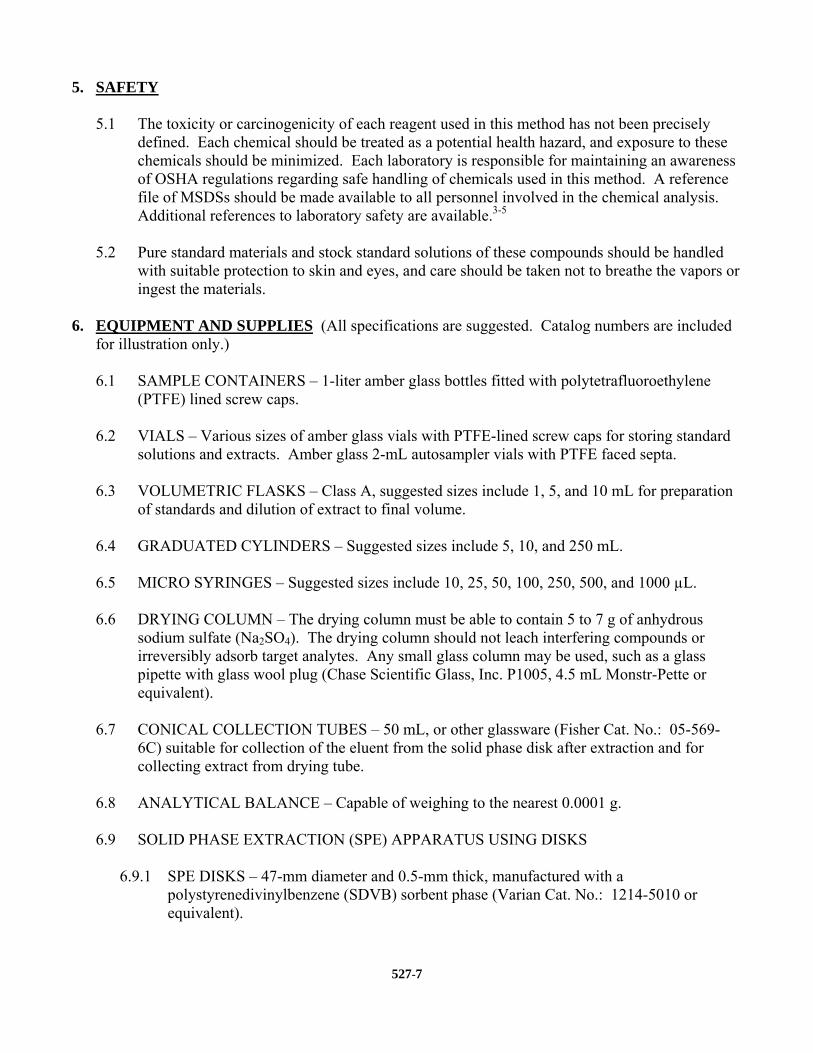
5. SAFETY 5.1 The toxicity or carcinogenicity of each reagent used in this method has not been precisely
defined. Each chemical should be treated as a potential health hazard, and exposure to these chemicals should be minimized. Each laboratory is responsible for maintaining an awareness of OSHA regulations regarding safe handling of chemicals used in this method. A reference file of MSDSs should be made available to all personnel involved in the chemical analysis. Additional references to laboratory safety are available.3-5
5.2 Pure standard materials and stock standard solutions of these compounds should be handled
with suitable protection to skin and eyes, and care should be taken not to breathe the vapors or ingest the materials.
6. EQUIPMENT AND SUPPLIES (All specifications are suggested. Catalog numbers are included
for illustration only.)
6.1 SAMPLE CONTAINERS – 1-liter amber glass bottles fitted with polytetrafluoroethylene (PTFE) lined screw caps.
6.2 VIALS – Various sizes of amber glass vials with PTFE-lined screw caps for storing standard
solutions and extracts. Amber glass 2-mL autosampler vials with PTFE faced septa. 6.3 VOLUMETRIC FLASKS – Class A, suggested sizes include 1, 5, and 10 mL for preparation
of standards and dilution of extract to final volume. 6.4 GRADUATED CYLINDERS – Suggested sizes include 5, 10, and 250 mL. 6.5 MICRO SYRINGES – Suggested sizes include 10, 25, 50, 100, 250, 500, and 1000 µL. 6.6 DRYING COLUMN – The drying column must be able to contain 5 to 7 g of anhydrous
sodium sulfate (Na2SO4). The drying column should not leach interfering compounds or irreversibly adsorb target analytes. Any small glass column may be used, such as a glass pipette with glass wool plug (Chase Scientific Glass, Inc. P1005, 4.5 mL Monstr-Pette or equivalent).
6.7 CONICAL COLLECTION TUBES – 50 mL, or other glassware (Fisher Cat. No.: 05-569-
6C) suitable for collection of the eluent from the solid phase disk after extraction and for collecting extract from drying tube.
6.8 ANALYTICAL BALANCE – Capable of weighing to the nearest 0.0001 g.
6.9 SOLID PHASE EXTRACTION (SPE) APPARATUS USING DISKS
6.9.1 SPE DISKS – 47-mm diameter and 0.5-mm thick, manufactured with a
polystyrenedivinylbenzene (SDVB) sorbent phase (Varian Cat. No.: 1214-5010 or equivalent).

527-8
6.9.2 SPE DISK EXTRACTION GLASSWARE – funnel, PTFE-coated support screen, PTFE gasket, base, and clamp used to support SPE disks and contain samples during extraction. May be purchased as a set (Fisher Cat. No.: K971100-0047 or equivalent) or separately.
6.9.3 VACUUM EXTRACTION MANIFOLD – Designed to accommodate extraction
glassware and disks (Varian Cat. No.: 1214-6001 or equivalent). 6.9.4 An automatic or robotic system designed for use with SPE cartridges may be used if all
quality control requirements discussed in Section 9 are met. Automated systems may use either vacuum or positive pressure to process samples and solvents through the cartridge. All extraction and elution steps must be the same as in the manual procedure. Extraction and/or elution steps may not be changed or omitted to accommodate the use of an automated system.
6.10 EXTRACT CONCENTRATION SYSTEM – Extracts are concentrated by blowdown with
nitrogen using water bath set at 40 °C (Meyer N-Evap, Model 111, Organomation Associates, Inc., or equivalent).
6.11 LABORATORY OR ASPIRATOR VACUUM SYSTEM – Sufficient capacity to maintain a
vacuum of approximately 15 to 25 inches of mercury for extraction disks. 6.12 GAS CHROMATOGRAPH/MASS SPECTROMETER (GC/MS) SYSTEM
6.12.1 FUSED SILICA CAPILLARY GC COLUMN – 30 m x 0.25-mm inside diameter (i.d.)
fused silica capillary column coated with a 0.25um bonded film of poly (dimethylsiloxy) poly(1,4-bis(dimethylsiloxy)phenylene)siloxane (J&W DB-5MS or equivalent). Any capillary column that provides adequate capacity, resolution, accuracy, and precision as summarized in Section 17 may be used. A nonpolar, low-bleed column is recommended for use with this method to provide adequate chromatography and minimize column bleed.
6.12.2 GC INJECTOR AND OVEN – Equipped for split/splitless injection. Some of the target
compounds included in this method like the brominated diphenyl ethers (BDEs) are subject to thermal breakdown in the injector port. This increases when the injector is not properly deactivated or at excessive temperatures. The injection system must not allow analytes to contact hot stainless steel or other metal surfaces that promote decomposition. The performance data in Section 17 was obtained using hot, splitless injection using a 2-mm i.d. glass deactivated liner (HP Cat. No.: 5181-8818). Other injection techniques such as temperature programmed injections, cold on-column injections and large volume injections may be used if the QC criteria in Section 9 are met. Equipment designed appropriately for these alternate types of injections must be used if these options are selected.
6.12.3 GC/MS INTERFACE – Interface should allow the capillary column or transfer line exit
to be placed within a few millimeters of the ion source. Other interfaces, like jet separa-tors, are acceptable as long as the system has adequate sensitivity and QC performance criteria are met.

527-9
6.12.4 MASS SPECTROMETER – The MS must be capable of electron ionization at a nominal electron energy (e.g., 70 eV is recommended) to produce positive ions. The spectrometer must be capable of scanning at a minimum from 45 to 650 m/z with a complete scan cycle time (including scan overhead) of 1.0 second or less. (Scan cycle time = total MS data acquisition time in seconds divided by number of scans in the chromatogram). The spectrometer should produce a mass spectrum that meets all criteria in Table 1 when a solution containing approximately 5 ng of decafluorotriphenyl phosphine (DFTPP) is injected into the GC/MS. Use a single spectrum at the apex of the DFTPP peak, an average spectrum of the three highest points of the peak, or an average spectrum across the entire peak to evaluate the performance of the system. The scan time should be set so that all analytes have a minimum of at least five scans across the chromatographic peak. Ten to 15 scans across chromatographic peaks are recommended.
6.12.5 DATA SYSTEM – An interfaced data system is required to acquire, store, and output MS
data. The computer software should have the capability of processing stored GC/MS data by recognizing a GC peak within a given retention time window. The software must allow integration of the ion abundance of any specific ion between specified time or scan number limits. The software must be able to calculate relative response factors (RRFs), construct linear regressions or quadratic calibration curves, and calculate analyte concentrations.
7. REAGENTS AND STANDARDS
7.1 REAGENTS AND SOLVENTS – Reagent grade or better chemicals should be used in all tests. Unless otherwise indicated, it is intended that all reagents will conform to the specifications of the Committee on Analytical Reagents of the American Chemical Society (ACS), where such specifications are available. Other grades may be used, provided it is first determined that the reagent is of sufficiently high purity to permit its use without lessening the quality of the determination.
7.1.1 HELIUM – 99.999 percent or better, GC carrier gas. 7.1.2 REAGENT WATER – Purified water which does not contain any measurable quantities
of any target analytes or interfering compounds at or above 1/3 the MRL for each compound of interest.
7.1.3 METHANOL (MeOH) (CASRN 67-56-1) – High purity, demonstrated to be free of
analytes and interferences (Fisher, GC Resolve Grade or equivalent). 7.1.4 ETHYL ACETATE (EtOAc) (CASRN 141-78-6) – High purity, demonstrated to be free
of analytes and interferences (B&J Brand®, High Purity Solvent Grade or equivalent). 7.1.5 METHYLENE CHLORIDE (MeCl2) (CASRN 75-09-02) – High purity, demonstrated to
be free of analytes and interferences (B&J Brand GC2®, Capillary GC/GC-MS Grade or equivalent).
7.1.6 SODIUM SULFATE (Na2SO4), ANHYDROUS (CASRN 7757-82-6) – Soxhlet
extracted with methylene chloride for a minimum of four hours or heated to 400 °C for

527-10
two hours in a muffle furnace. An “ACS grade, suitable for pesticide residue analysis,” or equivalent, of anhydrous sodium sulfate is recommended.
7.1.7 SAMPLE PRESERVATION REAGENTS – These preservatives are solids at room
temperature and may be added to the sample bottle before shipment to the field.
7.1.7.1 POTASSIUM DIHYDROGEN CITRATE (CASRN 866-83-1) – The sample must be buffered to pH 3.8 to inhibit microbial growth and analyte degradation.
7.1.7.2 L-ASCORBIC ACID (CASRN 50-81-7) – Ascorbic acid reduces “free chlorine” at
the time of sample collection (ACS Reagent Grade or equivalent). 7.1.7.3 ETHYLENEDIAMINETETRAACETIC ACID (EDTA), TRISODIUM SALT
(CASRN 10378-22-0) – Trisodium EDTA is added to inhibit metal-catalyzed hydrolysis of analytes.
7.2 STANDARD SOLUTIONS – When a compound purity is assayed to be 96 percent or greater,
the weight can be used without correction to calculate the concentration of the stock standard. Solution concentrations listed in this section were used to develop this method and are included as an example. Standards for sample fortification generally should be prepared in the smallest volume that can be accurately measured to minimize the addition of excess organic solvent to aqueous samples. Even though stability times for standard solutions are suggested in the following sections, laboratories should use standard QC practices to determine when their standards need to be replaced.
7.2.1 INTERNAL STANDARD (IS) SOLUTIONS – This method uses three internal standard
compounds listed in the table below.
Internal Standards CASRN
acenaphthene-d10 15067-26-2
phenanthrene-d10 1517-22-2
chrysene-d12 1719-03-5
7.2.1.1 INTERNAL STANDARD PRIMARY DILUTION (ISTD PDS) STANDARD (500 µg/ mL) – Prepare, or purchase commercially, the Internal Standard Primary Dilution Standard at a concentration of 500 µg/mL. If prepared from neat or solid standards, this solution requires the preparation of a more concentrated stock standard similar to the procedure followed for the analyte stock (Sect. 7.2.3.1). The Internal Standard PDS used in these studies was purchased in acetone. The Internal Standard PDS has been shown to be stable for 1 year in amber glass screw cap vials when stored at !10 °C or less. Use 10 µL of this 500-µg/mL solution to fortify the final 1-mL extracts (Sect. 11.3.7). This will yield a concentration of 5 µg/mL of each internal standard.
527-11
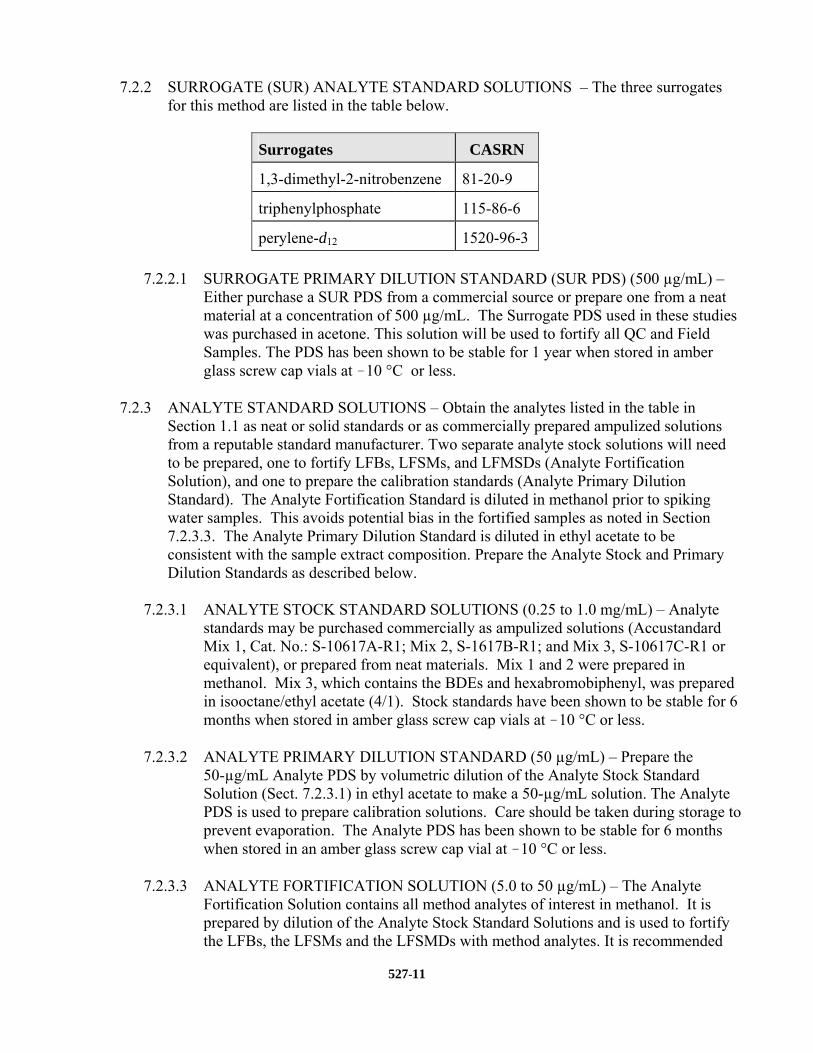
7.2.2 SURROGATE (SUR) ANALYTE STANDARD SOLUTIONS – The three surrogates for this method are listed in the table below.
Surrogates CASRN
1,3-dimethyl-2-nitrobenzene 81-20-9
triphenylphosphate 115-86-6
perylene-d12 1520-96-3
7.2.2.1 SURROGATE PRIMARY DILUTION STANDARD (SUR PDS) (500 µg/mL) – Either purchase a SUR PDS from a commercial source or prepare one from a neat material at a concentration of 500 µg/mL. The Surrogate PDS used in these studies was purchased in acetone. This solution will be used to fortify all QC and Field Samples. The PDS has been shown to be stable for 1 year when stored in amber glass screw cap vials at !10 °C or less.
7.2.3 ANALYTE STANDARD SOLUTIONS – Obtain the analytes listed in the table in
Section 1.1 as neat or solid standards or as commercially prepared ampulized solutions from a reputable standard manufacturer. Two separate analyte stock solutions will need to be prepared, one to fortify LFBs, LFSMs, and LFMSDs (Analyte Fortification Solution), and one to prepare the calibration standards (Analyte Primary Dilution Standard). The Analyte Fortification Standard is diluted in methanol prior to spiking water samples. This avoids potential bias in the fortified samples as noted in Section 7.2.3.3. The Analyte Primary Dilution Standard is diluted in ethyl acetate to be consistent with the sample extract composition. Prepare the Analyte Stock and Primary Dilution Standards as described below.
7.2.3.1 ANALYTE STOCK STANDARD SOLUTIONS (0.25 to 1.0 mg/mL) – Analyte
standards may be purchased commercially as ampulized solutions (Accustandard Mix 1, Cat. No.: S-10617A-R1; Mix 2, S-1617B-R1; and Mix 3, S-10617C-R1 or equivalent), or prepared from neat materials. Mix 1 and 2 were prepared in methanol. Mix 3, which contains the BDEs and hexabromobiphenyl, was prepared in isooctane/ethyl acetate (4/1). Stock standards have been shown to be stable for 6 months when stored in amber glass screw cap vials at !10 °C or less.
7.2.3.2 ANALYTE PRIMARY DILUTION STANDARD (50 µg/mL) – Prepare the
50-µg/mL Analyte PDS by volumetric dilution of the Analyte Stock Standard Solution (Sect. 7.2.3.1) in ethyl acetate to make a 50-µg/mL solution. The Analyte PDS is used to prepare calibration solutions. Care should be taken during storage to prevent evaporation. The Analyte PDS has been shown to be stable for 6 months when stored in an amber glass screw cap vial at !10 °C or less.
7.2.3.3 ANALYTE FORTIFICATION SOLUTION (5.0 to 50 µg/mL) – The Analyte
Fortification Solution contains all method analytes of interest in methanol. It is prepared by dilution of the Analyte Stock Standard Solutions and is used to fortify the LFBs, the LFSMs and the LFSMDs with method analytes. It is recommended
527-12
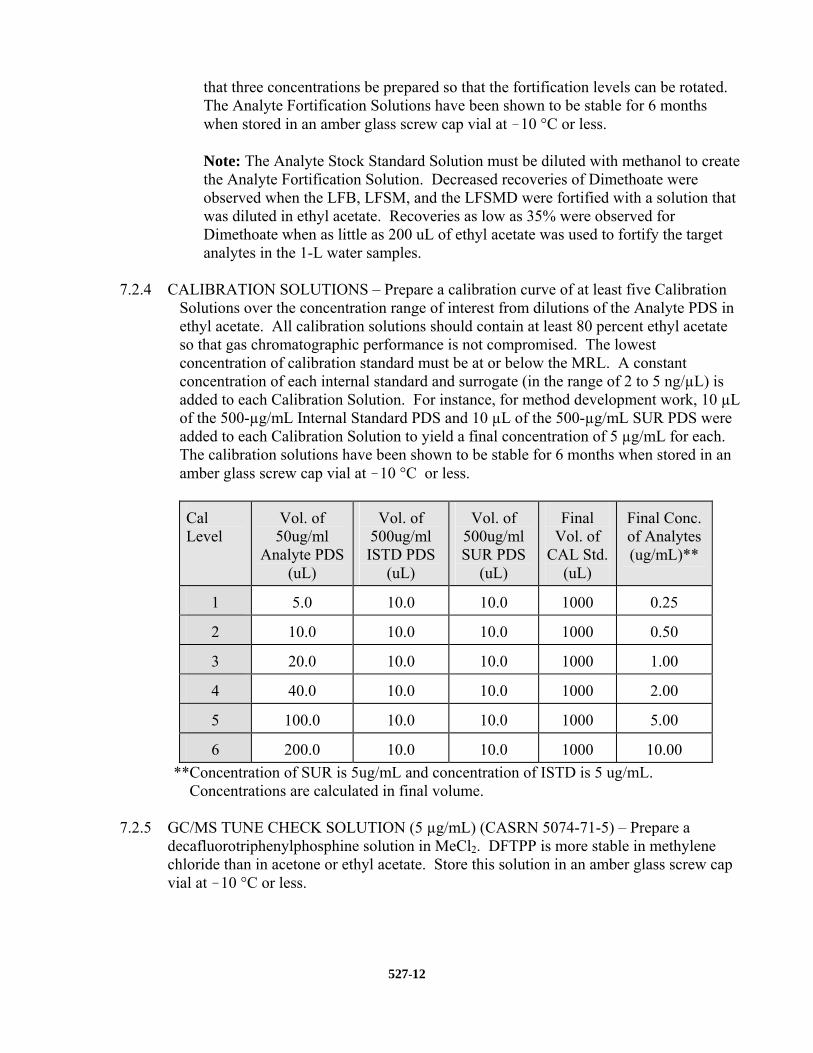
that three concentrations be prepared so that the fortification levels can be rotated. The Analyte Fortification Solutions have been shown to be stable for 6 months when stored in an amber glass screw cap vial at !10 °C or less.
Note: The Analyte Stock Standard Solution must be diluted with methanol to create the Analyte Fortification Solution. Decreased recoveries of Dimethoate were observed when the LFB, LFSM, and the LFSMD were fortified with a solution that was diluted in ethyl acetate. Recoveries as low as 35% were observed for Dimethoate when as little as 200 uL of ethyl acetate was used to fortify the target analytes in the 1-L water samples.
7.2.4 CALIBRATION SOLUTIONS – Prepare a calibration curve of at least five Calibration
Solutions over the concentration range of interest from dilutions of the Analyte PDS in ethyl acetate. All calibration solutions should contain at least 80 percent ethyl acetate so that gas chromatographic performance is not compromised. The lowest concentration of calibration standard must be at or below the MRL. A constant concentration of each internal standard and surrogate (in the range of 2 to 5 ng/µL) is added to each Calibration Solution. For instance, for method development work, 10 µL of the 500-µg/mL Internal Standard PDS and 10 µL of the 500-µg/mL SUR PDS were added to each Calibration Solution to yield a final concentration of 5 µg/mL for each. The calibration solutions have been shown to be stable for 6 months when stored in an amber glass screw cap vial at !10 °C or less.
Cal Level
Vol. of 50ug/ml
Analyte PDS (uL)
Vol. of 500ug/ml ISTD PDS
(uL)
Vol. of 500ug/ml SUR PDS
(uL)
Final Vol. of
CAL Std. (uL)
Final Conc. of Analytes (ug/mL)**
1 5.0 10.0 10.0 1000 0.25
2 10.0 10.0 10.0 1000 0.50
3 20.0 10.0 10.0 1000 1.00
4 40.0 10.0 10.0 1000 2.00
5 100.0 10.0 10.0 1000 5.00
6 200.0 10.0 10.0 1000 10.00 **Concentration of SUR is 5ug/mL and concentration of ISTD is 5 ug/mL. Concentrations are calculated in final volume.
7.2.5 GC/MS TUNE CHECK SOLUTION (5 µg/mL) (CASRN 5074-71-5) – Prepare a
decafluorotriphenylphosphine solution in MeCl2. DFTPP is more stable in methylene chloride than in acetone or ethyl acetate. Store this solution in an amber glass screw cap vial at !10 °C or less.

527-13
8. SAMPLE COLLECTION, PRESERVATION, AND STORAGE
8.1 SAMPLE BOTTLE PREPARATION
8.1.1 Grab samples must be collected in accordance with conventional sampling practices using a 1-liter or 1-quart amber bottle fitted with a PTFE-lined screw-cap.6 Some of the pyrethroid compounds photodegrade.
8.1.2 Preservation reagents, listed in the table below, are added to each sample bottle prior to
shipment to the field (or prior to sample collection).
Compound Amount Purpose
L-Ascorbic acid 0.10 g/L Dechlorination
Ethylenediaminetetraacetic acid, trisodium salt
0.35 g/L Inhibit metal-catalyzed hydrolysis of targets
Potassium dihydrogen citrate 9.4 g/L pH 3.8 buffer mixture, microbial inhibitor
8.1.2.1 Residual chlorine must be reduced at the time of sample collection with 100 mg of
ascorbic acid per liter. Sodium thiosulfate and sodium sulfite cannot be used because they were found to degrade target analytes. Sodium thiosulfate produced an extraneous sulfur peak and required more frequent instrument maintenance.
8.1.2.2 Trisodium EDTA (0.35 g/L) must be added to inhibit metal-catalyzed hydrolysis of
the target analytes, principally, esbiol, thiazopyr, malathion, chlorpyrifos, thiobencarb, parathion, terbufos-sulfone, vinclozolin, atrazine, and propazine.
8.1.2.3 The sample must be buffered to pH 3.8 using Potassium dihydrogen citrate (9.4
g/L). This is added to inhibit microbial degradation of analytes, and to reduce base catalyzed hydrolysis of some of the target analytes.
8.2 SAMPLE COLLECTION
8.2.1 Open the tap and allow the system to flush until the water temperature has stabilized
(usually approximately 3 to 5 minutes). Collect samples from the flowing system. 8.2.2 When sampling from an open body of water, fill a 1-L (or 1-quart) wide-mouth bottle or
1-L beaker with water sampled from a representative area, and carefully fill sample bottles from the container. Sampling equipment, including automatic samplers, must be free of plastic tubing, gaskets, and other parts that may leach interfering analytes into the water sample.
8.2.3 Fill sample bottles, taking care not to flush out the sample preservation reagents.
Samples do not need to be collected headspace free.

527-14
8.2.4 After collecting the sample, cap the bottle and agitate by hand until preservatives are dissolved. Keep the sample sealed from time of collection until extraction.
8.3 SAMPLE SHIPMENT AND STORAGE – Samples must be chilled during shipment and
must not exceed 10 °C during the first 48 hours after collection. Sample temperature must be confirmed to be at or below 10 °C when they are received at the laboratory. Samples stored in the lab must be held at or below 6 °C until extraction, but should not be frozen.
8.4 SAMPLE AND EXTRACT HOLDING TIMES – Results of the sample storage stability
study (Sect. 17, Table 7) indicated that most compounds listed in this method have adequate stability for 14 days when collected, dechlorinated, preserved, shipped and stored as described in Sections 8.1, 8.2, and 8.3. Water samples should be extracted as soon as possible but must be extracted within 14 days. Extracts must be stored at 0 °C or less and analyzed within 28 days after extraction. The extract storage stability study data are presented in Section 17, Table 8.
9. QUALITY CONTROL
9.1 QC requirements include the Initial Demonstration of Capability (IDC) and ongoing QC requirements that must be met when preparing and analyzing Field Samples. This section describes each QC parameter, their required frequency, and the performance criteria that must be met in order to meet EPA quality objectives. The QC criteria discussed in the following sections are summarized in Section 17, Tables 9 and 10. These QC requirements are considered the minimum acceptable QC criteria. Laboratories are encouraged to institute additional QC practices to meet their specific needs.
9.1.1 METHOD MODIFICATIONS – The analyst is permitted to modify GC columns, GC
conditions, evaporation techniques, internal standards or surrogate standards, and MS conditions. However, each time such method modifications are made, the analyst must repeat the procedures of the IDC.
9.2 INITIAL DEMONSTRATION OF CAPABILITY – The IDC must be successfully performed
prior to analyzing any Field Samples. Prior to conducting the IDC, the analyst must first generate an acceptable Initial Calibration following the procedure outlined in Section 10.2.
9.2.1 INITIAL DEMONSTRATION OF LOW SYSTEM BACKGROUND – Any time a new
lot of SPE cartridges or disks is used, it must be demonstrated that a Laboratory Reagent Blank is reasonably free of contamination and that the criteria in Section 9.3.1 are met.
9.2.2 INITIAL DEMONSTRATION OF PRECISION (IDP) – Prepare, extract, and analyze 4
to 7 replicate LFBs fortified near the midrange of the initial calibration curve according to the procedure described in Section 11. Sample preservatives as described in Section 8.1 must be added to these samples. The relative standard deviation (RSD) of the results of the replicate analyses must be less than 20 percent.
9.2.3 INITIAL DEMONSTRATION OF ACCURACY – Using the same set of replicate data
generated for Section 9.2.2, calculate average recovery. The average recovery of the replicate values must be within ± 30 percent of the true value.

9.2.4 MINIMUM REPORTING LEVEL (MRL) CONFIRMATION – Establish a target
concentration for the MRL based on the intended use of the method. Establish an Initial Calibration following the procedure outlined in Section 10.2. The lowest calibration standard used to establish the Initial Calibration (as well as the low-level Continuing Calibration Check standard) must be at or below the concentration of the MRL. Establishing the MRL concentration too low may cause repeated failure of ongoing QC requirements. Confirm or validate the MRL following the procedure outlined below.
9.2.4.1 Fortify, extract, and analyze seven replicate Laboratory Fortified Blanks (LFBs) at
the proposed MRL concentration. These LFBs must contain all method preservatives described in Section 8. Calculate the mean (Mean) and standard deviation for these replicates. Determine the Half Range for the prediction interval of results (HRPIR) using the equation below
HR SPIR = 3963.
where S is the standard deviation, and 3.963 is a constant value for seven replicates.(1)
9.2.4.2 Confirm that the upper and lower limits for the Prediction Interval of Result (PIR =
Mean + HRPIR) meet the upper and lower recovery limits as shown below
The Upper PIR Limit must be [150 percent recovery.
150% %100 ≤×+
ononcentratiFortifiedCHRMean PIR
The Lower PIR Limit must be m 50 percent recovery.
150% %100 ≤×−
ononcentratiFortifiedCHRMean PIR
9.2.4.3 The MRL is validated if both the Upper and Lower PIR Limits meet the criteria
described above (Sects. 9.2.4.2). If these criteria are not met, the MRL has been set too low and must be determined again at a higher concentration.
9.2.5 CALIBRATION CONFIRMATION – Analyze a Quality Control Sample as described in
Section 9.3.9 to confirm the accuracy of the standards/calibration curve.
527-15
9.2.6 DETECTION LIMIT DETERMINATION (optional) -- While DL determination is not a specific requirement of this method, it may be required by various regulatory bodies associated with compliance monitoring. It is the responsibility of the laboratory to determine if DL determination is required based upon the intended use of the data.
Replicate analyses for this procedure should be done over at least 3 days (both the sample extraction and the GC analyses should be done over at least 3 days). Prepare at least 7
replicate LFBs at a concentration estimated to be near the DL. This concentration may be estimated by selecting a concentration at 2-5 times the noise level. The DLs in Table 1 were calculated from LFBs fortified at various concentrations as indicated in the table. The appropriate fortification concentrations will be dependent upon the the sensitivity of the GC/MS system used. All preservation reagents listed in Section 8.1.2 must also be added to these samples. Analyze the seven replicates through all steps of Section 11.
NOTE: If an MRL confirmation data set meets these requirements, a DL may be calculated from the MRL confirmation data, and no additional analyses are necessary.
Calculate the DL using the following equation: )99.01 ,1( =−−×= αntsDL
where:
t (n-1, 1-α=0.99) = Student's t value for the 99% confidence level with n-1 degrees of freedom
n = number of replicates s = standard deviation of replicate analyses.
NOTE: Do not subtract blank values when performing DL calculations.
9.3 ONGOING QC REQUIREMENTS – This section summarizes the ongoing QC criteria that
must be followed when processing and analyzing Field Samples.
9.3.1 LABORATORY REAGENT BLANK (LRB) – An LRB is required with each extraction batch to confirm that potential background contaminants are not interfering with the identification or quantitation of target analytes. If the LRB produces a peak within the retention time window of any analyte that would prevent the determination of that analyte, determine the source of contamination and eliminate the interference before processing samples. Background contamination must be reduced to an acceptable level before proceeding. Background from method analytes or other contaminants that inter-fere with the measurement of method analytes must be below 1/3 of the MRL. Blank contamination may be estimated by extrapolation, if the concentration is below the lowest calibration standard. This procedure is not allowed for sample results as it may not meet data quality objectives. If the target analytes are detected in the LRB at concentrations equal to or greater than this level, then all data for the problem analyte(s) must be considered invalid for all samples in the extraction batch.
9.3.2 CONTINUING CALIBRATION CHECK (CCC) – CCC Standards are analyzed at the
beginning of each analysis batch, after every ten Field Samples, and at the end of the analysis batch. See Section 10.3 for concentration requirements and acceptance criteria.
527-16
9.3.3 LABORATORY FORTIFIED BLANK (LFB) – An LFB is required with each extraction batch. The fortified concentration of the LFB must be rotated between low, medium, and high concentrations from batch to batch. The low concentration LFB must be as near as
practical to, but no more than two times the MRL. Similarly, the high concentration LFB should be near the high end of the calibration range established during the initial cal-ibration (Sect. 10.2). Results of the low-level LFB analyses must be 50 to 150 percent of the true value. Results of the medium and high-level LFB analyses must be 70 to 130 percent of the true value. If the LFB results do not meet these criteria for target analytes, then all data for the problem analyte(s) must be considered invalid for all sam-ples in the extraction batch.
9.3.4 MS TUNE CHECK – A complete description of the MS Tune Check is found in Section
10.2.1. Acceptance criteria for the MS Tune Check is summarized in Section 17, Table 1. The MS Tune Check must be performed each time a major change is made to the mass spectrometer, and prior to establishing and/or re-establishing an initial calibration (Sect. 10.2). In this method daily DFTPP analysis is not required.
9.3.5 INTERNAL STANDARDS (IS) --The analyst must monitor the peak area of the IS in all
injections during each analysis day. The IS response (peak area) in any chromatographic run must not deviate from the response in the most recent CCC by more than 30%, and must not deviate by more than 50% from the area measured during initial analyte calibration. If the IS area in a chromatographic run does not meet these criteria, inject a second aliquot of that extract.
9.3.5.1 If the reinjected aliquot produces an acceptable internal standard response, report
results for that aliquot. 9.3.5.2 If the reinjected extract fails again, the analyst should check the calibration by
reanalyzing the most recently acceptable calibration standard. If the calibration standard fails the criteria of Section 10.3, recalibration is in order per Section10.2. If the calibration standard is acceptable, extraction of the sample may need to be repeated provided the sample is still within the holding time. Otherwise, report results obtained from the reinjected extract, but annotate as suspect. Alternatively, collect a new sample and re-analyze.
9.3.6 SURROGATE RECOVERY – The surrogate standard is fortified into the aqueous
portion of all samples, LRBs, CCCs, LFSMs, and LFSMDs prior to extraction. It is also added to the calibration standards. The surrogate is a means of assessing method performance from extraction to final chromatographic measurement. Calculate the recovery (%R) for the surrogate using the equation
100% ×⎟⎠⎞
⎜⎝⎛=
BAR
where A = calculated surrogate concentration for the QC or Field Sample, and B = fortified concentration of the surrogate.
527-17
9.3.6.1 Surrogate recovery must be in the range of 70 – 130%. When surrogate recovery from a sample, blank, or CCC is less than 70 percent or greater than 130 percent, check 1) calculations to locate possible errors, 2) standard solutions for degradation,
3) contamination, and 4) instrument performance. Correct the problem and reanalyze the extract.
9.3.6.2 If the extract reanalysis meets the surrogate recovery criterion, report only data for
the reanalyzed extract. 9.3.6.3 If the extract reanalysis fails the 70 to 130 percent recovery criterion, the analyst
should check the calibration by injecting the last calibration standard that passed. If the calibration standard fails the criteria of Section 9.3.6.1., recalibration is in order per Section 10.2. If the calibration standard is acceptable, extraction of the sample should be repeated provided the sample is still within the holding time. If the re-extracted sample also fails the recovery criterion, report all data for that sample as suspect/surrogate recovery to inform the data user that the results are suspect due to surrogate recovery.
9.3.7 LABORATORY FORTIFIED SAMPLE MATRIX (LFSM) – Analysis of an LFSM is
required in each extraction batch and is used to determine that the sample matrix does not adversely affect method accuracy. If the occurrence of target analytes in the samples is infrequent, or if historical trends are unavailable, a second LFSM or LFSMD must be prepared, extracted, and analyzed from a duplicate Field Sample used to prepare the LFSM to assess method precision. Extraction batches that contain LFSMDs do not require the analysis of a Field Duplicate (Sect. 9.3.8). If a variety of different sample matrices are analyzed regularly, for example, drinking water from groundwater and surface water sources, method performance should be established for each. Over time, LFSM data should be documented for all routine sample sources for the laboratory.
9.3.7.1 Within each extraction batch, a minimum of one Field Sample is fortified as an
LFSM for every 20 samples extracted. The LFSM is prepared by spiking a sample with an appropriate amount of the Analyte Fortification Solution (Sect. 7.2.3.3). Select a spiking concentration that is greater than or equal to the matrix background concentration, if known. Use historical data and rotate through the designated concentrations when selecting a fortifying concentration.
9.3.7.2 Calculate the percent recovery (%R) for each analyte using the equation
where A = measured concentration in the fortified sample, B = measured concentration in the unfortified sample, and C = fortification concentration.
( ) 100% ×
−=
CBAR
527-18
9.3.7.3 Analyte recoveries may exhibit matrix bias. For samples fortified at or above their native concentration, recoveries should range between 70 and 130 percent, except for low-level fortification near or at the MRL (within a factor of 2-times the MRL concentration) where 50 to 150 percent recoveries are acceptable. If the accuracy of any analyte falls outside the designated range, and the laboratory performance for that analyte is shown to be in control in the CCCs, the recovery is judged to be ma-trix biased. The result for that analyte in the unfortified sample is labeled suspect/ matrix to inform the data user that the results are suspect due to matrix effects.

9.3.8 FIELD DUPLICATE OR LABORATORY FORTIFIED SAMPLE MATRIX
DUPLICATE (FD or LFSMD) – Within each extraction batch, a minimum of one Field Duplicate (FD) or Laboratory Fortified Sample Matrix Duplicate (LFSMD) must be analyzed. Duplicates check the precision associated with sample collection, preservation, storage, and laboratory procedures. If target analytes are not routinely observed in Field Samples, an LFSMD should be analyzed rather than an FD.
9.3.8.1 Calculate the relative percent difference (RPD) for duplicate measurements (FD1
and FD2) using the equation
( ) 1002/21
21×
+−
=FDFD
FDFDRPD
9.3.8.2 RPDs for Field Duplicates should be ñ 30 percent. Greater variability may be
observed when Field Duplicates have analyte concentrations that are within a factor of 2 of the MRL. At these concentrations Field Duplicates should have RPDs that are ñ 50 percent. If the RPD of any analyte falls outside the designated range, and the laboratory performance for that analyte is shown to be in control in the CCC, the recovery is judged to be matrix biased. The result for that analyte in the unfortified sample is labeled suspect/matrix to inform the data user that the results are suspect due to matrix effects.
9.3.8.3 If an LFSMD is analyzed instead of a Field Duplicate, calculate the relative percent
difference (RPD) for duplicate LFSMs (LFSM and LFSMD) using the equation
( ) 1002/×
+−
=LFSMDLFSM
LFSMDLFSAMRPD
9.3.8.4 RPDs for duplicate LFSMs should be ñ 30 percent for samples fortified at or above
their native concentration. Greater variability may be observed when LFSMs are fortified at analyte concentrations that are within a factor of 2 of the MRL. LFSMs fortified at these concentrations should have RPDs that are ñ 50 percent for samples fortified at or above their native concentration. If the RPD of any analyte falls outside the designated range, and the laboratory performance for that analyte is shown to be in control in the CCC, the recovery is judged to be matrix biased. The result for that analyte in the unfortified sample is labeled suspect/matrix to inform the data user that the results are suspect due to matrix effects.
527-19
9.3.9 QUALITY CONTROL SAMPLES (QCS) – As part of the IDC (Sect. 9.2), each time a new Analyte PDS (Sect. 7.2.3.2) is prepared, and at least quarterly, analyze a QCS sample from a source different from the source of the calibration standards. If a second vendor is not available then a different lot of the standard should be used. The QCS should be prepared and analyzed just like a CCC. Acceptance criteria for the QCS is identical to the CCCs; the calculated amount for each analyte must be ± 30 percent of the expected value. If measured analyte concentrations are not of acceptable accuracy, check the entire analytical procedure to locate and correct the problem.

527-20
10. CALIBRATION AND STANDARDIZATION
10.1 Demonstration and documentation of acceptable mass spectrometer tune and initial calibration is required before any samples are analyzed. After the initial calibration is successful, a con-tinuing calibration check is required at the beginning and end of each period in which analyses are performed, and after every tenth sample. Verification of mass spectrometer tune must be repeated each time a major instrument modification is made or maintenance is performed, and prior to analyte calibration.
10.2 INITIAL CALIBRATION
10.2.1 MS TUNE/MS TUNE CHECK– Calibrate the mass and abundance scales of the MS with
calibration compounds and procedures prescribed by the manufacturer with any modifi-cations necessary to meet tuning requirements. Inject 5 ng or less of the DFTPP solution (Sect. 7.2.5) into the GC/MS system. Acquire a mass spectrum that includes data for m/z 45 to 450. Use a single spectrum of the DFTPP peak, an average spectrum of the three highest points of the peak, or an average spectrum across the entire peak to evaluate the performance of the system. If the DFTPP mass spectrum does not meet all criteria in Table 1, the MS must be retuned and adjusted to meet all criteria before proceeding with the initial calibration.
10.2.2 INSTRUMENT CONDITIONS – Operating conditions are described below. Conditions
different from those described may be used if QC criteria in Section 9 are met. Different conditions include alternate GC columns, temperature programs, MS conditions, and injection techniques and volume, such as cold on-column and direct injection port liners and/or large volume injection techniques. Equipment designed for alternate types of injections must be used if these options are selected.
10.2.2.1 Inject a 1-µL aliquot into a hot, splitless injection port held at 250 EC with a split
delay of 1 minute. The temperature program is as follows: initial oven temperature of 55 EC, hold for 0 minutes, ramp at 20 EC/min to 200 EC, hold for 2 minutes, ramp at 4 EC/min to a final temperature of 300 EC and hold for 0.75 minute. Total run time is approximately 35 minutes. Begin data acquisition at 4.4 minutes.
Note: The GC was operated in a constant flow rate mode at a rate of 1.4 mL per
minute and an initial head-pressure of 12.0 psi. 10.2.2.2 Target compounds can exhibit decreased sensitivity for low-level injections due to
degradation or irreversible adsorption in the injector port. Deactivated glass or quartz inlet liners are recommended. A loss in response for BDE-47, BDE-99, BDE-100, BDE-153, fenvalerate, esfenvalerate, hexazinone, nitrophen, norflurazon, and parathion are generally a result of degradation or adsorption occurring in the inlet liner or on the inlet seal. A loss in response for the lower molecular weight target analytes such as vinclozolin, prometryn, bromacil and chlorpyrifos can usually be attributed to degradation of the first meter of the GC column.

10.2.2.3 MS Detection and Sensitivity –Adjust the cycle time to measure at least five or more spectra during the elution of each GC peak. Ten to 15 scans across each GC peak are recommended. The scan range can be set from m/z 45-670 for the entire chromatographic run provided that there are enough scans across each GC peak at the method reporting limit.
10.2.2.3.1 An alternate approach that was used during method development is to establish
two scan ranges. Acquire data from a suggested range of m/z 45 – 450 with a total cycle time (including scan overhead time) of 1.0 second or less for the first 19 minutes of the run. Adjust the scan range to m/z 45 – 670 for the final 16 minutes of the run. If this approach is taken, the analyst must ensure that the scan range is changed just prior to the elution of the third internal standard peak (chrysene-d12). The time at which the increased scan range occurs will be dependent on chromatographic parameters.
10.2.3 CALIBRATION SOLUTIONS – Prepare a set of at least five calibration standards as
described in Section 7.2.4. The lowest concentration of the calibration standard must be at or below the MRL, which will depend on system sensitivity. The MRL must be confirmed using the procedure outlined in Section 9.2.4 after establishing the initial calibration. Acceptable calibration over a large dynamic range, greater than about 40-fold, may require more than one calibration curve. If this approach is taken, each curve must contain at least 5 calibration standards. In addition, Field Samples must be quantitated using the same number of curves over the same concentration range used to collect the IDC data (Sect. 9.2).
10.2.4 CALIBRATION – The GC/MS system is calibrated using the internal standard tech-
nique. Concentrations may be calculated through the use of an average relative response factor (RRF) or through the use of a calibration curve. Calculate the RRFs using the equation
RRFA QA Q
x is
is x=
( )( )( )( )
where
Ax = integrated peak area of the analyte, Ais = integrated peak area of the internal standard, Qx = quantity of analyte injected in ng or concentration units, Qis = quantity of internal standard injected in ng or concentration units, and RRF = relative response factor.
Average RRF calibrations may only be used if the RRF values over the calibration range are relatively constant.
527-21
10.2.4.1 Suggested quantitation ions are designated in Table 2. Some of the polybrominated diphenyl ethers have ions at higher mass that may offer better selectivity. Quantitation at high m/z values, however, can suffer from imprecision due to mass defect associated with halogenated compounds on some mass spectrometers. This is observed as irregular, jagged extracted ion peak shapes.

527-22
10.2.5 As an alternative to calculating average RRFs and applying the RSD test, use the GC/MS
data system software to generate a linear regression or quadratic calibration curve. Forc-ing the calibration curve through the origin is not recommended. Examples of common GC/MS system calibration curve options are: 1) Ax/Ais vs. Qx/Qis, and 2) RRF vs. Ax/Ais.
10.2.6 CALIBRATION ACCEPTANCE CRITERIA- Acceptance criteria for the calibration of
each analyte is determined by calculating the concentration of each analyte and surrogate in each of the analyses used to generate the calibration curve or average RRF. Each calibration point, except the lowest point, for each analyte should calculate to be 70 to 130 percent of its true value. The lowest point should calculate to be 50 to 150 percent of its true value. If these criteria cannot be met, the analyst will have difficulty meeting ongoing QC criteria. It is recommended that corrective action is taken to reanalyze the calibration standards, restrict the range of calibration, or select an alternate method of calibration. The data presented in this method were obtained using quadratic fits. Quadratic fit calibrations should be used with caution, because the non-linear area of the curve may not be reproducible.
10.3 CONTINUING CALIBRATION CHECK (CCC) – The CCC verifies the initial calibration at
the beginning and end of each group of analyses, and after every tenth sample during analyses. In this context, a “sample” is considered to be a Field Sample. The LRBs, LFBs, LFMs, LFMDs and CCCs are not counted as samples. The beginning CCC for each analysis batch must be at or below the MRL in order to verify instrument sensitivity prior to any analyses. If standards have been prepared such that all analytes are not in the same calibration standard (or all low CAL points are not in the same CAL standard), it may be necessary to analyze more than one CCC to meet this requirement. Alternatively, it may be cost effective to prepare or obtain a customized standard to meet this criteria. Subsequent CCCs should alternate between a medium and high concentration.
10.3.1 Inject an aliquot of the appropriate concentration calibration solution and analyze with
the same conditions used during the initial calibration. 10.3.2 Determine that the absolute areas of the quantitation ions of the internal standards have
not changed by more than ± 30 percent from the average area measured during initial calibration. If any IS area has changed by more this amount, remedial action must be taken (Sect. 10.3.4). Control charts are useful aids in documenting system sensitivity changes.
10.3.3 Calculate the concentration of each analyte and surrogate in the check standard. The
calculated amount for each analyte for medium and high level CCCs must be ± 30 percent of the true value. The calculated amount for the lowest calibration level for each analyte, which must be at a concentration less than or equal to the MRL, must be within ± 50 percent of the true value. If these criteria are not met, then all data for the problem analyte must be considered invalid, and remedial action (Sect. 10.3.4) should be taken which may require recalibration. Any Field Sample extracts that have been analyzed since the last acceptable calibration verification should be reanalyzed after adequate calibration has been restored, with the following exception. If the continuing calibration fails because the calculated concentration is greater than 130 percent (150

527-23
percent for the low-level CCC) for a particular target compound, and Field Sample extracts show no detection for that target compound, non-detects may be reported without re-analysis.
10.3.4 REMEDIAL ACTION – Failure to meet CCC QC performance criteria may require
remedial action. Major maintenance such as cleaning an ion source, cleaning the mass analyzer, replacing filament assemblies, replacing or shortening GC columns, etc., require returning to the initial calibration step (Sect. 10.2).
11. PROCEDURE
11.1 Important aspects of this analytical procedure include proper preparation of laboratory glassware, sample containers (Sect. 4.1), and sample collection and storage (Sect. 8). This section describes the procedures for sample preparation, solid phase extraction (SPE) using disks, and extract analysis.
11.2 SAMPLE BOTTLE PREPARATION
11.2.1 Samples are preserved, collected and stored as presented in Section 8. All field and QC
samples must contain the preservatives listed in Section 8.1.2, including the LRB and LFB. Before extraction, mark the level of the sample on the outside of the sample bottle for later sample volume determination. If using weight to determine volume (Sect. 11.3.8), weigh the bottle with collected sample before extraction.
11.2.2 Add an aliquot of the SUR PDS (Sect. 7.2.2.1) to each sample to be extracted. For
method development work, a 10-µL aliquot of the 500-µg/mL SUR PDS was added to 1 L for a final concentration of 5.0 µg/L.
11.2.3 If the sample is an LFB, LFSM, or LFSMD, add the necessary amount of Analyte Fortifi-
cation Solution (Sect. 7.2.3.3). Swirl each sample to ensure all components are mixed. The analyte fortification solution should be prepared in methanol for reasons stated in Section 7.2.3.3.
11.2.4 Proceed with sample extraction using SPE disks (Sect. 11.3).
11.3 DISK SPE PROCEDURE – The disk extraction procedure may be carried out in a manual
mode or by using a robotic or automatic sample preparation device. This section describes the disk SPE procedure using the equipment outlined in Section 6.9 in its simplest, least expensive mode without the use of a robotics system. The manual mode described below was used to collect data presented in Section 17. The use of a robotics system is allowed; however, extraction and/or elution steps may not be changed or omitted to accommodate the use of an automated system.
11.3.1 SAMPLE PREPARATION – Prepare the samples as described in Section 11.2. 11.3.2 DISK CLEANUP – Assemble the extraction glassware onto the vacuum manifold,
placing disks on a support screen between the funnel and base. Add a 5-mL aliquot of a 1:1 mixture of EtOAc and MeCl2, drawing about half through the disk, and allowing the
527-24
solvent to soak the disk for about a minute. Draw the remaining solvent through the disk to waste until the disk is dry of solvent.
11.3.3 DISK CONDITIONING – The conditioning step is critical for recovery of analytes and
can have a marked effect on method precision and accuracy. Once the conditioning has begun, the disk must not go dry until the last portion of the sample passes, because ana-lyte and surrogate recoveries may be affected. If the disk goes dry during the condition-ing phase, the conditioning must be started over. The analyst should note premature drying of the solid phase, because the sample may require re-extraction due to low surro-gate (and analyte) recoveries. During conditioning, it is not unusual for the middle of the solid phase disk to form a wrinkle. This typically does not adversely affect extraction.
11.3.3.1 CONDITIONING WITH METHANOL – Add approximately 10 mL of MeOH to
each disk. Pull about 1 mL of MeOH through the disk and turn off the vacuum temporarily to let the disk soak for about one minute. Draw most of the remaining MeOH through the disk, but leave a layer of MeOH on the surface of the disk. The disk must not be allowed to go dry from this point until the end of the sample extraction.
11.3.3.2 CONDITIONING WITH WATER – Follow the MeOH rinse with two 10-mL
aliquots of reagent water, being careful to keep the water level above the disk surface. Turn off the vacuum.
11.3.4 DISK EXTRACTION – Add the sample to the extraction funnel containing the
conditioned disk and turn on the vacuum. Adjust the flow rate to 10 – 15 mL/min. Do not let the disk go dry before all of the sample has been extracted. Drain as much water from the sample container as possible. After all the sample has passed, pull air through the disk by maintaining full vacuum (minus 10 to 15 in. Hg) for 10 minutes. If the disk is dried for a period much longer than 10 minutes, there will be a loss of recovery for the surrogate 1,3-dimethyl-2-nitrobenzene. After drying, turn off and release the vacuum.
11.3.5 DISK ELUTION – Detach the glassware base from the manifold without disassembling
the funnel from the base. Dry the underside of the base. Insert collection tubes into the manifold to catch the extracts as they are eluted from the disk. The collection tube must fit around the drip tip of the base to ensure collection of all the eluent. Reattach the base to the manifold. Add 5 mL of EtOAc to the empty sample bottle and thoroughly rinse the inside of the bottle. Transfer the EtOAc to the disk and, with vacuum, pull enough EtOAc into the disk to soak the sorbent. Allow the solvent to soak the disk for about one minute. Using a vacuum, pull the remaining solvent slowly (dropwise) through the disk into the collection tube. Next, add 5 mL of MeCl2 to the empty sample bottle and thoroughly rinse the inside of the bottle. Transfer the MeCl2 to the disk and, with vacuum, pull enough methylene chloride into the disk to soak the sorbent. Allow the solvent to soak the disk for about one minute. Pull the remaining solvent slowly through the disk into the collection tube. Rinse the SPE funnel surface with a 5-mL aliquot of 1:1 EtOAc/MeCl2 and pull the solvent slowly through the disk into the collection tube. Repeat this last rinse of the SPE funnel. Detach glassware from manifold and remove collection tube from the manifold.
527-25
11.3.6 DRYING OF THE EXTRACT – Small amounts of residual water from the sample container and solid phase may form an immiscible layer with the solvent in the extract. Set up a drying column (Sect. 6.6) packed with about 5 - 7 grams of anhydrous sodium sulfate. Pre-rinse the sodium sulfate column with about 2 mL of 1:1 EtOAc/MeCl2. Place a clean collection tube that can hold at least 30 mL beneath the drying column. Add the entire extract to the column and follow with two 3-mL aliquots of 1:1 EtOAc/MeCl2.
11.3.6.1 Extracts should be examined visually for water droplets after drying. Extracts that
contain water have been noted to rapidly degrade the inertness of the GC inlet and the head of the GC column requiring much more frequent maintenance.
11.3.7 EXTRACT CONCENTRATION – Concentrate the extract to about 0.7 mL under a
gentle stream of nitrogen in a warm water bath (at ~ 40 oC). Do not blow down samples to less than 0.5 mL, because the most volatile compounds (dimethoate, and 1,3-dimethyl-2-nitrobenzene) will exhibit diminished recovery. Transfer the extract to a 1-mL volumetric flask and add the internal standard (method development used 10 µL of 500-µg/mL IS PDS for an extract concentration of 5 µg/mL). Rinse the collection tube that held the dried extract with small amounts of EtOAc and add to the volumetric flask to bring the volume up to the 1-mL mark. Transfer to an autosampler vial.
11.3.8 SAMPLE VOLUME OR WEIGHT DETERMINATION – Use a graduated cylinder to
measure the volume of water required to fill the original sample bottle to the mark made prior to extraction (Sect. 11.2.1). Determine volume to the nearest 10 mL for use in the final calculations of analyte concentration (Sect. 12.2). If using weight to determine volume, reweigh empty sample bottle. From the weight of the original sample bottle measured in Section 11.2.1, subtract the empty bottle weight. Use this value for analyte concentration calculations in Section 12.2.
11.4 ANALYSIS OF SAMPLE EXTRACTS
11.4.1 Establish operating conditions as described in Section 10.2.2. Confirm that compound separation and resolution are similar to those summarized in Table 2 and Figure 1 (Sect. 17).
11.4.2 Establish a valid initial calibration following the procedures outlined in Section 10.2 or
confirm that the calibration is still valid by running a CCC as described in Section 10.3. If establishing an initial calibration for the first time, complete the IDC as described in Section 9.2.
11.4.3 Analyze aliquots of Field and QC Samples at appropriate frequencies (Sect. 9) with the
GC/MS conditions used to acquire the initial calibration and/or the CCC. At the conclu-sion of data acquisition, use the same software that was used in the calibration procedure to tentatively identify peaks in predetermined retention time windows of interest. Use the data system software to examine the ion abundances of components of the chromato-gram.

527-26
11.4.4 COMPOUND IDENTIFICATION – Identify a sample component by comparison of its mass spectrum (after background subtraction if necessary) to a reference spectrum in the user-created database.
11.4.4.1 Establish an appropriate retention time window for each target analyte, internal
standard and surrogate standard to identify them in QC and Field Sample chromat-ograms. Ideally, the retention time window should be based on measurements of actual retention time variation for each compound in standard solutions collected on each GC/MS over the course of time. The suggested variation is plus or minus three times the standard deviation of the retention time for each compound for a series of injections. The injections from the initial calibration and from the IDC (Sect. 9.2) may be used to calculate a suggested window size. However, the experience of the analyst should weigh heavily on the determination of an appropriate retention window size.
11.4.4.2 In general, all ions that are present above 30 percent relative abundance in the mass
spectrum of the standard should be present in the mass spectrum of the sample component and should agree within an absolute 20 percent. For example, if an ion has a relative abundance of 30 percent in the standard spectrum, its abundance in the sample spectrum should be in the range of 10 to 50 percent. Some ions, particularly the molecular ion, are of special importance, and should be evaluated even if they are below 30 percent relative abundance.
11.4.4.3 Identification is hampered when sample components are not resolved
chromatographically and produce mass spectra containing ions contributed by more than one analyte. When GC peaks obviously represent more than one sample component (i.e., broadened peak with shoulder(s) or valley between two or more maxima), appropriate analyte spectra and background spectra can be selected by examining plots of characteristic ions. When analytes coelute (i.e., only one GC peak is apparent), the identification criteria can be met but each analyte spectrum will contain extraneous ions contributed by the coeluting compound
12. DATA ANALYSIS AND CALCULATIONS
12.1 Identify method analytes present in the Field and QC Samples as described in Section 11.4.4. Complete chromatographic resolution is not necessary for accurate and precise measurements of analyte concentrations if unique ions with adequate intensities are available for quantitation.
12.1.1 In validating this method, concentrations were calculated by measuring the characteristic
ions listed in Table 2 (Sect. 17). Other ions may be selected at the discretion of the analyst.
12.2 Calculate analyte and surrogate concentrations, using the multipoint calibration established in
Section 10.2. Do not use daily continuing calibration check data to quantitate analytes in samples. Adjust the final analyte concentrations to reflect the actual sample volume or weight determined in Section 11.3.8. Field Sample extracts that require dilution should be treated as described in Section 12.3.

527-27
12.3 EXCEEDING CALIBRATION RANGE – An analyst must not extrapolate beyond the
established calibration range. If an analyte result exceeds the range of the initial calibration curve, the extract may be diluted with EtOAc, with the appropriate amount of internal standard added to match the original level, and the diluted extract injected. Acceptable surrogate performance (Sect. 9.3.6) should be determined from the undiluted sample extract. Incorporate the dilution factor into final concentration calculations. The resulting sample should be documented as a dilution, and MRLs should be adjusted accordingly.
. 12.4 Calculations must utilize all available digits of precision, but final reported concentrations
should be rounded to an appropriate number of significant figures (one digit of uncertainty), typically two, and not more than three significant figures .
NOTE: Some data in Section 17 of this method are reported with more than 2 significant figures. This is done to better illustrate the method performance data.
13. METHOD PERFORMANCE
13.1 PRECISION, ACCURACY, AND MINIMUM REPORTING LEVELS – Tables for these data are presented in Section 17. Lowest Concentration MRLs for each target analyte are presented in Table 3. This involved preparing, extracting, and analyzing seven replicates at five concentrations (0.1, 0.2, 0.35, 0.5, and 1.0 µg/L) and then calculating the LCMRL following the procedure described in reference 1. Detection Limits (DLs) were determined following the procedure outlined in Section 9.2.6. The DLs are included in Table 3 for comparison. Single laboratory precision and accuracy data are presented in Tables 4-6.
13.2 POTENTIAL PROBLEM COMPOUNDS
13.2.1 MATRIX ENHANCED SENSITIVITY – Fenvalerate, Esfenvalerate, Nitrophen, Parathion and to a lesser extent, Norflurazon can exhibit “matrix-induced chromatographic response enhancement.”7-11 Compounds that exhibit this phenomenon often give analytical results that exceed 100% recovery in fortified extracts at low concentrations and in continuing calibration checks. If this is observed, more frequent recalibration will be required. It has been proposed that these compounds are susceptible to GC inlet absorption or thermal degradation so that analytes degrade more when injected in a “cleaner” matrix. The injection of a “dirty” sample extract coats surfaces with matrix components and “protects” the problem compounds from decomposition or adsorption. As a result, a relatively greater response is observed for analytes in sample extracts than in calibration solutions. This effect is minimized by using deactivated injection liners, and by minimizing the liner volume as much as is practical (Sect. 6.12.2). The analyst may also choose to condition the injection port after maintenance by injecting a few aliquots of a field sample extract prior to establishing an initial calibration. Preparation of calibration standards in clean sample extracts is not allowed.
13.2.2 As the injector becomes dirty, the analyst may note a fall-off in response for the later
eluting compounds. During method development, some of the analytes lost as much as 50% of their response over the course of 150 – 200 injections. This required recalibration

527-28
and/or routine maintenance. If routine maintenance is put off too long, the analyst may experience difficulty meeting the low-level CCC recovery criteria (at the MRL concentration).
13.2.3 Kepone can be problematic. It occasionally exhibited recoveries below 70%.
Dimethoate exhibited unacceptable recoveries in the LFSMs if it was fortified in EtOAc. This was the reason that the Analyte Fortification Solution is prepared in methanol (Sect. 7.2.3.3).
13.3 SAMPLE STORAGE STABILITY STUDIES – An analyte storage stability study was
conducted by fortifying the analytes (5.0 Fg/L of each analyte) into chlorinated surface water samples that were collected, preserved, and stored as described in Section 8. The precision and average recovery of triplicate analyses, conducted on Days 0, 3, 7, and 14, are presented in Table 7.
13.4 EXTRACT STORAGE STABILITY STUDIES – Extract storage stability studies were
conducted on EtOAc extracts obtained from a chlorinated surface water fortified at 5.0 Fg/L. The precision and average recovery of triplicate injections are reported in Table 8.
14. POLLUTION PREVENTION
14.1 This method utilizes solid phase extraction to extract analytes from water. It requires the use
of very small volumes of organic solvent and very small quantities of pure analytes, thereby minimizing the potential hazards to both the analyst and the environment as compared to the use of large volumes of organic solvents in conventional liquid-liquid extractions.
14.2 For information about pollution prevention that may be applicable to laboratory operations,
consult “Less is Better: Laboratory Chemical Management for Waste Reduction” available from the American Chemical Society’s Department of Government Relations and Science Policy, 1155 16th Street N.W., Washington, D.C., 20036 or on-line at http://membership.acs.org/c/ccs/pub_9.htm.
15. WASTE MANAGEMENT
15.1 The analytical procedures described in this method generate relatively small amounts of waste since only small amounts of reagents and solvents are used. The matrices of concern are finished drinking water or source water. However, the Agency requires that laboratory waste management practices be conducted consistent with all applicable rules and regulations, and that laboratories protect the air, water, and land by minimizing and controlling all releases from fume hoods and bench operations. Also, compliance is required with any sewage discharge permits and regulations, particularly the hazardous waste identification rules and land disposal restrictions.
527-29
16. REFERENCES 1. Statistical Protocol for the Determination of the Single-Laboratory Lowest Concentration Minimum
Reporting Level (LCMRL) and Validation of the Minimum Reporting Level (MRL), available at www.epa.gov/OGWDW/methods/sourcalt.html
2. Glaser, J.A., D.L. Foerst, G.D. McKee, S.A. Quave, and W.L. Budde, "Trace Analyses for
Wastewaters”, Environ. Sci. Technol., 15 (1981) 1426_1435. 3. “Carcinogens - Working With Carcinogens,” Department of Health, Education, and Welfare, Public
Health Service, Center for Disease Control, National Institute for Occupational Safety and Health, Publication No. 77-206, Aug. 1977.
4. “OSHA Safety and Health Standards, General Industry,” (29CFR1910), Occupational Safety and
Health Administration, OSHA 2206, (Revised, January 1976). 5. “Safety in Academic Chemistry Laboratories,” American Chemical Society Publication, Committee
on Chemical Safety, 3rd Edition, 1979. 6. ASTM Annual Book of Standards, Part II, Volume 11.01, D3370-82, “Standard Practice for
Sampling Water,” American Society for Testing and Materials, Philadelphia, PA, 1986. 7. Erney, D.R., Gillespie, A.M., Gilvydis, D.M., and Poole, C.F., “Explanation of the Matrix-Induced
Chromatographic Response Enhancement of Organophosphorous Pesticides During Open Tubular Column Gas Chromatography with Splitless or Hot On-Column Injection and Flame Photometric Detection,” J. Chromatogr., 638 (1993) 57-63.
8. Mol, H.G.J., Althuizen, M., Janssen, H., and Cramers, C.A., Brinkman, U.A.Th., “Environmental
Applications of Large Volume Injection in Capillary GC Using PTV Injectors,” J. High Resol. Chromatogr., 19 (1996) 69-79.
9. Erney, D.R., Pawlowski, T.M., Poole, C.F., “Matrix Induced Peak Enhancement of Pesticides in Gas
Chromatography,” J. High Resol. Chromatogr., 20 (1997) 375-378. 10. Hajslova, J., Holadova, K. , Kocourek, V., Poustka, J., Godula, M., Cuhra, P., Kempny, M., “Matrix
Induced Effects: A Critical Point in the Gas Chromatographic Analysis of Pesticide Residues,” J. Chromatogr., 800 (1998) 283-295.
11. Wylie, P., Uchiyama, M., “Improved Gas Chromatographic Analysis of Organophosphorous
Pesticides with Pulsed Splitless Injection,” J. AOAC International, 79, 2, (1996) 571-577.

527-30
17. TABLES, DIAGRAMS, FLOWCHARTS AND VALIDATION DATA TABLE 1. ION ABUNDANCE CRITERIA FOR BIS(PERFLUOROPHENYL)PHENYL PHOSPHINE,(DECAFLUOROTRIPHENYL PHOSPHINE, DFTPP)
Mass (M/z)
Relative Abundance Criteria
Purpose of Checkpoint1
51 10-85% of base peak Low-mass sensitivity 68 < 2% of m/z 69 Low-mass resolution 70 < 2% of m/z 69 Low-mass resolution 127 10-80% of base peak Low- to mid-mass resolution 197 < 2% of m/z 198 Mid-mass resolution 198 Base peak or >50% of m/z 442 Mid-mass resolution and sensitivity 199 5-9% of m/z 198 Mid-mass resolution and isotope ratio 275 10-60% of base peak Mid- to high-mass sensitivity 365 > 0.5 of m/z 198 Baseline threshold 441 < 150% of m/z 443 High-mass resolution 442 Base peak or >30% of m/z 198 High-mass resolution and sensitivity 443 15-24% of m/z 442 High-mass resolution and isotope ratio
1All ions are used primarily to check the mass measuring accuracy of the mass spectrometer and data system, and this is the most important part of the performance test. The three resolution checks, which include natural abundance isotope ratios, constitute the next most important part of the performance test. The correct setting of the baseline threshold, as indicated by the presence of low intensity ions, is the next most important part of the test. Finally, the ion abundance ranges are designed to encourage some standardization to fragmentation patterns.
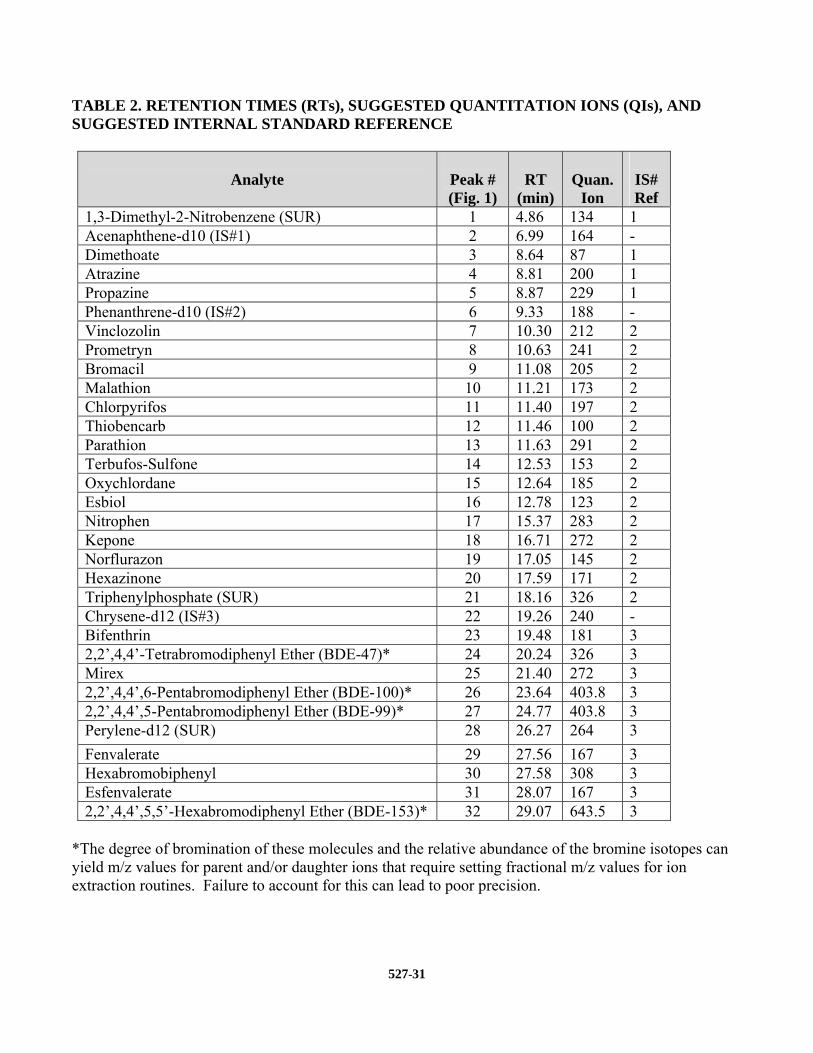
527-31
TABLE 2. RETENTION TIMES (RTs), SUGGESTED QUANTITATION IONS (QIs), AND SUGGESTED INTERNAL STANDARD REFERENCE
Analyte
Peak # (Fig. 1)
RT
(min)
Quan.
Ion
IS# Ref
1,3-Dimethyl-2-Nitrobenzene (SUR) 1 4.86 134 1 Acenaphthene-d10 (IS#1) 2 6.99 164 - Dimethoate 3 8.64 87 1 Atrazine 4 8.81 200 1 Propazine 5 8.87 229 1 Phenanthrene-d10 (IS#2) 6 9.33 188 - Vinclozolin 7 10.30 212 2 Prometryn 8 10.63 241 2 Bromacil 9 11.08 205 2 Malathion 10 11.21 173 2 Chlorpyrifos 11 11.40 197 2 Thiobencarb 12 11.46 100 2 Parathion 13 11.63 291 2 Terbufos-Sulfone 14 12.53 153 2 Oxychlordane 15 12.64 185 2 Esbiol 16 12.78 123 2 Nitrophen 17 15.37 283 2 Kepone 18 16.71 272 2 Norflurazon 19 17.05 145 2 Hexazinone 20 17.59 171 2 Triphenylphosphate (SUR) 21 18.16 326 2 Chrysene-d12 (IS#3) 22 19.26 240 - Bifenthrin 23 19.48 181 3 2,2’,4,4’-Tetrabromodiphenyl Ether (BDE-47)* 24 20.24 326 3 Mirex 25 21.40 272 3 2,2’,4,4’,6-Pentabromodiphenyl Ether (BDE-100)* 26 23.64 403.8 3 2,2’,4,4’,5-Pentabromodiphenyl Ether (BDE-99)* 27 24.77 403.8 3 Perylene-d12 (SUR) 28 26.27 264 3 Fenvalerate 29 27.56 167 3 Hexabromobiphenyl 30 27.58 308 3 Esfenvalerate 31 28.07 167 3 2,2’,4,4’,5,5’-Hexabromodiphenyl Ether (BDE-153)* 32 29.07 643.5 3
*The degree of bromination of these molecules and the relative abundance of the bromine isotopes can yield m/z values for parent and/or daughter ions that require setting fractional m/z values for ion extraction routines. Failure to account for this can lead to poor precision.
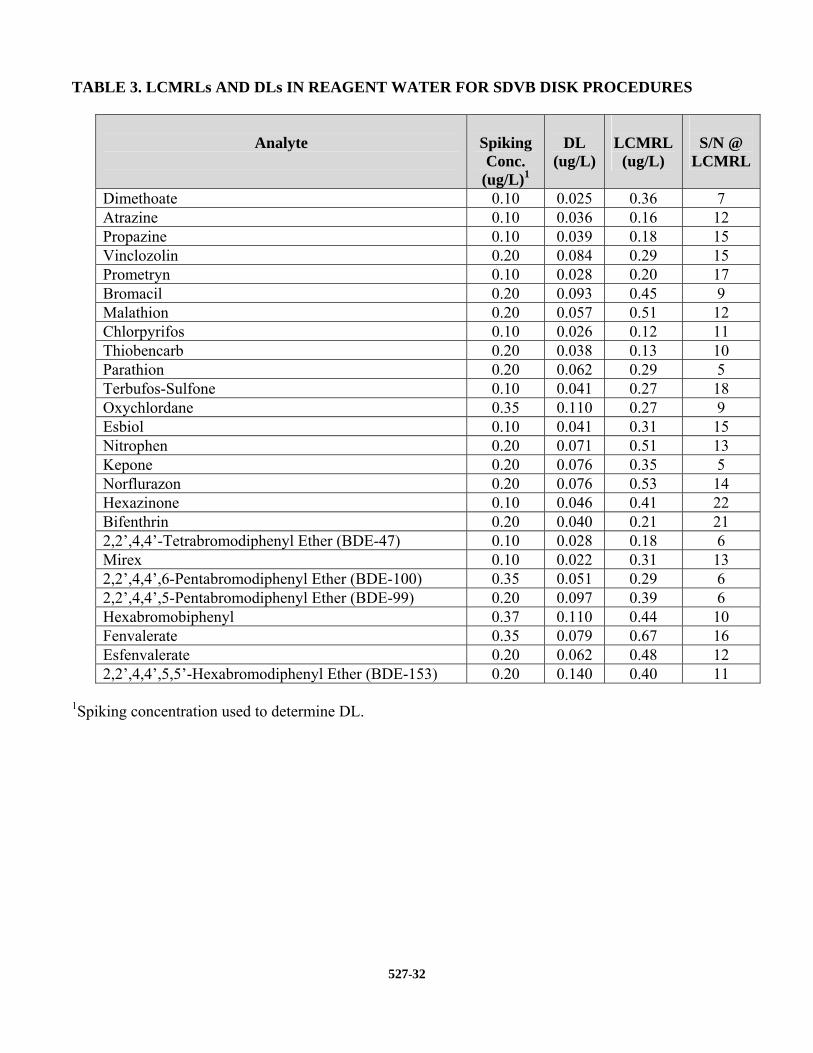
527-32
TABLE 3. LCMRLs AND DLs IN REAGENT WATER FOR SDVB DISK PROCEDURES
Analyte
Spiking Conc.
(ug/L)1
DL
(ug/L)
LCMRL
(ug/L)
S/N @
LCMRL
Dimethoate 0.10 0.025 0.36 7 Atrazine 0.10 0.036 0.16 12 Propazine 0.10 0.039 0.18 15 Vinclozolin 0.20 0.084 0.29 15 Prometryn 0.10 0.028 0.20 17 Bromacil 0.20 0.093 0.45 9 Malathion 0.20 0.057 0.51 12 Chlorpyrifos 0.10 0.026 0.12 11 Thiobencarb 0.20 0.038 0.13 10 Parathion 0.20 0.062 0.29 5 Terbufos-Sulfone 0.10 0.041 0.27 18 Oxychlordane 0.35 0.110 0.27 9 Esbiol 0.10 0.041 0.31 15 Nitrophen 0.20 0.071 0.51 13 Kepone 0.20 0.076 0.35 5 Norflurazon 0.20 0.076 0.53 14 Hexazinone 0.10 0.046 0.41 22 Bifenthrin 0.20 0.040 0.21 21 2,2’,4,4’-Tetrabromodiphenyl Ether (BDE-47) 0.10 0.028 0.18 6 Mirex 0.10 0.022 0.31 13 2,2’,4,4’,6-Pentabromodiphenyl Ether (BDE-100) 0.35 0.051 0.29 6 2,2’,4,4’,5-Pentabromodiphenyl Ether (BDE-99) 0.20 0.097 0.39 6 Hexabromobiphenyl 0.37 0.110 0.44 10 Fenvalerate 0.35 0.079 0.67 16 Esfenvalerate 0.20 0.062 0.48 12 2,2’,4,4’,5,5’-Hexabromodiphenyl Ether (BDE-153) 0.20 0.140 0.40 11
1Spiking concentration used to determine DL.

527-33
TABLE 4. PRECISION AND ACCURACY DATA FOR METHOD ANALYTES FORTIFIED
AT 1.0 AND 5.0 Fg/L IN REAGENT WATER EXTRACTED WITH SDVB DISKS
Concentration = 1.0 ug/L, n=5
Concentration = 5.0 ug/L, n=5
Analyte Mean % Recovery
%RSD Mean % Recovery
%RSD
Dimethoate 114 5.3 85.8 4.5 Atrazine 109 13 85.8 8.7 Propazine 94.6 9.1 82.3 9.1 Vinclozolin 116 5.0 93.8 6.0 Prometryn 106 4.1 85.6 5.6 Bromacil 127 5.1 103 5.7 Malathion 107 2.1 86.4 4.5 Chlorpyrifos 98.0 3.3 84.6 5.4 Thiobencarb 102 1.8 87.0 4.7 Parathion 107 4.1 87.4 5.1 Terbufos-Sulfone 111 4.2 93.2 4.3 Oxychlordane 106 3.9 84.0 6.0 Esbiol 119 4.1 97.2 5.2 Nitrophen 116 3.5 100 4.6 Kepone 103 4.3 82.8 4.3 Norflurazon 134 1.9 106 5.8 Hexazinone 120 7.0 94.1 6.8 Bifenthrin 102 1.8 78.7 4.3 2,2’,4,4’-Tetrabromodiphenyl Ether (BDE-47) 93.0 5.0 81.3 4.1 Mirex 93.0 3.4 75.4 4.7 2,2’,4,4’,6-Pentabromodiphenyl Ether (BDE-100) 93.4 8.1 83.6 3.9 2,2’,4,4’,5-Pentabromodiphenyl Ether (BDE-99) 98.4 8.6 86.8 5.4 Hexabromobiphenyl1 102 5.8 82.0 3.6 Fenvalerate 120 3.6 95.6 4.4 Esfenvalerate 111 3.4 86.3 4.8 2,2’,4,4’,5,5’-Hexabromodiphenyl Ether (BDE-153) 96.4 10 85.4 9.3 1,3-Dimethyl-2-Nitrobenzene (SUR) 92.6 3.2 87.7 9.1 Triphenylphosphate (SUR) 88.0 2.0 88.4 4.8 Perylene-d12 (SUR) 84.4 4.8 78.5 5.6 1Precision and accuracy determinations were obtained by using a technical mixture of Hexabromobiphenyl (Firemaster BP-6). Actual spiked concentrations for the isomer 2,2’,4,4’,5,5’-Hexabromobiphenyl are 0.74 Fg/L and 3.70 Fg/L, respectively.

527-34
TABLE 5. PRECISION AND ACCURACY DATA FOR METHOD ANALYTES FORTIFIED AT 1.0 AND 5.0 Fg/L IN SURFACE WATER EXTRACTED WITH SDVB DISKS
Concentration = 1.0
ug/L, n=5
Concentration = 5.0 ug/L, n=5
Analyte Mean % Recovery
%RSD Mean % Recovery
%RSD
Dimethoate 112 2.7 89.3 2.6 Atrazine 106 4.5 102 2.9 Propazine 92.4 6.3 89.8 4.1 Vinclozolin 115 4.7 103 6.0 Prometryn 101 2.9 91.0 4.9 Bromacil 119 2.1 104 3.2 Malathion 106 2.5 95.4 4.0 Chlorpyrifos 94.6 2.4 91.1 4.8 Thiobencarb 96.0 2.7 95.0 4.5 Parathion 105 2.1 93.8 4.7 Terbufos-Sulfone 107 1.6 97.3 4.6 Oxychlordane 94.4 4.9 90.6 3.4 Esbiol 114 2.6 104 4.8 Nitrophen 111 2.7 98.8 3.7 Kepone 91.4 5.0 88.1 4.0 Norflurazon 122 4.8 105 3.2 Hexazinone 120 2.2 101 3.1 Bifenthrin 96.8 2.4 89.8 5.1 2,2’,4,4’-Tetrabromodiphenyl Ether (BDE-47) 92.6 6.3 88.8 2.9 Mirex 79.6 5.4 86.6 5.6 2,2’,4,4’,6-Pentabromodiphenyl Ether (BDE-100) 95.8 5.1 91.0 1.8 2,2’,4,4’,5-Pentabromodiphenyl Ether (BDE-99) 108 4.6 93.4 2.7 Hexabromobiphenyl1 102 9.2 95.2 2.5 Fenvalerate 124 3.4 105 3.9 Esfenvalerate 113 2.9 97.3 3.3 2,2’,4,4’,5,5’-Hexabromodiphenyl Ether (BDE-153) 108 6.7 91.3 5.3 1,3-Dimethyl-2-Nitrobenzene (SUR) 79.8 5.2 96.5 14 Triphenylphosphate (SUR) 82.8 3.6 97.7 4.2 Perylene-d12 (SUR) 83.2 3.0 92.6 4.2 1Precision and accuracy determinations were obtained by using a technical mixture of Hexabromobiphenyl (Firemaster BP-6). Actual spiked concentrations for the isomer 2,2’,4,4’,5,5’-Hexabromobiphenyl are 0.74 Fg/L and 3.70 Fg/L, respectively.

527-35
TABLE 6. PRECISION AND ACCURACY DATA FOR METHOD ANALYTES FORTIFIED AT 1.0 AND 5.0 Fg/L IN GROUND WATER EXTRACTED WITH SDVB DISKS
Concentration = 1.0
ug/L, n=5
Concentration = 5.0 ug/L, n=4
Analyte Mean % Recovery
%RSD Mean % Recovery
%RSD
Dimethoate 114 7.1 78.0 4.3 Atrazine 120 7.2 89.7 9.6 Propazine 97.8 9.8 82.5 9.5 Vinclozolin 116 6.0 95.8 8.9 Prometryn 102 8.2 84.5 9.7 Bromacil 128 7.3 93.3 9.5 Malathion 106 6.1 85.3 10 Chlorpyrifos 100 3.5 84.8 10 Thiobencarb 100 6.4 85.8 9.6 Parathion 103 4.2 86.6 9.8 Terbufos-Sulfone 110 8.1 87.3 11 Oxychlordane 102 12 85.8 10 Esbiol 109 8.3 94.8 8.6 Nitrophen 109 6.3 89.2 8.4 Kepone 84.4 6.7 75.0 7.4 Norflurazon 116 6.4 94.5 7.8 Hexazinone 114 7.7 92.9 7.5 Bifenthrin 98.2 6.0 76.7 11 2,2’,4,4’-Tetrabromodiphenyl Ether (BDE-47) 86.6 6.8 78.0 5.6 Mirex 90.4 8.0 72.7 12 2,2’,4,4’,6-Pentabromodiphenyl Ether (BDE-100) 86.4 5.8 79.8 3.8 2,2’,4,4’,5-Pentabromodiphenyl Ether (BDE-99) 86.8 8.9 82.7 4.2 Hexabromobiphenyl1 87.8 5.1 79.5 6.1 Fenvalerate 116 8.4 93.7 7.2 Esfenvalerate 111 8.2 87.7 9.4 2,2’,4,4’,5,5’-Hexabromodiphenyl Ether (BDE-153) 99.8 9.8 82.7 4.6 1,3-Dimethyl-2-Nitrobenzene (SUR) 95.4 5.8 85.5 12 Triphenylphosphate (SUR) 89.8 4.6 86.1 9.6 Perylene-d12 (SUR) 85.8 3.3 82.9 8.5 1Precision and accuracy determinations were obtained by using a technical mixture of Hexabromobiphenyl (Firemaster BP-6). Actual spiked concentrations for the isomer 2,2’,4,4’,5,5’-Hexabromobiphenyl are 0.74 Fg/L and 3.70 Fg/L, respectively.
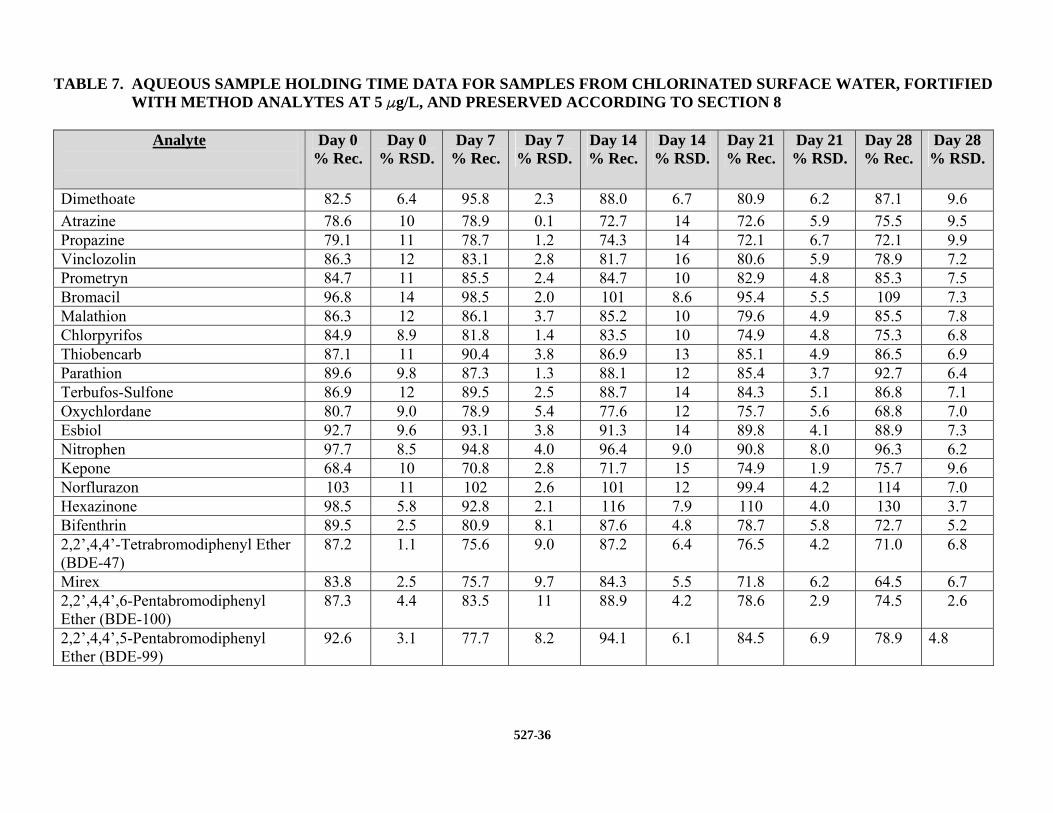
527-36
TABLE 7. AQUEOUS SAMPLE HOLDING TIME DATA FOR SAMPLES FROM CHLORINATED SURFACE WATER, FORTIFIED WITH METHOD ANALYTES AT 5 Fg/L, AND PRESERVED ACCORDING TO SECTION 8
Analyte
Day 0 % Rec.
Day 0 % RSD.
Day 7 % Rec.
Day 7 % RSD.
Day 14 % Rec.
Day 14 % RSD.
Day 21 % Rec.
Day 21 % RSD.
Day 28 % Rec.
Day 28 % RSD.
Dimethoate 82.5 6.4 95.8 2.3 88.0 6.7 80.9 6.2 87.1 9.6Atrazine 78.6 10 78.9 0.1 72.7 14 72.6 5.9 75.5 9.5Propazine 79.1 11 78.7 1.2 74.3 14 72.1 6.7 72.1 9.9Vinclozolin 86.3 12 83.1 2.8 81.7 16 80.6 5.9 78.9 7.2Prometryn 84.7 11 85.5 2.4 84.7 10 82.9 4.8 85.3 7.5Bromacil 96.8 14 98.5 2.0 101 8.6 95.4 5.5 109 7.3Malathion 86.3 12 86.1 3.7 85.2 10 79.6 4.9 85.5 7.8Chlorpyrifos 84.9 8.9 81.8 1.4 83.5 10 74.9 4.8 75.3 6.8Thiobencarb 87.1 11 90.4 3.8 86.9 13 85.1 4.9 86.5 6.9Parathion 89.6 9.8 87.3 1.3 88.1 12 85.4 3.7 92.7 6.4Terbufos-Sulfone 86.9 12 89.5 2.5 88.7 14 84.3 5.1 86.8 7.1Oxychlordane 80.7 9.0 78.9 5.4 77.6 12 75.7 5.6 68.8 7.0Esbiol 92.7 9.6 93.1 3.8 91.3 14 89.8 4.1 88.9 7.3Nitrophen 97.7 8.5 94.8 4.0 96.4 9.0 90.8 8.0 96.3 6.2Kepone 68.4 10 70.8 2.8 71.7 15 74.9 1.9 75.7 9.6Norflurazon 103 11 102 2.6 101 12 99.4 4.2 114 7.0Hexazinone 98.5 5.8 92.8 2.1 116 7.9 110 4.0 130 3.7Bifenthrin 89.5 2.5 80.9 8.1 87.6 4.8 78.7 5.8 72.7 5.22,2’,4,4’-Tetrabromodiphenyl Ether (BDE-47)
87.2 1.1 75.6 9.0 87.2 6.4 76.5 4.2 71.0 6.8
Mirex 83.8 2.5 75.7 9.7 84.3 5.5 71.8 6.2 64.5 6.72,2’,4,4’,6-Pentabromodiphenyl Ether (BDE-100)
87.3 4.4 83.5 11 88.9 4.2 78.6 2.9 74.5 2.6
2,2’,4,4’,5-Pentabromodiphenyl Ether (BDE-99)
92.6 3.1 77.7 8.2 94.1 6.1 84.5 6.9 78.9 4.8

527-37
TABLE 7. AQUEOUS SAMPLE HOLDING TIME DATA FOR SAMPLES FROM CHLORINATED SURFACE WATER, FORTIFIED
WITH METHOD ANALYTES AT 5 Fg/L, AND PRESERVED ACCORDING TO SECTION 8 (CONTINUED)
Analyte
Day 0 % Rec.
Day 0 % RSD.
Day 7 % Rec.
Day 7 % RSD.
Day 14 % Rec.
Day 14 % RSD.
Day 21 % Rec.
Day 21 % RSD.
Day 28 % Rec.
Day 28 % RSD.
Hexabromobiphenyl 92.5 4.4 76.9 11 92.4 5.2 80.5 10.6 74.9 3.7Fenvalerate 116 2.9 97.7 18 104 5.1 106 14 97.3 6.9Esfenvalerate 103 3.3 84.6 12 102 5.1 96.9 12 92.4 2.52,2’,4,4’,5,5’-Hexabromodiphenyl Ether (BDE-153)
89.8 4.6 79.2 28 93.3 6.1 84.9 5.1 87.5 10
1,3-Dimethyl-2-Nitrobenzene (SUR) 74.9 7.7 81.9 5.1 80.3 12 79.3 8.1 82.4 9.7Triphenylphosphate (SUR) 79.9 9.8 84.2 2.4 87.7 16 90.8 4.8 96.6 7.5Perylene-d12 (SUR) 96.9 8.3 89.5 3.9 92.1 5.2 99.1 4.5 104 4.3
Average recovery and precision are based on five samples.

527-38
TABLE 8. EXTRACT HOLDING TIME DATA FOR SAMPLES FROM CHLORINATED SURFACE WATER, FORTIFIED WITH
METHOD ANALYTES AT 5 Fg/L, AND PRESERVED ACCORDING TO SECTION 8 Analyte
Day 0 % Rec.
Day 0 % RSD.
Day 7 % Rec.
Day 7 % RSD.
Day 14 % Rec.
Day 14 % RSD.
Day 21 % Rec.
Day 21 % RSD.
Day 28 % Rec.
Day 28 % RSD.
Dimethoate 82.5 6.4 87.5 8.8 84.1 11 86.9 9.4 94.2 4.9Atrazine 78.6 10 78.1 13 76.3 14 78.9 14 86.1 12Propazine 79.1 11 76.0 11 77.1 15 78.7 14 83.3 13Vinclozolin 86.3 12 85.3 13 88.8 14 90.3 12 87.5 11Prometryn 84.7 11 89.6 0.0 86.1 12 87.1 13 87.0 12Bromacil 96.8 14 104 0.7 98.6 12 102 13 112 13Malathion 86.3 12 89.7 3.3 87.5 14 84.4 12 89.4 11Chlorpyrifos 84.9 8.9 87.0 3.3 87.4 12 83.7 11 84.4 7.4Thiobencarb 87.1 11 92.2 2.5 88.7 12 90.4 10 88.6 10Parathion 89.6 9.8 90.4 0.3 89.7 12 90.7 14 96.2 12Terbufos-Sulfone 86.9 12 94.4 2.1 90.9 14 90.1 13 90.5 12Oxychlordane 80.7 9.0 81.8 4.1 83.7 3.9 82.3 4.3 87.6 5.4Esbiol 92.7 9.6 94.2 2.7 92.8 12 96.0 11 92.9 9.0Nitrophen 97.7 8.5 95.8 5.3 98.2 10 97.9 13 100 8.8Kepone 68.4 10 73.7 0.2 75.3 11 74.9 12 75.5 11Norflurazon 103 11 105 1.8 106 10 117 19 115 12Hexazinone 98.5 5.8 98.9 2.1 122 8.4 123 11 135 13Bifenthrin 89.5 2.5 88.9 2.1 84.5 2.8 86.3 2.2 87.6 5.22,2’,4,4’-Tetrabromodiphenyl Ether (BDE-47)
87.2 1.1 84.2 2.3 86.7 3.2 81.1 1.4 85.7 1.6
Mirex 83.8 2.5 86.1 3.0 81.3 2.2 80.5 5.2 82.5 6.92,2’,4,4’,6-Pentabromodiphenyl Ether (BDE-100
87.3 4.4 92.2 5.2 87.5 1.0 85.1 2.4 87.0 1.7
2,2’,4,4’,5-Pentabromodiphenyl Ether (BDE-99)
92.6 3.1 90.0 6.4 88.2 0.8 95.2 3.1 95.1 3.9
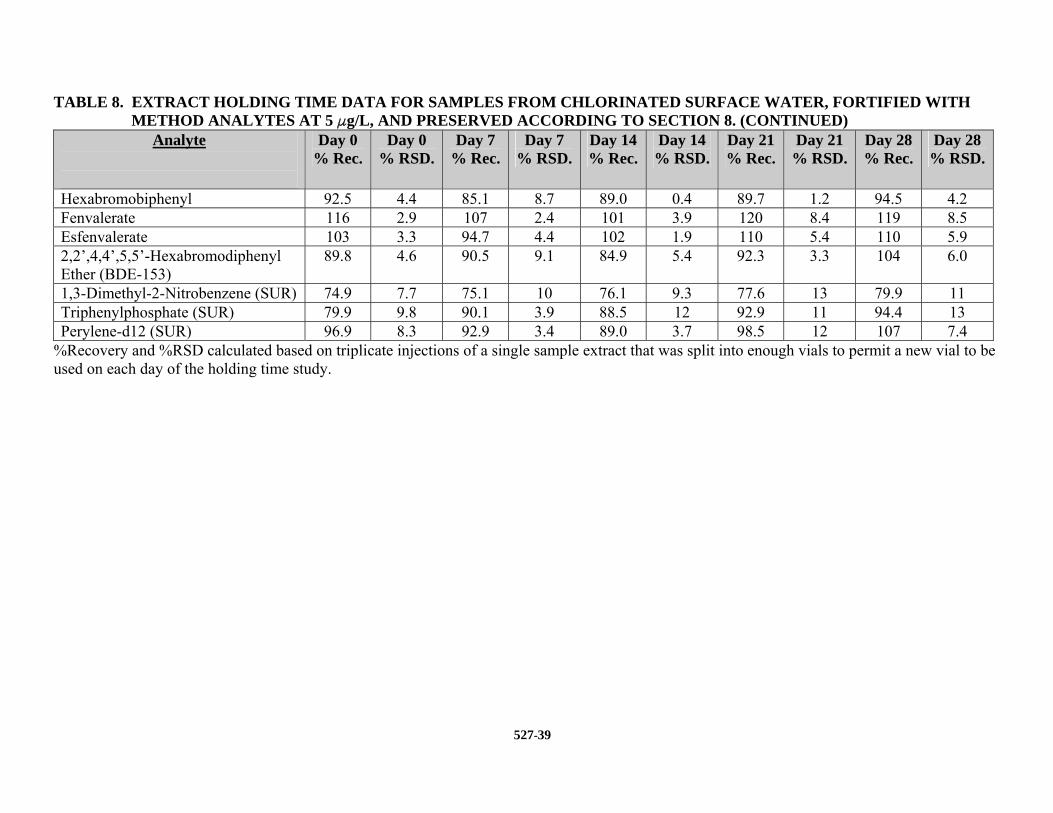
527-39
TABLE 8. EXTRACT HOLDING TIME DATA FOR SAMPLES FROM CHLORINATED SURFACE WATER, FORTIFIED WITH
METHOD ANALYTES AT 5 Fg/L, AND PRESERVED ACCORDING TO SECTION 8. (CONTINUED) Analyte
Day 0 % Rec.
Day 0 % RSD.
Day 7 % Rec.
Day 7 % RSD.
Day 14 % Rec.
Day 14 % RSD.
Day 21 % Rec.
Day 21 % RSD.
Day 28 % Rec.
Day 28 % RSD.
Hexabromobiphenyl 92.5 4.4 85.1 8.7 89.0 0.4 89.7 1.2 94.5 4.2Fenvalerate 116 2.9 107 2.4 101 3.9 120 8.4 119 8.5Esfenvalerate 103 3.3 94.7 4.4 102 1.9 110 5.4 110 5.92,2’,4,4’,5,5’-Hexabromodiphenyl Ether (BDE-153)
89.8 4.6 90.5 9.1 84.9 5.4 92.3 3.3 104 6.0
1,3-Dimethyl-2-Nitrobenzene (SUR) 74.9 7.7 75.1 10 76.1 9.3 77.6 13 79.9 11Triphenylphosphate (SUR) 79.9 9.8 90.1 3.9 88.5 12 92.9 11 94.4 13Perylene-d12 (SUR) 96.9 8.3 92.9 3.4 89.0 3.7 98.5 12 107 7.4
%Recovery and %RSD calculated based on triplicate injections of a single sample extract that was split into enough vials to permit a new vial to be used on each day of the holding time study.

527-40
TABLE 9. INITIAL DEMONSTRATION OF CAPABILITY QUALITY CONTROL REQUIREMENTS
Method Reference
Requirement
Specification and Frequency
Acceptance Criteria
Section 9.2.1
Initial Demonstration of Low System Background
Analyze LRB prior to any other IDC steps
Demonstrate that all target analytes are below 1/3 the reporting limit or lowest calibration standard, and that possible interferences from extraction media do not prevent the identification and quantification of method analytes.
Section 9.2.4
Minimum Reporting Limit (MRL) Confirmation
Fortify, extract and analyze 7 replicates at the proposed MRL concentration. Calculate the mean and the Half Range (HR). Confirm that the upper and lower limits for the Prediction Interval of Result (Upper PIR, and Lower PIR, Sect. 9.2.4.2) meet the recovery criteria.
Upper PIR ≤ 150% Lower PIR ≥ 50%
Section 9.2.2
Initial Demonstration of Precision (IDP)
Analyze 4-7 replicate LFBs fortified near the midrange concentration
%RSD must be ≤ 20%
Section 9.2.3
Initial Demonstration of Accuracy
Calculate average recovery for replicates used in IDP
Mean recovery ± 30% of true value

527-41
TABLE 10. ONGOING QUALITY CONTROL REQUIREMENTS (SUMMARY) Method Reference
Requirement
Specification and Frequency
Acceptance Criteria
Section 10.2.1
MS Tune Check
Analyze DFTPP to verify MS tune each time the instrument is calibrated.
Criteria are given in Table 1, or the system meets the manufacturer’s recommended criteria
Section 10.2
Initial Calibration
Use internal standard calibration technique to generate an average RRF or first or second order calibration curve. Use at least 5 standard concentrations. Check the calibration curve as described in Sect. 10.2.6.
When each calibration standard is calculated as an unknown using the calibration curve, the result should be 70-130% of the true value for all except the lowest standard, which should be 50-150% of the true value. Recalibration is recommended if these criteria are not met.
Section 9.3.1
Laboratory Reagent Blank (LRB)
Daily, or with each extraction batch of up to 20 samples, whichever is more frequent.
Demonstrate that all target analytes are below 1/3 the MRL, and confirm that possible interferences do not prevent quantification of method analytes. If targets exceed 1/3 the MRL, results for these subject analytes in the extraction batch are invalid.
Section 10.3
Continuing Calibration Check (CCC)
Verify initial calibration by analyzing a calibration standard at the beginning of each analysis batch prior to analyzing samples, after every 10 samples, and after the last sample. Low CCC – at or below the MRL concentration Mid CCC – near midpoint in initial calibration curve High CCC – near the highest calibration standard.
± 50% of true value ± 30% of true value ± 30% of true value
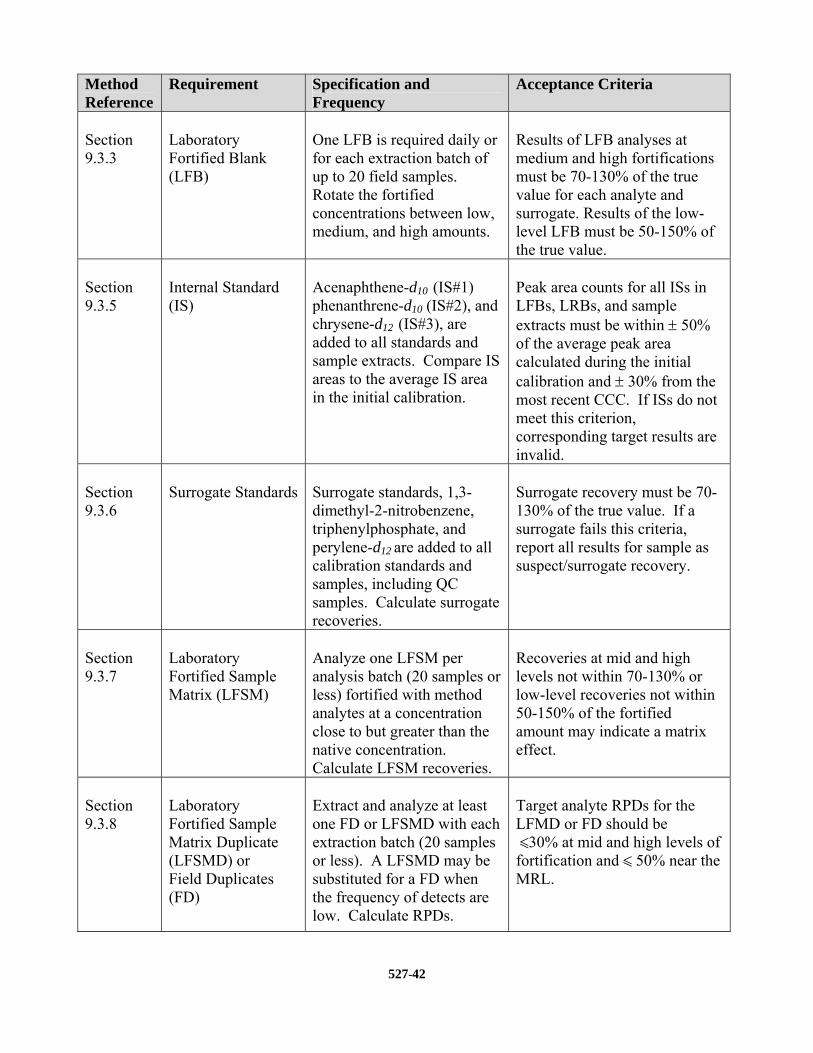
527-42
Method Reference
Requirement Specification and Frequency
Acceptance Criteria
Section 9.3.3
Laboratory Fortified Blank (LFB)
One LFB is required daily or for each extraction batch of up to 20 field samples. Rotate the fortified concentrations between low, medium, and high amounts.
Results of LFB analyses at medium and high fortifications must be 70-130% of the true value for each analyte and surrogate. Results of the low-level LFB must be 50-150% of the true value.
Section 9.3.5
Internal Standard (IS)
Acenaphthene-d10 (IS#1) phenanthrene-d10 (IS#2), and chrysene-d12 (IS#3), are added to all standards and sample extracts. Compare IS areas to the average IS area in the initial calibration.
Peak area counts for all ISs in LFBs, LRBs, and sample extracts must be within ± 50% of the average peak area calculated during the initial calibration and ± 30% from the most recent CCC. If ISs do not meet this criterion, corresponding target results are invalid.
Section 9.3.6
Surrogate Standards
Surrogate standards, 1,3-dimethyl-2-nitrobenzene, triphenylphosphate, and perylene-d12 are added to all calibration standards and samples, including QC samples. Calculate surrogate recoveries.
Surrogate recovery must be 70-130% of the true value. If a surrogate fails this criteria, report all results for sample as suspect/surrogate recovery.
Section 9.3.7
Laboratory Fortified Sample Matrix (LFSM)
Analyze one LFSM per analysis batch (20 samples or less) fortified with method analytes at a concentration close to but greater than the native concentration. Calculate LFSM recoveries.
Recoveries at mid and high levels not within 70-130% or low-level recoveries not within 50-150% of the fortified amount may indicate a matrix effect.
Section 9.3.8
Laboratory Fortified Sample Matrix Duplicate (LFSMD) or Field Duplicates (FD)
Extract and analyze at least one FD or LFSMD with each extraction batch (20 samples or less). A LFSMD may be substituted for a FD when the frequency of detects are low. Calculate RPDs.
Target analyte RPDs for the LFMD or FD should be ñ30% at mid and high levels of fortification and ñ 50% near the MRL.

527-43
Method Reference
Requirement
Specification and Frequency
Acceptance Criteria
Section 9.3.9
Quality Control Sample (QCS)
Analyze QCS during the IDC and at least quarterly.
Results must be 70-130% of the expected value.
Section 8.4
Sample Holding Time
14 days with appropriate preservation and storage
Sample results are valid only if samples are extracted within sample hold time.
Section 8.4
Extract Holding Time
28 days with appropriate preservation and storage
Sample results are valid only if extracts are analyzed within extract hold time.

FIGURE 1. EXAMPLE CHROMATOGRAM FOR A REAGENT WATER FORTIFIED WITH METHOD 527 ANALYTES AT 5 µG/L. . NUMBERED PEAKS ARE IDENTIFIED IN TABLE 2.
6 8 1 0 12 1 4 1 6 18 2 0 2 2 24 2 6 2 8 3 0 3 2T im e (M in u te s)
12
5
2 4
2 0
1 51 0
2 23
4
6
78
1 1
1 3
1 21 4
1 6
1 8
1 91 7
2 5
2 3
2 62 7
3 2
2 8
2 1
9
2 9 ,3 0
3 1
527-44