Embed Size (px)
Citation preview
EP Energy, a.s.
Consolidated annual report for the year
ended 31 December 2015

CONTENT
I. Independent Auditor´s Report on Consolidated Annual Report
II. Introduction by the Chairman of the Board of Directors
III. Other Information
IV. Report on Relations
V. Consolidated Financial Statements and Notes to the Financial Statements
VI. Independent Auditor´s Report on Statutory Financial Statements
VII. Statutory Financial Statements and Notes to the Financial Statements
I. Independent Auditor´s Report on Consolidated
Annual Report

II. Introduction by the Chairman of the Board
of Directors

III. Other Information
Other information
Subsequent events
Pražská teplárenská (“PT”) spin-off
In May 2015, PT spunoff certain assets consisting of small local heat sources and related
distribution networks located predominantly on the left bank of Vltava river into Pražská
teplárenská LPZ, a.s. (“PT LPZ”).
On 29 February 2016, PT as seller entered into a share purchase agreement with Veolia Energie
ČR, a.s. as buyer relating to the sale of 85% of shares in PT LPZ for EUR 60,322 thousand (CZK
1,632 million) subject to usual post-closing adjustments based on working capital level against
the benchmarked value. Consummation of the transaction is subject to customary conditions
precedent including competition clearance. PT and Veolia Energie ČR, a.s. also entered into an
option agreement in relation to the remaining 15% of shares in PT LPZ exercisable between 1
July 2016 and 30 September 2017. If exercised, the total purchase price for 100% of the shares in
PT LPZ will amount to CZK 1,920 million (subject to the above post-closing adjustments, which
can significantly increase the final price). Due to the absence of several approvals, the relevant
assets and liabilities were not presented as Assets and liabilities held for sale as of 31 December
2015.
On 6 April 2016 the parent company CE Energy, a.s. was renamed to EP Infrastructure, a.s.
(EPIF). The change was entered to Commercial register on 11 April 2016.
During 2016 activities and assets held by CEE (in 2016 renamed to EP Infrastructure, a.s.) were
reorganized in view of intended sale of a minority share of CEE to third parties.
The reorganization also included the following matters relating to the EPE Group:
German assets sale
German assets include, among others, MIBRAG and Saale Energie. MIBRAG is a wholly-owned
subsidiary of JTSD Braunkohlebergbau GmbH (“JTSD”), Saale Energie is a wholly-owned
subsidiary of EP Germany; both EP Germany and JTSD were wholly-owned subsidiaries of EPE
(where EP Germany has been since 31 December 2015 directly owned by JTSD as
a result of the sale of all EP Germany shares by EPE to JTSD for EUR 4.3 million, corresponding
to fair value of equity of EP Germany).
The German assets were disposed of by means of sale of 100 per cent. shares in JTSD by EPE to
EPH for EUR 156.0 million (corresponding to fair value of equity of JTSD); the disposal was
completed on 1 April 2016 and the purchase price was fully settled in cash.
Further, as a part of the pre-sale restructuring, on 23 February 2016:
JTSD set-off (a part of) its receivables towards EPE in the amount of EUR 81.9 million
arising from (i) a loan of EUR 16.9 million provided by JTSD to EPE, and (ii) a loan
of EUR 65.0 million provided by MIBRAG to EPE (assumed by JTSD from EPE for the
nominal value thereof); following the set off, the total liabilities of JTSD towards EPE
amounted to EUR 314.4 million; and
(i) JTSD assumed a liability of EP Germany towards EPE in the amount of EUR 61.8 million
(out of the original total amount of EUR 91.8 million outstanding under the loan provided
by EPE to EP Germany) for the nominal value thereof, and (ii) EPE contributed EUR 71.2
million to the capital funds of JTSD.
Immediately after the capitalization, the total liabilities of JTSD towards EPE amounted to
EUR 305.0 million. These were settled by JTSD making a payment to EPE in the amount
of EUR 305.0 million (out of the funds drawn under a bank loan contracted by JTSD in the total
amount of EUR 309.0 million for this purpose) and the outstanding receivable of EPE towards
JTSD was acquired by EPH for its nominal value as of the date of the JTSD acquisition by EPH;
the consideration was fully settled in cash (EUR 1,690 thousand).
The outstanding amount of the original loan provided by EPE to EP Germany immediately after
JTSD assumed part of this liability of EP Germany to EPE was EUR 30.0 million. This was settled
by EP Germany making a payment in the amount of EUR 30.0 million (out of the funds drawn
under a bank loan contracted by EP Germany in the total amount of EUR 31.0 million for this
purpose) and the outstanding receivable of EPE towards EP Germany was acquired by EPH for
its nominal value as of the date of the JTSD acquisition by EPH; the consideration was fully
settled in cash (EUR 241 thousand).
Other disposals of shares
The restructuring further included a number of other (smaller in terms of the acquisition price)
transfers of assets. These include sale of:
a. 60% of shares in PGP Terminal, a.s. by EPE (as the seller) to EPH (as the buyer) for
the purchase price of EUR 340 thousand (CZK 9,189 thousand) in cash (completed on
29 February 2016),
b. 99.78% ownership interest in EOP & HOKA s.r.o. by EP Sourcing, a.s. (as the seller)
to EP Coal Trading, a.s. (as the buyer) for the purchase price of EUR 4,716 thousand
(CZK 127,614 thousand) in cash (completed on 29 February 2016),
c. 100% of shares in EP COAL TRADING Spółka akcyjna by EP Sourcing, a.s. (as the
seller) to EP Coal Trading, a.s. (as the buyer) for the purchase price of EUR 406
thousand (PLN 1,769 thousand) in cash (completed on 29 February 2016),
d. 65% ownership interest in LOKOTRAIN, s.r.o. by EP Cargo a.s. (as the seller) to EP
Logistics International, a.s. (as the buyer) for the purchase price of EUR 1,603 thousand
(CZK 43,371 thousand) in cash (completed on 4 April 2016),
e. 100% ownership interest in EP Cargo Deutschland GmbH by EP Energy, a.s. (as the
seller) to EP Logistics International, a.s. (as the buyer) for the purchase price of EUR
352 thousand (CZK 9,523 thousand) in cash (completed on 4 April 2016),
f. 100% of shares in EP CARGO POLSKA s.a. by EPE (as the seller) to EP Logistics
International, a.s. (as the buyer) for the purchase price of EUR 487 thousand (CZK
13,176 thousand) in cash (completed on 4 April 2016).
In addition, management of EP Energy Trading sold 100% of shares in Adconcretum real estate
Ltd., which owns investment property in Serbia, to EPH for EUR 3,5 million.
Repayment of EP Energy’s term loans
On 4 April 2016 EPE fully repaid the term loans totalling EUR 175.0 million previously provided
by ČSOB, HSBC and Commerzbank using the proceeds from the sale of JTSD.
On 4 April 2016 EPE unwound an existing FX forward with EPH and as a result, EPE had a
receivable of EUR 4.1 million towards EPH corresponding to the FX forward fair value. This
receivable was acquired by EP Infrastructure, a.s. (formerly CE Energy, a.s.) for the nominal
value thereof, i.e., the Company had a receivable of EUR 4.1 million towards EP Infrastructure,
a.s.
On 4 April 2016 EP Infrastructure, a.s. assumed from EPH all debts of EPH owed to EPE at their
nominal values. The debts of EPH towards EPE of EUR 308.7 million consisted of unpaid
principal loan of EUR 273.2 million and unpaid accrued interest of EUR 35.5 million.
SSE - Solar s.r.o.
SSE – Solar was reported as Asset held for sale as of 31 December 2015. As of the date of
compilation of these financial statements it was no longer the case.

Except for the matters described above and elsewhere in the Notes, the Company’s management is
not aware of any other material subsequent events that could have an effect on the consolidated
financial statements as at 31 December 2015.
Environmental activities
In 2015, the EPE group was very active in terms of environmental protection.
In 2015, the companies from the EPE group continued to be operated in a manner ensuring their
failure-free operation and high efficiency in producing electricity and heat, which has direct impact
on the volume of produced emissions.
For example Elektrárny Opatovice a.s. (EOP) defended the compliance of its environmental
management system with the international standard ISO 14001 during a supervisory audit. EOP’s
environmental management system strives to minimise the impact of the Company’s operations on
the environment. Compliance with legislative requirements in terms of environmental protection
was confirmed during an inspection carried out by the relevant state administration supervisory
body. In 2015, EOP realised a separate project consisting of the implementation and completion of
investment projects which will result in the reduction of the emissions of sulphur dioxide (SO2),
nitrogen oxides (NOx,) and particulate matter (PM) by tens of per cent compared to previous years.
These projects comprise the reconstruction of four boilers including primary and secondary
measures aimed at reducing nitrogen oxides emissions (NOx), the replacement of the electrostatic
separators on these boilers with textile filters and the completion of one of two newly built
desulphurisation lines which will allow for a significant reduction of sulphur dioxide emissions
(SO2).
Pražská teplárenská also met all emission limits for particulate matter (PM), sulphur dioxide,
nitrogen oxides and carbon monoxide in 2015. During 2015, new versions of the integrated permits
were issued for specified sources (Malešice heating plant, Michle heating plant, Holešovice heating
plant, and Krč heat station), relating to legislative changes. Monitoring plans for reporting carbon
dioxide emissions for the Malešice and Holešovice heating plants were updated and approved by
the Ministry of the Environment.
The companies from the EPE group employ a functioning sorting system for components of
municipal waste.
Recycling, the reuse of materials and composting are preferred to establishing waste dumps, which
significantly contributes to a reduction of the volume of produced waste and has economic benefits.
Branch
EPE has no branch abroad.
Research and development activities
In 2015, the EPE group did not carry out any research and development activities and as a result
did not incur any research and development costs.
Financial risk management
The financial risk management principles of the EPE group are stated in the notes to the
consolidated financial statements.
Employment relations
The main strengths of the EPE group include good relations with its employees and their loyalty.
The Group maintains good and correct relations with the trade unions active within the Group by
holding regular meetings and discussions on work, social and wage related issues. The EPE group
will continue paying special attention to preventing work accidents. The individual companies
primarily concentrate on preventive checks, workplace inspections and the high quality of
organised trainings on occupational safety and health.

IV. Report on Relations

REPORT ON RELATIONS
between the controlling and controlled entities and on relations between the controlled entity and other
entities controlled by the same controlling entity (related entities)
prepared by the board of directors of EP Energy, a.s., with its registered office at Příkop 843/4,
Zábrdovice, Brno, postcode 602 00, ID No.: 292 59 428, in accordance with Section 82 (1) of the
Corporations Act (Act No. 90/2012 Coll., as amended)
(“the Report”)
__________________________________________________
I.
Preamble
The Report has been prepared pursuant to Section 82 (1) of the Corporations Act (Act No.
90/2012 Coll., as amended).
The Report has been submitted for review to the Company’s supervisory board in line with
Section 83 (1) of the Corporations Act (Act No.90/2012 Coll., as amended), and the supervisory
board’s position will be communicated to the Company’s general meeting which will decide
on the approval of the Company’s ordinary financial statements and the distribution of the
Company’s profit or the settlement of its loss.
The Report has been prepared for the 2015 accounting period.
II.
Structure of relations between related entities
CONTROLLED ENTITY
The controlled entity is EP Energy, a.s., with its registered office at Příkop 843/4, Zábrdovice, Brno,
postcode 602 00, ID No: 292 59 428, recorded in the Commercial Register maintained by the Regional
Court in Brno, section B, insert 6278.
DIRECTLY CONTROLLING ENTITIES:
CE Energy, a.s. (since 24 January 2014)
Registered office: Příkop 843/4, Zábrdovice, Brno, postcode
602 00, Czech Republic
Reg. No.: 02413507
INDIRECTLY CONTROLLING ENTITIES:
Energetický a průmyslový holding, a.s.
Registered office: Příkop 843/4, Zábrdovice, Brno, postcode
602 00, Czech Republic
Reg. No.: 28356250
EP Investment S.a r.l.
Registered office: 46A, Avenue J.F. Kennedy, L – 1855
Luxembourg, Luxembourgh
Reg. No.: B 184488
MILEES LIMITED
Registered office: Akropoleos, 59-61, SAVVIDES CENTRE,
1st floor, Flat/Office 102, Nicosia, P.C. 2012, Cyprus
Reg. No.: HE246283
OTHER CONTROLLED ENTITIES
The companies controlled by the same controlling entities are disclosed in note 38 to the
consolidated financial statements of the controlled entity.
III.
Role of the controlled entity; method and means of control
Role of the controlled entity
strategic management of the development of a group of directly or indirectly controlled
entities
providing financing and developing financing systems for group entities
optimising the services utilised/provided in order to improve the entire group’s
performance
managing, acquiring and disposing of the Company’s ownership interests and other
assets
Method and means of control
The controlling entities hold a majority share of voting rights in EP Energy, a.s., and exercise
a controlling influence over EP Energy, a.s.
IV.
Overview of actions pursuant to Section 82 (2)(d) of Act No.
90/2012 Coll., on Corporations
In 2015 no actions were taken at the initiative or in the interest of the controlling entity that
would concern assets exceeding 10% of the controlled entity’s equity as determined from the
most recent financial statements.
V.
Contracts concluded between EP Energy, a.s. and other related entities
V.1.1.
In 2015 the following loan agreements were in operation:
On 21 November 2006 a loan agreement, including valid amendments, was signed by and
between a third party as the creditor and VTE Pchery s.r.o. (formerly ČES s.r.o.) as the debtor.
On 9 May 2012, based on a receivable transfer agreement, the receivable was transferred to
EP Energy, a.s.
On 7 December 2009 a loan agreement, including valid amendments, was signed by and
between Energetický a průmyslový holding, a.s. as the creditor and VTE Moldava II, a.s.
(formerly Czech Wind Holding, a.s.) as the debtor. On 30 December 2010, based on a
receivable transfer agreement, the receivable was transferred to EP Energy, a.s.
On 9 December 2009 a loan agreement, including valid amendments, was signed by and
between Energetický a průmyslový holding, a.s. as the creditor and VTE Moldava II, a.s.
(formerly Czech Wind Holding, a.s.) as the debtor. On 30 December 2010, based on a
receivable transfer agreement, the receivable was transferred to EP Energy, a.s.
On 18 December 2009 a loan agreement, including valid amendments, was signed by and
between Energetický a průmyslový holding, a.s. as the creditor and VTE Pchery s.r.o. as the
debtor. On 30 December 2010, based on a receivable transfer agreement, the receivable was
transferred to EP Energy, a.s.
On 29 January 2010 a loan agreement, including valid amendments, was signed by and between
Energetický a průmyslový holding, a.s. as the creditor and Triskata, s.r.o. as the debtor.
On 30 December 2010, based on a receivable transfer agreement, the receivable was transferred
to EP Energy, a.s.
On 4 February 2010 a loan agreement, including valid amendments, was signed by and between
Energetický a průmyslový holding, a.s. as the creditor and VTE Moldava II, a.s. (formerly
Czech Wind Holding, a.s.) as the debtor. On 30 December 2010, based on a receivable transfer
agreement, the receivable was transferred to EP Energy, a.s.
On 27 May 2010 a loan agreement was signed by and between Energetický a průmyslový
holding, a.s. as the creditor and VTE Moldava, a.s. as the debtor. On 30 December 2010, based
on a receivable transfer agreement, the receivable was transferred to EP Energy, a.s. In 2015
VTE Moldava II, a.s. became the legal successor of VTE Moldava, a.s.
On 15 June 2010 a loan agreement, including valid amendments, was signed by and between
EP Renewables a.s. (formerly Czech Wind Holding, a.s.) as the creditor and ARISUN, s. r. o.
as the debtor. In 2015 EP Energy, a.s. became the legal successor of EP Renewables a.s.
On 23 June 2010 a loan agreement, including valid amendments, was signed by and between
Energetický a průmyslový holding, a.s. as the creditor and CHIFFON ENTERPRISES
LIMITED as the debtor. On 30 December 2010 based on a receivable transfer agreement, the
receivable was transferred to EP Energy, a.s. On 26 September 2012 based on a receivable
transfer agreement, the receivable was transferred to EP Renewables a.s. In 2015 EP Energy,
a.s. became the legal successor of EP Renewables a.s.
On 5 August 2010 a loan agreement, including valid amendments, was signed by and between
Energetický a průmyslový holding, a.s. as the creditor and POWERSUN, a.s. as the debtor. On
31 December 2010, based on a receivable transfer agreement, the receivable was transferred to
EP Energy, a.s.
On 3 November 2010 a loan agreement, including valid amendments, was signed by and
between EP Renewables a.s. (formerly Czech Wind Holding, a.s.) as the creditor and
Greeninvest Energy, a.s. as the debtor. In 2015 EP Energy, a.s. became the legal successor of
EP Renewables a.s.
On 27 May 2011 a loan agreement, including valid amendments, was signed by and between
PT-Holding Investment B.V. as the creditor and Honor Invest, a.s. as the debtor. In 2013
EP Energy, a.s. became the legal successor of Honor Invest, a.s.
On 27 June 2011 a loan agreement, including valid amendments, was signed by and between
Energetický a průmyslový holding, a.s. as the creditor and VTE Pchery s.r.o. as the debtor. On
25 September 2012 based on a receivable transfer agreement, the receivable was transferred to
EP Energy, a.s.
On 19 July 2011 a loan agreement was signed by and between PT-Holding Investment B.V. as
the creditor and Energetický a průmyslový holding, a.s. as the debtor. On 31 October 2011 the
debt was assumed by EP Energy, a.s., which thus became the new debtor.
On 28 December 2011 a loan agreement, including valid amendments, was signed by and
between EP Energy, a.s. as the creditor and VTE Pchery s.r.o. as the debtor.
On 20 June 2012 a loan agreement, including valid amendments, was signed by and between
Energetický a průmyslový holding, a.s. as the debtor and EP Energy, a.s. as the creditor.
On 9 July 2012 a loan agreement, including valid amendments, was signed by and between
Energetický a průmyslový holding, a.s. as the debtor and EP Energy, a.s. as the creditor.
On 21 August 2012 a loan agreement, including valid amendments, was signed by and between
EP Energy, a.s. as the creditor and CHIFFON ENTERPRISES LIMITED as the debtor.
On 26 September 2012 based on a receivable transfer agreement, the receivable was transferred
to EP Renewables a.s. In 2015 EP Energy, a.s. became the legal successor of EP Renewables
a.s.

On 15 October 2012 a loan agreement, including valid amendments, was signed by and between
EP Renewables a.s. as the creditor and CHIFFON ENTERPRISES LIMITED as the debtor. In
2015 EP Energy, a.s. became the legal successor of EP Renewables a.s.
On 16 October 2012 a loan agreement was signed by and between EP Energy, a.s. as the creditor
and Plzeňská energetika a.s. as the debtor.
On 30 October 2012 a loan agreement was signed by and between EP Energy, a.s. as the creditor
and United Energy, a.s. as the debtor.
On 30 October 2012 a loan agreement was signed by and between EP Energy, a.s. as the creditor
and EP ENERGY TRADING, a.s. as the debtor.
On 30 October 2012 a loan agreement was signed by and between EP Energy, a.s. as the creditor
and EP ENERGY TRADING, a.s. as the debtor.
On 30 October 2012 a loan agreement was signed by and between EP Energy, a.s. as the creditor
and Elektrárny Opatovice, a.s. as the debtor.
On 30 October 2012 a loan agreement was signed by and between EP Energy, a.s. as the creditor
and Mitteldeutsche Braunkohlengesellschaft mbH as the debtor.
On 17 January 2013 a loan agreement, including valid amendments, was signed by and between
EP Energy, a.s. as a creditor and debtor and United Energy, a.s. as a creditor and debtor.
On 17 January 2013 a loan agreement, including valid amendments, was signed by and between
EP Energy, a.s. as a creditor and debtor and Plzeňská energetika a.s. as a creditor and debtor.
On 17 January 2013 a loan agreement, including valid amendments, was signed by and between
EP Energy, a.s. as a creditor and debtor and EP ENERGY TRADING, a.s. as a creditor and
debtor.
On 17 January 2013 a loan agreement, including valid amendments, was signed by and between
EP Energy, a.s. as a creditor and debtor and Elektrárny Opatovice, a.s. as a creditor and debtor.
On 18 January 2013 a loan agreement, including valid amendments, was signed by and between
Energetický a průmyslový holding, a.s. as the debtor and EP Energy, a.s. as the creditor.
On 17 June 2013 a loan agreement was signed by and between EP Energy, a.s. as the creditor
and EP Germany GmbH as the debtor.
On 26 June 2013 a loan agreement was signed by and between EP Energy, a.s. as the creditor
and Elektrárny Opatovice, a.s. as the debtor.
On 28 June 2013 a loan agreement, including valid amendments, was signed by and between
EP Energy, a.s. as the debtor and ROLLEON a.s. as the creditor.
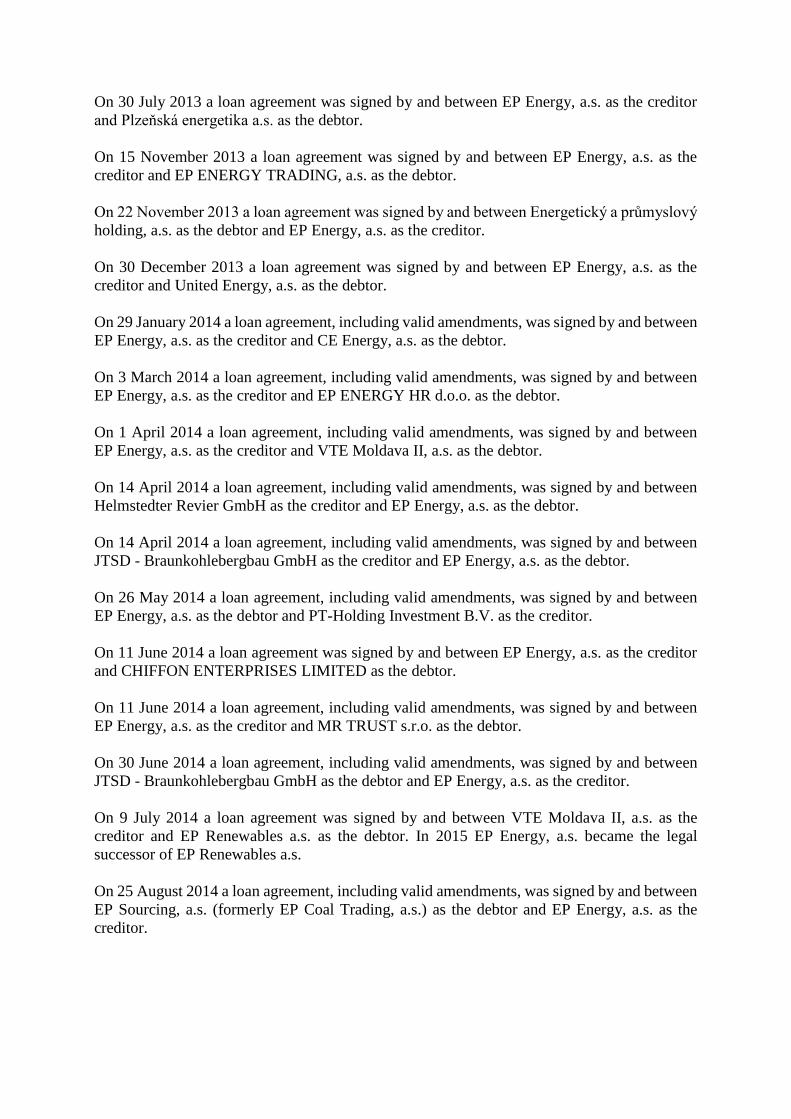
On 30 July 2013 a loan agreement was signed by and between EP Energy, a.s. as the creditor
and Plzeňská energetika a.s. as the debtor.
On 15 November 2013 a loan agreement was signed by and between EP Energy, a.s. as the
creditor and EP ENERGY TRADING, a.s. as the debtor.
On 22 November 2013 a loan agreement was signed by and between Energetický a průmyslový
holding, a.s. as the debtor and EP Energy, a.s. as the creditor.
On 30 December 2013 a loan agreement was signed by and between EP Energy, a.s. as the
creditor and United Energy, a.s. as the debtor.
On 29 January 2014 a loan agreement, including valid amendments, was signed by and between
EP Energy, a.s. as the creditor and CE Energy, a.s. as the debtor.
On 3 March 2014 a loan agreement, including valid amendments, was signed by and between
EP Energy, a.s. as the creditor and EP ENERGY HR d.o.o. as the debtor.
On 1 April 2014 a loan agreement, including valid amendments, was signed by and between
EP Energy, a.s. as the creditor and VTE Moldava II, a.s. as the debtor.
On 14 April 2014 a loan agreement, including valid amendments, was signed by and between
Helmstedter Revier GmbH as the creditor and EP Energy, a.s. as the debtor.
On 14 April 2014 a loan agreement, including valid amendments, was signed by and between
JTSD - Braunkohlebergbau GmbH as the creditor and EP Energy, a.s. as the debtor.
On 26 May 2014 a loan agreement, including valid amendments, was signed by and between
EP Energy, a.s. as the debtor and PT-Holding Investment B.V. as the creditor.
On 11 June 2014 a loan agreement was signed by and between EP Energy, a.s. as the creditor
and CHIFFON ENTERPRISES LIMITED as the debtor.
On 11 June 2014 a loan agreement, including valid amendments, was signed by and between
EP Energy, a.s. as the creditor and MR TRUST s.r.o. as the debtor.
On 30 June 2014 a loan agreement, including valid amendments, was signed by and between
JTSD - Braunkohlebergbau GmbH as the debtor and EP Energy, a.s. as the creditor.
On 9 July 2014 a loan agreement was signed by and between VTE Moldava II, a.s. as the
creditor and EP Renewables a.s. as the debtor. In 2015 EP Energy, a.s. became the legal
successor of EP Renewables a.s.
On 25 August 2014 a loan agreement, including valid amendments, was signed by and between
EP Sourcing, a.s. (formerly EP Coal Trading, a.s.) as the debtor and EP Energy, a.s. as the
creditor.
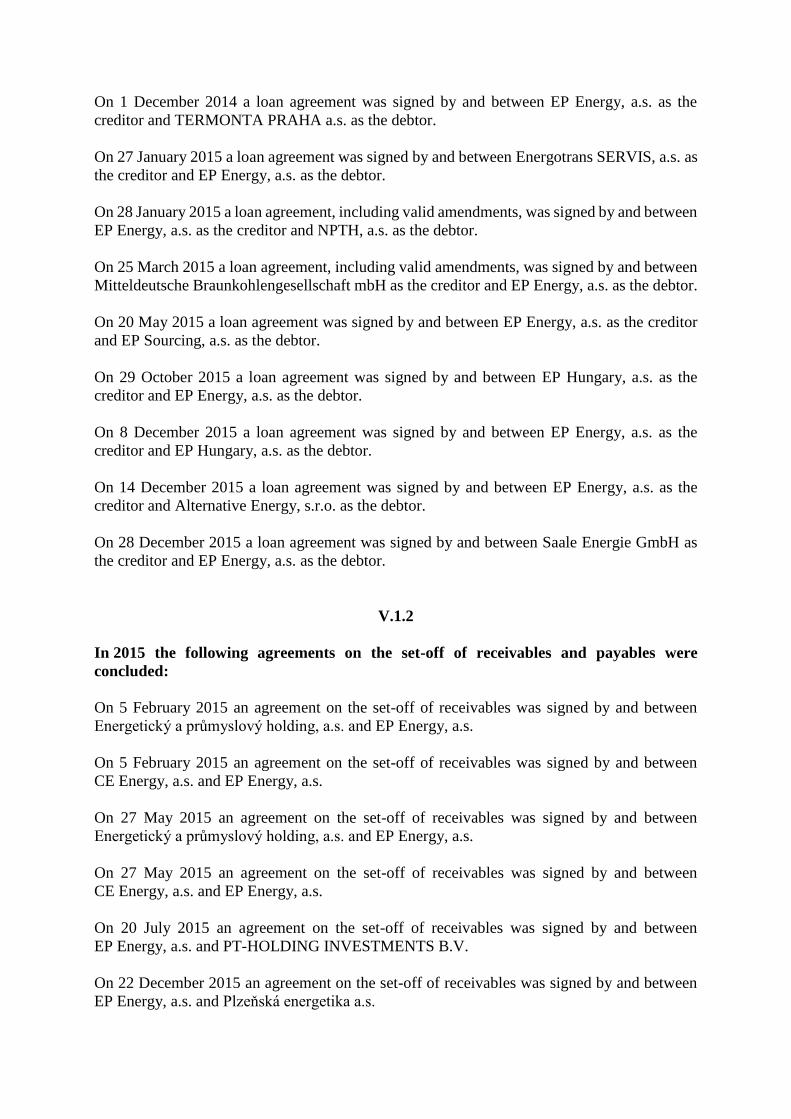
On 1 December 2014 a loan agreement was signed by and between EP Energy, a.s. as the
creditor and TERMONTA PRAHA a.s. as the debtor.
On 27 January 2015 a loan agreement was signed by and between Energotrans SERVIS, a.s. as
the creditor and EP Energy, a.s. as the debtor.
On 28 January 2015 a loan agreement, including valid amendments, was signed by and between
EP Energy, a.s. as the creditor and NPTH, a.s. as the debtor.
On 25 March 2015 a loan agreement, including valid amendments, was signed by and between
Mitteldeutsche Braunkohlengesellschaft mbH as the creditor and EP Energy, a.s. as the debtor.
On 20 May 2015 a loan agreement was signed by and between EP Energy, a.s. as the creditor
and EP Sourcing, a.s. as the debtor.
On 29 October 2015 a loan agreement was signed by and between EP Hungary, a.s. as the
creditor and EP Energy, a.s. as the debtor.
On 8 December 2015 a loan agreement was signed by and between EP Energy, a.s. as the
creditor and EP Hungary, a.s. as the debtor.
On 14 December 2015 a loan agreement was signed by and between EP Energy, a.s. as the
creditor and Alternative Energy, s.r.o. as the debtor.
On 28 December 2015 a loan agreement was signed by and between Saale Energie GmbH as
the creditor and EP Energy, a.s. as the debtor.
V.1.2
In 2015 the following agreements on the set-off of receivables and payables were
concluded:
On 5 February 2015 an agreement on the set-off of receivables was signed by and between
Energetický a průmyslový holding, a.s. and EP Energy, a.s.
On 5 February 2015 an agreement on the set-off of receivables was signed by and between
CE Energy, a.s. and EP Energy, a.s.
On 27 May 2015 an agreement on the set-off of receivables was signed by and between
Energetický a průmyslový holding, a.s. and EP Energy, a.s.
On 27 May 2015 an agreement on the set-off of receivables was signed by and between
CE Energy, a.s. and EP Energy, a.s.
On 20 July 2015 an agreement on the set-off of receivables was signed by and between
EP Energy, a.s. and PT-HOLDING INVESTMENTS B.V.
On 22 December 2015 an agreement on the set-off of receivables was signed by and between
EP Energy, a.s. and Plzeňská energetika a.s.
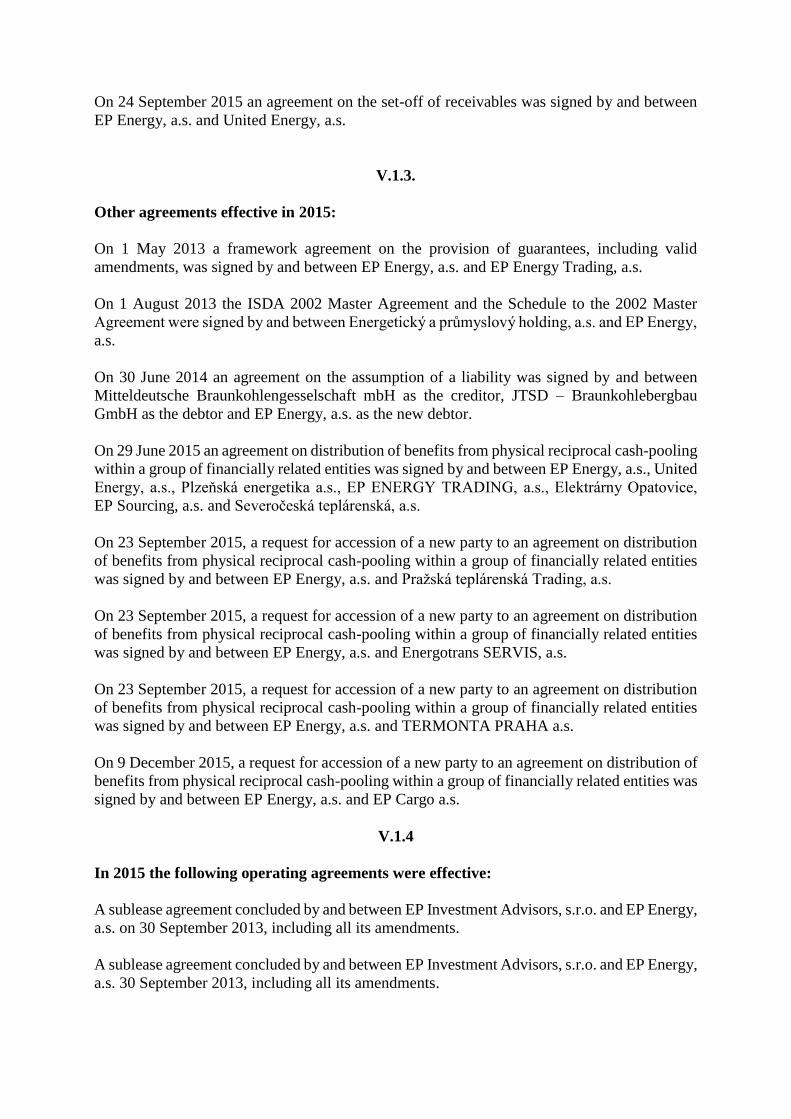
On 24 September 2015 an agreement on the set-off of receivables was signed by and between
EP Energy, a.s. and United Energy, a.s.
V.1.3.
Other agreements effective in 2015:
On 1 May 2013 a framework agreement on the provision of guarantees, including valid
amendments, was signed by and between EP Energy, a.s. and EP Energy Trading, a.s.
On 1 August 2013 the ISDA 2002 Master Agreement and the Schedule to the 2002 Master
Agreement were signed by and between Energetický a průmyslový holding, a.s. and EP Energy,
a.s.
On 30 June 2014 an agreement on the assumption of a liability was signed by and between
Mitteldeutsche Braunkohlengesselschaft mbH as the creditor, JTSD – Braunkohlebergbau
GmbH as the debtor and EP Energy, a.s. as the new debtor.
On 29 June 2015 an agreement on distribution of benefits from physical reciprocal cash-pooling
within a group of financially related entities was signed by and between EP Energy, a.s., United
Energy, a.s., Plzeňská energetika a.s., EP ENERGY TRADING, a.s., Elektrárny Opatovice,
EP Sourcing, a.s. and Severočeská teplárenská, a.s.
On 23 September 2015, a request for accession of a new party to an agreement on distribution
of benefits from physical reciprocal cash-pooling within a group of financially related entities
was signed by and between EP Energy, a.s. and Pražská teplárenská Trading, a.s.
On 23 September 2015, a request for accession of a new party to an agreement on distribution
of benefits from physical reciprocal cash-pooling within a group of financially related entities
was signed by and between EP Energy, a.s. and Energotrans SERVIS, a.s.
On 23 September 2015, a request for accession of a new party to an agreement on distribution
of benefits from physical reciprocal cash-pooling within a group of financially related entities
was signed by and between EP Energy, a.s. and TERMONTA PRAHA a.s.
On 9 December 2015, a request for accession of a new party to an agreement on distribution of
benefits from physical reciprocal cash-pooling within a group of financially related entities was
signed by and between EP Energy, a.s. and EP Cargo a.s.
V.1.4
In 2015 the following operating agreements were effective:
A sublease agreement concluded by and between EP Investment Advisors, s.r.o. and EP Energy,
a.s. on 30 September 2013, including all its amendments.
A sublease agreement concluded by and between EP Investment Advisors, s.r.o. and EP Energy,
a.s. 30 September 2013, including all its amendments.
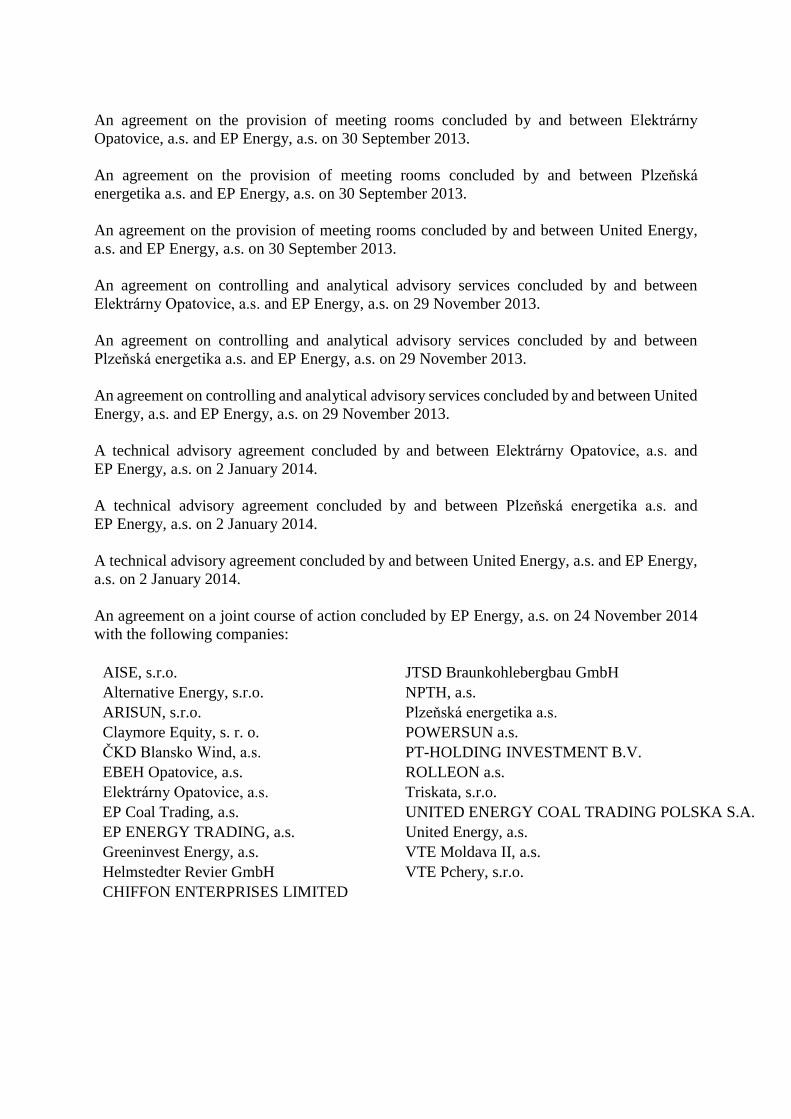
An agreement on the provision of meeting rooms concluded by and between Elektrárny
Opatovice, a.s. and EP Energy, a.s. on 30 September 2013.
An agreement on the provision of meeting rooms concluded by and between Plzeňská
energetika a.s. and EP Energy, a.s. on 30 September 2013.
An agreement on the provision of meeting rooms concluded by and between United Energy,
a.s. and EP Energy, a.s. on 30 September 2013.
An agreement on controlling and analytical advisory services concluded by and between
Elektrárny Opatovice, a.s. and EP Energy, a.s. on 29 November 2013.
An agreement on controlling and analytical advisory services concluded by and between
Plzeňská energetika a.s. and EP Energy, a.s. on 29 November 2013.
An agreement on controlling and analytical advisory services concluded by and between United
Energy, a.s. and EP Energy, a.s. on 29 November 2013.
A technical advisory agreement concluded by and between Elektrárny Opatovice, a.s. and
EP Energy, a.s. on 2 January 2014.
A technical advisory agreement concluded by and between Plzeňská energetika a.s. and
EP Energy, a.s. on 2 January 2014.
A technical advisory agreement concluded by and between United Energy, a.s. and EP Energy,
a.s. on 2 January 2014.
An agreement on a joint course of action concluded by EP Energy, a.s. on 24 November 2014
with the following companies:
AISE, s.r.o. JTSD Braunkohlebergbau GmbH
Alternative Energy, s.r.o. NPTH, a.s.
ARISUN, s.r.o. Plzeňská energetika a.s.
Claymore Equity, s. r. o. POWERSUN a.s.
ČKD Blansko Wind, a.s. PT-HOLDING INVESTMENT B.V.
EBEH Opatovice, a.s. ROLLEON a.s.
Elektrárny Opatovice, a.s. Triskata, s.r.o.
EP Coal Trading, a.s. UNITED ENERGY COAL TRADING POLSKA S.A.
EP ENERGY TRADING, a.s. United Energy, a.s.
Greeninvest Energy, a.s. VTE Moldava II, a.s.
Helmstedter Revier GmbH VTE Pchery, s.r.o.
CHIFFON ENTERPRISES LIMITED

An agreement on a joint course of action concluded by and between Stredoslovenská
energetika, a.s. and EP Energy, a.s. on 15 December 2014.
An agreement on a joint course of action concluded by and between Energotrans SERVIS, a.s.
and EP Energy, a.s. on 23 December 2014.
An agreement on a joint course of action concluded by and between Pražská teplárenská a.s.
and EP Energy, a.s. on 23 December 2014.
An agreement on providing professional assistance concluded by and between EP Investment
Advisors, s.r.o. and EP Energy, a.s. on 2 January 2015.
V.2.
Other juridical acts made between EP Energy, a.s. and other related
entities
Except for the above, no other agreements were concluded by and between EP Energy, a.s. and
related entities, and no supplies or considerations were provided or received between
EP Energy, a.s. and related entities.
EP Energy, a.s. did not take or adopt any other actions or measures in the interest or at the
initiative of related entities.
V.3.
Transactions, receivables and payables of EP Energy, a.s. vis-à-vis related
entities
The receivables and payables of EP Energy, a.s. from/to related entities as at 31 December 2015
are disclosed in the notes to the consolidated financial statements, which form part of the annual
report.


V. Consolidated Financial Statements and Notes to the
Financial Statements
EP Energy, a.s.
Consolidated Financial Statements
as at and for the year ended 31 December 2015
prepared in accordance with International Financial Reporting Standards
as adopted by the European Union

Consolidated financial statements of EP Energy, a.s. as at and for the year ended 31 December 2015
2
Content
Consolidated statement of comprehensive income ....................................................................................................................... 3 Consolidated statement of financial position ................................................................................................................................ 4 Consolidated statement of changes in equity ................................................................................................................................ 5 Consolidated statement of cash flows ........................................................................................................................................... 7 Notes to the consolidated financial statements ............................................................................................................................. 9
1. Background ..................................................................................................................................................................... 9 2. Basis of preparation ...................................................................................................................................................... 11 3. Significant Accounting Policies .................................................................................................................................... 16 4. Determination of fair values ......................................................................................................................................... 32 5. Operating segments ....................................................................................................................................................... 34 6. Acquisitions and contributions of subsidiaries, special purpose entities, joint-ventures and associates ....................... 41 7. Sales .............................................................................................................................................................................. 47 8. Cost of sales .................................................................................................................................................................. 47 9. Personnel expenses ....................................................................................................................................................... 48 10. Emission rights ............................................................................................................................................................. 48 11. Taxes and charges ......................................................................................................................................................... 49 12. Other operating income ................................................................................................................................................. 49 13. Other operating expenses .............................................................................................................................................. 50 14. Finance income and expense, profit (loss) from financial instruments ......................................................................... 51 15. Income tax expenses ..................................................................................................................................................... 51 16. Property, plant and equipment ...................................................................................................................................... 53 17. Intangible assets (including goodwill) .......................................................................................................................... 56 18. Investment property ...................................................................................................................................................... 60 19. Equity accounted investees ........................................................................................................................................... 60 20. Deferred tax assets and liabilities .................................................................................................................................. 62 21. Inventories .................................................................................................................................................................... 65 22. Trade receivables and other assets ................................................................................................................................ 66 23. Cash and cash equivalents ............................................................................................................................................. 66 24. Tax receivables ............................................................................................................................................................. 67 25. Assets and liabilities held for sale ................................................................................................................................. 67 26. Equity ............................................................................................................................................................................ 69 27. Earnings per share ......................................................................................................................................................... 71 28. Non-controlling interest ................................................................................................................................................ 72 29. Loans and borrowings ................................................................................................................................................... 74 30. Provisions...................................................................................................................................................................... 77 31. Deferred income............................................................................................................................................................ 84 32. Financial instruments .................................................................................................................................................... 84 33. Trade payables and other liabilities ............................................................................................................................... 88 34. Financial commitments and contingencies ................................................................................................................... 89 35. Operating leases ............................................................................................................................................................ 90 36. Risk management policies and disclosures ................................................................................................................... 90 37. Related parties ............................................................................................................................................................. 106 38. Group entities .............................................................................................................................................................. 107 39. Litigations and claims ................................................................................................................................................. 109 40. Subsequent events ....................................................................................................................................................... 111 Appendix 1 – Business combinations ................................................................................................................................... 114 Appendix 2 – Restated Consolidated statement of comprehensive income .......................................................................... 117 Appendix 3 – Analysis of results from discontinued operations ........................................................................................... 118 Appendix 4 – Restated Consolidated statement of cash flow ............................................................................................... 119
Consolidated financial statements of EP Energy, a.s. as at and for the year ended 31 December 2015
3
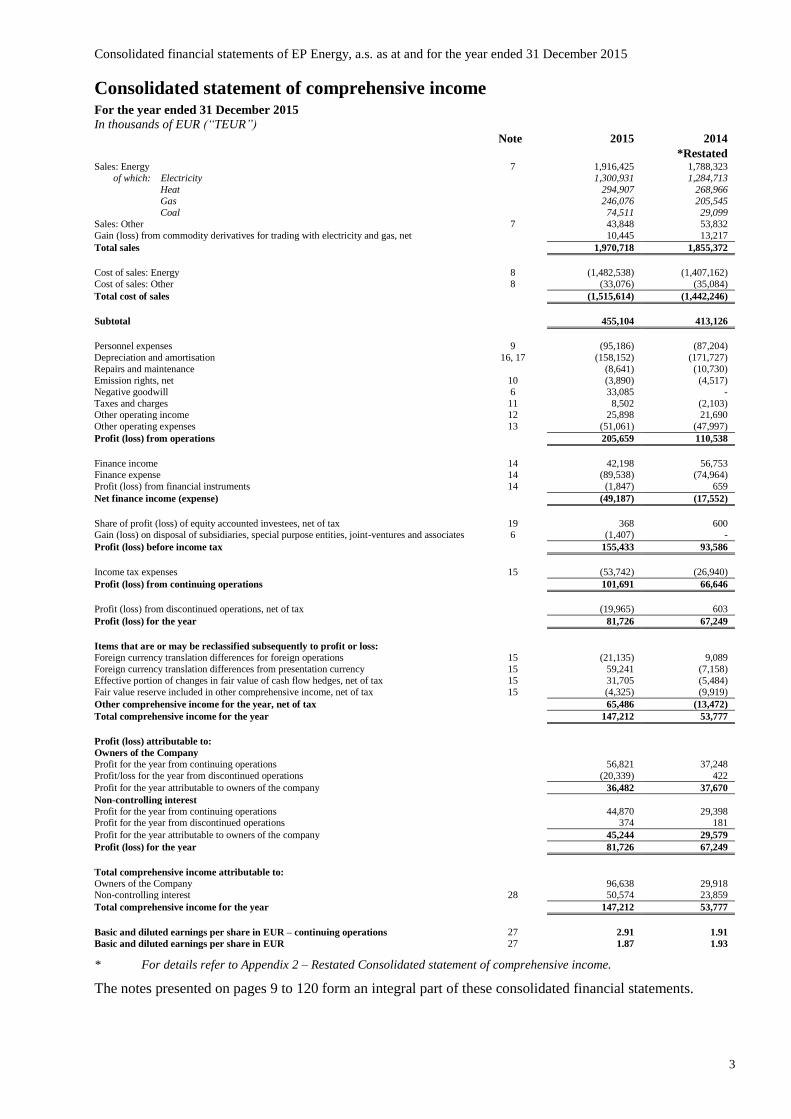
Consolidated statement of comprehensive income For the year ended 31 December 2015
In thousands of EUR (“TEUR”)
Note 2015 2014
*Restated Sales: Energy 7 1,916,425 1,788,323
of which: Electricity 1,300,931 1,284,713
Heat 294,907 268,966
Gas 246,076 205,545
Coal 74,511 29,099
Sales: Other 7 43,848 53,832
Gain (loss) from commodity derivatives for trading with electricity and gas, net 10,445 13,217
Total sales 1,970,718 1,855,372
Cost of sales: Energy 8 (1,482,538) (1,407,162)
Cost of sales: Other 8 (33,076) (35,084)
Total cost of sales (1,515,614) (1,442,246)
Subtotal 455,104 413,126
Personnel expenses 9 (95,186) (87,204)
Depreciation and amortisation 16, 17 (158,152) (171,727)
Repairs and maintenance (8,641) (10,730)
Emission rights, net 10 (3,890) (4,517)
Negative goodwill 6 33,085 -
Taxes and charges 11 8,502 (2,103) Other operating income 12 25,898 21,690
Other operating expenses 13 (51,061) (47,997)
Profit (loss) from operations 205,659 110,538
Finance income 14 42,198 56,753 Finance expense 14 (89,538) (74,964)
Profit (loss) from financial instruments 14 (1,847) 659
Net finance income (expense) (49,187) (17,552)
Share of profit (loss) of equity accounted investees, net of tax 19 368 600 Gain (loss) on disposal of subsidiaries, special purpose entities, joint-ventures and associates 6 (1,407) -
Profit (loss) before income tax 155,433 93,586
Income tax expenses 15 (53,742) (26,940)
Profit (loss) from continuing operations 101,691 66,646
Profit (loss) from discontinued operations, net of tax (19,965) 603
Profit (loss) for the year 81,726 67,249
Items that are or may be reclassified subsequently to profit or loss:
Foreign currency translation differences for foreign operations 15 (21,135) 9,089
Foreign currency translation differences from presentation currency 15 59,241 (7,158)
Effective portion of changes in fair value of cash flow hedges, net of tax 15 31,705 (5,484)
Fair value reserve included in other comprehensive income, net of tax 15 (4,325) (9,919)
Other comprehensive income for the year, net of tax 65,486 (13,472)
Total comprehensive income for the year 147,212 53,777
Profit (loss) attributable to:
Owners of the Company
Profit for the year from continuing operations 56,821 37,248
Profit/loss for the year from discontinued operations (20,339) 422
Profit for the year attributable to owners of the company 36,482 37,670
Non-controlling interest
Profit for the year from continuing operations 44,870 29,398 Profit for the year from discontinued operations 374 181
Profit for the year attributable to owners of the company 45,244 29,579
Profit (loss) for the year 81,726 67,249
Total comprehensive income attributable to:
Owners of the Company 96,638 29,918 Non-controlling interest 28 50,574 23,859
Total comprehensive income for the year 147,212 53,777
Basic and diluted earnings per share in EUR – continuing operations 27 2.91 1.91
Basic and diluted earnings per share in EUR 27 1.87 1.93
* For details refer to Appendix 2 – Restated Consolidated statement of comprehensive income.
The notes presented on pages 9 to 120 form an integral part of these consolidated financial statements.

Consolidated financial statements of EP Energy, a.s. as at and for the year ended 31 December 2015
4
Consolidated statement of financial position
As at 31 December 2015
In thousands of EUR (“TEUR”)
Note 2015 2014
Assets
Property, plant and equipment 16 1,605,706 2,245,936
Intangible assets 17 82,369 154,996
Goodwill 17 98,210 96,241
Investment property 18 2,531 -
Equity accounted investees 19 8,407 127,376
Financial instruments and other financial assets 32 8,306 57,152
of which receivables from the parent company/ultimate parent company - -
Trade receivables and other assets 22 21,488 28,999
Deferred tax assets 20 1,898 9,627
Total non-current assets 1,828,915 2,720,327
Inventories 21 47,319 77,022
Extracted minerals and mineral products - 7,926
Trade receivables and other assets 22 294,944 356,919
Financial instruments and other financial assets 32 313,718 553,933
of which receivables from the parent company/ultimate parent company 305,810 548,115
Prepayments and other deferrals 3,073 2,803
Tax receivables 24 20,320 21,441
Cash and cash equivalents 23 131,629 200,978
Assets/disposal groups held for sale 25 1,094,041 26,131
Total current assets 1,905,044 1,247,153
Total assets 3,733,959 3,967,480
Equity
Share capital 26 504,843 769,180
Share premium 116,434 116,434
Reserves (378,646) (438,802)
Retained earnings 400,240 462,084
Total equity attributable to equity holders 642,871 908,896
Non-controlling interest 28 474,949 462,175
Total equity 1,117,820 1,371,071
Liabilities
Loans and borrowings 29 1,304,272 1,267,328
of which owed to the parent company/ultimate parent company - -
Financial instruments and financial liabilities 32 513 680
Provisions 30 16,325 360,247
Deferred income 31 72,279 63,996
Deferred tax liabilities 20 182,724 240,922
Trade payables and other liabilities 33 6,668 71,951
Total non-current liabilities 1,582,781 2,005,124
Trade payables and other liabilities 33 286,080 350,975
Loans and borrowings 29 45,555 126,430
of which owed to the parent company/ultimate parent company 2,637 2,462
Financial instruments and financial liabilities 32 5,121 830
Provisions 30 23,467 83,248
Deferred income 31 11,459 4,015
Current income tax liability 13,303 9,372
Liabilities from disposal groups held for sale 25 648,373 16,415
Total current liabilities 1,033,358 591,285
Total liabilities 2,616,139 2,596,409
Total equity and liabilities 3,733,959 3,967,480
The notes presented on pages 9 to 120 form an integral part of these consolidated financial statements.
Consolidated financial statements of EP Energy, a.s. as at and for the year ended 31 December 2015
5
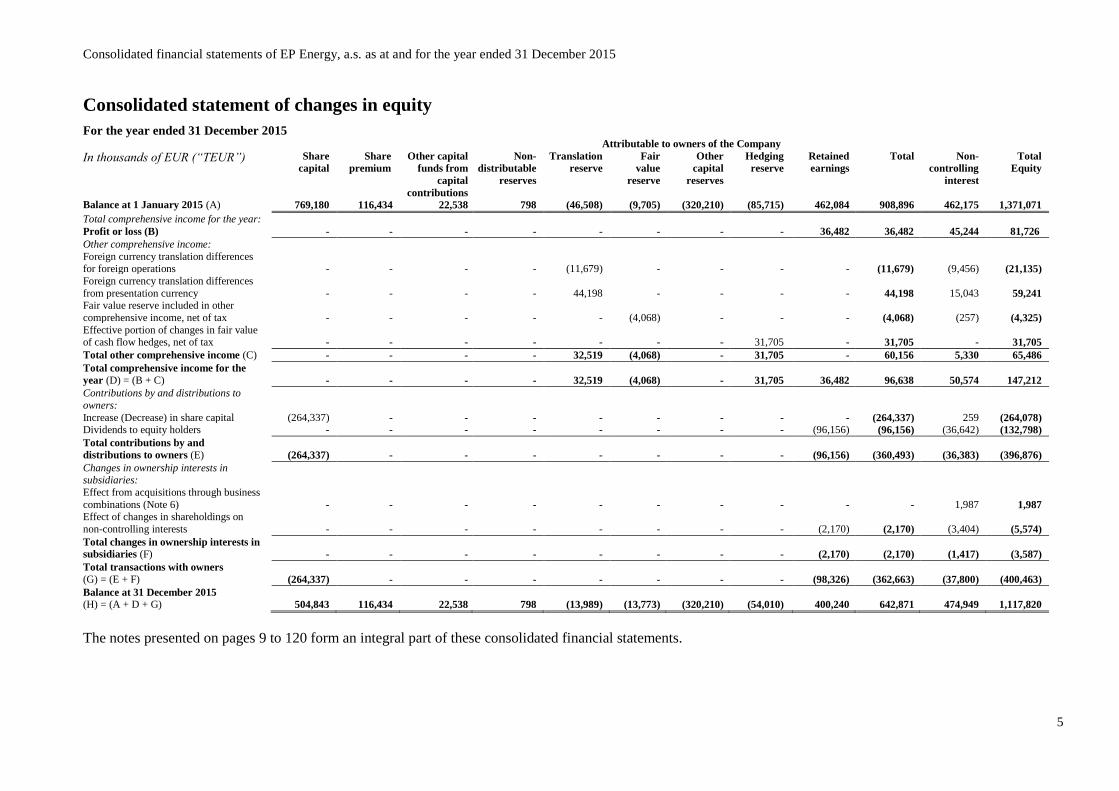
Consolidated statement of changes in equity
For the year ended 31 December 2015 Attributable to owners of the Company
In thousands of EUR (“TEUR”)
Share
capital
Share
premium
Other capital
funds from
capital
contributions
Non-
distributable
reserves
Translation
reserve
Fair
value
reserve
Other
capital
reserves
Hedging
reserve
Retained
earnings
Total Non-
controlling
interest
Total
Equity
Balance at 1 January 2015 (A) 769,180 116,434 22,538 798 (46,508) (9,705) (320,210) (85,715) 462,084 908,896 462,175 1,371,071
Total comprehensive income for the year:
Profit or loss (B) - - - - - - - - 36,482 36,482 45,244 81,726
Other comprehensive income:
Foreign currency translation differences
for foreign operations - - - - (11,679) - - - - (11,679) (9,456) (21,135)
Foreign currency translation differences
from presentation currency - - - - 44,198 - - - - 44,198 15,043 59,241
Fair value reserve included in other
comprehensive income, net of tax - - - - - (4,068) - - - (4,068) (257) (4,325)
Effective portion of changes in fair value of cash flow hedges, net of tax - - - - - - - 31,705 - 31,705 - 31,705
Total other comprehensive income (C) - - - - 32,519 (4,068) - 31,705 - 60,156 5,330 65,486
Total comprehensive income for the
year (D) = (B + C) - - - - 32,519 (4,068) - 31,705 36,482 96,638 50,574 147,212
Contributions by and distributions to
owners:
Increase (Decrease) in share capital (264,337) - - - - - - - - (264,337) 259 (264,078)
Dividends to equity holders - - - - - - - - (96,156) (96,156) (36,642) (132,798)
Total contributions by and
distributions to owners (E) (264,337) - - - - - - - (96,156) (360,493) (36,383) (396,876)
Changes in ownership interests in subsidiaries:
Effect from acquisitions through business
combinations (Note 6) - - - - - - - - - - 1,987 1,987
Effect of changes in shareholdings on
non-controlling interests - - - - - - - - (2,170) (2,170) (3,404) (5,574)
Total changes in ownership interests in
subsidiaries (F) - - - - - - - - (2,170) (2,170) (1,417) (3,587)
Total transactions with owners
(G) = (E + F) (264,337) - - - - - - - (98,326) (362,663) (37,800) (400,463)
Balance at 31 December 2015
(H) = (A + D + G) 504,843 116,434 22,538 798 (13,989) (13,773) (320,210) (54,010) 400,240 642,871 474,949 1,117,820
The notes presented on pages 9 to 120 form an integral part of these consolidated financial statements.
Consolidated financial statements of EP Energy, a.s. as at and for the year ended 31 December 2015
6
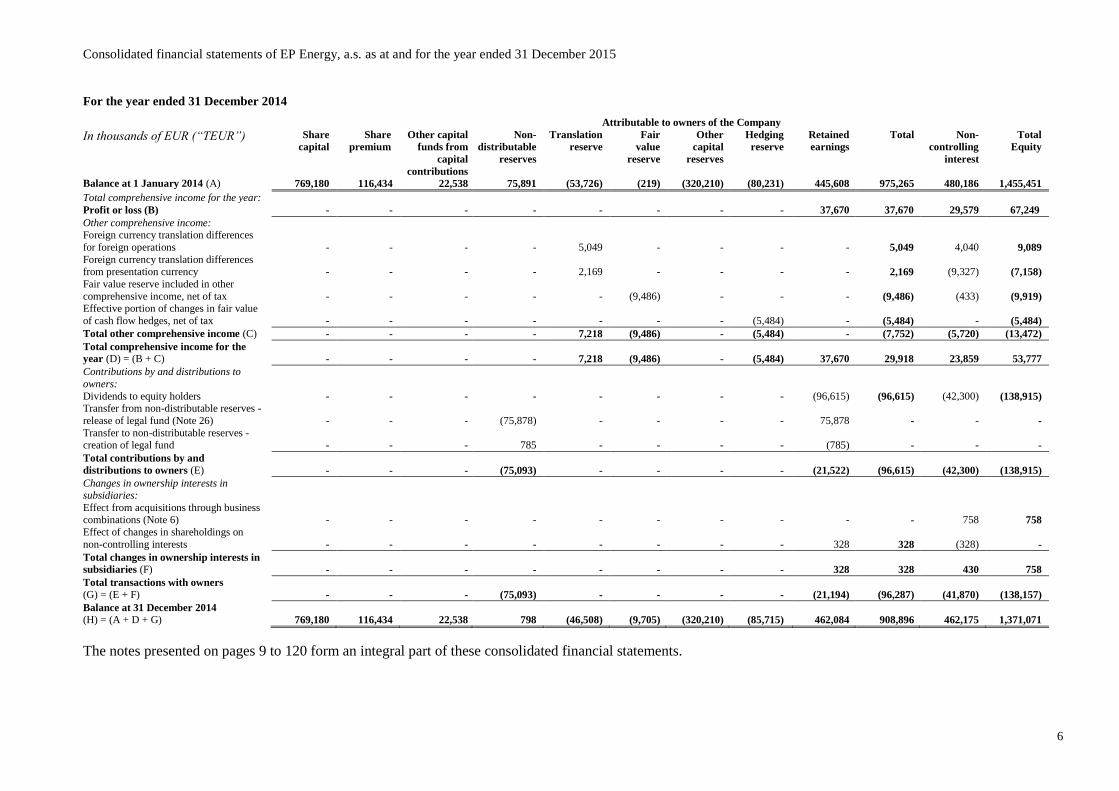
For the year ended 31 December 2014
Attributable to owners of the Company
In thousands of EUR (“TEUR”)
Share
capital
Share
premium
Other capital
funds from
capital
contributions
Non-
distributable
reserves
Translation
reserve
Fair
value
reserve
Other
capital
reserves
Hedging
reserve
Retained
earnings
Total Non-
controlling
interest
Total
Equity
Balance at 1 January 2014 (A) 769,180 116,434 22,538 75,891 (53,726) (219) (320,210) (80,231) 445,608 975,265 480,186 1,455,451
Total comprehensive income for the year:
Profit or loss (B) - - - - - - - - 37,670 37,670 29,579 67,249
Other comprehensive income:
Foreign currency translation differences
for foreign operations - - - - 5,049 - - - - 5,049 4,040 9,089
Foreign currency translation differences
from presentation currency - - - - 2,169 - - - - 2,169 (9,327) (7,158)
Fair value reserve included in other
comprehensive income, net of tax - - - - - (9,486) - - - (9,486) (433) (9,919)
Effective portion of changes in fair value
of cash flow hedges, net of tax - - - - - - - (5,484) - (5,484) - (5,484)
Total other comprehensive income (C) - - - - 7,218 (9,486) - (5,484) - (7,752) (5,720) (13,472)
Total comprehensive income for the
year (D) = (B + C) - - - - 7,218 (9,486) - (5,484) 37,670 29,918 23,859 53,777
Contributions by and distributions to
owners:
Dividends to equity holders - - - - - - - - (96,615) (96,615) (42,300) (138,915)
Transfer from non-distributable reserves -
release of legal fund (Note 26) - - - (75,878) - - - - 75,878 - - -
Transfer to non-distributable reserves -
creation of legal fund - - - 785 - - - - (785) - - -
Total contributions by and
distributions to owners (E) - - - (75,093) - - - - (21,522) (96,615) (42,300) (138,915)
Changes in ownership interests in subsidiaries:
Effect from acquisitions through business combinations (Note 6) - - - - - - - - - - 758 758
Effect of changes in shareholdings on
non-controlling interests - - - - - - - - 328 328 (328) -
Total changes in ownership interests in
subsidiaries (F) - - - - - - - - 328 328 430 758
Total transactions with owners
(G) = (E + F) - - - (75,093) - - - - (21,194) (96,287) (41,870) (138,157)
Balance at 31 December 2014
(H) = (A + D + G) 769,180 116,434 22,538 798 (46,508) (9,705) (320,210) (85,715) 462,084 908,896 462,175 1,371,071
The notes presented on pages 9 to 120 form an integral part of these consolidated financial statements.
Consolidated financial statements of EP Energy, a.s. as at and for the year ended 31 December 2015
7
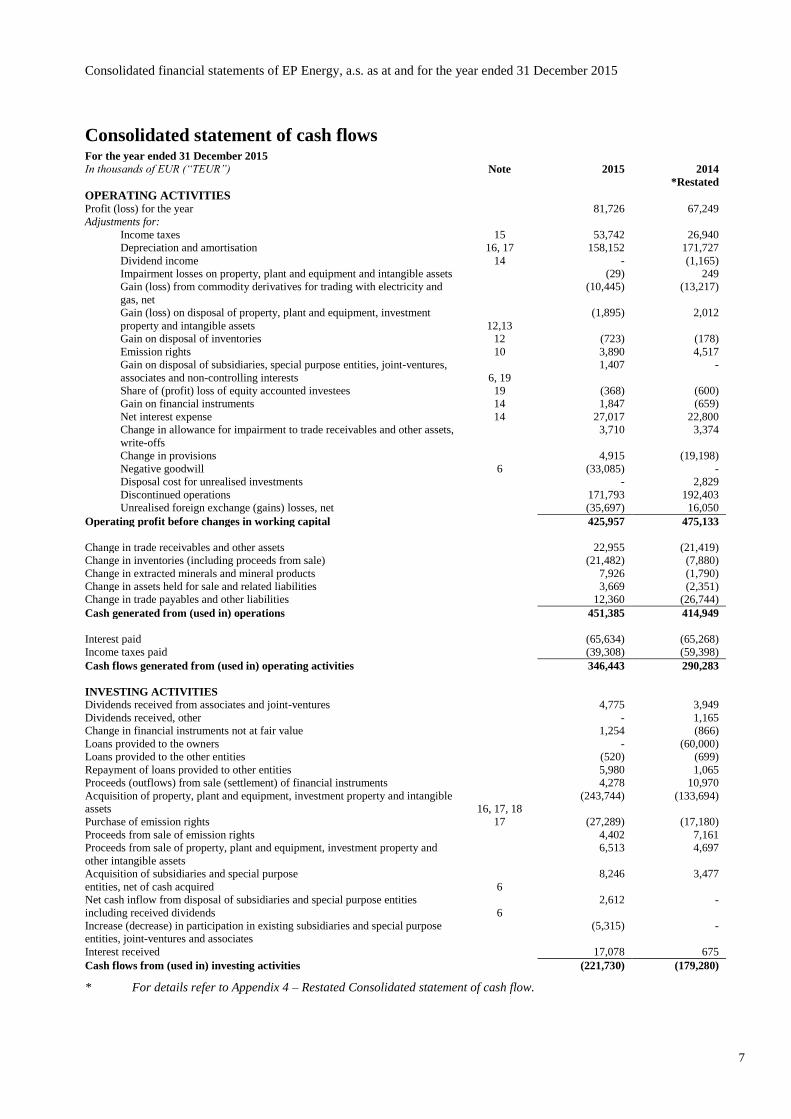
Consolidated statement of cash flows For the year ended 31 December 2015
In thousands of EUR (“TEUR”) Note 2015 2014
*Restated
OPERATING ACTIVITIES Profit (loss) for the year 81,726 67,249
Adjustments for:
Income taxes 15 53,742 26,940
Depreciation and amortisation 16, 17 158,152 171,727
Dividend income 14 - (1,165)
Impairment losses on property, plant and equipment and intangible assets (29) 249
Gain (loss) from commodity derivatives for trading with electricity and
gas, net
(10,445) (13,217)
Gain (loss) on disposal of property, plant and equipment, investment
property and intangible assets 12,13
(1,895) 2,012
Gain on disposal of inventories 12 (723) (178)
Emission rights 10 3,890 4,517
Gain on disposal of subsidiaries, special purpose entities, joint-ventures,
associates and non-controlling interests 6, 19
1,407 -
Share of (profit) loss of equity accounted investees 19 (368) (600)
Gain on financial instruments 14 1,847 (659)
Net interest expense 14 27,017 22,800
Change in allowance for impairment to trade receivables and other assets,
write-offs
3,710 3,374
Change in provisions 4,915 (19,198)
Negative goodwill 6 (33,085) -
Disposal cost for unrealised investments - 2,829
Discontinued operations 171,793 192,403
Unrealised foreign exchange (gains) losses, net (35,697) 16,050
Operating profit before changes in working capital 425,957 475,133
Change in trade receivables and other assets 22,955 (21,419)
Change in inventories (including proceeds from sale) (21,482) (7,880)
Change in extracted minerals and mineral products 7,926 (1,790)
Change in assets held for sale and related liabilities 3,669 (2,351)
Change in trade payables and other liabilities 12,360 (26,744)
Cash generated from (used in) operations 451,385 414,949
Interest paid (65,634) (65,268)
Income taxes paid (39,308) (59,398)
Cash flows generated from (used in) operating activities 346,443 290,283
INVESTING ACTIVITIES
Dividends received from associates and joint-ventures 4,775 3,949
Dividends received, other - 1,165
Change in financial instruments not at fair value 1,254 (866)
Loans provided to the owners - (60,000)
Loans provided to the other entities (520) (699)
Repayment of loans provided to other entities 5,980 1,065
Proceeds (outflows) from sale (settlement) of financial instruments 4,278 10,970
Acquisition of property, plant and equipment, investment property and intangible
assets 16, 17, 18
(243,744) (133,694)
Purchase of emission rights 17 (27,289) (17,180)
Proceeds from sale of emission rights 4,402 7,161
Proceeds from sale of property, plant and equipment, investment property and
other intangible assets
6,513 4,697
Acquisition of subsidiaries and special purpose
entities, net of cash acquired 6
8,246 3,477
Net cash inflow from disposal of subsidiaries and special purpose entities
including received dividends 6
2,612 -
Increase (decrease) in participation in existing subsidiaries and special purpose
entities, joint-ventures and associates
(5,315) -
Interest received 17,078 675
Cash flows from (used in) investing activities (221,730) (179,280)
* For details refer to Appendix 4 – Restated Consolidated statement of cash flow.
Consolidated financial statements of EP Energy, a.s. as at and for the year ended 31 December 2015
8
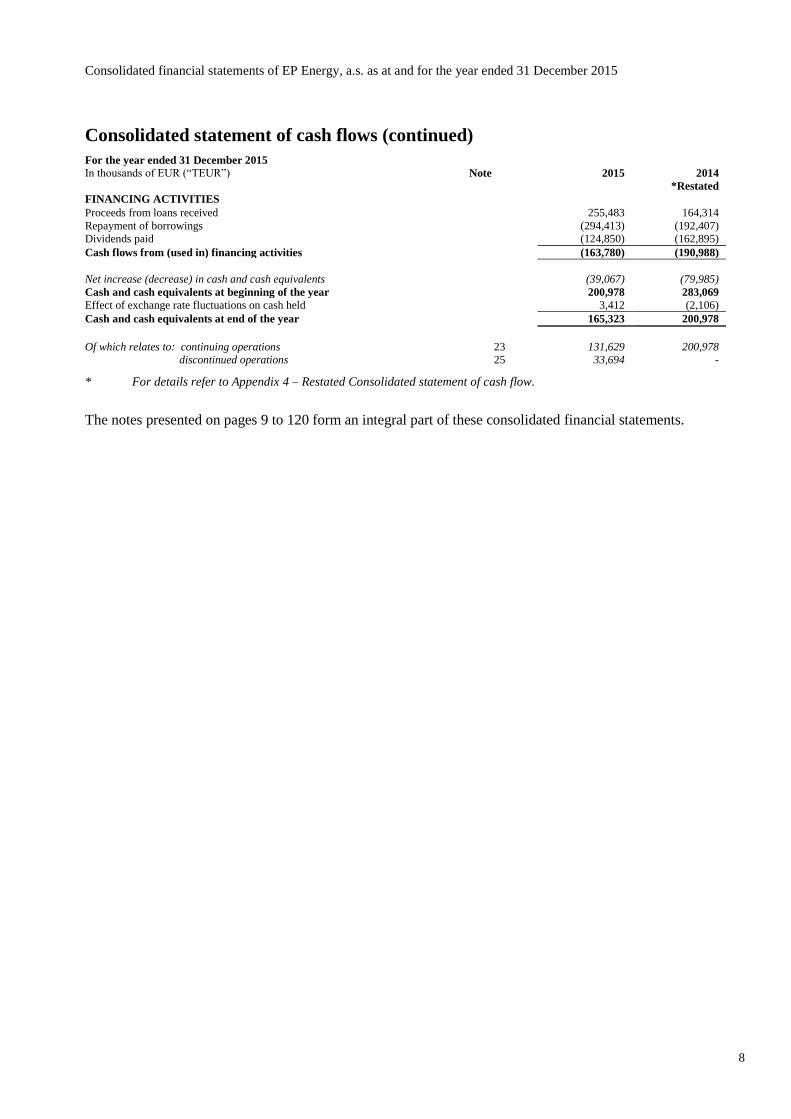
Consolidated statement of cash flows (continued)
For the year ended 31 December 2015
In thousands of EUR (“TEUR”) Note 2015 2014
*Restated
FINANCING ACTIVITIES Proceeds from loans received 255,483 164,314
Repayment of borrowings (294,413) (192,407)
Dividends paid (124,850) (162,895)
Cash flows from (used in) financing activities (163,780) (190,988)
Net increase (decrease) in cash and cash equivalents (39,067) (79,985)
Cash and cash equivalents at beginning of the year 200,978 283,069
Effect of exchange rate fluctuations on cash held 3,412 (2,106)
Cash and cash equivalents at end of the year 165,323 200,978
Of which relates to: continuing operations 23 131,629 200,978
discontinued operations 25 33,694 -
* For details refer to Appendix 4 – Restated Consolidated statement of cash flow.
The notes presented on pages 9 to 120 form an integral part of these consolidated financial statements.
Notes to the consolidated financial statements of EP Energy, a.s. as at and for the year ended 31 December 2015
9
Notes to the consolidated financial statements
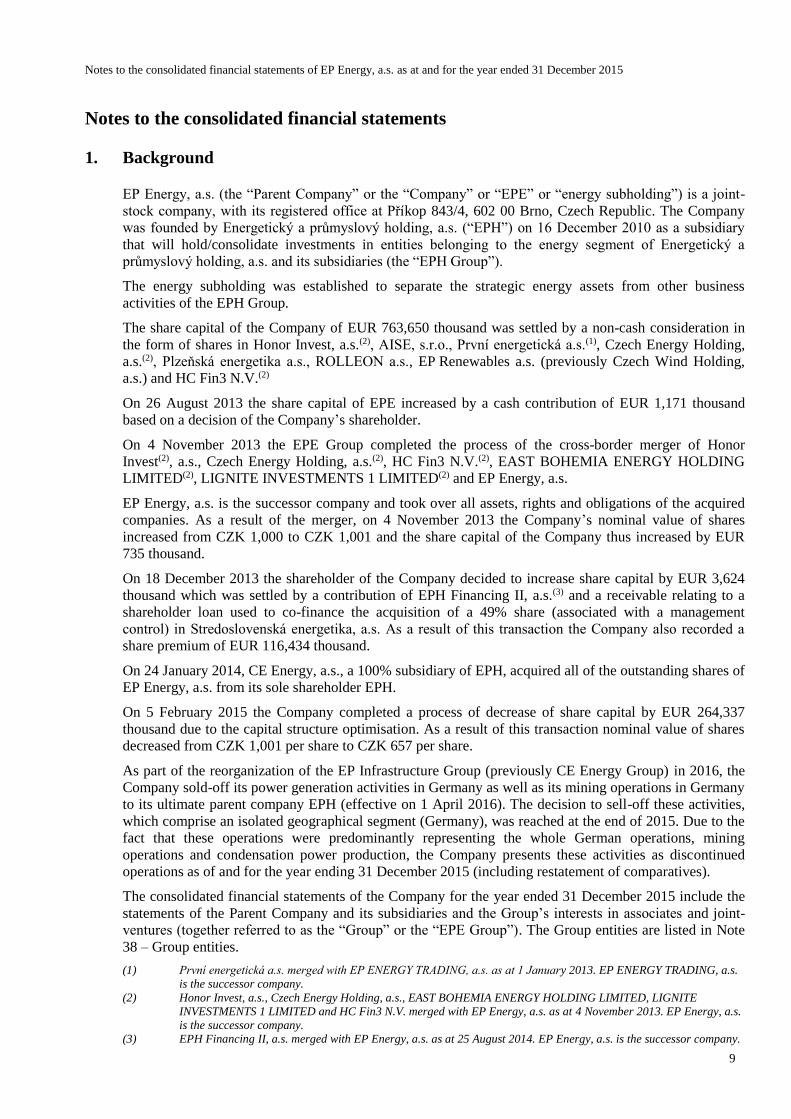
1. Background
EP Energy, a.s. (the “Parent Company” or the “Company” or “EPE” or “energy subholding”) is a joint-
stock company, with its registered office at Příkop 843/4, 602 00 Brno, Czech Republic. The Company
was founded by Energetický a průmyslový holding, a.s. (“EPH”) on 16 December 2010 as a subsidiary
that will hold/consolidate investments in entities belonging to the energy segment of Energetický a
průmyslový holding, a.s. and its subsidiaries (the “EPH Group”).
The energy subholding was established to separate the strategic energy assets from other business
activities of the EPH Group.
The share capital of the Company of EUR 763,650 thousand was settled by a non-cash consideration in
the form of shares in Honor Invest, a.s.(2), AISE, s.r.o., První energetická a.s.(1), Czech Energy Holding,
a.s.(2), Plzeňská energetika a.s., ROLLEON a.s., EP Renewables a.s. (previously Czech Wind Holding,
a.s.) and HC Fin3 N.V.(2)
On 26 August 2013 the share capital of EPE increased by a cash contribution of EUR 1,171 thousand
based on a decision of the Company’s shareholder.
On 4 November 2013 the EPE Group completed the process of the cross-border merger of Honor
Invest(2), a.s., Czech Energy Holding, a.s.(2), HC Fin3 N.V.(2), EAST BOHEMIA ENERGY HOLDING
LIMITED(2), LIGNITE INVESTMENTS 1 LIMITED(2) and EP Energy, a.s.
EP Energy, a.s. is the successor company and took over all assets, rights and obligations of the acquired
companies. As a result of the merger, on 4 November 2013 the Company’s nominal value of shares
increased from CZK 1,000 to CZK 1,001 and the share capital of the Company thus increased by EUR
735 thousand.
On 18 December 2013 the shareholder of the Company decided to increase share capital by EUR 3,624
thousand which was settled by a contribution of EPH Financing II, a.s.(3) and a receivable relating to a
shareholder loan used to co-finance the acquisition of a 49% share (associated with a management
control) in Stredoslovenská energetika, a.s. As a result of this transaction the Company also recorded a
share premium of EUR 116,434 thousand.
On 24 January 2014, CE Energy, a.s., a 100% subsidiary of EPH, acquired all of the outstanding shares of
EP Energy, a.s. from its sole shareholder EPH.
On 5 February 2015 the Company completed a process of decrease of share capital by EUR 264,337
thousand due to the capital structure optimisation. As a result of this transaction nominal value of shares
decreased from CZK 1,001 per share to CZK 657 per share.
As part of the reorganization of the EP Infrastructure Group (previously CE Energy Group) in 2016, the
Company sold-off its power generation activities in Germany as well as its mining operations in Germany
to its ultimate parent company EPH (effective on 1 April 2016). The decision to sell-off these activities,
which comprise an isolated geographical segment (Germany), was reached at the end of 2015. Due to the
fact that these operations were predominantly representing the whole German operations, mining
operations and condensation power production, the Company presents these activities as discontinued
operations as of and for the year ending 31 December 2015 (including restatement of comparatives).
The consolidated financial statements of the Company for the year ended 31 December 2015 include the
statements of the Parent Company and its subsidiaries and the Group’s interests in associates and joint-
ventures (together referred to as the “Group” or the “EPE Group”). The Group entities are listed in Note
38 – Group entities.
(1) První energetická a.s. merged with EP ENERGY TRADING, a.s. as at 1 January 2013. EP ENERGY TRADING, a.s.
is the successor company.
(2) Honor Invest, a.s., Czech Energy Holding, a.s., EAST BOHEMIA ENERGY HOLDING LIMITED, LIGNITE
INVESTMENTS 1 LIMITED and HC Fin3 N.V. merged with EP Energy, a.s. as at 4 November 2013. EP Energy, a.s.
is the successor company.
(3) EPH Financing II, a.s. merged with EP Energy, a.s. as at 25 August 2014. EP Energy, a.s. is the successor company.
Notes to the consolidated financial statements of EP Energy, a.s. as at and for the year ended 31 December 2015
10
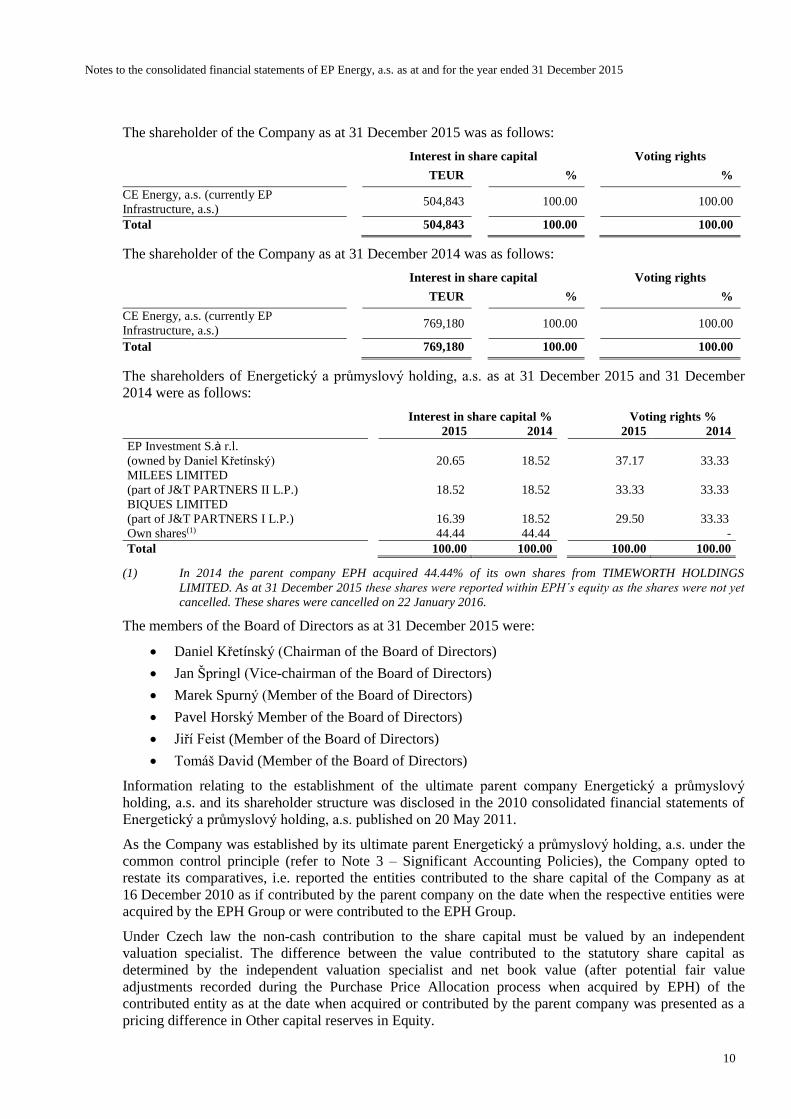
The shareholder of the Company as at 31 December 2015 was as follows:
Interest in share capital Voting rights
TEUR % %
CE Energy, a.s. (currently EP
Infrastructure, a.s.)
504,843 100.00 100.00
Total 504,843 100.00 100.00
The shareholder of the Company as at 31 December 2014 was as follows:
Interest in share capital Voting rights
TEUR % %
CE Energy, a.s. (currently EP
Infrastructure, a.s.)
769,180 100.00 100.00
Total 769,180 100.00 100.00
The shareholders of Energetický a průmyslový holding, a.s. as at 31 December 2015 and 31 December
2014 were as follows:
Interest in share capital % Voting rights %
2015 2014 2015 2014
EP Investment S.à r.l.
(owned by Daniel Křetínský)
20.65 18.52
37.17 33.33
MILEES LIMITED
(part of J&T PARTNERS II L.P.)
18.52 18.52
33.33 33.33
BIQUES LIMITED
(part of J&T PARTNERS I L.P.)
16.39 18.52
29.50 33.33
Own shares(1) 44.44 44.44 -
Total 100.00 100.00 100.00 100.00
(1) In 2014 the parent company EPH acquired 44.44% of its own shares from TIMEWORTH HOLDINGS
LIMITED. As at 31 December 2015 these shares were reported within EPH´s equity as the shares were not yet
cancelled. These shares were cancelled on 22 January 2016.
The members of the Board of Directors as at 31 December 2015 were:
Daniel Křetínský (Chairman of the Board of Directors)
Jan Špringl (Vice-chairman of the Board of Directors)
Marek Spurný (Member of the Board of Directors)
Pavel Horský Member of the Board of Directors)
Jiří Feist (Member of the Board of Directors)
Tomáš David (Member of the Board of Directors)
Information relating to the establishment of the ultimate parent company Energetický a průmyslový
holding, a.s. and its shareholder structure was disclosed in the 2010 consolidated financial statements of
Energetický a průmyslový holding, a.s. published on 20 May 2011.
As the Company was established by its ultimate parent Energetický a průmyslový holding, a.s. under the
common control principle (refer to Note 3 – Significant Accounting Policies), the Company opted to
restate its comparatives, i.e. reported the entities contributed to the share capital of the Company as at
16 December 2010 as if contributed by the parent company on the date when the respective entities were
acquired by the EPH Group or were contributed to the EPH Group.
Under Czech law the non-cash contribution to the share capital must be valued by an independent
valuation specialist. The difference between the value contributed to the statutory share capital as
determined by the independent valuation specialist and net book value (after potential fair value
adjustments recorded during the Purchase Price Allocation process when acquired by EPH) of the
contributed entity as at the date when acquired or contributed by the parent company was presented as a
pricing difference in Other capital reserves in Equity.

Notes to the consolidated financial statements of EP Energy, a.s. as at and for the year ended 31 December 2015
11
2. Basis of preparation
(a) Statement of compliance
The consolidated financial statements have been prepared in accordance with international accounting
standards (International Accounting Standards – IAS and International Financial Reporting Standards –
IFRS) issued by International Accounting Standards Board (IASB), as adopted by the European Union.
The consolidated financial statements were approved by the board of directors on 29 April 2016.
(b) Basis of measurement
The consolidated financial statements have been prepared on a going-concern basis using the historical
cost method, except for the following material items in the statement of financial position, which are
measured at fair value:
derivative financial instruments
available-for-sale financial instruments
Non-current assets and disposal groups held for sale are stated at the lower of their carrying amount and
fair value less costs to sell.
The accounting policies described in the following paragraphs have been consistently applied by the
Group entities and between accounting periods.
(c) Functional and presentation currency
The consolidated financial statements are presented in Euro (“EUR”). The Company’s functional
currency is the Czech crown (“CZK”). All financial information presented in Euros has been rounded to
the nearest thousand. The reason for the presentation currency is that by currency, EPE Group revenues
and operating profit generated in Euro represent a significant share of the total revenues and operating
profit.
(d) Use of estimates and judgments
The preparation of financial statements in accordance with International Financial Reporting Standards
requires the use of certain critical accounting estimates that affect the reported amounts of assets,
liabilities, income and expenses. It also requires management to exercise judgment in the process of
applying the Company’s accounting policies. The resulting accounting estimates will, by definition,
seldom equal the related actual results.
Estimates and assumptions are reviewed on an ongoing basis. Revisions to accounting estimates are
recognised in the period in which the estimate is revised if the revision affects only that period, or in the
period of the revision and future periods if the revision affects both current and future periods.
i. Assumptions and estimation uncertainties
Information about assumptions and estimation uncertainties that have a significant risk of resulting in a
material adjustment in the following years is included in the following notes:
Notes 6 and 17 – accounting for business combinations, recognition of goodwill/negative goodwill,
impairment testing of goodwill,
Note 7 – Revenues,
Note 25 – disposal of JTSD Braunkohlebergbau GmbH and its subsidiaries and associates classified as
discontinued operations,
Note 30 – recognition and measurement of provisions,
Notes 29, 32 and 36 – valuation of loans and borrowings and financial instruments,
Note 39 – litigations.
Measurement of fair values
A number of the Group’s accounting policies and disclosures require the measurement of fair values, for
both financial and non-financial assets and liabilities.
Notes to the consolidated financial statements of EP Energy, a.s. as at and for the year ended 31 December 2015
12
The Group has an established control framework with respect to the measurement of fair values. This
includes a valuation team that has overall responsibility for overseeing all significant fair value
measurements, including Level 3 fair values.
The valuation team regularly reviews significant unobservable inputs and valuation adjustments. If third
party information, such as broker quotes or pricing services, is used to measure fair values, then the
valuation team assesses the evidence obtained from the third parties to support the conclusion that such
valuations meet the requirements of IFRS, including the level in the fair value hierarchy in which such
valuation should be classified.
When measuring the fair value of an asset or a liability, the Group uses market observable data as far as
possible. Fair values are categorised into different levels in a fair value hierarchy based on the inputs used
in the valuation techniques as follows:
Level 1: quoted prices (unadjusted) in active markets for identical assets or liabilities.
Level 2: inputs other than quoted prices included in Level 1 that are observable for the asset or liability,
either directly (i.e. as prices) or indirectly (i.e. derived from prices).
Level 3: inputs for the asset or liability that are not based on observable market data (unobservable
inputs).
If the inputs used to measure the fair value of an asset or a liability might be categorised in different level
of the fair value hierarchy, then the fair value measurement is categorised in its entirety in the same level
of the fair value hierarchy as the lowest level input that is significant to the entire measurement.
The Group recognises transfers between levels of the fair value hierarchy at the end of the reporting
period during which the change has occurred.
ii. Judgements
Information about judgements made in the application of accounting policies that have the most
significant effects on the amounts recognised in the consolidated financial statements is included in the
following notes:
Notes 6 and 17 – accounting for business combinations, recognition of goodwill/negative goodwill,
impairment testing of goodwill,
Note 25 – accounting for a sale of JTSD Braunkohlebergbau GmbH and its subsidiaries and associates
as at 31 December 2015,
Note 30 – recognition and measurement of provisions.
(e) Recently issued accounting standards
i. Newly adopted Standards, Amendments to standards and Interpretations effective for the year
ended 31 December 2015 that have been applied in preparing the Group’s financial statements
The following paragraphs provide a summary of the key requirements of IFRSs that are effective for
annual periods beginning on or after 1 January 2015 and that have thus been applied by the Group for the
first time.
IFRIC 21 Levies (effective for annual periods beginning on or after 1 January 2015)
The Interpretation provides guidance as to the identification of the obligating event giving rise to a
liability, and to the timing of recognising a liability to pay a levy imposed by government.
In accordance with the Interpretation, the obligating event is the activity that triggers the payment of that
levy, as identified in the relevant legislation and as a consequence, the liability for paying the levy is
recognised when this event occurs.
The liability to pay a levy is recognised progressively if the obligating event occurs over a period of time.
If the obligating event is the reaching of a minimum activity threshold, the corresponding liability is
recognised when that minimum activity threshold is reached.

Notes to the consolidated financial statements of EP Energy, a.s. as at and for the year ended 31 December 2015
13
The Interpretation sets out that an entity cannot have a constructive obligation to pay a levy that will be
triggered by operating in a future period as a result of the entity being economically compelled to
continue to operate in that future period.
This standard does not have any impact on the consolidated financial statements, since it does not result
in a change in the Group‘s accounting policy regarding levies imposed by governments.
ii. Standards adopted by the EU but not yet effective
At the date of authorisation of these consolidated financial statements, the following significant
Standards, Amendments to Standards and Interpretations have been issued but are not yet effective for the
period ended 31 December 2015 and thus have not been adopted by the Group:
Amendments to IFRS 11 – Accounting for Acquisitions of Interests in Joint Operations (effective
for annual periods beginning on or after 1 January 2016)
The amendments require business combination accounting to be applied to acquisitions of interests in a
joint operation that constitutes a business.
Business combination accounting also applies to the acquisition of additional interests in a joint operation
while the joint operator retains joint control. The additional interest acquired will be measured at fair
value. The previously held interests in the joint operation will not be remeasured.
It is expected that the amendments will not have a material impact on the Group’s financial statements
because the Group has an existing accounting policy to account for acquisitions of joint operations
consistent with that set out in the amendments.
Amendments to IAS 1 – Presentation of Financial Statements (effective for annual periods
beginning on or after 1 January 2016)
The Amendments to IAS 1 include the following five improvements to the disclosure requirements
contained in the standard.
The guidance on materiality in IAS 1 has been amended to clarify that:
Immaterial information can detract from useful information.
Materiality applies to the whole of the financial statements.
Materiality applies to each disclosure requirement in an IFRS.
The guidance on the order of the notes (including the accounting policies) have been amended, to:
Remove language from IAS 1 that has been interpreted as prescribing the order of notes to the
financial statements.
Clarify that entities have flexibility about where they disclose accounting policies in the financial
statements
The Group expects that the amendments will not have a material impact on the presentation of the
financial statements of the Group.
Amendments to IAS 16 and IAS 38 – Clarification of Acceptable Methods of Depreciation and
Amortisation (Effective for annual periods beginning on or after 1 January 2016)
The amendments explicitly state that revenue-based methods of depreciation cannot be used for property,
plant and equipment.
The amendments introduce a rebuttable presumption that the use of revenue-based amortisation methods
for intangible assets is inappropriate. This presumption can be overcome only when revenue and the
consumption of the economic benefits of the intangible asset are ‘highly correlated’, or when the
intangible asset is expressed as a measure of revenue.
It is expected that the amendments will not have any impact on the Group’s financial statements as the
Group does not apply revenue-based methods of amortisation/depreciation.
Notes to the consolidated financial statements of EP Energy, a.s. as at and for the year ended 31 December 2015
14
Amendments to IAS 16 Property Plant and Equipment and IAS 41 Agriculture (Effective for
annual periods beginning on or after 1 January 2016)
The amendments result in bearer plants being in the scope of IAS 16 Property, Plant and Equipment,
instead of IAS 41 Agriculture, to reflect the fact that their operation is similar to that of manufacturing.
The Group does not expect that the amendments will have any impact on the financial statements as the
Group has no bearer plants.
Amendments to IAS 19 – Defined Benefit Plans: Employee Contributions (effective for annual
periods beginning on or after 1 January 2016)
The amendments are relevant only to defined benefit plans that involve contributions from employees or
third parties meeting certain criteria. Namely that they are:
set out in the formal terms of the plan;
linked to service; and
independent of the number of years of service.
When these criteria are met, a company is permitted (but not required) to recognise them as a reduction of
the service cost in the period in which the related service is rendered.
The Group is currently evaluating the effect on its financial position and performance.
IFRS 15 Revenue from contracts with customers (Effective for annual periods beginning on or after
1 January 2018 (not adopted by EU yet))
The new Standard provides a framework that replaces existing revenue recognition guidance in IFRS.
Entities will adopt a five-step model to determine when to recognise revenue, and at what amount. The
new model specifies that revenue should be recognised when (or as) an entity transfers control of goods
or services to a customer at the amount to which the entity expects to be entitled. Depending on whether
certain criteria are met, revenue is recognised:
over time, in a manner that depicts the entity’s performance; or
at a point in time, when control of the goods or services is transferred to the customer.
IFRS 15 also establishes the principles that an entity shall apply to provide qualitative and quantitative
disclosures which provide useful information to users of financial statements about the nature, amount,
timing, and uncertainty of revenue and cash flows arising from a contract with a customer.
The Group is currently evaluating the effect on its financial position and performance but does not expect
that the new Standard will have material impact on the financial statements. The timing and measurement
of the Group’s revenues are not expected to change under IFRS 15 because of the nature of the Group’s
operations and the types of revenues it earns.
IFRS 9 Financial Instruments (Effective for annual periods beginning on or after 1 January 2018
(not adopted by EU yet); to be applied retrospectively with some exemptions. The restatement of
prior periods is not required, and is permitted only if information is available without the use of
hindsight.)
This Standard replaces IAS 39, Financial Instruments: Recognition and Measurement, except that the IAS
39 exception for a fair value hedge of an interest rate exposure of a portfolio of financial assets or
financial liabilities continues to apply, and entities have an accounting policy choice between applying the
hedge accounting requirements of IFRS 9 or continuing to apply the existing hedge accounting
requirements in IAS 39 for all hedge accounting.
Although the permissible measurement bases for financial assets – amortised cost, fair value through
other comprehensive income (FVOCI) and fair value through profit and loss (FVTPL) – are similar to
IAS 39, the criteria for classification into the appropriate measurement category are significantly
different.
Notes to the consolidated financial statements of EP Energy, a.s. as at and for the year ended 31 December 2015
15
A financial asset is measured at amortized cost if the following two conditions are met:
the assets are held within a business model whose objective is to hold assets in order to collect
contractual cash flows; and,
its contractual terms give rise on specified dates to cash flows that are solely payments of
principal and interest on the principal outstanding.
In addition, for a non-trading equity instrument, a company may elect to irrevocably present subsequent
changes in fair value (including foreign exchange gains and losses) in OCI. These are not reclassified to
profit or loss under any circumstances.
For debt instruments measured at FVOCI, interest revenue, expected credit losses and foreign exchange
gains and losses are recognised in profit or loss in the same manner as for amortised cost assets. Other
gains and losses are recognised in OCI and are reclassified to profit or loss on derecognition.
The impairment model in IFRS 9 replaces the ‘incurred loss’ model in IAS 39 with an ‘expected credit
loss’ model, which means that a loss event will no longer need to occur before an impairment allowance
is recognised.
IFRS 9 includes a new general hedge accounting model, which aligns hedge accounting more closely
with risk management. The types of hedging relationships – fair value, cash flow and foreign operation
net investment – remain unchanged, but additional judgment will be required.
The standard contains new requirements to achieve, continue and discontinue hedge accounting and
allows additional exposures to be designated as hedged items.
Extensive additional disclosures regarding an entity’s risk management and hedging activities are
required.
The Group is currently evaluating the effect on its financial position and performance.
IFRS 16 Leases (Effective for annual periods beginning on or after 1 January 2019 (not adopted by
EU yet))
The standard IFRS 16 will replace the earlier leasing standard, IAS 17. A primary principle of IFRS 16 is
that all leases should be reported on the balance sheet, although there are exceptions for small items and
for leases with a term of less than 12 months. For lessors, however, the accounting remains largely
unchanged and the distinction between operating and finance leases is retained.
Under IFRS 16, a lessee recognizes a right-of-use asset and a lease liability. The right-of-use asset is
treated similarly to other nonfinancial assets and depreciated accordingly, and the liability accrues
interest. The lease liability is initially measured at the present value of the lease payments payable over
the lease term, discounted at the rate implicit in the lease if this rate can be readily determined. If the rate
cannot be readily determined, the lessee’s incremental borrowing rate should be used.
Like IAS 17, IFRS 16 requires lessors to classify leases as operating or finance leases. A lease is
classified as a finance lease if it transfers substantially all the risks and rewards of ownership of an
underlying asset. Otherwise, the lease is classified as an operating lease.
The new standard increases the disclosure burden for lessees and lessors.
The Group is currently evaluating the effect on its financial position and performance.
The Group has not early adopted any IFRS standards where adoption is not mandatory at the reporting
date. Where transition provisions in adopted IFRS give an entity the choice of whether to apply new
standards prospectively or retrospectively, the Group elects to apply the Standards prospectively from the
date of transition.

Notes to the consolidated financial statements of EP Energy, a.s. as at and for the year ended 31 December 2015
16
3. Significant Accounting Policies
The EPE Group has consistently applied the following accounting policies to all periods presented in
these consolidated financial statements.
Certain comparative amounts in the consolidated statement of financial position have been regrouped or
reclassified, where necessary, on a basis consistent with the current period.
(a) Basis of consolidation
i. Subsidiaries
Subsidiaries are entities controlled by the Company. Control exists when the Company has the power,
directly or indirectly, to govern the financial and operating policies of an enterprise, so as to obtain
benefits from its activities. The existence and effect of potential voting rights that are currently
exercisable or convertible are considered when assessing whether the Group controls another entity. The
consolidated financial statements include the Group’s interests in other entities based on the Group’s
ability to control such entities regardless of whether control is actually exercised or not. The financial
statements of subsidiaries are included in the consolidated financial statements from the date that control
commences until the date that control ceases.
ii. Equity accounted investees
Associates are enterprises in which the Group has significant influence, but not control, over financial and
operating policies. Investments in associates are accounted for under the equity method and are initially
recognised at cost. The consolidated financial statements include the Group’s share of the total profit or
loss and other comprehensive income of associates from the date that the significant influence
commences until the date that the significant influence ceases. When the Group’s share of losses exceeds
the carrying amount of the associate, the carrying amount is reduced to nil and the recognition of further
losses is discontinued, except to the extent that the Group has incurred obligations in respect of or has
made payments on behalf of the associate.
iii. Special purpose entities (“SPEs”)
The Group has established a number of special purpose entities (SPEs) for trading and investment
purposes. An SPE is consolidated if, based on an evaluation of the substance of its relationship with the
Group and the SPE’s risks and rewards, the Group concludes that it controls the SPE.
iv. Accounting for business combinations
The Group acquired its subsidiaries in two ways:
As a business combination transaction within the scope of IFRS 3 which requires initial
measurement of assets and liabilities at fair value.
As a business combination under common control which is a business combination in which all
of the combining entities or businesses are ultimately controlled by the same party or parties both
before and after the business combination, and that control is not transitory. Such acquisitions are
excluded from the scope of IFRS 3. The assets and liabilities acquired were recognised at the
carrying amounts recognised previously in the Group’s controlling shareholder’s consolidated
financial statements (i.e. value at cost as at the date of acquisition less accumulated depreciation
and/or potential impairment). No new goodwill or negative goodwill was recognised on these
acquisitions.
v. Non-controlling interests
Acquisitions of non-controlling interest are accounted for as transactions with equity holders in their
capacity as equity holders and therefore no goodwill and no gain or loss is recognised as a result of such
transactions.
Non-controlling interests are measured at their proportionate share of the acquiree’s identifiable net assets
at the acquisition date.
Changes in the Group’s interest in subsidiary that do not result in a loss of control are accounted for as
equity transaction.
Notes to the consolidated financial statements of EP Energy, a.s. as at and for the year ended 31 December 2015
17
vi. Transactions eliminated on consolidation
Intra-group balances and transactions, and any unrealised income and expenses arising from intra-group
transactions, are eliminated in preparing the consolidated financial statements. Unrealised gains arising
from transactions with associates are eliminated against the investment to the extent of the Group’s
interest in the enterprise. Unrealised losses are eliminated in the same way as unrealised gains, but only to
the extent that there is no evidence of impairment.
vii. Unification of accounting policies
The accounting policies and procedures applied by the consolidated companies in their financial
statements were unified in the consolidation, and agree with the accounting policies applied by the Parent
Company.
viii. Pricing differences
The Group accounted for pricing differences which arose from the acquisition of subsidiaries from
Energetický a průmyslový holding, a.s. or subsidiaries contributed to the share capital of the Company by
Energetický a průmyslový holding, a.s. As these acquired or contributed entities and EPE were under
common control of Energetický a průmyslový holding, a.s., they were therefore excluded from the scope
of IFRS 3, which defines recognition of goodwill raised from business combination as the excess of the
cost of an acquisition over the fair value of the Group’s share of the net identifiable assets, liabilities and
contingent liabilities of the acquired subsidiary. Acquirees under common control are treated under the
net book value presented in the consolidated financial statements of Energetický a průmyslový holding,
a.s. (i.e. including historical goodwill less potential impairment) as at the date these entities were acquired
by Energetický a průmyslový holding, a.s. (acquisition date). The difference between the cost of
acquisition and carrying values of net assets of the acquiree and original goodwill carried forward as at
the acquisition date were recorded to consolidated equity as pricing differences. Pricing differences are
presented in Other capital reserves in Equity. “Note 6 – Acquisitions and contributions of subsidiaries,
special purpose entities, joint-ventures and associates” summarises the effects of all common control
transactions in both periods.
ix. Disposal of subsidiaries and equity accounted investees
Gain or loss from the sale of investments in subsidiaries and equity accounted investees is recognised in
profit or loss when the significant risks and rewards of ownership have been transferred to the buyer.
If the assets and liabilities are sold by selling the interest in a subsidiary or an associate the profit or loss
on sale is recognised in total under Gain/(loss) on disposal of subsidiaries, special purpose entities, joint-
ventures and associates in the statement of comprehensive income.
If the Group disposes of a subsidiary that was acquired under a common control transaction and pricing
differences were recognised on the acquisition (see Note 3(a) – Pricing differences), the pricing
differences are reclassified from other capital reserves to retained earnings at the date of the subsidiary’s
disposal.
(b) Foreign currency
i. Foreign currency transactions
Items included in the financial statements of each of the Group’s entities are measured using the currency
of the primary economic environment in which the entity operates (the functional currency). The
consolidated financial statements are presented in Euro, which is the Group’s presentation currency.
Company’s functional currency is Czech crown. Transactions in foreign currencies are translated to the
respective functional currencies of Group entities at the foreign exchange rate at the transaction date.
Monetary assets and liabilities denominated in foreign currencies are retranslated to the respective
functional currencies of Group entities at the exchange rate at the reporting date; where the functional
currency is Czech crowns, at the exchange rate of the Czech National Bank.
Non-monetary assets and liabilities denominated in foreign currencies, which are stated at historical cost,
are translated to the respective functional currencies of Group entities at the foreign exchange rate at the
date of the transaction. Non-monetary assets and liabilities denominated in foreign currencies that are
Notes to the consolidated financial statements of EP Energy, a.s. as at and for the year ended 31 December 2015
18
stated at fair value are translated to the respective functional currencies at the foreign exchange rates at
the dates the fair values are determined.
Foreign exchange differences arising on retranslation are recognised in profit or loss, except for
differences arising on the retranslation of available-for-sale equity instruments (except for impairment in
which case foreign currency differences that have been recognised in other comprehensive income are
reclassified to profit or loss), a financial liability designated as a hedge of the net investment in a foreign
operation, or qualifying cash flow hedges to the extent that the hedge is effective, in which case foreign
exchange differences arising on retranslation are recognised in other comprehensive income.
A summary of the main foreign exchange rates applicable for the reporting period is presented in Note 36
– Risk management policies and disclosures.
ii. Financial statements of foreign operations
The assets and liabilities of foreign operations, including goodwill and fair value adjustments arising on
consolidation, are translated into Czech crowns at foreign exchange rates at the reporting date. The
income and expenses of foreign operations are translated into Czech crowns using a foreign exchange rate
that approximates the foreign exchange rate at the date of the transaction.
Foreign exchange differences arising on translation are recognised in other comprehensive income and
presented in the translation reserve in equity. However, if the foreign operation is a non-wholly owned
subsidiary, then the relevant proportion of the translation difference is allocated to non-controlling
interests.
iii. Translation to presentation currency
These consolidated financial statements are presented in Euro which is the Company’s presentation
currency. The assets and liabilities, including goodwill and fair value adjustments arising on
consolidation, are translated from Czech crowns into Euros at foreign exchange rate at the reporting date.
The income and expenses are translated from Czech crowns into Euros using a foreign exchange rate that
approximates the foreign exchange rate at the date of the transaction.
Foreign exchange differences arising on translation are recognised in other comprehensive income and
presented in the translation reserve in equity. The relevant proportion of the translation difference is
allocated to non-controlling interests if applicable.
(c) Non-derivative financial assets
The Group has the following non-derivative financial instruments: financial assets at fair value through
profit or loss, loans and receivables, held-to-maturity assets and available-for-sale financial assets.
i. Classification
Financial instruments at fair value through profit or loss are those that the Group principally holds for
trading, that is, with the purpose of short-term profit taking. They include investments and contracts that
are not designated as hedging instruments.
Loans and receivables are non-derivative financial assets with fixed or determinable payments, not
quoted in an active market, which are not classified as available for sale or held to maturity or at fair
value through profit or loss. Loans and receivables mainly comprise loans to other than credit institutions
(mainly to the parent company) and trade and other receivables.
Held-to-maturity assets are non-derivative financial assets with fixed or determinable payments and fixed
maturity that the Group has the positive intent and ability to hold to maturity.
Available-for-sale financial assets are non-derivative financial assets that are not designated as fair value
through profit or loss, loans and receivables, cash and cash equivalents or as held to maturity.
ii. Recognition
Financial assets at fair value through profit or loss and available-for-sale assets are recognised on the
date the Group becomes a party to the contractual provisions of the instrument. Regular way purchases
Notes to the consolidated financial statements of EP Energy, a.s. as at and for the year ended 31 December 2015
19
and sales of financial assets including held-to-maturity assets are initially recognised on the trade date,
when the Group becomes a party to the contractual provisions of the instrument.
Loans and receivables are recognised on the day they are originated.
iii. Measurement
Upon initial recognition, financial assets are measured at fair value plus, in the case of a financial
instrument not at fair value through profit or loss, transaction costs directly attributable to the acquisition
of the financial instrument. Attributable transaction costs relating to financial assets measured at fair
value through profit or loss are recognised in profit or loss as incurred. For the methods used to estimate
fair value, refer to Note 4 – Determination of fair values.
Subsequent to initial recognition, financial assets are measured at their fair value, except for loans and
receivables and held-to-maturity instruments, which are measured at amortised cost, less any impairment
loss.
In measuring the amortised cost, any difference between cost and redemption value is recognised in profit
or loss over the period of the asset or liability on an effective interest rate basis.
iv. Gains and losses on subsequent measurement
For financial assets at fair value through profit or loss, gains and losses arising from a change in fair value
are recognised in profit or loss.
For assets available for sale, changes in fair value, other than impairment losses and foreign currency
differences on available-for-sale equity instruments, are recognised in other comprehensive income and
presented within equity in the fair value reserve. When an available-for-sale asset is derecognised, the
cumulative gains and losses in other comprehensive income are transferred to profit or loss. Interest
income and expense from available-for-sale securities are recorded in profit or loss by applying the
effective interest rate method.
v. De-recognition
A financial asset is derecognised when the contractual rights to the cash flows from the asset expire, or
when the rights to receive the contractual cash flows are transferred in a transaction in which substantially
all the risks and rewards of ownership of the financial asset are transferred. Any interest in transferred
financial assets that is created or retained by the Group is recognised as a separate asset or liability.
vi. Offsetting of financial assets and liabilities
Financial assets and liabilities are offset and the net amount is reported in the statement of financial
position when the Group has a legally enforceable right to offset the recognised amounts and the
transactions are intended to be settled on a net basis.
(d) Non-derivative financial liabilities
The Group has the following non-derivative financial liabilities: loans and borrowings, debt securities
issued, bank overdrafts, and trade and other payables. Such financial liabilities are initially recognised at
the settlement date at fair value plus any directly attributable transaction costs except for financial
liabilities at fair value through profit and loss, where transaction costs are recognised in profit or loss as
incurred. Financial liabilities are subsequently measured at amortised cost using the effective interest rate,
except for financial liabilities at fair value through profit or loss. For the methods used to estimate fair
value, refer to Note 4 – Determination of fair values.
The Group derecognises a financial liability when its contractual obligations are discharged, cancelled or
expire.
(e) Derivative financial instruments
The Group holds derivative financial instruments to hedge its foreign currency, interest rate and
commodity risk exposures.

Notes to the consolidated financial statements of EP Energy, a.s. as at and for the year ended 31 December 2015
20
Derivatives are recognised initially at fair value, with attributable transaction costs recognised in profit or
loss as incurred. Subsequent to initial recognition, derivatives are measured at fair value, and changes
therein are accounted for as described below.
Other non-trading derivatives
When a derivative financial instrument is not held for trading and is not designated in a qualifying hedge
relationship, all changes in its fair value are recognised immediately in profit or loss.
Separable embedded derivatives
Financial and non-financial contracts (where they have not already been measured at fair value through
profit or loss) are assessed to determine whether they contain any embedded derivatives.
Embedded derivatives are separated from the host contract and accounted for separately if the economic
characteristics and risks of the host contract and the embedded derivative are not closely related, a
separate instrument with the same terms as the embedded derivative would meet the definition of a
derivative, and the combined instrument is not measured at fair value through profit or loss.
Changes in the fair value of separable embedded derivatives are recognised immediately in profit or loss.
Cash flow hedges and fair value hedges
The majority of financial derivatives are held for hedging purposes but do not meet the criteria for hedge
accounting as stated by IAS 39. These derivatives are designated for trading, and related profit and loss
from changes in fair value is recognised in profit and loss.
Hedging instruments which consist of derivatives associated with a currency risk are classified either as
cash-flow hedges or fair value hedges.
From the inception of the hedge, the Group maintains a formal documentation of the hedging relationship
and the Group’s risk management objective and strategy for undertaking the hedge. The Group also
periodically assesses the hedging instrument’s effectiveness in offsetting exposure to changes in the
hedged item’s fair value or cash flows attributable to the hedged risk.
In the case of a cash flow hedge, the portion of the gain or loss on the hedging instrument that is
determined to be an effective hedge is recognised in other comprehensive income and the ineffective
portion of the gain or loss on the hedging instrument is recognised in profit or loss. If the hedging
instrument no longer meets the criteria for hedge accounting, expires or is sold, terminated or exercised,
or the designation is revoked, then the hedge accounting is discontinued prospectively. If the forecast
transaction is no longer expected to occur, then the balance in equity is reclassified to profit or loss.
In the case of a fair value hedge, the gain or loss from re-measuring the hedging instrument at fair value is
recognised in profit or loss.
Transactions with emission rights and energy
According to IAS 39, certain contracts for emission rights and energy fall into the scope of the standard.
Most purchase and sales contracts entered into by the Group provide for physical delivery of quantities
intended for consumption or sale as part of its ordinary business. Such contracts are thus excluded from
the scope of IAS 39.
In particular, forward purchases and sales for physical delivery are considered to fall outside the scope of
application of IAS 39, when the contract concerned is considered to have been entered into as part of the
Group’s normal business activity. This is demonstrated to be the case when all the following conditions
are fulfilled:
– a physical delivery takes place under such contracts;
– the volumes purchased or sold under the contracts correspond to the Group’s operating requirements;
and
– the contract cannot be considered a written option as defined by IAS 39.
Notes to the consolidated financial statements of EP Energy, a.s. as at and for the year ended 31 December 2015
21
The Group thus considers that transactions negotiated with a view to balancing the volumes between
emission rights and energy purchases and sale commitments are part of its ordinary business and do not
therefore fall under the scope of IAS 39.
Contracts which fall under the scope of IAS 39 are carried at fair value with changes in the fair value
recognised in profit or loss. The Group presents revenues and expenses related to emission rights trading
net in the line Emission rights, net.
(f) Cash and cash equivalents
Cash and cash equivalents comprise cash balances on hand and in banks, and short-term highly liquid
investments with original maturities of three months or less.
(g) Inventories
Inventories are measured at the lower of cost and net realisable value. Net realisable value is the
estimated selling price in the ordinary course of business, less the estimated cost of completion and
selling expenses.
Purchased inventory and inventory in transit are initially stated at cost, which includes the purchase price
and other directly attributable expenses incurred in acquiring the inventories and bringing them to their
current location and condition. Inventories of a similar nature are valued using the weighted average
method except for the energy production segment, where the first-in, first-out principle is used.
Internally manufactured inventory and work in progress are initially stated at production costs. Production
costs include direct costs (direct material, direct labour and other direct costs) and part of overhead
directly attributable to inventory production (production overhead). The valuation is written down to net
realisable value if the net realisable value is lower than production costs.
(h) Impairment
i. Non-financial assets
The carrying amounts of the Group’s assets, other than inventories (refer to accounting policy (g) –
Inventories), investment properties (refer to accounting policy (k) – Investment property) and deferred tax
assets (refer to accounting policy (o) – Income taxes) are reviewed at each reporting date to determine
whether there is objective evidence of impairment. If any such indication exists, the asset’s recoverable
amount is estimated. For goodwill and intangible assets that have an indefinite useful life or that are not
yet available for use, the recoverable amount is estimated at least each year at the same time.
The recoverable amount of an asset or cash-generating unit (CGU) is the greater of its fair value less costs
to sell and value in use. In assessing value in use, the estimated future cash flows are discounted to their
present value using a pre-tax discount rate that reflects current market assessment of the time value of
money and the risks specific to the asset or CGU.
For the purpose of impairment testing, assets that cannot be tested individually are grouped together into
the smallest group of assets that generates cash inflows from continuing use that are largely independent
of the cash inflows of other assets or groups of assets (the “cash-generating unit”, or “CGU”). For the
purposes of goodwill impairment testing, CGUs to which goodwill has been allocated are aggregated so
that the level at which impairment is tested reflects the lowest level at which goodwill is monitored for
internal reporting purposes. Goodwill acquired in a business combination is allocated to groups of CGUs
that are expected to benefit from the synergies of the combination.
An impairment loss is recognised whenever the carrying amount of an asset or its cash generating unit
exceeds its recoverable amount. Impairment losses are recognised in profit or loss.
Impairment losses recognised in respect of CGUs are allocated first to reduce the carrying amount of any
goodwill allocated to the CGU or CGUs, and then to reduce the carrying amounts of the other assets in
the CGU (or group of CGUs) on a pro rata basis.
An impairment loss in respect of goodwill is not reversed. In respect of other assets, impairment losses
recognised in prior periods are assessed at each reporting date for any indications that the loss has
decreased or no longer exists. An impairment loss is reversed if there has been a change in the estimates

Notes to the consolidated financial statements of EP Energy, a.s. as at and for the year ended 31 December 2015
22
used to determine the recoverable amount. An impairment loss is reversed only to the extent that the
asset’s carrying amount does not exceed the carrying amount that would have been determined, net of
depreciation or amortisation, if no impairment loss had been recognised.
Goodwill that forms part of the carrying amount of an investment in an associate is not recognised
separately, and therefore is not tested for impairment separately. Instead, the entire amount of the
investment in an associate is tested for impairment as a single asset when there is objective evidence that
the investment in an associate may be impaired.
ii. Financial assets (including trade and other receivables)
A financial asset not carried at fair value through profit or loss is assessed at each reporting date to
determine whether there is objective evidence that it is impaired. A financial asset is impaired if objective
evidence indicates that a loss event has occurred after the initial recognition of the asset, and that the loss
event had a negative effect on the estimated future cash flows of that asset that can be estimated reliably.
Objective evidence that financial assets are impaired can include default or delinquency by a debtor,
restructuring of an amount due to the Group on terms that the Group would not consider otherwise,
indications that a debtor or issuer will enter bankruptcy, or the disappearance of an active market for a
security. In addition, for an investment in an equity security, a significant or prolonged decline in its fair
value below its cost is objective evidence of impairment. IAS 39 does not provide clear guidance on what
is significant relative to cost or what is a prolonged decline in the fair value. As such, the Group policy
states that impairment should be considered if declines in equity markets have been, and continue to be,
severe with many equity global indices down by nearly 50% from their 12-month highs for a period
longer than 6 months (impairment criteria).
The recoverable amount of the Group's investment in held-to-maturity securities and receivables carried
at amortised cost is calculated as the present value of estimated future cash flows, discounted at the
original effective interest rate (i.e. the effective interest rate computed at initial recognition of these
financial assets). Receivables with a short duration are not discounted. In determining the recoverable
amount for loans and receivables consideration is also given to the credit standing and performance of the
borrower and the value of any collateral or third-party guarantee.
An impairment loss in respect of a held-to-maturity security or receivable carried at amortised cost is
reversed if the subsequent increase in recoverable amount can be related objectively to an event occurring
after the impairment loss was recognised.
Impairment losses on available-for-sale investment securities are recognised by transferring the
cumulative loss that has been recognised in other comprehensive income, and presented in the fair value
reserve in equity, to profit or loss. The cumulative loss that is reclassified from equity to profit or loss and
recognised in profit or loss is the difference between the acquisition cost, net of any principal repayment
and amortisation, and the current fair value, less any impairment loss previously recognised in profit or
loss. Changes in cumulative impairment losses attributable to application of the effective interest method
are reflected as a component of interest income.
If, in a subsequent period, the fair value of an impaired available-for-sale debt security increases and the
increase can be related objectively to an event occurring after the impairment loss was recognised in
profit or loss, then the impairment loss is reversed, with the amount of the reversal recognised in profit or
loss. However, any subsequent recovery in the fair value of an impaired available-for-sale equity security
is recognised in other comprehensive income.
(i) Property, plant and equipment
i. Owned assets
Items of property, plant and equipment are stated at cost less accumulated depreciation (see below) and
impairment losses (refer to accounting policy (h) – Impairment). Opening balances are presented at net
book values, which include adjustment from revaluation within the Purchase Price Allocation process.
Cost includes expenditures that are directly attributable to the acquisition of the asset. The cost of self-
constructed assets includes the cost of materials and direct labour, any other costs directly attributable to
bringing the asset to a working condition for its intended use, and capitalised borrowing costs (refer to
Notes to the consolidated financial statements of EP Energy, a.s. as at and for the year ended 31 December 2015
23
accounting policy (n) – Finance income and costs). The cost also includes costs of dismantling and
removing the items and restoring the site on which they are located.
Property that is being constructed or developed for future use as investment property is classified as
property, plant and equipment and stated at fair value until construction or development is complete, at
which time it is reclassified as investment property.
When parts of an item of property, plant and equipment have different useful lives, those components are
accounted for as separate items (major components) of property, plant and equipment.
ii. Leased assets
Leases in terms of which the Group assumes substantially all of the risks and rewards of ownership are
classified as finance leases. Under finance leases, leased assets are stated at an amount equal to the lower
of their fair value and the present value of the minimum lease payments at inception of the lease, less
accumulated depreciation (see below) and impairment losses (refer to accounting policy (h) –
Impairment).
Minimum lease payments for finance leases are apportioned between the finance charge and the reduction
of the outstanding liability. The finance charge is allocated to each period during the lease term so as to
produce a constant periodic rate of interest on the remaining balance of the liability.
Other leases are operating leases and, except for investment property, the leased assets are not recognised
in the Group’s statement of financial position.
Payments made under operating leases are recognised in profit or loss on a straight-line basis over the
term of the lease.
In identifying lease agreements, the Group also considers the additional criteria defined in IFRIC 4 –
Determining Whether an Arrangement Contains a Lease, as to whether an agreement that conveys a right
to use an asset meets the definition of a lease. Certain purchase and supply contracts in the energy
business (electricity and gas) may be classified as leases if the criteria are met.
iii. Subsequent costs
Subsequent costs are capitalised only if it is probable that the future economic benefits embodied in an
item of property, plant and equipment will flow to the Group and its cost can be measured reliably. All
other expenditures, including the costs of the day-to-day servicing of property, plant and equipment, are
recognised in profit or loss as incurred.
iv. Depreciation
Depreciation is recognised in profit or loss on a straight-line basis over the estimated useful lives of items
of property, plant and equipment. Land is not depreciated. Leased assets are depreciated over the shorter
of the lease term and their useful lives unless it is reasonably certain that the Group will obtain ownership
by the end of the lease term.

Notes to the consolidated financial statements of EP Energy, a.s. as at and for the year ended 31 December 2015
24
The estimated useful lives are as follows:
Power plant buildings and structures 50 – 100 years
Buildings and structures 20 – 50 years
Machinery, electric generators, gas
producers, turbines and drums 20 – 30 years
Distribution network 10 – 30 years
Machinery and equipment 4 – 20 years
Fixtures, fittings and others 3 – 20 years
Depreciation methods and useful lives, as well as residual values, are reassessed annually at the reporting
date. For companies acquired under IFRS 3 for which a purchase price allocation was prepared, the useful
lives are reassessed based on the purchase price allocation process.
(j) Intangible assets
i. Goodwill and intangible assets acquired in a business combination
Goodwill represents the excess of the cost of an acquisition over the fair value of the Group’s share of the
net identifiable assets of the acquired subsidiary/associate/joint-venture at the date of acquisition.
Goodwill on acquisitions of subsidiaries/joint-ventures is included under intangible assets. Goodwill on
acquisitions of associates is included in the carrying amount of investments in associates.
If the Group’s share in the fair value of identifiable assets and liabilities of a subsidiary or equity
accounted investees as at the acquisition date exceeds the acquisition cost, the Group shall reconsider
identification and measurement of identifiable assets and liabilities, and the acquisition cost. Any excess
arising on the re-measurement (negative goodwill) is recognised in profit and loss account in the period of
acquisition.
Upon acquisition of non-controlling interests (while maintaining control), no goodwill is recognised.
Subsequent to initial recognition, goodwill is measured at cost less accumulated impairment losses (refer
to accounting policy (h) – Impairment) and is tested annually for impairment.
Gains and losses on the disposal of an entity include the carrying amount of goodwill relating to the entity
sold.
Intangible assets acquired in a business combination are recorded at fair value on the acquisition date if
the intangible asset is separable or arises from contractual or other legal rights. Intangible assets with an
indefinite useful life are not subject to amortisation and are recorded at cost less any impairment losses
(refer to accounting policy (h) – Impairment). Intangible assets with a definite useful life are amortised
over their useful lives and are recorded at cost less accumulated amortisation (see below) and impairment
losses (refer to accounting policy (h) – Impairment).
ii. Research and development
Expenditure on research activities, undertaken with the prospect of gaining new scientific or technical
knowledge and understanding, is recognised in profit or loss as incurred.
Development activities involve a plan or design for the production of new or substantially improved
products and processes. Development expenditure is capitalised only if development costs can be
measured reliably, the product or process is technically and commercially feasible, future economic
benefits are probable, and the Group intends to and has sufficient resources to complete development and
to use or sell the asset.
In 2015 and 2014, expenditures incurred by the Group did not meet these recognition criteria.
Development expenditure has thus been recognised in profit or loss.
Notes to the consolidated financial statements of EP Energy, a.s. as at and for the year ended 31 December 2015
25
iii. Emission rights
Recognition and measurement
Emission rights (purchased or issued by a government) are initially recognised at fair values. Where an
active market exists fair value should be based on the market price in accordance with IFRS 13 (for
allocated emission rights the fair value is determined as the price at the date of allocation; for purchased
emission rights the fair value typically equals the purchase price). If it is determined that an active market
does not exist then alternative valuation techniques are applied to estimate the fair value in accordance
with IFRS 13.
Subsequently, emission rights are accounted for under the cost method under intangible assets.
The Group’s accounting policy is to use the first-in, first-out principle (“FIFO”) for emission rights
disposal (consumption or sale).
Impairment of emission rights
At each reporting date, the Group assesses whether there is any indication that emission rights may be
impaired.
Where an impairment indicator exists, the Group reviews the recoverable amounts of the cash generating
unit, to which the emission rights were allocated, to determine whether such amounts continue to exceed
the assets’ carrying values. In case the carrying value of a cash generating unit is greater than its
recoverable value, impairment exists.
Any identified emission rights impairment is recognised directly as a debit to a profit or loss account and
a credit to a valuation adjustment.
Recognition of grants
A grant is initially recognised as deferred income and recognised in profit on a systematic basis over the
compliance period, which is the relevant calendar year, regardless of whether the allowance received
continues to be held by the entity. The pattern for the systematic recognition of the deferred income in
profit is assessed based on estimated pollutants emitted in the current month, taking into account the
estimated coverage of the estimated total annually emitted pollutants by allocated emission rights. The
release of deferred income to a profit and loss account is performed on a quarterly basis; any subsequent
update to the estimate of total annual pollutants is taken into account during the following monthly or
quarterly assessment. Any disposals of certificates or changes in their carrying amount do not affect the
manner in which grant income is recognised.
Recognition, measurement of provision
A provision is recognised regularly during the year based on the estimated number of tonnes of CO2
emitted.
It is measured at the best estimate of the expenditure required to settle the present obligation at the end of
the reporting period. It means that the provision is measured based on the current carrying amount of the
certificates on hand if sufficient certificates are owned to settle the current obligation, by using a FIFO
method. The group companies identify (in each provision measurement period) which of the certificates
are “marked for settling” the provision and this allocation is consistently applied.
Otherwise, if a shortfall of emission rights on hand as compared to the estimated need exists at the
reporting date, then the provision for the shortfall is recorded based on the current market value of the
emission certificates at the end of the reporting period.
iv. Software and other intangible assets
Software and other intangible assets acquired by the Group that have definite useful lives are stated at
cost less accumulated amortisation (see below) and impairment losses (refer to accounting policy (h) –
Impairment).
Intangible assets that have an indefinite useful life are not amortised and are instead tested annually for
impairment. Their useful life is reviewed at each period-end to assess whether events and circumstances
continue to support an indefinite useful life.
Notes to the consolidated financial statements of EP Energy, a.s. as at and for the year ended 31 December 2015
26
v. Amortisation
Amortisation is recognised in profit or loss on a straight-line basis over the estimated useful lives of
intangible assets other than goodwill, from the date the asset is available for use. The estimated useful
lives are as follows:
Software 2 – 7 years
Other intangible assets 2 – 20 years
Amortisation methods, useful lives and residual values are reviewed at each financial year-end and
adjusted if appropriate.
(k) Investment property
Investment property is property held by the Group either to earn rental income or for capital appreciation
or for both, but not for sale in the ordinary course of business, use in production or supply of goods or
services or for administrative purposes.
Investment property is measured at fair value, as determined by an independent registered valuer. Fair
value is assessed based on current prices in an active market for similar properties in the same location
and condition, or where not available, by applying generally applicable valuation methodologies. Any
gain or loss arising from a change in fair value is recognised in profit or loss.
When the use of a property changes such that it is reclassified as property, plant and equipment, its fair
value at the date of reclassification becomes its cost for subsequent accounting.
Rental income from investment property is accounted for as described in the accounting policy (m) –
Revenue.
(l) Provisions
A provision is recognised in the statement of financial position when the Group has a present legal or
constructive obligation as a result of a past event, when it is probable that an outflow of economic
benefits will be required to settle the obligation and when a reliable estimate of the amount can be made.
Provisions are recognised at the expected settlement amount. Long-term obligations are reported as
liabilities at the present value of their expected settlement amounts, if the effect of discount is material,
using as a discount rate the pre-tax rate that reflects current market assessments of the time value of
money and the risks specific to the liability. The periodic unwinding of the discount is recognised in
profit or loss in finance costs.
The effects of changes in interest rates, inflation rates and other factors are recognised in profit or loss in
operating income or expenses. Changes in estimates of provisions can arise in particular from deviations
from originally estimated costs, from changes in the settlement date or in the scope of the relevant
obligation. Changes in estimates are generally recognised in profit or loss at the date of the change in
estimate (see below).
i. Employee benefits
Long-term employee benefits
Liability relating to long-term employee benefits and service awards excluding pension plans is defined
as an amount of the future payments, to which employees will be entitled in return for their service in the
current and prior periods. Future liability which is calculated using the projected unit credit method is
discounted to its present value. The discount rate used is based on yields of high quality corporate bonds
as at the end of the reporting period, which maturity approximately corresponds with the maturity of the
future obligation. The revaluation of the net liability from defined benefit plans (including actuarial gains
and losses) shall be recognised in full immediately in other comprehensive income.
Contributions for pension insurance resulting from Collective agreement are expensed when incurred.
Employee benefits provision is presented separately both long and short-term part (if possible to
distinguish, otherwise as non-current, if not IFRS 5). The benefit could be classified as short-term, if and

Notes to the consolidated financial statements of EP Energy, a.s. as at and for the year ended 31 December 2015
27
only if the whole benefit category will be settled within 1 year; otherwise, it must be disclosed as long-
term.
Pension plans
In accordance with IAS 19, the projected unit credit method is the only permitted actuarial method. The
benchmark (target value) applied to measure defined benefit pension obligations is the present value of
vested pension rights of active and former employees and beneficiaries (present value of the defined
benefit obligation). It must in general be assumed that each partial benefit of the pension commitment is
earned evenly from commencement of service until the respective due date.
If specific plan assets are established to cover the pension payments, these plan assets can be netted
against the pension obligations and only the net liability is shown. The valuation of existing plan assets is
based on the fair value at the balance sheet date in accordance with IAS 19.
Assets used to cover pension obligations that do not fully meet the requirement of plan assets have to be
carried as assets on the balance sheet. Any netting off against the liability to be covered will not apply in
this respect.
The Group recognises all actuarial gains and losses arising from benefit plans immediately in other
comprehensive income and all expenses related to the defined benefit plan in profit or loss.
The Group recognises gains and losses on the curtailment or settlement of a benefit plan when the
curtailment or settlement occurs. The gain or loss on curtailment or settlement comprises any resulting
change in the fair value of plan assets, any change in the present value of the defined benefit obligation,
any related actuarial gains and losses and past service costs that had not been previously recognised.
Short-term employee benefits
Short-term employee benefit obligations are measured on an undiscounted basis and are expensed as the
related service is provided. A provision is recognised for the amount expected to be paid under short-term
cash bonus or profit-sharing plans if the Group has a present legal or constructive obligation to pay this
amount as a result of past service provided by the employee and the obligation can be estimated reliably.
ii. Warranties
A provision for warranties is recognised when the underlying products or services are sold. The provision
is based on historical warranty data and weighting of all possible outcomes against associated
probabilities.
iii. Provision for lawsuits and litigations
Settlement of a lawsuit represents an individual potential obligation. Determining the best estimate either
involves expected value calculations, where possible outcomes, stated based on a legal study, are
weighted by their likely probabilities or it is the single most likely outcome, adjusted as appropriate to
consider risk and uncertainty.
iv. Provision for emission rights
A provision for emission rights is recognised regularly during the year based on the estimated number of
tonnes of CO2 emitted. It is measured at the best estimate of the expenditure required to settle the present
obligation at the reporting date.
v. Restructuring
A provision for restructuring is recognised when the Group has approved a detailed and formal
restructuring plan, and the restructuring either has commenced or has been announced publicly. Future
operating costs are not provided for.
vi. Asset retirement obligation and provision for environmental remediation
Obligations arising from the decommissioning or dismantling of property, plant and equipment are
recognised in connection with the initial recognition of the related assets, provided that the obligation can
be reliably estimated. The carrying amounts of the related items of property, plant and equipment are
Notes to the consolidated financial statements of EP Energy, a.s. as at and for the year ended 31 December 2015
28
increased by the same amount that is subsequently amortised as part of the depreciation process of the
related assets.
A change in the estimate of a provision for the decommissioning and restoration of property, plant and
equipment is generally recognised against a corresponding adjustment to the related assets, with no effect
on profit or loss. If the related items of property, plant and equipment have already been fully depreciated,
changes in the estimate are recognised in profit or loss.
No provisions are recognised for contingent asset retirement obligations where the type, scope, timing
and associated probabilities cannot be determined reliably.
Provisions for environmental remediation in respect of contaminated sites are recognised when the site is
contaminated and when there is a legal or constructive obligation to remediate the related site.
Rehabilitation provisions are recognised for the following restoration activities:
dismantling and removing structures;
rehabilitating mines and tailings dams;
dismantling operating facilities;
closure of plant and waste sites; and
restoration and reclamation of affected areas.
The entity records the present value of the provision in the period in which the obligation is incurred. The
obligation generally arises when the asset is installed or the environment is disturbed at the production
location. When the liability is initially recognised, the present value of the estimated costs is capitalised
by increasing the carrying amount of the related mining assets. Over time, the discounted liability is
increased to reflect the change in the present value based on the discount rates that reflect current market
assessments and the risks specific to the liability. The periodic unwinding of the discount is recognised in
profit or loss as a finance cost.
vii. Onerous contracts
A provision for onerous contracts is recognised when the expected benefits to be derived by the Group
from a contract are lower than the unavoidable costs of meeting its obligations under the contract. The
provision is measured at the present value of the lower of the expected cost of terminating the contract
and the expected net cost of continuing with the contract. Before a provision is established, the Group
recognises any impairment loss on the assets associated with that contract.
(m) Revenue
i. Revenues from own products and goods sold and services rendered
Revenue is recognised when persuasive evidence exists, usually in the form of an executed sales
agreement, that the significant risks and rewards of ownership have been transferred to the buyer,
recovery of the consideration is probable, the associated costs and possible return of goods can be
estimated reliably, there is no continuing management involvement with the goods, and the amount of
revenue can be measured reliably.
Revenue from the sale of own products and goods in the course of ordinary activities is measured at the
fair value of the consideration received or receivable, net of trade discounts and volume rebates.
Discounts are recognised as a reduction of revenue as the sales are recognised, if it is probable that
discounts will be granted and the amount can be measured reliably.
Revenue from services rendered is recognised in profit or loss in proportion to the stage of completion of
the transaction at the reporting date. The stage of completion is assessed by reference to surveys of work
performed. No revenue is recognised if there are significant uncertainties regarding the recovery of the
consideration due, associated costs or the possible return of goods.
Revenues from the sale of energy comprise mainly revenues relating to production and sale of electricity,
heat energy and its distribution and sale of gas and coal.
Other revenues represent revenues from non-energy activities.
Notes to the consolidated financial statements of EP Energy, a.s. as at and for the year ended 31 December 2015
29
Revenues from sale of electricity, heat and gas
Revenues from sales of electricity, heat and gas to retail customers are recognised at the time the
electricity, heat or gas is supplied on the basis of periodic meter readings and also include an estimate of
the value of electricity and consumption after the date of the last meter reading of the year. Revenues
between the date of the meter reading and the end of the year are based on estimates of the daily
consumption record, adjusted to take account of weather conditions and other factors that may affect
estimated consumption such as:
inputs to the distribution companies system (measured value)
supply of high and very high voltage levels (measured value)
estimation of network losses
estimation of low voltage level supply
Revenues from sale of coal
Sales of coal are measured at the fair value of the consideration received, excluding any applicable taxes,
excise duties, charges, discounts and rebates. Most of the sales are priced as carriage paid to (CPT),
delivered at place (DAP) or delivered duty paid (DDP). The Group has concluded that it is acting as a
principal in all of its sales arrangements, delivering complete supplies to specified places including
responsibility for transportation, handling and potentially solving duty tax issues and insurance. A
significant proportion of Group production is sold under long-term contracts, which contain automatic
price escalation formulae and/or are updated from time to time by amendments specifying pricing for the
next period. However, the sales revenue is only recognised on an individual sale when all of the following
criteria are met:
the significant risks and rewards of ownership of the product have been transferred to the
customer;
the Group has retained neither continuing managerial involvement to the degree usually
associated with ownership, nor effective control over the goods sold;
the amount of revenue can be measured reliably;
it is probable that the economic benefits associated with the sale will flow to the Group; and
the costs incurred or to be incurred in respect of the sale can be measured reliably.
All these conditions are generally satisfied when the product is delivered to the destination specified by
the customer and as such, the title passes to the customer. Sales revenue is commonly subject to
adjustments based on an inspection of the product by the customer. Where there are agreed differences in
volume or quality of delivered products, this is reflected as reduction or increase (usually for better
qualities of coal) in sales revenue recognised on the sale transaction.
Energy trading
Revenues from energy trading comprise both realised (settled) and unrealised (change in fair value) net
gains and losses from trading in physical and financial energy contracts.
ii. Government grants
Government grants are recognised initially at fair value as deferred income when there is reasonable
assurance that they will be received and that the Company will comply with the conditions associated
with the grant. Grants that compensate the Company for expenses incurred are recognised in profit or loss
on a systematic basis in the same periods in which the expenses the grant is intended to compensate are
recognised. Grants that compensate the Company for the cost of an asset are recognised in profit or loss
on a systematic basis over the useful life of the asset.
iii. Rental income
Rental income from investment property is recognised in profit or loss on a straight-line basis over the
term of the lease.

Notes to the consolidated financial statements of EP Energy, a.s. as at and for the year ended 31 December 2015
30
(n) Finance income and costs
i. Finance income
Finance income comprises interest income on funds invested, dividend income, changes in the fair value
of financial assets at fair value through profit or loss, foreign currency gains, gains on sale of investments
in securities and gains on hedging instruments that are recognised in profit or loss. Interest income is
recognised in profit or loss as it accrues, using the effective interest method. Dividend income is
recognised in profit or loss on the date that the Group’s right to receive payment is established.
ii. Finance costs
Finance costs comprise interest expense on borrowings, unwinding of the discount on provisions, foreign
currency losses, changes in the fair value of financial assets at fair value through profit or loss, fees and
commissions expense for payment transactions and guarantees, impairment losses recognised on financial
assets, and losses on hedging instruments that are recognised in profit or loss.
iii. Borrowing costs
Borrowing costs that arise in connection with the acquisition, construction or production of a qualifying
asset, from the time of acquisition or from the beginning of construction or production until entry into
service, are capitalised and subsequently amortised alongside the related asset. In the case of a specific
financing arrangement, the respective borrowing costs for that arrangement are used. For non-specific
financing arrangements, borrowing costs to be capitalised are determined based on a weighted average of
the borrowing costs.
(o) Income taxes
Income taxes comprise current and deferred tax. Income taxes are recognised in profit or loss, except to
the extent that they relate to a business combination or to items recognised directly in equity or in other
comprehensive income.
Current tax is the expected tax payable or receivable on the taxable income or loss for the reporting
period, using tax rates enacted at the reporting date, and any adjustment to tax payable in respect of
previous years.
Deferred tax is measured using the balance sheet method, providing for temporary differences between
the carrying amounts of assets and liabilities for financial reporting purposes and the amounts used for
taxation purposes. No deferred tax is recognised on the following temporary differences: temporary
differences arising from the initial recognition of assets or liabilities that is not a business combination
and that affects neither accounting nor taxable profit or loss, and temporary differences relating to
investments in subsidiaries and jointly controlled entities to the extent that it is probable that they will not
reverse in the foreseeable future. No deferred tax is recognised on the initial recognition of goodwill.
The amount of deferred tax is based on the expected manner of realisation or settlement of the temporary
differences, using tax rates enacted or substantively enacted at the reporting date.
Deferred tax assets and liabilities are offset if there is a legally enforceable right to offset current tax
liabilities and assets, and they relate to income taxes levied by the same tax authority on the same taxable
entity, or on different tax entities, but there is an intention to settle current tax liabilities and assets on a
net basis, or the tax assets and liabilities will be realised simultaneously.
A deferred tax asset is recognised only to the extent that it is probable that future taxable profits will be
available against which the unused tax losses, tax credits and deductible temporary differences can be
utilised. Deferred tax assets are reduced to the extent that it is no longer probable that the related tax
benefit will be realised.
(p) Dividends
Dividends are recognised as distributions within equity upon approval by the Company’s shareholders.

Notes to the consolidated financial statements of EP Energy, a.s. as at and for the year ended 31 December 2015
31
(q) Non-current assets held for sale and disposal groups
Non-current assets (or disposal groups comprising assets and liabilities) which are expected to be
recovered primarily through sale rather than through continuing use are classified as held for sale.
Immediately before classification as held for sale, the assets (and all assets and liabilities in a disposal
group) are re-measured in accordance with the Group’s relevant accounting policies. Then, on initial
classification as held for sale, non-current assets and disposal groups are recognised at the lower of their
carrying amount and fair value less costs to sell.
Any impairment loss on a disposal group is first allocated to goodwill, and then to remaining assets and
liabilities on a pro rata basis, except that no loss is allocated to inventories, financial assets, deferred tax
assets, and investment property, which continue to be measured in accordance with the Group’s
accounting policies.
Impairment losses on initial classification as held for sale are included in profit or loss. The same applies
to gains and losses on subsequent re-measurement. Gains are not recognised in excess of any cumulative
impairment loss.
Any gain or loss on the re-measurement of a non-current asset (or disposal group) classified as held for
sale that does not meet the definition of a discontinued operation is included in profit or loss from
continuing operations.
Any separate major line of business or geographical area of operations or significant part of business,
which is decided to be sold, is classified as discontinued operations and is presented in profit or loss under
separate line Profit (loss) from discontinued operations, net of tax.
(r) Segment reporting
Due to the fact that the Company issued debentures (Senior Secured Notes) in 2012 and 2013 which were
listed on the Irish Stock Exchange, the Company reports segmental information in accordance with
IFRS 8.
Segment results that are reported to the Group’s board of directors (the chief operating decision maker)
include items directly attributable to the segment as well as those that can be allocated on a reasonable
basis. The support is provided by four executive committees: a strategic committee, an investment
committee, a risk management committee and a compliance committee.
Notes to the consolidated financial statements of EP Energy, a.s. as at and for the year ended 31 December 2015
32
4. Determination of fair values
A number of the Group’s accounting policies and disclosures require the determination of fair value, for
both financial and non-financial assets and liabilities. Fair values have been determined for measurement
and/or disclosure purposes based on the following methods. When applicable, further information about
the assumptions made in determining fair values is disclosed in the notes specific to that asset or liability.
(a) Property, plant and equipment
The fair value of property, plant and equipment recognised as a result of a business combination is based
on market values or the income approach method. The market value of property is the estimated amount
for which a property could be exchanged on the date of valuation between a willing buyer and a willing
seller in an arm’s length transaction after proper marketing wherein the parties had each acted
knowledgeably and willingly. The income approach method determines the value of property based on its
ability to generate desired economic benefit for the owners. The key objective of the income based
method is to determine the property value as a function of the economic benefit.
(b) Intangible assets
The fair value of intangible assets recognised as a result of a business combination is based on the
discounted cash flows expected to be derived from the use or eventual sale of the assets.
(c) Investment property
The fair value of investment property is determined by an independent registered valuer. The fair value is
assessed based on current prices in an active market for similar properties in the same location and
condition, or where not available, by applying generally applicable valuation methodologies that consider
the aggregate of the estimated cash flows expected to be received from renting out the property. A yield
that reflects the specific risks inherent in the net cash flows is then applied to the net annual cash flows to
arrive at the property valuation (discounting).
Valuations reflect, when appropriate, the type of tenants actually in occupation or responsible for meeting
lease commitments or likely to be in occupation after letting vacant accommodation, the allocation of
maintenance and insurance responsibilities between the Group and the lessee, and the remaining
economic life of the property. When rent reviews or lease renewals are pending with anticipated
reversionary increases, it is assumed that all notices, and when appropriate counter-notices, have been
served validly and within the appropriate time.
(d) Inventories
The fair value of inventories acquired in a business combination is determined based on the estimated
selling price in the ordinary course of business less the estimated costs of completion and sale, and a
reasonable profit margin based on the effort required to complete and sell the inventories.
(e) Non-derivative financial assets
The fair value of financial assets at fair value through profit or loss, held-to-maturity investments and
available-for-sale financial assets is based on their quoted market price at the reporting date without any
deduction for transaction costs. If a quoted market price is not available, the fair value of the instrument is
estimated by management using pricing models or discounted cash flows techniques.
Where discounted cash flow techniques are used, estimated future cash flows are based on management’s
best estimates and the discount rate is a market-related rate at the reporting date for an instrument with
similar terms and conditions. Where pricing models are used, inputs are based on market-related
measures at the reporting date.
The fair value of trade and other receivables, excluding construction work in progress, but including
service concession receivables, is estimated as the present value of future cash flows, discounted at the
market rate of interest at the reporting date.
The fair value of trade and other receivables and of held-to-maturity investments is determined for
disclosure purposes only.
Notes to the consolidated financial statements of EP Energy, a.s. as at and for the year ended 31 December 2015
33
(f) Non-derivative financial liabilities
Fair value, which is determined for disclosure purposes, is calculated based on the present value of future
principal and interest cash flows, discounted at the market rate of interest at the reporting date. For
finance leases the market rate of interest is determined by reference to similar lease agreements.
(g) Derivatives
The fair value of forward electricity contracts is based on their listed market price, if available. If a listed
market price is not available, then fair value is estimated by discounting the difference between the
contractual forward price and the current forward price for the residual maturity of the contract using a
risk-free interest rate (based on government bonds).
The fair value of interest rate swaps is based on broker quotes. Those quotes are tested for reasonableness
by discounting estimated future cash flows based on the terms and maturity of each contract and using
market interest rates for a similar instrument at the measurement date.
The fair value of other derivatives (exchange rate, commodity, foreign CPI indices) embedded in a
contract is estimated by discounting the difference between the forward values and the current values for
the residual maturity of the contract using a risk-free interest rate (based on zero coupon).
Fair values reflect the credit risk of the instrument and include adjustments to take account of the credit
risk of the Group entity and counterparty when appropriate.
Notes to the consolidated financial statements of EP Energy, a.s. as at and for the year ended 31 December 2015
34
5. Operating segments
The Group operates in five reportable segments: Mining, Heat and Power, Renewables, Power
Distribution and Supply and Holding and other. Heat and Power and Power Distribution and Supply are
the core segments of the Group. Mining segment was classified as discontinued operation for years 2015
and 2014 (for comparative purposes).
Operating segments have been identified primarily on the basis of internal reports used by the EPE’s
“chief operating decision maker” (Board of Directors) to allocate resources to the segments and assess
their performance. Major indicators used by the Board of Directors to measure these segments’
performance is operating profit before depreciation, amortization and negative goodwill (“Adjusted
EBITDA”) and capital expenditures.
i. Mining (discontinued)
The Mining segment, represented by Mitteldeutsche Braunkohlengesellschaft GmbH (MIBRAG),
produces brown coal, which it supplies to power plants under long-term supply agreements. The two
biggest customers – the Lippendorf and Schkopau-power plants – are highly efficient, state-of-the-art
power plants operating in base load and are well positioned in the German power merit order. This
segment was classified as discontinued operation in 2015.
ii. Heat and Power
The Heat and Power segment owns and operates four large-scale combined heat and power plants (CHPs)
in the Czech Republic primarily operated in highly efficient co-generation mode and represented
primarily by: Elektrárny Opatovice, a.s., United Energy, a.s., Plzeňská energetika a.s. and Pražská
teplárenská a.s., which is operating the largest district heating system in the Czech Republic, supplying
heat to the City of Prague, and three CHPs in Hungary, represented by Budapesti Erömü Zrt., which is
supplying the City of Budapest. The heat generated in its co-generation power plants is supplied mainly to
retail customers through well maintained and robust district heating systems that the EPE Group owns in
most of the cases. Czech based heat supply is regulated in a way of cost plus a reasonable profit margin
while the Hungarian operations are regulated using the standard Regulated Asset Base (“RAB”)
multiplied by WACC plus eligible operating expenditures and allowed depreciation formula.
The segment also includes Saale Energie GmbH purchased in 2012, which owns 41.9% of the Schkopau-
power plant representing a beneficial use right over 400MW of the plant´s total capacity of 900MW.
In December 2013, the EPE Group acquired a 100% share in Helmstedter Revier GmbH which operates a
condensation mode power plant in Lippendorf with an installed capacity of 390MW. These entities were
classified as discontinued operations in 2015.
iii. Renewables
The Renewables segment owns and operates three solar power plants and holds a minority interest in an
additional solar power plant and a majority interest in one wind farm in the Czech Republic. The Group
also owns two solar power plants in Slovakia, a biogas facility in Slovakia and one wind farm in Germany
at MIBRAG, which was classified as discontinued operation in 2015.
iv. Power Distribution and Supply
The Power Distribution and Supply segment consists of a Power Distribution division and a Supply
division. The Supply division supplies power and natural gas to end-consumers in the Czech Republic
and Slovakia. The Power Distribution division purchases and sells in the wholesale market power
generated by the Heat and Power segment and purchases from external sources and purchases electricity
and natural gas to supply customers through the Supply division. In addition, this segment distributes
electricity in the central Slovakia region. This segment is mainly represented by Stredoslovenská
energetika Group, EP Sourcing, a.s., EP Cargo a.s. and EP ENERGY TRADING, a.s.
SSE-Distribúcia, which provides distribution of natural gas and power, is required by law to provide
non-discriminatory access to the distribution network. Prices are subject to the review and approval of
Energy Regulatory Authority (“RONI”). Entity operates under similar regulatory frameworks whereby
allowed revenues are based on the RAB multiplied by the allowed regulatory WACC plus eligible

Notes to the consolidated financial statements of EP Energy, a.s. as at and for the year ended 31 December 2015
35
operating expenditures and allowed depreciation in line with regulatory frameworks in other European
countries. All key tariff parameters are set for a given regulatory period of five years.
RONI regulates certain aspects of the SSE’s relationships with its customers including the pricing of
electricity and services provided to certain customers of SSE. Price of electricity (the commodity) is
regulated for households and small businesses with the annual consumption up to 30 MWh where RONI
sets a capped gross profit per MWh. The price of electricity for the wholesale customers is not regulated.
v. Holding and other
The Holding and other segment mainly represents EP Energy, a.s. as a holding company. The segment
profit therefore primarily represents dividends received from its subsidiaries, finance expense and results
from acquisition accounting.

Notes to the consolidated financial statements of EP Energy, a.s. as at and for the year ended 31 December 2015
36
Profit or loss
For the year ended 31 December 2015
In thousands of EUR Mining
(discontinued)
Heat and Power Power
Distribution and
Supply
Renewables Holding and
other
Total segments Inter-segment
eliminations
Consolidated
Financial
Information
Sales: Energy - 416,575 1,648,462 5,069 - 2,070,106 (153,681) 1,916,425
external revenues - 335,473 1,576,248 4,704 - 1,916,425 - 1,916,425
inter-segment revenues - 81,102 72,214 365 - 153,681 (153,681) -
Sales: Other - 12,210 28,183 - 5,656 46,049 (2,201) 43,848
external revenues - 12,003 27,598 - 4,247 43,848 - 43,848 inter-segment revenues - 207 585 - 1,409 2,201 (2,201) -
Gain (loss) from commodity derivatives from trading with
electricity and gas, net - - 10,445 - - 10,445 - 10,445
Total sales - 428,785 1,687,090 5,069 5,656 2,126,600 (155,882) 1,970,718
Cost of sales: Energy - (237,123) (1,345,337) (358) - (1,582,818) 100,280 (1,482,538)
external cost of sales - (218,270) (1,263,910) (358) - (1,482,538) - (1,482,538)
inter-segment cost of sales - (18,853) (81,427) - - (100,280) 100,280 - Cost of sales: Other - (12,485) (66,665) (30) (3,663) (82,843) 49,767 (33,076)
external cost of sales - (12,225) (17,192) (8) (3,651) (33,076) - (33,076)
inter-segment cost of sales - (260) (49,473) (22) (12) (49,767) 49,767 -
Personnel expenses - (45,715) (47,241) (145) (2,085) (95,186) - (95,186)
Depreciation and amortisation - (83,895) (71,417) (2,796) (44) (158,152) - (158,152)
Repairs and maintenance - (5,792) (2,784) (521) (11) (9,108) 467 (8,641)
Emission rights, net - (3,894) 4 - - (3,890) - (3,890)
Negative goodwill - 33,085 - - - 33,085 - 33,085 Taxes and charges - 9,438 (808) (123) (5) 8,502 - 8,502
Other operating income - 12,004 9,600 399 442 22,445 3,453 25,898
Other operating expenses - (11,097) (37,126) (978) (3,398) (52,599) 1,538 (51,061)
Operating profit - 83,311 125,316 517 (3,108) 206,036 (377) 205,659
Finance income - 1,511 209 1 *134,469 *136,190 *(93,992) 42,198
external finance revenues - 204 154 1 41,839 42,198 - 42,198
inter-segment finance revenues - 1,307 55 - *92,630 *93,992 *(93,992) -
Finance expense - (14,318) (4,053) (1,659) (90,268) (110,298) 20,760 (89,538) Profit (loss) from derivative financial instruments - (289) 204 (112) (1,650) (1,847) - (1,847)
Share of profit (loss) of equity accounted investees, net of tax - (80) 448 - - 368 - 368
Gain (loss) on disposal of subsidiaries, special purpose entities,
joint ventures and associates - - - - (1,407) (1,407) - (1,407)
Profit (loss) before income tax - 70,135 122,124 (1,253) *38,036 *229,042 *(73,609) 155,433
Income tax expenses - (7,229) (29,486) (547) (16,480) (53,742) - (53,742)
Profit (loss) for the year before discontinued operations - 62,906 92,638 (1,800) *21,556 *175,300 *(73,609) 101,691
Profit (loss) from discontinued operations 28,769 (48,697) - (37) - (19,965) - (19,965)
Profit (loss) for the year 28,769 14,209 92,638 (1,837) *21,556 *155,335 *(73,609) 81,726
* EUR 73,344 thousand is attributable to intra-group dividends primarily recognised by EP Energy, a.s.
Other financial information:
Adjusted EBITDA(1) - 134,121 196,733 3,313 (3,064) 331,103 (377) 330,726
1) Adjusted EBITDA represents profit from operations plus depreciation of property, plant and equipment and amortisation of intangible assets (negative goodwill not included, if applicable). For Adjusted EBITDA
reconciliation to the closest IFRS measure explanation see below.
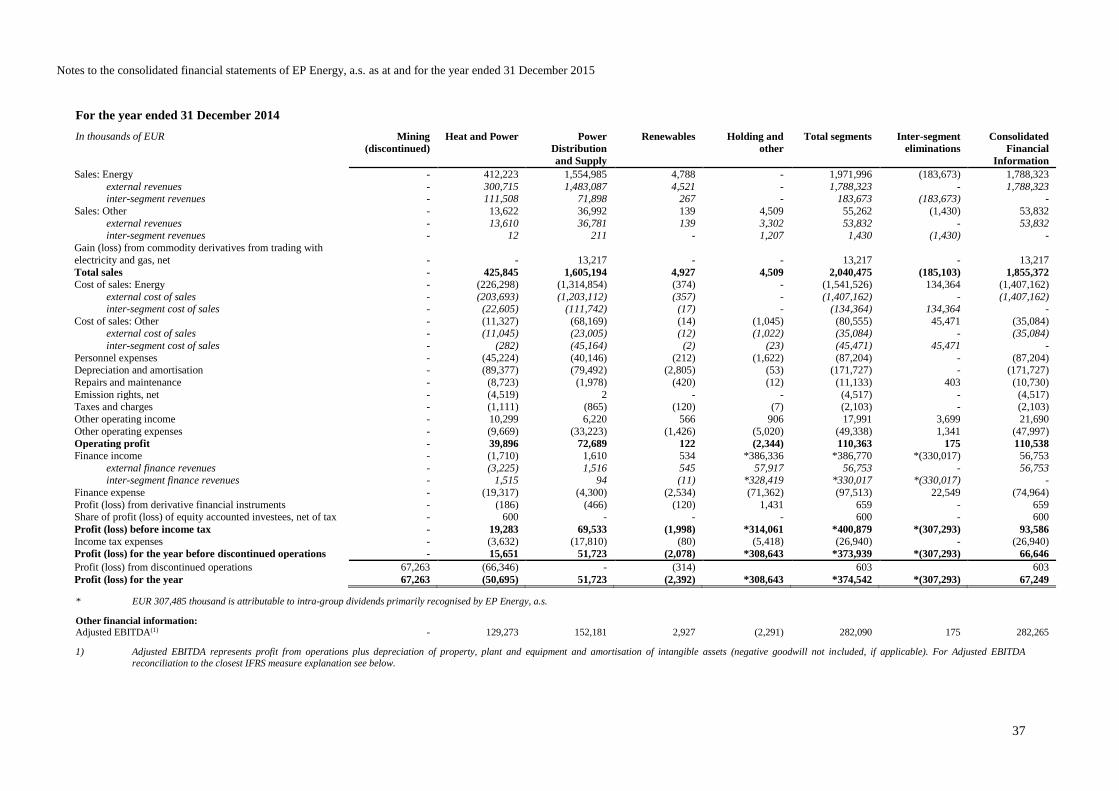
Notes to the consolidated financial statements of EP Energy, a.s. as at and for the year ended 31 December 2015
37
For the year ended 31 December 2014
In thousands of EUR Mining
(discontinued)
Heat and Power Power
Distribution
and Supply
Renewables Holding and
other
Total segments Inter-segment
eliminations
Consolidated
Financial
Information
Sales: Energy - 412,223 1,554,985 4,788 - 1,971,996 (183,673) 1,788,323
external revenues - 300,715 1,483,087 4,521 - 1,788,323 - 1,788,323 inter-segment revenues - 111,508 71,898 267 - 183,673 (183,673) -
Sales: Other - 13,622 36,992 139 4,509 55,262 (1,430) 53,832
external revenues - 13,610 36,781 139 3,302 53,832 - 53,832 inter-segment revenues - 12 211 - 1,207 1,430 (1,430) -
Gain (loss) from commodity derivatives from trading with
electricity and gas, net - - 13,217 - - 13,217 - 13,217
Total sales - 425,845 1,605,194 4,927 4,509 2,040,475 (185,103) 1,855,372
Cost of sales: Energy - (226,298) (1,314,854) (374) - (1,541,526) 134,364 (1,407,162)
external cost of sales - (203,693) (1,203,112) (357) - (1,407,162) - (1,407,162) inter-segment cost of sales - (22,605) (111,742) (17) - (134,364) 134,364 -
Cost of sales: Other - (11,327) (68,169) (14) (1,045) (80,555) 45,471 (35,084) external cost of sales - (11,045) (23,005) (12) (1,022) (35,084) - (35,084)
inter-segment cost of sales - (282) (45,164) (2) (23) (45,471) 45,471 -
Personnel expenses - (45,224) (40,146) (212) (1,622) (87,204) - (87,204) Depreciation and amortisation - (89,377) (79,492) (2,805) (53) (171,727) - (171,727)
Repairs and maintenance - (8,723) (1,978) (420) (12) (11,133) 403 (10,730)
Emission rights, net - (4,519) 2 - - (4,517) - (4,517) Taxes and charges - (1,111) (865) (120) (7) (2,103) - (2,103)
Other operating income - 10,299 6,220 566 906 17,991 3,699 21,690
Other operating expenses - (9,669) (33,223) (1,426) (5,020) (49,338) 1,341 (47,997)
Operating profit - 39,896 72,689 122 (2,344) 110,363 175 110,538
Finance income - (1,710) 1,610 534 *386,336 *386,770 *(330,017) 56,753
external finance revenues - (3,225) 1,516 545 57,917 56,753 - 56,753 inter-segment finance revenues - 1,515 94 (11) *328,419 *330,017 *(330,017) -
Finance expense - (19,317) (4,300) (2,534) (71,362) (97,513) 22,549 (74,964)
Profit (loss) from derivative financial instruments - (186) (466) (120) 1,431 659 - 659 Share of profit (loss) of equity accounted investees, net of tax - 600 - - - 600 - 600
Profit (loss) before income tax - 19,283 69,533 (1,998) *314,061 *400,879 *(307,293) 93,586
Income tax expenses - (3,632) (17,810) (80) (5,418) (26,940) - (26,940)
Profit (loss) for the year before discontinued operations - 15,651 51,723 (2,078) *308,643 *373,939 *(307,293) 66,646
Profit (loss) from discontinued operations 67,263 (66,346) - (314) 603 603
Profit (loss) for the year 67,263 (50,695) 51,723 (2,392) *308,643 *374,542 *(307,293) 67,249
* EUR 307,485 thousand is attributable to intra-group dividends primarily recognised by EP Energy, a.s.
Other financial information:
Adjusted EBITDA(1) - 129,273 152,181 2,927 (2,291) 282,090 175 282,265
1) Adjusted EBITDA represents profit from operations plus depreciation of property, plant and equipment and amortisation of intangible assets (negative goodwill not included, if applicable). For Adjusted EBITDA
reconciliation to the closest IFRS measure explanation see below.
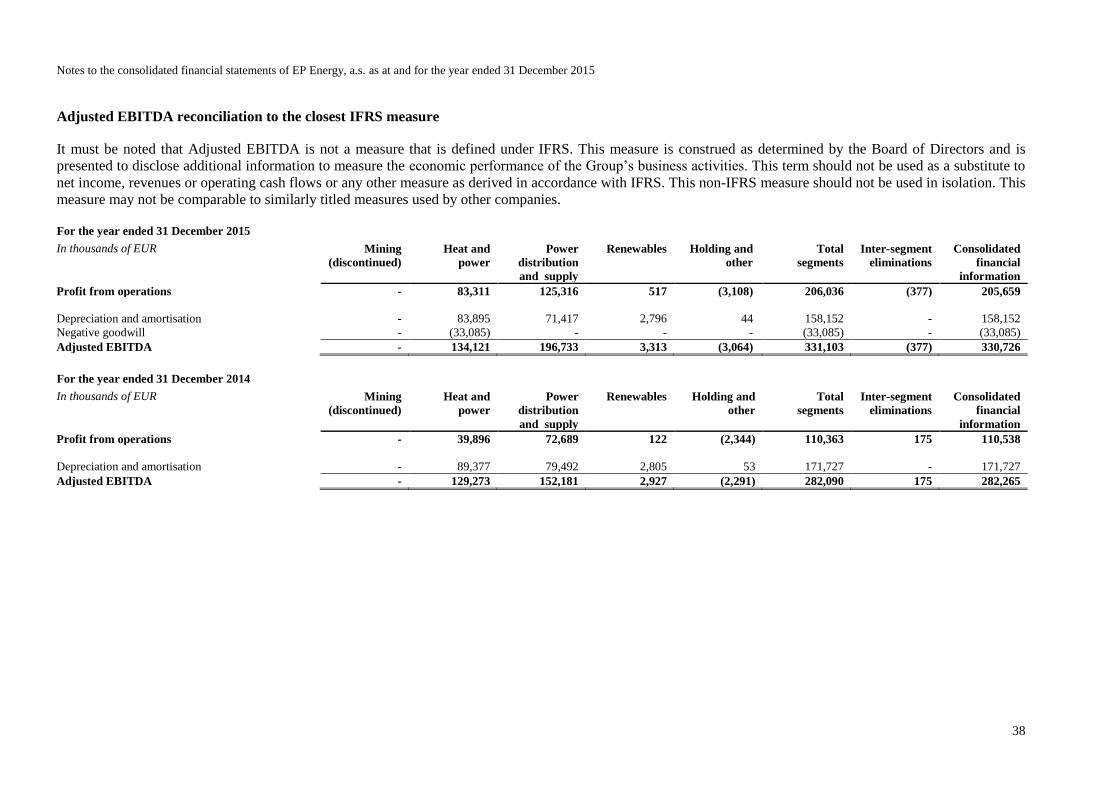
Notes to the consolidated financial statements of EP Energy, a.s. as at and for the year ended 31 December 2015
38
Adjusted EBITDA reconciliation to the closest IFRS measure
It must be noted that Adjusted EBITDA is not a measure that is defined under IFRS. This measure is construed as determined by the Board of Directors and is
presented to disclose additional information to measure the economic performance of the Group’s business activities. This term should not be used as a substitute to
net income, revenues or operating cash flows or any other measure as derived in accordance with IFRS. This non-IFRS measure should not be used in isolation. This
measure may not be comparable to similarly titled measures used by other companies.
For the year ended 31 December 2015
In thousands of EUR Mining
(discontinued)
Heat and
power
Power
distribution
and supply
Renewables Holding and
other
Total
segments
Inter-segment
eliminations
Consolidated
financial
information
Profit from operations - 83,311 125,316 517 (3,108) 206,036 (377) 205,659
Depreciation and amortisation - 83,895 71,417 2,796 44 158,152 - 158,152
Negative goodwill - (33,085) - - - (33,085) - (33,085)
Adjusted EBITDA - 134,121 196,733 3,313 (3,064) 331,103 (377) 330,726
For the year ended 31 December 2014
In thousands of EUR Mining
(discontinued)
Heat and
power
Power
distribution
and supply
Renewables Holding and
other
Total
segments
Inter-segment
eliminations
Consolidated
financial
information
Profit from operations - 39,896 72,689 122 (2,344) 110,363 175 110,538
Depreciation and amortisation - 89,377 79,492 2,805 53 171,727 - 171,727
Adjusted EBITDA - 129,273 152,181 2,927 (2,291) 282,090 175 282,265
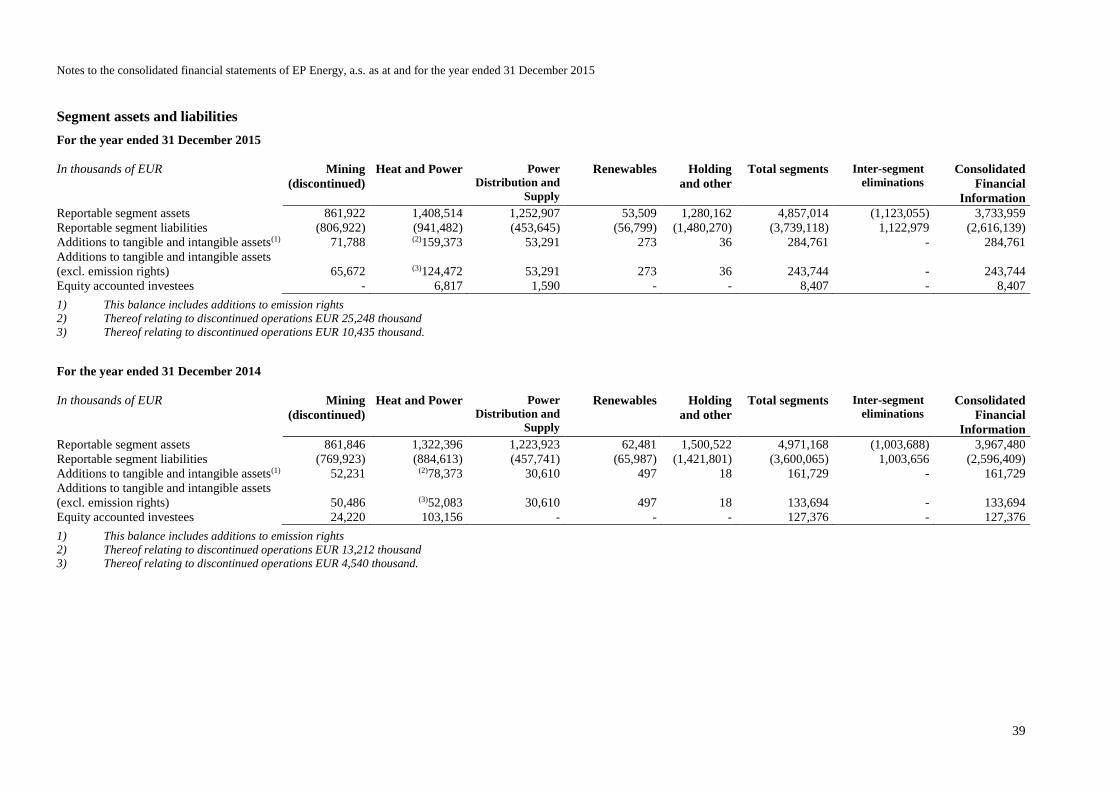
Notes to the consolidated financial statements of EP Energy, a.s. as at and for the year ended 31 December 2015
39
Segment assets and liabilities
For the year ended 31 December 2015
In thousands of EUR Mining
(discontinued)
Heat and Power Power
Distribution and
Supply
Renewables Holding
and other
Total segments Inter-segment
eliminations Consolidated
Financial
Information
Reportable segment assets 861,922 1,408,514 1,252,907 53,509 1,280,162 4,857,014 (1,123,055) 3,733,959
Reportable segment liabilities (806,922) (941,482) (453,645) (56,799) (1,480,270) (3,739,118) 1,122,979 (2,616,139)
Additions to tangible and intangible assets(1) 71,788 (2)159,373 53,291 273 36 284,761 - 284,761
Additions to tangible and intangible assets
(excl. emission rights) 65,672 (3)124,472 53,291 273 36 243,744 - 243,744
Equity accounted investees - 6,817 1,590 - - 8,407 - 8,407
1) This balance includes additions to emission rights
2) Thereof relating to discontinued operations EUR 25,248 thousand
3) Thereof relating to discontinued operations EUR 10,435 thousand.
For the year ended 31 December 2014
In thousands of EUR Mining
(discontinued)
Heat and Power Power
Distribution and
Supply
Renewables Holding
and other
Total segments Inter-segment
eliminations Consolidated
Financial
Information
Reportable segment assets 861,846 1,322,396 1,223,923 62,481 1,500,522 4,971,168 (1,003,688) 3,967,480
Reportable segment liabilities (769,923) (884,613) (457,741) (65,987) (1,421,801) (3,600,065) 1,003,656 (2,596,409)
Additions to tangible and intangible assets(1) 52,231 (2)78,373 30,610 497 18 161,729 - 161,729
Additions to tangible and intangible assets
(excl. emission rights) 50,486 (3)52,083 30,610 497 18 133,694 - 133,694
Equity accounted investees 24,220 103,156 - - - 127,376 - 127,376
1) This balance includes additions to emission rights
2) Thereof relating to discontinued operations EUR 13,212 thousand
3) Thereof relating to discontinued operations EUR 4,540 thousand.
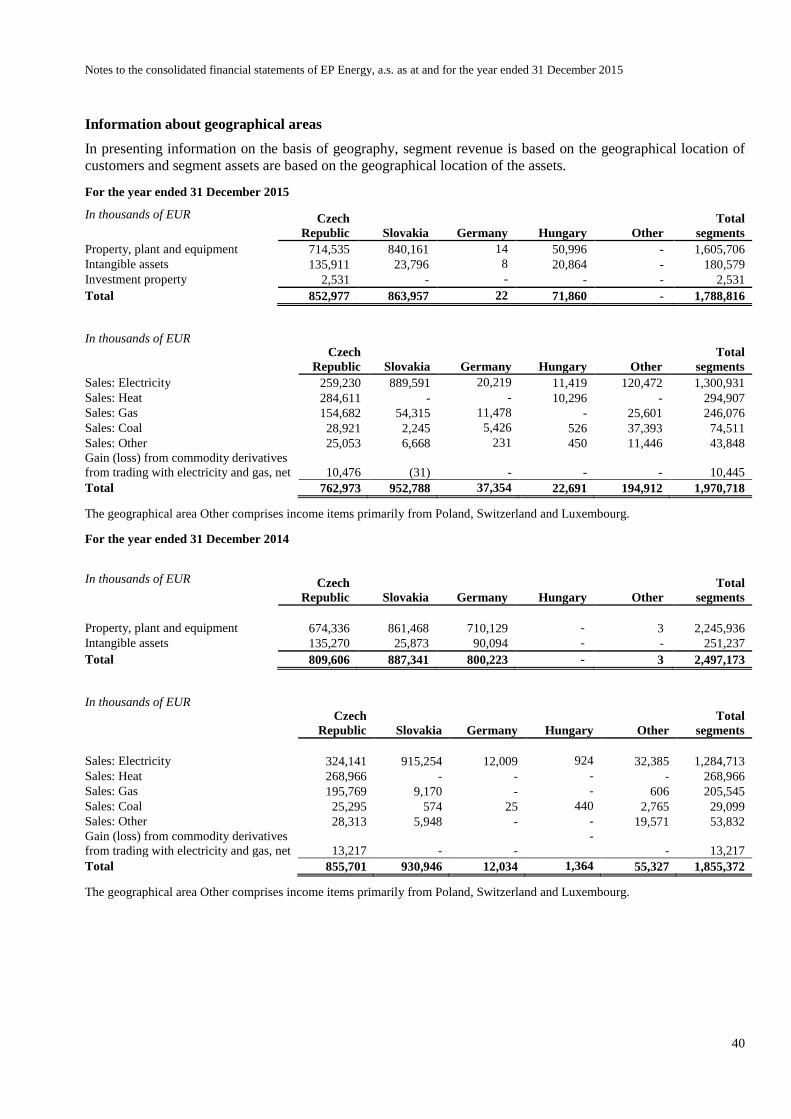
Notes to the consolidated financial statements of EP Energy, a.s. as at and for the year ended 31 December 2015
40
Information about geographical areas
In presenting information on the basis of geography, segment revenue is based on the geographical location of
customers and segment assets are based on the geographical location of the assets.
For the year ended 31 December 2015
In thousands of EUR Czech
Republic Slovakia Germany Hungary
Other
Total
segments
Property, plant and equipment 714,535 840,161 14 50,996 - 1,605,706
Intangible assets 135,911 23,796 8 20,864 - 180,579
Investment property 2,531 - - - - 2,531
Total 852,977 863,957 22 71,860 - 1,788,816
In thousands of EUR Czech
Republic Slovakia Germany Hungary Other
Total
segments
Sales: Electricity 259,230 889,591 20,219 11,419 120,472 1,300,931
Sales: Heat 284,611 - - 10,296 - 294,907
Sales: Gas 154,682 54,315 11,478 - 25,601 246,076
Sales: Coal 28,921 2,245 5,426 526 37,393 74,511
Sales: Other 25,053 6,668 231 450 11,446 43,848
Gain (loss) from commodity derivatives
from trading with electricity and gas, net 10,476 (31) - - - 10,445
Total 762,973 952,788 37,354 22,691 194,912 1,970,718
The geographical area Other comprises income items primarily from Poland, Switzerland and Luxembourg.
For the year ended 31 December 2014
In thousands of EUR Czech
Republic Slovakia Germany Hungary
Other
Total
segments
Property, plant and equipment 674,336 861,468 710,129 - 3 2,245,936
Intangible assets 135,270 25,873 90,094 - - 251,237
Total 809,606 887,341 800,223 - 3 2,497,173
In thousands of EUR Czech
Republic Slovakia Germany Hungary Other
Total
segments
Sales: Electricity 324,141 915,254 12,009 924 32,385 1,284,713
Sales: Heat 268,966 - - - - 268,966
Sales: Gas 195,769 9,170 - - 606 205,545
Sales: Coal 25,295 574 25 440 2,765 29,099
Sales: Other 28,313 5,948 - - 19,571 53,832
Gain (loss) from commodity derivatives
from trading with electricity and gas, net 13,217 - -
-
- 13,217
Total 855,701 930,946 12,034 1,364 55,327 1,855,372
The geographical area Other comprises income items primarily from Poland, Switzerland and Luxembourg.
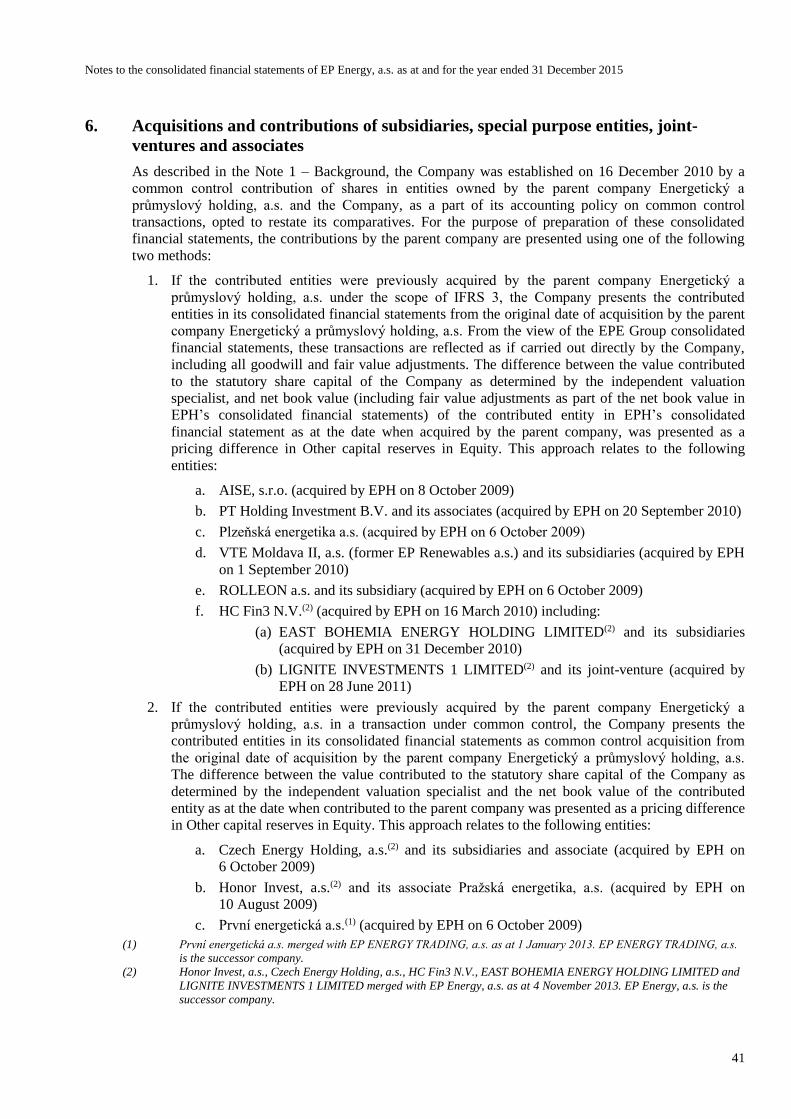
Notes to the consolidated financial statements of EP Energy, a.s. as at and for the year ended 31 December 2015
41
6. Acquisitions and contributions of subsidiaries, special purpose entities, joint-
ventures and associates
As described in the Note 1 – Background, the Company was established on 16 December 2010 by a
common control contribution of shares in entities owned by the parent company Energetický a
průmyslový holding, a.s. and the Company, as a part of its accounting policy on common control
transactions, opted to restate its comparatives. For the purpose of preparation of these consolidated
financial statements, the contributions by the parent company are presented using one of the following
two methods:
1. If the contributed entities were previously acquired by the parent company Energetický a
průmyslový holding, a.s. under the scope of IFRS 3, the Company presents the contributed
entities in its consolidated financial statements from the original date of acquisition by the parent
company Energetický a průmyslový holding, a.s. From the view of the EPE Group consolidated
financial statements, these transactions are reflected as if carried out directly by the Company,
including all goodwill and fair value adjustments. The difference between the value contributed
to the statutory share capital of the Company as determined by the independent valuation
specialist, and net book value (including fair value adjustments as part of the net book value in
EPH’s consolidated financial statements) of the contributed entity in EPH’s consolidated
financial statement as at the date when acquired by the parent company, was presented as a
pricing difference in Other capital reserves in Equity. This approach relates to the following
entities:
a. AISE, s.r.o. (acquired by EPH on 8 October 2009)
b. PT Holding Investment B.V. and its associates (acquired by EPH on 20 September 2010)
c. Plzeňská energetika a.s. (acquired by EPH on 6 October 2009)
d. VTE Moldava II, a.s. (former EP Renewables a.s.) and its subsidiaries (acquired by EPH
on 1 September 2010)
e. ROLLEON a.s. and its subsidiary (acquired by EPH on 6 October 2009)
f. HC Fin3 N.V.(2) (acquired by EPH on 16 March 2010) including:
(a) EAST BOHEMIA ENERGY HOLDING LIMITED(2) and its subsidiaries
(acquired by EPH on 31 December 2010)
(b) LIGNITE INVESTMENTS 1 LIMITED(2) and its joint-venture (acquired by
EPH on 28 June 2011)
2. If the contributed entities were previously acquired by the parent company Energetický a
průmyslový holding, a.s. in a transaction under common control, the Company presents the
contributed entities in its consolidated financial statements as common control acquisition from
the original date of acquisition by the parent company Energetický a průmyslový holding, a.s.
The difference between the value contributed to the statutory share capital of the Company as
determined by the independent valuation specialist and the net book value of the contributed
entity as at the date when contributed to the parent company was presented as a pricing difference
in Other capital reserves in Equity. This approach relates to the following entities:
a. Czech Energy Holding, a.s.(2) and its subsidiaries and associate (acquired by EPH on
6 October 2009)
b. Honor Invest, a.s.(2) and its associate Pražská energetika, a.s. (acquired by EPH on
10 August 2009)
c. První energetická a.s.(1) (acquired by EPH on 6 October 2009)
(1) První energetická a.s. merged with EP ENERGY TRADING, a.s. as at 1 January 2013. EP ENERGY TRADING, a.s.
is the successor company.
(2) Honor Invest, a.s., Czech Energy Holding, a.s., HC Fin3 N.V., EAST BOHEMIA ENERGY HOLDING LIMITED and
LIGNITE INVESTMENTS 1 LIMITED merged with EP Energy, a.s. as at 4 November 2013. EP Energy, a.s. is the
successor company.

Notes to the consolidated financial statements of EP Energy, a.s. as at and for the year ended 31 December 2015
42
(a) Acquisitions
i. 31 December 2015
In thousands of EUR Date of
acquisition
Purchase
price
Cash
paid
Other
consideration
Equity
interest
acquired
Equity
interest
after
acquisition
% %
New subsidiaries
LokoTrain s.r.o. 21/07/2015 1,108 (1,108) - 65 65
Optimum Energy, s.r.o. 01/08/2015 4,890 (4,890) - 100 100
Budapesti Erömü Zrt. (BERT) 10/12/2015 (2)5,504 - (1)(2)(5,504) 95.62 95.62
Total 11,502 (5,998) (5,504) - -
(1) Represents estimated deferred consideration contingent on meeting future operating results of BERT.
(2) The purchase price does not include EUR 28,999 thousand paid by the Group in exchange for a loan receivable from
BERT assigned by the seller to the acquirer. The loan receivable is not presented in the Note 6(b) – Effect of
acquisitions resulting in a change of control detailed table as it is eliminated in consolidation together with
respective liability of BERT towards the acquirer.
Acquisition of non-controlling interest
On 28 January 2015 NPTH, a.s. acquired a 0.35% share and on 30 March 2015 additional 0.07% share in
Pražská teplárenská a.s. This transaction resulted in change of ownership interest from 73.40% to 73.82%
share and derecognition of non-controlling interest in amount of EUR 1,221 thousand.
On 16 September 2015 EPE acquired a 40% share in EP Cargo a.s. for EUR 3,947 thousand and became
a 100% shareholder. As a result of this transaction the Group derecognised non-controlling interest in
amount of EUR 2,183 thousand.
ii. 31 December 2014
In thousands of EUR Date of
acquisition
Purchase
price
Purchase
price
liability
Other
consid-
eration
Equity
interest
acquired
Equity
interest after
acquisition
% %
New subsidiaries
EP Cargo a.s. 31/07/2014 5,803 (5,803) - 60 60
Total 5,803 (5,803) - - -
On 31 July 2014 the Group acquired 60% share in EP Cargo a.s. for EUR 5,803 thousand. The purchase
price liability has not yet been settled as at 31 December 2014.
On 11 December 2014 EP Energy, a.s. purchased EP Cargo Deutschland GmbH and on 30 September
2014 the Group acquired 60% share in PGP Terminal, a.s. Both these investments are held at cost as they
are immaterial.
Acquisition of non-controlling interest
On 3 July 2014 Severočeská teplárenská, a.s., a subsidiary of United Energy, a.s., acquired a 8.68% share
in PRVNÍ MOSTECKÁ a.s., which resulted in change of ownership interest from 91.32% to 100% share.
The 2.37% share was acquired from third parties, remaining 6.31% share acquisition was classified as
transfer within the Group.
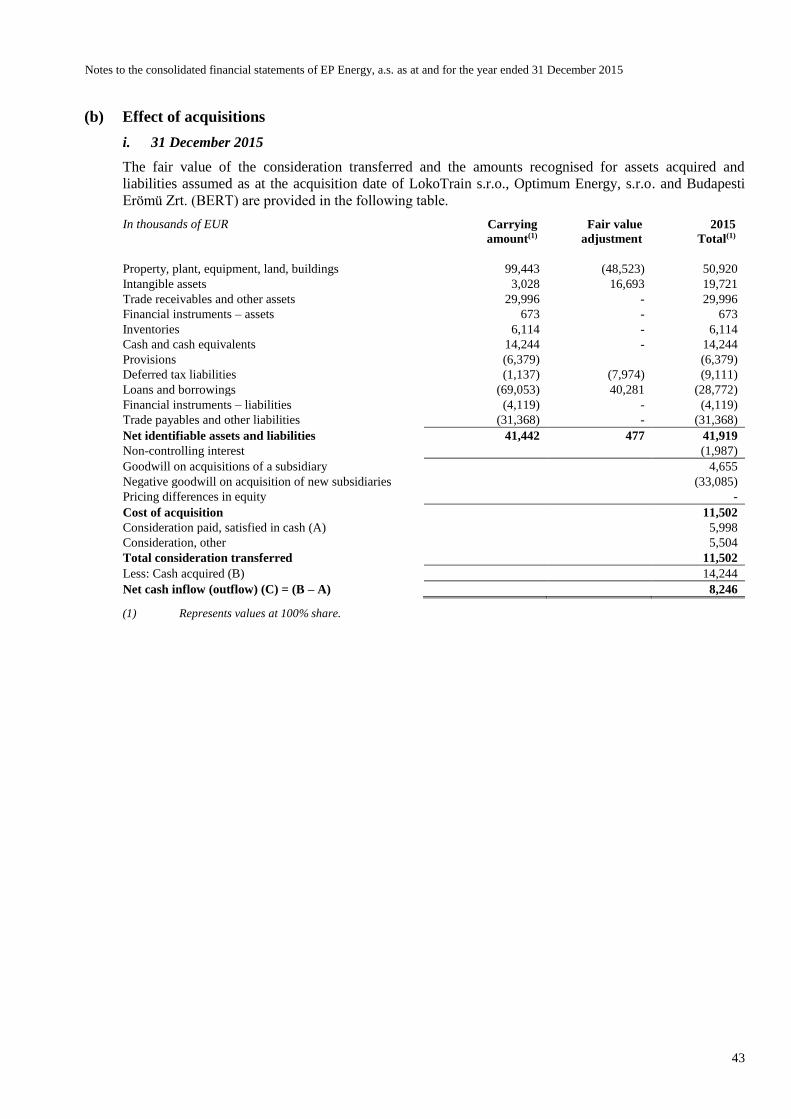
Notes to the consolidated financial statements of EP Energy, a.s. as at and for the year ended 31 December 2015
43
(b) Effect of acquisitions
i. 31 December 2015
The fair value of the consideration transferred and the amounts recognised for assets acquired and
liabilities assumed as at the acquisition date of LokoTrain s.r.o., Optimum Energy, s.r.o. and Budapesti
Erömü Zrt. (BERT) are provided in the following table.
In thousands of EUR Carrying
amount(1)
Fair value
adjustment
2015
Total(1)
Property, plant, equipment, land, buildings 99,443 (48,523) 50,920
Intangible assets 3,028 16,693 19,721
Trade receivables and other assets 29,996 - 29,996
Financial instruments – assets 673 - 673
Inventories 6,114 - 6,114
Cash and cash equivalents 14,244 - 14,244
Provisions (6,379) (6,379)
Deferred tax liabilities (1,137) (7,974) (9,111)
Loans and borrowings (69,053) 40,281 (28,772)
Financial instruments – liabilities (4,119) - (4,119)
Trade payables and other liabilities (31,368) - (31,368)
Net identifiable assets and liabilities 41,442 477 41,919
Non-controlling interest (1,987)
Goodwill on acquisitions of a subsidiary 4,655
Negative goodwill on acquisition of new subsidiaries (33,085)
Pricing differences in equity -
Cost of acquisition 11,502
Consideration paid, satisfied in cash (A) 5,998
Consideration, other 5,504
Total consideration transferred 11,502
Less: Cash acquired (B) 14,244
Net cash inflow (outflow) (C) = (B – A) 8,246
(1) Represents values at 100% share.
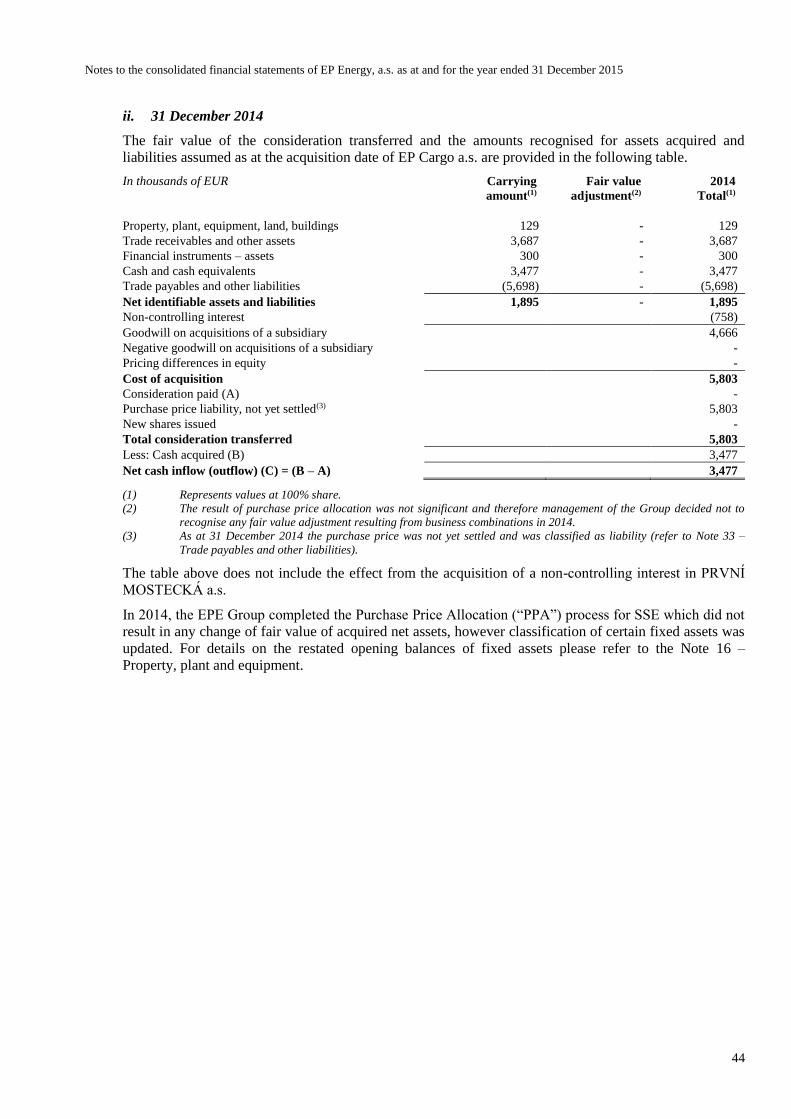
Notes to the consolidated financial statements of EP Energy, a.s. as at and for the year ended 31 December 2015
44
ii. 31 December 2014
The fair value of the consideration transferred and the amounts recognised for assets acquired and
liabilities assumed as at the acquisition date of EP Cargo a.s. are provided in the following table.
In thousands of EUR Carrying
amount(1)
Fair value
adjustment(2)
2014
Total(1)
Property, plant, equipment, land, buildings 129 - 129
Trade receivables and other assets 3,687 - 3,687
Financial instruments – assets 300 - 300
Cash and cash equivalents 3,477 - 3,477
Trade payables and other liabilities (5,698) - (5,698)
Net identifiable assets and liabilities 1,895 - 1,895
Non-controlling interest (758)
Goodwill on acquisitions of a subsidiary 4,666
Negative goodwill on acquisitions of a subsidiary -
Pricing differences in equity -
Cost of acquisition 5,803
Consideration paid (A) -
Purchase price liability, not yet settled(3) 5,803
New shares issued -
Total consideration transferred 5,803
Less: Cash acquired (B) 3,477
Net cash inflow (outflow) (C) = (B – A) 3,477
(1) Represents values at 100% share.
(2) The result of purchase price allocation was not significant and therefore management of the Group decided not to
recognise any fair value adjustment resulting from business combinations in 2014.
(3) As at 31 December 2014 the purchase price was not yet settled and was classified as liability (refer to Note 33 –
Trade payables and other liabilities).
The table above does not include the effect from the acquisition of a non-controlling interest in PRVNÍ
MOSTECKÁ a.s.
In 2014, the EPE Group completed the Purchase Price Allocation (“PPA”) process for SSE which did not
result in any change of fair value of acquired net assets, however classification of certain fixed assets was
updated. For details on the restated opening balances of fixed assets please refer to the Note 16 –
Property, plant and equipment.
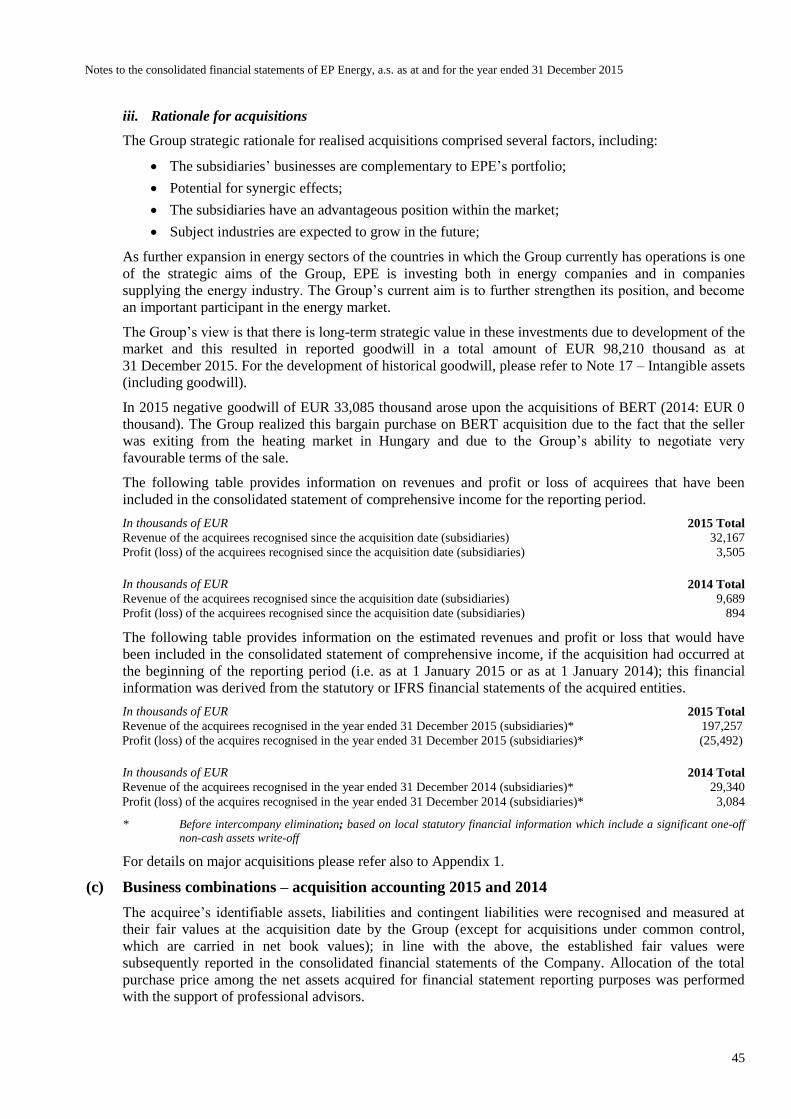
Notes to the consolidated financial statements of EP Energy, a.s. as at and for the year ended 31 December 2015
45
iii. Rationale for acquisitions
The Group strategic rationale for realised acquisitions comprised several factors, including:
The subsidiaries’ businesses are complementary to EPE’s portfolio;
Potential for synergic effects;
The subsidiaries have an advantageous position within the market;
Subject industries are expected to grow in the future;
As further expansion in energy sectors of the countries in which the Group currently has operations is one
of the strategic aims of the Group, EPE is investing both in energy companies and in companies
supplying the energy industry. The Group’s current aim is to further strengthen its position, and become
an important participant in the energy market.
The Group’s view is that there is long-term strategic value in these investments due to development of the
market and this resulted in reported goodwill in a total amount of EUR 98,210 thousand as at
31 December 2015. For the development of historical goodwill, please refer to Note 17 – Intangible assets
(including goodwill).
In 2015 negative goodwill of EUR 33,085 thousand arose upon the acquisitions of BERT (2014: EUR 0
thousand). The Group realized this bargain purchase on BERT acquisition due to the fact that the seller
was exiting from the heating market in Hungary and due to the Group’s ability to negotiate very
favourable terms of the sale.
The following table provides information on revenues and profit or loss of acquirees that have been
included in the consolidated statement of comprehensive income for the reporting period.
In thousands of EUR 2015 Total
Revenue of the acquirees recognised since the acquisition date (subsidiaries) 32,167
Profit (loss) of the acquirees recognised since the acquisition date (subsidiaries) 3,505
In thousands of EUR 2014 Total
Revenue of the acquirees recognised since the acquisition date (subsidiaries) 9,689
Profit (loss) of the acquirees recognised since the acquisition date (subsidiaries) 894
The following table provides information on the estimated revenues and profit or loss that would have
been included in the consolidated statement of comprehensive income, if the acquisition had occurred at
the beginning of the reporting period (i.e. as at 1 January 2015 or as at 1 January 2014); this financial
information was derived from the statutory or IFRS financial statements of the acquired entities.
In thousands of EUR 2015 Total
Revenue of the acquirees recognised in the year ended 31 December 2015 (subsidiaries)* 197,257
Profit (loss) of the acquires recognised in the year ended 31 December 2015 (subsidiaries)* (25,492)
In thousands of EUR 2014 Total
Revenue of the acquirees recognised in the year ended 31 December 2014 (subsidiaries)* 29,340
Profit (loss) of the acquires recognised in the year ended 31 December 2014 (subsidiaries)* 3,084
* Before intercompany elimination; based on local statutory financial information which include a significant one-off
non-cash assets write-off
For details on major acquisitions please refer also to Appendix 1.
(c) Business combinations – acquisition accounting 2015 and 2014
The acquiree’s identifiable assets, liabilities and contingent liabilities were recognised and measured at
their fair values at the acquisition date by the Group (except for acquisitions under common control,
which are carried in net book values); in line with the above, the established fair values were
subsequently reported in the consolidated financial statements of the Company. Allocation of the total
purchase price among the net assets acquired for financial statement reporting purposes was performed
with the support of professional advisors.
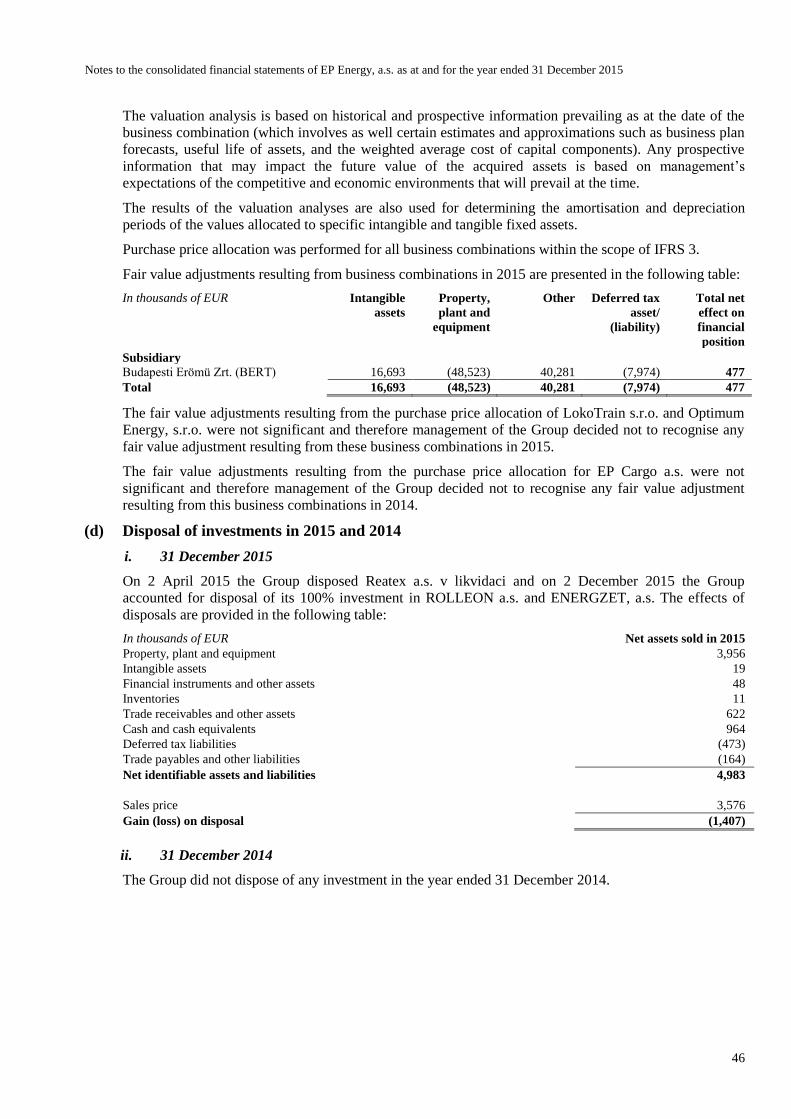
Notes to the consolidated financial statements of EP Energy, a.s. as at and for the year ended 31 December 2015
46
The valuation analysis is based on historical and prospective information prevailing as at the date of the
business combination (which involves as well certain estimates and approximations such as business plan
forecasts, useful life of assets, and the weighted average cost of capital components). Any prospective
information that may impact the future value of the acquired assets is based on management’s
expectations of the competitive and economic environments that will prevail at the time.
The results of the valuation analyses are also used for determining the amortisation and depreciation
periods of the values allocated to specific intangible and tangible fixed assets.
Purchase price allocation was performed for all business combinations within the scope of IFRS 3.
Fair value adjustments resulting from business combinations in 2015 are presented in the following table:
In thousands of EUR
Intangible
assets
Property,
plant and
equipment
Other Deferred tax
asset/
(liability)
Total net
effect on
financial
position
Subsidiary
Budapesti Erömü Zrt. (BERT) 16,693 (48,523) 40,281 (7,974) 477
Total 16,693 (48,523) 40,281 (7,974) 477
The fair value adjustments resulting from the purchase price allocation of LokoTrain s.r.o. and Optimum
Energy, s.r.o. were not significant and therefore management of the Group decided not to recognise any
fair value adjustment resulting from these business combinations in 2015.
The fair value adjustments resulting from the purchase price allocation for EP Cargo a.s. were not
significant and therefore management of the Group decided not to recognise any fair value adjustment
resulting from this business combinations in 2014.
(d) Disposal of investments in 2015 and 2014
i. 31 December 2015
On 2 April 2015 the Group disposed Reatex a.s. v likvidaci and on 2 December 2015 the Group
accounted for disposal of its 100% investment in ROLLEON a.s. and ENERGZET, a.s. The effects of
disposals are provided in the following table:
In thousands of EUR Net assets sold in 2015
Property, plant and equipment 3,956
Intangible assets 19
Financial instruments and other assets 48
Inventories 11
Trade receivables and other assets 622
Cash and cash equivalents 964
Deferred tax liabilities (473)
Trade payables and other liabilities (164)
Net identifiable assets and liabilities 4,983
Sales price 3,576
Gain (loss) on disposal (1,407)
ii. 31 December 2014
The Group did not dispose of any investment in the year ended 31 December 2014.
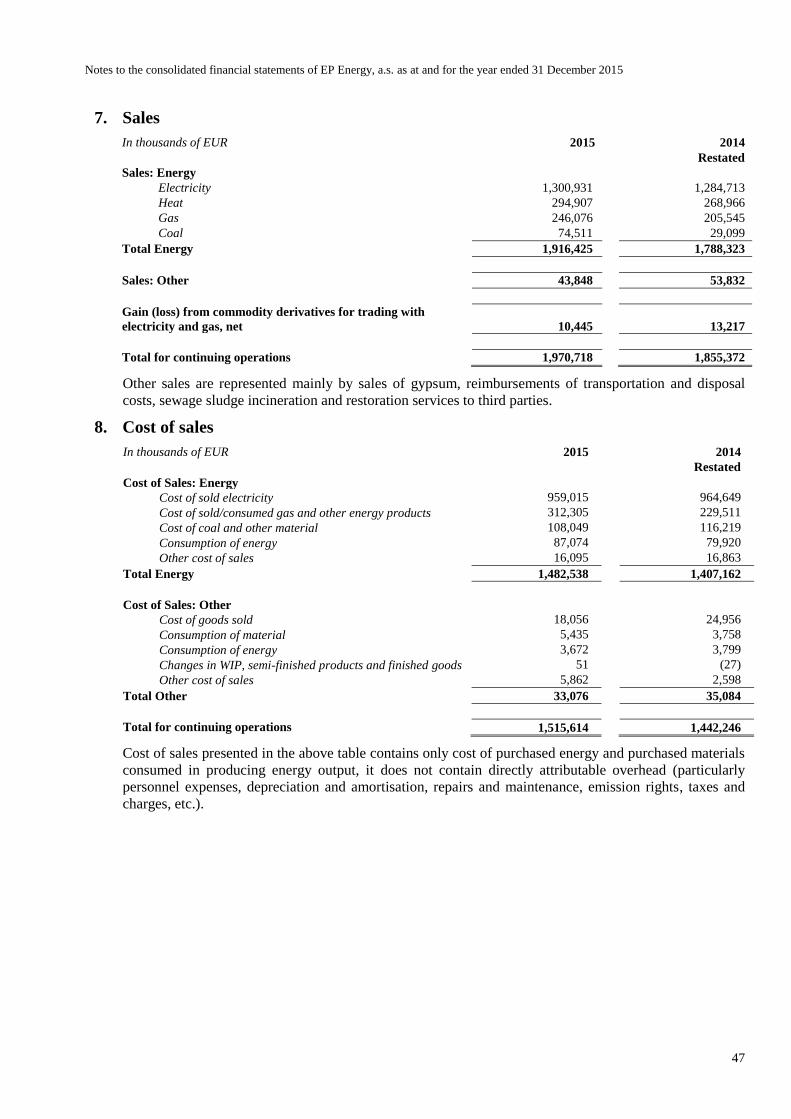
Notes to the consolidated financial statements of EP Energy, a.s. as at and for the year ended 31 December 2015
47
7. Sales
In thousands of EUR 2015 2014
Restated
Sales: Energy
Electricity 1,300,931 1,284,713
Heat 294,907 268,966
Gas 246,076 205,545
Coal 74,511 29,099
Total Energy 1,916,425 1,788,323
Sales: Other 43,848 53,832
Gain (loss) from commodity derivatives for trading with
electricity and gas, net 10,445 13,217
Total for continuing operations 1,970,718 1,855,372
Other sales are represented mainly by sales of gypsum, reimbursements of transportation and disposal
costs, sewage sludge incineration and restoration services to third parties.
8. Cost of sales
In thousands of EUR 2015 2014
Restated
Cost of Sales: Energy
Cost of sold electricity 959,015 964,649
Cost of sold/consumed gas and other energy products 312,305 229,511
Cost of coal and other material 108,049 116,219
Consumption of energy 87,074 79,920
Other cost of sales 16,095 16,863
Total Energy 1,482,538 1,407,162
Cost of Sales: Other
Cost of goods sold 18,056 24,956
Consumption of material 5,435 3,758
Consumption of energy 3,672 3,799
Changes in WIP, semi-finished products and finished goods 51 (27)
Other cost of sales 5,862 2,598
Total Other 33,076 35,084
Total for continuing operations 1,515,614 1,442,246
Cost of sales presented in the above table contains only cost of purchased energy and purchased materials
consumed in producing energy output, it does not contain directly attributable overhead (particularly
personnel expenses, depreciation and amortisation, repairs and maintenance, emission rights, taxes and
charges, etc.).
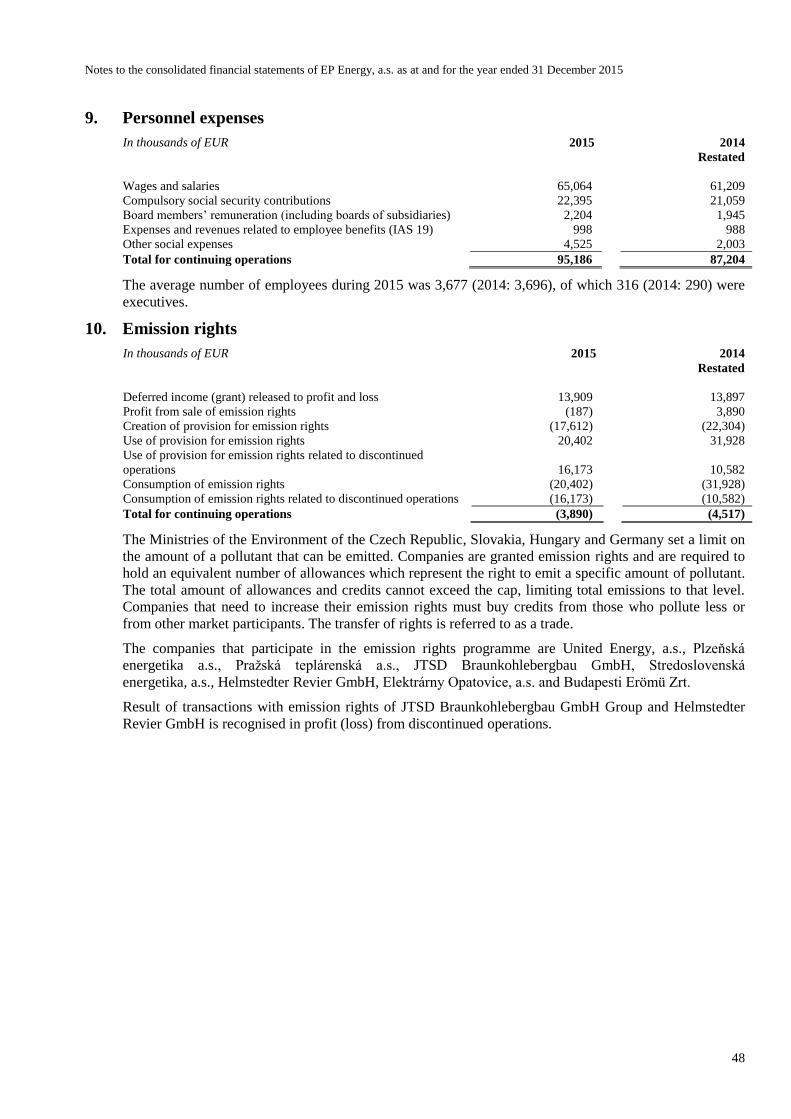
Notes to the consolidated financial statements of EP Energy, a.s. as at and for the year ended 31 December 2015
48
9. Personnel expenses
In thousands of EUR 2015 2014
Restated
Wages and salaries 65,064 61,209
Compulsory social security contributions 22,395 21,059
Board members’ remuneration (including boards of subsidiaries) 2,204 1,945
Expenses and revenues related to employee benefits (IAS 19) 998 988
Other social expenses 4,525 2,003
Total for continuing operations 95,186 87,204
The average number of employees during 2015 was 3,677 (2014: 3,696), of which 316 (2014: 290) were
executives.
10. Emission rights
In thousands of EUR 2015 2014
Restated
Deferred income (grant) released to profit and loss 13,909 13,897
Profit from sale of emission rights (187) 3,890
Creation of provision for emission rights (17,612) (22,304)
Use of provision for emission rights 20,402 31,928
Use of provision for emission rights related to discontinued
operations 16,173 10,582
Consumption of emission rights (20,402) (31,928)
Consumption of emission rights related to discontinued operations (16,173) (10,582)
Total for continuing operations (3,890) (4,517)
The Ministries of the Environment of the Czech Republic, Slovakia, Hungary and Germany set a limit on
the amount of a pollutant that can be emitted. Companies are granted emission rights and are required to
hold an equivalent number of allowances which represent the right to emit a specific amount of pollutant.
The total amount of allowances and credits cannot exceed the cap, limiting total emissions to that level.
Companies that need to increase their emission rights must buy credits from those who pollute less or
from other market participants. The transfer of rights is referred to as a trade.
The companies that participate in the emission rights programme are United Energy, a.s., Plzeňská
energetika a.s., Pražská teplárenská a.s., JTSD Braunkohlebergbau GmbH, Stredoslovenská
energetika, a.s., Helmstedter Revier GmbH, Elektrárny Opatovice, a.s. and Budapesti Erömü Zrt.
Result of transactions with emission rights of JTSD Braunkohlebergbau GmbH Group and Helmstedter
Revier GmbH is recognised in profit (loss) from discontinued operations.

Notes to the consolidated financial statements of EP Energy, a.s. as at and for the year ended 31 December 2015
49
11. Taxes and charges
In thousands of EUR 2015 2014
Restated
Gift tax refunds (10,799) -
Property and real estate transfer tax 811 829
Electricity tax 22 133
Other taxes and charges 1,464 1,141
Total for continuing operations (8,502) 2,103
In February 2015 the European Court of Justice issued preliminary ruling on gas emission rights taxation
in the Czech Republic. The Czech Republic levied a gift tax at a rate of 32% on greenhouse gas emission
allowances acquired free of charge for electricity production in years 2011 and 2012. The European Court
of Justice concluded that European law (namely Article 10 of Directive 2003/87/EC of the European
Parliament and of the Council of 13 October 2003) precludes the imposition of such tax if it does not
respect the 10% ceiling on the allocation of emission rights for consideration laid down in cited article.
Based on this ruling, the Supreme Administrative Court of the Czech Republic set out principles for
determining an amount in which the tax shall be refundable (judgement of 9th July 2015, case no: 1 Afs
6/2013-184). Applying the Supreme Administrative Court ruling, Tax Appeal Board approved tax refund
in December 2015. The refund of EUR 10,799 thousand was recognised as income by the Group in the
year ended 31 December 2015 and collected in 2015 and 2016.
Related amount of penalty in amount of EUR 2,406 thousand was recognised as penalty in Other
operating income (for more details refer to Note 12 – Other operating income).
12. Other operating income
In thousands of EUR 2015 2014
Restated
Rental income 4,908 5,241
Property acquired free-of-charge and fees from customers 3,789 3,931
Consulting fees 3,618 3,608
Compensation from insurance and other companies 3,195 3,930
Contractual penalties (1)3,044 521
Profit from disposal of tangible and intangible assets 1,859 -
Profit from sale of material 723 178
Decentralisation and cogeneration fee 359 338
Inventories surplus - 31
Other 4,403 3,912
Total for continuing operations 25,898 21,690
(1) Balance includes penalty received for a gift tax on emission rights in amount of EUR 2,406 thousand recognised in
2011 and 2012 (for more details refer to Note 11 – Taxes and charges).
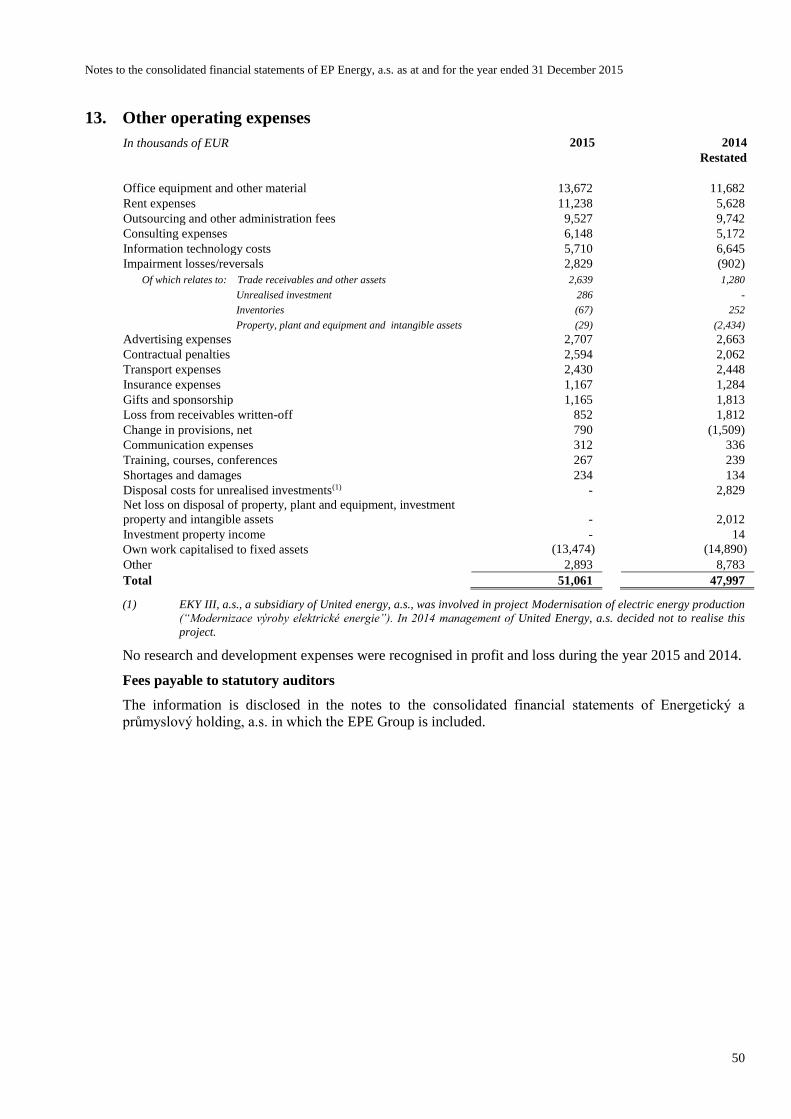
Notes to the consolidated financial statements of EP Energy, a.s. as at and for the year ended 31 December 2015
50
13. Other operating expenses
In thousands of EUR 2015 2014
Restated
Office equipment and other material 13,672 11,682
Rent expenses 11,238 5,628
Outsourcing and other administration fees 9,527 9,742
Consulting expenses 6,148 5,172
Information technology costs 5,710 6,645
Impairment losses/reversals 2,829 (902)
Of which relates to: Trade receivables and other assets 2,639 1,280
Unrealised investment 286 -
Inventories (67) 252
Property, plant and equipment and intangible assets (29) (2,434)
Advertising expenses 2,707 2,663
Contractual penalties 2,594 2,062
Transport expenses 2,430 2,448
Insurance expenses 1,167 1,284
Gifts and sponsorship 1,165 1,813
Loss from receivables written-off 852 1,812
Change in provisions, net 790 (1,509)
Communication expenses 312 336
Training, courses, conferences 267 239
Shortages and damages 234 134
Disposal costs for unrealised investments(1) - 2,829
Net loss on disposal of property, plant and equipment, investment
property and intangible assets - 2,012
Investment property income - 14
Own work capitalised to fixed assets (13,474) (14,890)
Other 2,893 8,783
Total 51,061 47,997
(1) EKY III, a.s., a subsidiary of United energy, a.s., was involved in project Modernisation of electric energy production
(“Modernizace výroby elektrické energie”). In 2014 management of United Energy, a.s. decided not to realise this
project.
No research and development expenses were recognised in profit and loss during the year 2015 and 2014.
Fees payable to statutory auditors
The information is disclosed in the notes to the consolidated financial statements of Energetický a
průmyslový holding, a.s. in which the EPE Group is included.
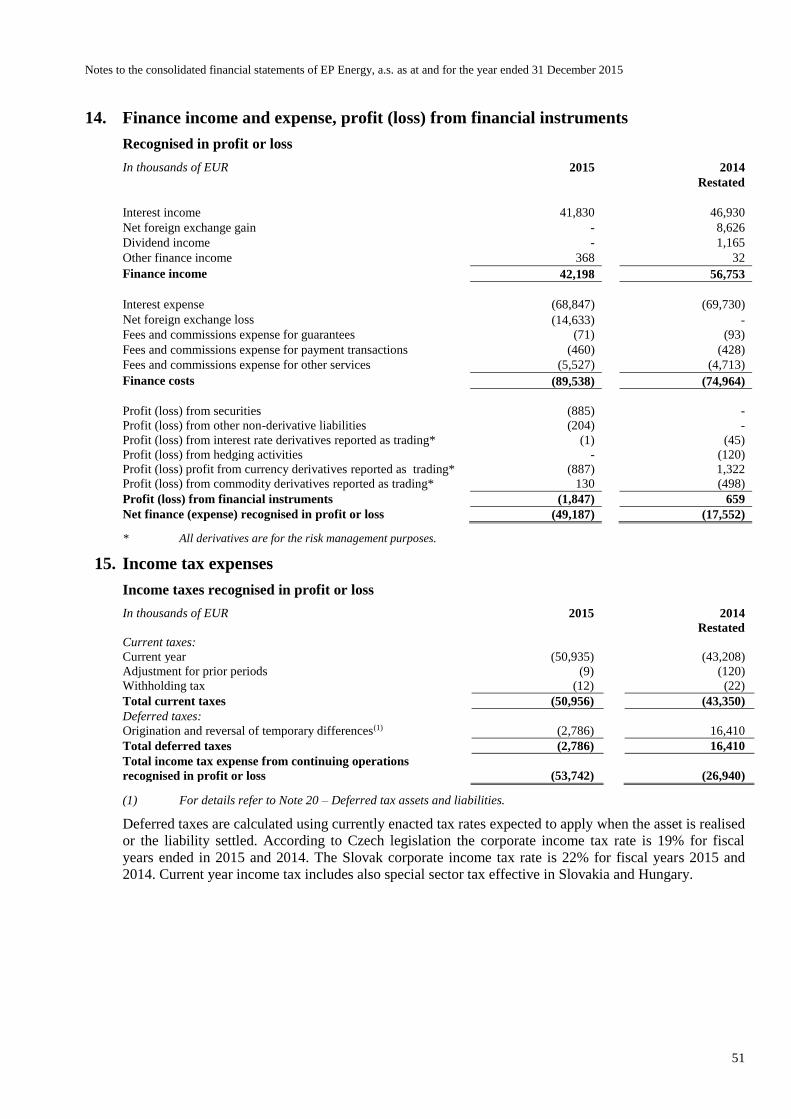
Notes to the consolidated financial statements of EP Energy, a.s. as at and for the year ended 31 December 2015
51
14. Finance income and expense, profit (loss) from financial instruments
Recognised in profit or loss
In thousands of EUR 2015 2014
Restated
Interest income 41,830 46,930
Net foreign exchange gain - 8,626
Dividend income - 1,165
Other finance income 368 32
Finance income 42,198 56,753
Interest expense (68,847) (69,730)
Net foreign exchange loss (14,633) -
Fees and commissions expense for guarantees (71) (93)
Fees and commissions expense for payment transactions (460) (428)
Fees and commissions expense for other services (5,527) (4,713)
Finance costs (89,538) (74,964)
Profit (loss) from securities (885) -
Profit (loss) from other non-derivative liabilities (204) -
Profit (loss) from interest rate derivatives reported as trading* (1) (45)
Profit (loss) from hedging activities - (120)
Profit (loss) profit from currency derivatives reported as trading* (887) 1,322
Profit (loss) from commodity derivatives reported as trading* 130 (498)
Profit (loss) from financial instruments (1,847) 659
Net finance (expense) recognised in profit or loss (49,187) (17,552)
* All derivatives are for the risk management purposes.
15. Income tax expenses
Income taxes recognised in profit or loss
In thousands of EUR 2015 2014
Restated
Current taxes:
Current year (50,935) (43,208)
Adjustment for prior periods (9) (120)
Withholding tax (12) (22)
Total current taxes (50,956) (43,350)
Deferred taxes:
Origination and reversal of temporary differences(1) (2,786) 16,410
Total deferred taxes (2,786) 16,410
Total income tax expense from continuing operations
recognised in profit or loss (53,742) (26,940)
(1) For details refer to Note 20 – Deferred tax assets and liabilities.
Deferred taxes are calculated using currently enacted tax rates expected to apply when the asset is realised
or the liability settled. According to Czech legislation the corporate income tax rate is 19% for fiscal
years ended in 2015 and 2014. The Slovak corporate income tax rate is 22% for fiscal years 2015 and
2014. Current year income tax includes also special sector tax effective in Slovakia and Hungary.
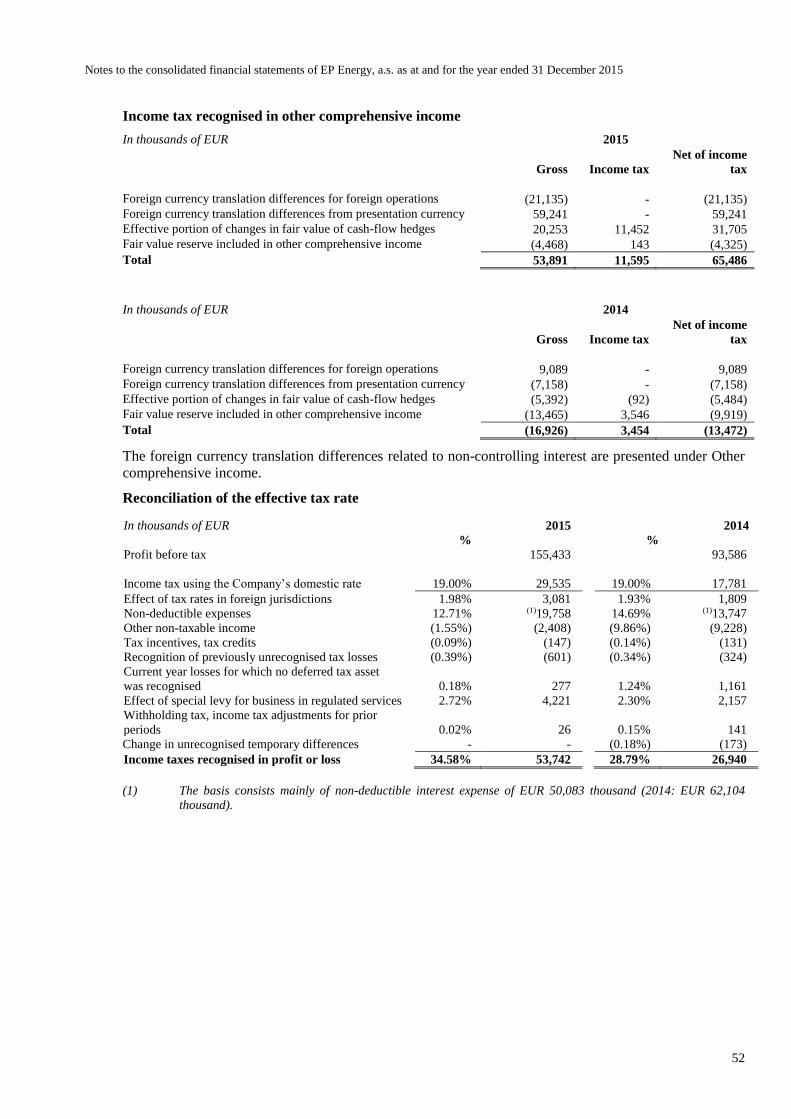
Notes to the consolidated financial statements of EP Energy, a.s. as at and for the year ended 31 December 2015
52
Income tax recognised in other comprehensive income
In thousands of EUR 2015
Gross Income tax
Net of income
tax
Foreign currency translation differences for foreign operations (21,135) - (21,135)
Foreign currency translation differences from presentation currency 59,241 - 59,241
Effective portion of changes in fair value of cash-flow hedges 20,253 11,452 31,705
Fair value reserve included in other comprehensive income (4,468) 143 (4,325)
Total 53,891 11,595 65,486
In thousands of EUR 2014
Gross Income tax
Net of income
tax
Foreign currency translation differences for foreign operations 9,089 - 9,089
Foreign currency translation differences from presentation currency (7,158) - (7,158)
Effective portion of changes in fair value of cash-flow hedges (5,392) (92) (5,484)
Fair value reserve included in other comprehensive income (13,465) 3,546 (9,919)
Total (16,926) 3,454 (13,472)
The foreign currency translation differences related to non-controlling interest are presented under Other
comprehensive income.
Reconciliation of the effective tax rate
In thousands of EUR 2015 2014
% %
Profit before tax 155,433 93,586
Income tax using the Company’s domestic rate 19.00% 29,535 19.00% 17,781
Effect of tax rates in foreign jurisdictions 1.98% 3,081 1.93% 1,809
Non-deductible expenses 12.71% (1)19,758 14.69% (1)13,747
Other non-taxable income (1.55%) (2,408) (9.86%) (9,228)
Tax incentives, tax credits (0.09%) (147) (0.14%) (131)
Recognition of previously unrecognised tax losses (0.39%) (601) (0.34%) (324)
Current year losses for which no deferred tax asset
was recognised 0.18% 277 1.24% 1,161
Effect of special levy for business in regulated services 2.72% 4,221 2.30% 2,157
Withholding tax, income tax adjustments for prior
periods 0.02% 26 0.15% 141
Change in unrecognised temporary differences - - (0.18%) (173)
Income taxes recognised in profit or loss 34.58% 53,742 28.79% 26,940
(1) The basis consists mainly of non-deductible interest expense of EUR 50,083 thousand (2014: EUR 62,104
thousand).
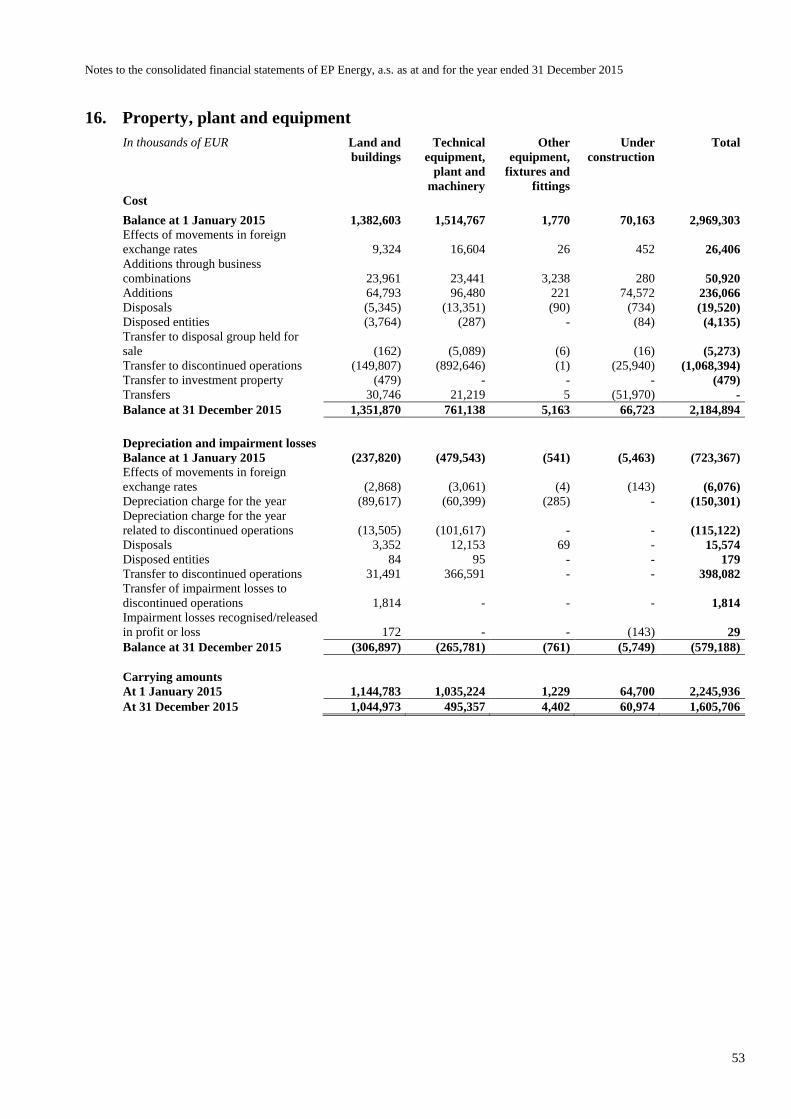
Notes to the consolidated financial statements of EP Energy, a.s. as at and for the year ended 31 December 2015
53
16. Property, plant and equipment
In thousands of EUR Land and
buildings
Technical
equipment,
plant and
machinery
Other
equipment,
fixtures and
fittings
Under
construction
Total
Cost
Balance at 1 January 2015 1,382,603 1,514,767 1,770 70,163 2,969,303
Effects of movements in foreign
exchange rates 9,324 16,604 26 452 26,406
Additions through business
combinations 23,961 23,441 3,238 280 50,920
Additions 64,793 96,480 221 74,572 236,066
Disposals (5,345) (13,351) (90) (734) (19,520)
Disposed entities (3,764) (287) - (84) (4,135)
Transfer to disposal group held for
sale (162) (5,089) (6) (16) (5,273)
Transfer to discontinued operations (149,807) (892,646) (1) (25,940) (1,068,394)
Transfer to investment property (479) - - - (479)
Transfers 30,746 21,219 5 (51,970) -
Balance at 31 December 2015 1,351,870 761,138 5,163 66,723 2,184,894
Depreciation and impairment losses
Balance at 1 January 2015 (237,820) (479,543) (541) (5,463) (723,367)
Effects of movements in foreign
exchange rates (2,868) (3,061) (4) (143) (6,076)
Depreciation charge for the year (89,617) (60,399) (285) - (150,301)
Depreciation charge for the year
related to discontinued operations (13,505) (101,617) - - (115,122)
Disposals 3,352 12,153 69 - 15,574
Disposed entities 84 95 - - 179
Transfer to discontinued operations 31,491 366,591 - - 398,082
Transfer of impairment losses to
discontinued operations 1,814 - - - 1,814
Impairment losses recognised/released
in profit or loss 172 - - (143) 29
Balance at 31 December 2015 (306,897) (265,781) (761) (5,749) (579,188)
Carrying amounts
At 1 January 2015 1,144,783 1,035,224 1,229 64,700 2,245,936
At 31 December 2015 1,044,973 495,357 4,402 60,974 1,605,706
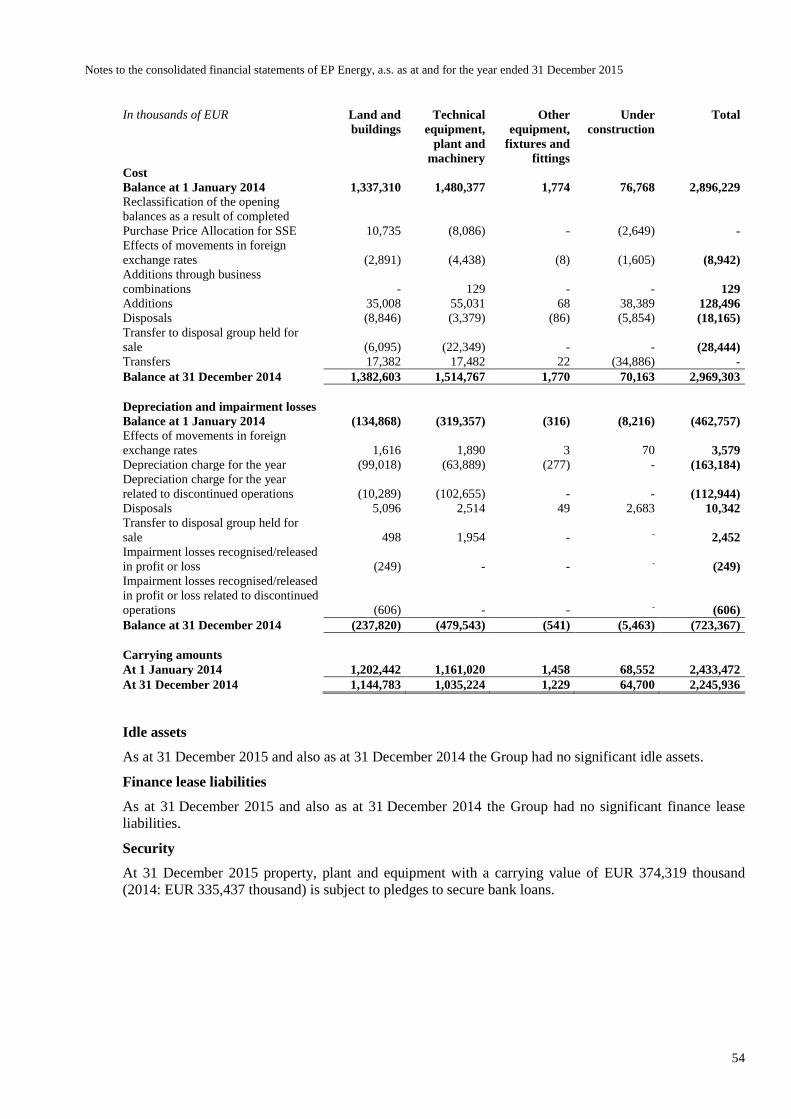
Notes to the consolidated financial statements of EP Energy, a.s. as at and for the year ended 31 December 2015
54
In thousands of EUR Land and
buildings
Technical
equipment,
plant and
machinery
Other
equipment,
fixtures and
fittings
Under
construction
Total
Cost
Balance at 1 January 2014 1,337,310 1,480,377 1,774 76,768 2,896,229
Reclassification of the opening
balances as a result of completed
Purchase Price Allocation for SSE 10,735 (8,086) - (2,649) -
Effects of movements in foreign
exchange rates (2,891) (4,438) (8) (1,605) (8,942)
Additions through business
combinations - 129 - - 129
Additions 35,008 55,031 68 38,389 128,496
Disposals (8,846) (3,379) (86) (5,854) (18,165)
Transfer to disposal group held for
sale (6,095) (22,349) - - (28,444)
Transfers 17,382 17,482 22 (34,886) -
Balance at 31 December 2014 1,382,603 1,514,767 1,770 70,163 2,969,303
Depreciation and impairment losses
Balance at 1 January 2014 (134,868) (319,357) (316) (8,216) (462,757)
Effects of movements in foreign
exchange rates 1,616 1,890 3 70 3,579
Depreciation charge for the year (99,018) (63,889) (277) - (163,184)
Depreciation charge for the year
related to discontinued operations (10,289) (102,655) - - (112,944)
Disposals 5,096 2,514 49 2,683 10,342
Transfer to disposal group held for
sale 498 1,954 - - 2,452
Impairment losses recognised/released
in profit or loss (249) - - - (249)
Impairment losses recognised/released
in profit or loss related to discontinued
operations (606) - - - (606)
Balance at 31 December 2014 (237,820) (479,543) (541) (5,463) (723,367)
Carrying amounts
At 1 January 2014 1,202,442 1,161,020 1,458 68,552 2,433,472
At 31 December 2014 1,144,783 1,035,224 1,229 64,700 2,245,936
Idle assets
As at 31 December 2015 and also as at 31 December 2014 the Group had no significant idle assets.
Finance lease liabilities
As at 31 December 2015 and also as at 31 December 2014 the Group had no significant finance lease
liabilities.
Security
At 31 December 2015 property, plant and equipment with a carrying value of EUR 374,319 thousand
(2014: EUR 335,437 thousand) is subject to pledges to secure bank loans.
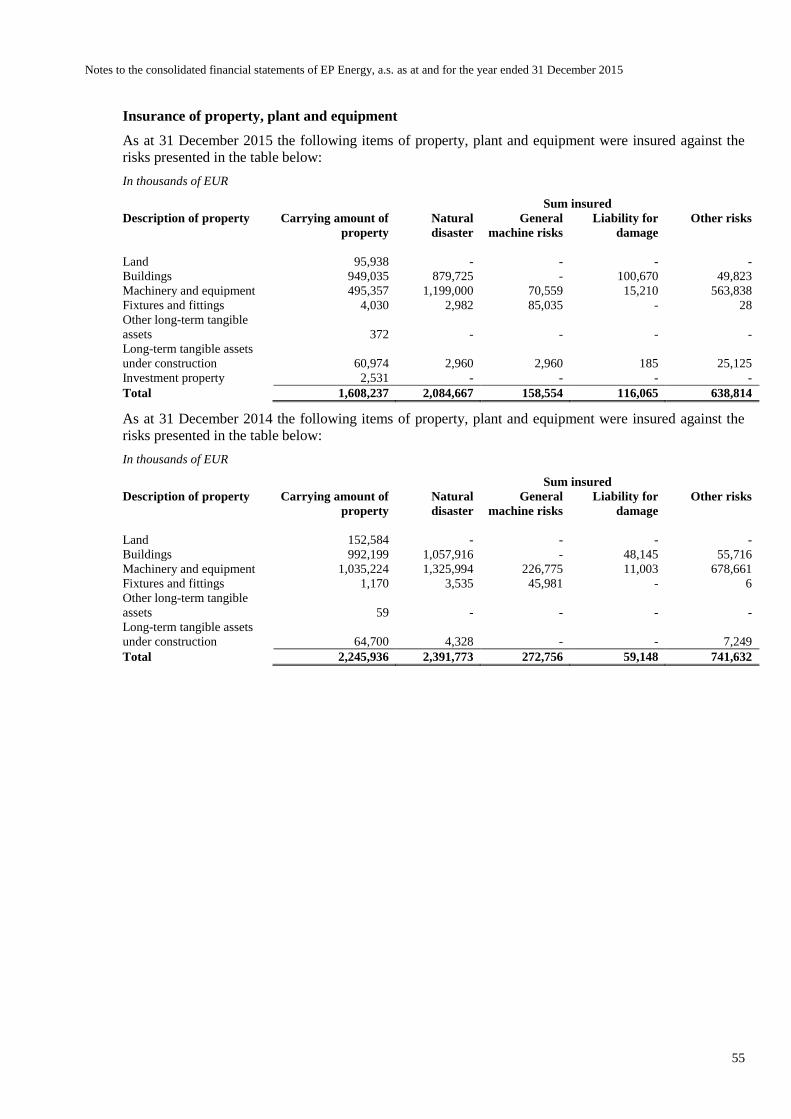
Notes to the consolidated financial statements of EP Energy, a.s. as at and for the year ended 31 December 2015
55
Insurance of property, plant and equipment
As at 31 December 2015 the following items of property, plant and equipment were insured against the
risks presented in the table below:
In thousands of EUR
Sum insured
Description of property Carrying amount of
property
Natural
disaster
General
machine risks
Liability for
damage
Other risks
Land 95,938 - - - -
Buildings 949,035 879,725 - 100,670 49,823
Machinery and equipment 495,357 1,199,000 70,559 15,210 563,838
Fixtures and fittings 4,030 2,982 85,035 - 28
Other long-term tangible
assets 372 - - - -
Long-term tangible assets
under construction 60,974 2,960 2,960 185 25,125
Investment property 2,531 - - - -
Total 1,608,237 2,084,667 158,554 116,065 638,814
As at 31 December 2014 the following items of property, plant and equipment were insured against the
risks presented in the table below:
In thousands of EUR
Sum insured
Description of property Carrying amount of
property
Natural
disaster
General
machine risks
Liability for
damage
Other risks
Land 152,584 - - - -
Buildings 992,199 1,057,916 - 48,145 55,716
Machinery and equipment 1,035,224 1,325,994 226,775 11,003 678,661
Fixtures and fittings 1,170 3,535 45,981 - 6
Other long-term tangible
assets 59 - - - -
Long-term tangible assets
under construction 64,700 4,328 - - 7,249
Total 2,245,936 2,391,773 272,756 59,148 741,632
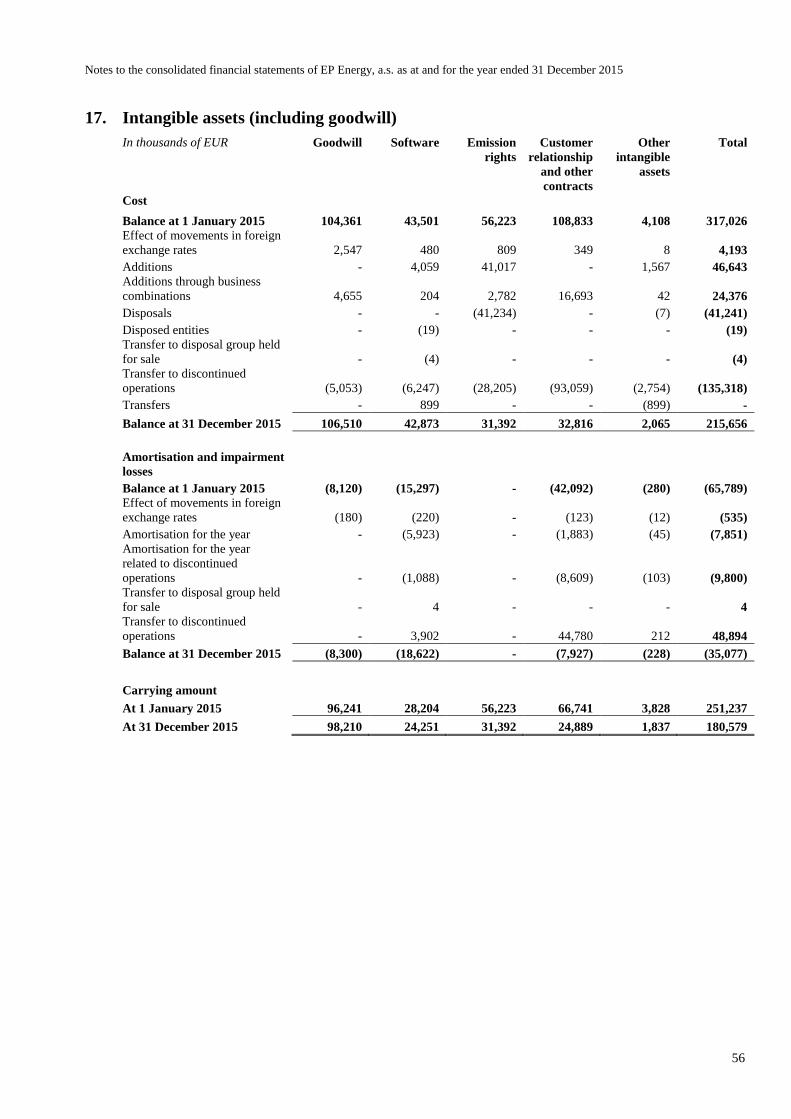
Notes to the consolidated financial statements of EP Energy, a.s. as at and for the year ended 31 December 2015
56
17. Intangible assets (including goodwill)
In thousands of EUR Goodwill Software Emission
rights
Customer
relationship
and other
contracts
Other
intangible
assets
Total
Cost
Balance at 1 January 2015 104,361 43,501 56,223 108,833 4,108 317,026
Effect of movements in foreign
exchange rates 2,547 480 809 349 8 4,193
Additions - 4,059 41,017 - 1,567 46,643
Additions through business
combinations 4,655 204 2,782 16,693 42 24,376
Disposals - - (41,234) - (7) (41,241)
Disposed entities - (19) - - - (19)
Transfer to disposal group held
for sale - (4) - - - (4)
Transfer to discontinued
operations (5,053) (6,247) (28,205) (93,059) (2,754) (135,318)
Transfers - 899 - - (899) -
Balance at 31 December 2015 106,510 42,873 31,392 32,816 2,065 215,656
Amortisation and impairment
losses
Balance at 1 January 2015 (8,120) (15,297) - (42,092) (280) (65,789)
Effect of movements in foreign
exchange rates (180) (220) - (123) (12) (535)
Amortisation for the year - (5,923) - (1,883) (45) (7,851)
Amortisation for the year
related to discontinued
operations - (1,088) - (8,609) (103) (9,800)
Transfer to disposal group held
for sale - 4 - - - 4
Transfer to discontinued
operations - 3,902 - 44,780 212 48,894
Balance at 31 December 2015 (8,300) (18,622) - (7,927) (228) (35,077)
Carrying amount
At 1 January 2015 96,241 28,204 56,223 66,741 3,828 251,237
At 31 December 2015 98,210 24,251 31,392 24,889 1,837 180,579
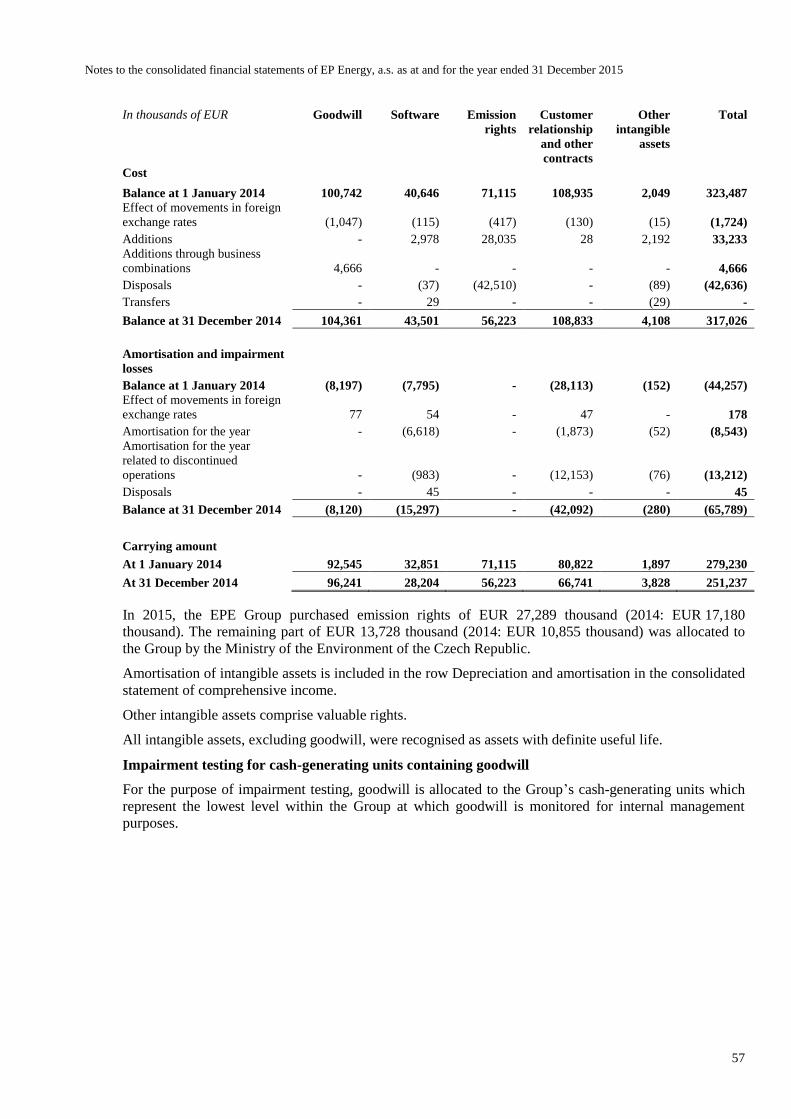
Notes to the consolidated financial statements of EP Energy, a.s. as at and for the year ended 31 December 2015
57
In thousands of EUR Goodwill Software Emission
rights
Customer
relationship
and other
contracts
Other
intangible
assets
Total
Cost
Balance at 1 January 2014 100,742 40,646 71,115 108,935 2,049 323,487
Effect of movements in foreign
exchange rates (1,047) (115) (417) (130) (15) (1,724)
Additions - 2,978 28,035 28 2,192 33,233
Additions through business
combinations 4,666 - - - - 4,666
Disposals - (37) (42,510) - (89) (42,636)
Transfers - 29 - - (29) -
Balance at 31 December 2014 104,361 43,501 56,223 108,833 4,108 317,026
Amortisation and impairment
losses
Balance at 1 January 2014 (8,197) (7,795) - (28,113) (152) (44,257)
Effect of movements in foreign
exchange rates 77 54 - 47 - 178
Amortisation for the year - (6,618) - (1,873) (52) (8,543)
Amortisation for the year
related to discontinued
operations - (983) - (12,153) (76) (13,212)
Disposals - 45 - - - 45
Balance at 31 December 2014 (8,120) (15,297) - (42,092) (280) (65,789)
Carrying amount
At 1 January 2014 92,545 32,851 71,115 80,822 1,897 279,230
At 31 December 2014 96,241 28,204 56,223 66,741 3,828 251,237
In 2015, the EPE Group purchased emission rights of EUR 27,289 thousand (2014: EUR 17,180
thousand). The remaining part of EUR 13,728 thousand (2014: EUR 10,855 thousand) was allocated to
the Group by the Ministry of the Environment of the Czech Republic.
Amortisation of intangible assets is included in the row Depreciation and amortisation in the consolidated
statement of comprehensive income.
Other intangible assets comprise valuable rights.
All intangible assets, excluding goodwill, were recognised as assets with definite useful life.
Impairment testing for cash-generating units containing goodwill
For the purpose of impairment testing, goodwill is allocated to the Group’s cash-generating units which
represent the lowest level within the Group at which goodwill is monitored for internal management
purposes.

Notes to the consolidated financial statements of EP Energy, a.s. as at and for the year ended 31 December 2015
58
The aggregate carrying amounts of goodwill allocated to single cash generating units are as follows (no
intangible assets with indefinite useful lives were identified):
In thousands of EUR 31 December 2015
Elektrárny Opatovice, a.s. 85,989
EP Cargo a.s. 4,761
Optimum Energy, s.r.o. (1)4,421
Plzeňská energetika a.s. 2,678
LokoTrain s.r.o. (1)236
ARISUN, s.r.o. 125
Total goodwill 98,210
In thousands of EUR 31 December 2014
Elektrárny Opatovice, a.s. 83,813
Helmstedter Revier GmbH 5,053
EP Cargo a.s. (2)4,640
Plzeňská energetika a.s. 2,610
ARISUN, s.r.o. 125
Total goodwill 96,241
(1) At the date of Optimum Energy, s.r.o. and LokoTrain s.r.o. acquisition, the Group recognised initial goodwill of EUR
4,655 thousand. As at 31 December 2015 the goodwill balance was increased by FX difference of EUR 2 thousand to
a balance of EUR 4,657 thousand.
(2) At the date of EP Cargo a.s. acquisition, the Group recognised initial goodwill of EUR 4,666 thousand. As at
31 December 2014 the goodwill balance was reduced by FX difference of EUR 26 thousand to final balance of EUR
4,640 thousand.
In 2015 the balance of goodwill increased by EUR 4,655 thousand as a result of Optimum Energy, s.r.o.
and LokoTrain s.r.o. acquisition (2014: EUR 4,666 thousand as a result of EP Cargo a.s. acquisition). In
2015 the EPE group did not recognise any goodwill impairment (2014: EUR 0 thousand).
Goodwill and impairment testing
In compliance with IAS 36, the Group annually conducts impairment testing of goodwill. The Group also
conducts impairment testing of other intangible assets with indefinite useful lives, and of cash generating
units (CGUs) where a trigger for impairment testing is identified. As at the acquisition date goodwill
acquired is allocated to each of the cash-generating units expected to benefit from the combination’s
synergies. Impairment is determined by assessing the recoverable amount of the CGU, to which the
goodwill relates, on the basis of a value in use that reflects estimated future discounted cash flows. Value
in use is derived from management forecasts of future cash flows updated since the date of acquisition.
The discount rates applied to the cash flow projections are calculated as the weighted average cost of
capital (WACC) of each CGU.
The calculation of the recoverable amounts was based on the following key assumptions:
Cash-flows were projected based on past experience, actual operating results and the one-year business
plan followed by additional four years of modelled projections followed by projected results based on
estimated growth factor plus a terminal value if relevant. Cash flows for a terminal period were
extrapolated using a constant growth rate of 0.5% – 2% (2014: 0.5% – 2%), which does not exceed the
long-term average growth rate for the industry. Other key assumptions considered by management
include forecasts of commodity market prices, future electricity and gas prices, investment activity,
changes in working capital and changes in the regulatory framework.
The discount rates used in estimating value in use were estimated based on the principle of an average
market participant using peer companies (i.e. companies operating in a comparable industry and listed on
world markets) as a standard for observing respective betas, debt to equity ratios and size adjustment
parameters used for calculation. The resulting discount rates ranged from 6.23% to 6.92% (2014: 6.69%
to 9.53%).
Notes to the consolidated financial statements of EP Energy, a.s. as at and for the year ended 31 December 2015
59
The 2015 and 2014 year testing showed no need for impairment as no CGU with the recoverable value
lower than the carrying value including goodwill was identified.
Additional information on CGU with significant goodwill assigned:
The recoverable amount of Elektrárny Opatovice, a.s. was based on its value in use, determined by
discounting the future cash flows to be generated from the continuing use of Elektrárny Opatovice, a.s.
Value in use in 2015 was determined in a similar manner as in 2014. Management estimated that the
recoverable amount for Elektrárny Opatovice, a.s. exceeded its carrying amount (including goodwill) by
EUR 426,405 thousand (2014: EUR 350,738 thousand). Key assumptions used in the calculation of value
in use were the discount rate, the terminal value growth rate and the planned Adjusted EBITDA. These
selected assumptions were as follows:
2015 2014
Discount rate 6.23% 6.81%
Terminal value growth rate 2.00% 2.00%
The EPE Group uses weighted average cost of capital (WACC). The discount rate is a pre-tax measure.
Cost of equity is based on the risk-free rate adjusted for a risk premium to reflect both the increase risk of
investing in equities generally and the systemic risk of Elektrárny Opatovice, a.s.
Budgeted Adjusted EBITDA was based on an expectation of future outcomes taking into account past
experience. In particular, we have reflected the following:
a. expected refurbishments necessary to comply with applicable regulations (impact especially on
electricity output/sales, OPEX and CAPEX);
b. market expectations regarding power and CO2 prices, development based on historical trends;
c. a slight decrease in heat supplies and modest increase of heat prices;
d. the inflation driven development of various other positions, especially overhead costs.
If Adjusted EBITDA were (Adjusted EBITDA represents profit from operations plus depreciation of
property, plant and equipment and amortisation of intangible assets) 10% less than the management
estimates (with all other indicators being constant), the value in use would decrease by EUR 91,234
thousand, which would not indicate any impairment loss.
If the discount rate were higher by one percentage point than currently used (with all other indicators
being constant), the value in use would decrease by EUR 146,992 thousand, which would not indicate any
impairment loss.
If the terminal value growth rate were one percentage point less than the management estimates (with all
other indicators being constant), the value in use would decrease by EUR 118,983 thousand, which would
not indicate any impairment loss.

Notes to the consolidated financial statements of EP Energy, a.s. as at and for the year ended 31 December 2015
60
18. Investment property
In thousands of EUR 31 December 2015 31 December 2014
Opening balance - 324
Additions 2,052 -
Transfer from property, plant and equipment 479 -
Disposals - (323)
Changes in fair value - -
Effects of movements in foreign exchange - (1)
Closing balance 2,531 -
Security
As at 31 December 2015 investment property in amount of EUR 1,200 thousand (2014: EUR 0 thousand)
is subject to pledges to secure bank loans.
19. Equity accounted investees
The Group has the investments in associates that are stated in the table below. All these associates are in
line with the Group strategic activities.
In thousands of EUR
Ownership
31 December 2015
Carrying amount
31 December 2015
Associates Country %
Pražská teplárenská Holding a.s. Czech Republic 49.00 6,817
Energotel, a.s Slovakia 20.00 1,546
Other Slovakia (1) 44
Total(2) 8,407
(1) Ownership percentage varies, for details refer to Note 38 – Group entities.
(2) Balance of investments in Equity accounted investees decreased significantly compared to prior year as
associates of JTSD Braunkohlebergbau GmbH and Saale Energie GmbH were classified as part of
discontinued operations as at 31 December 2015.
In thousands of EUR
Ownership
31 December 2014
Carrying amount
31 December 2014
Associates Country %
Pražská teplárenská Holding a.s. Czech Republic 49.00 13,044
Associates of JTSD
Braunkohlebergbau GmbH Germany (1) 24,220
Associates of Saale Energie GmbH Germany (1) 90,112
Total 127,376
(1) Ownership percentage varies, for details refer to Note 38 – Group entities.
The Group has the following shares in the profit (loss) from continuing operations of associates:
In thousands of EUR
Ownership
31 December 2015
Share of profit (loss)
2015
Associates Country %
Pražská teplárenská Holding a.s. Czech Republic 49.00 (80)
Energotel, a.s. Slovakia 20.00 444
Other Slovakia (1) 4
Total 368
In thousands of EUR
Ownership
31 December 2014
Share of profit (loss)
2014
Restated
Associates Country %
Pražská teplárenská Holding a.s. Czech Republic 49.00 600
Total 600
(1) Ownership percentage varies, for details refer to Note 38 – Group entities.
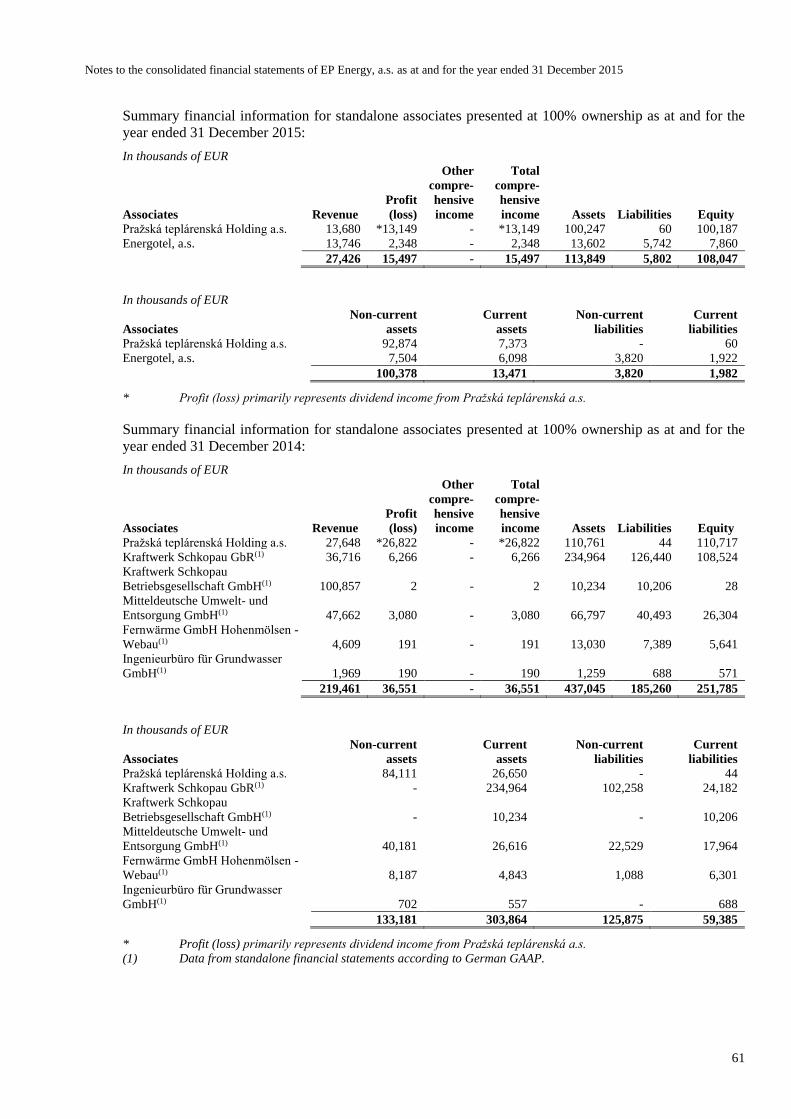
Notes to the consolidated financial statements of EP Energy, a.s. as at and for the year ended 31 December 2015
61
Summary financial information for standalone associates presented at 100% ownership as at and for the
year ended 31 December 2015:
In thousands of EUR
Associates Revenue
Profit
(loss)
Other
compre-
hensive
income
Total
compre-
hensive
income Assets Liabilities Equity
Pražská teplárenská Holding a.s. 13,680 *13,149 - *13,149 100,247 60 100,187
Energotel, a.s. 13,746 2,348 - 2,348 13,602 5,742 7,860
27,426 15,497 - 15,497 113,849 5,802 108,047
In thousands of EUR
Associates
Non-current
assets
Current
assets
Non-current
liabilities
Current
liabilities
Pražská teplárenská Holding a.s. 92,874 7,373 - 60
Energotel, a.s. 7,504 6,098 3,820 1,922
100,378 13,471 3,820 1,982
* Profit (loss) primarily represents dividend income from Pražská teplárenská a.s.
Summary financial information for standalone associates presented at 100% ownership as at and for the
year ended 31 December 2014:
In thousands of EUR
Associates Revenue
Profit
(loss)
Other
compre-
hensive
income
Total
compre-
hensive
income Assets Liabilities Equity
Pražská teplárenská Holding a.s. 27,648 *26,822 - *26,822 110,761 44 110,717
Kraftwerk Schkopau GbR(1) 36,716 6,266 - 6,266 234,964 126,440 108,524
Kraftwerk Schkopau
Betriebsgesellschaft GmbH(1) 100,857 2 - 2 10,234 10,206 28
Mitteldeutsche Umwelt- und
Entsorgung GmbH(1) 47,662 3,080 - 3,080 66,797 40,493 26,304
Fernwärme GmbH Hohenmölsen -
Webau(1) 4,609 191 - 191 13,030 7,389 5,641
Ingenieurbüro für Grundwasser
GmbH(1) 1,969 190 - 190 1,259 688 571
219,461 36,551 - 36,551 437,045 185,260 251,785
In thousands of EUR
Associates
Non-current
assets
Current
assets
Non-current
liabilities
Current
liabilities
Pražská teplárenská Holding a.s. 84,111 26,650 - 44
Kraftwerk Schkopau GbR(1) - 234,964 102,258 24,182
Kraftwerk Schkopau
Betriebsgesellschaft GmbH(1) - 10,234 - 10,206
Mitteldeutsche Umwelt- und
Entsorgung GmbH(1) 40,181 26,616 22,529 17,964
Fernwärme GmbH Hohenmölsen -
Webau(1) 8,187 4,843 1,088 6,301
Ingenieurbüro für Grundwasser
GmbH(1) 702 557 - 688
133,181 303,864 125,875 59,385
* Profit (loss) primarily represents dividend income from Pražská teplárenská a.s.
(1) Data from standalone financial statements according to German GAAP.

Notes to the consolidated financial statements of EP Energy, a.s. as at and for the year ended 31 December 2015
62
20. Deferred tax assets and liabilities
Recognised deferred tax assets and liabilities
The following deferred tax assets and (liabilities) have been recognised:
In thousands of EUR 31 December 2015 31 December 2014
Temporary difference
related to:
Assets Liabilities Net Assets Liabilities Net
Property, plant and
equipment 1,555 (189,689) (188,134) 2,200 (255,697) (253,497)
Intangible assets 3,179 (1,555) 1,624 30,478 (33,572) (3,094)
Financial instruments at
fair value through profit
or loss 779 (17) 762 - (121) (121)
Inventories 116 - 116 108 (201) (93)
Trade receivables and
other assets 1,514 - 1,514 1,443 (9) 1,434
Provisions 5,858 - 5,858 15,296 - 15,296
Employee benefits
(IAS 19) 2,059 - 2,059 1,948 - 1,948
Loans and borrowings 2,367 (14,055) (11,688) 5,987 - 5,987
Derivatives 1,224 (2,539) (1,315) 1,587 (911) 676
Tax losses 9,079 - 9,079 180 - 180
Unpaid interest, net - (19) (19) - (11) (11)
Other items 612 (1,294) (682) - - -
Subtotal 28,342 (209,168) (180,826) 59,227 (290,522) (231,295)
Set-off tax (26,444) 26,444 - (49,600) 49,600 -
Total 1,898 (182,724) (180,826) 9,627 (240,922) (231,295)
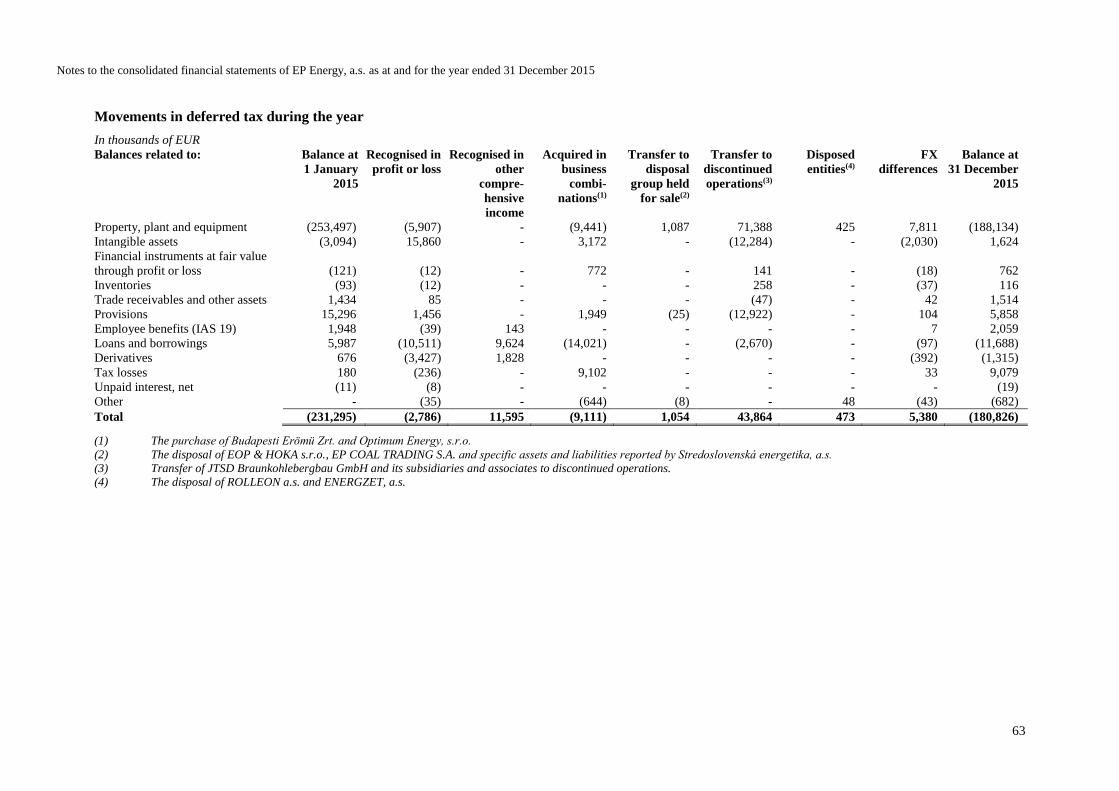
Notes to the consolidated financial statements of EP Energy, a.s. as at and for the year ended 31 December 2015
63
Movements in deferred tax during the year
In thousands of EUR
Balances related to: Balance at
1 January
2015
Recognised in
profit or loss
Recognised in
other
compre-
hensive
income
Acquired in
business
combi-
nations(1)
Transfer to
disposal
group held
for sale(2)
Transfer to
discontinued
operations(3)
Disposed
entities(4)
FX
differences
Balance at
31 December
2015
Property, plant and equipment (253,497) (5,907) - (9,441) 1,087 71,388 425 7,811 (188,134)
Intangible assets (3,094) 15,860 - 3,172 - (12,284) - (2,030) 1,624
Financial instruments at fair value
through profit or loss (121) (12) - 772 - 141 - (18) 762
Inventories (93) (12) - - - 258 - (37) 116
Trade receivables and other assets 1,434 85 - - - (47) - 42 1,514
Provisions 15,296 1,456 - 1,949 (25) (12,922) - 104 5,858
Employee benefits (IAS 19) 1,948 (39) 143 - - - - 7 2,059
Loans and borrowings 5,987 (10,511) 9,624 (14,021) - (2,670) - (97) (11,688)
Derivatives 676 (3,427) 1,828 - - - - (392) (1,315)
Tax losses 180 (236) - 9,102 - - - 33 9,079
Unpaid interest, net (11) (8) - - - - - - (19)
Other - (35) - (644) (8) - 48 (43) (682)
Total (231,295) (2,786) 11,595 (9,111) 1,054 43,864 473 5,380 (180,826)
(1) The purchase of Budapesti Erömü Zrt. and Optimum Energy, s.r.o.
(2) The disposal of EOP & HOKA s.r.o., EP COAL TRADING S.A. and specific assets and liabilities reported by Stredoslovenská energetika, a.s.
(3) Transfer of JTSD Braunkohlebergbau GmbH and its subsidiaries and associates to discontinued operations.
(4) The disposal of ROLLEON a.s. and ENERGZET, a.s.

Notes to the consolidated financial statements of EP Energy, a.s. as at and for the year ended 31 December 2015
64
In thousands of EUR
Balances related to: Balance at
1 January 2014
Recognised in
profit or loss
Recognised in
profit or loss
from
discontinued
operations(1)
Recognised in
other
comprehensive
income
Transfer to
disposal group
held for sale(2)
FX differences Balance at
31 December
2014
Property, plant and equipment (289,970) 29,344 4,007 - 1,999 1,123 (253,497)
Intangible assets 9,486 (14,067) 610 - (47) 924 (3,094)
Financial instruments at fair value
through profit or loss (153) - 32 - - - (121)
Inventories (2,241) 34 2,131 - - (17) (93)
Trade receivables and other assets 1,406 50 - - - (22) 1,434
Provisions 11,678 4,540 (833) - - (89) 15,296
Employee benefits (IAS 19) 2,852 (4,407) - 3,546 - (43) 1,948
Loans and borrowings 5,192 282 557 - - (44) 5,987
Unpaid interest, net (85) 74 - - - - (11)
Derivatives 30 736 - (92) - 2 676
Tax losses - 179 - - - 1 180
Other 356 (355) - - - (1) -
Total (261,449) 16,410 6,504 3,454 1,952 1,834 (231,295)
(1) The transfer of JTSD Brunkohlebergbau GmbH to discontinued operations.
(2) The disposal of specific assets and liabilities reported by Stredoslovenská energetika, a.s.
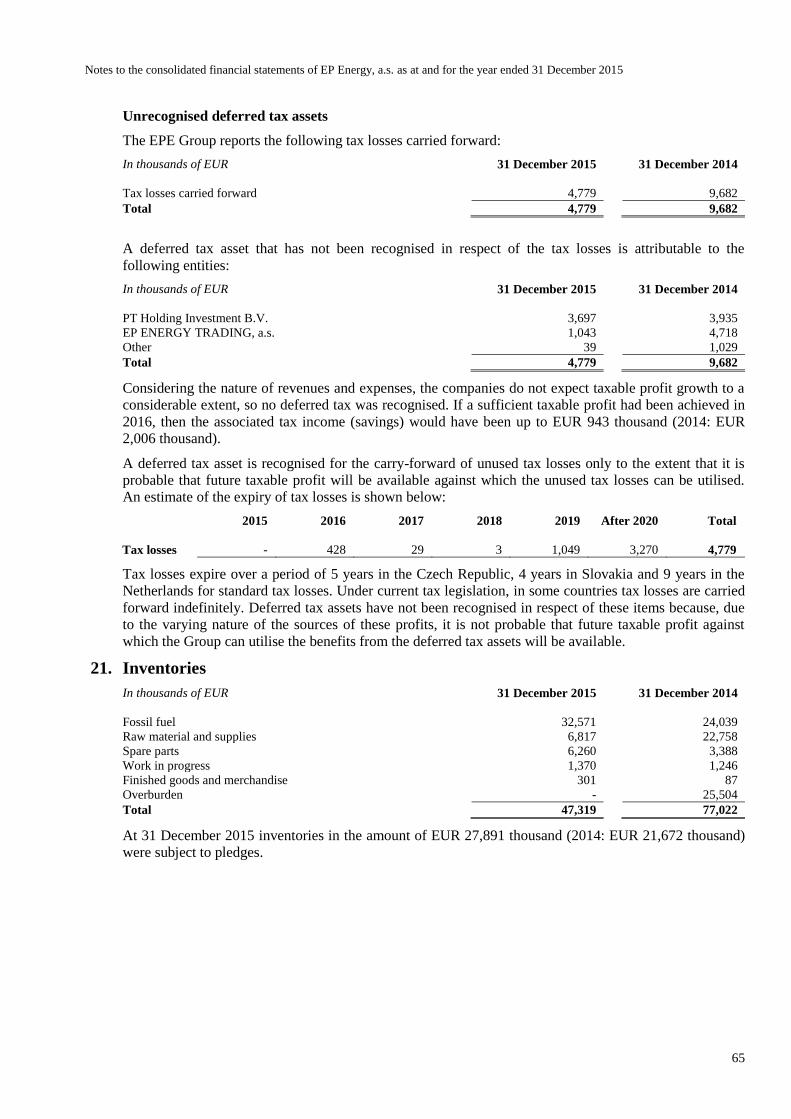
Notes to the consolidated financial statements of EP Energy, a.s. as at and for the year ended 31 December 2015
65
Unrecognised deferred tax assets
The EPE Group reports the following tax losses carried forward:
In thousands of EUR 31 December 2015 31 December 2014
Tax losses carried forward 4,779 9,682
Total 4,779 9,682
A deferred tax asset that has not been recognised in respect of the tax losses is attributable to the
following entities:
In thousands of EUR 31 December 2015 31 December 2014
PT Holding Investment B.V. 3,697 3,935
EP ENERGY TRADING, a.s. 1,043 4,718
Other 39 1,029
Total 4,779 9,682
Considering the nature of revenues and expenses, the companies do not expect taxable profit growth to a
considerable extent, so no deferred tax was recognised. If a sufficient taxable profit had been achieved in
2016, then the associated tax income (savings) would have been up to EUR 943 thousand (2014: EUR
2,006 thousand).
A deferred tax asset is recognised for the carry-forward of unused tax losses only to the extent that it is
probable that future taxable profit will be available against which the unused tax losses can be utilised.
An estimate of the expiry of tax losses is shown below:
2015 2016 2017 2018 2019 After 2020 Total
Tax losses - 428 29 3 1,049 3,270 4,779
Tax losses expire over a period of 5 years in the Czech Republic, 4 years in Slovakia and 9 years in the
Netherlands for standard tax losses. Under current tax legislation, in some countries tax losses are carried
forward indefinitely. Deferred tax assets have not been recognised in respect of these items because, due
to the varying nature of the sources of these profits, it is not probable that future taxable profit against
which the Group can utilise the benefits from the deferred tax assets will be available.
21. Inventories
In thousands of EUR 31 December 2015 31 December 2014
Fossil fuel 32,571 24,039
Raw material and supplies 6,817 22,758
Spare parts 6,260 3,388
Work in progress 1,370 1,246
Finished goods and merchandise 301 87
Overburden - 25,504
Total 47,319 77,022
At 31 December 2015 inventories in the amount of EUR 27,891 thousand (2014: EUR 21,672 thousand)
were subject to pledges.

Notes to the consolidated financial statements of EP Energy, a.s. as at and for the year ended 31 December 2015
66
22. Trade receivables and other assets
In thousands of EUR 31 December 2015 31 December 2014
Trade receivables 167,667 237,174
Accrued income 76,705 41,531
Advance payments 39,789 (1)54,542
Estimated receivables 20,075 15,322
Uninvoiced supplies 18,661 15,541
Other receivables and assets 6,608 31,947
Allowance for bad debts (13,073) (10,139)
Total 316,432 385,918
Non-current 21,488 28,999
Current 294,944 356,919
Total 316,432 385,918
(1) This balance contained an amount of EUR 18,000 thousand which was advance payment for dividend paid to
parent company. As final decision about profit distribution had not been approved by general meeting, this
dividend had been recognised as advance payment as of 31 December 2014.
In 2015, receivables of EUR 852 thousand were written off through profit or loss (2014: EUR 1,812
thousand).
As at 31 December 2015 trade receivables with a carrying value of EUR 71,170 thousand are subject to
pledges (2014: EUR 87,391 thousand).
As at 31 December 2015 trade receivables and other assets amounting to EUR 291,953 thousand are not
past due (2014: EUR 328,523 thousand); the remaining balance of EUR 24,479 thousand is overdue
(2014: EUR 57,395 thousand).
The Group’s exposure to credit and currency risks and impairment losses related to trade and other
receivables is disclosed in Note 36 – Risk management policies and disclosures.
23. Cash and cash equivalents
In thousands of EUR 31 December 2015 31 December 2014
Current accounts with banks 129,927 200,483
Term deposits 1,482 338
Cash on hand 220 157
Total 131,629 200,978
Term deposits with original maturity of up to three months are classified as cash equivalents.
As at 31 December 2015 cash equivalents of EUR 45,015 thousand are subject to pledges (2014: EUR
102,203 thousand). According to the bond documentation cash balances at specific entities are pledged in
favour of the bondholders in case the Company defaults on bonds payments. As such, the pledged cash is
readily available to the EPE Group and does not represent restricted cash.
Significant investing and financing activities not requiring cash:
In thousands of EUR 31 December 2015 31 December 2014
Investing activities 264,337 -
Financing activities 12,051 -
Total 276,388 -
For the year 2015 non-cash investing activities include EPE loan provided to EPH which was set-off
against decrease of share capital of EUR 264,337 thousand.
Non-cash financing activities are represented by EPE loan provided to EPH in amount of EUR 12,051
thousand, which was set-off.
For the year 2014 the Group did not recognised any non-cash investing or financing activities.
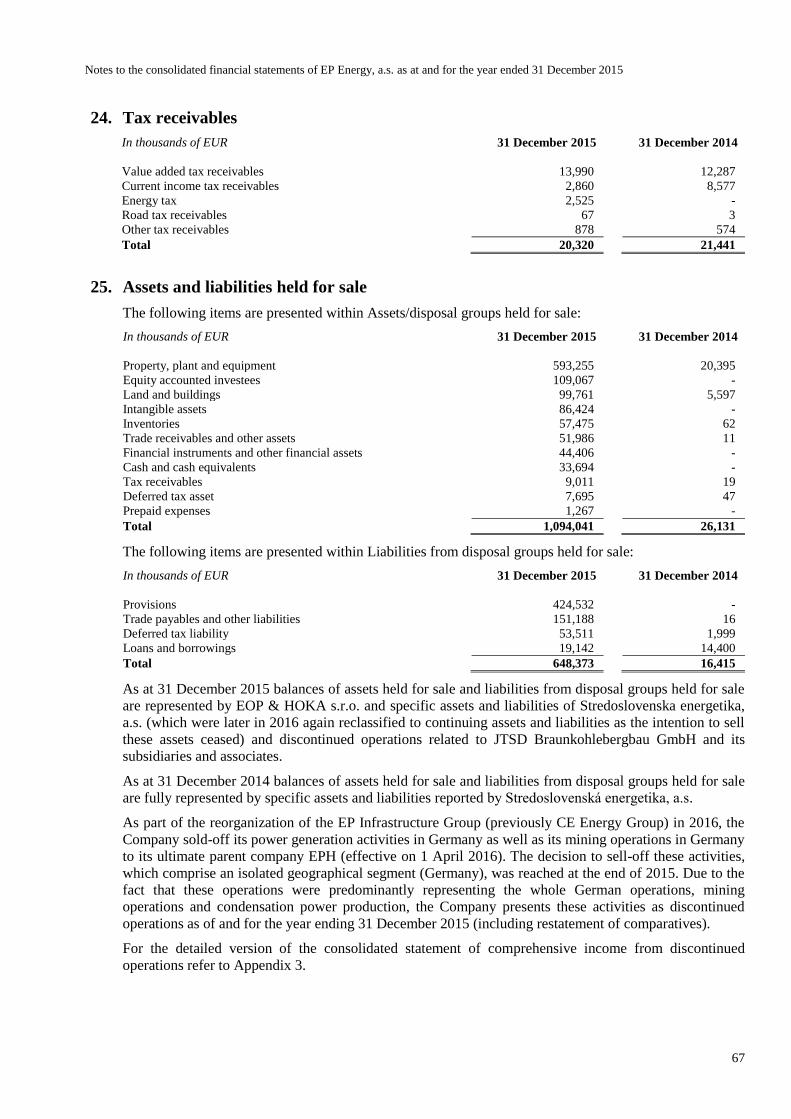
Notes to the consolidated financial statements of EP Energy, a.s. as at and for the year ended 31 December 2015
67
24. Tax receivables
In thousands of EUR 31 December 2015 31 December 2014
Value added tax receivables 13,990 12,287
Current income tax receivables 2,860 8,577
Energy tax 2,525 -
Road tax receivables 67 3
Other tax receivables 878 574
Total 20,320 21,441
25. Assets and liabilities held for sale
The following items are presented within Assets/disposal groups held for sale:
In thousands of EUR 31 December 2015 31 December 2014
Property, plant and equipment 593,255 20,395
Equity accounted investees 109,067 -
Land and buildings 99,761 5,597
Intangible assets 86,424 -
Inventories 57,475 62
Trade receivables and other assets 51,986 11
Financial instruments and other financial assets 44,406 -
Cash and cash equivalents 33,694 -
Tax receivables 9,011 19
Deferred tax asset 7,695 47
Prepaid expenses 1,267 -
Total 1,094,041 26,131
The following items are presented within Liabilities from disposal groups held for sale:
In thousands of EUR 31 December 2015 31 December 2014
Provisions 424,532 -
Trade payables and other liabilities 151,188 16
Deferred tax liability 53,511 1,999
Loans and borrowings 19,142 14,400
Total 648,373 16,415
As at 31 December 2015 balances of assets held for sale and liabilities from disposal groups held for sale
are represented by EOP & HOKA s.r.o. and specific assets and liabilities of Stredoslovenska energetika,
a.s. (which were later in 2016 again reclassified to continuing assets and liabilities as the intention to sell
these assets ceased) and discontinued operations related to JTSD Braunkohlebergbau GmbH and its
subsidiaries and associates.
As at 31 December 2014 balances of assets held for sale and liabilities from disposal groups held for sale
are fully represented by specific assets and liabilities reported by Stredoslovenská energetika, a.s.
As part of the reorganization of the EP Infrastructure Group (previously CE Energy Group) in 2016, the
Company sold-off its power generation activities in Germany as well as its mining operations in Germany
to its ultimate parent company EPH (effective on 1 April 2016). The decision to sell-off these activities,
which comprise an isolated geographical segment (Germany), was reached at the end of 2015. Due to the
fact that these operations were predominantly representing the whole German operations, mining
operations and condensation power production, the Company presents these activities as discontinued
operations as of and for the year ending 31 December 2015 (including restatement of comparatives).
For the detailed version of the consolidated statement of comprehensive income from discontinued
operations refer to Appendix 3.
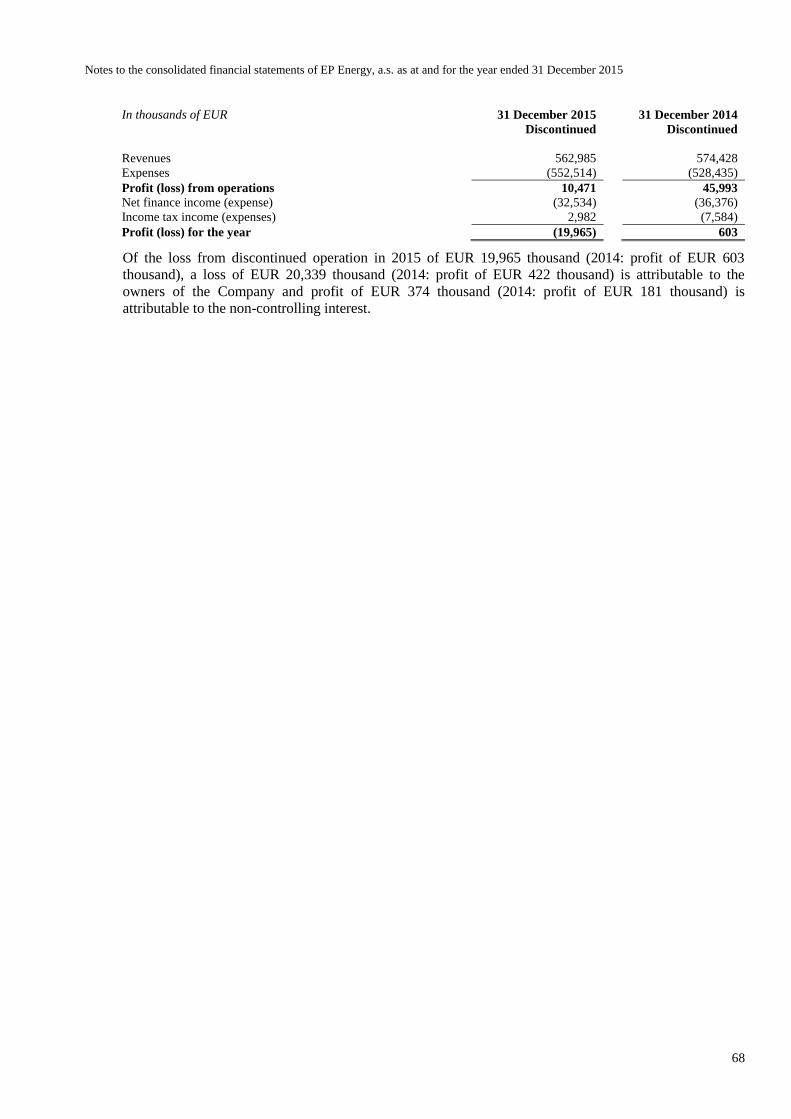
Notes to the consolidated financial statements of EP Energy, a.s. as at and for the year ended 31 December 2015
68
In thousands of EUR 31 December 2015 31 December 2014
Discontinued Discontinued
Revenues 562,985 574,428
Expenses (552,514) (528,435)
Profit (loss) from operations 10,471 45,993
Net finance income (expense) (32,534) (36,376)
Income tax income (expenses) 2,982 (7,584)
Profit (loss) for the year (19,965) 603
Of the loss from discontinued operation in 2015 of EUR 19,965 thousand (2014: profit of EUR 603
thousand), a loss of EUR 20,339 thousand (2014: profit of EUR 422 thousand) is attributable to the
owners of the Company and profit of EUR 374 thousand (2014: profit of EUR 181 thousand) is
attributable to the non-controlling interest.

Notes to the consolidated financial statements of EP Energy, a.s. as at and for the year ended 31 December 2015
69
Cash flows from (used in) discontinued operations
Cash flows from discontinued operations presented in the table below are included in the total amounts of
cash flows presented in the consolidated statement of cash flows.
In thousands of EUR 2015 2014
Net cash from (used in) operating activities 134,926 136,475
Net cash from (used in) investing activities (164,468) (87,243)
Net cash from (used in) financing activities (10,800) (66,503)
Net cash flows for the year (40,342) (17,271)
26. Equity
Share capital and share premium
The authorised, issued and fully paid share capital as at 31 December 2015 consisted of 19,549,548
ordinary shares with a par value of CZK 657 each (2014: 19,549,548 ordinary shares with a par value of
CZK 1,001 each).
The shareholder is entitled to receive dividends and to cast 1 vote per 1 share of nominal value CZK 657,
at meetings of the Company’s shareholders.
In 2015 the Company declared dividends in amount of EUR 96,156 thousand (2014: EUR 96,615
thousand) to its sole shareholder.
31 December 2015 Number of shares Ownership Voting rights
657 CZK % %
CE Energy, a.s. (currently EP
Infrastructure, a.s.) 19,549,548 100.00 100.00
Total 19,549,548 100.00 100.00
31 December 2014 Number of shares Ownership Voting rights
1,001 CZK % %
CE Energy, a.s. (currently EP
Infrastructure, a.s.) 19,549,548 100.00 100.00
Total 19,549,548 100.00 100.00
The reconciliation of the number of shares outstanding at the beginning and at the end of the period is
hereby provided.
Number of shares
31 December 2015 31 December 2014
Shares outstanding at the beginning of the period 19,549,548 19,549,548
Shares outstanding at the end of the period 19,549,548 19,549,548
Reserves recognised in equity comprise the following items:
In thousands of EUR 31 December 2015 31 December 2014
Non-distributable reserves 798 798
Fair value reserve (13,773) (9,705)
Translation reserve (13,989) (46,508)
Hedging reserve (54,010) (85,715)
Other capital reserves (320,210) (320,210)
Total (401,184) (461,340)
Other capital funds from capital contributions 22,538 22,538
Reserves (378,646) (438,802)
Non-distributable reserves
Notes to the consolidated financial statements of EP Energy, a.s. as at and for the year ended 31 December 2015
70
The creation of a legal reserve fund in the Czech Republic was prior to 1 January 2014 required at a
minimum of 20% (10% for limited liability companies) of net profit (annually) and up to a minimum of
10% (5% for limited liability companies) of the registered share capital (cumulative balance). The legal
reserve fund could have only been used to cover losses of the Company and may not have been
distributed as a dividend. The calculation of the legal reserve was based on local statutory regulations.
The legal reserve of EUR 798 thousand was reported as at 31 December 2015 (2014: EUR 798 thousand).
From 1 January 2014, in relation to the newly enacted legislation, legal reserve fund and its creation are
no longer, under certain circumstances, obligatory. Similarly, legal reserve fund can be from 1 January
2014, under certain conditions, distributed in a form of dividend. As a result of the enacted legislation, in
2014 EUR 75,878 thousand was transferred from legal reserve fund to retained earnings.
Translation reserve
The translation reserve comprises all foreign exchange differences arising from the translation of the
financial statements of foreign operations of the Group and translation of the consolidated financial
statements to presentation currency.
Other capital reserves
As stated in section 3 (a) viii – Pricing differences, in 2009 the Group accounted for pricing differences
that arose both from establishment of the Group as at 10 August 2009 and acquisition of certain new
subsidiaries in the subsequent periods prior to 31 December 2010. Such subsidiaries were acquired under
common control of Energetický a průmyslový holding, a.s. and therefore excluded from scope of IFRS 3,
which defines recognition of goodwill raised from business combinations as the excess of the cost of an
acquisition over the fair value of the Group’s share of the net identifiable assets, liabilities and contingent
liabilities of the acquired subsidiary. Acquirees under common control are recorded at the book value,
which is presented in the consolidated financial statements of Energetický a průmyslový holding, a.s. (i.e.
including historical goodwill less potential impairment). The difference between the cost of acquisition,
carrying values of net assets and original goodwill carried forward as at the acquisition date was recorded
in consolidated equity as pricing differences.
In 2010 other capital reserves decreased by EUR 47,385 thousand in relation to the disposal of Pražská
energetika, a.s. (associate), previously acquired under common control. The amount corresponds to
pricing differences assigned directly to the disposed associate and its direct parent company (Honor
Invest, a.s.). The increase in other capital reserves was recognised against retained earnings.
In 2011 other capital reserves decreased by EUR 31,557 thousand in relation to the acquisition of
LIGNITE INVESTMENTS 1 LIMITED which was contributed by EPH to the Company’s share capital.
In 2013 other capital reserves decreased by EUR 1,047 thousand in relation to the disposal of 47.06%
share in PRVNÍ MOSTECKÁ a.s. as a part of the step acquisition process and the increase in share
capital originating from the revaluation of Czech Energy Holding, a.s. during the merger with EP Energy,
a.s.
Hedging reserves
The effective portion of fair value changes in financial derivatives designated as cash flow hedges are
recognised in equity (for more details please refer to Note 32 – Financial instruments and Note 36 – Risk
management policies and disclosure).
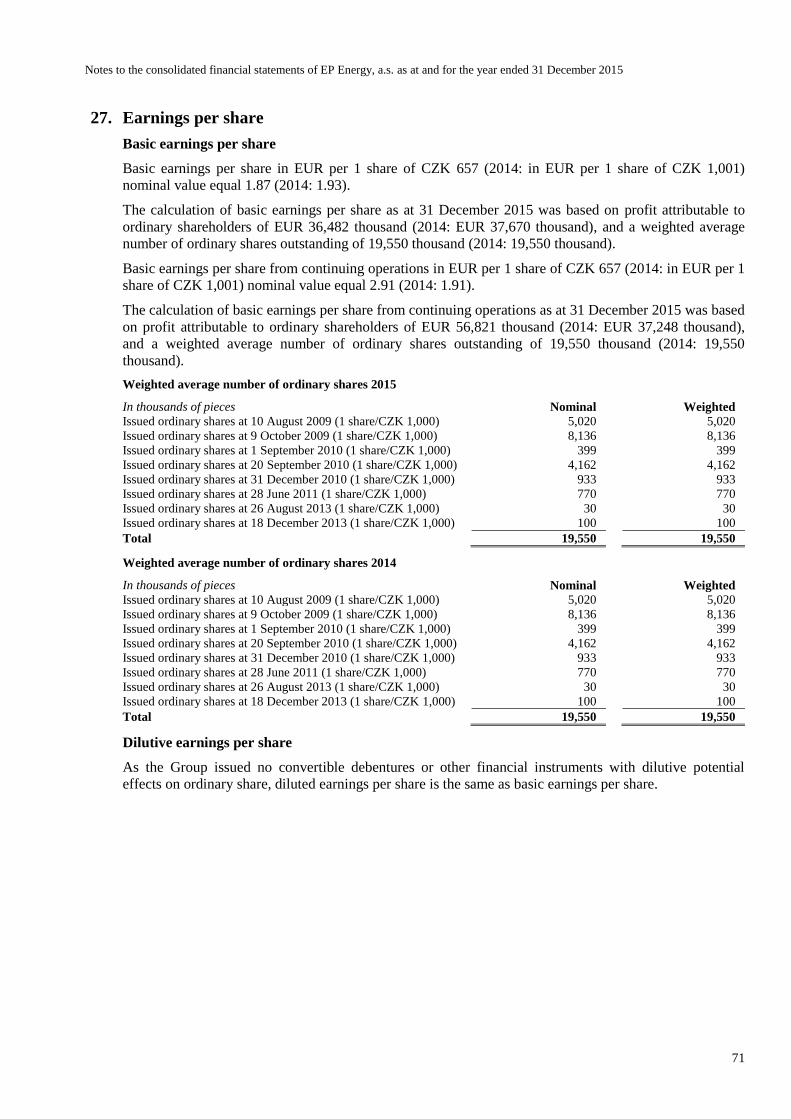
Notes to the consolidated financial statements of EP Energy, a.s. as at and for the year ended 31 December 2015
71
27. Earnings per share
Basic earnings per share
Basic earnings per share in EUR per 1 share of CZK 657 (2014: in EUR per 1 share of CZK 1,001)
nominal value equal 1.87 (2014: 1.93).
The calculation of basic earnings per share as at 31 December 2015 was based on profit attributable to
ordinary shareholders of EUR 36,482 thousand (2014: EUR 37,670 thousand), and a weighted average
number of ordinary shares outstanding of 19,550 thousand (2014: 19,550 thousand).
Basic earnings per share from continuing operations in EUR per 1 share of CZK 657 (2014: in EUR per 1
share of CZK 1,001) nominal value equal 2.91 (2014: 1.91).
The calculation of basic earnings per share from continuing operations as at 31 December 2015 was based
on profit attributable to ordinary shareholders of EUR 56,821 thousand (2014: EUR 37,248 thousand),
and a weighted average number of ordinary shares outstanding of 19,550 thousand (2014: 19,550
thousand).
Weighted average number of ordinary shares 2015
In thousands of pieces Nominal Weighted
Issued ordinary shares at 10 August 2009 (1 share/CZK 1,000) 5,020 5,020
Issued ordinary shares at 9 October 2009 (1 share/CZK 1,000) 8,136 8,136
Issued ordinary shares at 1 September 2010 (1 share/CZK 1,000) 399 399
Issued ordinary shares at 20 September 2010 (1 share/CZK 1,000) 4,162 4,162
Issued ordinary shares at 31 December 2010 (1 share/CZK 1,000) 933 933
Issued ordinary shares at 28 June 2011 (1 share/CZK 1,000) 770 770
Issued ordinary shares at 26 August 2013 (1 share/CZK 1,000) 30 30
Issued ordinary shares at 18 December 2013 (1 share/CZK 1,000) 100 100
Total 19,550 19,550
Weighted average number of ordinary shares 2014
In thousands of pieces Nominal Weighted
Issued ordinary shares at 10 August 2009 (1 share/CZK 1,000) 5,020 5,020
Issued ordinary shares at 9 October 2009 (1 share/CZK 1,000) 8,136 8,136
Issued ordinary shares at 1 September 2010 (1 share/CZK 1,000) 399 399
Issued ordinary shares at 20 September 2010 (1 share/CZK 1,000) 4,162 4,162
Issued ordinary shares at 31 December 2010 (1 share/CZK 1,000) 933 933
Issued ordinary shares at 28 June 2011 (1 share/CZK 1,000) 770 770
Issued ordinary shares at 26 August 2013 (1 share/CZK 1,000) 30 30
Issued ordinary shares at 18 December 2013 (1 share/CZK 1,000) 100 100
Total 19,550 19,550
Dilutive earnings per share
As the Group issued no convertible debentures or other financial instruments with dilutive potential
effects on ordinary share, diluted earnings per share is the same as basic earnings per share.

Notes to the consolidated financial statements of EP Energy, a.s. as at and for the year ended 31 December 2015
72
28. Non-controlling interest
31 December 2015
In thousands of EUR
Pražská teplárenská a.s.
and its subsidiaries
Stredoslovenská
energetika, a.s. and its
subsidiaries
Other individually
immaterial subsidiaries
Total
Non-controlling percentage 26.18% 51.00%
Business activity
Production and
distribution of heat
Distribution of
electricity
Country(1) Czech Republic Slovakia
Carrying amount of NCI at 31 December 2015 85,631 385,716 3,602 474,949
Profit (loss) attributable to non-controlling interest 5,475 38,988 781 45,244
Dividends declared (7,968) (28,439) (235) (36,642)
Statement of financial position information(2)
Total assets 382,973 1,083,411
of which: non-current 326,521 850,103
current 56,452 233,308
Total liabilities 69,394 327,105
of which: non-current 38,743 178,569
current 30,651 148,536
Net assets 313,579 756,306 - -
Statement of comprehensive income information(2)
Total revenues 241,775 948,283
of which: dividends received - 346
Profit after tax 20,909 76,446
Total other comprehensive income for the year, net of tax - (259)
Total comprehensive income for the year(2) 20,909 76,187 - -
Net cash inflows (outflows)(2) 591 17,261
(1) Principal place of business of subsidiaries and associates varies (for detail refer to Note 38 – Group entities).
(2) Financial information derived from financial statements prepared in accordance with local statutory accounting standards.

Notes to the consolidated financial statements of EP Energy, a.s. as at and for the year ended 31 December 2015
73
31 December 2014
In thousands of EUR
Pražská teplárenská a.s.
and its subsidiaries
Stredoslovenská
energetika, a.s. and its
subsidiaries
Other individually
immaterial subsidiaries
Total
Non-controlling percentage 26.60% 51.00%
Business activity
Production and
distribution of heat
Distribution of
electricity
Country(1) Czech Republic Slovakia
Carrying amount of NCI at 31 December 2014 87,522 373,400 1,253 462,175
Profit (loss) attributable to non-controlling interest 4,167 24,865 547 29,579
Dividends declared (14,845) (27,397) (58) (42,300)
Statement of financial position information(2)
Total assets 385,047 1,048,308
of which: non-current 337,075 869,916
current 47,972 178,392
Total liabilities 69,099 316,151
of which: non-current 41,544 180,359
current 27,555 135,792
Net assets 315,948 732,157 - -
Statement of comprehensive income information(3)
Total revenues 232,182 901,069
of which: dividends received - 235
Profit after tax 15,556 48,491
Total other comprehensive income for the year, net of tax - (129)
Total comprehensive income for the year(2) 15,556 48,362 - -
Net cash inflows (outflows)(2) (20,141) (33,508) - -
(1) Principal place of business of subsidiaries and associates varies (for detail refer to Note 38 – Group entities).
(2) Financial information derived from financial statements prepared in accordance with local statutory accounting standards.
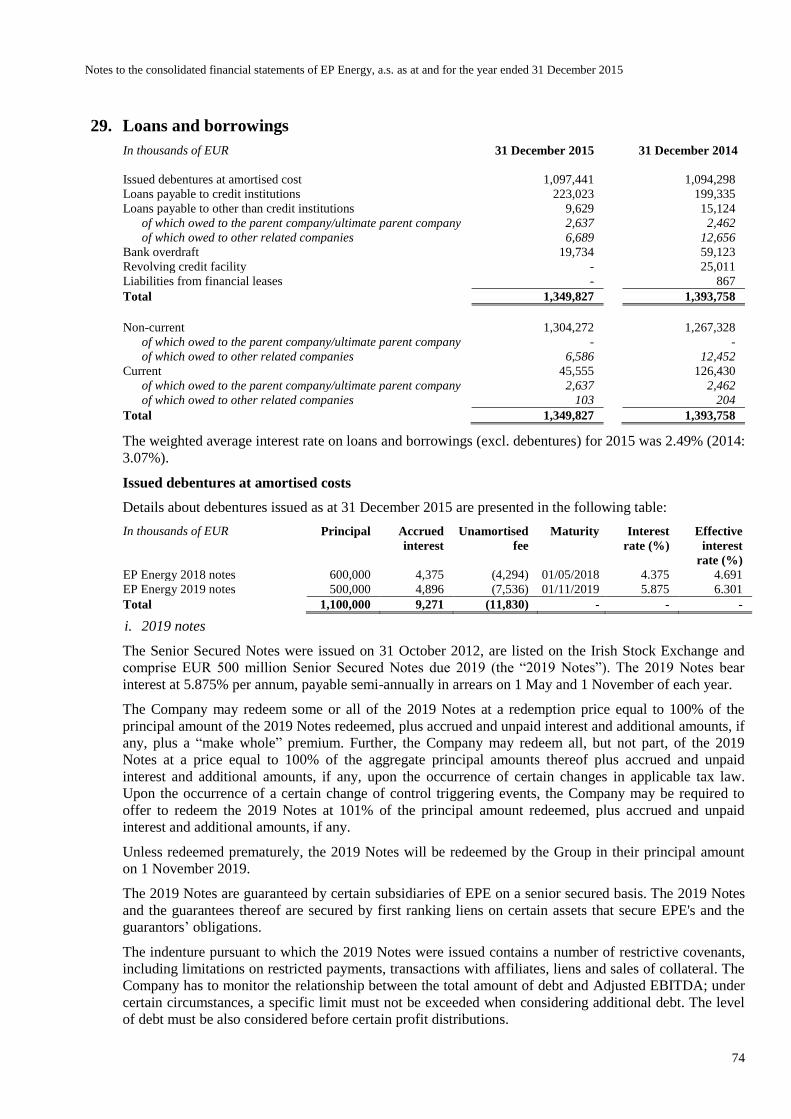
Notes to the consolidated financial statements of EP Energy, a.s. as at and for the year ended 31 December 2015
74
29. Loans and borrowings
In thousands of EUR 31 December 2015 31 December 2014
Issued debentures at amortised cost 1,097,441 1,094,298
Loans payable to credit institutions 223,023 199,335
Loans payable to other than credit institutions 9,629 15,124
of which owed to the parent company/ultimate parent company 2,637 2,462
of which owed to other related companies 6,689 12,656
Bank overdraft 19,734 59,123
Revolving credit facility - 25,011
Liabilities from financial leases - 867
Total 1,349,827 1,393,758
Non-current 1,304,272 1,267,328
of which owed to the parent company/ultimate parent company - -
of which owed to other related companies 6,586 12,452
Current 45,555 126,430
of which owed to the parent company/ultimate parent company 2,637 2,462
of which owed to other related companies 103 204
Total 1,349,827 1,393,758
The weighted average interest rate on loans and borrowings (excl. debentures) for 2015 was 2.49% (2014:
3.07%).
Issued debentures at amortised costs
Details about debentures issued as at 31 December 2015 are presented in the following table:
In thousands of EUR Principal Accrued
interest
Unamortised
fee
Maturity Interest
rate (%)
Effective
interest
rate (%)
EP Energy 2018 notes 600,000 4,375 (4,294) 01/05/2018 4.375 4.691
EP Energy 2019 notes 500,000 4,896 (7,536) 01/11/2019 5.875 6.301
Total 1,100,000 9,271 (11,830) - - -
i. 2019 notes
The Senior Secured Notes were issued on 31 October 2012, are listed on the Irish Stock Exchange and
comprise EUR 500 million Senior Secured Notes due 2019 (the “2019 Notes”). The 2019 Notes bear
interest at 5.875% per annum, payable semi-annually in arrears on 1 May and 1 November of each year.
The Company may redeem some or all of the 2019 Notes at a redemption price equal to 100% of the
principal amount of the 2019 Notes redeemed, plus accrued and unpaid interest and additional amounts, if
any, plus a “make whole” premium. Further, the Company may redeem all, but not part, of the 2019
Notes at a price equal to 100% of the aggregate principal amounts thereof plus accrued and unpaid
interest and additional amounts, if any, upon the occurrence of certain changes in applicable tax law.
Upon the occurrence of a certain change of control triggering events, the Company may be required to
offer to redeem the 2019 Notes at 101% of the principal amount redeemed, plus accrued and unpaid
interest and additional amounts, if any.
Unless redeemed prematurely, the 2019 Notes will be redeemed by the Group in their principal amount
on 1 November 2019.
The 2019 Notes are guaranteed by certain subsidiaries of EPE on a senior secured basis. The 2019 Notes
and the guarantees thereof are secured by first ranking liens on certain assets that secure EPE's and the
guarantors’ obligations.
The indenture pursuant to which the 2019 Notes were issued contains a number of restrictive covenants,
including limitations on restricted payments, transactions with affiliates, liens and sales of collateral. The
Company has to monitor the relationship between the total amount of debt and Adjusted EBITDA; under
certain circumstances, a specific limit must not be exceeded when considering additional debt. The level
of debt must be also considered before certain profit distributions.

Notes to the consolidated financial statements of EP Energy, a.s. as at and for the year ended 31 December 2015
75
The 2019 Notes are stated at net of debt issue costs of EUR 12 million. These costs are allocated to the
profit and loss account over the term of the 2019 Notes through the effective interest rate of 6.301%.
ii. 2018 Notes
On 18 April 2013 EPE issued additional Senior Secured Notes due in 2018 (the “2018 Notes”). These
second notes are listed on the Irish Stock Exchange and amount to EUR 600 million. The 2018 Notes bear
interest at 4.375% per annum, payable semi-annually in arrears on 1 May and 1 November of each year.
The Company may redeem some or all of the 2018 Notes at a redemption price equal to 100% of the
principal amount of the 2018 Notes redeemed, plus accrued and unpaid interest and additional amounts, if
any, plus a “make whole” premium. Further, the Company may redeem all, but not part, of the 2018
Notes at a price equal to 100% of the aggregate principal amounts thereof plus accrued and unpaid
interest and additional amounts, if any, upon the occurrence of certain changes in applicable tax law.
Upon the occurrence of a certain change of control triggering events, the Company may be required to
offer to redeem the 2018 Notes at 101% of the principal amount redeemed, plus accrued and unpaid
interest and additional amounts, if any.
Unless redeemed prematurely, the 2018 Notes will be redeemed by the Group in their principal amount
on 1 May 2018.
The 2018 Notes rank pari passu with the EPE Senior Secured Notes due 2019 issued on 31 October 2012
(the “2019 Notes”). The 2018 Notes and 2019 Notes share the same security package and are guaranteed
by certain subsidiaries of EPE on a senior secured basis. The 2018 Notes and the guarantees thereof are
also secured by first ranking liens on the same assets that secure EPE’s and the guarantors’ obligations
under the 2019 Notes.
The indenture pursuant to which the 2018 Notes were issued contains similar covenants as the indenture
of the 2019 Notes.
The 2018 Notes are stated at net of debt issue costs of EUR 8 million. These costs are allocated to the
profit and loss account over the term of the 2018 Notes through the effective interest rate of 4.691%.
Other loans and borrowings
Terms and debt repayment schedule
Terms and conditions of outstanding other loans and borrowing as at 31 December 2015 were as follows:
In thousands of EUR Cur-
rency
Nominal
interest
rate
Year of
maturity
(up to)
Balance at
31 December
2015
Due within
1 year
Due in 1–5
years
Due in
following
years
Secured bank loan EUR variable* 2022 175,000 - 100,000 75,000
Secured bank loan CZK variable* 2021 6,730 513 5,056 1,161
Secured bank loan EUR fixed 2023 6,540 4,458 1,542 540
Secured bank loan CZK fixed 2021 1,401 - 240 1,161
Unsecured bank loan EUR fixed 2023 32,627 8,142 16,985 7,500
Unsecured bank loan EUR variable* 2016 715 715 - -
Unsecured bank loan CZK fixed 2016 10 10 - -
Unsecured loan CZK fixed 2018 6,985 103 6,882 -
Unsecured loan EUR fixed 2016 2,644 2,644 - -
Bank overdraft EUR variable* 19,734 19,734 - -
Total interest-bearing liabilities 252,386 36,319 130,705 85,362
* Variable interest rate is derived as PRIBOR or EURIBOR plus a margin. All interest rates are market based.
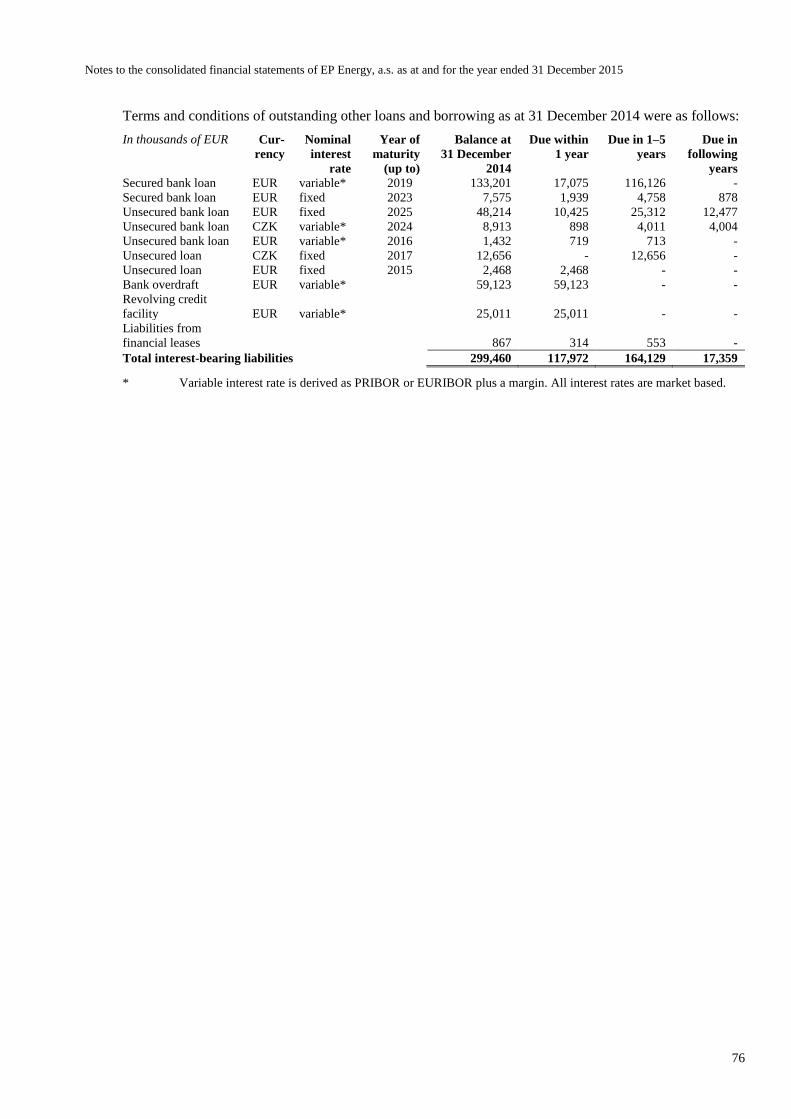
Notes to the consolidated financial statements of EP Energy, a.s. as at and for the year ended 31 December 2015
76
Terms and conditions of outstanding other loans and borrowing as at 31 December 2014 were as follows:
In thousands of EUR Cur-
rency
Nominal
interest
rate
Year of
maturity
(up to)
Balance at
31 December
2014
Due within
1 year
Due in 1–5
years
Due in
following
years
Secured bank loan EUR variable* 2019 133,201 17,075 116,126 -
Secured bank loan EUR fixed 2023 7,575 1,939 4,758 878
Unsecured bank loan EUR fixed 2025 48,214 10,425 25,312 12,477
Unsecured bank loan CZK variable* 2024 8,913 898 4,011 4,004
Unsecured bank loan EUR variable* 2016 1,432 719 713 -
Unsecured loan CZK fixed 2017 12,656 - 12,656 -
Unsecured loan EUR fixed 2015 2,468 2,468 - -
Bank overdraft EUR variable* 59,123 59,123 - -
Revolving credit
facility EUR variable* 25,011 25,011 - -
Liabilities from
financial leases 867 314 553 -
Total interest-bearing liabilities 299,460 117,972 164,129 17,359
* Variable interest rate is derived as PRIBOR or EURIBOR plus a margin. All interest rates are market based.
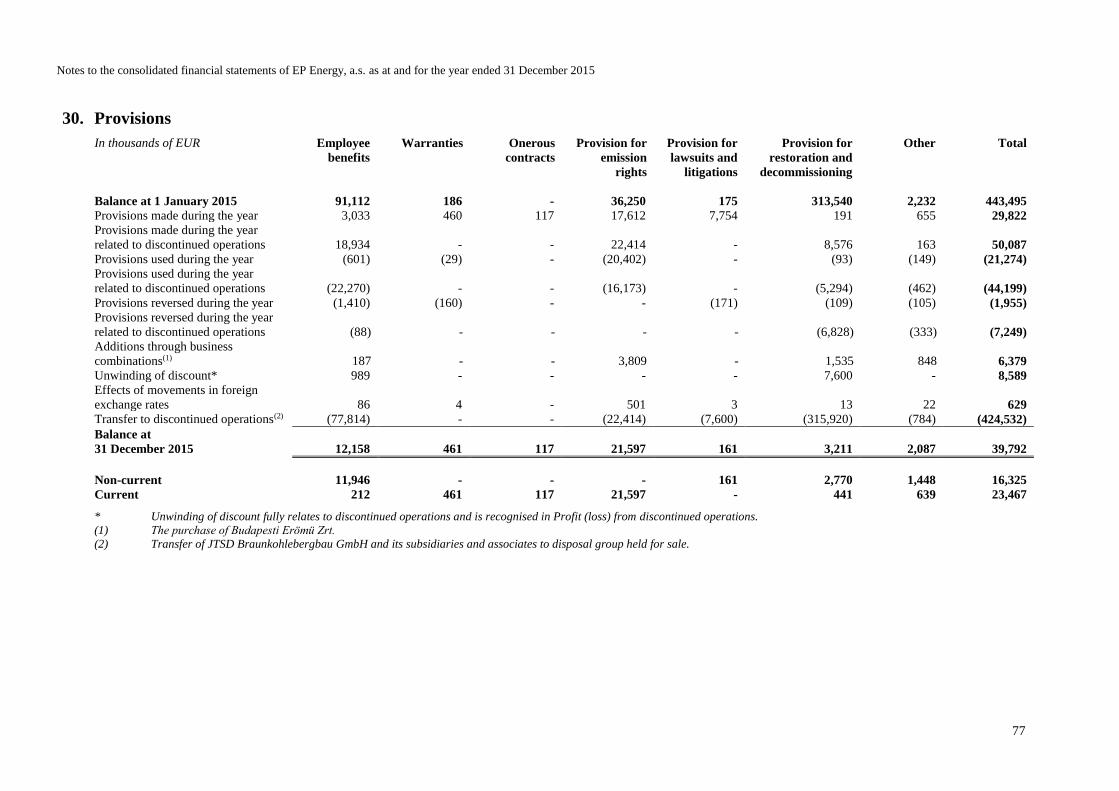
Notes to the consolidated financial statements of EP Energy, a.s. as at and for the year ended 31 December 2015
77
30. Provisions
In thousands of EUR Employee
benefits
Warranties Onerous
contracts
Provision for
emission
rights
Provision for
lawsuits and
litigations
Provision for
restoration and
decommissioning
Other Total
Balance at 1 January 2015 91,112 186 - 36,250 175 313,540 2,232 443,495
Provisions made during the year 3,033 460 117 17,612 7,754 191 655 29,822
Provisions made during the year
related to discontinued operations 18,934 - - 22,414 - 8,576 163 50,087
Provisions used during the year (601) (29) - (20,402) - (93) (149) (21,274)
Provisions used during the year
related to discontinued operations (22,270) - - (16,173) - (5,294) (462) (44,199)
Provisions reversed during the year (1,410) (160) - - (171) (109) (105) (1,955)
Provisions reversed during the year
related to discontinued operations (88) - - - - (6,828) (333) (7,249)
Additions through business
combinations(1) 187 - - 3,809 - 1,535 848 6,379
Unwinding of discount* 989 - - - - 7,600 - 8,589
Effects of movements in foreign
exchange rates 86 4 - 501 3 13 22 629
Transfer to discontinued operations(2) (77,814) - - (22,414) (7,600) (315,920) (784) (424,532)
Balance at
31 December 2015 12,158 461 117 21,597 161 3,211 2,087 39,792
Non-current 11,946 - - - 161 2,770 1,448 16,325
Current 212 461 117 21,597 - 441 639 23,467
* Unwinding of discount fully relates to discontinued operations and is recognised in Profit (loss) from discontinued operations.
(1) The purchase of Budapesti Erömü Zrt.
(2) Transfer of JTSD Braunkohlebergbau GmbH and its subsidiaries and associates to disposal group held for sale.
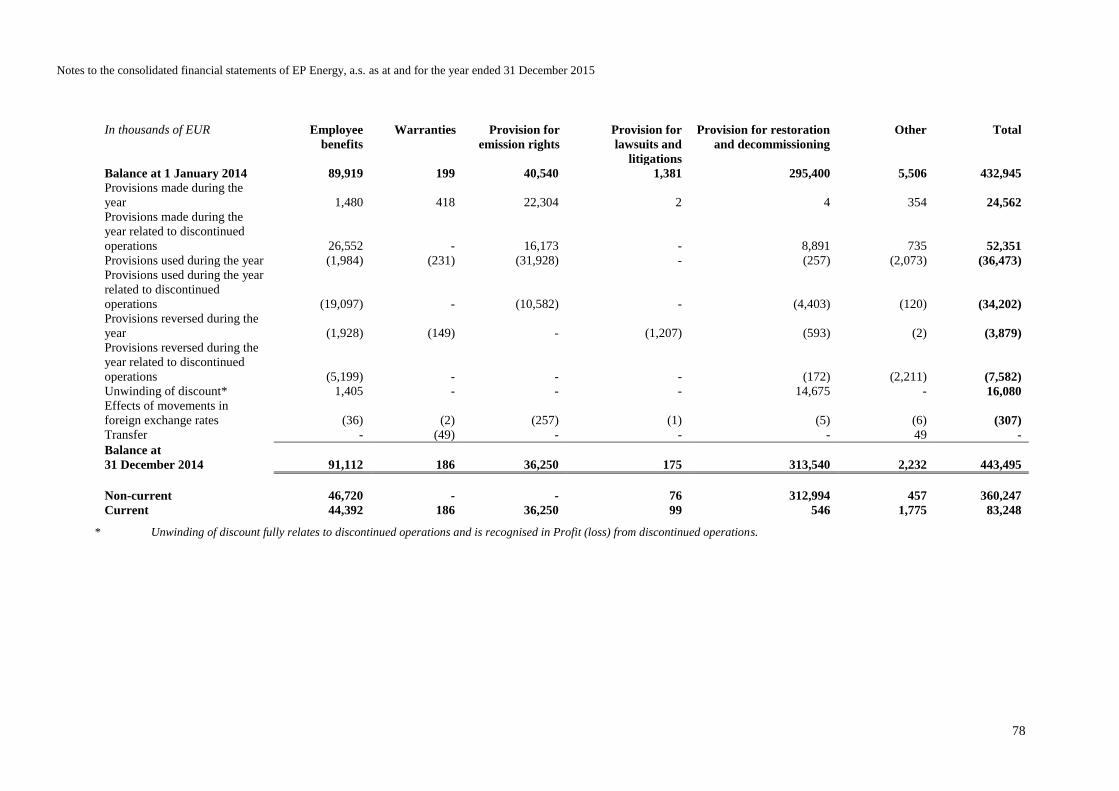
Notes to the consolidated financial statements of EP Energy, a.s. as at and for the year ended 31 December 2015
78
In thousands of EUR Employee
benefits
Warranties Provision for
emission rights
Provision for
lawsuits and
litigations
Provision for restoration
and decommissioning
Other Total
Balance at 1 January 2014 89,919 199 40,540 1,381 295,400 5,506 432,945
Provisions made during the
year 1,480 418 22,304 2 4 354 24,562
Provisions made during the
year related to discontinued
operations 26,552 - 16,173 - 8,891 735 52,351
Provisions used during the year (1,984) (231) (31,928) - (257) (2,073) (36,473)
Provisions used during the year
related to discontinued
operations (19,097) - (10,582) - (4,403) (120) (34,202)
Provisions reversed during the
year (1,928) (149) - (1,207) (593) (2) (3,879)
Provisions reversed during the
year related to discontinued
operations (5,199) - - - (172) (2,211) (7,582)
Unwinding of discount* 1,405 - - - 14,675 - 16,080
Effects of movements in
foreign exchange rates (36) (2) (257) (1) (5) (6) (307)
Transfer - (49) - - - 49 -
Balance at
31 December 2014 91,112 186 36,250 175 313,540 2,232 443,495
Non-current 46,720 - - 76 312,994 457 360,247
Current 44,392 186 36,250 99 546 1,775 83,248
* Unwinding of discount fully relates to discontinued operations and is recognised in Profit (loss) from discontinued operations.
Notes to the consolidated financial statements of EP Energy, a.s. as at and for the year ended 31 December 2015
79
Accounting for provisions involves frequent use of estimates, such as probability of occurrence of
uncertain events or calculation of the expected outcome. Such estimates are based on past experience,
statistical models and professional judgment.
Employee benefits
The Group recorded a provision for long-term employee benefits related to its employees. Valuations of
these provisions are sensitive to assumptions used in the calculations, such as future salary and benefit
levels, discount rates, employee leaving rate, late retirement rate, mortality and life expectancy. The
management considered various estimated factors and how these estimates would impact the recognised
provision. As a result of this analysis, no significant variances to the recorded provision are expected.
As at 31 December 2015 the provision for employee benefits in amount of EUR 12,158 thousand (2014:
EUR 91,112 thousand) was recorded by United Energy, a.s., Elektrárny Opatovice, a.s., Pražská
teplárenská a.s., Stredoslovenská energetika, a.s., PT měření, a.s. and Budapesti Erömü Zrt. This
provision decreased significantly compared to previous period as JTSD Braunhohlebergbau GmbH and
its subsidiaries and associates were transferred to disposal group held for sale in 2015.
The provision recorded by Stredoslovenská energetika, a.s. amounts to EUR 8,543 thousand (2014: EUR
7,533 thousand). The SSE Group has the following retirement plan with defined benefit and defined
contribution plans:
Pension Plans
This program has a defined contribution pension plan under which the Group pays fixed contributions to
third parties or government. The Group has no legal or constructive obligation to pay further funds, if the
amount of plan assets is insufficient to pay all the performance of employees who are eligible for the
current and prior periods.
The amount of benefits depends on several factors, such as age, years of service and salary.
Unfunded pension plan with defined benefit
According to the Corporate Group collective agreement for the period 2015 – 2016, the Group is obliged
to pay its employees upon age pension or disability pension, depending on seniority, the following
multiples of the average monthly salary:
Multiples of average monthly wage
10 years or less 2
11 – 15 years 4
16 – 20 years 5
21 – 25 years 6
25 years and more 7
The minimum requirement of the Labour Code to post the retirement, equal to one average monthly
salary, is included in the above multiples.
Other benefits
The Group also pays benefits for work and life anniversaries:
one monthly wage after 25 years of service;
40% to 110% of the employee’s monthly salary depending on seniority in the Group at the age of 50.
For comparative purposes, as at 31 December 2014 the provision recorded by Mitteldeutsche
Braunkohlengesellschaft GmbH amounts to EUR 14,868 thousand, of which EUR 3,873 thousand
represents a defined benefit pension scheme. The remaining balance of EUR 10,995 thousand represents
other unfunded employee benefits paid for work and life jubilees and anniversaries.
The schedules below summarise information about the defined benefit obligations and plan assets.
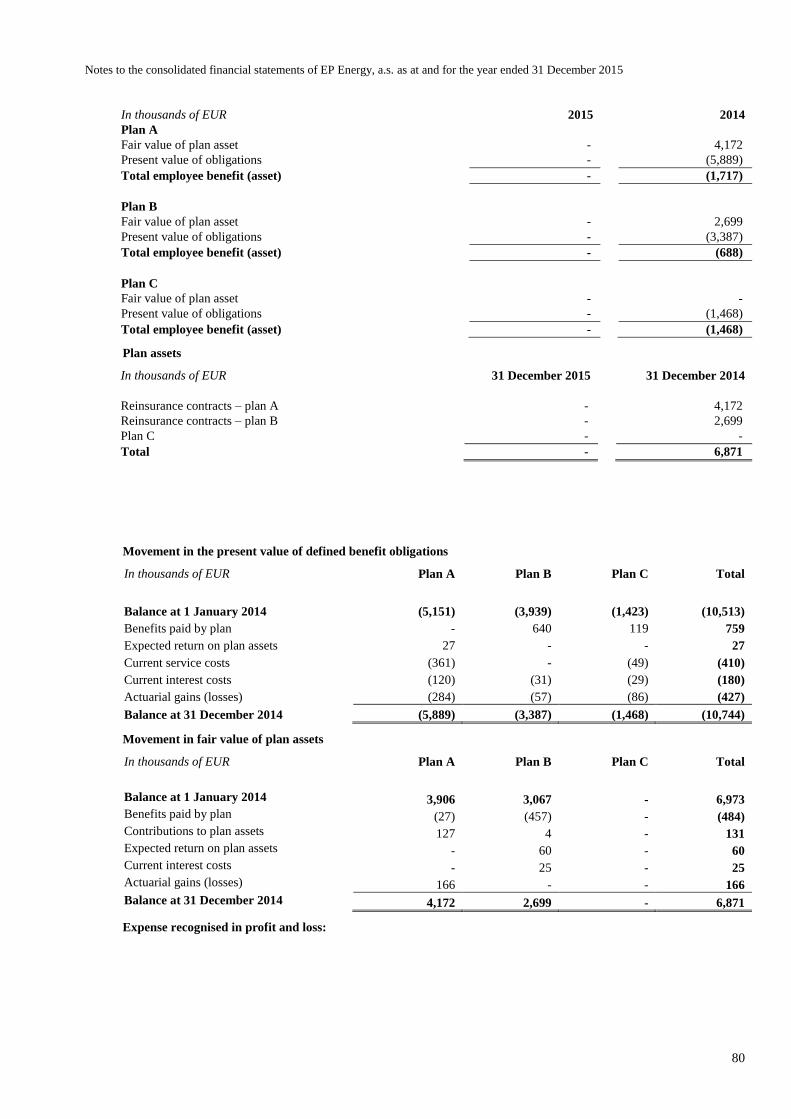
Notes to the consolidated financial statements of EP Energy, a.s. as at and for the year ended 31 December 2015
80
In thousands of EUR 2015 2014
Plan A
Fair value of plan asset - 4,172
Present value of obligations - (5,889)
Total employee benefit (asset) - (1,717)
Plan B
Fair value of plan asset - 2,699
Present value of obligations - (3,387)
Total employee benefit (asset) - (688)
Plan C
Fair value of plan asset - -
Present value of obligations - (1,468)
Total employee benefit (asset) - (1,468)
Plan assets
In thousands of EUR 31 December 2015 31 December 2014
Reinsurance contracts – plan A - 4,172
Reinsurance contracts – plan B - 2,699
Plan C - -
Total - 6,871
Movement in the present value of defined benefit obligations
In thousands of EUR Plan A Plan B Plan C Total
Balance at 1 January 2014 (5,151) (3,939) (1,423) (10,513)
Benefits paid by plan - 640 119 759
Expected return on plan assets 27 - - 27
Current service costs (361) - (49) (410)
Current interest costs (120) (31) (29) (180)
Actuarial gains (losses) (284) (57) (86) (427)
Balance at 31 December 2014 (5,889) (3,387) (1,468) (10,744)
Movement in fair value of plan assets
In thousands of EUR Plan A Plan B Plan C Total
Balance at 1 January 2014 3,906 3,067 - 6,973
Benefits paid by plan (27) (457) - (484)
Contributions to plan assets 127 4 - 131
Expected return on plan assets - 60 - 60
Current interest costs - 25 - 25
Actuarial gains (losses) 166 - - 166
Balance at 31 December 2014 4,172 2,699 - 6,871
Expense recognised in profit and loss:

Notes to the consolidated financial statements of EP Energy, a.s. as at and for the year ended 31 December 2015
81
In thousands of EUR 2015 2014
Current service costs - (410)
Expected return on plan assets - 87
Current interest costs - (155)
Actuarial gains (losses) - (261)
Total - (739)
The following were the principal actuarial assumptions at the reporting date (expressed as weighted
averages):
As at 31 December 2014
In % Plan A Plan B Plan C
Discount rate 2.30 0.46 1.63
Expected return on assets 3.50 0.46 N/A
Annual rate of increase in salaries 0.00 N/A 0.00
Post retirement pension increase 0.00 N/A 0.00
Mortality & disability (1) (1) (1)
(1) Assumptions regarding future mortality are based on published statistics and mortality tables 2005G.
For comparative purposes, as at 31 December 2014 the provision recorded by Helmstedter Revier GmbH
amounts to EUR 65,381 thousand, of which EUR 21,968 thousand represents a defined benefit pension
scheme and EUR 32,419 thousand represents an early retirement scheme. The schedules below
summarise information about the defined benefit obligations.
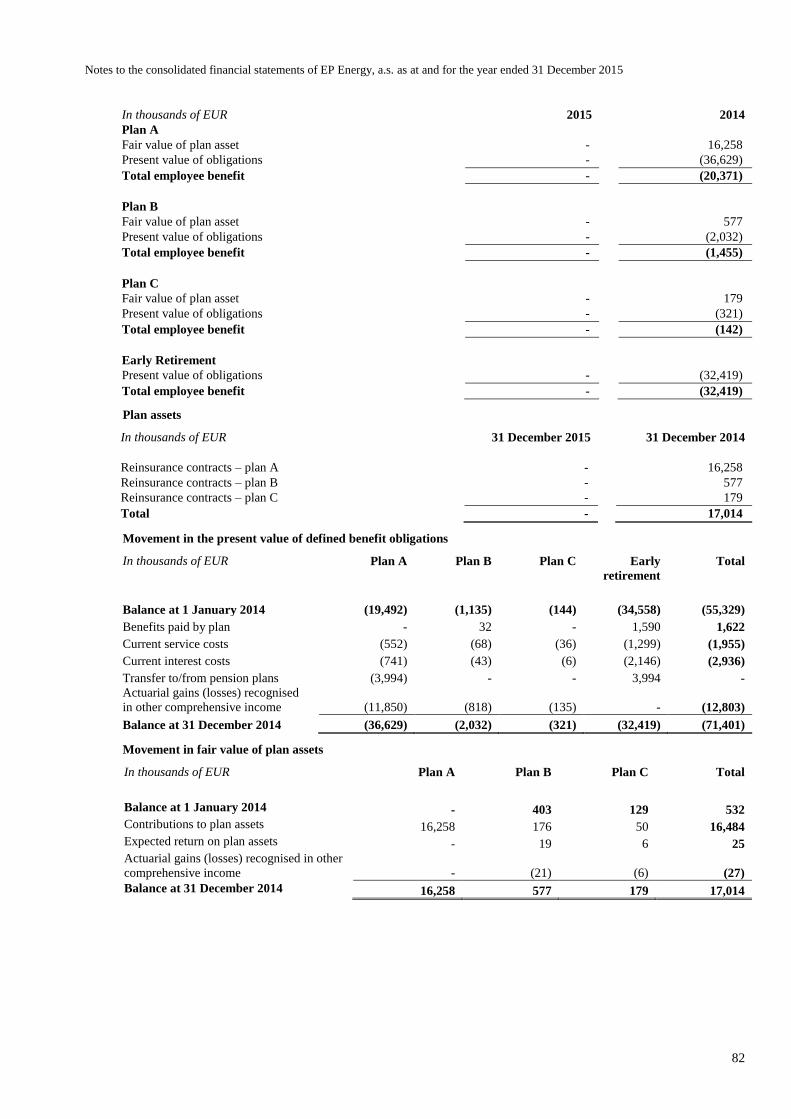
Notes to the consolidated financial statements of EP Energy, a.s. as at and for the year ended 31 December 2015
82
In thousands of EUR 2015 2014
Plan A
Fair value of plan asset - 16,258
Present value of obligations - (36,629)
Total employee benefit - (20,371)
Plan B
Fair value of plan asset - 577
Present value of obligations - (2,032)
Total employee benefit - (1,455)
Plan C
Fair value of plan asset - 179
Present value of obligations - (321)
Total employee benefit - (142)
Early Retirement
Present value of obligations - (32,419)
Total employee benefit - (32,419)
Plan assets
In thousands of EUR 31 December 2015 31 December 2014
Reinsurance contracts – plan A - 16,258
Reinsurance contracts – plan B - 577
Reinsurance contracts – plan C - 179
Total - 17,014
Movement in the present value of defined benefit obligations
In thousands of EUR Plan A Plan B Plan C Early
retirement
Total
Balance at 1 January 2014 (19,492) (1,135) (144) (34,558) (55,329)
Benefits paid by plan - 32 - 1,590 1,622
Current service costs (552) (68) (36) (1,299) (1,955)
Current interest costs (741) (43) (6) (2,146) (2,936)
Transfer to/from pension plans (3,994) - - 3,994 -
Actuarial gains (losses) recognised
in other comprehensive income (11,850) (818) (135) - (12,803)
Balance at 31 December 2014 (36,629) (2,032) (321) (32,419) (71,401)
Movement in fair value of plan assets
In thousands of EUR Plan A Plan B Plan C Total
Balance at 1 January 2014 - 403 129 532
Contributions to plan assets 16,258 176 50 16,484
Expected return on plan assets - 19 6 25
Actuarial gains (losses) recognised in other
comprehensive income - (21) (6) (27)
Balance at 31 December 2014 16,258 577 179 17,014
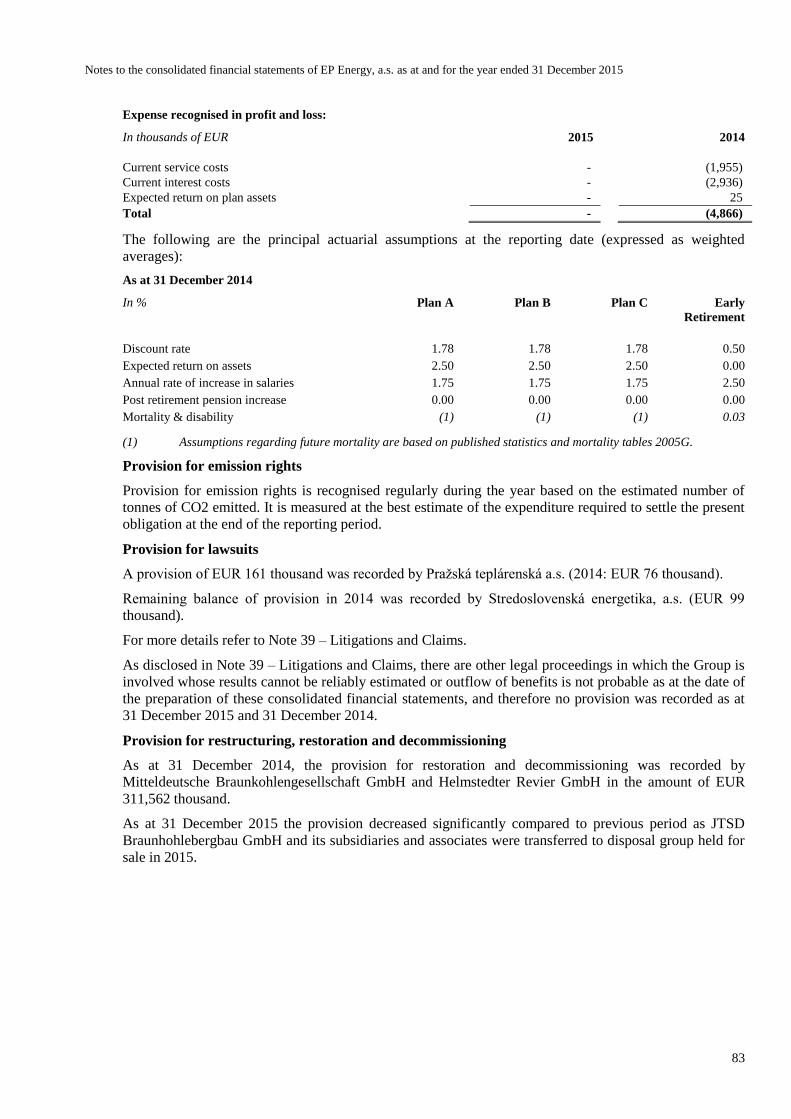
Notes to the consolidated financial statements of EP Energy, a.s. as at and for the year ended 31 December 2015
83
Expense recognised in profit and loss:
In thousands of EUR 2015 2014
Current service costs - (1,955)
Current interest costs - (2,936)
Expected return on plan assets - 25
Total - (4,866)
The following are the principal actuarial assumptions at the reporting date (expressed as weighted
averages):
As at 31 December 2014
In %
Plan A
Plan B Plan C Early
Retirement
Discount rate 1.78 1.78 1.78 0.50
Expected return on assets 2.50 2.50 2.50 0.00
Annual rate of increase in salaries 1.75 1.75 1.75 2.50
Post retirement pension increase 0.00 0.00 0.00 0.00
Mortality & disability (1) (1) (1) 0.03
(1) Assumptions regarding future mortality are based on published statistics and mortality tables 2005G.
Provision for emission rights
Provision for emission rights is recognised regularly during the year based on the estimated number of
tonnes of CO2 emitted. It is measured at the best estimate of the expenditure required to settle the present
obligation at the end of the reporting period.
Provision for lawsuits
A provision of EUR 161 thousand was recorded by Pražská teplárenská a.s. (2014: EUR 76 thousand).
Remaining balance of provision in 2014 was recorded by Stredoslovenská energetika, a.s. (EUR 99
thousand).
For more details refer to Note 39 – Litigations and Claims.
As disclosed in Note 39 – Litigations and Claims, there are other legal proceedings in which the Group is
involved whose results cannot be reliably estimated or outflow of benefits is not probable as at the date of
the preparation of these consolidated financial statements, and therefore no provision was recorded as at
31 December 2015 and 31 December 2014.
Provision for restructuring, restoration and decommissioning
As at 31 December 2014, the provision for restoration and decommissioning was recorded by
Mitteldeutsche Braunkohlengesellschaft GmbH and Helmstedter Revier GmbH in the amount of EUR
311,562 thousand.
As at 31 December 2015 the provision decreased significantly compared to previous period as JTSD
Braunhohlebergbau GmbH and its subsidiaries and associates were transferred to disposal group held for
sale in 2015.
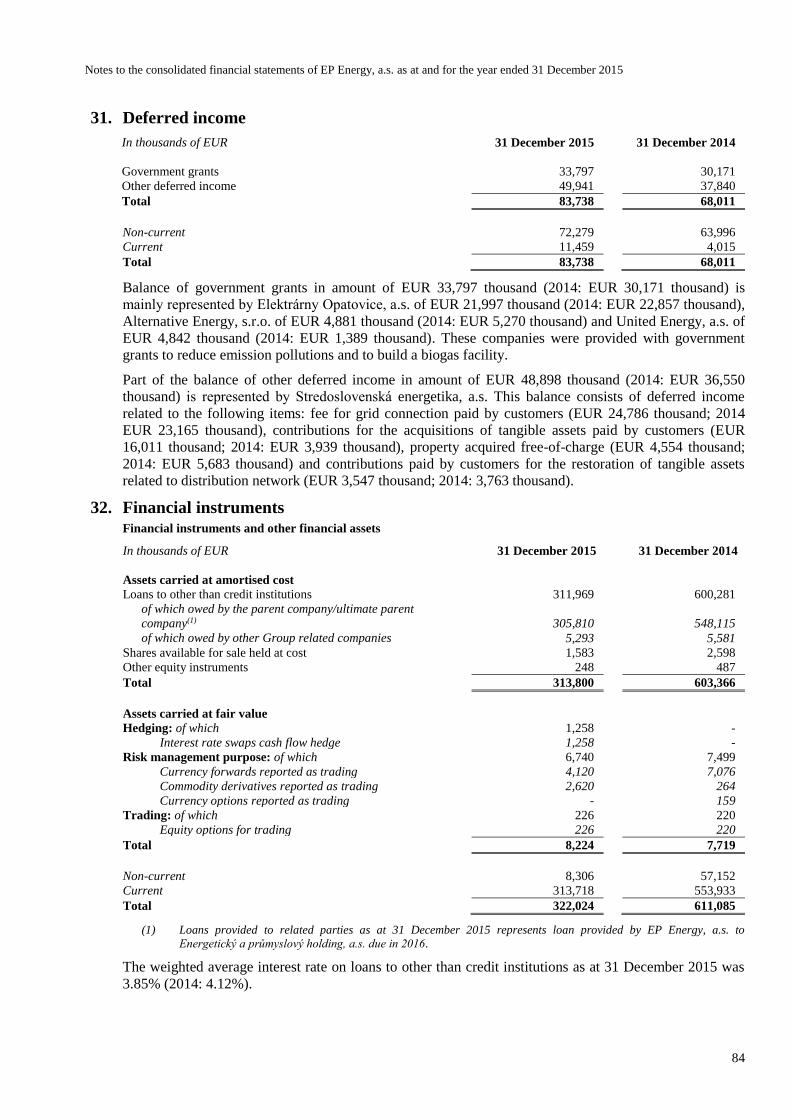
Notes to the consolidated financial statements of EP Energy, a.s. as at and for the year ended 31 December 2015
84
31. Deferred income
In thousands of EUR 31 December 2015 31 December 2014
Government grants 33,797 30,171
Other deferred income 49,941 37,840
Total 83,738 68,011
Non-current 72,279 63,996
Current 11,459 4,015
Total 83,738 68,011
Balance of government grants in amount of EUR 33,797 thousand (2014: EUR 30,171 thousand) is
mainly represented by Elektrárny Opatovice, a.s. of EUR 21,997 thousand (2014: EUR 22,857 thousand),
Alternative Energy, s.r.o. of EUR 4,881 thousand (2014: EUR 5,270 thousand) and United Energy, a.s. of
EUR 4,842 thousand (2014: EUR 1,389 thousand). These companies were provided with government
grants to reduce emission pollutions and to build a biogas facility.
Part of the balance of other deferred income in amount of EUR 48,898 thousand (2014: EUR 36,550
thousand) is represented by Stredoslovenská energetika, a.s. This balance consists of deferred income
related to the following items: fee for grid connection paid by customers (EUR 24,786 thousand; 2014
EUR 23,165 thousand), contributions for the acquisitions of tangible assets paid by customers (EUR
16,011 thousand; 2014: EUR 3,939 thousand), property acquired free-of-charge (EUR 4,554 thousand;
2014: EUR 5,683 thousand) and contributions paid by customers for the restoration of tangible assets
related to distribution network (EUR 3,547 thousand; 2014: 3,763 thousand).
32. Financial instruments
Financial instruments and other financial assets
In thousands of EUR 31 December 2015 31 December 2014
Assets carried at amortised cost
Loans to other than credit institutions 311,969 600,281
of which owed by the parent company/ultimate parent
company(1) 305,810
548,115
of which owed by other Group related companies 5,293 5,581
Shares available for sale held at cost 1,583 2,598
Other equity instruments 248 487
Total 313,800 603,366
Assets carried at fair value
Hedging: of which 1,258 -
Interest rate swaps cash flow hedge 1,258 -
Risk management purpose: of which 6,740 7,499
Currency forwards reported as trading 4,120 7,076
Commodity derivatives reported as trading 2,620 264
Currency options reported as trading - 159
Trading: of which 226 220
Equity options for trading 226 220
Total 8,224 7,719
Non-current 8,306 57,152
Current 313,718 553,933
Total 322,024 611,085
(1) Loans provided to related parties as at 31 December 2015 represents loan provided by EP Energy, a.s. to
Energetický a průmyslový holding, a.s. due in 2016.
The weighted average interest rate on loans to other than credit institutions as at 31 December 2015 was
3.85% (2014: 4.12%).
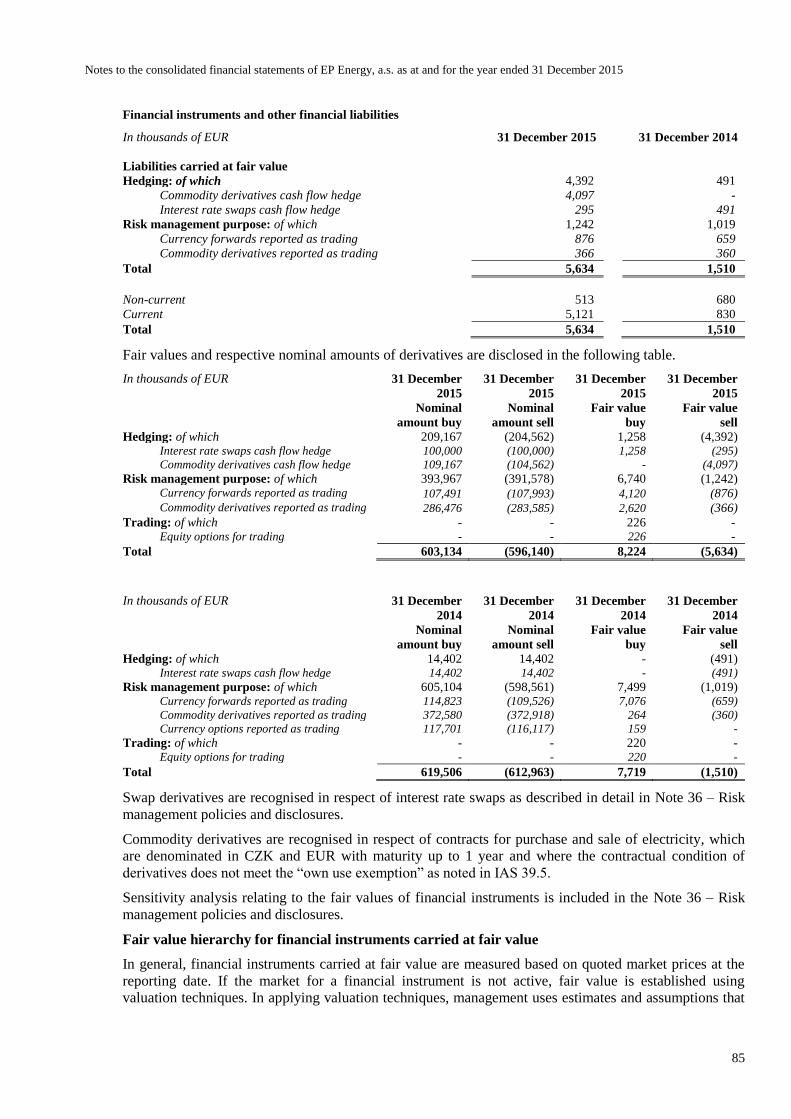
Notes to the consolidated financial statements of EP Energy, a.s. as at and for the year ended 31 December 2015
85
Financial instruments and other financial liabilities
In thousands of EUR 31 December 2015 31 December 2014
Liabilities carried at fair value
Hedging: of which 4,392 491
Commodity derivatives cash flow hedge 4,097 -
Interest rate swaps cash flow hedge 295 491
Risk management purpose: of which 1,242 1,019
Currency forwards reported as trading 876 659
Commodity derivatives reported as trading 366 360
Total 5,634 1,510
Non-current 513 680
Current 5,121 830
Total 5,634 1,510
Fair values and respective nominal amounts of derivatives are disclosed in the following table.
In thousands of EUR 31 December
2015
31 December
2015
31 December
2015
31 December
2015
Nominal
amount buy
Nominal
amount sell
Fair value
buy
Fair value
sell
Hedging: of which 209,167 (204,562) 1,258 (4,392) Interest rate swaps cash flow hedge 100,000 (100,000) 1,258 (295)
Commodity derivatives cash flow hedge 109,167 (104,562) - (4,097)
Risk management purpose: of which 393,967 (391,578) 6,740 (1,242) Currency forwards reported as trading 107,491 (107,993) 4,120 (876) Commodity derivatives reported as trading 286,476 (283,585) 2,620 (366)
Trading: of which - - 226 - Equity options for trading - - 226 -
Total 603,134 (596,140) 8,224 (5,634)
In thousands of EUR 31 December
2014
31 December
2014
31 December
2014
31 December
2014
Nominal
amount buy
Nominal
amount sell
Fair value
buy
Fair value
sell
Hedging: of which 14,402 14,402 - (491) Interest rate swaps cash flow hedge 14,402 14,402 - (491)
Risk management purpose: of which 605,104 (598,561) 7,499 (1,019) Currency forwards reported as trading 114,823 (109,526) 7,076 (659)
Commodity derivatives reported as trading 372,580 (372,918) 264 (360)
Currency options reported as trading 117,701 (116,117) 159 -
Trading: of which - - 220 - Equity options for trading - - 220 -
Total 619,506 (612,963) 7,719 (1,510)
Swap derivatives are recognised in respect of interest rate swaps as described in detail in Note 36 – Risk
management policies and disclosures.
Commodity derivatives are recognised in respect of contracts for purchase and sale of electricity, which
are denominated in CZK and EUR with maturity up to 1 year and where the contractual condition of
derivatives does not meet the “own use exemption” as noted in IAS 39.5.
Sensitivity analysis relating to the fair values of financial instruments is included in the Note 36 – Risk
management policies and disclosures.
Fair value hierarchy for financial instruments carried at fair value
In general, financial instruments carried at fair value are measured based on quoted market prices at the
reporting date. If the market for a financial instrument is not active, fair value is established using
valuation techniques. In applying valuation techniques, management uses estimates and assumptions that

Notes to the consolidated financial statements of EP Energy, a.s. as at and for the year ended 31 December 2015
86
are consistent with available information that market participants would use in setting a price for the
financial instrument.
The table below analyses financial instruments carried at fair value, by valuation method. The different
levels have been defined as follows:
Level 1: quoted prices (unadjusted) in active markets for identical assets or liabilities;
Level 2: inputs other than quoted prices included in Level 1 that are observable for the asset or
liability, either directly (i.e. as prices) or indirectly (i.e. derived from prices);
Level 3: inputs for the asset or liability that are not based on observable market data
(unobservable inputs).
2015
In thousands of EUR Level 1 Level 2 Level 3 Total
Financial assets carried at fair value:
Hedging: of which - 1,258 - 1,258 Interest rate swaps cash flow hedge - 1,258 - 1,258
Risk management purpose: of which - 6,740 - 6,740 Currency forwards reported as trading - 4,120 - 4,120
Commodity derivatives reported as trading - 2,620 - 2,620
Trading: of which - 226 - 226 Equity options for trading - 226 - 226
Total - 8,224 - 8,224
Financial liabilities carried at fair value:
Hedging: of which - 4,392 - 4,392 Commodity derivatives cash flow hedge - 4,097 - 4,097
Interest rate swaps cash flow hedge - 295 - 295
Risk management purpose: of which - 1,242 - 1,242 Currency forwards reported as trading - 876 - 876
Commodity derivatives reported as trading - 366 - 366
Total - 5,634 - 5,634
2014
In thousands of EUR Level 1 Level 2 Level 3 Total
Financial assets carried at fair value:
Risk management purpose: of which - 7,499 - 7,499 Currency forwards reported as trading - 7,076 - 7,076
Commodity derivatives reported as trading - 264 - 264
Currency options reported as trading - 159 - 159
Trading: of which - 220 - 220 Equity options for trading - 220 - 220
Total - 7,719 - 7,719
Financial liabilities carried at fair value:
Hedging: of which - 491 - 491 Interest rate swaps cash flow hedge - 491 - 491
Risk management purpose: of which - 1,019 - 1,019 Currency forwards reported as trading - 659 - 659
Commodity derivatives reported as trading - 360 - 360
Total - 1,510 - 1,510
There were no transfers between fair value levels in either 2015 or 2014.

Notes to the consolidated financial statements of EP Energy, a.s. as at and for the year ended 31 December 2015
87
The fair value of financial instruments held at amortised costs is shown in the table below:
In thousands of EUR Carrying value
amount
Fair value
Financial assets 31 December 2015 31 December 2015
Loans to other than credit institutions 311,969 312,610
Shares available for sale 1,583 (1)-
Other equity instruments 248 248
Financial instruments held at amortised costs 313,800 312,858
Financial liabilities
Loans and borrowings 1,349,827 1,391,106
In thousands of EUR Carrying value
amount
Fair value
Financial assets 31 December 2014 31 December 2014
Loans to other than credit institutions 600,281 631,362
Shares available for sale 2,598 (1)-
Other equity instruments 487 487
Financial instruments held at amortised costs 603,366 631,849
Financial liabilities
Loans and borrowings 1,393,758 1,406,351
(1) These equity instruments do not have a quoted price in an active market and their fair value cannot be otherwise
measured reliably, therefore they are held at cost and disclosure of fair value is not required.
All financial instruments held at amortised costs are categorised within Level 2 of the fair value hierarchy
(for more details of valuation methods refer to Note 2(d) i – Assumption and estimation uncertainties).
Transactions with emission rights
The following information pertains to contracts on delivery or sale of emission rights. These contracts do
not meet the IAS 39 criteria for derivatives (refer to the Note 3(e) – Derivative financial instruments –
Transactions with emission rights and energy) and are reported as off-balance sheet items, not derivatives.
The management carefully assessed conditions of the contracts and concluded that all contracts are
intended to be settled via physical delivery needed for consumption or physically delivered quantities
shall be sold as part of its ordinary business.
Forward operations
As at 31 December 2015 the EPE Group is contractually obliged to purchase 2,172,971 pieces (2014:
5,488,000 pieces) of emission rights at an average price 8.40 EUR/piece (2014: 5.81 EUR/piece).
Debentures held to maturity
In December 2013, the management of Stredoslovenská energetika, a.s. sold the debentures held in its
Held to maturity portfolio before original maturity in nominal amount of EUR 20,113 thousand. Proceed
of this transaction was EUR 20,943 thousand. As a result of this transaction, the Group could not hold any
assets in the Held to maturity portfolio until December 2015.
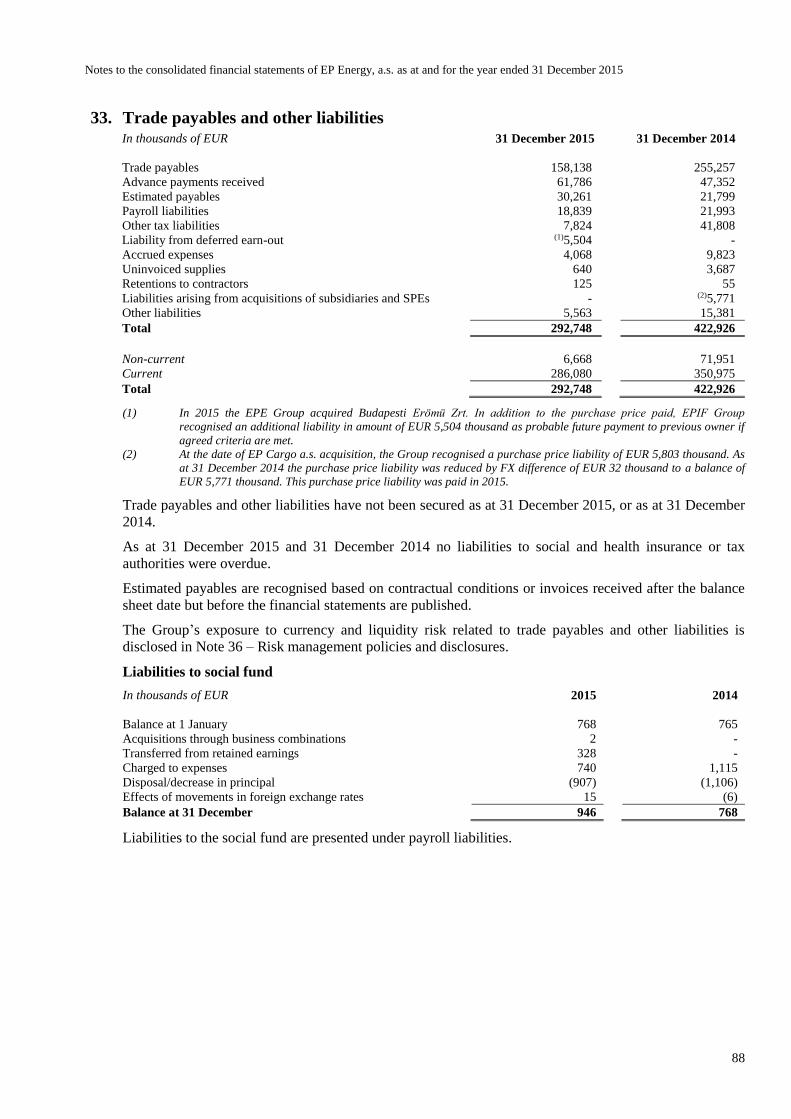
Notes to the consolidated financial statements of EP Energy, a.s. as at and for the year ended 31 December 2015
88
33. Trade payables and other liabilities In thousands of EUR 31 December 2015 31 December 2014
Trade payables 158,138 255,257
Advance payments received 61,786 47,352
Estimated payables 30,261 21,799
Payroll liabilities 18,839 21,993
Other tax liabilities 7,824 41,808
Liability from deferred earn-out (1)5,504 -
Accrued expenses 4,068 9,823
Uninvoiced supplies 640 3,687
Retentions to contractors 125 55
Liabilities arising from acquisitions of subsidiaries and SPEs - (2)5,771
Other liabilities 5,563 15,381
Total 292,748 422,926
Non-current 6,668 71,951
Current 286,080 350,975
Total 292,748 422,926
(1) In 2015 the EPE Group acquired Budapesti Erömü Zrt. In addition to the purchase price paid, EPIF Group
recognised an additional liability in amount of EUR 5,504 thousand as probable future payment to previous owner if
agreed criteria are met.
(2) At the date of EP Cargo a.s. acquisition, the Group recognised a purchase price liability of EUR 5,803 thousand. As
at 31 December 2014 the purchase price liability was reduced by FX difference of EUR 32 thousand to a balance of
EUR 5,771 thousand. This purchase price liability was paid in 2015.
Trade payables and other liabilities have not been secured as at 31 December 2015, or as at 31 December
2014.
As at 31 December 2015 and 31 December 2014 no liabilities to social and health insurance or tax
authorities were overdue.
Estimated payables are recognised based on contractual conditions or invoices received after the balance
sheet date but before the financial statements are published.
The Group’s exposure to currency and liquidity risk related to trade payables and other liabilities is
disclosed in Note 36 – Risk management policies and disclosures.
Liabilities to social fund
In thousands of EUR 2015 2014
Balance at 1 January 768 765
Acquisitions through business combinations 2 -
Transferred from retained earnings 328 -
Charged to expenses 740 1,115
Disposal/decrease in principal (907) (1,106)
Effects of movements in foreign exchange rates 15 (6)
Balance at 31 December 946 768
Liabilities to the social fund are presented under payroll liabilities.

Notes to the consolidated financial statements of EP Energy, a.s. as at and for the year ended 31 December 2015
89
34. Financial commitments and contingencies
Off balance sheet liabilities
In thousands of EUR 31 December 2015 31 December 2014
Granted pledges – securities 1,013,141 1,010,929
Guarantees given 179,315 240,321
Other granted pledges 1,676,868 1,940,890
Total 2,869,324 3,192,140
Granted pledges represent securities of individual Group companies used as collateral for external
financing.
Guarantees given
Guarantees given mainly include contracts for the future supply of energy for EUR 173,067 thousand
(2014: EUR 162,719 thousand).
Other granted pledges
In thousands of EUR 31 December 2015 31 December 2014
Loans granted(1) 1,157,273 1,394,187
Property, plant and equipment 374,319 335,437
Cash and cash equivalents 45,015 102,203
Trade receivables 71,170 87,391
Inventories 27,891 21,672
Investment property 1,200 -
Total 1,676,868 1,940,890
(1) Total balance of pledged granted loans includes intercompany loans of EUR 924,816 thousand (2014: EUR 846,057
thousand).
Off balance sheet assets
In thousands of EUR 31 December 2015 31 December 2014
Received promises 262,804 248,376
Other received guarantees and warranties 4,187 1,810
Total 266,991 250,186
Received promises
Received promises mainly comprise the contracts for the future purchase of energy in amount of EUR
119,638 thousand (2014: EUR 175,475 thousand), loan commitment received recognised by EPE of EUR
30,344 thousand (2014: EUR 0 thousand) and regulatory contingent assets related to green energy of
EUR 73,471 thousand (2014: EUR 53,139 thousand) recognised by Stredoslovenská energetika, a.s.,
which are represented by the contingent assets related to green energy for the year 2015 (2014: contingent
assets cover year 2014).
Regulatory contingent assets related to green energy
The SSE Group is legally bound to connect producers of green energy, if they comply with requirements
set by RONI and to purchase the green electricity generated, which is used to cover network losses. The
purchase tariff for green energy is set by RONI and is covered by the Tariff for system operation (“TPS”).
For the year ended 31 December 2015 the SSE Group recognised a loss of EUR 73,471 thousand (2014:
EUR 76,702 thousand) as the difference between the costs of purchased green energy and costs related to
the subvention of electricity produced from coal and revenues from TPS in the period from 1 January
2015 to 31 December 2015. The 2015 loss is included in the contingent asset of EUR 73,471 (2014: EUR
53,139 thousand) specified above. Based on the current Regulatory Framework the losses incurred will be
compensated in two years’ time, i.e. relevant amounts in 2016 and 2017 through an increase of revenues
from TPS (2014: in 2015 and 2016). Based on the RONI decision dated in December 2014 the resulting
asset of EUR 41,528 thousand originating in the year 2013 was recognised as accrued income in the
Notes to the consolidated financial statements of EP Energy, a.s. as at and for the year ended 31 December 2015
90
combined statement of financial position as of 31 December 2014 and was collected in 2015. Similarly,
based on the RONI decision dated in December 2015 the resulting asset of EUR 76,702 thousand
originating in the year 2014 was recognised as accrued income in the combined statement of financial
position as of 31 December 2015 and will be collected in the course of 2016. The resulting asset
originating in the year 2015 was not recognised as the asset does not meet currently the recognition
criteria set by IFRS as adopted by the EU and will be recognised during the course of 2016.
35. Operating leases
During the year ended 31 December 2015, EUR 11,238 thousand (2014: EUR 5,628 thousand) was
recognised as an expense in profit or loss in respect of operating leases.
During the year ended 31 December 2015 EUR 4,908 thousand (2014: EUR 5,241 thousand) was
recognised as income in profit or loss in respect of operating leases and rent of property.
36. Risk management policies and disclosures
This section provides details of the Group’s exposure to financial and operational risks and the way it
manages such risk. The most important types of financial risks to which the Group is exposed are credit
risk, liquidity risk, interest rate risk, foreign exchange risk and concentration risk.
As part of its operations, the Group is exposed to different market risks, notably the risk of changes in
interest rates, exchange rates and commodity prices. To minimise this exposure, the Group enters into
derivatives contracts to mitigate or manage the risks associated with individual transactions and overall
exposures, using instruments available on the market.
(a) Credit risk
i. Exposure to credit risk
Credit risk is the risk of financial loss to the Group if a customer or counterparty to a financial instrument
fails to meet its contractual obligations, and arises principally from the Group’s receivables from
customers and loans and advances.
The Group has established a credit policy under which each new customer requesting products/services
over a certain limit (which is based on the size and nature of the particular business) is analysed
individually for creditworthiness before the Group’s standard payment and delivery terms and conditions
are offered. The Group uses credit databases for analysis of creditworthiness of new customers and after
deemed creditworthy they are also subject to Risk committee approval. The Group’s policy is also to
require suitable collateral to be provided by customers such as a bank guarantee or a parent company
guarantee. The exposure to credit risk is monitored on an ongoing basis.
Additional aspects mitigating credit risk
The Group operates mainly as an energy and power generation company, and thus has a specific customer
structure. The distribution companies represent a comparatively low credit risk. The large clients are
dependent upon electricity supplies which significantly mitigates the credit risks. In addition, bank
guarantees and advance payments are required before active operation with traders. Previous experience
shows that such elements are very favourable in terms of credit risk mitigation.
The carrying amount of financial assets (plus guarantees issued) represents the maximum credit exposure
if counterparties fail to carry out completely their contractual obligations and any collateral or security
proves to be of no value. The maximum credit exposure amounts disclosed below therefore greatly
exceed expected losses, which are included in the allowance for impairment.
The Group establishes an allowance for impairment that represents its estimate of incurred losses in
respect of trade and other receivables. The main components of this allowance are a specific loss
component that relates to individually significant exposures and a collective loss component established
for groups of similar assets in respect of losses that have been incurred but not yet identified. The
collective loss allowance is determined based on historical data of payment statistics for similar financial
assets.

Notes to the consolidated financial statements of EP Energy, a.s. as at and for the year ended 31 December 2015
91
At the reporting date, the maximum exposure to credit risk by the type of counterparty and by geographic
region is provided in the following tables.

Notes to the consolidated financial statements of EP Energy, a.s. as at and for the year ended 31 December 2015
92
Credit risk by type of counterparty
As at 31 December 2015
In thousands of EUR Corporate
(non-financial
institutions)
State,
government
Financial
institutions
Banks Individuals Other Total
Assets
Cash and cash equivalents 1,228 - 1,480 128,649 - (1)272 131,629
Trade receivables and other assets 302,587 2,459 15 55 227 11,089 316,432
Financial instruments and other financial assets 10,129 - 310,220 1,675 - - 322,024
Total 313,944 2,459 311,715 130,379 227 11,631 770,085
(1) Primarily petty cash
As at 31 December 2014
In thousands of EUR Corporate
(non-financial
institutions)
State,
government
Financial
institutions
Banks Individuals Other Total
Assets
Cash and cash equivalents 4,479 - - 196,342 - (1)157 200,978
Trade receivables and other assets 343,602 16,055 39 4 9,566 16,652 385,918
Financial instruments and other financial assets 117,280 - 491,961 1,841 - 3 611,085
Total 465,361 16,055 492,000 198,187 9,566 16,812 1,197,981
(1) Primarily petty cash
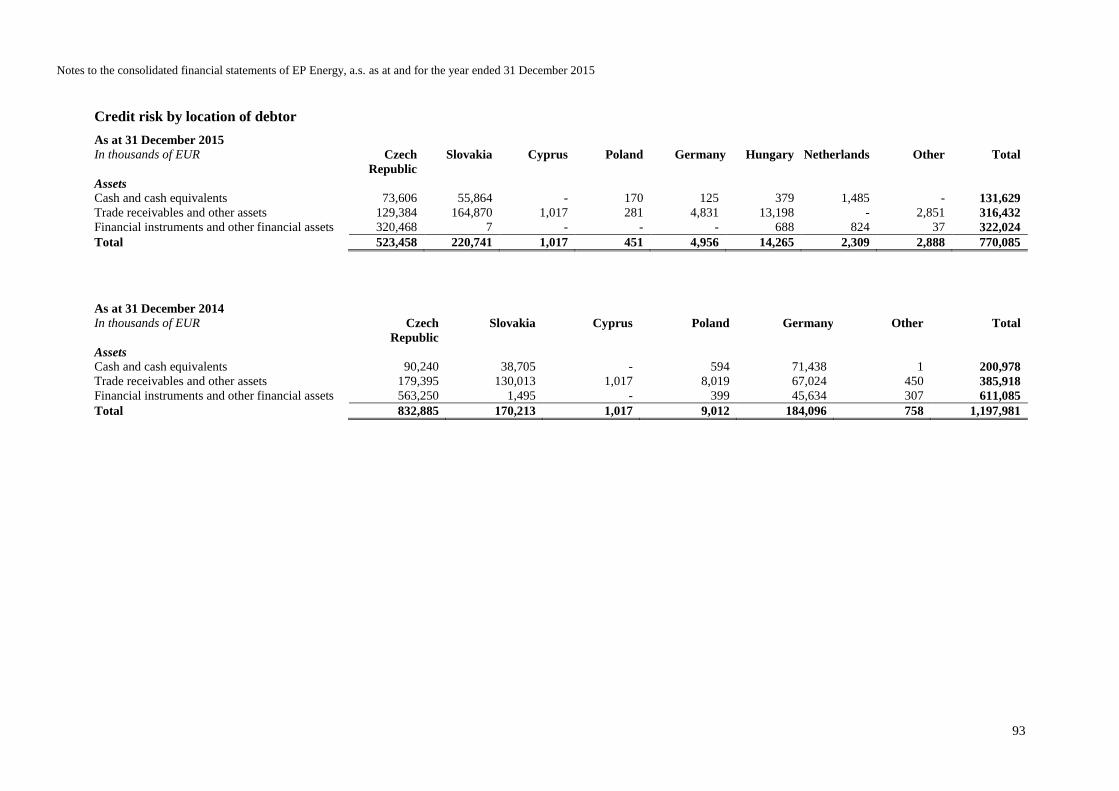
Notes to the consolidated financial statements of EP Energy, a.s. as at and for the year ended 31 December 2015
93
Credit risk by location of debtor
As at 31 December 2015
In thousands of EUR Czech
Republic
Slovakia Cyprus Poland Germany Hungary Netherlands Other Total
Assets
Cash and cash equivalents 73,606 55,864 - 170 125 379 1,485 - 131,629
Trade receivables and other assets 129,384 164,870 1,017 281 4,831 13,198 - 2,851 316,432
Financial instruments and other financial assets 320,468 7 - - - 688 824 37 322,024
Total 523,458 220,741 1,017 451 4,956 14,265 2,309 2,888 770,085
As at 31 December 2014
In thousands of EUR Czech
Republic
Slovakia Cyprus Poland Germany Other Total
Assets
Cash and cash equivalents 90,240 38,705 - 594 71,438 1 200,978
Trade receivables and other assets 179,395 130,013 1,017 8,019 67,024 450 385,918
Financial instruments and other financial assets 563,250 1,495 - 399 45,634 307 611,085
Total 832,885 170,213 1,017 9,012 184,096 758 1,197,981
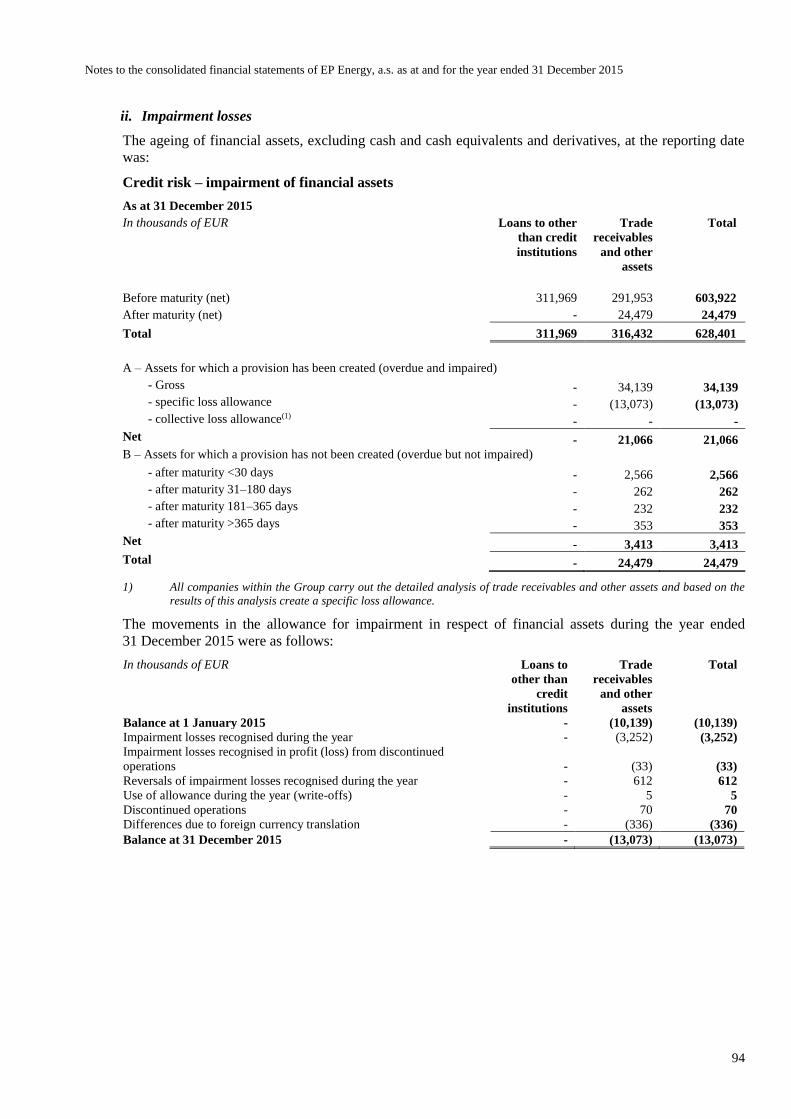
Notes to the consolidated financial statements of EP Energy, a.s. as at and for the year ended 31 December 2015
94
ii. Impairment losses
The ageing of financial assets, excluding cash and cash equivalents and derivatives, at the reporting date
was:
Credit risk – impairment of financial assets
As at 31 December 2015
In thousands of EUR Loans to other
than credit
institutions
Trade
receivables
and other
assets
Total
Before maturity (net) 311,969 291,953 603,922
After maturity (net) - 24,479 24,479
Total 311,969 316,432 628,401
A – Assets for which a provision has been created (overdue and impaired)
- Gross - 34,139 34,139
- specific loss allowance - (13,073) (13,073)
- collective loss allowance(1) - - -
Net - 21,066 21,066
B – Assets for which a provision has not been created (overdue but not impaired)
- after maturity <30 days - 2,566 2,566
- after maturity 31–180 days - 262 262
- after maturity 181–365 days - 232 232
- after maturity >365 days - 353 353
Net - 3,413 3,413
Total - 24,479 24,479
1) All companies within the Group carry out the detailed analysis of trade receivables and other assets and based on the
results of this analysis create a specific loss allowance.
The movements in the allowance for impairment in respect of financial assets during the year ended
31 December 2015 were as follows:
In thousands of EUR Loans to
other than
credit
institutions
Trade
receivables
and other
assets
Total
Balance at 1 January 2015 - (10,139) (10,139)
Impairment losses recognised during the year - (3,252) (3,252)
Impairment losses recognised in profit (loss) from discontinued
operations - (33) (33)
Reversals of impairment losses recognised during the year - 612 612
Use of allowance during the year (write-offs) - 5 5
Discontinued operations - 70 70
Differences due to foreign currency translation - (336) (336)
Balance at 31 December 2015 - (13,073) (13,073)

Notes to the consolidated financial statements of EP Energy, a.s. as at and for the year ended 31 December 2015
95
As at 31 December 2014
In thousands of EUR Loans to
other than
credit
institutions
Trade
receivables
and other
assets
Total
Before maturity (net) 600,281 328,523 928,804
After maturity (net) - 57,395 57,395
Total 600,281 385,918 986,199
A – Assets for which a provision has been created (overdue and impaired)
- Gross - 99,370 99,370
- specific loss allowance - (17,346) (17,346)
- collective loss allowance - (37,408) (37,408)
Net - 44,616 44,616
B – Assets for which a provision has not been created (overdue but not impaired)
- after maturity <30 days - 9,938 9,938
- after maturity 31–180 days - 751 751
- after maturity 181–365 days - 1,390 1,390
- after maturity >365 days - 700 700
Net - 12,779 12,779
Total - 57,395 57,395
The movements in the allowance for impairment in respect of financial assets during the year ended
31 December 2014 were as follows:
In thousands of EUR Loans to
other than
credit
institutions
Trade
receivables
and other
assets
Total
Balance at 1 January 2014 - (8,883) (8,883)
Impairment losses recognised during the year - (4,000) (4,000)
Reversals of impairment losses recognised during the year - 2,654 2,654
Differences due to foreign currency translation - 90 90
Balance at 31 December 2014 - (10,139) (10,139)
Impairment losses on trade receivables and other assets at 31 December 2015 and 31 December 2014
relate to several customers that have indicated that they do not expect to be able to pay their outstanding
balances, mainly due to economic circumstances. The Group believes that the unimpaired amounts that
are past due by more than 30 days are still collectible, based on extensive analyses of the underlying
ratings of the customers.
Based on historic default rates, management believes that, apart from the above, no significant collective
impairment allowance is necessary in respect of trade receivables and other assets that are not past due or
past due.
The allowance for impairment in respect of financial assets is used to record impairment losses unless the
Group is satisfied that no recovery of the amount owed is possible; at that point the amounts are
considered irrecoverable and are written off against the financial asset directly.
(b) Liquidity risk
Liquidity risk is the risk that the Group will encounter difficulties in meeting the obligations associated
with its financial liabilities that are settled by delivering cash or another financial asset. Various methods
of managing liquidity risk are used by individual companies in the Group.
The Group’s management focuses on methods used by financial institutions, i.e. diversification of sources
of funds. This diversification makes the Group flexible and limits its dependency on one financing source.
Liquidity risk is evaluated in particular by monitoring changes in the structure of financing and

Notes to the consolidated financial statements of EP Energy, a.s. as at and for the year ended 31 December 2015
96
comparing these changes with the Group’s liquidity risk management strategy. The Group also holds, as a
part of its liquidity risk management strategy, a portion of its assets in highly liquid funds.
Typically the Group ensures that it has sufficient cash on demand and assets within short maturity to meet
expected operational expenses for a period of 90 days, including servicing financial obligations; this
excludes the potential impact of extreme circumstances that cannot reasonably be predicted, such as
natural disasters.
The table below provides an analysis of financial assets and liabilities by relevant maturity groupings
based on the remaining period from the reporting date to the contractual maturity date. It is presented
under the most prudent consideration of maturity dates where options or repayment schedules allow for
early repayment possibilities. Therefore, in the case of liabilities, the earliest possible repayment date is
shown while for assets the latest possible repayment date is disclosed. Those assets and liabilities that do
not have a contractual maturity date are grouped together in the “undefined maturity” category.
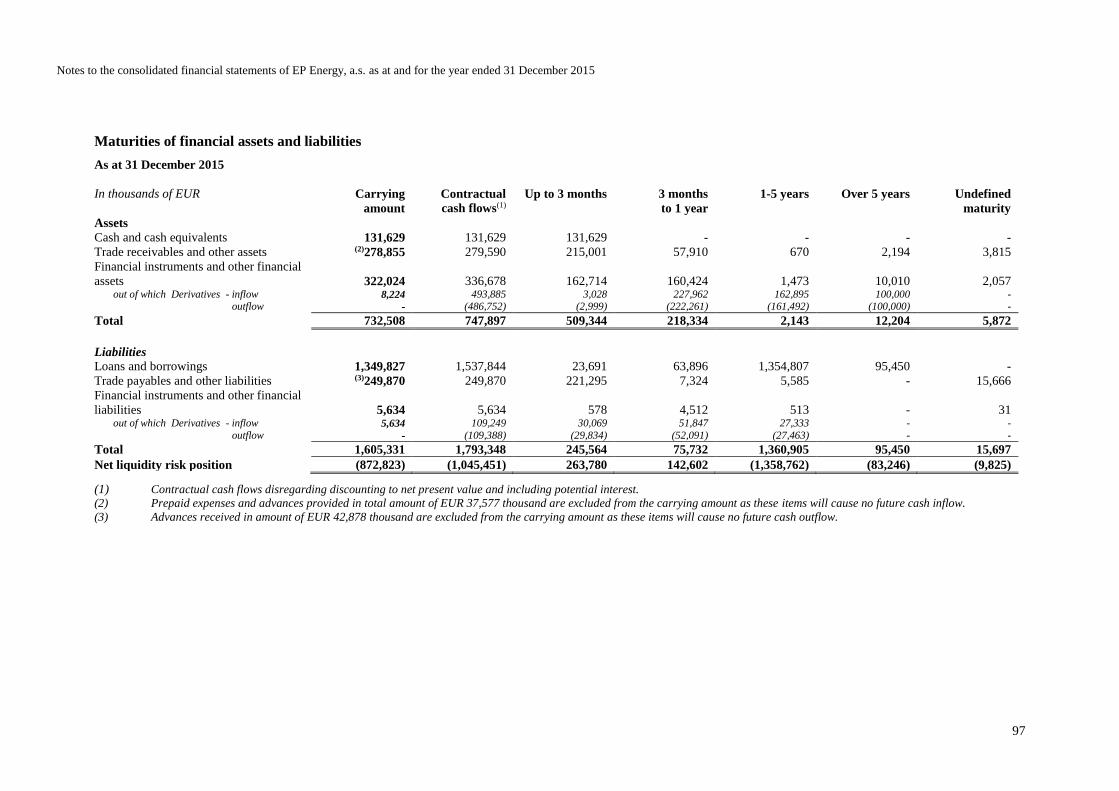
Notes to the consolidated financial statements of EP Energy, a.s. as at and for the year ended 31 December 2015
97
Maturities of financial assets and liabilities
As at 31 December 2015
In thousands of EUR Carrying
amount
Contractual
cash flows(1)
Up to 3 months 3 months
to 1 year
1-5 years Over 5 years Undefined
maturity
Assets
Cash and cash equivalents 131,629 131,629 131,629 - - - -
Trade receivables and other assets (2)278,855 279,590 215,001 57,910 670 2,194 3,815
Financial instruments and other financial
assets 322,024 336,678 162,714 160,424 1,473 10,010 2,057 out of which Derivatives - inflow 8,224 493,885 3,028 227,962 162,895 100,000 -
outflow - (486,752) (2,999) (222,261) (161,492) (100,000) -
Total 732,508 747,897 509,344 218,334 2,143 12,204 5,872
Liabilities
Loans and borrowings 1,349,827 1,537,844 23,691 63,896 1,354,807 95,450 -
Trade payables and other liabilities (3)249,870 249,870 221,295 7,324 5,585 - 15,666
Financial instruments and other financial
liabilities 5,634 5,634 578 4,512 513 - 31 out of which Derivatives - inflow 5,634 109,249 30,069 51,847 27,333 - -
outflow - (109,388) (29,834) (52,091) (27,463) - -
Total 1,605,331 1,793,348 245,564 75,732 1,360,905 95,450 15,697
Net liquidity risk position (872,823) (1,045,451) 263,780 142,602 (1,358,762) (83,246) (9,825)
(1) Contractual cash flows disregarding discounting to net present value and including potential interest. (2) Prepaid expenses and advances provided in total amount of EUR 37,577 thousand are excluded from the carrying amount as these items will cause no future cash inflow.
(3) Advances received in amount of EUR 42,878 thousand are excluded from the carrying amount as these items will cause no future cash outflow.
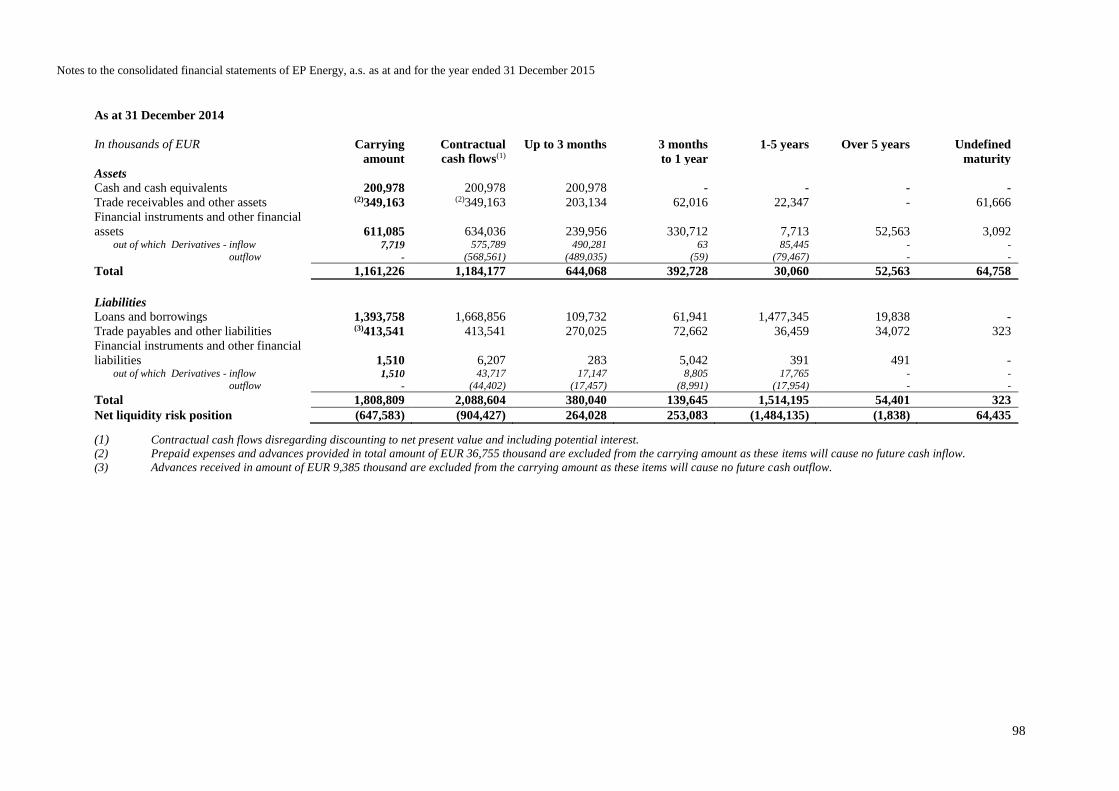
Notes to the consolidated financial statements of EP Energy, a.s. as at and for the year ended 31 December 2015
98
As at 31 December 2014
In thousands of EUR Carrying
amount
Contractual
cash flows(1)
Up to 3 months 3 months
to 1 year
1-5 years Over 5 years Undefined
maturity
Assets
Cash and cash equivalents 200,978 200,978 200,978 - - - -
Trade receivables and other assets (2)349,163 (2)349,163 203,134 62,016 22,347 - 61,666
Financial instruments and other financial
assets 611,085 634,036 239,956 330,712 7,713 52,563 3,092 out of which Derivatives - inflow 7,719 575,789 490,281 63 85,445 - -
outflow - (568,561) (489,035) (59) (79,467) - -
Total 1,161,226 1,184,177 644,068 392,728 30,060 52,563 64,758
Liabilities
Loans and borrowings 1,393,758 1,668,856 109,732 61,941 1,477,345 19,838 -
Trade payables and other liabilities (3)413,541 413,541 270,025 72,662 36,459 34,072 323
Financial instruments and other financial
liabilities 1,510 6,207 283 5,042 391 491 - out of which Derivatives - inflow 1,510 43,717 17,147 8,805 17,765 - -
outflow - (44,402) (17,457) (8,991) (17,954) - -
Total 1,808,809 2,088,604 380,040 139,645 1,514,195 54,401 323
Net liquidity risk position (647,583) (904,427) 264,028 253,083 (1,484,135) (1,838) 64,435
(1) Contractual cash flows disregarding discounting to net present value and including potential interest. (2) Prepaid expenses and advances provided in total amount of EUR 36,755 thousand are excluded from the carrying amount as these items will cause no future cash inflow.
(3) Advances received in amount of EUR 9,385 thousand are excluded from the carrying amount as these items will cause no future cash outflow.
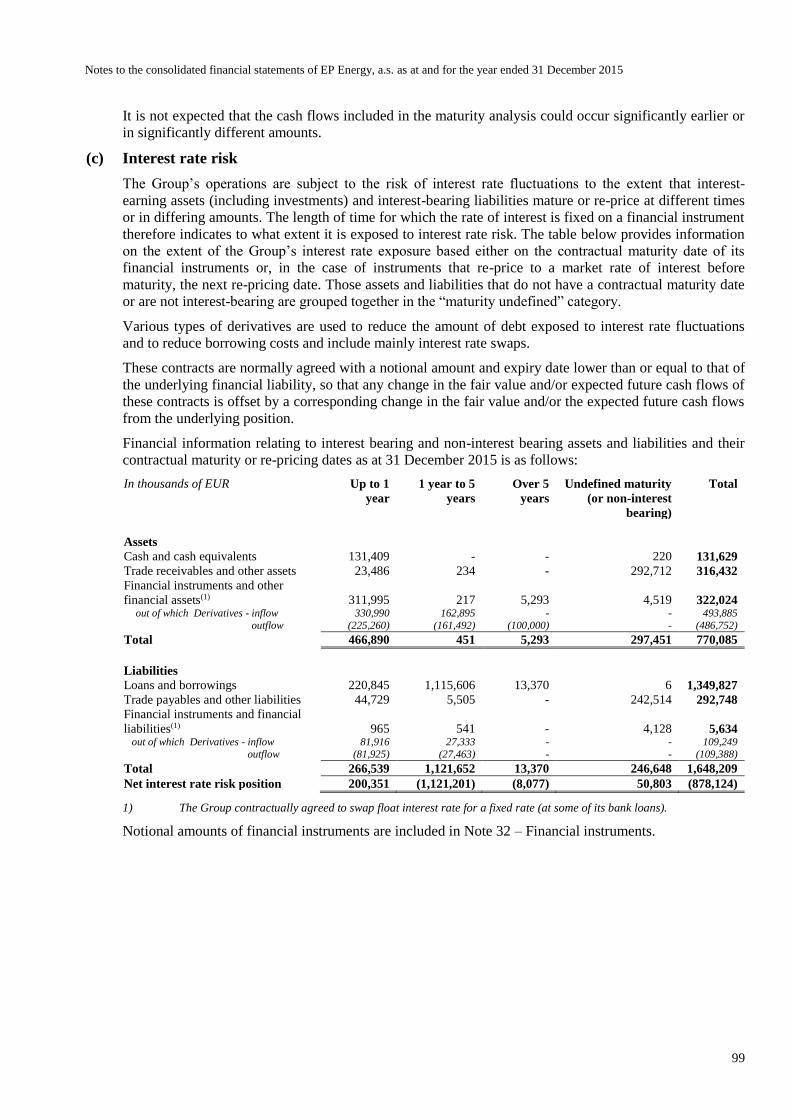
Notes to the consolidated financial statements of EP Energy, a.s. as at and for the year ended 31 December 2015
99
It is not expected that the cash flows included in the maturity analysis could occur significantly earlier or
in significantly different amounts.
(c) Interest rate risk
The Group’s operations are subject to the risk of interest rate fluctuations to the extent that interest-
earning assets (including investments) and interest-bearing liabilities mature or re-price at different times
or in differing amounts. The length of time for which the rate of interest is fixed on a financial instrument
therefore indicates to what extent it is exposed to interest rate risk. The table below provides information
on the extent of the Group’s interest rate exposure based either on the contractual maturity date of its
financial instruments or, in the case of instruments that re-price to a market rate of interest before
maturity, the next re-pricing date. Those assets and liabilities that do not have a contractual maturity date
or are not interest-bearing are grouped together in the “maturity undefined” category.
Various types of derivatives are used to reduce the amount of debt exposed to interest rate fluctuations
and to reduce borrowing costs and include mainly interest rate swaps.
These contracts are normally agreed with a notional amount and expiry date lower than or equal to that of
the underlying financial liability, so that any change in the fair value and/or expected future cash flows of
these contracts is offset by a corresponding change in the fair value and/or the expected future cash flows
from the underlying position.
Financial information relating to interest bearing and non-interest bearing assets and liabilities and their
contractual maturity or re-pricing dates as at 31 December 2015 is as follows:
In thousands of EUR Up to 1
year
1 year to 5
years
Over 5
years
Undefined maturity
(or non-interest
bearing)
Total
Assets
Cash and cash equivalents 131,409 - - 220 131,629
Trade receivables and other assets 23,486 234 - 292,712 316,432
Financial instruments and other
financial assets(1) 311,995 217 5,293 4,519 322,024 out of which Derivatives - inflow 330,990 162,895 - - 493,885
outflow (225,260) (161,492) (100,000) - (486,752)
Total 466,890 451 5,293 297,451 770,085
Liabilities
Loans and borrowings 220,845 1,115,606 13,370 6 1,349,827
Trade payables and other liabilities 44,729 5,505 - 242,514 292,748
Financial instruments and financial
liabilities(1) 965 541 - 4,128 5,634 out of which Derivatives - inflow 81,916 27,333 - - 109,249
outflow (81,925) (27,463) - - (109,388)
Total 266,539 1,121,652 13,370 246,648 1,648,209
Net interest rate risk position 200,351 (1,121,201) (8,077) 50,803 (878,124)
1) The Group contractually agreed to swap float interest rate for a fixed rate (at some of its bank loans).
Notional amounts of financial instruments are included in Note 32 – Financial instruments.

Notes to the consolidated financial statements of EP Energy, a.s. as at and for the year ended 31 December 2015
100
Interest rate risk exposure as at 31 December 2014 is as follows:
In thousands of EUR Up to 1
year
1 year to 5
years
Over 5
years
Undefined maturity
(or non-interest
bearing)
Total
Assets
Cash and cash equivalents 200,821 - - 157 200,978
Trade receivables and other assets 91,310 209 - 294,399 385,918
Financial instruments and other
financial assets(1) 550,724 182 8,288 51,891 611,085
out of which Derivatives - inflow 575,789 - - - 575,789
outflow (468,561) - (100,000) - (568,561)
Total 842,855 391 8,288 346,447 1,197,981
Liabilities
Loans and borrowings 242,136 1,135,191 11,047 5,384 1,393,758
Trade payables and other liabilities 58,251 - - 364,675 422,926
Financial instruments and financial
liabilities(1) 360 - - 1,150 1,510 out of which Derivatives - inflow 43,717 - - - 43,717
outflow (44,402) - - - (44,402)
Total 300,747 1,135,191 11,047 371,209 1,818,194
Net interest rate risk position 542,108 (1,134,800) (2,759) (24,762) (620,213)
1) The Group contractually agreed to swap float interest rate for a fixed rate (at some of its bank loans).
Notional amounts of financial instruments are included in Note 32 – Financial instruments.
Sensitivity analysis
The Group performs stress testing using a standardised interest rate shock, i.e. an immediate
decrease/increase in interest rates by 100 basis points (‘bp’) along the whole yield curve is applied to the
interest rate positions of the portfolio.
At the reporting date, a change of 100 basis points in interest rates would have increased or decreased
profit by the amounts shown in the table below. This analysis assumes that all other variables, in
particular foreign currency rates, remain constant.
In thousands of EUR
2015 2014
Decrease in interest rates by 100 bp 33,032 4,320
Increase in interest rates by 100 bp (33,032) (4,320)
The other comprehensive income impact resulting from the change of interest rate is not significant in
years 2015 and 2014.
(d) Foreign exchange risk
The Group takes on exposure to the effects of fluctuations in the prevailing foreign currency exchange
rates on its financial position and cash flows.
The Group is exposed to a currency risk on sales, purchases and borrowings that are denominated in
currency other that the respective functional currencies of Group entities, primarily EUR, USD and PLN.
Various types of derivatives are used to reduce the exchange rate risk on foreign currency assets,
liabilities and expected future cash flows. These include forward exchange contracts, most with a
maturity of less than one year.
These contracts are also normally agreed with a notional amount and expiry date equal to that of the
underlying financial liability or the expected future cash flows, so that any change in the fair value and/or
future cash flows of these contracts stemming from a potential appreciation or depreciation of the Czech
crown against other currencies is fully offset by a corresponding change in the fair value and/or the
expected future cash flows of the underlying position.

Notes to the consolidated financial statements of EP Energy, a.s. as at and for the year ended 31 December 2015
101
In respect of monetary assets and liabilities denominated in foreign currencies, the Group ensures that its
net exposure is kept to an acceptable level by buying or selling foreign currencies at spot rates when
necessary to address short-term imbalances on the single Companies level.
As at 31 December 2015, the exposure to foreign exchange risk translated to thousands of EUR was as
follows:
In thousands of EUR CZK USD EUR PLN Other Total
Assets
Cash and cash equivalents 61,528 593 69,128 - 380 131,629
Trade receivables and other assets 99,826 - 200,163 - 16,443 316,432
Financial instruments and other
financial assets 11,639 - 309,697 - 688 322,024
172,993 593 578,988 - 17,511 770,085
Off balance assets
Received promises and guarantees 20,839 - 246,152 - - 266,991
Receivables from derivative
operations 208,915 - 393,886 333 - 603,134
229,754 - 640,038 333 - 870,125
Liabilities
Loans and borrowings 15,127 - 1,334,700 - - 1,349,827
Financial instruments and other
financial liabilities 1,144 - 367 26 4,097 5,634
Trade payables and other liabilities 121,548 70 151,378 2 19,750 292,748
137,819 70 1,486,445 28 23,847 1,648,209
Off balance liabilities
Granted pledges 1,430,372 - 1,259,637 - - 2,690,009
Guarantees given 370 - 177,967 - 978 179,315
Payables related to derivative
operations 283,949 - 312,191 - - 596,140
1,714,691 - 1,749,795 - 978 3,465,464
Net foreign exchange risk position 35,174 523 (907,457) (28) (6,336) (878,124)
Off-balance sheet assets and liabilities include notional amounts of financial instruments (refer to Note 32
– Financial instruments for more details).
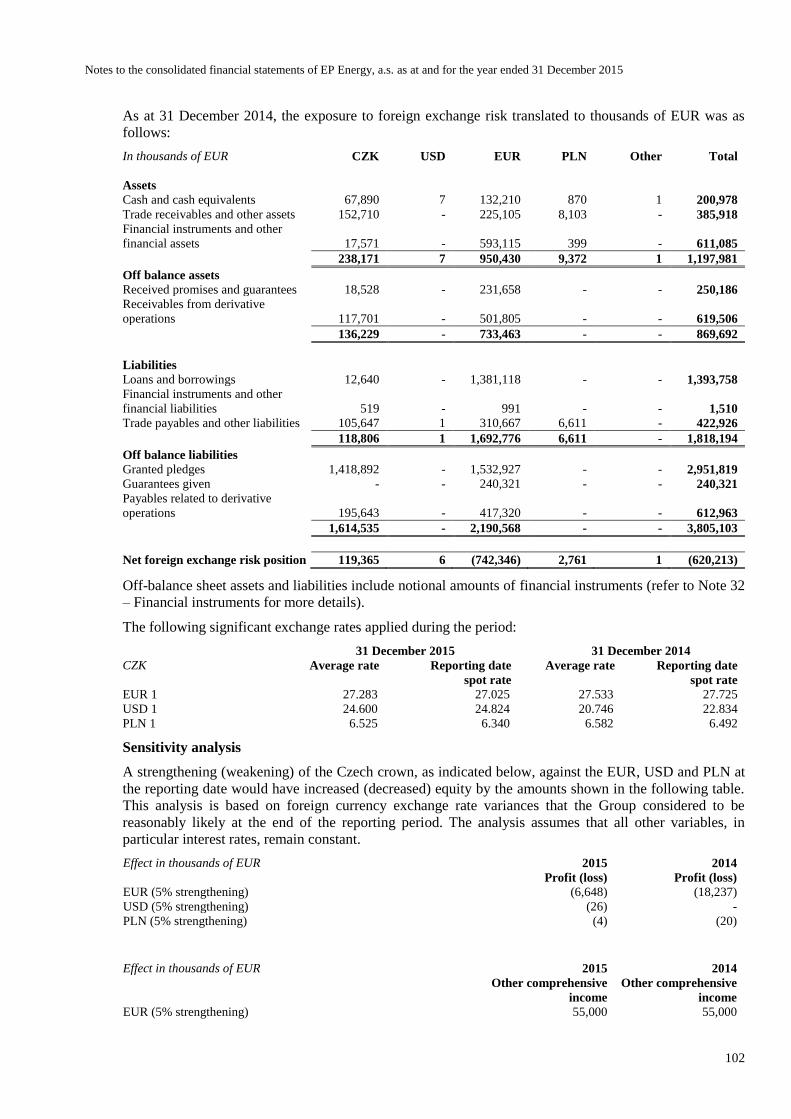
Notes to the consolidated financial statements of EP Energy, a.s. as at and for the year ended 31 December 2015
102
As at 31 December 2014, the exposure to foreign exchange risk translated to thousands of EUR was as
follows:
In thousands of EUR CZK USD EUR PLN Other Total
Assets
Cash and cash equivalents 67,890 7 132,210 870 1 200,978
Trade receivables and other assets 152,710 - 225,105 8,103 - 385,918
Financial instruments and other
financial assets 17,571 - 593,115 399 - 611,085
238,171 7 950,430 9,372 1 1,197,981
Off balance assets
Received promises and guarantees 18,528 - 231,658 - - 250,186
Receivables from derivative
operations 117,701 - 501,805 - - 619,506
136,229 - 733,463 - - 869,692
Liabilities
Loans and borrowings 12,640 - 1,381,118 - - 1,393,758
Financial instruments and other
financial liabilities 519 - 991 - - 1,510
Trade payables and other liabilities 105,647 1 310,667 6,611 - 422,926
118,806 1 1,692,776 6,611 - 1,818,194
Off balance liabilities
Granted pledges 1,418,892 - 1,532,927 - - 2,951,819
Guarantees given - - 240,321 - - 240,321
Payables related to derivative
operations 195,643 - 417,320 - - 612,963
1,614,535 - 2,190,568 - - 3,805,103
Net foreign exchange risk position 119,365 6 (742,346) 2,761 1 (620,213)
Off-balance sheet assets and liabilities include notional amounts of financial instruments (refer to Note 32
– Financial instruments for more details).
The following significant exchange rates applied during the period:
31 December 2015 31 December 2014
CZK Average rate
Reporting date
spot rate
Average rate Reporting date
spot rate
EUR 1 27.283 27.025 27.533 27.725
USD 1 24.600 24.824 20.746 22.834
PLN 1 6.525 6.340 6.582 6.492
Sensitivity analysis
A strengthening (weakening) of the Czech crown, as indicated below, against the EUR, USD and PLN at
the reporting date would have increased (decreased) equity by the amounts shown in the following table.
This analysis is based on foreign currency exchange rate variances that the Group considered to be
reasonably likely at the end of the reporting period. The analysis assumes that all other variables, in
particular interest rates, remain constant.
Effect in thousands of EUR 2015 2014
Profit (loss) Profit (loss)
EUR (5% strengthening) (6,648) (18,237)
USD (5% strengthening) (26) -
PLN (5% strengthening) (4) (20)
Effect in thousands of EUR 2015 2014
Other comprehensive
income
Other comprehensive
income
EUR (5% strengthening) 55,000 55,000
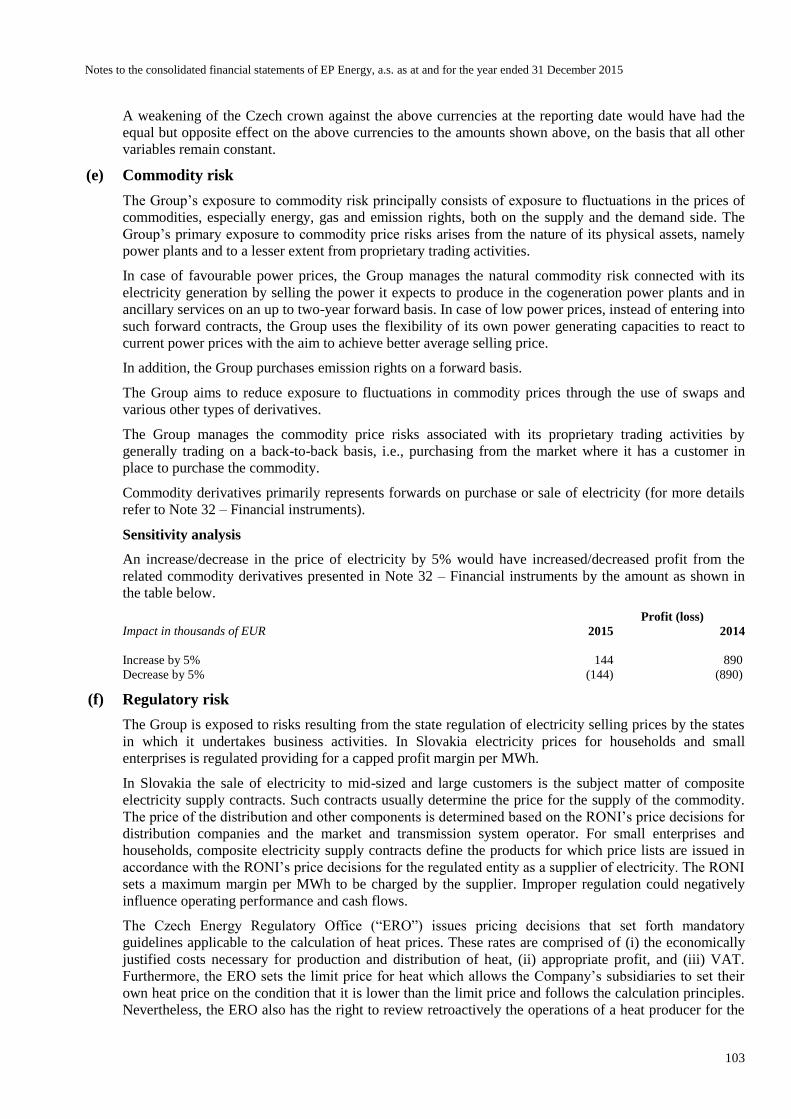
Notes to the consolidated financial statements of EP Energy, a.s. as at and for the year ended 31 December 2015
103
A weakening of the Czech crown against the above currencies at the reporting date would have had the
equal but opposite effect on the above currencies to the amounts shown above, on the basis that all other
variables remain constant.
(e) Commodity risk
The Group’s exposure to commodity risk principally consists of exposure to fluctuations in the prices of
commodities, especially energy, gas and emission rights, both on the supply and the demand side. The
Group’s primary exposure to commodity price risks arises from the nature of its physical assets, namely
power plants and to a lesser extent from proprietary trading activities.
In case of favourable power prices, the Group manages the natural commodity risk connected with its
electricity generation by selling the power it expects to produce in the cogeneration power plants and in
ancillary services on an up to two-year forward basis. In case of low power prices, instead of entering into
such forward contracts, the Group uses the flexibility of its own power generating capacities to react to
current power prices with the aim to achieve better average selling price.
In addition, the Group purchases emission rights on a forward basis.
The Group aims to reduce exposure to fluctuations in commodity prices through the use of swaps and
various other types of derivatives.
The Group manages the commodity price risks associated with its proprietary trading activities by
generally trading on a back-to-back basis, i.e., purchasing from the market where it has a customer in
place to purchase the commodity.
Commodity derivatives primarily represents forwards on purchase or sale of electricity (for more details
refer to Note 32 – Financial instruments).
Sensitivity analysis
An increase/decrease in the price of electricity by 5% would have increased/decreased profit from the
related commodity derivatives presented in Note 32 – Financial instruments by the amount as shown in
the table below.
Profit (loss)
Impact in thousands of EUR 2015 2014
Increase by 5% 144 890
Decrease by 5% (144) (890)
(f) Regulatory risk
The Group is exposed to risks resulting from the state regulation of electricity selling prices by the states
in which it undertakes business activities. In Slovakia electricity prices for households and small
enterprises is regulated providing for a capped profit margin per MWh.
In Slovakia the sale of electricity to mid-sized and large customers is the subject matter of composite
electricity supply contracts. Such contracts usually determine the price for the supply of the commodity.
The price of the distribution and other components is determined based on the RONI’s price decisions for
distribution companies and the market and transmission system operator. For small enterprises and
households, composite electricity supply contracts define the products for which price lists are issued in
accordance with the RONI’s price decisions for the regulated entity as a supplier of electricity. The RONI
sets a maximum margin per MWh to be charged by the supplier. Improper regulation could negatively
influence operating performance and cash flows.
The Czech Energy Regulatory Office (“ERO”) issues pricing decisions that set forth mandatory
guidelines applicable to the calculation of heat prices. These rates are comprised of (i) the economically
justified costs necessary for production and distribution of heat, (ii) appropriate profit, and (iii) VAT.
Furthermore, the ERO sets the limit price for heat which allows the Company’s subsidiaries to set their
own heat price on the condition that it is lower than the limit price and follows the calculation principles.
Nevertheless, the ERO also has the right to review retroactively the operations of a heat producer for the
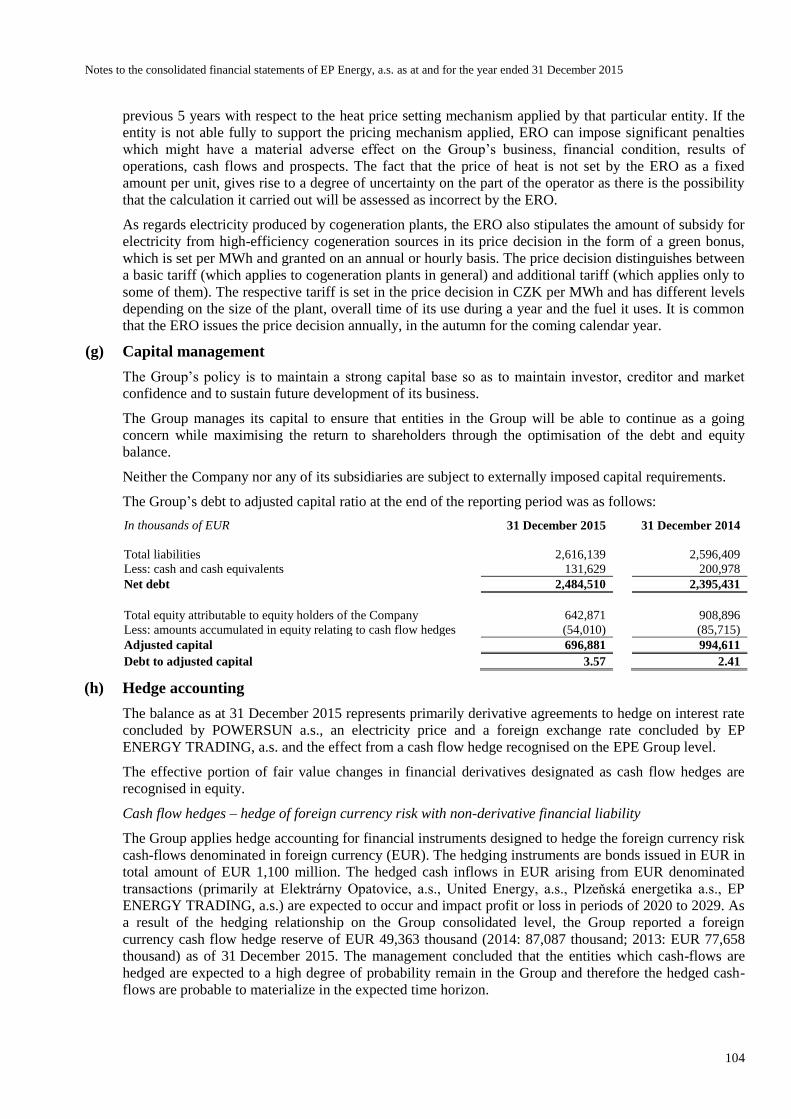
Notes to the consolidated financial statements of EP Energy, a.s. as at and for the year ended 31 December 2015
104
previous 5 years with respect to the heat price setting mechanism applied by that particular entity. If the
entity is not able fully to support the pricing mechanism applied, ERO can impose significant penalties
which might have a material adverse effect on the Group’s business, financial condition, results of
operations, cash flows and prospects. The fact that the price of heat is not set by the ERO as a fixed
amount per unit, gives rise to a degree of uncertainty on the part of the operator as there is the possibility
that the calculation it carried out will be assessed as incorrect by the ERO.
As regards electricity produced by cogeneration plants, the ERO also stipulates the amount of subsidy for
electricity from high-efficiency cogeneration sources in its price decision in the form of a green bonus,
which is set per MWh and granted on an annual or hourly basis. The price decision distinguishes between
a basic tariff (which applies to cogeneration plants in general) and additional tariff (which applies only to
some of them). The respective tariff is set in the price decision in CZK per MWh and has different levels
depending on the size of the plant, overall time of its use during a year and the fuel it uses. It is common
that the ERO issues the price decision annually, in the autumn for the coming calendar year.
(g) Capital management
The Group’s policy is to maintain a strong capital base so as to maintain investor, creditor and market
confidence and to sustain future development of its business.
The Group manages its capital to ensure that entities in the Group will be able to continue as a going
concern while maximising the return to shareholders through the optimisation of the debt and equity
balance.
Neither the Company nor any of its subsidiaries are subject to externally imposed capital requirements.
The Group’s debt to adjusted capital ratio at the end of the reporting period was as follows:
In thousands of EUR
31 December 2015 31 December 2014
Total liabilities 2,616,139 2,596,409
Less: cash and cash equivalents 131,629 200,978
Net debt 2,484,510 2,395,431
Total equity attributable to equity holders of the Company 642,871 908,896
Less: amounts accumulated in equity relating to cash flow hedges (54,010) (85,715)
Adjusted capital 696,881 994,611
Debt to adjusted capital 3.57 2.41
(h) Hedge accounting
The balance as at 31 December 2015 represents primarily derivative agreements to hedge on interest rate
concluded by POWERSUN a.s., an electricity price and a foreign exchange rate concluded by EP
ENERGY TRADING, a.s. and the effect from a cash flow hedge recognised on the EPE Group level.
The effective portion of fair value changes in financial derivatives designated as cash flow hedges are
recognised in equity.
Cash flow hedges – hedge of foreign currency risk with non-derivative financial liability
The Group applies hedge accounting for financial instruments designed to hedge the foreign currency risk
cash-flows denominated in foreign currency (EUR). The hedging instruments are bonds issued in EUR in
total amount of EUR 1,100 million. The hedged cash inflows in EUR arising from EUR denominated
transactions (primarily at Elektrárny Opatovice, a.s., United Energy, a.s., Plzeňská energetika a.s., EP
ENERGY TRADING, a.s.) are expected to occur and impact profit or loss in periods of 2020 to 2029. As
a result of the hedging relationship on the Group consolidated level, the Group reported a foreign
currency cash flow hedge reserve of EUR 49,363 thousand (2014: 87,087 thousand; 2013: EUR 77,658
thousand) as of 31 December 2015. The management concluded that the entities which cash-flows are
hedged are expected to a high degree of probability remain in the Group and therefore the hedged cash-
flows are probable to materialize in the expected time horizon.
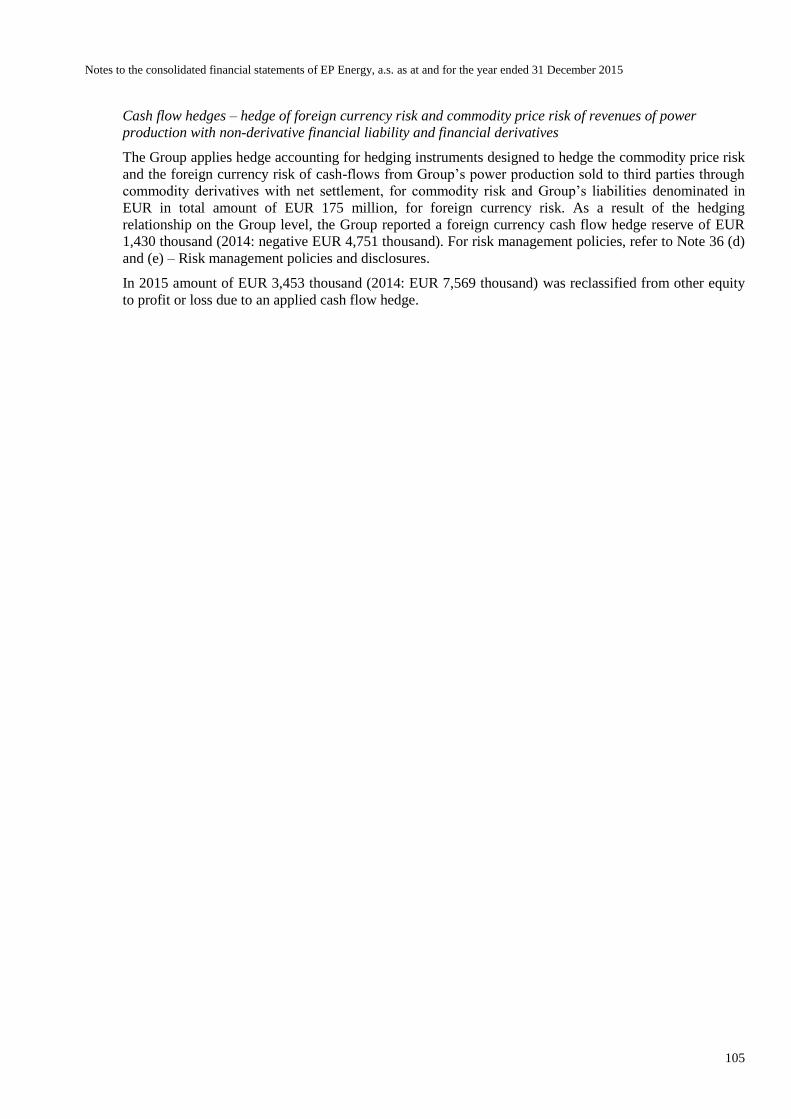
Notes to the consolidated financial statements of EP Energy, a.s. as at and for the year ended 31 December 2015
105
Cash flow hedges – hedge of foreign currency risk and commodity price risk of revenues of power
production with non-derivative financial liability and financial derivatives
The Group applies hedge accounting for hedging instruments designed to hedge the commodity price risk
and the foreign currency risk of cash-flows from Group’s power production sold to third parties through
commodity derivatives with net settlement, for commodity risk and Group’s liabilities denominated in
EUR in total amount of EUR 175 million, for foreign currency risk. As a result of the hedging
relationship on the Group level, the Group reported a foreign currency cash flow hedge reserve of EUR
1,430 thousand (2014: negative EUR 4,751 thousand). For risk management policies, refer to Note 36 (d)
and (e) – Risk management policies and disclosures.
In 2015 amount of EUR 3,453 thousand (2014: EUR 7,569 thousand) was reclassified from other equity
to profit or loss due to an applied cash flow hedge.
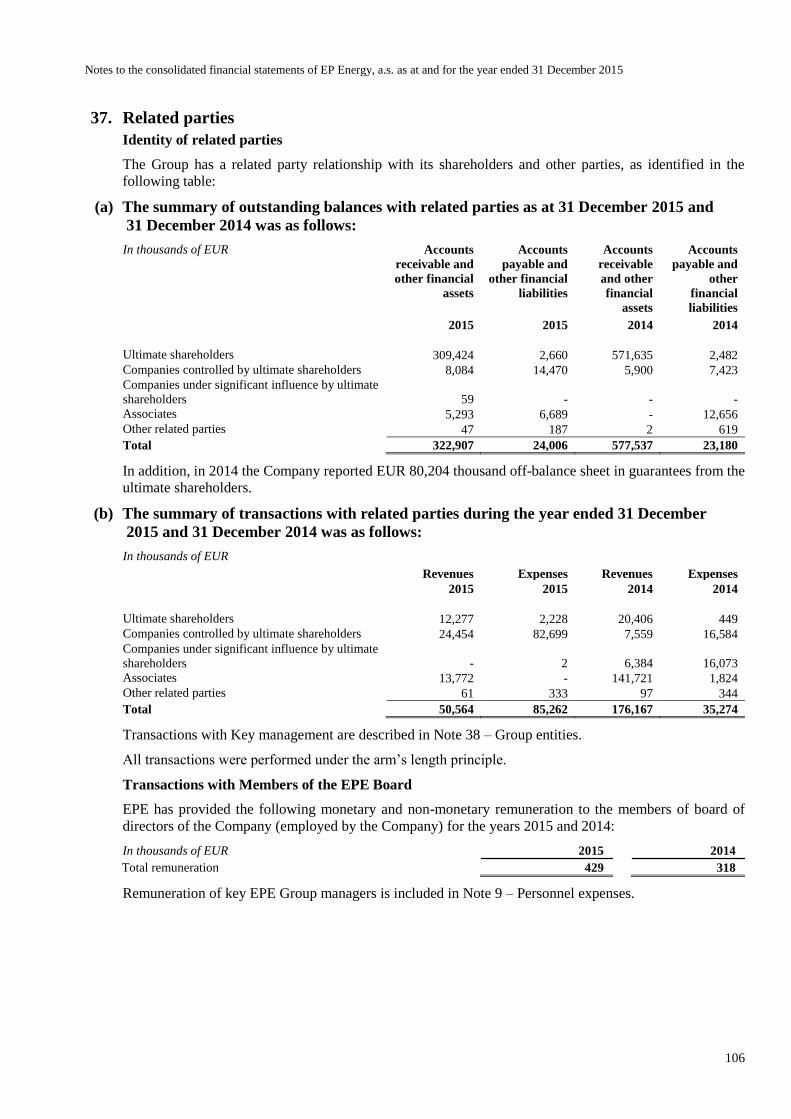
Notes to the consolidated financial statements of EP Energy, a.s. as at and for the year ended 31 December 2015
106
37. Related parties
Identity of related parties
The Group has a related party relationship with its shareholders and other parties, as identified in the
following table:
(a) The summary of outstanding balances with related parties as at 31 December 2015 and
31 December 2014 was as follows:
In thousands of EUR Accounts
receivable and
other financial
assets
Accounts
payable and
other financial
liabilities
Accounts
receivable
and other
financial
assets
Accounts
payable and
other
financial
liabilities
2015 2015 2014 2014
Ultimate shareholders 309,424 2,660 571,635 2,482
Companies controlled by ultimate shareholders 8,084 14,470 5,900 7,423
Companies under significant influence by ultimate
shareholders 59 - - -
Associates 5,293 6,689 - 12,656
Other related parties 47 187 2 619
Total 322,907 24,006 577,537 23,180
In addition, in 2014 the Company reported EUR 80,204 thousand off-balance sheet in guarantees from the
ultimate shareholders.
(b) The summary of transactions with related parties during the year ended 31 December
2015 and 31 December 2014 was as follows:
In thousands of EUR
Revenues Expenses Revenues Expenses
2015 2015 2014 2014
Ultimate shareholders 12,277 2,228 20,406 449
Companies controlled by ultimate shareholders 24,454 82,699 7,559 16,584
Companies under significant influence by ultimate
shareholders - 2 6,384 16,073
Associates 13,772 - 141,721 1,824
Other related parties 61 333 97 344
Total 50,564 85,262 176,167 35,274
Transactions with Key management are described in Note 38 – Group entities.
All transactions were performed under the arm’s length principle.
Transactions with Members of the EPE Board
EPE has provided the following monetary and non-monetary remuneration to the members of board of
directors of the Company (employed by the Company) for the years 2015 and 2014:
In thousands of EUR 2015 2014
Total remuneration 429 318
Remuneration of key EPE Group managers is included in Note 9 – Personnel expenses.

Notes to the consolidated financial statements of EP Energy, a.s. as at and for the year ended 31 December 2015
107
38. Group entities
The list of the Group entities as at 31 December 2015 and 31 December 2014 is set out below:
31 December 2015 31 December 2014 2015 2014
Country of
incorporation
Owner-
ship %
Owner-
ship
interest
Owner-
ship %
Owner-
ship
interest
Conso-
lidation
method
Conso-
lidation
method
EP Energy, a.s. Czech Republic - - - - - -
AISE, s.r.o. Czech Republic 80 Direct 80 Direct Full Full
PT Holding Investment B.V. * Netherlands 100 Direct 100 Direct Full Full
Pražská teplárenská Holding a.s. * Czech Republic 49 Direct 49 Direct Equity Equity
Pražská teplárenská a.s. Czech Republic 47.42 Direct 47.42 Direct Full Full
Pražská teplárenská Trading, a.s. Czech Republic 100 Direct 100 Direct Full Full
Termonta Praha a.s. Czech Republic 100 Direct 100 Direct Full Full
Energotrans SERVIS, a.s. Czech Republic 95 Direct 95 Direct Full Full
Teplo Neratovice, spol. s r.o. Czech Republic 100 Direct 100 Direct Full Full
RPC, a.s. Czech Republic 100 Direct 100 Direct Full Full
Pražská teplárenská LPZ, a.s. Czech Republic 100 Direct 100 Direct Full Full
Nový Veleslavín, a.s. Czech Republic 100 Direct 100 Direct Full Full
Pod Juliskou, a.s. Czech Republic 100 Direct 100 Direct Full Full
Nová Invalidovna, a.s. Czech Republic 100 Direct 100 Direct Full Full
Michelský trojúhelník, a.s. Czech Republic 100 Direct 100 Direct Full Full
Nové Modřany, a.s. Czech Republic 100 Direct 100 Direct Full Full
PT Properties I, a.s. Czech Republic 100 Direct 100 Direct Full Full
PT Properties II, a.s. Czech Republic 100 Direct 100 Direct Full Full
PT Properties III, a.s. Czech Republic 100 Direct 100 Direct Full Full
PT Properties IV, a.s. Czech Republic 100 Direct 100 Direct Full Full
PT měření, a.s. Czech Republic 47.42 Direct - - Full -
United Energy, a.s. Czech Republic 100 Direct 100 Direct Full Full
United Energy Moldova, s.r.o. Czech Republic 100 Direct 100 Direct Full Full
EKY III, a.s.(1) Czech Republic - - 100 Direct - Full
United Energy Invest, a.s. Czech Republic 100 Direct 100 Direct Full Full
EVO – Komořany, a.s. Czech Republic 100 Direct 100 Direct Full Full
Severočeská teplárenská, a.s. Czech Republic 100 Direct 100 Direct Full Full
PRVNÍ MOSTECKÁ a.s.(2) Czech Republic - - 100 Direct - Full
PRVNÍ MOSTECKÁ Servis a.s. (2) Czech Republic - - 100 Direct - Full
EP Sourcing, a.s. (former EP Coal Trading, a.s.) Czech Republic 100 Direct 100 Direct Full Full
EOP & HOKA s.r.o. Czech Republic 99.79 Direct 99.79 Direct IFRS 5 Full
EOP HOKA POLSKA SPOŁKA Z
OGRANICZONA ODPOWIEDZIALNOSCIA Poland 100 Direct 100 Direct IFRS 5 Full
EP COAL TRADING POLSKA S.A. Poland 100 Direct 100 Direct IFRS 5 Full
EP ENERGY TRADING, a.s. Czech Republic 100 Direct 100 Direct Full Full
Optimum Energy, s.r.o. Czech Republic 100 Direct - - Full -
ADCONCRETUM REAL ESTATE ltd Serbia 100 Direct 100 Direct Full Full
Plzeňská energetika a.s. Czech Republic 100 Direct 100 Direct Full Full
VTE Moldava II, a.s. * Czech Republic 100 Direct 100 Direct Full Full
MR TRUST s.r.o. * Czech Republic 99.50 Direct 99.50 Direct Full Full
VTE Moldava, a.s.(3) Czech Republic - - 100 Direct - Full
VTE Pastviny s.r.o. (3) Czech Republic - - 100 Direct - Full
EP Renewables a.s. *(4) Czech Republic - - 100 Direct - Full
Arisun, s.r.o. Slovakia 100 Direct 100 Direct Full Full
Greeninvest Energy, a.s. Czech Republic 41.70 Direct 41.70 Direct IFRS 5 IFRS 5
ČKD Blansko Wind, a.s.(4) Czech Republic - - 100 Direct - Full
POWERSUN a.s. Czech Republic 100 Direct 100 Direct Full Full
Triskata, s.r.o. Slovakia 100 Direct 100 Direct Full Full
MR TRUST s.r.o. * Czech Republic 0.50 Direct 0.50 Direct Full Full
VTE Pchery, s.r.o. Czech Republic 64 Direct 64 Direct Full Full
CHIFFON ENTERPRISES LIMITED * Cyprus 100 Direct 100 Direct Full Full
Claymore Equity, s. r. o. * Slovakia 80 Direct 80 Direct Full Full
Alternative Energy, s.r.o. Slovakia 90 Direct 90 Direct Full Full
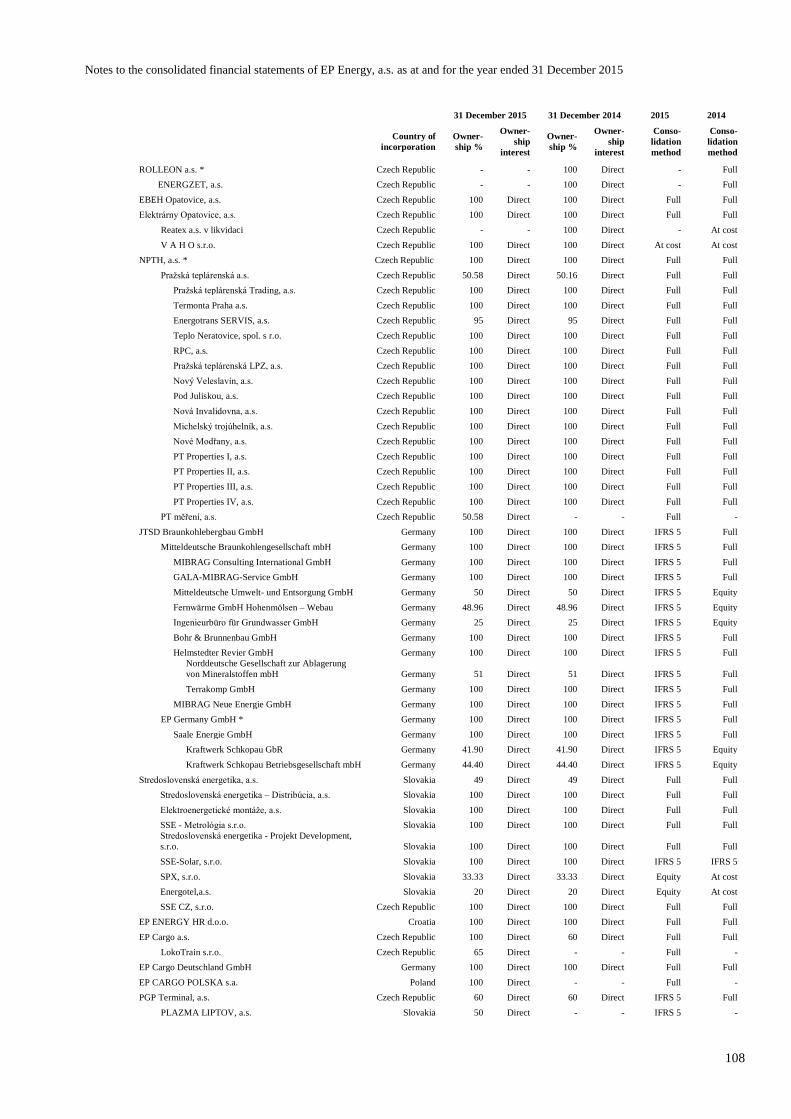
Notes to the consolidated financial statements of EP Energy, a.s. as at and for the year ended 31 December 2015
108
31 December 2015 31 December 2014 2015 2014
Country of
incorporation
Owner-
ship %
Owner-
ship
interest
Owner-
ship %
Owner-
ship
interest
Conso-
lidation
method
Conso-
lidation
method
ROLLEON a.s. * Czech Republic - - 100 Direct - Full
ENERGZET, a.s. Czech Republic - - 100 Direct - Full
EBEH Opatovice, a.s. Czech Republic 100 Direct 100 Direct Full Full
Elektrárny Opatovice, a.s. Czech Republic 100 Direct 100 Direct Full Full
Reatex a.s. v likvidaci Czech Republic - - 100 Direct - At cost
V A H O s.r.o. Czech Republic 100 Direct 100 Direct At cost At cost
NPTH, a.s. * Czech Republic 100 Direct 100 Direct Full Full
Pražská teplárenská a.s. Czech Republic 50.58 Direct 50.16 Direct Full Full
Pražská teplárenská Trading, a.s. Czech Republic 100 Direct 100 Direct Full Full
Termonta Praha a.s. Czech Republic 100 Direct 100 Direct Full Full
Energotrans SERVIS, a.s. Czech Republic 95 Direct 95 Direct Full Full
Teplo Neratovice, spol. s r.o. Czech Republic 100 Direct 100 Direct Full Full
RPC, a.s. Czech Republic 100 Direct 100 Direct Full Full
Pražská teplárenská LPZ, a.s. Czech Republic 100 Direct 100 Direct Full Full
Nový Veleslavín, a.s. Czech Republic 100 Direct 100 Direct Full Full
Pod Juliskou, a.s. Czech Republic 100 Direct 100 Direct Full Full
Nová Invalidovna, a.s. Czech Republic 100 Direct 100 Direct Full Full
Michelský trojúhelník, a.s. Czech Republic 100 Direct 100 Direct Full Full
Nové Modřany, a.s. Czech Republic 100 Direct 100 Direct Full Full
PT Properties I, a.s. Czech Republic 100 Direct 100 Direct Full Full
PT Properties II, a.s. Czech Republic 100 Direct 100 Direct Full Full
PT Properties III, a.s. Czech Republic 100 Direct 100 Direct Full Full
PT Properties IV, a.s. Czech Republic 100 Direct 100 Direct Full Full
PT měření, a.s. Czech Republic 50.58 Direct - - Full -
JTSD Braunkohlebergbau GmbH Germany 100 Direct 100 Direct IFRS 5 Full
Mitteldeutsche Braunkohlengesellschaft mbH Germany 100 Direct 100 Direct IFRS 5 Full
MIBRAG Consulting International GmbH Germany 100 Direct 100 Direct IFRS 5 Full
GALA-MIBRAG-Service GmbH Germany 100 Direct 100 Direct IFRS 5 Full
Mitteldeutsche Umwelt- und Entsorgung GmbH Germany 50 Direct 50 Direct IFRS 5 Equity
Fernwärme GmbH Hohenmölsen – Webau Germany 48.96 Direct 48.96 Direct IFRS 5 Equity
Ingenieurbüro für Grundwasser GmbH Germany 25 Direct 25 Direct IFRS 5 Equity
Bohr & Brunnenbau GmbH Germany 100 Direct 100 Direct IFRS 5 Full
Helmstedter Revier GmbH Germany 100 Direct 100 Direct IFRS 5 Full
Norddeutsche Gesellschaft zur Ablagerung
von Mineralstoffen mbH Germany 51 Direct 51 Direct IFRS 5 Full
Terrakomp GmbH Germany 100 Direct 100 Direct IFRS 5 Full
MIBRAG Neue Energie GmbH Germany 100 Direct 100 Direct IFRS 5 Full
EP Germany GmbH * Germany 100 Direct 100 Direct IFRS 5 Full
Saale Energie GmbH Germany 100 Direct 100 Direct IFRS 5 Full
Kraftwerk Schkopau GbR Germany 41.90 Direct 41.90 Direct IFRS 5 Equity
Kraftwerk Schkopau Betriebsgesellschaft mbH Germany 44.40 Direct 44.40 Direct IFRS 5 Equity
Stredoslovenská energetika, a.s. Slovakia 49 Direct 49 Direct Full Full
Stredoslovenská energetika – Distribúcia, a.s. Slovakia 100 Direct 100 Direct Full Full
Elektroenergetické montáže, a.s. Slovakia 100 Direct 100 Direct Full Full
SSE - Metrológia s.r.o. Slovakia 100 Direct 100 Direct Full Full
Stredoslovenská energetika - Projekt Development,
s.r.o. Slovakia 100 Direct 100 Direct Full Full
SSE-Solar, s.r.o. Slovakia 100 Direct 100 Direct IFRS 5 IFRS 5
SPX, s.r.o. Slovakia 33.33 Direct 33.33 Direct Equity At cost
Energotel,a.s. Slovakia 20 Direct 20 Direct Equity At cost
SSE CZ, s.r.o. Czech Republic 100 Direct 100 Direct Full Full
EP ENERGY HR d.o.o. Croatia 100 Direct 100 Direct Full Full
EP Cargo a.s. Czech Republic 100 Direct 60 Direct Full Full
LokoTrain s.r.o. Czech Republic 65 Direct - - Full -
EP Cargo Deutschland GmbH Germany 100 Direct 100 Direct Full Full
EP CARGO POLSKA s.a. Poland 100 Direct - - Full -
PGP Terminal, a.s. Czech Republic 60 Direct 60 Direct IFRS 5 Full
PLAZMA LIPTOV, a.s. Slovakia 50 Direct - - IFRS 5 -
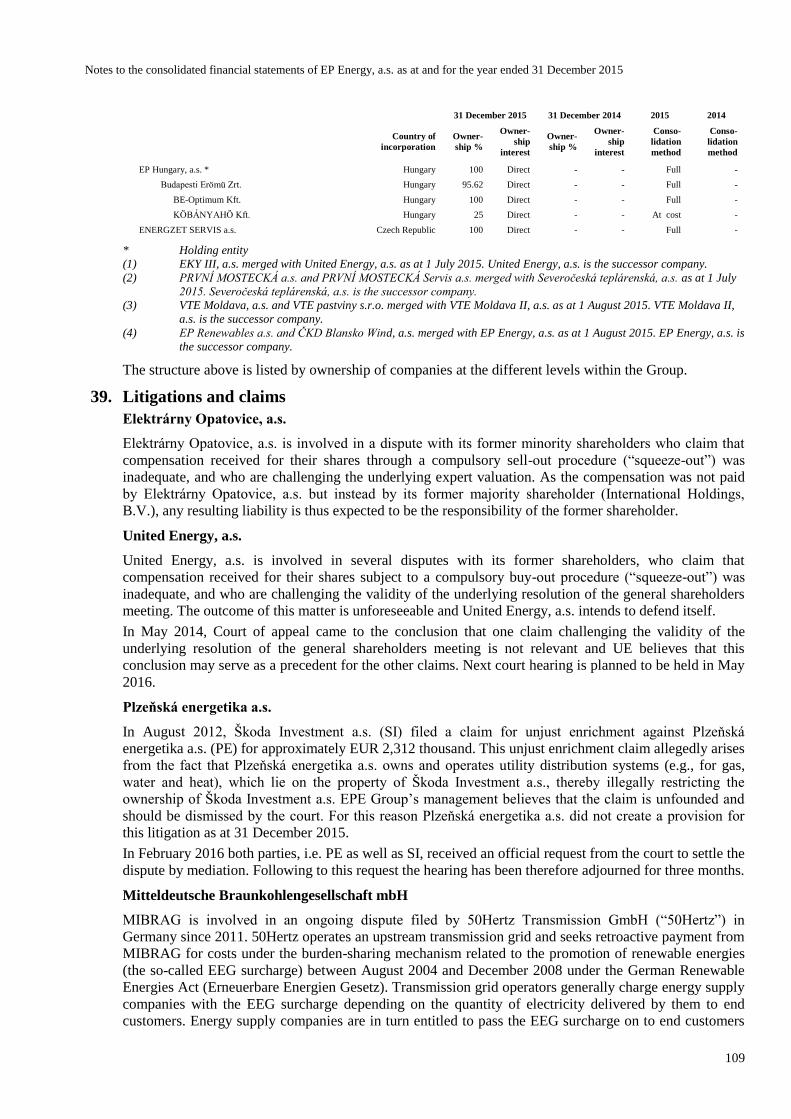
Notes to the consolidated financial statements of EP Energy, a.s. as at and for the year ended 31 December 2015
109
31 December 2015 31 December 2014 2015 2014
Country of
incorporation
Owner-
ship %
Owner-
ship
interest
Owner-
ship %
Owner-
ship
interest
Conso-
lidation
method
Conso-
lidation
method
EP Hungary, a.s. * Hungary 100 Direct - - Full -
Budapesti Erömü Zrt. Hungary 95.62 Direct - - Full -
BE-Optimum Kft. Hungary 100 Direct - - Full -
KÖBÁNYAHÖ Kft. Hungary 25 Direct - - At cost -
ENERGZET SERVIS a.s. Czech Republic 100 Direct - - Full -
* Holding entity
(1) EKY III, a.s. merged with United Energy, a.s. as at 1 July 2015. United Energy, a.s. is the successor company.
(2) PRVNÍ MOSTECKÁ a.s. and PRVNÍ MOSTECKÁ Servis a.s. merged with Severočeská teplárenská, a.s. as at 1 July
2015. Severočeská teplárenská, a.s. is the successor company.
(3) VTE Moldava, a.s. and VTE pastviny s.r.o. merged with VTE Moldava II, a.s. as at 1 August 2015. VTE Moldava II,
a.s. is the successor company.
(4) EP Renewables a.s. and ČKD Blansko Wind, a.s. merged with EP Energy, a.s. as at 1 August 2015. EP Energy, a.s. is
the successor company.
The structure above is listed by ownership of companies at the different levels within the Group.
39. Litigations and claims
Elektrárny Opatovice, a.s.
Elektrárny Opatovice, a.s. is involved in a dispute with its former minority shareholders who claim that
compensation received for their shares through a compulsory sell-out procedure (“squeeze-out”) was
inadequate, and who are challenging the underlying expert valuation. As the compensation was not paid
by Elektrárny Opatovice, a.s. but instead by its former majority shareholder (International Holdings,
B.V.), any resulting liability is thus expected to be the responsibility of the former shareholder.
United Energy, a.s.
United Energy, a.s. is involved in several disputes with its former shareholders, who claim that
compensation received for their shares subject to a compulsory buy-out procedure (“squeeze-out”) was
inadequate, and who are challenging the validity of the underlying resolution of the general shareholders
meeting. The outcome of this matter is unforeseeable and United Energy, a.s. intends to defend itself.
In May 2014, Court of appeal came to the conclusion that one claim challenging the validity of the
underlying resolution of the general shareholders meeting is not relevant and UE believes that this
conclusion may serve as a precedent for the other claims. Next court hearing is planned to be held in May
2016.
Plzeňská energetika a.s.
In August 2012, Škoda Investment a.s. (SI) filed a claim for unjust enrichment against Plzeňská
energetika a.s. (PE) for approximately EUR 2,312 thousand. This unjust enrichment claim allegedly arises
from the fact that Plzeňská energetika a.s. owns and operates utility distribution systems (e.g., for gas,
water and heat), which lie on the property of Škoda Investment a.s., thereby illegally restricting the
ownership of Škoda Investment a.s. EPE Group’s management believes that the claim is unfounded and
should be dismissed by the court. For this reason Plzeňská energetika a.s. did not create a provision for
this litigation as at 31 December 2015.
In February 2016 both parties, i.e. PE as well as SI, received an official request from the court to settle the
dispute by mediation. Following to this request the hearing has been therefore adjourned for three months.
Mitteldeutsche Braunkohlengesellschaft mbH
MIBRAG is involved in an ongoing dispute filed by 50Hertz Transmission GmbH (“50Hertz”) in
Germany since 2011. 50Hertz operates an upstream transmission grid and seeks retroactive payment from
MIBRAG for costs under the burden-sharing mechanism related to the promotion of renewable energies
(the so-called EEG surcharge) between August 2004 and December 2008 under the German Renewable
Energies Act (Erneuerbare Energien Gesetz). Transmission grid operators generally charge energy supply
companies with the EEG surcharge depending on the quantity of electricity delivered by them to end
customers. Energy supply companies are in turn entitled to pass the EEG surcharge on to end customers

Notes to the consolidated financial statements of EP Energy, a.s. as at and for the year ended 31 December 2015
110
as a part of the electricity price. In March 2013, the District Court of Halle (Landgericht Halle) rendered a
partial judgement in favour of 50Hertz ordering MIBRAG to provide detailed data on its deliveries of
electricity to end customers from August 2004 to December 2008 to allow for a calculation of EEG
surcharge payments potentially owed by MIBRAG. MIBRAG filed an appeal against the partial
judgement.
On 6 February 2014, MIBRAG´s appeal was turned down by the Higher Regional Court, however, a
further appeal of the partial judgement has been filed with the Federal Supreme Court
(Bundesgerichtshof). A final decision was made in the second quarter of 2015, the appeal was rejected
and MIBRAG was required to provide detailed data to 50Hertz for the purposes of a calculation of a
potential EEG surcharge for the above noted period. Based on MIBRAG’s analysis a provision of EUR
7,600 thousand was recorded as at 31 December 2015, which should reflect the expected payments with
respect to EEG surcharge. MIBRAG continues to analyse the situation and its potential financial impact.
Stredoslovenská energetika, a.s. Group (“SSE Group”)
The SSE Group is a party to various legal proceedings. As at 31 December 2015 no legal provisions were
recorded (2014: EUR 99 thousand). The Group management has decided not to disclose details in respect
of material legal claims as they are currently ongoing and disclosure may prejudice the SSE Group.
Based on a reasonable estimate the SSE Group´s management does not expect a significant material
impact on the SSE Group due to on-going legal proceedings.
The SSE Group further faces a claim for EUR 42,952 thousand plus lawsuit costs. Based on the legal
analysis of the case the SSE Group´s management does not expect an impact on the SSE Group and
considers the risk of failure in these proceedings to be unlikely. The SSE Group did not record any
provision related to this lawsuit.
Regulatory proceedings by ERO against Pražská teplárenská (“PT”)
PT is involved in regulatory proceedings commenced in October 2015 by ERO claiming that prices
charged to customers of PT’s local small-scale heating infrastructures in 2011 were in breach of the
Czech Act on Prices. In March 2016, ERO issued a decision ordering PT to pay EUR 8,880 thousand
(CZK 240 million) consisting of a penalty in the amount of EUR 4,440 thousand (CZK 120 million) and
restitution to affected customers in the amount of EUR 4,440 thousand (CZK 120 million). PT intends to
appeal the decision and believes that it has reasonable arguments to succeed, nevertheless it cannot be
ruled out that PT may ultimately be obliged to make the payment, regarding which no provision has yet
been created. These proceedings may be relevant but not necessarily decisive in assessing the prices
charged under similar circumstances from 2012 onwards.
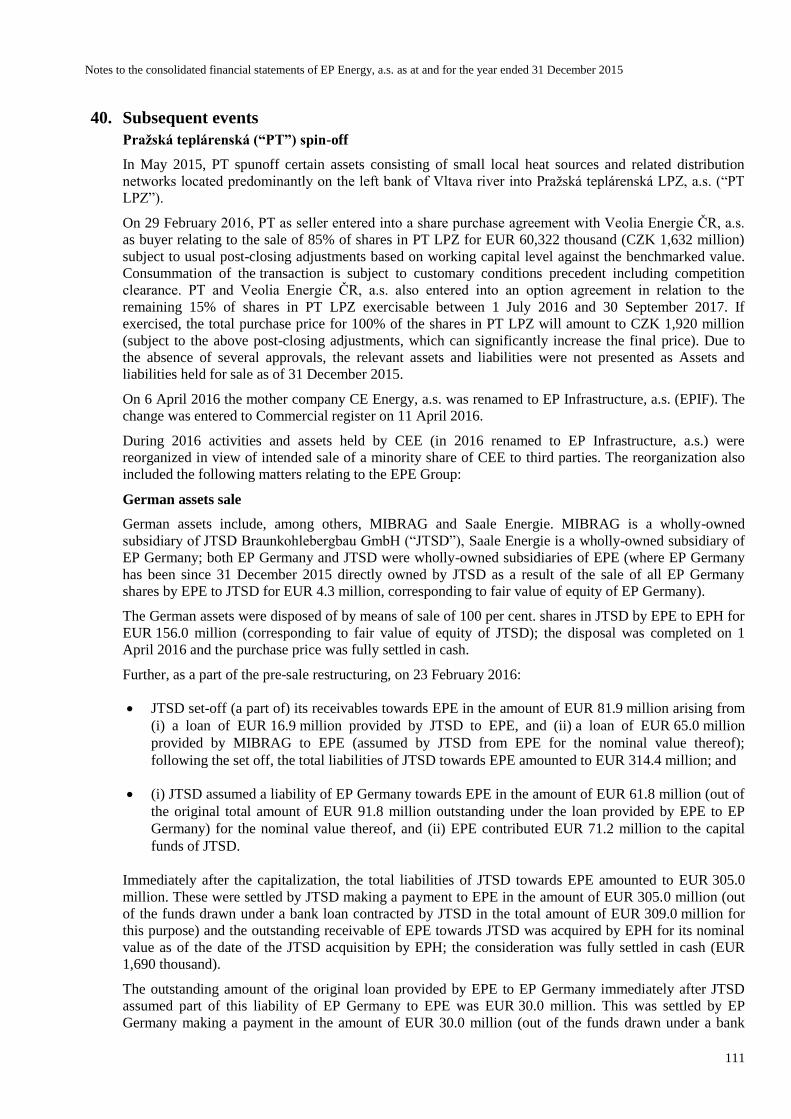
Notes to the consolidated financial statements of EP Energy, a.s. as at and for the year ended 31 December 2015
111
40. Subsequent events
Pražská teplárenská (“PT”) spin-off
In May 2015, PT spunoff certain assets consisting of small local heat sources and related distribution
networks located predominantly on the left bank of Vltava river into Pražská teplárenská LPZ, a.s. (“PT
LPZ”).
On 29 February 2016, PT as seller entered into a share purchase agreement with Veolia Energie ČR, a.s.
as buyer relating to the sale of 85% of shares in PT LPZ for EUR 60,322 thousand (CZK 1,632 million)
subject to usual post-closing adjustments based on working capital level against the benchmarked value.
Consummation of the transaction is subject to customary conditions precedent including competition
clearance. PT and Veolia Energie ČR, a.s. also entered into an option agreement in relation to the
remaining 15% of shares in PT LPZ exercisable between 1 July 2016 and 30 September 2017. If
exercised, the total purchase price for 100% of the shares in PT LPZ will amount to CZK 1,920 million
(subject to the above post-closing adjustments, which can significantly increase the final price). Due to
the absence of several approvals, the relevant assets and liabilities were not presented as Assets and
liabilities held for sale as of 31 December 2015.
On 6 April 2016 the mother company CE Energy, a.s. was renamed to EP Infrastructure, a.s. (EPIF). The
change was entered to Commercial register on 11 April 2016.
During 2016 activities and assets held by CEE (in 2016 renamed to EP Infrastructure, a.s.) were
reorganized in view of intended sale of a minority share of CEE to third parties. The reorganization also
included the following matters relating to the EPE Group:
German assets sale
German assets include, among others, MIBRAG and Saale Energie. MIBRAG is a wholly-owned
subsidiary of JTSD Braunkohlebergbau GmbH (“JTSD”), Saale Energie is a wholly-owned subsidiary of
EP Germany; both EP Germany and JTSD were wholly-owned subsidiaries of EPE (where EP Germany
has been since 31 December 2015 directly owned by JTSD as a result of the sale of all EP Germany
shares by EPE to JTSD for EUR 4.3 million, corresponding to fair value of equity of EP Germany).
The German assets were disposed of by means of sale of 100 per cent. shares in JTSD by EPE to EPH for
EUR 156.0 million (corresponding to fair value of equity of JTSD); the disposal was completed on 1
April 2016 and the purchase price was fully settled in cash.
Further, as a part of the pre-sale restructuring, on 23 February 2016:
JTSD set-off (a part of) its receivables towards EPE in the amount of EUR 81.9 million arising from
(i) a loan of EUR 16.9 million provided by JTSD to EPE, and (ii) a loan of EUR 65.0 million
provided by MIBRAG to EPE (assumed by JTSD from EPE for the nominal value thereof);
following the set off, the total liabilities of JTSD towards EPE amounted to EUR 314.4 million; and
(i) JTSD assumed a liability of EP Germany towards EPE in the amount of EUR 61.8 million (out of
the original total amount of EUR 91.8 million outstanding under the loan provided by EPE to EP
Germany) for the nominal value thereof, and (ii) EPE contributed EUR 71.2 million to the capital
funds of JTSD.
Immediately after the capitalization, the total liabilities of JTSD towards EPE amounted to EUR 305.0
million. These were settled by JTSD making a payment to EPE in the amount of EUR 305.0 million (out
of the funds drawn under a bank loan contracted by JTSD in the total amount of EUR 309.0 million for
this purpose) and the outstanding receivable of EPE towards JTSD was acquired by EPH for its nominal
value as of the date of the JTSD acquisition by EPH; the consideration was fully settled in cash (EUR
1,690 thousand).
The outstanding amount of the original loan provided by EPE to EP Germany immediately after JTSD
assumed part of this liability of EP Germany to EPE was EUR 30.0 million. This was settled by EP
Germany making a payment in the amount of EUR 30.0 million (out of the funds drawn under a bank
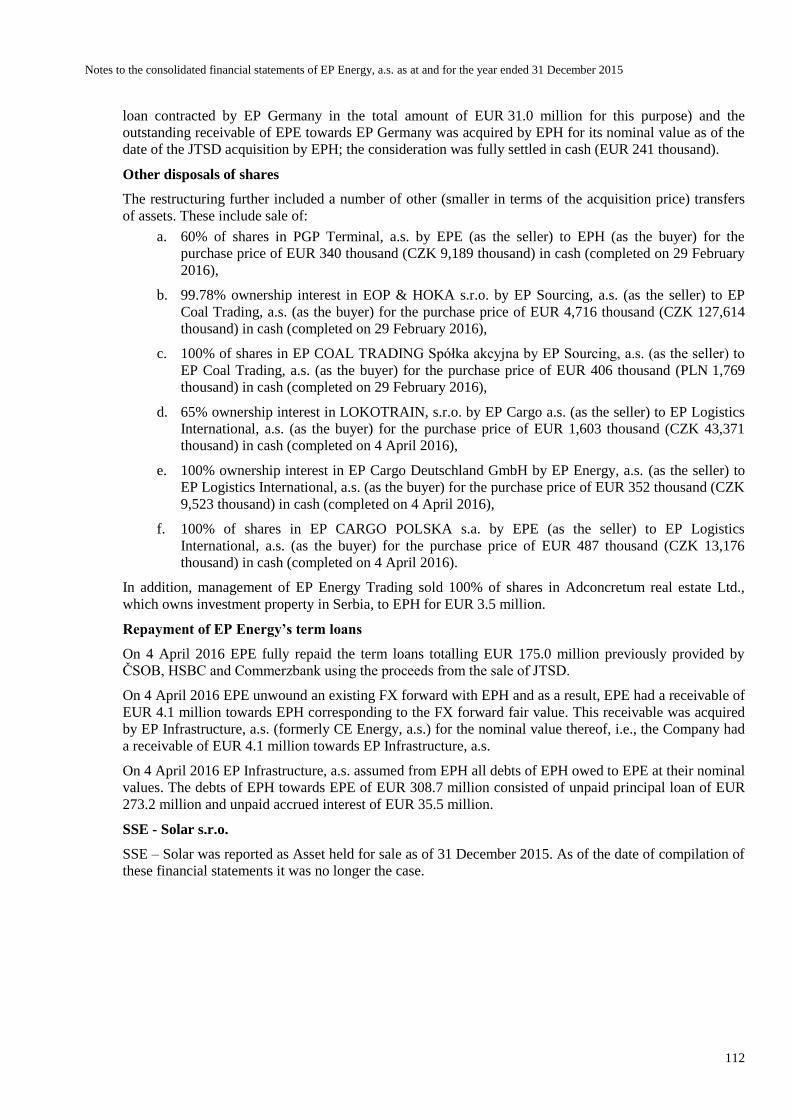
Notes to the consolidated financial statements of EP Energy, a.s. as at and for the year ended 31 December 2015
112
loan contracted by EP Germany in the total amount of EUR 31.0 million for this purpose) and the
outstanding receivable of EPE towards EP Germany was acquired by EPH for its nominal value as of the
date of the JTSD acquisition by EPH; the consideration was fully settled in cash (EUR 241 thousand).
Other disposals of shares
The restructuring further included a number of other (smaller in terms of the acquisition price) transfers
of assets. These include sale of:
a. 60% of shares in PGP Terminal, a.s. by EPE (as the seller) to EPH (as the buyer) for the
purchase price of EUR 340 thousand (CZK 9,189 thousand) in cash (completed on 29 February
2016),
b. 99.78% ownership interest in EOP & HOKA s.r.o. by EP Sourcing, a.s. (as the seller) to EP
Coal Trading, a.s. (as the buyer) for the purchase price of EUR 4,716 thousand (CZK 127,614
thousand) in cash (completed on 29 February 2016),
c. 100% of shares in EP COAL TRADING Spółka akcyjna by EP Sourcing, a.s. (as the seller) to
EP Coal Trading, a.s. (as the buyer) for the purchase price of EUR 406 thousand (PLN 1,769
thousand) in cash (completed on 29 February 2016),
d. 65% ownership interest in LOKOTRAIN, s.r.o. by EP Cargo a.s. (as the seller) to EP Logistics
International, a.s. (as the buyer) for the purchase price of EUR 1,603 thousand (CZK 43,371
thousand) in cash (completed on 4 April 2016),
e. 100% ownership interest in EP Cargo Deutschland GmbH by EP Energy, a.s. (as the seller) to
EP Logistics International, a.s. (as the buyer) for the purchase price of EUR 352 thousand (CZK
9,523 thousand) in cash (completed on 4 April 2016),
f. 100% of shares in EP CARGO POLSKA s.a. by EPE (as the seller) to EP Logistics
International, a.s. (as the buyer) for the purchase price of EUR 487 thousand (CZK 13,176
thousand) in cash (completed on 4 April 2016).
In addition, management of EP Energy Trading sold 100% of shares in Adconcretum real estate Ltd.,
which owns investment property in Serbia, to EPH for EUR 3.5 million.
Repayment of EP Energy’s term loans
On 4 April 2016 EPE fully repaid the term loans totalling EUR 175.0 million previously provided by
ČSOB, HSBC and Commerzbank using the proceeds from the sale of JTSD.
On 4 April 2016 EPE unwound an existing FX forward with EPH and as a result, EPE had a receivable of
EUR 4.1 million towards EPH corresponding to the FX forward fair value. This receivable was acquired
by EP Infrastructure, a.s. (formerly CE Energy, a.s.) for the nominal value thereof, i.e., the Company had
a receivable of EUR 4.1 million towards EP Infrastructure, a.s.
On 4 April 2016 EP Infrastructure, a.s. assumed from EPH all debts of EPH owed to EPE at their nominal
values. The debts of EPH towards EPE of EUR 308.7 million consisted of unpaid principal loan of EUR
273.2 million and unpaid accrued interest of EUR 35.5 million.
SSE - Solar s.r.o.
SSE – Solar was reported as Asset held for sale as of 31 December 2015. As of the date of compilation of
these financial statements it was no longer the case.


Notes to the consolidated financial statements of EP Energy, a.s. as at and for the year ended 31 December 2015
114
Appendix 1 – Business combinations
The following tables provide further information on the amounts recognised for assets acquired and
liabilities assumed as at the acquisition date for individually significant business combinations through
step acquisitions and acquisitions.
Effect of acquisitions
i. 31 December 2015
The fair value of the consideration transferred and the amounts recognised for assets acquired and
liabilities assumed as at the acquisition date of Budapesti Erömü Zrt. (BERT) are provided in the
following table.
In thousands of EUR Carrying
amount(1)
Fair value
adjustment
2015
Total(1)
Property, plant, equipment, land, buildings 99,205 (48,523) 50,682
Intangible assets 3,003 16,693 19,696
Trade receivables and other assets 17,908 - 17,908
Financial instruments – assets 673 - 673
Inventories 6,114 - 6,114
Cash and cash equivalents 11,891 - 11,891
Provisions (6,379) (6,379)
Deferred tax liabilities (1,137) (7,974) (9,111)
Loans and borrowings (69,032) 40,281 (28,751)
Financial instruments – liabilities (4,119) - (4,119)
Trade payables and other liabilities (18,499) - (18,499)
Net identifiable assets and liabilities 39,628 477 40,105
Non-controlling interest (1,516)
Goodwill on acquisitions of a subsidiary -
Negative goodwill on acquisition of new subsidiaries (33,085)
Pricing differences in equity -
Cost of acquisition 5,504
Consideration paid, satisfied in cash (A) -
Consideration, other 5,504
Total consideration transferred 5,504
Less: Cash acquired (B) 11,891
Net cash inflow (outflow) (C) = (B – A) 11,891
(1) Represents values at 100% share.
In thousands of EUR 2015 Total
Revenue of the acquirees recognised since the acquisition date (subsidiaries) 24,555
Profit (loss) of the acquirees recognised since the acquisition date (subsidiaries) 2,997
In thousands of EUR 2015 Total
Revenue of the acquirees recognised in the year ended 31 December 2015 (subsidiaries)* 175,492
Profit (loss) of the acquirees recognised in the year ended 31 December 2015 (subsidiaries)* (26,493)
* Before intercompany elimination; based on local statutory financial information which include a significant one-off
non-cash assets write-off.
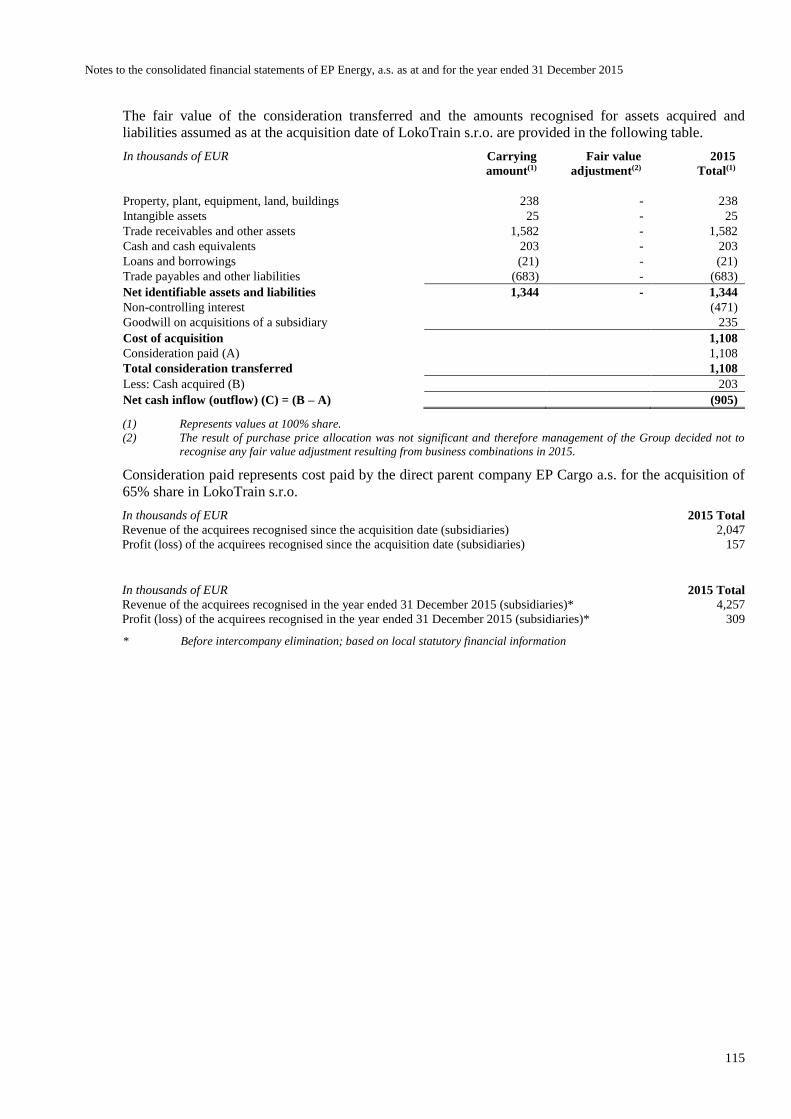
Notes to the consolidated financial statements of EP Energy, a.s. as at and for the year ended 31 December 2015
115
The fair value of the consideration transferred and the amounts recognised for assets acquired and
liabilities assumed as at the acquisition date of LokoTrain s.r.o. are provided in the following table.
In thousands of EUR Carrying
amount(1)
Fair value
adjustment(2)
2015
Total(1)
Property, plant, equipment, land, buildings 238 - 238
Intangible assets 25 - 25
Trade receivables and other assets 1,582 - 1,582
Cash and cash equivalents 203 - 203
Loans and borrowings (21) - (21)
Trade payables and other liabilities (683) - (683)
Net identifiable assets and liabilities 1,344 - 1,344
Non-controlling interest (471)
Goodwill on acquisitions of a subsidiary 235
Cost of acquisition 1,108
Consideration paid (A) 1,108
Total consideration transferred 1,108
Less: Cash acquired (B) 203
Net cash inflow (outflow) (C) = (B – A) (905)
(1) Represents values at 100% share.
(2) The result of purchase price allocation was not significant and therefore management of the Group decided not to
recognise any fair value adjustment resulting from business combinations in 2015.
Consideration paid represents cost paid by the direct parent company EP Cargo a.s. for the acquisition of
65% share in LokoTrain s.r.o.
In thousands of EUR 2015 Total
Revenue of the acquirees recognised since the acquisition date (subsidiaries) 2,047
Profit (loss) of the acquirees recognised since the acquisition date (subsidiaries) 157
In thousands of EUR 2015 Total
Revenue of the acquirees recognised in the year ended 31 December 2015 (subsidiaries)* 4,257
Profit (loss) of the acquirees recognised in the year ended 31 December 2015 (subsidiaries)* 309
* Before intercompany elimination; based on local statutory financial information

Notes to the consolidated financial statements of EP Energy, a.s. as at and for the year ended 31 December 2015
116
The fair value of the consideration transferred and the amounts recognised for assets acquired and
liabilities assumed as at the acquisition date of Optimum Energy, s.r.o. are provided in the following
table.
In thousands of EUR Carrying
amount
Fair value
adjustment(1)
2015
Total
Trade receivables and other assets 10,506 - 10,506
Cash and cash equivalents 2,150 - 2,150
Trade payables and other liabilities (12,186) - (12,186)
Net identifiable assets and liabilities 470 - 470
Non-controlling interest -
Goodwill on acquisitions of a subsidiary 4,420
Cost of acquisition 4,890
Consideration paid (A) 4,890
Total consideration transferred 4,890
Less: Cash acquired (B) 2,150
Net cash inflow (outflow) (C) = (B – A) (2,740)
(1) The result of purchase price allocation was not significant and therefore management of the Group decided not to
recognise any fair value adjustment resulting from business combinations in 2015.
Consideration paid represents cost paid by the direct parent company EP ENERGY TRADING, a.s. for
the acquisition of 100% share in Optimum Energy, s.r.o.
In thousands of EUR 2015 Total
Revenue of the acquirees recognised since the acquisition date (subsidiaries) 5,565
Profit (loss) of the acquirees recognised since the acquisition date (subsidiaries) 351
In thousands of EUR 2015 Total
Revenue of the acquirees recognised in the year ended 31 December 2015 (subsidiaries)* 17,508
Profit (loss) of the acquirees recognised in the year ended 31 December 2015 (subsidiaries)* 692
* Before intercompany elimination; based on local statutory financial information
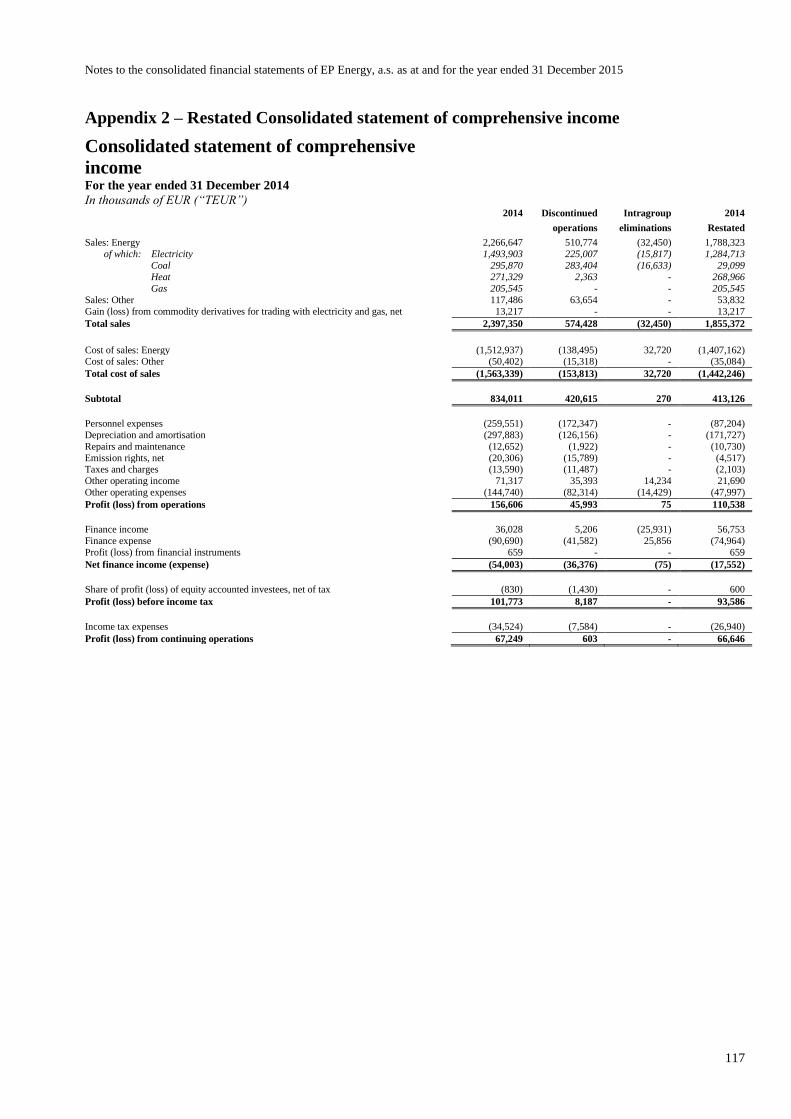
Notes to the consolidated financial statements of EP Energy, a.s. as at and for the year ended 31 December 2015
117
Appendix 2 – Restated Consolidated statement of comprehensive income
Consolidated statement of comprehensive
income
For the year ended 31 December 2014
In thousands of EUR (“TEUR”)
2014 Discontinued Intragroup 2014
operations eliminations Restated
Sales: Energy 2,266,647 510,774 (32,450) 1,788,323
of which: Electricity 1,493,903 225,007 (15,817) 1,284,713
Coal 295,870 283,404 (16,633) 29,099
Heat 271,329 2,363 - 268,966
Gas 205,545 - - 205,545
Sales: Other 117,486 63,654 - 53,832
Gain (loss) from commodity derivatives for trading with electricity and gas, net 13,217 - - 13,217
Total sales 2,397,350 574,428 (32,450) 1,855,372
Cost of sales: Energy (1,512,937) (138,495) 32,720 (1,407,162) Cost of sales: Other (50,402) (15,318) - (35,084)
Total cost of sales (1,563,339) (153,813) 32,720 (1,442,246)
Subtotal 834,011 420,615 270 413,126
Personnel expenses (259,551) (172,347) - (87,204)
Depreciation and amortisation (297,883) (126,156) - (171,727)
Repairs and maintenance (12,652) (1,922) - (10,730)
Emission rights, net (20,306) (15,789) - (4,517) Taxes and charges (13,590) (11,487) - (2,103)
Other operating income 71,317 35,393 14,234 21,690
Other operating expenses (144,740) (82,314) (14,429) (47,997)
Profit (loss) from operations 156,606 45,993 75 110,538
Finance income 36,028 5,206 (25,931) 56,753
Finance expense (90,690) (41,582) 25,856 (74,964)
Profit (loss) from financial instruments 659 - - 659
Net finance income (expense) (54,003) (36,376) (75) (17,552)
Share of profit (loss) of equity accounted investees, net of tax (830) (1,430) - 600
Profit (loss) before income tax 101,773 8,187 - 93,586
Income tax expenses (34,524) (7,584) - (26,940)
Profit (loss) from continuing operations 67,249 603 - 66,646

Notes to the consolidated financial statements of EP Energy, a.s. as at and for the year ended 31 December 2015
118
Appendix 3 – Analysis of results from discontinued operations
For the year ended 31 December 2015 2014
In thousands of EUR (“TEUR”)
Discontinued
operations after
inter-company
eliminations
Discontinued
operations after
inter-company
eliminations Discontinued operations
Sales: Energy 499,026 510,774 of which: Coal 260,613 283,404
Electricity 235,978 225,007 Heat 2,435 2,363
Sales: Other 63,959 63,654
Total sales 562,985 574,428
Cost of sales: Energy (138,063) (138,495) Cost of sales: Other (30,231) (15,318)
Total cost of sales (168,294) (153,813)
Subtotal 394,691 420,615
Personnel expenses (184,026) (172,347)
Depreciation and amortisation (124,922) (126,156) Repairs and maintenance 6,350 (1,922)
Emission rights, net (22,091) (15,789)
Taxes and charges (9,949) (11,487) Other operating income 35,851 35,393
Other operating expenses (85,433) (82,314)
Profit (loss) from operations 10,471 45,993
Finance income 5,356 5,206 Finance expense (37,890) (41,582)
Net finance income (expense) (32,534) (36,376)
Share of profit (loss) of equity accounted investees, net of tax (884) (1,430)
Profit (loss) before income tax (22,947) 8,187
Income tax expenses 2,982 (7,584)
Profit (loss) from discontinued operations (19,965) 603
Profit (loss) attributable to: Owners of the Company (20,339) 422
Non-controlling interest 374 181
Profit (loss) for the year (19,965) 603
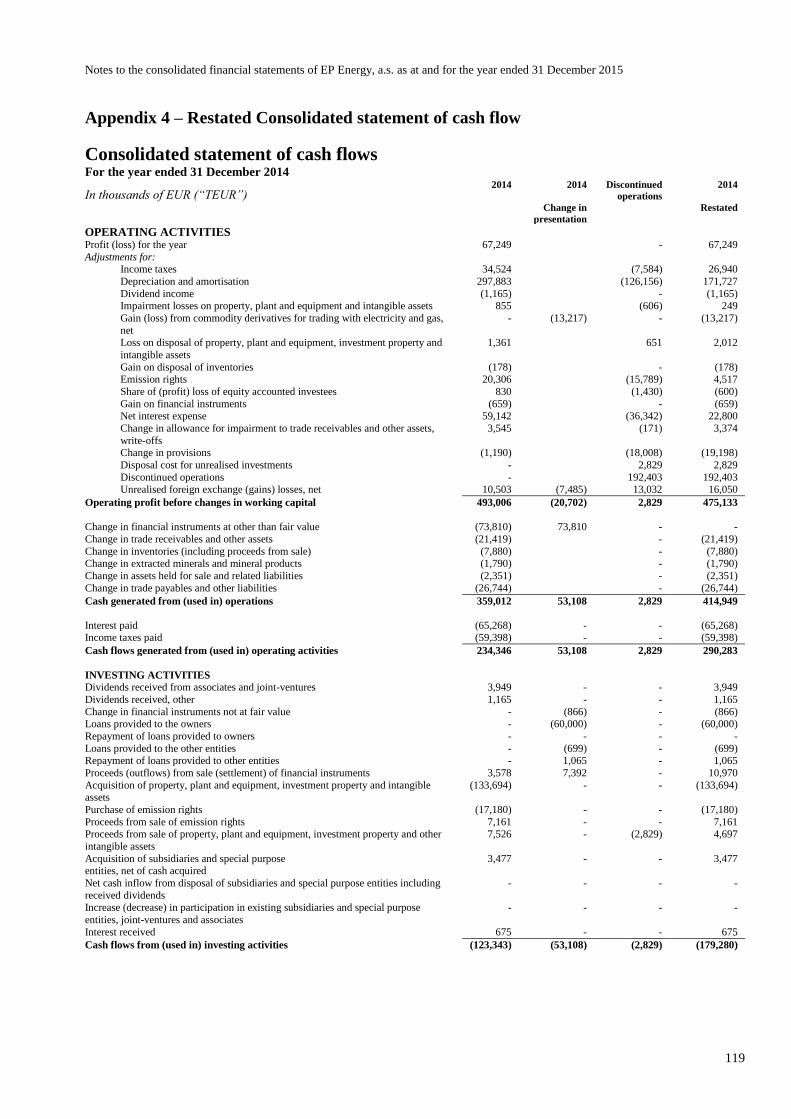
Notes to the consolidated financial statements of EP Energy, a.s. as at and for the year ended 31 December 2015
119
Appendix 4 – Restated Consolidated statement of cash flow
Consolidated statement of cash flows For the year ended 31 December 2014
In thousands of EUR (“TEUR”) 2014 2014 Discontinued
operations
2014
Change in
presentation Restated
OPERATING ACTIVITIES Profit (loss) for the year 67,249 - 67,249
Adjustments for: Income taxes 34,524 (7,584) 26,940
Depreciation and amortisation 297,883 (126,156) 171,727
Dividend income (1,165) - (1,165) Impairment losses on property, plant and equipment and intangible assets 855 (606) 249
Gain (loss) from commodity derivatives for trading with electricity and gas,
net
- (13,217) - (13,217)
Loss on disposal of property, plant and equipment, investment property and
intangible assets
1,361 651 2,012
Gain on disposal of inventories (178) - (178) Emission rights 20,306 (15,789) 4,517
Share of (profit) loss of equity accounted investees 830 (1,430) (600)
Gain on financial instruments (659) - (659) Net interest expense 59,142 (36,342) 22,800
Change in allowance for impairment to trade receivables and other assets,
write-offs
3,545 (171) 3,374
Change in provisions (1,190) (18,008) (19,198)
Disposal cost for unrealised investments - 2,829 2,829
Discontinued operations - 192,403 192,403
Unrealised foreign exchange (gains) losses, net 10,503 (7,485) 13,032 16,050
Operating profit before changes in working capital 493,006 (20,702) 2,829 475,133
Change in financial instruments at other than fair value (73,810) 73,810 - -
Change in trade receivables and other assets (21,419) - (21,419)
Change in inventories (including proceeds from sale) (7,880) - (7,880) Change in extracted minerals and mineral products (1,790) - (1,790)
Change in assets held for sale and related liabilities (2,351) - (2,351)
Change in trade payables and other liabilities (26,744) - (26,744)
Cash generated from (used in) operations 359,012 53,108 2,829 414,949
Interest paid (65,268) - - (65,268) Income taxes paid (59,398) - - (59,398)
Cash flows generated from (used in) operating activities 234,346 53,108 2,829 290,283
INVESTING ACTIVITIES
Dividends received from associates and joint-ventures 3,949 - - 3,949
Dividends received, other 1,165 - - 1,165
Change in financial instruments not at fair value - (866) - (866) Loans provided to the owners - (60,000) - (60,000)
Repayment of loans provided to owners - - - -
Loans provided to the other entities - (699) - (699) Repayment of loans provided to other entities - 1,065 - 1,065
Proceeds (outflows) from sale (settlement) of financial instruments 3,578 7,392 - 10,970
Acquisition of property, plant and equipment, investment property and intangible assets
(133,694) - - (133,694)
Purchase of emission rights (17,180) - - (17,180)
Proceeds from sale of emission rights 7,161 - - 7,161 Proceeds from sale of property, plant and equipment, investment property and other
intangible assets
7,526 - (2,829) 4,697
Acquisition of subsidiaries and special purpose entities, net of cash acquired
3,477 - - 3,477
Net cash inflow from disposal of subsidiaries and special purpose entities including
received dividends
- - - -
Increase (decrease) in participation in existing subsidiaries and special purpose
entities, joint-ventures and associates
- - - -
Interest received 675 - - 675
Cash flows from (used in) investing activities (123,343) (53,108) (2,829) (179,280)
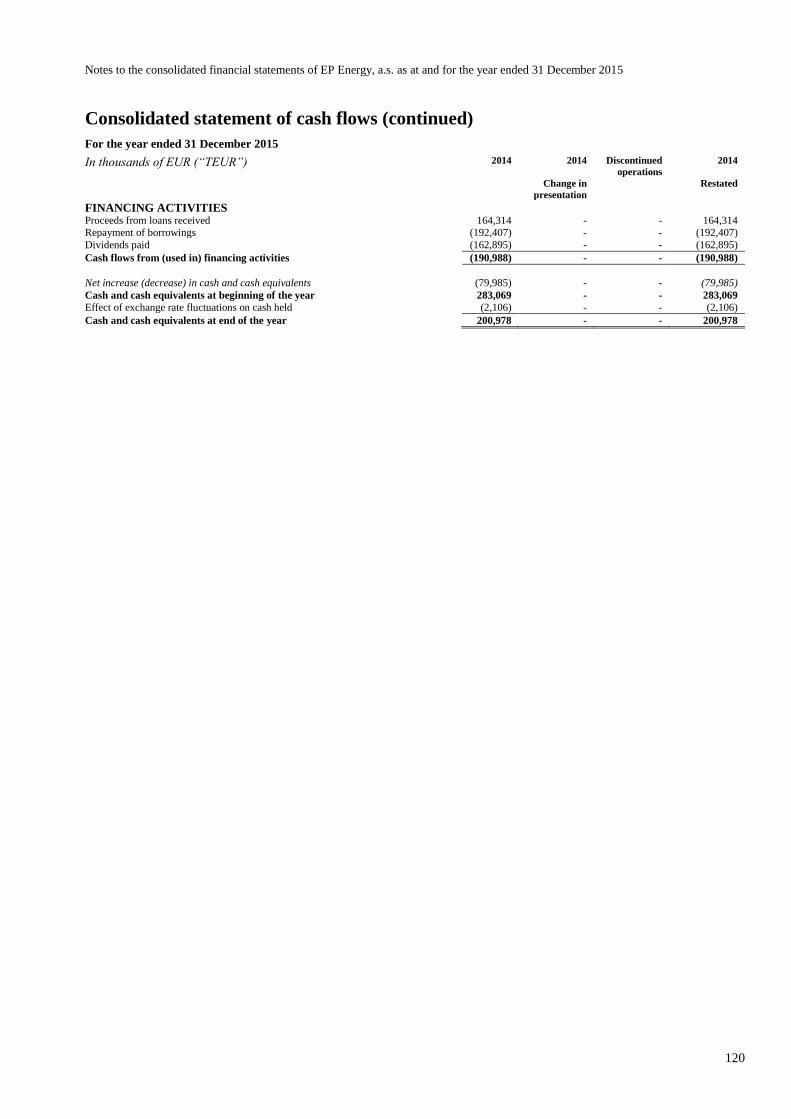
Notes to the consolidated financial statements of EP Energy, a.s. as at and for the year ended 31 December 2015
120
Consolidated statement of cash flows (continued)
For the year ended 31 December 2015
In thousands of EUR (“TEUR”) 2014 2014 Discontinued
operations
2014
Change in
presentation Restated
FINANCING ACTIVITIES Proceeds from loans received 164,314 - - 164,314 Repayment of borrowings (192,407) - - (192,407)
Dividends paid (162,895) - - (162,895)
Cash flows from (used in) financing activities (190,988) - - (190,988)
Net increase (decrease) in cash and cash equivalents (79,985) - - (79,985)
Cash and cash equivalents at beginning of the year 283,069 - - 283,069
Effect of exchange rate fluctuations on cash held (2,106) - - (2,106)
Cash and cash equivalents at end of the year 200,978 - - 200,978
VI. Independent Auditor´s Report on Statutory Financial
Statements
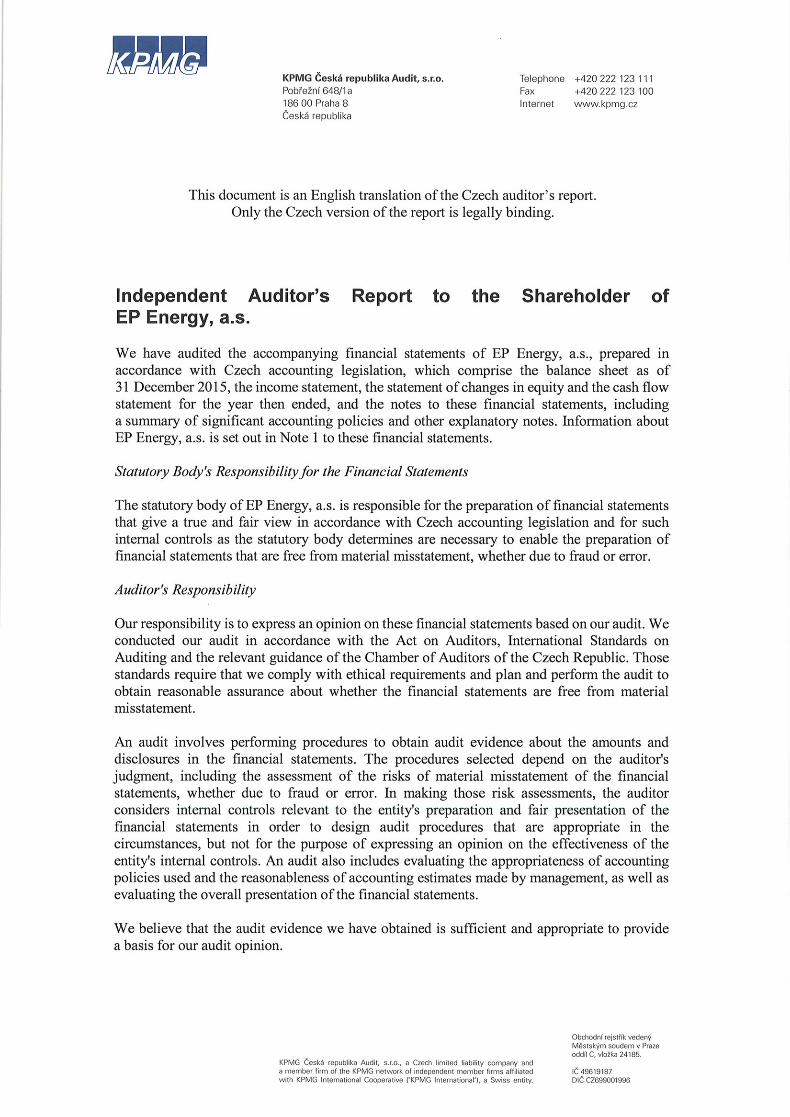

VII. Statutory Financial Statements and Notes to the Financial
Statements
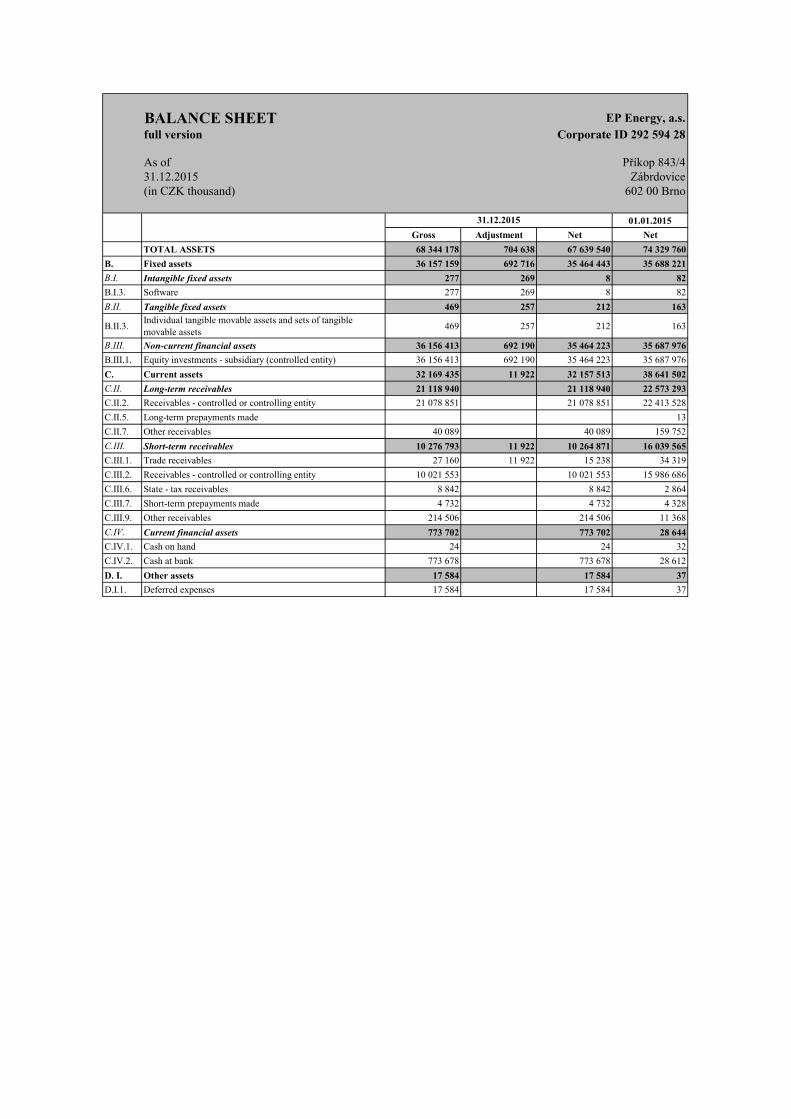
BALANCE SHEET EP Energy, a.s.
full version Corporate ID 292 594 28
As of Příkop 843/4
31.12.2015 Zábrdovice
(in CZK thousand) 602 00 Brno
01.01.2015
Gross Adjustment Net Net
TOTAL ASSETS 68 344 178 704 638 67 639 540 74 329 760
B. Fixed assets 36 157 159 692 716 35 464 443 35 688 221
B.I. Intangible fixed assets 277 269 8 82
B.I.3. Software 277 269 8 82
B.II. Tangible fixed assets 469 257 212 163
B.II.3.Individual tangible movable assets and sets of tangible
movable assets469 257 212 163
B.III. Non-current financial assets 36 156 413 692 190 35 464 223 35 687 976
B.III.1. Equity investments - subsidiary (controlled entity) 36 156 413 692 190 35 464 223 35 687 976
C. Current assets 32 169 435 11 922 32 157 513 38 641 502
C.II. Long-term receivables 21 118 940 21 118 940 22 573 293
C.II.2. Receivables - controlled or controlling entity 21 078 851 21 078 851 22 413 528
C.II.5. Long-term prepayments made 13
C.II.7. Other receivables 40 089 40 089 159 752
C.III. Short-term receivables 10 276 793 11 922 10 264 871 16 039 565
C.III.1. Trade receivables 27 160 11 922 15 238 34 319
C.III.2. Receivables - controlled or controlling entity 10 021 553 10 021 553 15 986 686
C.III.6. State - tax receivables 8 842 8 842 2 864
C.III.7. Short-term prepayments made 4 732 4 732 4 328
C.III.9. Other receivables 214 506 214 506 11 368
C.IV. Current financial assets 773 702 773 702 28 644
C.IV.1. Cash on hand 24 24 32
C.IV.2. Cash at bank 773 678 773 678 28 612
D. I. Other assets 17 584 17 584 37
D.I.1. Deferred expenses 17 584 17 584 37
31.12.2015
Person responsible for Person responsible forSDate Person responsible for Person responsible forSDate NOTES
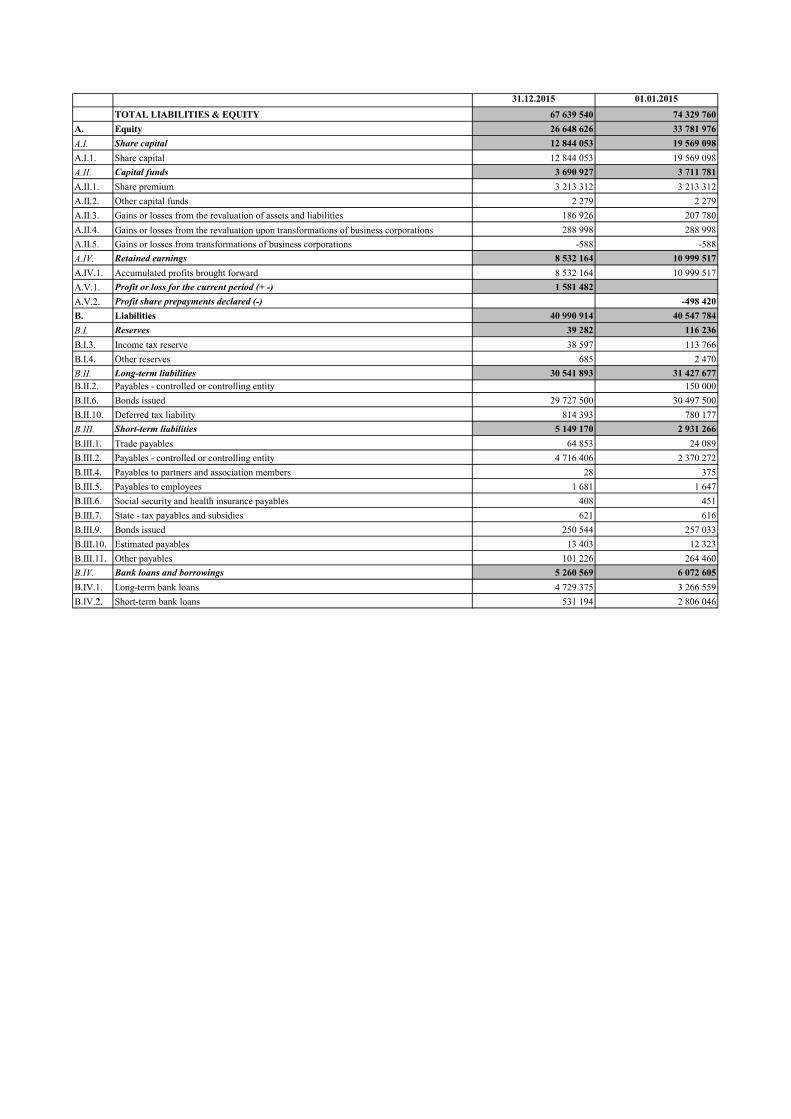
31.12.2015 01.01.2015
TOTAL LIABILITIES & EQUITY 67 639 540 74 329 760
A. Equity 26 648 626 33 781 976
A.I. Share capital 12 844 053 19 569 098
A.I.1. Share capital 12 844 053 19 569 098
A.II. Capital funds 3 690 927 3 711 781
A.II.1. Share premium 3 213 312 3 213 312
A.II.2. Other capital funds 2 279 2 279
A.II.3. Gains or losses from the revaluation of assets and liabilities 186 926 207 780
A.II.4. Gains or losses from the revaluation upon transformations of business corporations 288 998 288 998
A.II.5. Gains or losses from transformations of business corporations -588 -588
A.IV. Retained earnings 8 532 164 10 999 517
A.IV.1. Accumulated profits brought forward 8 532 164 10 999 517
A.V.1. Profit or loss for the current period (+ -) 1 581 482
A.V.2. Profit share prepayments declared (-) -498 420
B. Liabilities 40 990 914 40 547 784
B.I. Reserves 39 282 116 236
B.I.3. Income tax reserve 38 597 113 766
B.I.4. Other reserves 685 2 470
B.II. Long-term liabilities 30 541 893 31 427 677
B.II.2. Payables - controlled or controlling entity 150 000
B.II.6. Bonds issued 29 727 500 30 497 500
B.II.10. Deferred tax liability 814 393 780 177
B.III. Short-term liabilities 5 149 170 2 931 266
B.III.1. Trade payables 64 853 24 089
B.III.2. Payables - controlled or controlling entity 4 716 406 2 370 272
B.III.4. Payables to partners and association members 28 375
B.III.5. Payables to employees 1 681 1 647
B.III.6. Social security and health insurance payables 408 451
B.III.7. State - tax payables and subsidies 621 616
B.III.9. Bonds issued 250 544 257 033
B.III.10. Estimated payables 13 403 12 323
B.III.11. Other payables 101 226 264 460
B.IV. Bank loans and borrowings 5 260 569 6 072 605
B.IV.1. Long-term bank loans 4 729 375 3 266 559
B.IV.2. Short-term bank loans 531 194 2 806 046

PROFIT AND LOSS ACCOUNT EP Energy, a.s.
structured by the nature of expense method Corporate ID 292 594 28
Year ended Příkop 843/4
31.12.2015 Zábrdovice
(in CZK thousand) 602 00 Brno
Year ended
31.12.2015
II. Production 5 981
II.1. Sales of own products and services 5 981
B. Purchased consumables and services 69 895
B.1. Consumed material and energy 447
B.2. Services 69 448
+ Added value -63 914
C. Staff costs 35 243
C.1. Payroll costs 28 749
C.3. Social security and health insurance costs 6 490
C.4. Social costs 4
D. Taxes and charges 20
E. Depreciation of intangible and tangible fixed assets 189
G.Change in reserves and provisions relating to operating activities and complex
deferred expenses1 195
IV. Other operating income 9 765
H. Other operating expenses 18 725
* Operating profit or loss -109 521
VI. Proceeds from the sale of securities and investments 212 290
J. Cost of securities and investments sold 132 528
VII. Income from non-current financial assets 2 010 638
VII.1. Income from equity investments in subsidiaries and associates 2 010 638
IX. Income from the revaluation of securities and derivatives 27 263
L. Costs of the revaluation of securities and derivatives 72 287
M. Change in reserves and provisions relating to financial activities 118 974
X. Interest income 1 645 943
N. Interest expenses 1 705 873
XI. Other financial income 739 985
O. Other financial expenses 825 013
* Financial profit or loss 1 781 444
Q. Income tax on ordinary activities 90 441
Q 1. - due 112 558
Q 2. - deferred -22 117
** Profit or loss from ordinary activities 1 581 482
*** Profit or loss for the current period (+/-) 1 581 482
**** Profit or loss before tax 1 671 923
S Person responsible forS Person responsible forS Person responsible forS
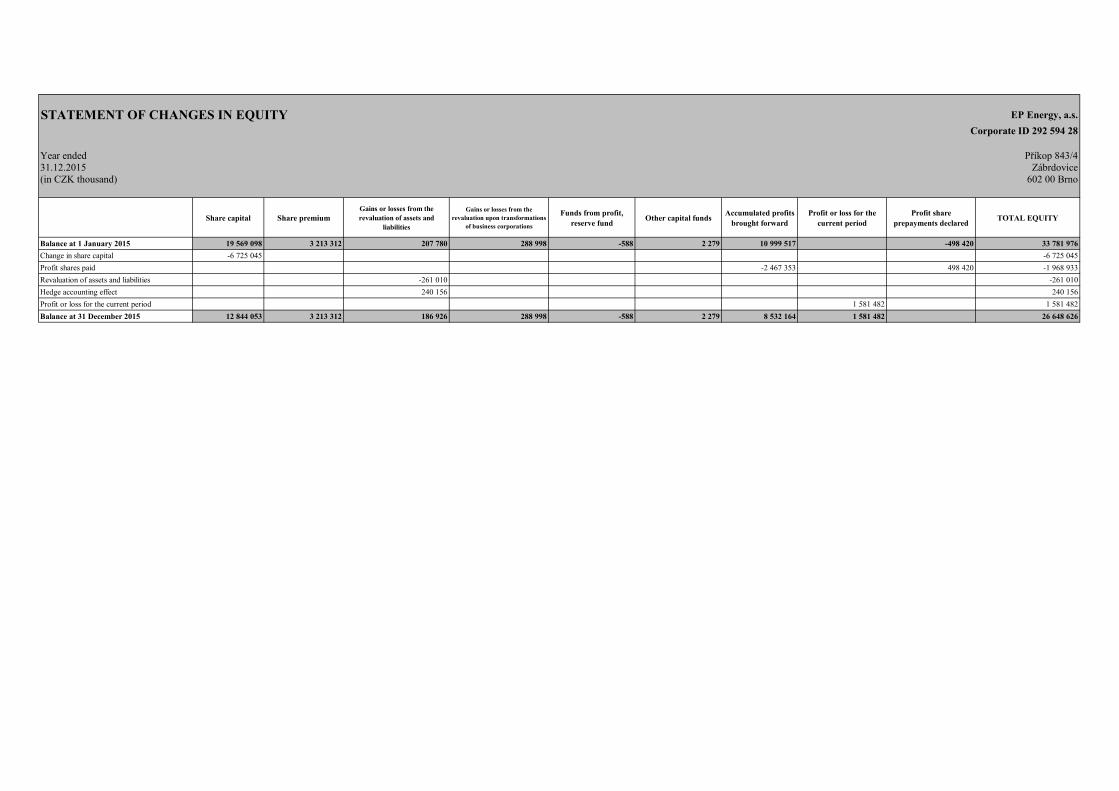
STATEMENT OF CHANGES IN EQUITY EP Energy, a.s.
Corporate ID 292 594 28
Year ended Příkop 843/4
31.12.2015 Zábrdovice
(in CZK thousand) 602 00 Brno
Share capital Share premium
Gains or losses from the
revaluation of assets and
liabilities
Gains or losses from the
revaluation upon transformations
of business corporations
Funds from profit,
reserve fundOther capital funds
Accumulated profits
brought forward
Profit or loss for the
current period
Profit share
prepayments declaredTOTAL EQUITY
Balance at 1 January 2015 19 569 098 3 213 312 207 780 288 998 -588 2 279 10 999 517 -498 420 33 781 976
Change in share capital -6 725 045 -6 725 045
Profit shares paid -2 467 353 498 420 -1 968 933
Revaluation of assets and liabilities -261 010 -261 010
Hedge accounting effect 240 156 240 156
Profit or loss for the current period 1 581 482 1 581 482
Balance at 31 December 2015 12 844 053 3 213 312 186 926 288 998 -588 2 279 8 532 164 1 581 482 26 648 626

CASH FLOW EP Energy, a.s.
STATEMENT Corporate ID 292 594 28
Year ended Příkop 843/4
31.12.2015 Zábrdovice
(in CZK thousand) 602 00 Brno
Year ended
31.12.2015
P. Opening balance of cash and cash equivalents 28 644
Cash flows from ordinary activities
Z. Profit or loss from ordinary activities before tax 1 671 923
A.1. Adjustments for non-cash transactions -1 653 112
A.1.1. Depreciation of fixed assets 189
A.1.2. Change in provisions and reserves 120 170
A.1.3. Profit/(loss) on the sale of fixed assets -79 762
A.1.4. Revenues from profit shares -2 010 638
A.1.5. Interest expense and interest income 59 930
A.1.6. Adjustments for other non-cash transactions 256 999
A.* Net operating cash flow before changes in working capital 18 811
A.2. Change in working capital 43 413
A.2.1. Change in operating receivables and other assets 1 804
A.2.2. Change in operating payables and other liabilities 41 609
A.** Net cash flow from operations before tax and extraordinary items 62 224
A.3. Interest paid -1 697 835
A.4. Interest received 986 043
A.5. Income tax paid from ordinary operations -187 728
A.*** Net operating cash flows -837 296
Cash flows from investing activities
B.1. Fixed assets expenditures -448 923
B.2. Proceeds from fixed assets sold 96 650
B.3. Loans provided to related parties -211 860
B.3. Received profit shares 1 225 207
B.*** Net investment cash flows 661 074
Cash flow from financial activities
C.1. Change in payables from financing 2 559 955
C.2. Impact of changes in equity -1 638 675
C.2.2. Capital payments to partners -1 638 675
C.*** Net financial cash flows 921 280
F. Net increase or decrease in cash and cash equivalents 745 058
R. Closing balance of cash and cash equivalents 773 702
EP Energy, a.s. Notes to the Czech statutory financial statements (non-consolidated, translated from the Czech original)
Year ended 31 December 2015 (All amounts are shown in thousands of Czech crowns "TCZK")
1
Contents
1. Description and principal activities ......................................................................................................................................... 2 2. Significant accounting policies applied by the Company ........................................................................................................ 3
a) Tangible and intangible fixed assets ...................................................................................................................................... 3 b) Financial assets ...................................................................................................................................................................... 4 c) Receivables ............................................................................................................................................................................ 5 d) Loans received ....................................................................................................................................................................... 5 e) Derivatives............................................................................................................................................................................. 5 f) Foreign currency transactions ................................................................................................................................................ 6 g) Recognition of expenses and revenues .................................................................................................................................. 6 h) External financing costs ......................................................................................................................................................... 6 i) Income tax ............................................................................................................................................................................. 6 j) Consolidation ......................................................................................................................................................................... 7 k) Loans, bonds and overdrafts .................................................................................................................................................. 7
3. Change in accounting policies and procedures ........................................................................................................................ 7 4. Comparability of information .................................................................................................................................................. 7 5. Cash flow statement ................................................................................................................................................................. 7 6. Long-term investments ............................................................................................................................................................ 8 7. Long-term receivables ........................................................................................................................................................... 11 8. Short-term receivables ........................................................................................................................................................... 12 9. Tax receivables ...................................................................................................................................................................... 12 10. Long-term liabilities .............................................................................................................................................................. 13 11. Short-term liabilities .............................................................................................................................................................. 13 12. Bank loans ............................................................................................................................................................................. 14 13. Related parties ....................................................................................................................................................................... 15
a) Long-term receivables from provided loans ........................................................................................................................ 15 b) Short-term receivables from provided loans ........................................................................................................................ 16 c) Other short-term receivables* .............................................................................................................................................. 17 d) Short-term payables from received loans ............................................................................................................................ 18 e) Expenses – interest .............................................................................................................................................................. 19 f) Revenues – interest .............................................................................................................................................................. 19 g) Revenues – dividends .......................................................................................................................................................... 20 h) Revenues – other ................................................................................................................................................................. 20
14. Cost of services ...................................................................................................................................................................... 20 15. Other financial expenses and revenues .................................................................................................................................. 20 16. Employees and executives ..................................................................................................................................................... 20 17. Fees payable to statutory auditors .......................................................................................................................................... 21 18. Income tax ............................................................................................................................................................................. 21 19. Contingencies and commitments ........................................................................................................................................... 22 20. Receivables kept off-balance sheet ........................................................................................................................................ 22 21. Material subsequent events .................................................................................................................................................... 23

EP Energy, a.s. Notes to the Czech statutory financial statements (non-consolidated, translated from the Czech original)
Year ended 31 December 2015 (All amounts are shown in thousands of Czech crowns "TCZK")
2
1. Description and principal activities
Establishment and description of the Company
EP Energy, a.s. (“the Company”) was established on 16 December 2010 by subscribing the registered
capital in the form of a non-monetary contribution of 100% of shares of Plzeňská energetika a.s., Honor
Invest, a.s., EP Renewables a.s. (formerly Czech Wind Holding, a.s.), První energetická a.s., ROLLEON
a.s., Czech Energy Holding, a.s. and of a 51% share in AISE, s.r.o.
The Company’s principal activity is the management of its own assets.
Ownership structure
The shareholders of the Company as at 31 December 2015 were:
CE Energy, a.s., Id. No.: 024 13 507 100%
Registered office
EP Energy, a.s.
Příkop 843/4
Zábrdovice
602 00 Brno
Czech Republic
Identification number
292 59 428
Members of the board of directors and supervisory board as at 31 December 2015
Board of directors Supervisory board
JUDr. Daniel Křetínský (Chairman) Ivan Jakabovič
Jan Špringl (Vice-Chairman) Martin Fedor
Marek Spurný Miloš Badida
Pavel Horský
Jiří Feist
Tomáš David
Organisational structure
The Company had fourteen employees as at 31 December 2015.
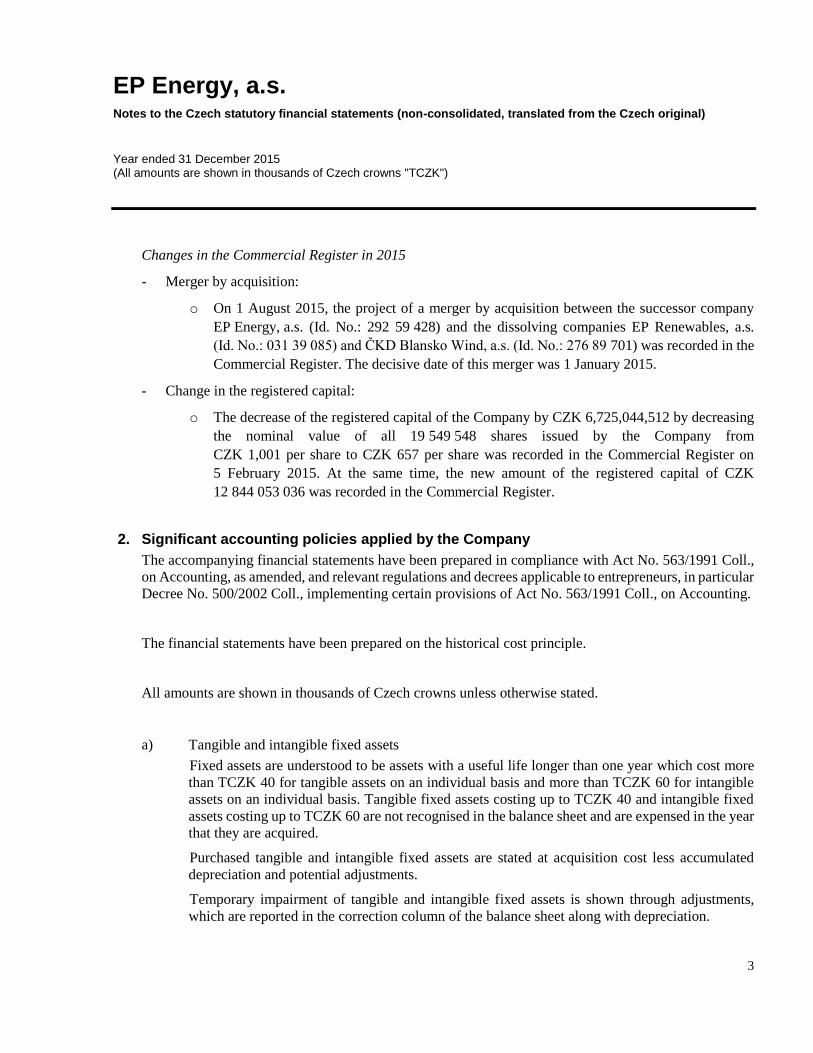
EP Energy, a.s. Notes to the Czech statutory financial statements (non-consolidated, translated from the Czech original)
Year ended 31 December 2015 (All amounts are shown in thousands of Czech crowns "TCZK")
3
Changes in the Commercial Register in 2015
- Merger by acquisition:
o On 1 August 2015, the project of a merger by acquisition between the successor company
EP Energy, a.s. (Id. No.: 292 59 428) and the dissolving companies EP Renewables, a.s.
(Id. No.: 031 39 085) and ČKD Blansko Wind, a.s. (Id. No.: 276 89 701) was recorded in the
Commercial Register. The decisive date of this merger was 1 January 2015.
- Change in the registered capital:
o The decrease of the registered capital of the Company by CZK 6,725,044,512 by decreasing
the nominal value of all 19 549 548 shares issued by the Company from
CZK 1,001 per share to CZK 657 per share was recorded in the Commercial Register on
5 February 2015. At the same time, the new amount of the registered capital of CZK
12 844 053 036 was recorded in the Commercial Register.
2. Significant accounting policies applied by the Company
The accompanying financial statements have been prepared in compliance with Act No. 563/1991 Coll.,
on Accounting, as amended, and relevant regulations and decrees applicable to entrepreneurs, in particular
Decree No. 500/2002 Coll., implementing certain provisions of Act No. 563/1991 Coll., on Accounting.
The financial statements have been prepared on the historical cost principle.
All amounts are shown in thousands of Czech crowns unless otherwise stated.
a) Tangible and intangible fixed assets
Fixed assets are understood to be assets with a useful life longer than one year which cost more
than TCZK 40 for tangible assets on an individual basis and more than TCZK 60 for intangible
assets on an individual basis. Tangible fixed assets costing up to TCZK 40 and intangible fixed
assets costing up to TCZK 60 are not recognised in the balance sheet and are expensed in the year
that they are acquired.
Purchased tangible and intangible fixed assets are stated at acquisition cost less accumulated
depreciation and potential adjustments.
Temporary impairment of tangible and intangible fixed assets is shown through adjustments,
which are reported in the correction column of the balance sheet along with depreciation.
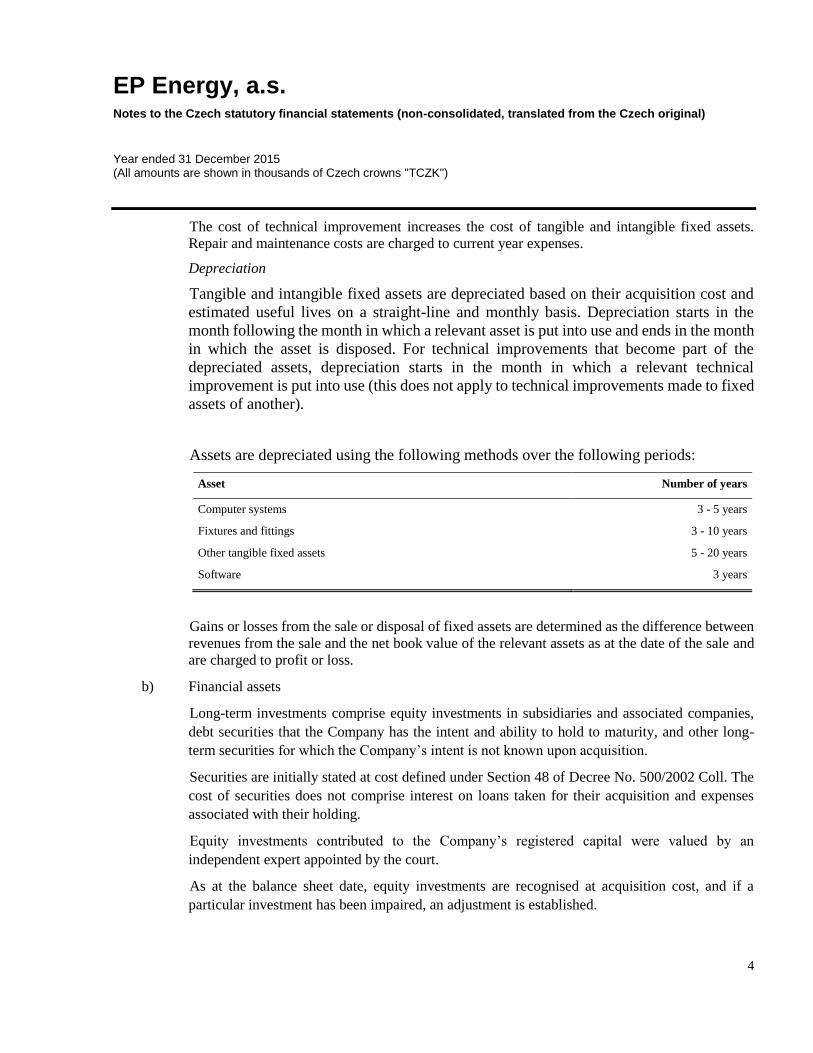
EP Energy, a.s. Notes to the Czech statutory financial statements (non-consolidated, translated from the Czech original)
Year ended 31 December 2015 (All amounts are shown in thousands of Czech crowns "TCZK")
4
The cost of technical improvement increases the cost of tangible and intangible fixed assets.
Repair and maintenance costs are charged to current year expenses.
Depreciation
Tangible and intangible fixed assets are depreciated based on their acquisition cost and
estimated useful lives on a straight-line and monthly basis. Depreciation starts in the
month following the month in which a relevant asset is put into use and ends in the month
in which the asset is disposed. For technical improvements that become part of the
depreciated assets, depreciation starts in the month in which a relevant technical
improvement is put into use (this does not apply to technical improvements made to fixed
assets of another).
Assets are depreciated using the following methods over the following periods:
Asset Number of years
Computer systems 3 - 5 years
Fixtures and fittings 3 - 10 years
Other tangible fixed assets 5 - 20 years
Software 3 years
Gains or losses from the sale or disposal of fixed assets are determined as the difference between
revenues from the sale and the net book value of the relevant assets as at the date of the sale and
are charged to profit or loss.
b) Financial assets
Long-term investments comprise equity investments in subsidiaries and associated companies,
debt securities that the Company has the intent and ability to hold to maturity, and other long-
term securities for which the Company’s intent is not known upon acquisition.
Securities are initially stated at cost defined under Section 48 of Decree No. 500/2002 Coll. The
cost of securities does not comprise interest on loans taken for their acquisition and expenses
associated with their holding.
Equity investments contributed to the Company’s registered capital were valued by an
independent expert appointed by the court.
As at the balance sheet date, equity investments are recognised at acquisition cost, and if a
particular investment has been impaired, an adjustment is established.

EP Energy, a.s. Notes to the Czech statutory financial statements (non-consolidated, translated from the Czech original)
Year ended 31 December 2015 (All amounts are shown in thousands of Czech crowns "TCZK")
5
If securities are held in foreign currencies, they are translated as at the balance sheet date using
the current rates of exchange announced by the Czech National Bank against the revaluation of
assets and liabilities in equity.
c) Receivables
Receivables are accounted for at their nominal value. Assigned receivables are stated at
acquisition cost including other related costs (Section 25 of Act No. 563/1991 Coll.). As at the
balance sheet date, temporary impairment of doubtful receivables is accounted for using
adjustments that are debited to expenses and are shown in the correction column in the balance
sheet. Adjustments are established to receivables that are more than 180 days overdue and to
receivables identified based on an analysis of the credit status of individual customers.
The value of receivables from provided loans is increased by uncollected interest (except for
default interest).
d) Loans received
Short-term and long-term loans are initially recorded at their nominal value. Upon the preparation
of the financial statements the loan balances are increased by unpaid interest charged by banks or
other parties. The Company classifies as short-term any part of long-term loans that is due within
one year of the balance sheet date.
e) Derivatives
Trading derivatives
As at the balance sheet date, derivatives held for trading are recognised at fair value in Other
receivables or Other payables. Gains/losses from changes in fair value are recorded in the income
statement.
Hedging derivatives
The Company uses hedging derivatives (interest rate swaps) to mitigate interest rate risks relating
to payments of interest on loans received. Hedging derivatives are recognised at fair value. The
hedge is fully in line with the Company’s risk management strategy. All interest rate swap
transactions are documented and their effectiveness is evaluated on a continuous basis.
The realised portion of financial derivatives is recognised under Other financial
expenses/revenues in the income statement. As at the balance sheet date, the unrealised portion is
recorded in revaluation of assets and liabilities and recognised as part of equity.
In the case of cash flow hedges, the portion of the gain or loss on the hedging instrument that is
determined to be an effective hedge is recognised in equity and the ineffective portion of the gain
or loss on the hedging instrument is recognised in profit or loss. If the hedging instrument no
longer meets the criteria for hedge accounting, expires or is sold, terminated or exercised, or the
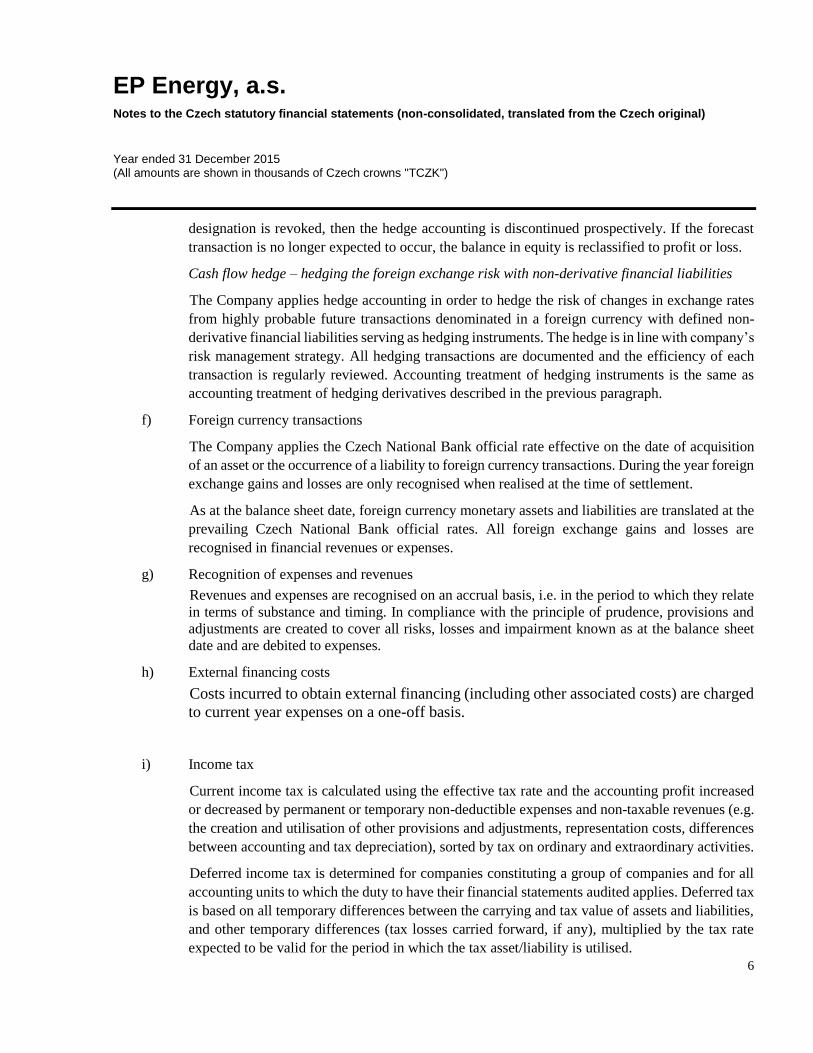
EP Energy, a.s. Notes to the Czech statutory financial statements (non-consolidated, translated from the Czech original)
Year ended 31 December 2015 (All amounts are shown in thousands of Czech crowns "TCZK")
6
designation is revoked, then the hedge accounting is discontinued prospectively. If the forecast
transaction is no longer expected to occur, the balance in equity is reclassified to profit or loss.
Cash flow hedge – hedging the foreign exchange risk with non-derivative financial liabilities
The Company applies hedge accounting in order to hedge the risk of changes in exchange rates
from highly probable future transactions denominated in a foreign currency with defined non-
derivative financial liabilities serving as hedging instruments. The hedge is in line with company’s
risk management strategy. All hedging transactions are documented and the efficiency of each
transaction is regularly reviewed. Accounting treatment of hedging instruments is the same as
accounting treatment of hedging derivatives described in the previous paragraph.
f) Foreign currency transactions
The Company applies the Czech National Bank official rate effective on the date of acquisition
of an asset or the occurrence of a liability to foreign currency transactions. During the year foreign
exchange gains and losses are only recognised when realised at the time of settlement.
As at the balance sheet date, foreign currency monetary assets and liabilities are translated at the
prevailing Czech National Bank official rates. All foreign exchange gains and losses are
recognised in financial revenues or expenses.
g) Recognition of expenses and revenues
Revenues and expenses are recognised on an accrual basis, i.e. in the period to which they relate
in terms of substance and timing. In compliance with the principle of prudence, provisions and
adjustments are created to cover all risks, losses and impairment known as at the balance sheet
date and are debited to expenses.
h) External financing costs
Costs incurred to obtain external financing (including other associated costs) are charged
to current year expenses on a one-off basis.
i) Income tax
Current income tax is calculated using the effective tax rate and the accounting profit increased
or decreased by permanent or temporary non-deductible expenses and non-taxable revenues (e.g.
the creation and utilisation of other provisions and adjustments, representation costs, differences
between accounting and tax depreciation), sorted by tax on ordinary and extraordinary activities.
Deferred income tax is determined for companies constituting a group of companies and for all
accounting units to which the duty to have their financial statements audited applies. Deferred tax
is based on all temporary differences between the carrying and tax value of assets and liabilities,
and other temporary differences (tax losses carried forward, if any), multiplied by the tax rate
expected to be valid for the period in which the tax asset/liability is utilised.
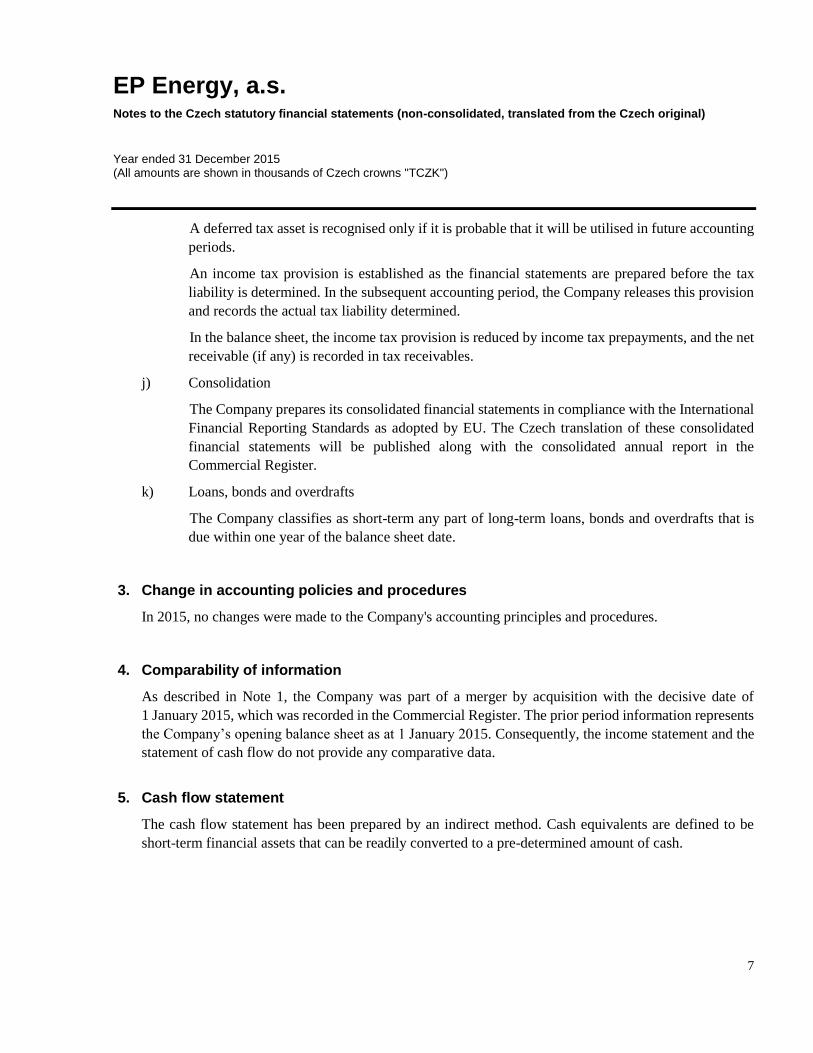
EP Energy, a.s. Notes to the Czech statutory financial statements (non-consolidated, translated from the Czech original)
Year ended 31 December 2015 (All amounts are shown in thousands of Czech crowns "TCZK")
7
A deferred tax asset is recognised only if it is probable that it will be utilised in future accounting
periods.
An income tax provision is established as the financial statements are prepared before the tax
liability is determined. In the subsequent accounting period, the Company releases this provision
and records the actual tax liability determined.
In the balance sheet, the income tax provision is reduced by income tax prepayments, and the net
receivable (if any) is recorded in tax receivables.
j) Consolidation
The Company prepares its consolidated financial statements in compliance with the International
Financial Reporting Standards as adopted by EU. The Czech translation of these consolidated
financial statements will be published along with the consolidated annual report in the
Commercial Register.
k) Loans, bonds and overdrafts
The Company classifies as short-term any part of long-term loans, bonds and overdrafts that is
due within one year of the balance sheet date.
3. Change in accounting policies and procedures
In 2015, no changes were made to the Company's accounting principles and procedures.
4. Comparability of information
As described in Note 1, the Company was part of a merger by acquisition with the decisive date of
1 January 2015, which was recorded in the Commercial Register. The prior period information represents
the Company’s opening balance sheet as at 1 January 2015. Consequently, the income statement and the
statement of cash flow do not provide any comparative data.
5. Cash flow statement
The cash flow statement has been prepared by an indirect method. Cash equivalents are defined to be
short-term financial assets that can be readily converted to a pre-determined amount of cash.
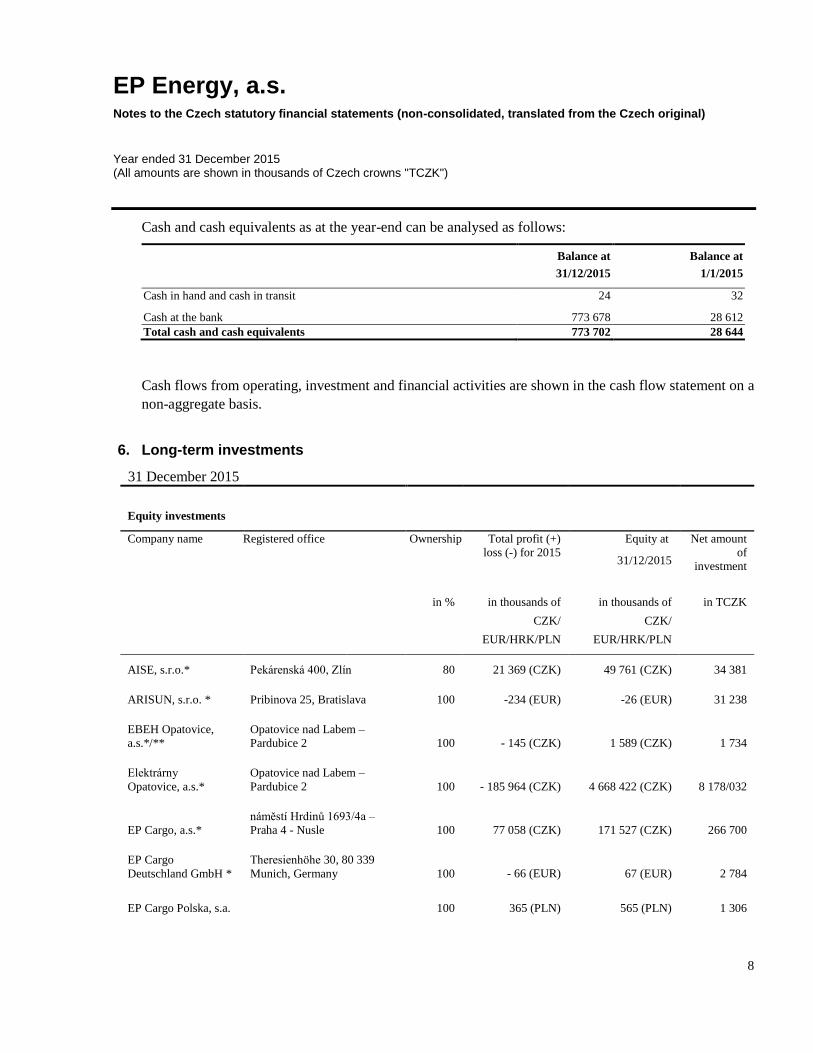
EP Energy, a.s. Notes to the Czech statutory financial statements (non-consolidated, translated from the Czech original)
Year ended 31 December 2015 (All amounts are shown in thousands of Czech crowns "TCZK")
8
Cash and cash equivalents as at the year-end can be analysed as follows:
Balance at
31/12/2015
Balance at
1/1/2015
Cash in hand and cash in transit 24 32
Cash at the bank 773 678 28 612
Total cash and cash equivalents 773 702 28 644
Cash flows from operating, investment and financial activities are shown in the cash flow statement on a
non-aggregate basis.
6. Long-term investments
31 December 2015
Equity investments
Company name Registered office Ownership
Total profit (+)
loss (-) for 2015
Equity at
31/12/2015
Net amount
of
investment
in % in thousands of
CZK/
EUR/HRK/PLN
in thousands of
CZK/
EUR/HRK/PLN
in TCZK
AISE, s.r.o.* Pekárenská 400, Zlín 80 21 369 (CZK) 49 761 (CZK) 34 381
ARISUN, s.r.o. * Pribinova 25, Bratislava 100 -234 (EUR) -26 (EUR) 31 238
EBEH Opatovice,
a.s.*/**
Opatovice nad Labem –
Pardubice 2 100 - 145 (CZK) 1 589 (CZK) 1 734
Elektrárny
Opatovice, a.s.*
Opatovice nad Labem –
Pardubice 2 100 - 185 964 (CZK) 4 668 422 (CZK) 8 178/032
EP Cargo, a.s.*
náměstí Hrdinů 1693/4a –
Praha 4 - Nusle 100 77 058 (CZK) 171 527 (CZK) 266 700
EP Cargo
Deutschland GmbH *
Theresienhöhe 30, 80 339
Munich, Germany 100 - 66 (EUR) 67 (EUR) 2 784
EP Cargo Polska, s.a. 100 365 (PLN) 565 (PLN) 1 306
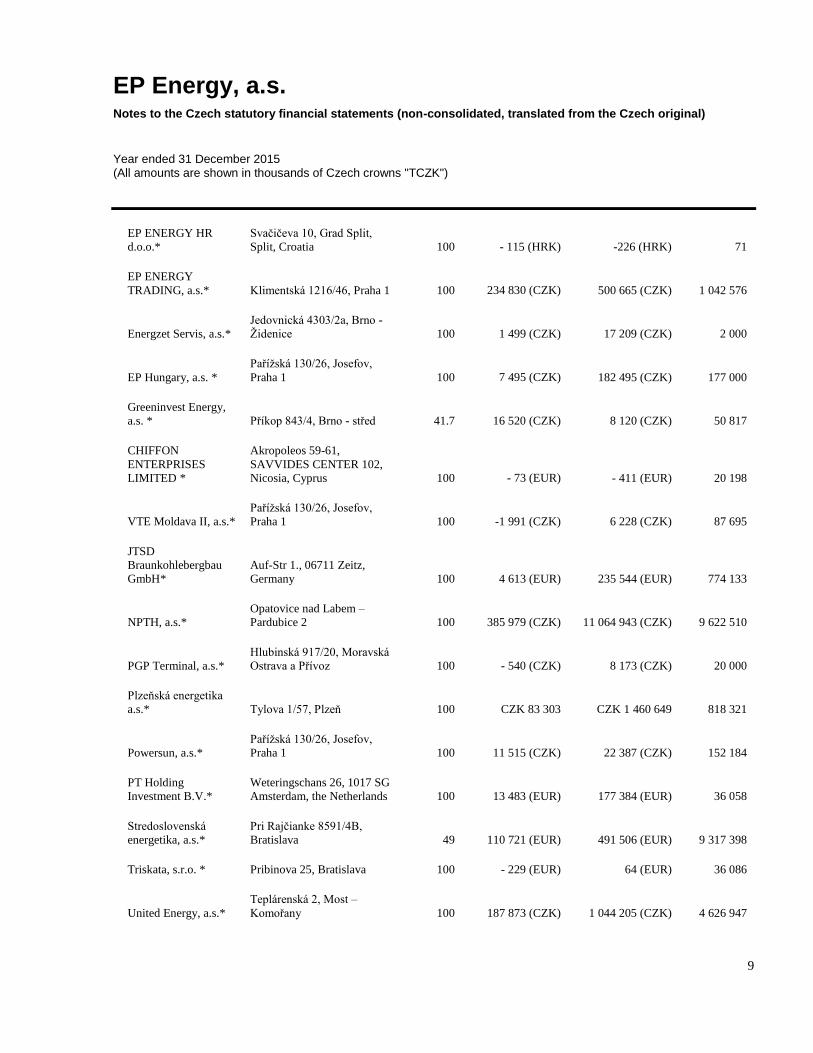
EP Energy, a.s. Notes to the Czech statutory financial statements (non-consolidated, translated from the Czech original)
Year ended 31 December 2015 (All amounts are shown in thousands of Czech crowns "TCZK")
9
EP ENERGY HR
d.o.o.*
Svačičeva 10, Grad Split,
Split, Croatia 100 - 115 (HRK) -226 (HRK) 71
EP ENERGY
TRADING, a.s.* Klimentská 1216/46, Praha 1 100 234 830 (CZK) 500 665 (CZK) 1 042 576
Energzet Servis, a.s.*
Jedovnická 4303/2a, Brno -
Židenice 100 1 499 (CZK) 17 209 (CZK) 2 000
EP Hungary, a.s. *
Pařížská 130/26, Josefov,
Praha 1 100 7 495 (CZK) 182 495 (CZK) 177 000
Greeninvest Energy,
a.s. * Příkop 843/4, Brno - střed 41.7 16 520 (CZK) 8 120 (CZK) 50 817
CHIFFON
ENTERPRISES
LIMITED *
Akropoleos 59-61,
SAVVIDES CENTER 102,
Nicosia, Cyprus 100 - 73 (EUR) - 411 (EUR) 20 198
VTE Moldava II, a.s.*
Pařížská 130/26, Josefov,
Praha 1 100 -1 991 (CZK) 6 228 (CZK) 87 695
JTSD
Braunkohlebergbau
GmbH*
Auf-Str 1., 06711 Zeitz,
Germany 100 4 613 (EUR) 235 544 (EUR) 774 133
NPTH, a.s.*
Opatovice nad Labem –
Pardubice 2 100 385 979 (CZK) 11 064 943 (CZK) 9 622 510
PGP Terminal, a.s.*
Hlubinská 917/20, Moravská
Ostrava a Přívoz 100 - 540 (CZK) 8 173 (CZK) 20 000
Plzeňská energetika
a.s.* Tylova 1/57, Plzeň 100 CZK 83 303 CZK 1 460 649 818 321
Powersun, a.s.*
Pařížská 130/26, Josefov,
Praha 1 100 11 515 (CZK) 22 387 (CZK) 152 184
PT Holding
Investment B.V.*
Weteringschans 26, 1017 SG
Amsterdam, the Netherlands 100 13 483 (EUR) 177 384 (EUR) 36 058
Stredoslovenská
energetika, a.s.*
Pri Rajčianke 8591/4B,
Bratislava 49 110 721 (EUR) 491 506 (EUR) 9 317 398
Triskata, s.r.o. * Pribinova 25, Bratislava 100 - 229 (EUR) 64 (EUR) 36 086
United Energy, a.s.*
Teplárenská 2, Most –
Komořany 100 187 873 (CZK) 1 044 205 (CZK) 4 626 947
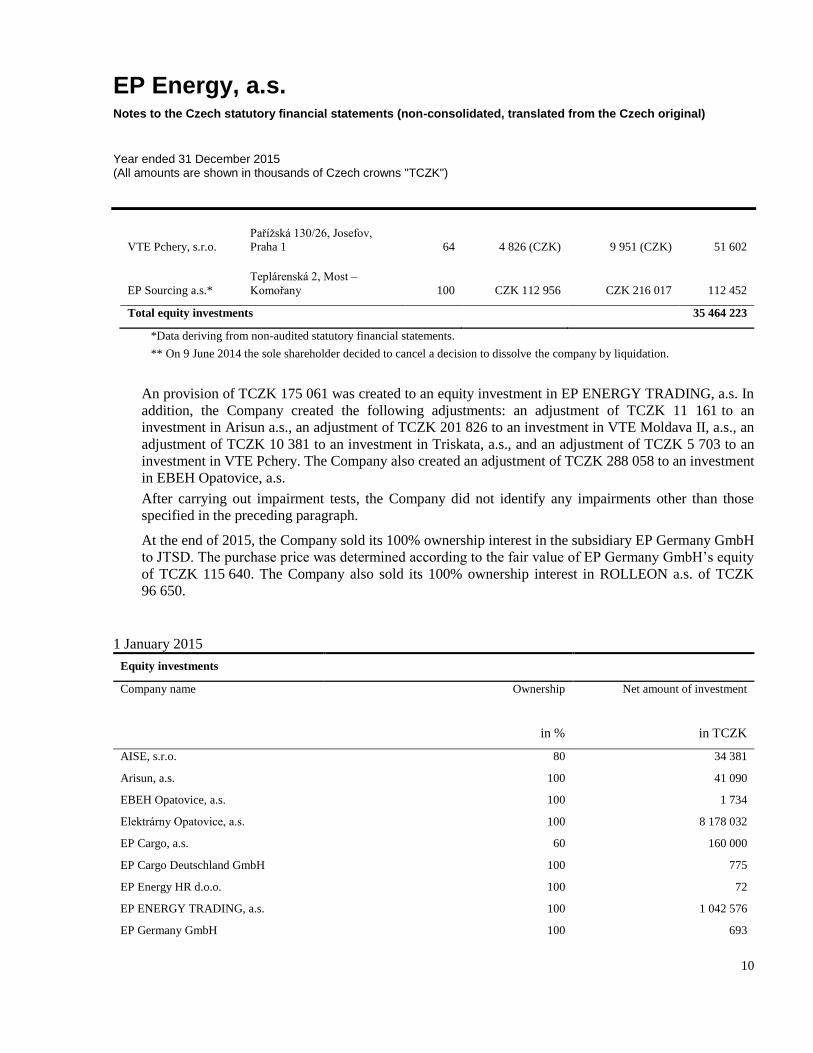
EP Energy, a.s. Notes to the Czech statutory financial statements (non-consolidated, translated from the Czech original)
Year ended 31 December 2015 (All amounts are shown in thousands of Czech crowns "TCZK")
10
VTE Pchery, s.r.o.
Pařížská 130/26, Josefov,
Praha 1 64 4 826 (CZK) 9 951 (CZK) 51 602
EP Sourcing a.s.*
Teplárenská 2, Most –
Komořany 100 CZK 112 956 CZK 216 017 112 452
Total equity investments 35 464 223
*Data deriving from non-audited statutory financial statements.
** On 9 June 2014 the sole shareholder decided to cancel a decision to dissolve the company by liquidation.
An provision of TCZK 175 061 was created to an equity investment in EP ENERGY TRADING, a.s. In
addition, the Company created the following adjustments: an adjustment of TCZK 11 161 to an
investment in Arisun a.s., an adjustment of TCZK 201 826 to an investment in VTE Moldava II, a.s., an
adjustment of TCZK 10 381 to an investment in Triskata, a.s., and an adjustment of TCZK 5 703 to an
investment in VTE Pchery. The Company also created an adjustment of TCZK 288 058 to an investment
in EBEH Opatovice, a.s.
After carrying out impairment tests, the Company did not identify any impairments other than those
specified in the preceding paragraph.
At the end of 2015, the Company sold its 100% ownership interest in the subsidiary EP Germany GmbH
to JTSD. The purchase price was determined according to the fair value of EP Germany GmbH’s equity
of TCZK 115 640. The Company also sold its 100% ownership interest in ROLLEON a.s. of TCZK
96 650.
1 January 2015
Equity investments
Company name Ownership Net amount of investment
in % in TCZK
AISE, s.r.o. 80 34 381
Arisun, a.s. 100 41 090
EBEH Opatovice, a.s. 100 1 734
Elektrárny Opatovice, a.s. 100 8 178 032
EP Cargo, a.s. 60 160 000
EP Cargo Deutschland GmbH 100 775
EP Energy HR d.o.o. 100 72
EP ENERGY TRADING, a.s. 100 1 042 576
EP Germany GmbH 100 693
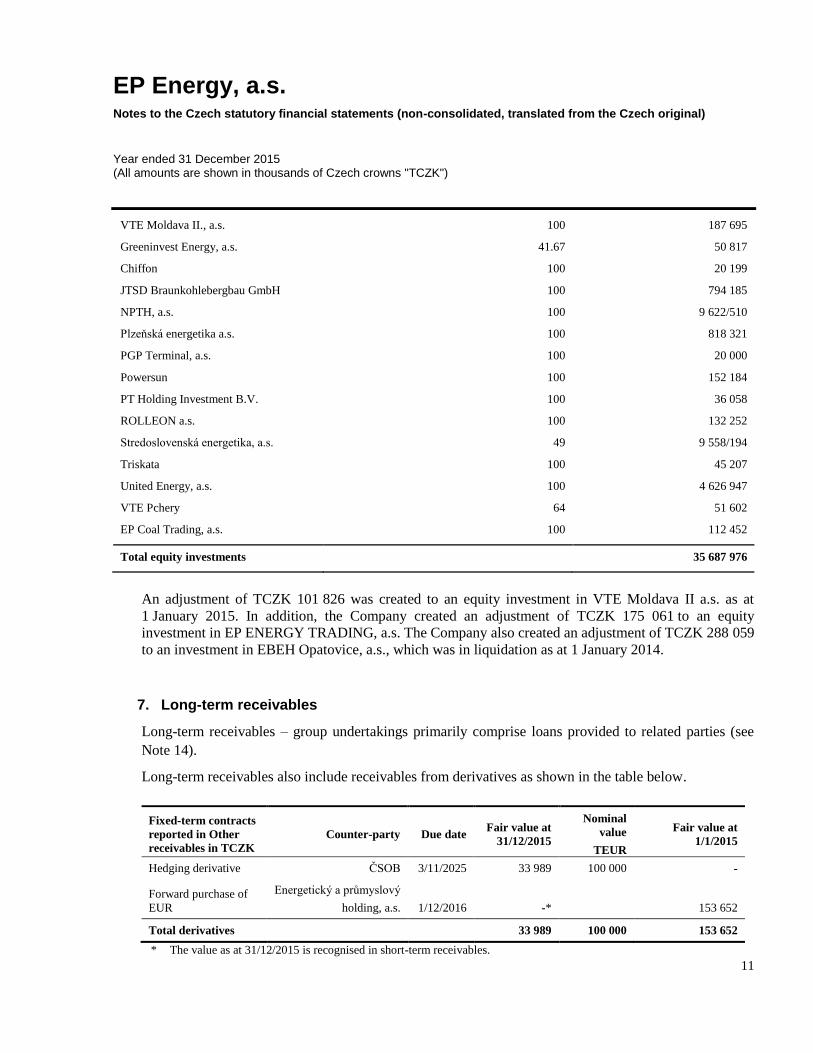
EP Energy, a.s. Notes to the Czech statutory financial statements (non-consolidated, translated from the Czech original)
Year ended 31 December 2015 (All amounts are shown in thousands of Czech crowns "TCZK")
11
VTE Moldava II., a.s. 100 187 695
Greeninvest Energy, a.s. 41.67 50 817
Chiffon 100 20 199
JTSD Braunkohlebergbau GmbH 100 794 185
NPTH, a.s. 100 9 622/510
Plzeňská energetika a.s. 100 818 321
PGP Terminal, a.s. 100 20 000
Powersun 100 152 184
PT Holding Investment B.V. 100 36 058
ROLLEON a.s. 100 132 252
Stredoslovenská energetika, a.s. 49 9 558/194
Triskata 100 45 207
United Energy, a.s. 100 4 626 947
VTE Pchery 64 51 602
EP Coal Trading, a.s. 100 112 452
Total equity investments 35 687 976
An adjustment of TCZK 101 826 was created to an equity investment in VTE Moldava II a.s. as at
1 January 2015. In addition, the Company created an adjustment of TCZK 175 061 to an equity
investment in EP ENERGY TRADING, a.s. The Company also created an adjustment of TCZK 288 059
to an investment in EBEH Opatovice, a.s., which was in liquidation as at 1 January 2014.
7. Long-term receivables
Long-term receivables – group undertakings primarily comprise loans provided to related parties (see
Note 14).
Long-term receivables also include receivables from derivatives as shown in the table below.
Fixed-term contracts
reported in Other
receivables in TCZK
Counter-party Due date Fair value at
31/12/2015
Nominal
value
TEUR
Fair value at
1/1/2015
Hedging derivative ČSOB 3/11/2025 33 989 100 000 -
Forward purchase of
EUR
Energetický a průmyslový
holding, a.s. 1/12/2016 -*
153 652
Total derivatives 33 989 100 000 153 652
* The value as at 31/12/2015 is recognised in short-term receivables.

EP Energy, a.s. Notes to the Czech statutory financial statements (non-consolidated, translated from the Czech original)
Year ended 31 December 2015 (All amounts are shown in thousands of Czech crowns "TCZK")
12
Cash flow hedge – hedging the interest risk with interest rate swap
The Company applies hedge accounting for interest rate swaps that are used for hedging of interest
expense on current and planned financing of the Company. Hedged interest expense from financing
of Company’s needs are considered as highly probable and are expected between years 2018 and 2025.
The impact on profit of the Company is expected in this period as well. As at 31 December 2015,
TCZK 33 989 from this hedge relationship was recognised in the Company’s equity including a related
deferred tax of TCZK 6 458 (as at 1 January 2015 – TCZK 0). In 2015, TCZK 0 was transferred from
equity to the income statement as a result of realization of hedged planned cash flows.
8. Short-term receivables
Short-term receivables primarily comprise loans provided to related parties (see Note 13).
Ageing structure of trade receivables
Receivables of TCZK 202 (1 January 2015: TCZK 2 735) are less than 60 days overdue.
The Company believes that it is not necessary to create adjustments to these receivables after performing
an analysis of their collectability.
Receivables of TCZK 11 922 (as at 1 January 2015: TCZK 12 230) are more than two years overdue.
A 100% adjustment has been created to these receivables (as at 1 January 2015: an adjustment of TCZK
9 173).
Other short-term receivables primarily include a receivable resulting from sale of the equity investment
in EP Germany GmbH of TCZK 115 640 to JTSD-Braunkohlebergbau GmbH. As at 1 January 2015, they
primarily include a receivable of TCZK 9 671 from VTE Moldava II. A receivable from derivatives (see
the table below).
Fixed-term contracts
reported in Other
receivables in TCZK
Counter-party Due date Fair value at
31/12/2015
Fair value at
1/1/2015
Forward purchase of EUR
Energetický a průmyslový
holding, a.s. 1/12/2016 97 640
-*
Total swaps and forwards 97 640 -
* The value as at 1/1/2015 is recognised in long-term receivables.
9. Tax receivables
As at 31 December 2015, the Company reports a receivable relating to value added tax and a receivable
relating to corporate income tax prepayments. As at 1 January 2015, the Company reports a receivable
relating to corporate income tax prepayments (see Note 18).

EP Energy, a.s. Notes to the Czech statutory financial statements (non-consolidated, translated from the Czech original)
Year ended 31 December 2015 (All amounts are shown in thousands of Czech crowns "TCZK")
13
10. Long-term liabilities
The bonds issued are quoted on the Irish stock exchange. The first tranche is payable in 2019 and bears
an interest rate of 5.875% p.a. The second tranche is payable in 2018 and bears an interest rate of 4.375%
p.a. A total of 50% + 1 shares of the Company and of other selected subsidiaries are pledged in favour of
bond holders.
Interest on both tranches are payable twice a year retrospectively on 1 May and 1 November of each year.
Deferred tax liability of TCZK 814 393 (1 January 2015: TCZK 780 177) is described in note 18. Income
tax.
Cash flow hedge - hedging the foreign exchange risk with non-derivative financial liabilities
The Company applies hedge accounting for hedging instruments designated to hedge foreign exchange
risk of revenues denominated in foreign currency (EUR). Out of total nominal MEUR 1 100 of issued
bonds, the Company designates MEUR 375 as hedging instrument. Hedged cash flows from dividends
from subsidiaries in EUR, which are considered highly probable by Company, are expected between years
2016 and 2030. The impact on profit of the Company is expected in this period as well. As at
31 December 2015, TCZK 262 500 from this hedge relationship was recognised in the Company’s equity
including a related deferred tax of TCZK 49 875 (as at 1 January 2015 – TCZK 0). In 2015, TCZK 0 was
transferred from equity to the income statement as a result of realization of hedged planned cash flows.
11. Short-term liabilities
Short-term liabilities primarily comprise payables to related parties arising from received loans
of TCZK 4 716 406 (1 January 2015: TCZK 2 370 273), accrued interest on issued bonds
of TCZK 250 544 (1 January 2015: TCZK 257 033), and other payables of TCZK 101 226 (1 January
2015: TCZK 264 460).
Other payables include, in particular, a payable to JTSD-Braunkohlebergbau GmbH of
TCZK 94 588 (1 January 2015: TCZK 97 038) relating to real estate transfer tax.

EP Energy, a.s. Notes to the Czech statutory financial statements (non-consolidated, translated from the Czech original)
Year ended 31 December 2015 (All amounts are shown in thousands of Czech crowns "TCZK")
14
12. Bank loans
Long-term bank loans comprise:
Bank Currency Balance at
31/12/2015
Balance at
1/1/2015 Interest rate
HSBC Bank Praha EUR 1 351 250 0 variable
Commerzbank EUR 1 351 250 0 variable
ČSOB EUR 2 026 875 0 variable
UniCredit Bank London EUR 0 3 266 559 variable
Total 4 729 375 3 266 559
Short-term bank loans and short-term overdrafts comprise:
Bank Currency Balance at
31/12/2015
Balance at
1/1/2015 Interest rate
HSBC Bank Praha EUR 0 693 125 variable
Royal Bank of Scotland EUR 0 609 131 variable
Komerční banka EUR 0 1 030 064 variable
UniCredit Bank EUR 531 194 473 726 variable
Total 531 194 2 806 046
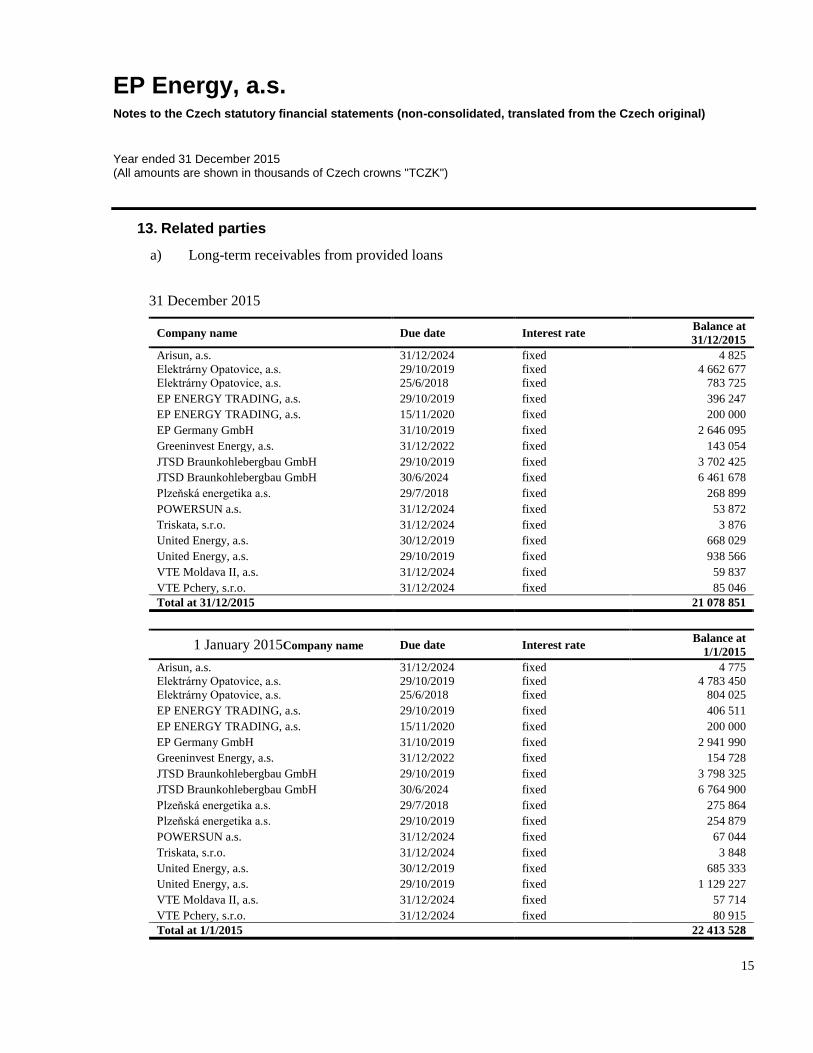
EP Energy, a.s. Notes to the Czech statutory financial statements (non-consolidated, translated from the Czech original)
Year ended 31 December 2015 (All amounts are shown in thousands of Czech crowns "TCZK")
15
13. Related parties
a) Long-term receivables from provided loans
31 December 2015
Company name Due date Interest rate Balance at
31/12/2015
Arisun, a.s. 31/12/2024 fixed 4 825
Elektrárny Opatovice, a.s. 29/10/2019 fixed 4 662 677
Elektrárny Opatovice, a.s. 25/6/2018 fixed 783 725
EP ENERGY TRADING, a.s. 29/10/2019 fixed 396 247
EP ENERGY TRADING, a.s. 15/11/2020 fixed 200 000
EP Germany GmbH 31/10/2019 fixed 2 646 095
Greeninvest Energy, a.s. 31/12/2022 fixed 143 054
JTSD Braunkohlebergbau GmbH 29/10/2019 fixed 3 702 425
JTSD Braunkohlebergbau GmbH 30/6/2024 fixed 6 461 678
Plzeňská energetika a.s. 29/7/2018 fixed 268 899
POWERSUN a.s. 31/12/2024 fixed 53 872
Triskata, s.r.o. 31/12/2024 fixed 3 876
United Energy, a.s. 30/12/2019 fixed 668 029
United Energy, a.s. 29/10/2019 fixed 938 566
VTE Moldava II, a.s. 31/12/2024 fixed 59 837
VTE Pchery, s.r.o. 31/12/2024 fixed 85 046
Total at 31/12/2015 21 078 851
1 January 2015Company name Due date Interest rate Balance at
1/1/2015
Arisun, a.s. 31/12/2024 fixed 4 775
Elektrárny Opatovice, a.s. 29/10/2019 fixed 4 783 450
Elektrárny Opatovice, a.s. 25/6/2018 fixed 804 025
EP ENERGY TRADING, a.s. 29/10/2019 fixed 406 511
EP ENERGY TRADING, a.s. 15/11/2020 fixed 200 000
EP Germany GmbH 31/10/2019 fixed 2 941 990
Greeninvest Energy, a.s. 31/12/2022 fixed 154 728
JTSD Braunkohlebergbau GmbH 29/10/2019 fixed 3 798 325
JTSD Braunkohlebergbau GmbH 30/6/2024 fixed 6 764 900
Plzeňská energetika a.s. 29/7/2018 fixed 275 864
Plzeňská energetika a.s. 29/10/2019 fixed 254 879
POWERSUN a.s. 31/12/2024 fixed 67 044
Triskata, s.r.o. 31/12/2024 fixed 3 848
United Energy, a.s. 30/12/2019 fixed 685 333
United Energy, a.s. 29/10/2019 fixed 1 129 227
VTE Moldava II, a.s. 31/12/2024 fixed 57 714
VTE Pchery, s.r.o. 31/12/2024 fixed 80 915
Total at 1/1/2015 22 413 528
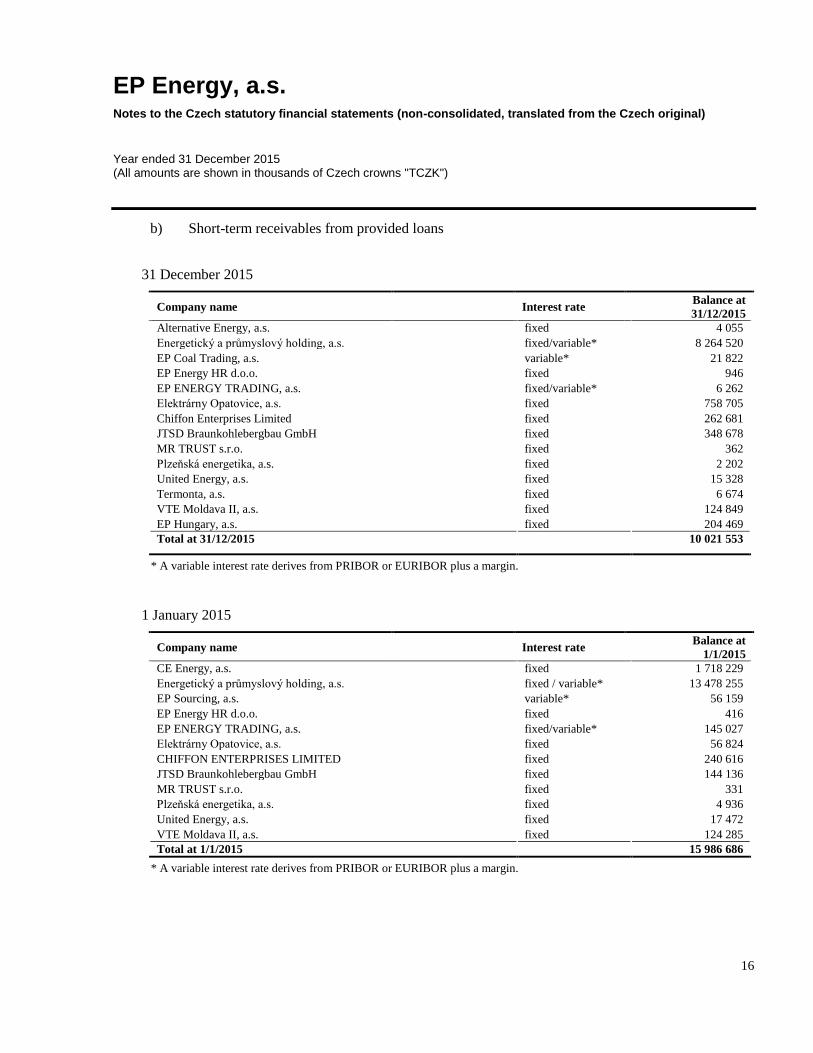
EP Energy, a.s. Notes to the Czech statutory financial statements (non-consolidated, translated from the Czech original)
Year ended 31 December 2015 (All amounts are shown in thousands of Czech crowns "TCZK")
16
b) Short-term receivables from provided loans
31 December 2015
Company name Interest rate Balance at
31/12/2015
Alternative Energy, a.s. fixed 4 055
Energetický a průmyslový holding, a.s. fixed/variable* 8 264 520
EP Coal Trading, a.s. variable* 21 822
EP Energy HR d.o.o. fixed 946
EP ENERGY TRADING, a.s. fixed/variable* 6 262
Elektrárny Opatovice, a.s. fixed 758 705
Chiffon Enterprises Limited fixed 262 681
JTSD Braunkohlebergbau GmbH fixed 348 678
MR TRUST s.r.o. fixed 362
Plzeňská energetika, a.s. fixed 2 202
United Energy, a.s. fixed 15 328
Termonta, a.s. fixed 6 674
VTE Moldava II, a.s. fixed 124 849
EP Hungary, a.s. fixed 204 469
Total at 31/12/2015 10 021 553
* A variable interest rate derives from PRIBOR or EURIBOR plus a margin.
1 January 2015
Company name Interest rate Balance at
1/1/2015
CE Energy, a.s. fixed 1 718 229
Energetický a průmyslový holding, a.s. fixed / variable* 13 478 255
EP Sourcing, a.s. variable* 56 159
EP Energy HR d.o.o. fixed 416
EP ENERGY TRADING, a.s. fixed/variable* 145 027
Elektrárny Opatovice, a.s. fixed 56 824
CHIFFON ENTERPRISES LIMITED fixed 240 616
JTSD Braunkohlebergbau GmbH fixed 144 136
MR TRUST s.r.o. fixed 331
Plzeňská energetika, a.s. fixed 4 936
United Energy, a.s. fixed 17 472
VTE Moldava II, a.s. fixed 124 285
Total at 1/1/2015 15 986 686
* A variable interest rate derives from PRIBOR or EURIBOR plus a margin.

EP Energy, a.s. Notes to the Czech statutory financial statements (non-consolidated, translated from the Czech original)
Year ended 31 December 2015 (All amounts are shown in thousands of Czech crowns "TCZK")
17
c) Other short-term receivables*
Counter-party Balance at
31/12/2015
Balance at
1/1/2015
POWERSUN a.s. -- 308
JTSD Braukohlebergbau GmbH 115 640 930
AISE, s.r.o. -- 136
Alternative Energy, s.r.o. 189 123
ARISUN s.r.o. -- 123
VTE Pchery s.r.o. -- 283
Claymore Equity, s.r.o. 35 123
Energotrans SERVIS, a.s. -- 530
Energzet a.s. -- 527
Elektrárny Opatovice, a.s. 267 3 435
EP Auto, s.r.o. -- 1
EPH Gas Holding B.V. -- 332
EP Energy HR d.o.o. 1 1
EP Cargo, a.s. 571 --
EP Sourcing, a.s. 34 335
LokoTrain, s.r.o. 14 --
Greeninvest Energy, a.s. -- 212
Helmstedter Revier GmbH -- 769
CHIFFON ENTERPRISES LIMITED -- 148
EBEH Opatovice, a.s. -- 232
EP Investment Advisors, s.r.o. 1 525 4 309
Plzeňská energetika a.s. 144 2 768
NPTH, a.s. -- 232
Pražská teplárenská, a.s. 497 2 690
PT Holding Investment B.V. 50 169
ROLLEON a.s. -- 95
EP Industries, a.s. 140 --
Stredoslovenská energetika, a.s. -- 1 581
Triskata, s.r.o. -- 123
EP Coal Trading, a.s. 17 --
United Energy, a.s. 157 5 629
EP ENERGY TRADING, a.s. 2 771 8 658
EP COAL TRADING POLSKA S.A. -- 79
VTE Moldava II, a.s. 9 671 10 097
MR TRUST s.r.o. 329 329
S.E.E.V.I. -- 10
Total 132 052 45 317
* The balances are included in various lines of short-term receivables except for the “Receivables – group undertakings” line.
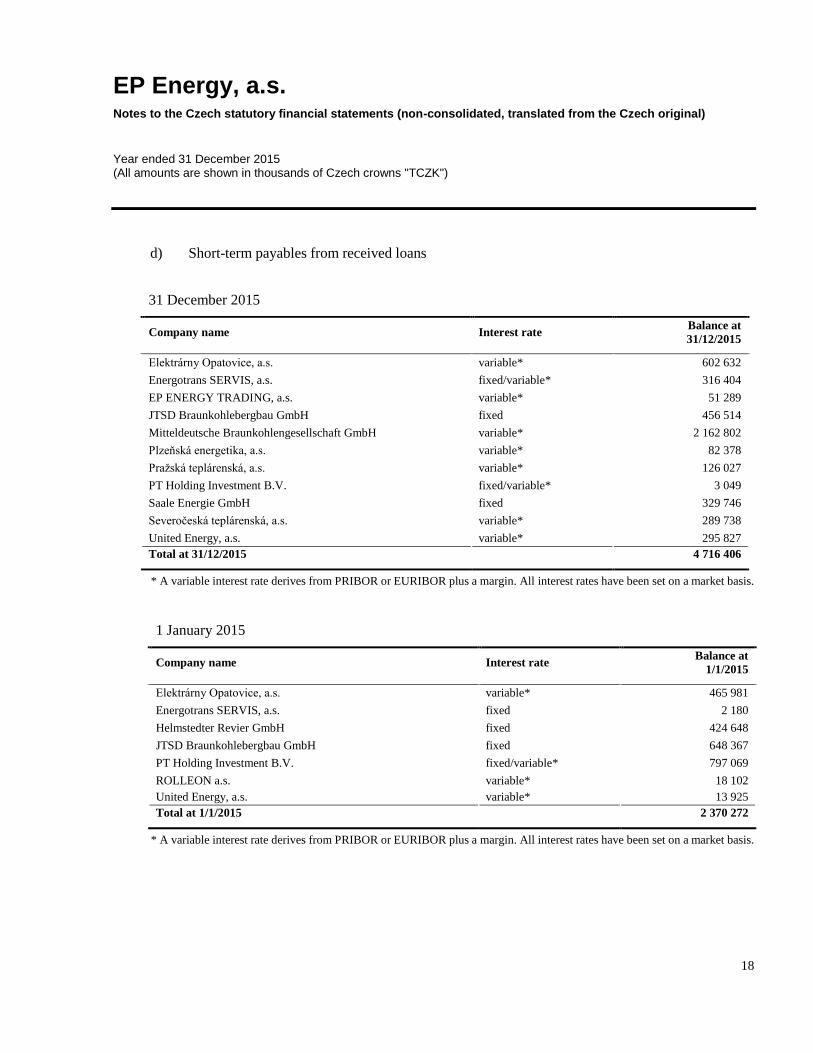
EP Energy, a.s. Notes to the Czech statutory financial statements (non-consolidated, translated from the Czech original)
Year ended 31 December 2015 (All amounts are shown in thousands of Czech crowns "TCZK")
18
d) Short-term payables from received loans
31 December 2015
Company name Interest rate Balance at
31/12/2015
Elektrárny Opatovice, a.s. variable* 602 632
Energotrans SERVIS, a.s. fixed/variable* 316 404
EP ENERGY TRADING, a.s. variable* 51 289
JTSD Braunkohlebergbau GmbH fixed 456 514
Mitteldeutsche Braunkohlengesellschaft GmbH variable* 2 162 802
Plzeňská energetika, a.s. variable* 82 378
Pražská teplárenská, a.s. variable* 126 027
PT Holding Investment B.V. fixed/variable* 3 049
Saale Energie GmbH fixed 329 746
Severočeská teplárenská, a.s. variable* 289 738
United Energy, a.s. variable* 295 827
Total at 31/12/2015 4 716 406
* A variable interest rate derives from PRIBOR or EURIBOR plus a margin. All interest rates have been set on a market basis.
1 January 2015
Company name Interest rate Balance at
1/1/2015
Elektrárny Opatovice, a.s. variable* 465 981
Energotrans SERVIS, a.s. fixed 2 180
Helmstedter Revier GmbH fixed 424 648
JTSD Braunkohlebergbau GmbH fixed 648 367
PT Holding Investment B.V. fixed/variable* 797 069
ROLLEON a.s. variable* 18 102
United Energy, a.s. variable* 13 925
Total at 1/1/2015 2 370 272
* A variable interest rate derives from PRIBOR or EURIBOR plus a margin. All interest rates have been set on a market basis.
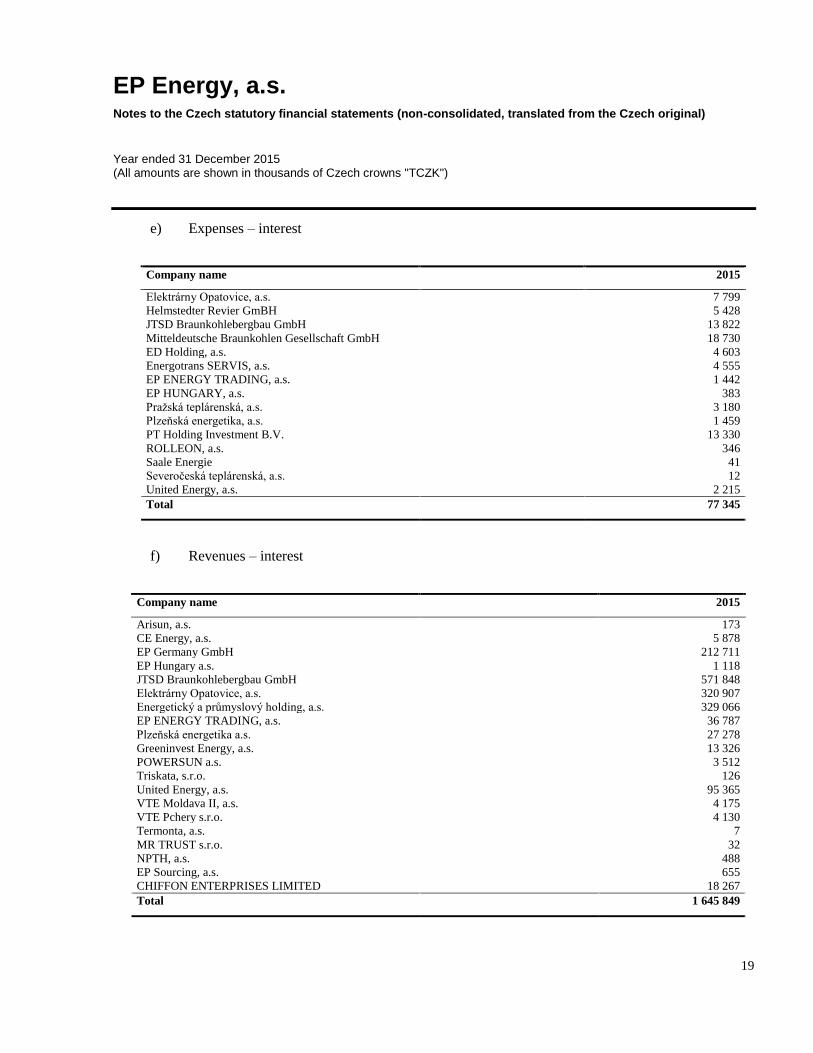
EP Energy, a.s. Notes to the Czech statutory financial statements (non-consolidated, translated from the Czech original)
Year ended 31 December 2015 (All amounts are shown in thousands of Czech crowns "TCZK")
19
e) Expenses – interest
Company name 2015
Elektrárny Opatovice, a.s. 7 799
Helmstedter Revier GmBH 5 428
JTSD Braunkohlebergbau GmbH 13 822
Mitteldeutsche Braunkohlen Gesellschaft GmbH 18 730
ED Holding, a.s. 4 603
Energotrans SERVIS, a.s. 4 555
EP ENERGY TRADING, a.s. 1 442
EP HUNGARY, a.s. 383
Pražská teplárenská, a.s. 3 180
Plzeňská energetika, a.s. 1 459
PT Holding Investment B.V. 13 330
ROLLEON, a.s. 346
Saale Energie 41
Severočeská teplárenská, a.s. 12
United Energy, a.s. 2 215
Total 77 345
f) Revenues – interest
Company name 2015
Arisun, a.s. 173
CE Energy, a.s. 5 878
EP Germany GmbH 212 711
EP Hungary a.s. 1 118
JTSD Braunkohlebergbau GmbH 571 848
Elektrárny Opatovice, a.s. 320 907
Energetický a průmyslový holding, a.s. 329 066
EP ENERGY TRADING, a.s. 36 787
Plzeňská energetika a.s. 27 278
Greeninvest Energy, a.s. 13 326
POWERSUN a.s. 3 512
Triskata, s.r.o. 126
United Energy, a.s. 95 365
VTE Moldava II, a.s. 4 175
VTE Pchery s.r.o. 4 130
Termonta, a.s. 7
MR TRUST s.r.o. 32
NPTH, a.s. 488
EP Sourcing, a.s. 655
CHIFFON ENTERPRISES LIMITED 18 267
Total 1 645 849

EP Energy, a.s. Notes to the Czech statutory financial statements (non-consolidated, translated from the Czech original)
Year ended 31 December 2015 (All amounts are shown in thousands of Czech crowns "TCZK")
20
g) Revenues – dividends
Company name 2015
Rolleon a.s. 5 000
Stredoslovenská energetika, a.s. 691 406
AISE, s.r.o. 9 600
PT Holding Investment B.V. 962 432
NPTH, a.s. 342 200
Total 2 010 638
h) Revenues – other
Company name 2015
EP Cargo, a.s. 571
LokoTrain, a.s. 15
United Energy, a.s. 12 519
Total 13 105
14. Cost of services
These costs primarily include costs incurred for legal and accounting advisory and services rendered by
experts.
15. Other financial expenses and revenues
Other financial revenues primarily comprise foreign exchange gains of TCZK 718 250.
Other financial expenses comprise foreign exchange losses of TCZK 788 029 and expenses associated
with fees for bank loans of TCZK 36 984.
16. Employees and executives
The Company had fourteen employees as at 31 December 2015. As at 1 January 2015, the Company had
eleven employees. TCZK 11 708 of total personnel expenses relates to executives.
Social security liabilities (31/12/2015: TCZK 118; 1/1/2015: TCZK 127) and health insurance liabilities
(31/12/2015: TCZK 290; 1/1/2015: TCZK 265) are not overdue.
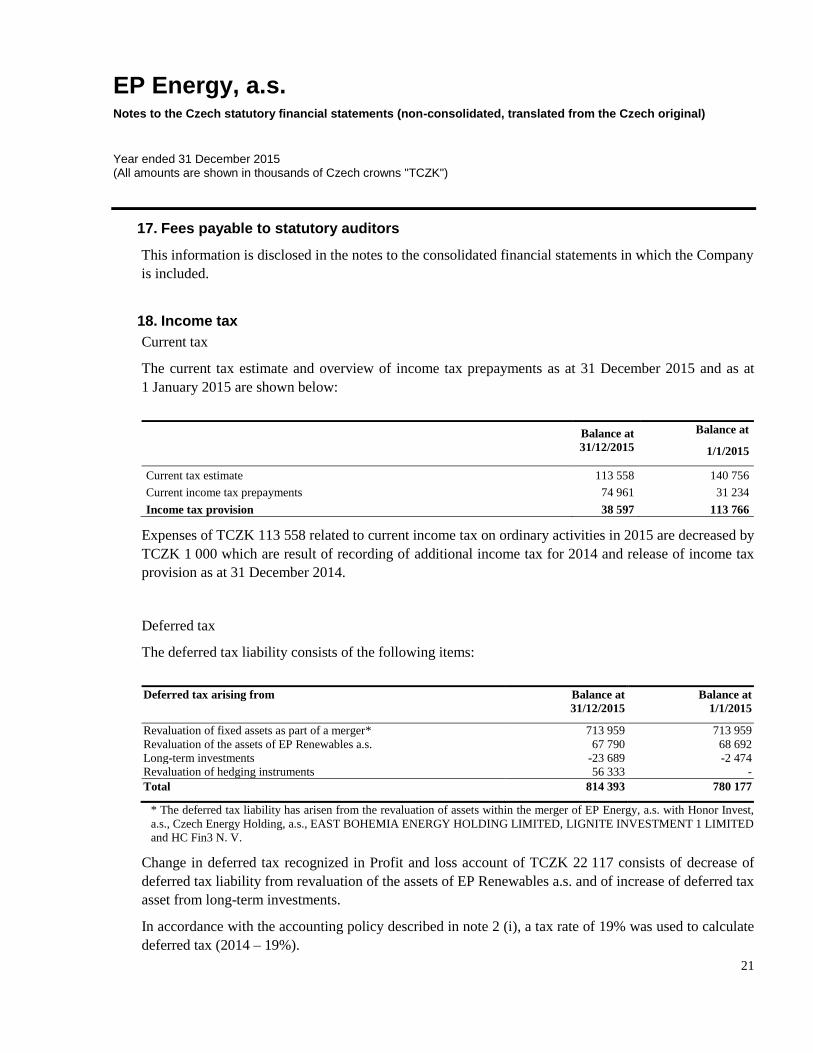
EP Energy, a.s. Notes to the Czech statutory financial statements (non-consolidated, translated from the Czech original)
Year ended 31 December 2015 (All amounts are shown in thousands of Czech crowns "TCZK")
21
17. Fees payable to statutory auditors
This information is disclosed in the notes to the consolidated financial statements in which the Company
is included.
18. Income tax
Current tax
The current tax estimate and overview of income tax prepayments as at 31 December 2015 and as at
1 January 2015 are shown below:
Balance at
31/12/2015
Balance at
1/1/2015
Current tax estimate 113 558 140 756
Current income tax prepayments 74 961 31 234
Income tax provision 38 597 113 766
Expenses of TCZK 113 558 related to current income tax on ordinary activities in 2015 are decreased by
TCZK 1 000 which are result of recording of additional income tax for 2014 and release of income tax
provision as at 31 December 2014.
Deferred tax
The deferred tax liability consists of the following items:
Deferred tax arising from Balance at
31/12/2015
Balance at
1/1/2015
Revaluation of fixed assets as part of a merger* 713 959 713 959
Revaluation of the assets of EP Renewables a.s. 67 790 68 692
Long-term investments -23 689 -2 474
Revaluation of hedging instruments 56 333 -
Total 814 393 780 177
* The deferred tax liability has arisen from the revaluation of assets within the merger of EP Energy, a.s. with Honor Invest,
a.s., Czech Energy Holding, a.s., EAST BOHEMIA ENERGY HOLDING LIMITED, LIGNITE INVESTMENT 1 LIMITED
and HC Fin3 N. V.
Change in deferred tax recognized in Profit and loss account of TCZK 22 117 consists of decrease of
deferred tax liability from revaluation of the assets of EP Renewables a.s. and of increase of deferred tax
asset from long-term investments.
In accordance with the accounting policy described in note 2 (i), a tax rate of 19% was used to calculate
deferred tax (2014 – 19%).
EP Energy, a.s. Notes to the Czech statutory financial statements (non-consolidated, translated from the Czech original)
Year ended 31 December 2015 (All amounts are shown in thousands of Czech crowns "TCZK")
22
19. Contingencies and commitments
In off-balance sheet records the Company reports a liability of TCZK 25 286 272 representing the shares
of the Company’s subsidiaries pledged in favour of ČSOB, HSBC and Commerzbank (as of 1 January in
favour of Unicredit Bank AG London Branch) in connection with a guarantee for a syndicated loan.
In addition, the Company records off-balance sheet a liability of TCZK 773 701 arising from security
interests charged in favour of ČSOB, HSBC and Commerzbank (as of 1 January in favour of Unicredit
Bank AG London Branch).
As well as a liability of TCZK 31 071 908 arising from loans put as a security interest in favour
of ČSOB, HSBC and Commerzbank (as of 1 January in favour of Unicredit Bank AG London Branch).
The Company reports an off-balance sheet liability from derivative transactions in the nominal value of
TCZK 4 717 532.
In addition, the Company reports off-balance sheet a liability from provided guarantees to EP ENERGY
TRADING, a.s. of TCZK 893 303, a liability from provided guarantees to EP Cargo, a.s. of
TCZK 121 613, and a liability from provided guarantees to LokoTrain, a.s. of TCZK 10 000.
20. Receivables kept off-balance sheet
The Company reports off-balance sheet a receivable from derivative transactions in the nominal value of
TCZK 4 829 032.
EP Energy, a.s. Notes to the Czech statutory financial statements (non-consolidated, translated from the Czech original)
Year ended 31 December 2015 (All amounts are shown in thousands of Czech crowns "TCZK")
23
21. Material subsequent events
On 6 April 2016 the parent company CE Energy, a.s. was renamed to EP Infrastructure, a.s. (EPIF). The
change was entered to Commercial register on 11 April 2016.
During 2016 activities and assets held by EPIF were reorganized in view of intended sale of a minority
share of EPIF to third parties. The reorganization also included the following matters relating to the EPE
Company.
German assets sale
German assets include MIBRAG and Saale Energie. MIBRAG is a wholly-owned subsidiary of JTSD,
Saale Energie is a wholly-owned subsidiary of EP Germany; both EP Germany and JTSD were wholly-
owned subsidiaries of EPE.
The German assets were disposed of by means of sale of 100 per cent shares in JTSD by EPE to EPH for
TCZK 4 217 112 (corresponding to fair value of equity of JTSD); the disposal was completed on
1 April 2016 and the purchase price was fully settled in cash.
Further, on 23 February 2016 JTSD set-off its receivables towards EPE in the amount of
TCZK 2 215 010 arising from:
(i) a loan of TCZK 458 060 provided by JTSD to EPE, and
(ii) a loan of TCZK 1 756 950 provided by MIBRAG to EPE (assumed by JTSD from EPE for the nominal
value thereof); following the set off, the total liabilities of JTSD towards EPE amounted to TCZK
8 497 458; and
JTSD assumed a liability of EP Germany towards EPE in the amount of TCZK 1 670 676 (out of the
original total amount of TCZK 2 481 576 outstanding under the loan provided by EPE to EP Germany)
for the nominal value thereof, and
EPE contributed TCZK 1 923 984 to the capital funds of JTSD.
Immediately after the capitalization, the total liabilities of JTSD towards EPE amounted to
TCZK 8 244 150. These were settled by JTSD making a payment to EPE in the amount of
TCZK 8 244 150 and the outstanding receivable of EPE towards JTSD was acquired by EPH for its
nominal value as of the date of the JTSD acquisition by EPH; the consideration was fully settled in cash
TCZK 45 692.
The outstanding amount of the original loan provided by EPE to EP Germany immediately after JTSD
assumed part of this liability of EP Germany to EPE was TCZK 811 650. This was settled by
EP Germany making a payment in the amount of TCZK 811 650 and the outstanding receivable of EPE
towards EP Germany was acquired by EPH for its nominal value as of the date of the JTSD acquisition
by EPH; the consideration of TCZK 6 512 was fully settled in cash.

EP Energy, a.s. Notes to the Czech statutory financial statements (non-consolidated, translated from the Czech original)
Year ended 31 December 2015 (All amounts are shown in thousands of Czech crowns "TCZK")
24
Other disposals of shares
These include sale of:
a. 60% of shares in PGP Terminal, a.s. by EPE (as the seller) to EPH (as the buyer) for the purchase price
of TCZK 6 5129 189 in cash (completed on 29 February 2016),
b. 100% ownership interest in EP Cargo Deutschland GmbH by EP Energy, a.s. (as the seller) to EP
Logistics International, a.s. (as the buyer) for the purchase price of TCZK 9 523 in cash (completed on
4 April 2016),
c. 100% of shares in EP CARGO POLSKA s.a. by EP Energy, a.s. (as the seller) to EP Logistics
International, a.s. (as the buyer) for the purchase price of TCZK 13 176 in cash (completed on 4 April
2016).
Repayment of EP Energy’s term loans
On 4 April 2016 EPE fully repaid the term loans totalling TCZK 4 733 750 previously provided by ČSOB,
HSBC and Commerzbank using the proceeds from the sale of JTSD.
On 4 April 2016 EPE unwound an existing FX forward with EPH and as a result, EPE had a receivable
of TCZK 110 697 towards EPH corresponding to the FX forward fair value. This receivable was acquired
by EP Infrastructure, a.s. for the nominal value thereof, i.e., the Company had a receivable of TCZK
110 697 towards EP Infrastructure, a.s.
On 4 April 2016 EP Infrastructure, a.s. assumed from EPH all debts of EPH owed to EPE at their nominal
values. The debts of EPH towards EPE of TCZK 8 349 611 consisted of unpaid principal loan of TCZK
7 390 477 and unpaid accrued interest of TCZK 959 134.