Embed Size (px)
Citation preview

EOR: The Economic Alternative for CCSDenbury Resources Inc. Gasification Technology Conference October 2007

2Denbury Resources Inc.
Outline
Company Information
The CO2 Pipeline Dilemma
Carbon Capture and Storage
Issues and Potential Solutions

3Denbury Resources Inc.
Company SnapshotDenbury is the largest oil and gas producer in the State of Mississippi
Primarily as a result of CO2 enhanced oil recovery and Denbury’s efforts, Mississippi’s oil production has reversed its decline and is actually increasing
Denbury currently operates seven (7) active CO2 enhanced oil recovery projects in Mississippi and is in the process of initiating three (3) new floods during 2007
Denbury currently injects approximately 400 MMcf (23,000+ tons) of CO2 per day into the seven active floods
Based on our injection volumes we believe we are the largest injector of CO2 on a daily basis in the U.S.
Denbury currently operates approximately 270 miles of CO2 pipelines and is in the process of constructing an additional 400+ miles of CO2 pipelines.
Since 1999, Denbury has produced in excess of 15 MMBbls of oil from CO2Flooding

4Denbury Resources Inc.
Tinsley
Citronelle
Jackson Dome
NEJD
CO
2 P
ipel
ine
Free State Pipeline
Sonat MS Pipeline
Martinville
DavisQuitman
Heidelberg
Summerland Soso
Sandersville
EucuttaYellow Creek
Cypress Creek
BrookhavenMallalieu
Little Creek
Olive
Smithdale
McComb
Cranfield
LakeSt. John
LockhartCrossing
PortBarre
LakeChicot
IberiaThornwell S Lake Arthur SW
Hastings
T E X A S
L O U I S I A N A
M I S S I S S I P P I
Oyster Bayou
Fig Ridge
Delta Pipeline
Green Pipeline
Delhi
CO2 Projects ‐ Total Potential Tertiary Oil Reserves (1)
(1) Probable tertiary oil reserves as of 12/31/06 based on 10% to 17% recovery factors. Hastings Field is under contract but not owned.(2) Projected CO2 production of petroleum coke to ammonia plant expected to be completed during 2010.
Phase 341 MMBbls
Phase 277 MMBbls
Phase 536 MMBbls
Phase 431 MMBbls
Phase 182 MMBbls
Phase 626 MMBblsPhase 7
Hastings Field50 - 90 MMBbls (1)
Faustina Project190 - 225 MMcf/d of CO2
(2)
Phase 8Seabreeze Complex
30 - 40 MMBbls (1)

5Denbury Resources Inc.
CO2 Business Model – Projected Net Oil Production
0
5,000
10,000
15,000
20,000
25,000
30,000
35,000
40,000
45,000
50,000
55,000
60,000
65,000
70,00020
02
2003
2004
2005
2006
2007
2008
2009
2010
2011
2012
2013
2014
2015
NET
BOPD
Phase 1 Phase 2 Phase 3 Phase 4 Phase 5 Phase 6 Phase 7 Phase 8
Note: Forecast based on internal management estimates. Actual results may vary.
(SW MS) (E MS) (Tinsley) (Cranfield/St. John) (Delhi) (Citronelle) (Hastings) (Seabreeze)
6Denbury Resources Inc.
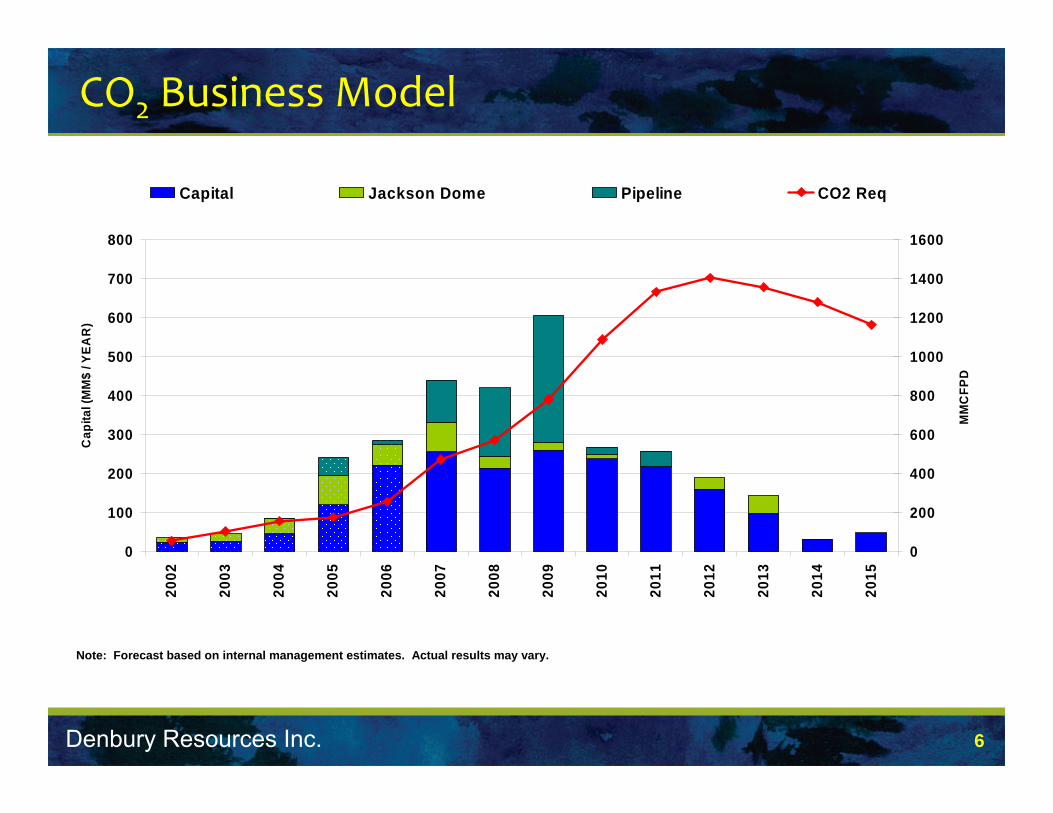
CO2 Business Model
Note: Forecast based on internal management estimates. Actual results may vary.
0
100
200
300
400
500
600
700
800
2002
2003
2004
2005
2006
2007
2008
2009
2010
2011
2012
2013
2014
2015
Cap
ital (
MM
$ / Y
EAR
)
0
200
400
600
800
1000
1200
1400
1600
MM
CFP
D
Capital Jackson Dome Pipeline CO2 Req

7Denbury Resources Inc.
WATER INJECTOR WELLS
Phase I
Phase VPilot
Phase II
Phase I
Phase IV
Phase IIPhase III
Mallalieu, West Unit: 3,574 Acres Mallalieu, East
Phase I
Phase IIPhase IV
Phase III
Pilot
Phase V
Mallalieu Area

8Denbury Resources Inc.
Mallalieu AreaMallalieu Area Net Oil Production vs. Total CO2 Injection
0
1,000
2,000
3,000
4,000
5,000
6,000
7,000
Jan-01 Jul-01 Jan-02 Jul-02 Jan-03 Jul-03 Jan-04 Jul-04 Jan-05 Jul-05 Jan-06 Jul-06 Jan-07
Net B
OP
D
0
100
200
300
MM
CFP
D C
O2
Net Daily Production vs. Total CO2 Injection
Temperature Issues
EMU BOPD (Net)
WMU BOPD (Net)CO2 INJECTION MMCPD
WMU current production 5200 BOPD
EMU current production 700 BOPD

Denbury Resources Inc.
US CO2 Pipelines vs Gasification Projects
Gasification Projects
Existing CO2 Pipelines
“The Dilemma”
10Denbury Resources Inc.
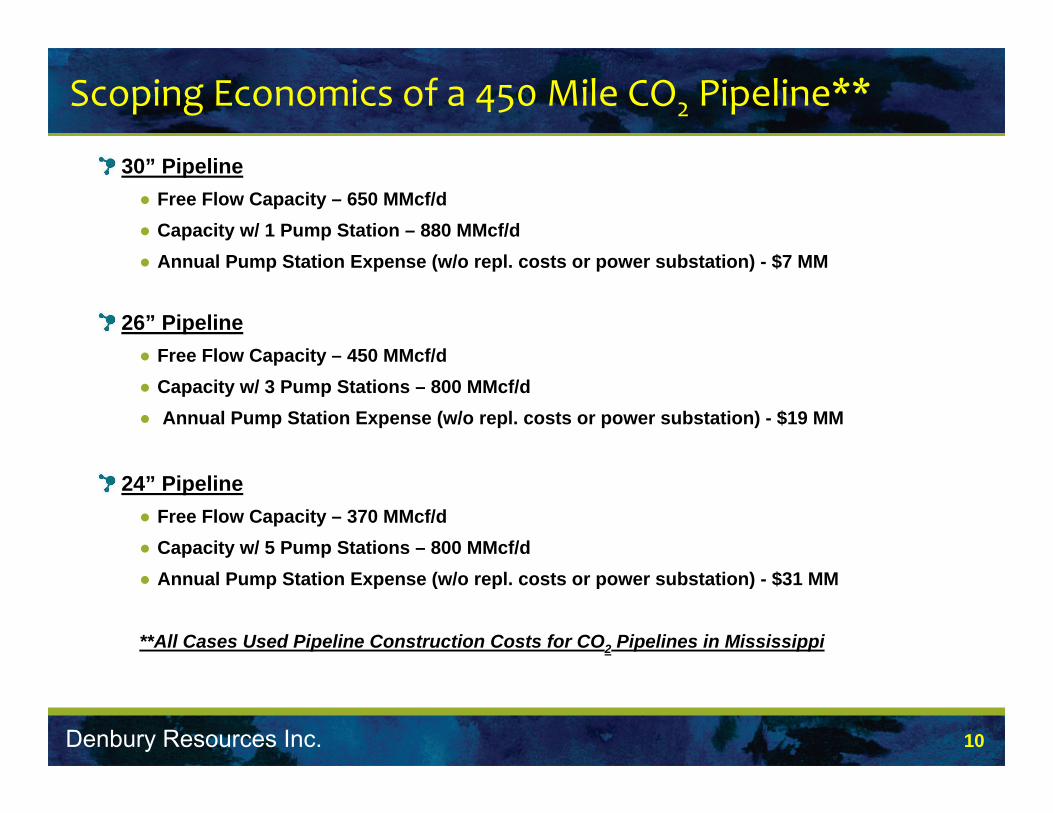
Scoping Economics of a 450 Mile CO2 Pipeline**
30” Pipeline● Free Flow Capacity – 650 MMcf/d● Capacity w/ 1 Pump Station – 880 MMcf/d● Annual Pump Station Expense (w/o repl. costs or power substation) - $7 MM
26” Pipeline● Free Flow Capacity – 450 MMcf/d● Capacity w/ 3 Pump Stations – 800 MMcf/d● Annual Pump Station Expense (w/o repl. costs or power substation) - $19 MM
24” Pipeline● Free Flow Capacity – 370 MMcf/d● Capacity w/ 5 Pump Stations – 800 MMcf/d● Annual Pump Station Expense (w/o repl. costs or power substation) - $31 MM
**All Cases Used Pipeline Construction Costs for CO2 Pipelines in Mississippi

11Denbury Resources Inc.
Compression Capital Costs
Stated Conditions● 15 psig Suction to 2100 psig Discharge● 3 - 5800 T/d Compressors● Purchase Cost - $30 MM● Installation Cost - $30 MM (based on general construction and installation costs)● Total Cost - $60 MM● Total Power Requirement – 82.8 MW
Higher Suction Pressure● 50 psig Suction to 2100 psig Discharge● Purchase Costs - $22.5 MM ● Total Costs - $45 MM● Total Power Requirement – 45 MW
CO2 Capture Pressure is a Major Factor on Costs for CCS

12Denbury Resources Inc.
Total Amortized Cost ($/Mcf)
Amortization Schedule ● 20 and 30 Years
● Solved for Lowest Cost per Mcf Delivered to the EOR Project
● Attempting to Achieve a Utility Type ROR - 30 Year Schedule
● 800 MMcf/d from Day 1
● Two Year Construction Timetable
● Total Capital - $750 M – (24” Pipeline)
Components of Costs – Stated Conditions (15 psig)● Capital Recovery - $0.475/Mcf
● Operating Costs of Pipeline and Booster Stations - $0.146/Mcf
● Total Costs - $0.621/Mcf
● Excludes Costs of Power to Compress CO2
● Excludes Cost for CO2

13Denbury Resources Inc.
Carbon Capture and Storage
Basic Assumption: Everyone will be Required to Deal with CO2 Emissions
The Costs of Capture is the same whether the Emitter Chooses to Ultimately Inject into a Pipeline or Inject into Saline Reservoirs.
CO2 Pipelines Operate at Pressures > 2000 psi
Injection Pressures for Saline Reservoir Injection will most likely be > 2000 psi

14Denbury Resources Inc.
Carbon Capture and Storage – Geologic Example
Single Gasification Project Emitting 200 MMcf/d of CO2
30 Year Life
Total CO2 Emissions – 2.2 Tcf of CO2
Denbury’s DRI Ice Field
16,000’ Underground
Reservoir Pressure - +/- 11,000 psi
Areal Extent - 5,500 acres to spill point (Approx: 9 sq. miles)
Average Thickness - 300’
Storage Capacity - Approx. – 3 Tcf
Thus, the areal extent of a single plant’s CO2 emissions will cover a very large area, much greater than the most likely plant site area.
if thickness = 125’, Area would be the size of Manhattan (22+ sq. miles)
if thickness = 60’, Area would be the size of San Francisco (47+ sq miles)
15Denbury Resources Inc.
Carbon Capture and Storage
Enhanced Oil Recovery Operations Can Provide the “Costs” of Transportation, Sequestration and Liability
Saline Reservoir Injection - All “Costs” for Transportation, Sequestration and Liability will Remain with the Emitter
Therefore;
Enhanced Oil Recovery is the Lowest Cost Option for Sequestering CO2
Emissions Today and for the Foreseeable Future
Provides an Economic Solution for CCS and Provides Additional Quantities of Domestic Oil Production
The Only CCS Method that Produces an Economic Benefit and Social Benefits
The Only CCS Method that can be Utilized Now

16Denbury Resources Inc.
Issues
EOR Projects Require Total Delivered CO2 Costs < $0.50/Mcf at Oil Prices of $30/Bbl to Ensure Its Ability to Continually Take and Sequester the CO2. Higher Oil Prices will allow CO2 to be Transported Longer Distances
CO2 Located Closer to Existing CO2 Pipeline Infrastructure will have a Considerable Cost Advantage
No Different than Natural Gas Production
The Closer Natural Gas is to the User the Higher the Price it Receives (Gulf Coast vs Rockies)

17Denbury Resources Inc.
Solutions
Potential Solutions
● Greenhouse Gas Emissions Credits – “Carbon Value”● Estimated 2010 Values - 100% VER @ $3/ton = $0.17/Mcf @$5/ton = $0.285/Mcf
● State or Federal Subsidies to Offset Costs (Capital and Operating)
● Is there the Possibility that CO2 Capture is Valued by the Community Whereby the Sale Price of the Gasification Product Can Be Increased to Cover a Portion of the Costs of CCS?