Embed Size (px)
Citation preview

News ReFor Furt
EOG ReIncrease
• A• R
L-Y
• DF
• InM
• R• R• In
P• R
FOR IMM H
of $120.7
million, o
or $4.10
elease ther Inform
esources Repes Dividend Achieves 9.4 Reports 52 PeLiquids GrowYear
Delivers Strolow ncreases Eag
MMboe to 1,6Realizes ConRaises Total Cncreases 201ercent
Raises Divide
MEDIATE R
HOUSTON –
7 million, or
or $0.21 per
per share, as
EOG Resou
mation Conta
ports 2011 R
Percent Yeaercent North
wth with 48 P
ng Year-Ov
gle Ford Pote600 MMboetinued DrilliCompany Pr
12 Total Com
end on Comm
RELEASE:
– EOG Reso
r $0.45 per sh
share. For th
s compared t
urces, Inc.
act:
Results, Inc
ar-Over-Yeah American APercent Incre
er-Year Gro
ential Recove, Net After Ring Success roved Reservmpany Organ
mon Stock f
Thursday, F
urces, Inc. (E
hare. This co
he full year
to $160.7 mi
P
creases Eagl
ar Total ComAnnual Crudease in Tota
owth in EPS,
verable ReseRoyalty in Permian Bves 5.3 Percnic Liquids G
for 13th Time
February 16,
EOG) today
ompares to f
2011, EOG
illion, or $0.
.O. Box 4362
InvestorMaire A(713) 65Elizabet(713) 65
Media K Leona(713) 57
le Ford Res
mpany Produde Oil, Condal Company L
, EBITDAX
erve Estimate
Basin Wolfcent at AttracGrowth Targ
e in 13 Year
2012
y reported fou
fourth quarte
reported net
.63 per share
Hou
rs A. Baldwin 51-6EOG (65th M. Ivers 51-7132
ard 71-3870
erve Potent
uction Growtdensate and NLiquids Volu
and Discret
e by 78 Perc
camp and Lective Findingget from 27
rs
urth quarter
er 2010 net i
t income of $
e, for the ful
uston, TX 77210‐4
51-6364)
tial and
th Natural Gas umes Year-O
tionary Cash
cent – from 9
eonard Shaleg Costs Percent to 3
2011 net inc
ncome of $5
$1,091.1 mil
ll year 2010.
4362
Over
h
900
e
0
come
53.7
llion,
Consistent with some analysts’ practice of matching realizations to settlement months,
and making certain other adjustments in order to exclude one-time items, adjusted non-GAAP
net income for the quarter was $309.0 million, or $1.15 per share. Adjusted non-GAAP net
income for the fourth quarter 2010 was $92.0 million, or $0.36 per share. The results for the
fourth quarter 2011 included a $249.1 million, net of tax ($0.93 per share) impairment of certain
North American non-core natural gas assets, gains on asset dispositions of $33.3 million, net of
tax ($0.12 per share), the write-off of fees associated with revolving credit facilities of $3.7
million, net of tax ($0.01 per share) and a previously disclosed non-cash net gain of $145.5
million ($93.2 million after tax, or $0.35 per share) on the mark-to-market of financial
commodity contracts. During the quarter, the net cash inflow related to financial commodity
contracts was $96.9 million ($62.0 million after tax, or $0.23 per share).
On a similar basis, eliminating the items detailed in the attached table, adjusted non-
GAAP net income for the full year 2011 was $1,008.5 million, or $3.79 per share, and for the
full year 2010 was $296.4 million, or $1.16 per share. (Please refer to the attached tables for the
reconciliation of adjusted non-GAAP net income to GAAP net income.)
“EOG had an exceptional year in 2011 with a 551 percent increase in earnings per share
versus 2010. This solidifies the completion of our goal of becoming an oil company. These
strong returns are one of the traditional hallmarks of EOG,” said Mark G. Papa, Chairman and
Chief Executive Officer.
Through its focus on higher margins and returns, EOG posted strong financial metrics
year-over-year in adjusted non-GAAP earnings per share, adjusted EBITDAX and discretionary
cash flow. Compared to 2010, adjusted non-GAAP earnings per share increased 227 percent,
adjusted EBITDAX increased 55 percent and discretionary cash flow rose 52 percent. (Please
refer to the attached tables for the reconciliation of adjusted non-GAAP net income per share to
GAAP net income per share, adjusted EBITDAX (non-GAAP) to income before interest expense
and income taxes (GAAP) and non-GAAP discretionary cash flow to net cash provided by
operating activities (GAAP).)
2011 Operational Highlights
For the full year 2011, total company production increased 9.4 percent compared to 2010,
driven by 52 percent organic growth in North American crude oil, condensate and natural gas
liquids, and a 48 percent increase in total company liquids production. During the fourth quarter,
United States crude oil and condensate production rose 68 percent compared to 2010,
contributing to a 61 percent increase for the full year 2011.

Crude Oil and Liquids Activity
2011 marked a significant year in the development of EOG’s single largest asset, the
South Texas Eagle Ford. Production at year-end was 66 thousand barrels of oil equivalent per
day, net, 78 percent of which was crude oil.
Starting 2011 with a 12-rig drilling program that ramped up to 26 rigs in December, EOG
drilled and completed 244 net wells during the year with a focus on optimizing completion
techniques, in addition to reducing drilling days and overall well costs. Moving into development
mode early in 2011, EOG began shifting its attention to increasing recovery of the oil-in-place in
the field. To test the impact of well spacing on reserve recoveries, EOG drilled eight pilot
programs that included 33 total wells. Based on production analysis from these pilots and
reservoir modeling, EOG is now pursuing development drilling on 65 to 90-acre spacing,
significantly tighter than the original density of 130 acres between wells.
After taking into account both the excellent results from the 375 wells it has drilled to
date across its 120-mile acreage position and the results from the down-spaced drilling tests,
EOG has increased its estimated potential reserves in the Eagle Ford from 900 million barrels of
oil equivalent (MMboe) to 1,600 MMboe, net after royalty (NAR). The 700 MMBoe, NAR, or
78 percent increase represents an estimated 6 percent recovery factor. On its 572,000 net acres in
the prolific oil window, EOG has identified approximately 3,200 remaining drilling locations and
increased its average per well estimate to 450 thousand barrels of oil equivalent (MBoe), NAR.
EOG’s well results in the Eagle Ford continue to lead the industry. In Gonzales County,
the Henkhaus Unit #1H, #2H, #3H, #4H, #6H and #7H wells were drilled on a pattern of 65-acre
spacing. The six wells were completed to sales at individual initial production rates ranging from
2,424 to 3,733 barrels of oil per day (Bopd) with 442 to 679 barrels per day (Bpd) of natural gas
liquids (NGLs) and 2.2 to 3.4 million cubic feet per day (MMcfd) of natural gas per well. The
Mitchell Unit #3H, #4H, #5H, #6H, #7H and #8H wells, which were also drilled as down-spaced
pilots, began initial production at 2,833 to 3,527 Bopd with 275 to 485 Bpd of NGLs and 1.4 to
2.4 MMcfd of natural gas per well. The Meyer #3H, #4H, #5H, #8H and #9H wells had
individual peak oil rates ranging from 1,647 to 2,813 Bopd with 199 to 413 Bpd of NGLs and
1.0 to 2.1 MMcfd of natural gas. EOG has 100 percent working interest in these 17 Gonzales
County wells.
“With tremendous resource potential still remaining on our acreage, we continue to test
and apply techniques that will increase the oil recovery and potential of the Eagle Ford, our
crown jewel. This strategy takes us into the next inning of development. By concentrating our
efforts on getting more oil out of the ground early in the development phase, we are taking a
good asset and making it great,” Papa said. “Looking across the industry, we believe EOG’s
Eagle Ford position represents the largest domestic net oil discovery in 40 years and the highest
rate of return play in North America today.”
In the Fort Worth Barnett Shale Combo, EOG’s second largest driver of liquids growth
during 2011, total liquids production increased 107 percent compared to 2010, driven by a 124
percent increase in crude oil and condensate production. In Montague County, a pattern of five
horizontal wells, the Badger A Unit #1H, B Unit #2H, C Unit #3H, D Unit #4H and E Unit #5H
showed initial peak oil production rates ranging from 525 to 659 Bopd with 106 to 205 Bpd of
NGLs and 704 to 1,361 Mcfd (thousand cubic feet per day) of natural gas per well. EOG has 100
percent working interest in the wells, which had an average peak crude oil production rate of 604
Bopd per well. A series of 10 McKown wells drilled in Cooke County, began producing to sales
at an average oil rate of 689 Bopd, with 210 Bpd of NGLs and 1.4 MMcfd of natural gas per
well. EOG has 93 percent working interest in these wells.
During 2011, EOG expanded its core holdings in the Barnett Combo by approximately
25,000 acres to 200,000 net acres. Following the success of its drilling program last year, EOG
expects the Barnett Combo to be its second largest liquids production growth contributor again in
2012.
In the West Texas Permian Basin, EOG increased drilling activity in the Wolfcamp
formation during the second half of 2011 in preparation for a more active year in 2012. EOG
reported success from the upper Wolfcamp zone. The University 9 #2803H in Reagan County,
25 miles west of its current middle Wolfcamp activity began production at 883 Bopd with 68
Bpd of NGLs and 388 Mcfd of natural gas. EOG has a 100 percent working interest in the well.
In Irion County, the University 43 #0902H and 40A #0402H were completed in the middle
Wolfcamp zone at initial oil rates of 1,088 and 1,076 Bopd, respectively. In addition to the strong
oil production, the wells were turned to sales with 86 and 129 Bpd of NGLs and 489 and 736
Mcfd of natural gas, respectively. EOG has 90 and 85 percent working interest in the wells,
respectively. On the border between Irion and Crockett counties, the University 40 #1309H and
38 #0601H began production at 1,738 and 1,077 Bopd with 137 and 119 Bpd of NGLs and 779
and 678 Mcfd of natural gas, respectively. EOG has 88 percent working interest in these wells.
EOG plans to operate a four-rig drilling program in the Wolfcamp during 2012.
In the New Mexico Leonard Shale, EOG reported drilling success from Lea County with
the Caballo 23 Fed #4H and #6H. The wells, in which EOG has 86 percent working interest,

initially produced at 932 and 750 Bopd with 116 and 99 Bpd of NGLs and 636 and 545 Mcfd of
natural gas, respectively. During 2012, EOG is positioned to increase its drilling activity in the
Leonard Shale with a year-long two-rig program.
Consistent with its game plan to increase recovery rates in existing fields, during 2011
EOG continued infill drilling on its core acreage in the North Dakota Bakken Parshall Field,
which it discovered in 2006. Although originally developed on 640-acre spacing, EOG has
successfully tested 320-acre down-spacing in various areas and around the perimeters of the
field. A recent well in Mountrail County, the Fertile 48-0905H, in which EOG has a 96 percent
working interest, was completed at an initial rate of 1,324 Bopd. Also in Mountrail County, the
Liberty 24-2531H and Liberty LR 20-26H were drilled on 320-acre spacing. The wells, in which
EOG has 82 and 95 percent working interest, respectively, were turned to sales at initial crude oil
rates of 1,507 and 1,165 Bopd, respectively. Over the course of 2012, EOG will continue its
efforts to increase recovery of the oil-in-place on its Bakken acreage through further down-
spacing tests and the initiation of a secondary recovery pilot project.
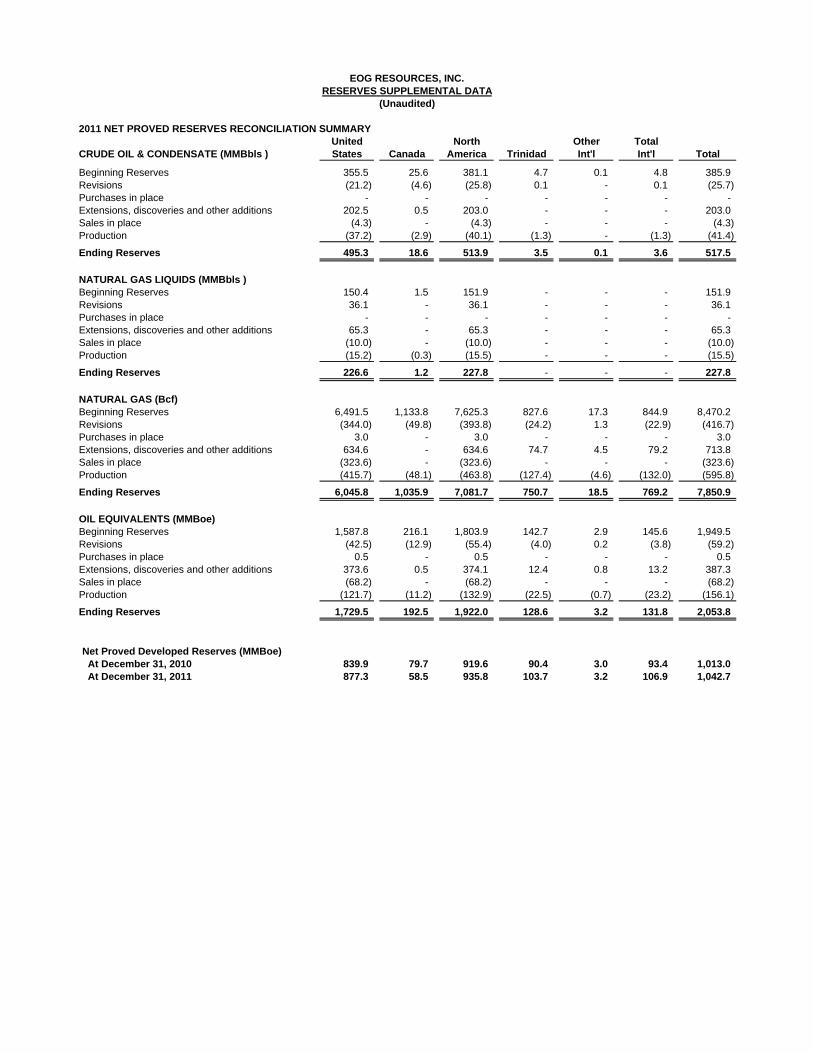
Reserves
EOG’s total company net proved reserves for 2011 increased 5.3 percent over the prior
year from 1,950 to 2,054 MMBoe, all organic. Total liquids proved reserves increased 39 percent
year-over-year. Excluding the impact of property dispositions, total company and total North
American net proved developed reserves increased 8.8 percent and 8.2 percent, respectively.
Total liquids proved reserves, as a percentage of total company proved reserves, increased from
28 percent to 36 percent.
In 2011:
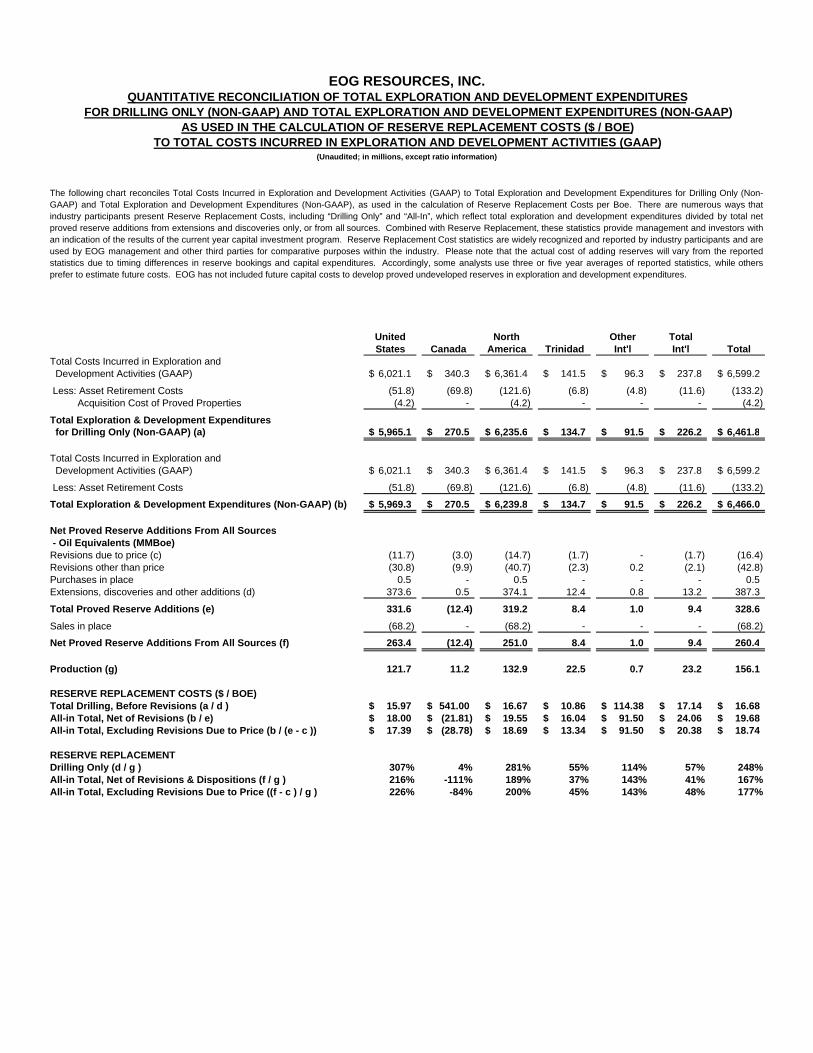
• Total reserve replacement from all sources – the ratio of net reserve additions from
drilling, acquisitions, total revisions and dispositions to total production – was 167
percent at a total reserve replacement cost of $19.68 per barrel of oil equivalent
(Boe), based on exploration and development expenditures of $6,466 million. (For the
calculation of total reserve replacement and total reserve replacement costs, please
refer to the attached tables.)
• Total liquids reserve replacement from all sources – the ratio of net reserve additions
from drilling, acquisitions, total revisions and dispositions to total production – was
465 percent. (For the calculation of total liquids reserve replacement, please refer to
the attached tables.)

• Reserve replacement from drilling – the ratio of extensions, discoveries and other
additions to total production – was 248 percent. (Pease refer to the attached tables.)
• In the United States, total reserve replacement from all sources was 216 percent at a
reserve replacement cost of $18.00 per Boe based on exploration and development
expenditures of $5,969 million. (For the calculation of U.S. total reserve replacement
and total reserve replacement costs, please refer to the attached tables.) In the United
States, 72 percent of the reserve additions were liquids.
For the 24th consecutive year, internal reserve estimates were within 5 percent of those
prepared by the independent reserve engineering firm of DeGolyer and MacNaughton (D&M).
For 2011, D&M prepared a complete independent engineering analysis of properties containing
85 percent of EOG’s proved reserves on a Boe basis.
Natural Gas Activity
EOG is continuing to de-emphasize dry natural gas drilling activity on its Haynesville,
Marcellus and Horn River acreage to pursue higher rate of return opportunities in its crude oil
and liquids-rich unconventional resource plays. Since 2008, EOG’s North American natural gas
production has declined annually, with a 7 percent reduction from 2010 to 2011. Because EOG’s
outlook for natural gas prices is weak for the next several years, EOG plans to invest the
minimum amount of capital expenditures necessary to hold its core acreage positions. During
2012, approximately 10 percent of EOG’s exploration and development capital expenditures is
expected to be allocated to dry natural gas drilling activity, a significant decrease from 2011.
Capital Structure
During 2011, total cash proceeds from asset sales were $1.43 billion. At December 31,
2011, EOG’s total debt outstanding was $5,009 million for a debt-to-total capitalization ratio of
28 percent. Taking into account cash on the balance sheet of $616 million at year-end, EOG’s net
debt was $4,393 million for a net debt-to-total capitalization ratio of 26 percent. (Please refer to
the attached tables for the reconciliation of net debt (non-GAAP) to current and long-term debt
(GAAP) and the reconciliation of net debt-to-total capitalization ratio (non-GAAP) to debt-to-
total capitalization ratio (GAAP).)
“EOG hit a series of home runs during 2011. We exceeded our crude oil production
growth targets and increased the estimated reserves in the Eagle Ford by increasing individual
per well reserves and improving the overall recovery factor in the field,” Papa said. “The
business model we set in motion several years ago is working, evidenced by the outstanding
operational and financial metrics EOG achieved in 2011.”

2012 Operational Plans and Targets
EOG is targeting total company production growth of 5.5 percent in 2012 and has
increased its total organic liquids production growth forecast from the previously stated 27
percent to 30 percent. Total liquids growth is expected to be comprised of a 30 percent increase
in crude oil and condensate production and a 30 percent increase in natural gas liquids
production. In North America, natural gas production is expected to decrease 11 percent from
2011, reflecting additional producing property sales and a further de-emphasis on natural gas
drilling in a weak price environment.
Estimated exploration and production expenditures for 2012 are expected to range from
$7.4 to $7.6 billion, including exploration and development, production facilities and midstream
expenditures. To offset any funding gap between estimated cash flows and capital expenditures,
EOG expects to sell approximately $1.2 billion of assets during 2012, including crude oil,
liquids-rich and natural gas producing properties, of which $340 million has closed to date. With
a continued focus on the balance sheet in 2012, EOG plans to maintain a net debt-to-total
capitalization ratio below 30 percent at year-end.
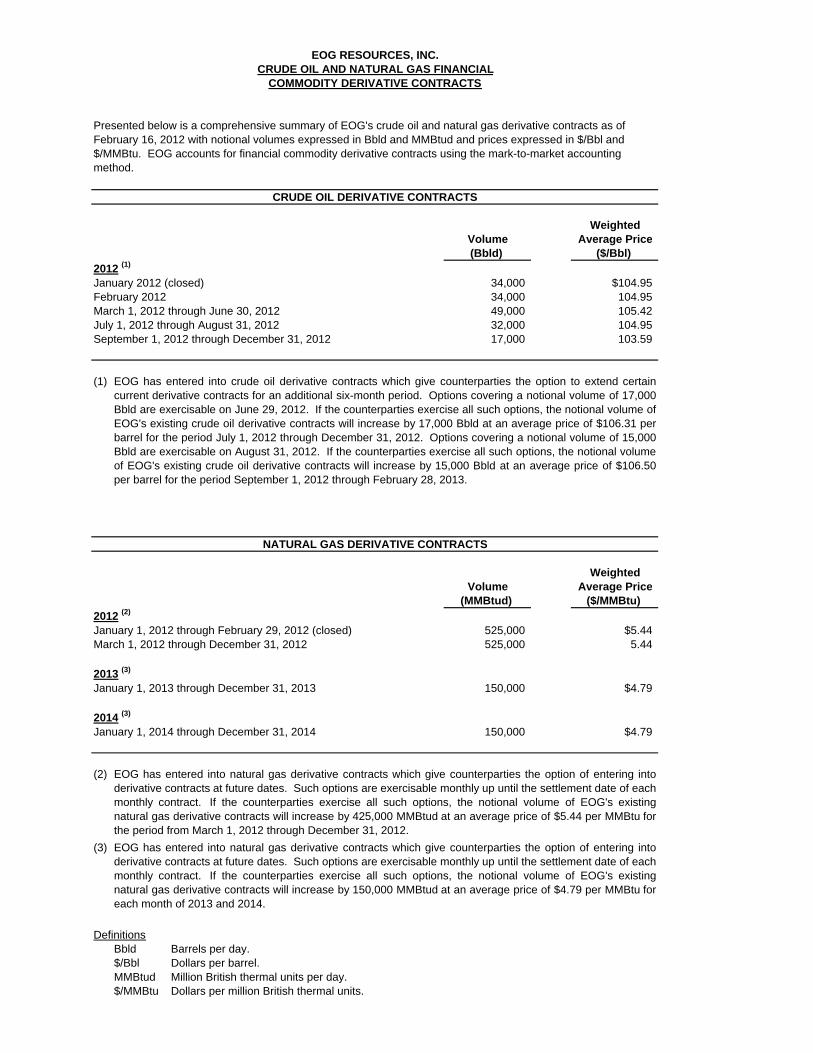
EOG has hedged approximately 23 percent of its North American crude oil production
for 2012. For the period February 1 through June 30, 2012, EOG has crude oil financial price
swap contracts in place for approximately 33 percent of its production at a weighted average
price of $105.36 per barrel, excluding unexercised options. For the period July 1 through
December 31, 2012, EOG has 14 percent of its production hedged at a weighted average price of
$104.26 per barrel, excluding unexercised options.
For 2012, EOG has hedged approximately 45 percent of its North American natural gas
production. For the period March 1 through December 31, 2012, EOG has natural gas financial
price swap contracts in place for 525,000 million British thermal units per day (MMBtud) at a
weighted average price of $5.44 per million British thermal units (MMBtu), excluding
unexercised options. For each of the years 2013 and 2014, EOG has natural gas financial price
swap contracts of 150,000 MMBtud in place at a weighted average price of $4.79 per MMBtu,
excluding unexercised options. (For a comprehensive summary of crude oil and natural gas
derivative contracts, please refer to the attached tables.)
Dividend Increase
Following an increase in the common stock dividend in 2011, EOG’s Board of Directors
has again increased the cash dividend on the common stock. Effective with the dividend payable
on April 30, 2012, to holders of record as of April 16, 2012, the quarterly dividend on the
common stock will be $0.17 per share, an increase of 6.25 percent over the previous indicated
annual rate. The indicated annual rate of $0.68 per share reflects the 13th increase in 13 years.
Conference Call Scheduled for February 17, 2012
EOG’s full year 2011 results conference call will be available via live audio webcast at 8
a.m. Central time (9 a.m. Eastern time) on Friday, February 17, 2012. To listen, log on to
www.eogresources.com. The webcast will be archived on EOG’s website through March 2,
2012.
EOG Resources, Inc. is one of the largest independent (non-integrated) crude oil and
natural gas companies in the United States with proved reserves in the United States, Canada,
Trinidad, the United Kingdom and China. EOG Resources, Inc. is listed on the New York Stock
Exchange and is traded under the ticker symbol “EOG.” This press release includes forward-looking statements within the meaning of Section 27A of the Securities Act of 1933, as amended, and Section 21E of the Securities Exchange Act of 1934, as amended. All statements, other than statements of historical facts, including, among others, statements and projections regarding EOG's future financial position, operations, performance, business strategy, returns, budgets, reserves, levels of production and costs and statements regarding the plans and objectives of EOG's management for future operations, are forward-looking statements. EOG typically uses words such as "expect," "anticipate," "estimate," "project," "strategy," "intend," "plan," "target," "goal," "may," "will" and "believe" or the negative of those terms or other variations or comparable terminology to identify its forward-looking statements. In particular, statements, express or implied, concerning EOG's future operating results and returns or EOG's ability to replace or increase reserves, increase production or generate income or cash flows are forward-looking statements. Forward-looking statements are not guarantees of performance. Although EOG believes the expectations reflected in its forward-looking statements are reasonable and are based on reasonable assumptions, no assurance can be given that these assumptions are accurate or that any of these expectations will be achieved (in full or at all) or will prove to have been correct. Moreover, EOG's forward-looking statements may be affected by known and unknown risks, events or circumstances that may be outside EOG's control. Important factors that could cause EOG's actual results to differ materially from the expectations reflected in EOG's forward-looking statements include, among others: • the timing and extent of changes in prices for, and demand for, crude oil, natural gas and related commodities; • the extent to which EOG is successful in its efforts to acquire or discover additional reserves; • the extent to which EOG can optimize reserve recovery and economically develop its plays utilizing horizontal and vertical drilling and
advanced completion technologies; • the extent to which EOG is successful in its efforts to economically develop its acreage in, and to produce reserves and achieve anticipated
production levels from, its existing and future crude oil and natural gas exploration and development projects, given the risks and uncertainties inherent in drilling, completing and operating crude oil and natural gas wells and the potential for interruptions of development and production, whether involuntary or intentional as a result of market or other conditions;
• the extent to which EOG is successful in its efforts to market its crude oil, natural gas and related commodity production; • the availability, proximity and capacity of, and costs associated with, gathering, processing, compression and transportation facilities; • the availability, cost, terms and timing of issuance or execution of, and competition for, mineral licenses and leases and governmental and
other permits and rights-of-way; • the impact of, and changes in, government policies, laws and regulations, including tax laws and regulations, environmental laws and
regulations relating to air emissions, waste disposal and hydraulic fracturing and laws and regulations imposing conditions and restrictions on drilling and completion operations;
• EOG's ability to effectively integrate acquired crude oil and natural gas properties into its operations, fully identify existing and potential problems with respect to such properties and accurately estimate reserves, production and costs with respect to such properties;
• the extent to which EOG's third-party-operated crude oil and natural gas properties are operated successfully and economically; • competition in the oil and gas exploration and production industry for employees and other personnel, equipment, materials and services
and, related thereto, the availability and cost of employees and other personnel, equipment, materials and services; • the accuracy of reserve estimates, which by their nature involve the exercise of professional judgment and may therefore be imprecise; • weather, including its impact on crude oil and natural gas demand, and weather-related delays in drilling and in the installation and
operation of production, gathering, processing, compression and transportation facilities; • the ability of EOG's customers and other contractual counterparties to satisfy their obligations to EOG and, related thereto, to access the
credit and capital markets to obtain financing needed to satisfy their obligations to EOG; • EOG's ability to access the commercial paper market and other credit and capital markets to obtain financing on terms it deems acceptable,
if at all; • the extent and effect of any hedging activities engaged in by EOG; • the timing and extent of changes in foreign currency exchange rates, interest rates, inflation rates, global and domestic financial market
conditions and global and domestic general economic conditions; • political developments around the world, including in the areas in which EOG operates; • the timing and impact of liquefied natural gas imports and exports; • the use of competing energy sources and the development of alternative energy sources; • the extent to which EOG incurs uninsured losses and liabilities; • acts of war and terrorism and responses to these acts; and

• the other factors described under Item 1A, "Risk Factors", on pages 14 through 20 of EOG's Annual Report on Form 10-K for the fiscal year ended December 31, 2010 and any updates to those factors set forth in EOG's subsequent Quarterly Reports on Form 10-Q or Current Reports on Form 8-K.
In light of these risks, uncertainties and assumptions, the events anticipated by EOG's forward-looking statements may not occur, and, if any of such events do, we may not have anticipated the timing of their occurrence or the extent of their impact on our actual results. Accordingly, you should not place any undue reliance on any of EOG's forward-looking statements. EOG's forward-looking statements speak only as of the date made and EOG undertakes no obligation, other than as required by applicable law, to update or revise its forward-looking statements, whether as a result of new information, subsequent events, anticipated or unanticipated circumstances or otherwise. Effective January 1, 2010, the United States Securities and Exchange Commission (SEC) permits oil and gas companies, in their filings with the SEC, to disclose not only "proved" reserves (i.e., quantities of oil and gas that are estimated to be recoverable with a high degree of confidence), but also "probable" reserves (i.e., quantities of oil and gas that are as likely as not to be recovered) as well as "possible" reserves (i.e., additional quantities of oil and gas that might be recovered, but with a lower probability than probable reserves). As noted above, statements of reserves are only estimates and may not correspond to the ultimate quantities of oil and gas recovered. Any reserve estimates provided in this press release that are not specifically designated as being estimates of proved reserves may include “potential” reserves and/or other estimated reserves not necessarily calculated in accordance with, or contemplated by, the SEC's latest reserve reporting guidelines. Investors are urged to consider closely the disclosure in EOG's Annual Report on Form 10-K for the fiscal year ended December 31, 2010, available from EOG at P.O. Box 4362, Houston, Texas 77210-4362 (Attn: Investor Relations). You can also obtain this report from the SEC by calling 1-800-SEC-0330 or from the SEC's website at www.sec.gov.
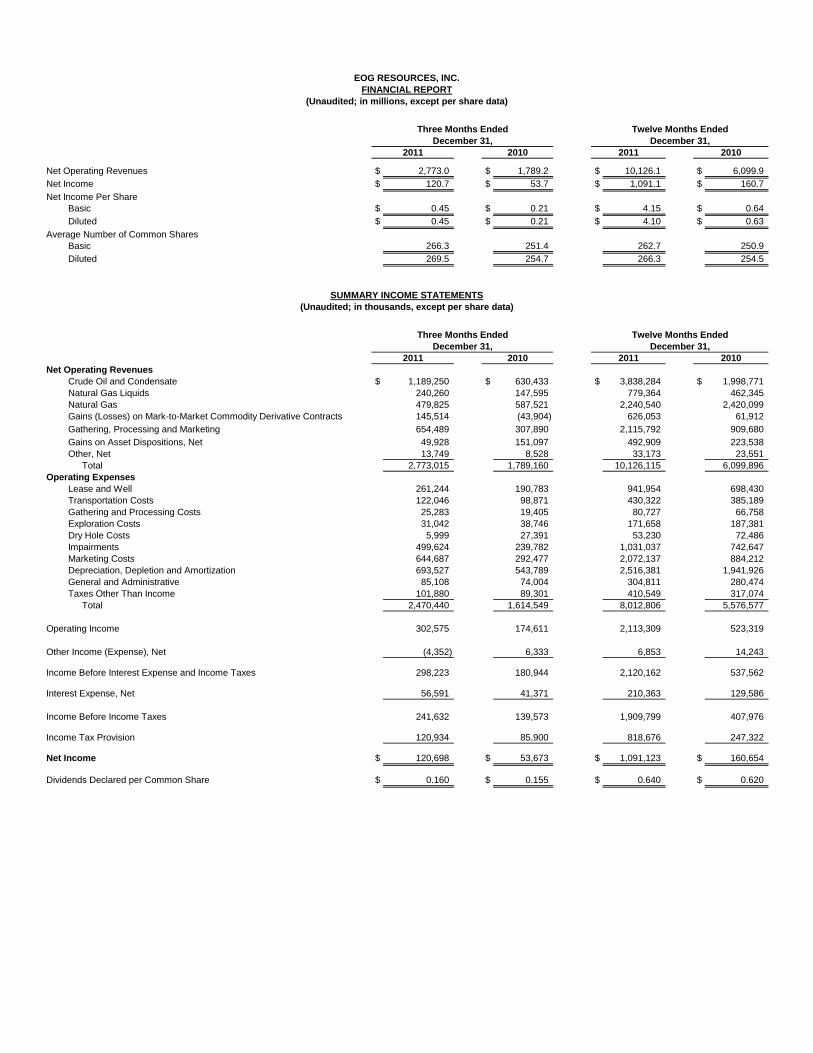
Net Operating Revenues $ 2,773.0 $ 1,789.2 $ 10,126.1 $ 6,099.9 Net Income $ 120.7 $ 53.7 $ 1,091.1 $ 160.7 Net Income Per Share
Basic $ 0.45 $ 0.21 $ 4.15 $ 0.64 Diluted $ 0.45 $ 0.21 $ 4.10 $ 0.63
Average Number of Common SharesBasic 266.3 251.4 262.7 250.9 Diluted 269.5 254.7 266.3 254.5
Net Operating RevenuesCrude Oil and Condensate $ 1,189,250 $ 630,433 $ 3,838,284 $ 1,998,771 Natural Gas Liquids 240,260 147,595 779,364 462,345 Natural Gas 479,825 587,521 2,240,540 2,420,099 Gains (Losses) on Mark-to-Market Commodity Derivative Contracts 145,514 (43,904) 626,053 61,912 Gathering, Processing and Marketing 654,489 307,890 2,115,792 909,680 Gains on Asset Dispositions, Net 49,928 151,097 492,909 223,538 Other, Net 13,749 8,528 33,173 23,551
Total 2,773,015 1,789,160 10,126,115 6,099,896 Operating Expenses
Lease and Well 261,244 190,783 941,954 698,430 Transportation Costs 122,046 98,871 430,322 385,189 Gathering and Processing Costs 25,283 19,405 80,727 66,758 Exploration Costs 31,042 38,746 171,658 187,381 Dry Hole Costs 5,999 27,391 53,230 72,486 Impairments 499,624 239,782 1,031,037 742,647 Marketing Costs 644,687 292,477 2,072,137 884,212 Depreciation, Depletion and Amortization 693,527 543,789 2,516,381 1,941,926 General and Administrative 85,108 74,004 304,811 280,474 Taxes Other Than Income 101,880 89,301 410,549 317,074
Total 2,470,440 1,614,549 8,012,806 5,576,577
Operating Income 302,575 174,611 2,113,309 523,319
Other Income (Expense), Net (4,352) 6,333 6,853 14,243
Income Before Interest Expense and Income Taxes 298,223 180,944 2,120,162 537,562
Interest Expense, Net 56,591 41,371 210,363 129,586
Income Before Income Taxes 241,632 139,573 1,909,799 407,976
Income Tax Provision 120,934 85,900 818,676 247,322
Net Income $ 120,698 $ 53,673 $ 1,091,123 $ 160,654
Dividends Declared per Common Share $ 0.160 $ 0.155 $ 0.640 $ 0.620
(Unaudited; in thousands, except per share data)
EOG RESOURCES, INC.FINANCIAL REPORT
(Unaudited; in millions, except per share data)
Three Months Ended Twelve Months EndedDecember 31, December 31,
2011 2010 2011 2010
SUMMARY INCOME STATEMENTS
Three Months Ended Twelve Months EndedDecember 31, December 31,
2011 2010 2011 2010
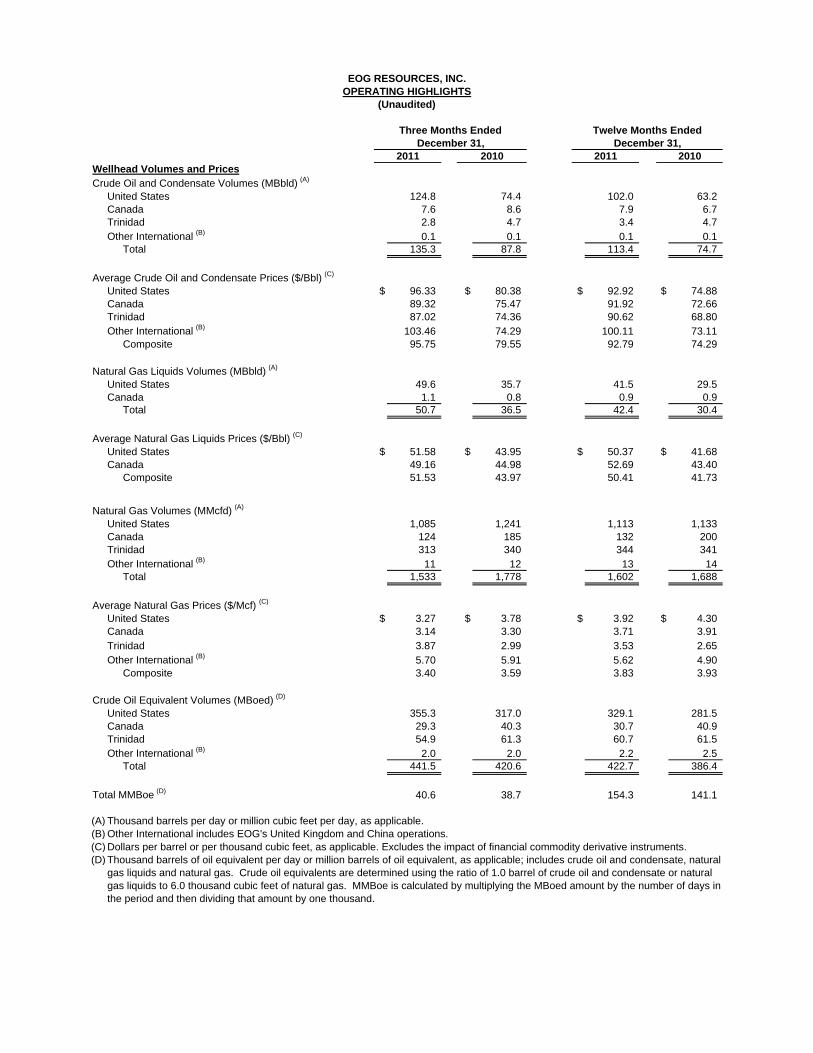
EOG RESOURCES, INC.OPERATING HIGHLIGHTS
(Unaudited)
Three Months Ended Twelve Months EndedDecember 31, December 31,
2011 2010 2011 2010Wellhead Volumes and PricesCrude Oil and Condensate Volumes (MBbld) (A)
United States 124.8 74.4 102.0 63.2 Canada 7.6 8.6 7.9 6.7 Trinidad 2.8 4.7 3.4 4.7 Other International (B) 0.1 0.1 0.1 0.1
Total 135.3 87.8 113.4 74.7
Average Crude Oil and Condensate Prices ($/Bbl) (C)
United States $ 96.33 $ 80.38 $ 92.92 $ 74.88 Canada 89.32 75.47 91.92 72.66 Trinidad 87.02 74.36 90.62 68.80 Other International (B) 103.46 74.29 100.11 73.11
Composite 95.75 79.55 92.79 74.29
Natural Gas Liquids Volumes (MBbld) (A)
United States 49.6 35.7 41.5 29.5 Canada 1.1 0.8 0.9 0.9
Total 50.7 36.5 42.4 30.4
Average Natural Gas Liquids Prices ($/Bbl) (C)
United States $ 51.58 $ 43.95 $ 50.37 $ 41.68 Canada 49.16 44.98 52.69 43.40
Composite 51.53 43.97 50.41 41.73
Natural Gas Volumes (MMcfd) (A)
United States 1,085 1,241 1,113 1,133 Canada 124 185 132 200 Trinidad 313 340 344 341 Other International (B) 11 12 13 14
Total 1,533 1,778 1,602 1,688
Average Natural Gas Prices ($/Mcf) (C)
United States $ 3.27 $ 3.78 $ 3.92 $ 4.30 Canada 3.14 3.30 3.71 3.91 Trinidad 3.87 2.99 3.53 2.65 Other International (B) 5.70 5.91 5.62 4.90
Composite 3.40 3.59 3.83 3.93
Crude Oil Equivalent Volumes (MBoed) (D)
United States 355.3 317.0 329.1 281.5 Canada 29.3 40.3 30.7 40.9 Trinidad 54.9 61.3 60.7 61.5 Other International (B) 2.0 2.0 2.2 2.5
Total 441.5 420.6 422.7 386.4
Total MMBoe (D) 40.6 38.7 154.3 141.1
(A) Thousand barrels per day or million cubic feet per day, as applicable.(B) Other International includes EOG's United Kingdom and China operations.(C)(D)
Dollars per barrel or per thousand cubic feet, as applicable. Excludes the impact of financial commodity derivative instruments.Thousand barrels of oil equivalent per day or million barrels of oil equivalent, as applicable; includes crude oil and condensate, natural gas liquids and natural gas. Crude oil equivalents are determined using the ratio of 1.0 barrel of crude oil and condensate or natural gas liquids to 6.0 thousand cubic feet of natural gas. MMBoe is calculated by multiplying the MBoed amount by the number of days in the period and then dividing that amount by one thousand.

Current AssetsCash and Cash Equivalents $ 615,726 $ 788,853 Accounts Receivable, Net 1,451,227 1,113,279 Inventories 590,594 415,792 Assets from Price Risk Management Activities 450,730 48,153 Income Taxes Receivable 26,609 54,916 Deferred Income Taxes - 9,260 Other 119,052 97,193 Total 3,253,938 2,527,446
Property, Plant and EquipmentOil and Gas Properties (Successful Efforts Method) 33,664,435 29,263,809 Other Property, Plant and Equipment 2,149,989 1,733,073 Total Property, Plant and Equipment 35,814,424 30,996,882 Less: Accumulated Depreciation, Depletion and Amortization (14,525,600) (12,315,982) Total Property, Plant and Equipment, Net 21,288,824 18,680,900
Other Assets 296,035 415,887 Total Assets $ 24,838,797 $ 21,624,233
Current LiabilitiesAccounts Payable $ 2,033,615 $ 1,664,944 Accrued Taxes Payable 147,105 82,168 Dividends Payable 42,578 38,962 Liabilities from Price Risk Management Activities - 28,339 Deferred Income Taxes 135,989 41,703 Current Portion of Long-Term Debt - 220,000 Other 163,032 143,983 Total 2,522,319 2,220,099
Long-Term Debt 5,009,166 5,003,341 Other Liabilities 799,189 667,455 Deferred Income Taxes 3,867,219 3,501,706 Commitments and Contingencies
Stockholders' EquityCommon Stock, $0.01 Par, 640,000,000 Shares Authorized and 269,323,084 Shares and 254,223,521 Shares Issued at December 31, 2011 and 2010, respectively 202,693 202,542 Additional Paid In Capital 2,272,052 729,992 Accumulated Other Comprehensive Income 401,746 440,071 Retained Earnings 9,789,345 8,870,179 Common Stock Held in Treasury, 303,633 Shares and 146,186 Shares at December 31, 2011 and 2010, respectively (24,932) (11,152) Total Stockholders' Equity 12,640,904 10,231,632
Total Liabilities and Stockholders’ Equity $ 24,838,797 $ 21,624,233
EOG RESOURCES, INC.SUMMARY BALANCE SHEETS
(Unaudited; in thousands, except share data)
LIABILITIES AND STOCKHOLDERS' EQUITY
December 31, December 31,2011 2010
ASSETS
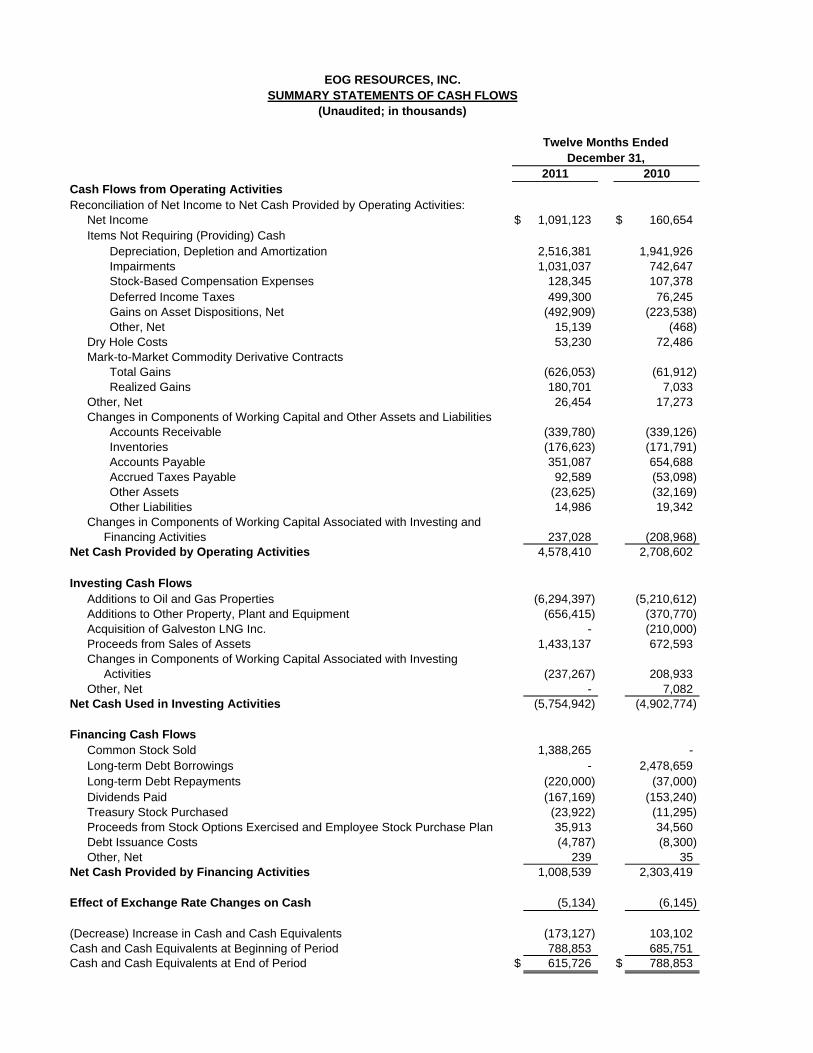
Cash Flows from Operating ActivitiesReconciliation of Net Income to Net Cash Provided by Operating Activities:
Net Income $ 1,091,123 $ 160,654 Items Not Requiring (Providing) Cash
Depreciation, Depletion and Amortization 2,516,381 1,941,926 Impairments 1,031,037 742,647 Stock-Based Compensation Expenses 128,345 107,378 Deferred Income Taxes 499,300 76,245 Gains on Asset Dispositions, Net (492,909) (223,538) Other, Net 15,139 (468)
Dry Hole Costs 53,230 72,486 Mark-to-Market Commodity Derivative Contracts
Total Gains (626,053) (61,912) Realized Gains 180,701 7,033
Other, Net 26,454 17,273 Changes in Components of Working Capital and Other Assets and Liabilities
Accounts Receivable (339,780) (339,126) Inventories (176,623) (171,791) Accounts Payable 351,087 654,688 Accrued Taxes Payable 92,589 (53,098) Other Assets (23,625) (32,169) Other Liabilities 14,986 19,342
Changes in Components of Working Capital Associated with Investing and Financing Activities 237,028 (208,968)
Net Cash Provided by Operating Activities 4,578,410 2,708,602
Investing Cash FlowsAdditions to Oil and Gas Properties (6,294,397) (5,210,612) Additions to Other Property, Plant and Equipment (656,415) (370,770) Acquisition of Galveston LNG Inc. - (210,000) Proceeds from Sales of Assets 1,433,137 672,593 Changes in Components of Working Capital Associated with Investing Activities (237,267) 208,933 Other, Net - 7,082
Net Cash Used in Investing Activities (5,754,942) (4,902,774)
Financing Cash FlowsCommon Stock Sold 1,388,265 - Long-term Debt Borrowings - 2,478,659 Long-term Debt Repayments (220,000) (37,000) Dividends Paid (167,169) (153,240) Treasury Stock Purchased (23,922) (11,295) Proceeds from Stock Options Exercised and Employee Stock Purchase Plan 35,913 34,560 Debt Issuance Costs (4,787) (8,300) Other, Net 239 35
Net Cash Provided by Financing Activities 1,008,539 2,303,419
Effect of Exchange Rate Changes on Cash (5,134) (6,145)
(Decrease) Increase in Cash and Cash Equivalents (173,127) 103,102 Cash and Cash Equivalents at Beginning of Period 788,853 685,751 Cash and Cash Equivalents at End of Period $ 615,726 $ 788,853
2011 2010
EOG RESOURCES, INC.SUMMARY STATEMENTS OF CASH FLOWS
(Unaudited; in thousands)
Twelve Months EndedDecember 31,

December 31, December 31,
Reported Net Income (GAAP) $ 120,698 $ 53,673 $ 1,091,123 $ 160,654
Mark-to-Market (MTM) Commodity Derivative Contracts ImpactTotal (Gains) Losses (145,514) 43,904 (626,053) (61,912) Realized Gains (Losses) 96,936 (18,147) 180,701 7,033 Subtotal (48,578) 25,757 (445,352) (54,879)
After-Tax MTM Impact (31,101) 16,424 (285,136) (35,203)
Add: Impairment of Certain North American Assets, Net of Tax 249,084 122,344 516,198 330,675 Add: Write-off of Fees Associated with Revolving Credit Facilities, Net of Tax 3,656 - 3,656 - Less: Net Gains on Asset Dispositions, Net of Tax (33,337) (98,835) (317,342) (145,216) Less: Change in Fair Value of Contingent Consideration Liability, Net of Tax - (1,580) - (14,521)
Adjusted Net Income (Non-GAAP) $ 309,000 $ 92,026 $ 1,008,499 $ 296,389
Net Income Per Share (GAAP)Basic $ 0.45 $ 0.21 $ 4.15 $ 0.64Diluted $ 0.45 $ 0.21 $ 4.10 (a) $ 0.63 (b)
Percentage Increase - [(a) - (b)] / (b) 551%
Adjusted Net Income Per Share (Non-GAAP)Basic $ 1.16 $ 0.37 $ 3.84 $ 1.18 Diluted $ 1.15 $ 0.36 $ 3.79 (c) $ 1.16 (d)
Percentage Increase - [(c) - (d)] / (d) 227%
Average Number of Common Shares Basic 266,277 251,365 262,735 250,876 Diluted 269,524 254,716 266,268 254,500
2011 2010 2011 2010
Three Months Ended Twelve Months Ended
EOG RESOURCES, INC.QUANTITATIVE RECONCILIATION OF ADJUSTED NET
The following chart adjusts the three-month and twelve-month periods ended December 31, 2011 and 2010 reported Net Income (GAAP) to reflect actual net cashrealized from financial commodity derivative transactions by eliminating the unrealized mark-to-market (gains) losses from these transactions, to add back impairmentcharges related to certain of EOG's North American assets in 2011 and in 2010, to add back the write-off of fees associated with revolving credit facilities cancelled inconnection with the establishment of a new revolving credit facility in the fourth quarter of 2011, to eliminate the net gains on asset dispositions primarily in NorthAmerica in 2011 and 2010, and to eliminate the change in the estimated fair value of a contingent consideration liability in 2010 related to EOG's previously disclosedacquisition of Haynesville and Bossier Shale unproved acreage. EOG believes this presentation may be useful to investors who follow the practice of some industryanalysts who adjust reported company earnings to match realizations to production settlement months and make certain other adjustments to exclude non-recurringitems. EOG management uses this information for comparative purposes within the industry.
INCOME (NON-GAAP) TO NET INCOME (GAAP)(Unaudited; in thousands, except per share data)
December 31,
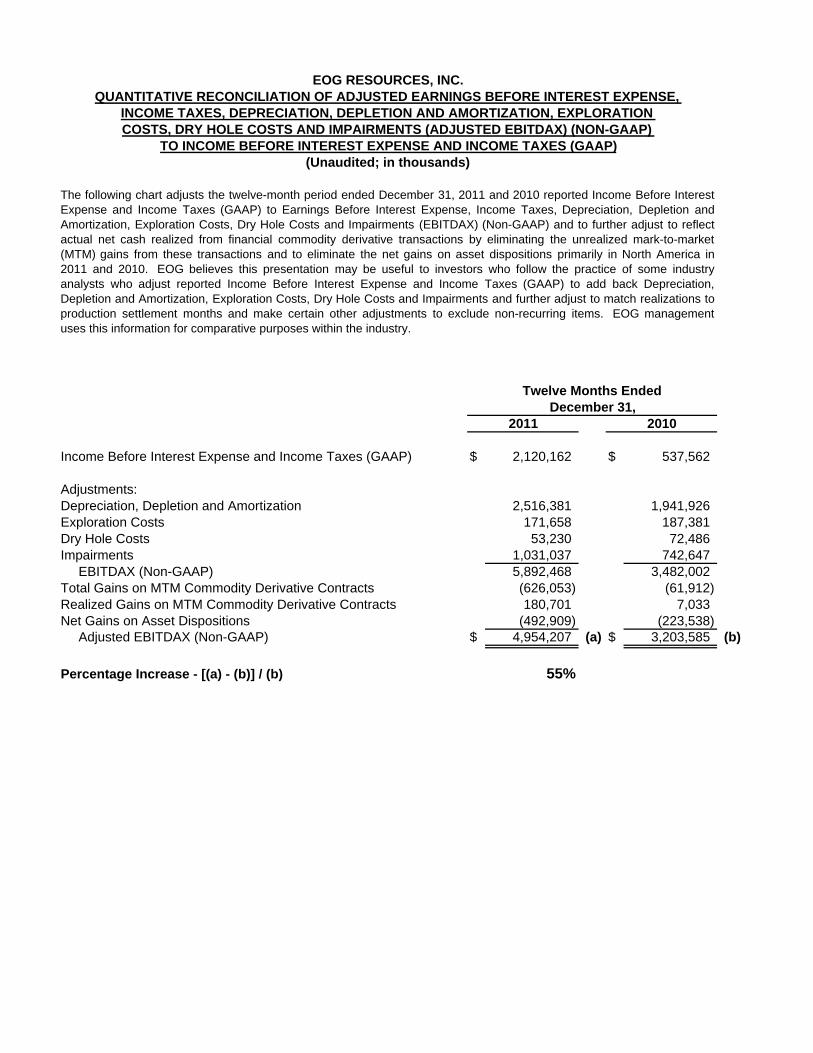
Income Before Interest Expense and Income Taxes (GAAP) $ 2,120,162 $ 537,562
Adjustments:Depreciation, Depletion and Amortization 2,516,381 1,941,926Exploration Costs 171,658 187,381Dry Hole Costs 53,230 72,486Impairments 1,031,037 742,647
EBITDAX (Non-GAAP) 5,892,468 3,482,002 Total Gains on MTM Commodity Derivative Contracts (626,053) (61,912) Realized Gains on MTM Commodity Derivative Contracts 180,701 7,033 Net Gains on Asset Dispositions (492,909) (223,538)
Adjusted EBITDAX (Non-GAAP) $ 4,954,207 (a) $ 3,203,585 (b)
Percentage Increase - [(a) - (b)] / (b) 55%
The following chart adjusts the twelve-month period ended December 31, 2011 and 2010 reported Income Before InterestExpense and Income Taxes (GAAP) to Earnings Before Interest Expense, Income Taxes, Depreciation, Depletion andAmortization, Exploration Costs, Dry Hole Costs and Impairments (EBITDAX) (Non-GAAP) and to further adjust to reflectactual net cash realized from financial commodity derivative transactions by eliminating the unrealized mark-to-market(MTM) gains from these transactions and to eliminate the net gains on asset dispositions primarily in North America in2011 and 2010. EOG believes this presentation may be useful to investors who follow the practice of some industryanalysts who adjust reported Income Before Interest Expense and Income Taxes (GAAP) to add back Depreciation,Depletion and Amortization, Exploration Costs, Dry Hole Costs and Impairments and further adjust to match realizations toproduction settlement months and make certain other adjustments to exclude non-recurring items. EOG managementuses this information for comparative purposes within the industry.
Twelve Months Ended
2011 2010
EOG RESOURCES, INC.QUANTITATIVE RECONCILIATION OF ADJUSTED EARNINGS BEFORE INTEREST EXPENSE,
INCOME TAXES, DEPRECIATION, DEPLETION AND AMORTIZATION, EXPLORATION COSTS, DRY HOLE COSTS AND IMPAIRMENTS (ADJUSTED EBITDAX) (NON-GAAP)
TO INCOME BEFORE INTEREST EXPENSE AND INCOME TAXES (GAAP)(Unaudited; in thousands)
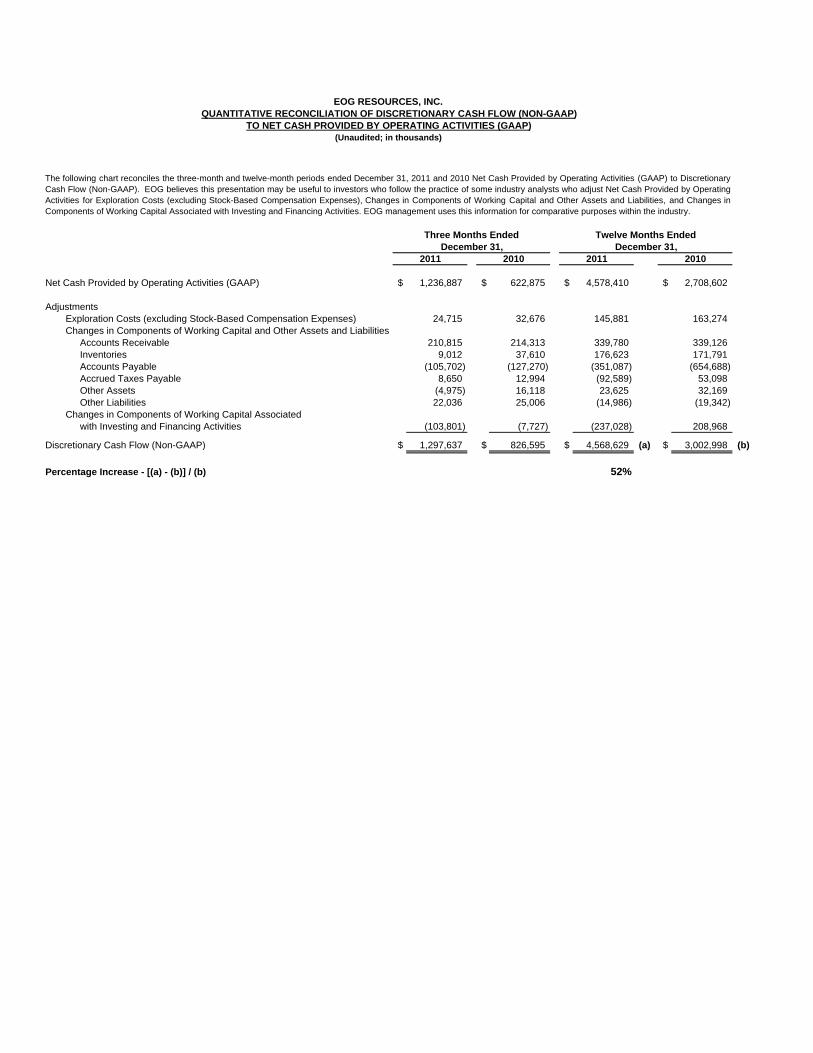
Net Cash Provided by Operating Activities (GAAP) $ 1,236,887 $ 622,875 $ 4,578,410 $ 2,708,602
AdjustmentsExploration Costs (excluding Stock-Based Compensation Expenses) 24,715 32,676 145,881 163,274 Changes in Components of Working Capital and Other Assets and Liabilities
Accounts Receivable 210,815 214,313 339,780 339,126 Inventories 9,012 37,610 176,623 171,791 Accounts Payable (105,702) (127,270) (351,087) (654,688) Accrued Taxes Payable 8,650 12,994 (92,589) 53,098 Other Assets (4,975) 16,118 23,625 32,169 Other Liabilities 22,036 25,006 (14,986) (19,342)
Changes in Components of Working Capital Associatedwith Investing and Financing Activities (103,801) (7,727) (237,028) 208,968
Discretionary Cash Flow (Non-GAAP) $ 1,297,637 $ 826,595 $ 4,568,629 (a) $ 3,002,998 (b)
Percentage Increase - [(a) - (b)] / (b) 52%
2011 2010 2011 2010
EOG RESOURCES, INC.QUANTITATIVE RECONCILIATION OF DISCRETIONARY CASH FLOW (NON-GAAP)
TO NET CASH PROVIDED BY OPERATING ACTIVITIES (GAAP)(Unaudited; in thousands)
The following chart reconciles the three-month and twelve-month periods ended December 31, 2011 and 2010 Net Cash Provided by Operating Activities (GAAP) to DiscretionaryCash Flow (Non-GAAP). EOG believes this presentation may be useful to investors who follow the practice of some industry analysts who adjust Net Cash Provided by OperatingActivities for Exploration Costs (excluding Stock-Based Compensation Expenses), Changes in Components of Working Capital and Other Assets and Liabilities, and Changes inComponents of Working Capital Associated with Investing and Financing Activities. EOG management uses this information for comparative purposes within the industry.
Three Months Ended Twelve Months EndedDecember 31, December 31,
(Unaudited)
2011 NET PROVED RESERVES RECONCILIATION SUMMARY United North Other Total
CRUDE OIL & CONDENSATE (MMBbls ) States Canada America Trinidad Int'l Int'l Total
Beginning Reserves 355.5 25.6 381.1 4.7 0.1 4.8 385.9 Revisions (21.2) (4.6) (25.8) 0.1 - 0.1 (25.7) Purchases in place - - - - - - - Extensions, discoveries and other additions 202.5 0.5 203.0 - - - 203.0 Sales in place (4.3) - (4.3) - - - (4.3) Production (37.2) (2.9) (40.1) (1.3) - (1.3) (41.4)
Ending Reserves 495.3 18.6 513.9 3.5 0.1 3.6 517.5
NATURAL GAS LIQUIDS (MMBbls )Beginning Reserves 150.4 1.5 151.9 - - - 151.9 Revisions 36.1 - 36.1 - - - 36.1 Purchases in place - - - - - - - Extensions, discoveries and other additions 65.3 - 65.3 - - - 65.3 Sales in place (10.0) - (10.0) - - - (10.0) Production (15.2) (0.3) (15.5) - - - (15.5)
Ending Reserves 226.6 1.2 227.8 - - - 227.8
NATURAL GAS (Bcf) Beginning Reserves 6,491.5 1,133.8 7,625.3 827.6 17.3 844.9 8,470.2 Revisions (344.0) (49.8) (393.8) (24.2) 1.3 (22.9) (416.7) Purchases in place 3.0 - 3.0 - - - 3.0 Extensions, discoveries and other additions 634.6 - 634.6 74.7 4.5 79.2 713.8 Sales in place (323.6) - (323.6) - - - (323.6) Production (415.7) (48.1) (463.8) (127.4) (4.6) (132.0) (595.8)
Ending Reserves 6,045.8 1,035.9 7,081.7 750.7 18.5 769.2 7,850.9
OIL EQUIVALENTS (MMBoe) Beginning Reserves 1,587.8 216.1 1,803.9 142.7 2.9 145.6 1,949.5 Revisions (42.5) (12.9) (55.4) (4.0) 0.2 (3.8) (59.2) Purchases in place 0.5 - 0.5 - - - 0.5 Extensions, discoveries and other additions 373.6 0.5 374.1 12.4 0.8 13.2 387.3 Sales in place (68.2) - (68.2) - - - (68.2) Production (121.7) (11.2) (132.9) (22.5) (0.7) (23.2) (156.1)
Ending Reserves 1,729.5 192.5 1,922.0 128.6 3.2 131.8 2,053.8
Net Proved Developed Reserves (MMBoe) At December 31, 2010 839.9 79.7 919.6 90.4 3.0 93.4 1,013.0 At December 31, 2011 877.3 58.5 935.8 103.7 3.2 106.9 1,042.7
EOG RESOURCES, INC.RESERVES SUPPLEMENTAL DATA

(Unaudited)
2011 EXPLORATION AND DEVELOPMENT EXPENDITURES ($ Millions) United North Other TotalStates Canada America Trinidad Int'l Int'l Total
Acquisition Cost of Unproved Properties 295.2$ 6.2$ 301.4$ -$ (0.6)$ (0.6)$ 300.8$ Exploration Costs 311.3 31.5 342.8 2.6 18.1 20.7 363.5 Development Costs 5,358.6 232.8 5,591.4 132.1 74.0 206.1 5,797.5
Total Drilling 5,965.1 270.5 6,235.6 134.7 91.5 226.2 6,461.8
Acquisition Cost of Proved Properties 4.2 - 4.2 - - - 4.2
Total Exploration & Development Expenditures 5,969.3 270.5 6,239.8 134.7 91.5 226.2 6,466.0
Gathering, Processing and Other 604.0 52.1 656.1 0.1 0.2 0.3 656.4 Asset Retirement Costs 51.8 69.8 121.6 6.8 4.8 11.6 133.2
Total Expenditures 6,625.1 392.4 7,017.5 141.6 96.5 238.1 7,255.6
Proceeds from Sales in Place (1,252.0) (177.9) (1,429.9) (3.3) - (3.3) (1,433.2)
Net Expenditures 5,373.1$ 214.5$ 5,587.6$ 138.3$ 96.5$ 234.8$ 5,822.4$
RESERVE REPLACEMENT COSTS ($ / Boe ) * Total Drilling, Before Revisions 15.97$ 541.00$ 16.67$ 10.86$ 114.38$ 17.14$ 16.68$ All-in Total, Net of Revisions 18.00$ (21.81)$ 19.55$ 16.04$ 91.50$ 24.06$ 19.68$
RESERVE REPLACEMENT *Drilling Only 307% 4% 281% 55% 114% 57% 248%All-in Total, Net of Revisions & Dispositions 216% -111% 189% 37% 143% 41% 167%
* See attached reconciliation schedule for calculation methodology
EOG RESOURCES, INC.RESERVES SUPPLEMENTAL DATA (CONTINUED)
EOG RESOURCES, INC.QUANTITATIVE RECONCILIATION OF TOTAL EXPLORATION AND DEVELOPMENT EXPENDITURES
FOR DRILLING ONLY (NON-GAAP) AND TOTAL EXPLORATION AND DEVELOPMENT EXPENDITURES (NON-GAAP)AS USED IN THE CALCULATION OF RESERVE REPLACEMENT COSTS ($ / BOE)
TO TOTAL COSTS INCURRED IN EXPLORATION AND DEVELOPMENT ACTIVITIES (GAAP)(Unaudited; in millions, except ratio information)
United North Other TotalStates Canada America Trinidad Int'l Int'l Total
Total Costs Incurred in Exploration and Development Activities (GAAP) 6,021.1$ 340.3$ 6,361.4$ 141.5$ 96.3$ 237.8$ 6,599.2$
Less: Asset Retirement Costs (51.8) (69.8) (121.6) (6.8) (4.8) (11.6) (133.2) Acquisition Cost of Proved Properties (4.2) - (4.2) - - - (4.2)
Total Exploration & Development Expenditures for Drilling Only (Non-GAAP) (a) 5,965.1$ 270.5$ 6,235.6$ 134.7$ 91.5$ 226.2$ 6,461.8$
Total Costs Incurred in Exploration and Development Activities (GAAP) 6,021.1$ 340.3$ 6,361.4$ 141.5$ 96.3$ 237.8$ 6,599.2$
Less: Asset Retirement Costs (51.8) (69.8) (121.6) (6.8) (4.8) (11.6) (133.2)
Total Exploration & Development Expenditures (Non-GAAP) (b) 5,969.3$ 270.5$ 6,239.8$ 134.7$ 91.5$ 226.2$ 6,466.0$
Net Proved Reserve Additions From All Sources - Oil Equivalents (MMBoe) Revisions due to price (c) (11.7) (3.0) (14.7) (1.7) - (1.7) (16.4) Revisions other than price (30.8) (9.9) (40.7) (2.3) 0.2 (2.1) (42.8) Purchases in place 0.5 - 0.5 - - - 0.5 Extensions, discoveries and other additions (d) 373.6 0.5 374.1 12.4 0.8 13.2 387.3
Total Proved Reserve Additions (e) 331.6 (12.4) 319.2 8.4 1.0 9.4 328.6 Sales in place (68.2) - (68.2) - - - (68.2)
Net Proved Reserve Additions From All Sources (f) 263.4 (12.4) 251.0 8.4 1.0 9.4 260.4
Production (g) 121.7 11.2 132.9 22.5 0.7 23.2 156.1
RESERVE REPLACEMENT COSTS ($ / BOE)Total Drilling, Before Revisions (a / d ) 15.97$ 541.00$ 16.67$ 10.86$ 114.38$ 17.14$ 16.68$ All-in Total, Net of Revisions (b / e) 18.00$ (21.81)$ 19.55$ 16.04$ 91.50$ 24.06$ 19.68$ All-in Total, Excluding Revisions Due to Price (b / (e - c )) 17.39$ (28.78)$ 18.69$ 13.34$ 91.50$ 20.38$ 18.74$
RESERVE REPLACEMENTDrilling Only (d / g ) 307% 4% 281% 55% 114% 57% 248%All-in Total, Net of Revisions & Dispositions (f / g ) 216% -111% 189% 37% 143% 41% 167%All-in Total, Excluding Revisions Due to Price ((f - c ) / g ) 226% -84% 200% 45% 143% 48% 177%
The following chart reconciles Total Costs Incurred in Exploration and Development Activities (GAAP) to Total Exploration and Development Expenditures for Drilling Only (Non-GAAP) and Total Exploration and Development Expenditures (Non-GAAP), as used in the calculation of Reserve Replacement Costs per Boe. There are numerous ways thatindustry participants present Reserve Replacement Costs, including “Drilling Only” and “All-In”, which reflect total exploration and development expenditures divided by total netproved reserve additions from extensions and discoveries only, or from all sources. Combined with Reserve Replacement, these statistics provide management and investors withan indication of the results of the current year capital investment program. Reserve Replacement Cost statistics are widely recognized and reported by industry participants and areused by EOG management and other third parties for comparative purposes within the industry. Please note that the actual cost of adding reserves will vary from the reportedstatistics due to timing differences in reserve bookings and capital expenditures. Accordingly, some analysts use three or five year averages of reported statistics, while othersprefer to estimate future costs. EOG has not included future capital costs to develop proved undeveloped reserves in exploration and development expenditures.

Total Stockholders' Equity - (a) $ 12,641
Current and Long-Term Debt - (b) 5,009 Less: Cash (616) Net Debt (Non-GAAP) - (c) 4,393
Total Capitalization (GAAP) - (a) + (b) $ 17,650
Total Capitalization (Non-GAAP) - (a) + (c) $ 17,034
Debt-to-Total Capitalization (GAAP) - (b) / [(a) + (b)] 28%
Net Debt-to-Total Capitalization (Non-GAAP) - (c) / [(a) + (c)] 26%
The following chart reconciles Current and Long-Term Debt (GAAP) to Net Debt (Non-GAAP) andTotal Capitalization (GAAP) to Total Capitalization (Non-GAAP), as used in the Net Debt-to-TotalCapitalization ratio calculation. A portion of the cash is associated with international subsidiaries;tax considerations may impact debt paydown. EOG believes this presentation may be useful toinvestors who follow the practice of some industry analysts who utilize Net Debt and TotalCapitalization (Non-GAAP) in their Net Debt-to-Total Capitalization ratio calculation. EOGmanagement uses this information for comparative purposes within the industry.
December 31,2011
EOG RESOURCES, INC.QUANTITATIVE RECONCILIATION OF NET DEBT (NON-GAAP) AND TOTAL
CAPITALIZATION (NON-GAAP) AS USED IN THE CALCULATION OF THE NET DEBT-TO-TOTAL CAPITALIZATION RATIO (NON-GAAP)
TO CURRENT AND LONG-TERM DEBT (GAAP) AND TOTAL CAPITALIZATION (GAAP)(Unaudited; in millions, except ratio data)
CRUDE OIL DERIVATIVE CONTRACTS
WeightedVolume Average Price(Bbld) ($/Bbl)
2012 (1)
January 2012 (closed) 34,000 $104.95February 2012 34,000 104.95 March 1, 2012 through June 30, 2012 49,000 105.42 July 1, 2012 through August 31, 2012 32,000 104.95 September 1, 2012 through December 31, 2012 17,000 103.59
(1)
NATURAL GAS DERIVATIVE CONTRACTS
WeightedVolume Average Price
(MMBtud) ($/MMBtu) 2012 (2)
January 1, 2012 through February 29, 2012 (closed) 525,000 $5.44March 1, 2012 through December 31, 2012 525,000 5.44
2013 (3)
January 1, 2013 through December 31, 2013 150,000 $4.79
2014 (3)
January 1, 2014 through December 31, 2014 150,000 $4.79
(2)
(3)
DefinitionsBbld Barrels per day.$/Bbl Dollars per barrel.MMBtud Million British thermal units per day.$/MMBtu Dollars per million British thermal units.
EOG has entered into natural gas derivative contracts which give counterparties the option of entering intoderivative contracts at future dates. Such options are exercisable monthly up until the settlement date of eachmonthly contract. If the counterparties exercise all such options, the notional volume of EOG's existingnatural gas derivative contracts will increase by 425,000 MMBtud at an average price of $5.44 per MMBtu forthe period from March 1, 2012 through December 31, 2012. EOG has entered into natural gas derivative contracts which give counterparties the option of entering intoderivative contracts at future dates. Such options are exercisable monthly up until the settlement date of eachmonthly contract. If the counterparties exercise all such options, the notional volume of EOG's existingnatural gas derivative contracts will increase by 150,000 MMBtud at an average price of $4.79 per MMBtu foreach month of 2013 and 2014.
EOG RESOURCES, INC.CRUDE OIL AND NATURAL GAS FINANCIAL
COMMODITY DERIVATIVE CONTRACTS
Presented below is a comprehensive summary of EOG's crude oil and natural gas derivative contracts as of February 16, 2012 with notional volumes expressed in Bbld and MMBtud and prices expressed in $/Bbl and $/MMBtu. EOG accounts for financial commodity derivative contracts using the mark-to-market accounting method.
EOG has entered into crude oil derivative contracts which give counterparties the option to extend certaincurrent derivative contracts for an additional six-month period. Options covering a notional volume of 17,000Bbld are exercisable on June 29, 2012. If the counterparties exercise all such options, the notional volume ofEOG's existing crude oil derivative contracts will increase by 17,000 Bbld at an average price of $106.31 perbarrel for the period July 1, 2012 through December 31, 2012. Options covering a notional volume of 15,000Bbld are exercisable on August 31, 2012. If the counterparties exercise all such options, the notional volumeof EOG's existing crude oil derivative contracts will increase by 15,000 Bbld at an average price of $106.50per barrel for the period September 1, 2012 through February 28, 2013.

ESTIMATED RANGES(Unaudited)
Daily ProductionCrude Oil and Condensate Volumes (MBbld)
United States 118.0 - 133.0 130.0 - 147.5Canada 6.5 - 7.5 5.5 - 7.8Trinidad 2.0 - 2.8 1.0 - 2.0Other International 0.0 - 0.0 0.1 - 0.2
Total 126.5 - 143.3 136.6 - 157.5
Natural Gas Liquids Volumes (MBbld)United States 46.0 - 53.0 49.2 - 59.2Canada 0.6 - 1.0 0.6 - 1.0
Total 46.6 - 54.0 49.8 - 60.2
Natural Gas Volumes (MMcfd)United States 1,015 - 1,045 995 - 1,035Canada 90 - 107 82 - 102Trinidad 315 - 345 335 - 363Other International 9 - 11 8 - 10
Total 1,429 - 1,508 1,420 - 1,510
Crude Oil Equivalent Volumes (MBoed) United States 333.2 - 360.2 345.0 - 379.2Canada 22.1 - 26.3 19.8 - 25.8Trinidad 54.5 - 60.3 56.8 - 62.5Other International 1.4 - 1.8 1.4 - 1.9
Total 411.2 - 448.6 423.0 - 469.4
EOG RESOURCES, INC. FIRST QUARTER AND FULL YEAR 2012 FORECAST AND BENCHMARK COMMODITY PRICING
(a) First Quarter and Full Year 2012 Forecast
The forecast items for the first quarter and full year 2012 set forth below for EOG Resources, Inc. (EOG) are based oncurrent available information and expectations as of the date of the accompanying press release. EOG undertakes noobligation, other than as required by applicable law, to update or revise this forecast, whether as a result of new information,subsequent events, anticipated or unanticipated circumstances or otherwise. This forecast, which should be read inconjunction with the accompanying press release and EOG’s related Current Report on Form 8-K filing, replaces andsupersedes any previously issued guidance or forecast.
(b) Benchmark Commodity Pricing
EOG bases United States, Canada and Trinidad crude oil and condensate price differentials upon the West TexasIntermediate crude oil price at Cushing, Oklahoma, using the simple average of the NYMEX settlement prices for eachtrading day within the applicable calendar month.
EOG bases United States and Canada natural gas price differentials upon the natural gas price at Henry Hub, Louisiana,using the simple average of the NYMEX settlement prices for the last three trading days of the applicable month.
1Q 2012 Full Year 2012

ESTIMATED RANGES(Unaudited)
Operating CostsUnit Costs ($/Boe)
Lease and Well 6.48$ - 7.08$ 6.48$ - 7.08$ Transportation Costs 3.12$ - 3.48$ 3.24$ - 3.66$ Depreciation, Depletion and Amortization 17.22$ - 18.42$ 17.70$ - 18.60$
Expenses ($MM)Exploration, Dry Hole and Impairment 101.5$ - 120.0$ 450.0$ - 490.0$ General and Administrative 78.0$ - 84.0$ 338.0$ - 358.0$ Gathering and Processing 19.0$ - 23.0$ 72.0$ - 90.0$ Capitalized Interest 13.0$ - 17.0$ 60.0$ - 72.0$ Net Interest 45.0$ - 51.0$ 175.0$ - 195.0$
Taxes Other Than Income (% of Revenue) 6.1% - 6.5% 5.5% - 6.5%
Income TaxesEffective Rate 35% - 50% 35% - 45%Current Taxes ($MM) 70$ - 85$ 290$ - 310$
Capital Expenditures ($MM) - FY 2012 (Excluding Acquisitions) Exploration and Development, Excluding Facilities 6,200$ - 6,300$
Exploration and Development Facilities 630$ - 675$ Gathering, Processing and Other 570$ - 600$
Pricing - (Refer to Benchmark Commodity Pricing in text)Crude Oil and Condensate ($/Bbl)
DifferentialsUnited States - below WTI 0.50$ - 3.00$ 0.25$ - 1.75$ Canada - below WTI 7.00$ - 11.00$ 5.00$ - 8.00$ Trinidad - below WTI 2.50$ - 3.50$ 6.00$ - 7.00$
Natural Gas ($/Mcf)Differentials
United States - below NYMEX Henry Hub 0.05$ - 0.20$ 0.05$ - 0.25$ Canada - below NYMEX Henry Hub 0.42$ - 0.63$ 0.45$ - 0.90$
RealizationsTrinidad 2.75$ - 3.25$ 2.25$ - 3.00$ Other International 5.00$ - 6.00$ 5.00$ - 5.90$
$/Bbl U.S. Dollars per barrel$/Boe U.S. Dollars per barrel of oil equivalent$/Mcf U.S. Dollars per thousand cubic feet$MM U.S. Dollars in millionsMBbld Thousand barrels per dayMBoed Thousand barrels of oil equivalent per dayMMcfd Million cubic feet per dayNYMEX New York Mercantile ExchangeWTI West Texas Intermediate
Definitions
1Q 2012 Full Year 2012