Embed Size (px)
Citation preview
Date : 21 February 2012
EO Information Services in support of
Multi-Hazard Vulnerability Assessment in Yogyakarta (Indonesia)
F. N. Koudogbo and A. Arnaud Altamira Information
I. Bauwens, H. Tambuyzer Eurosense
Agenda
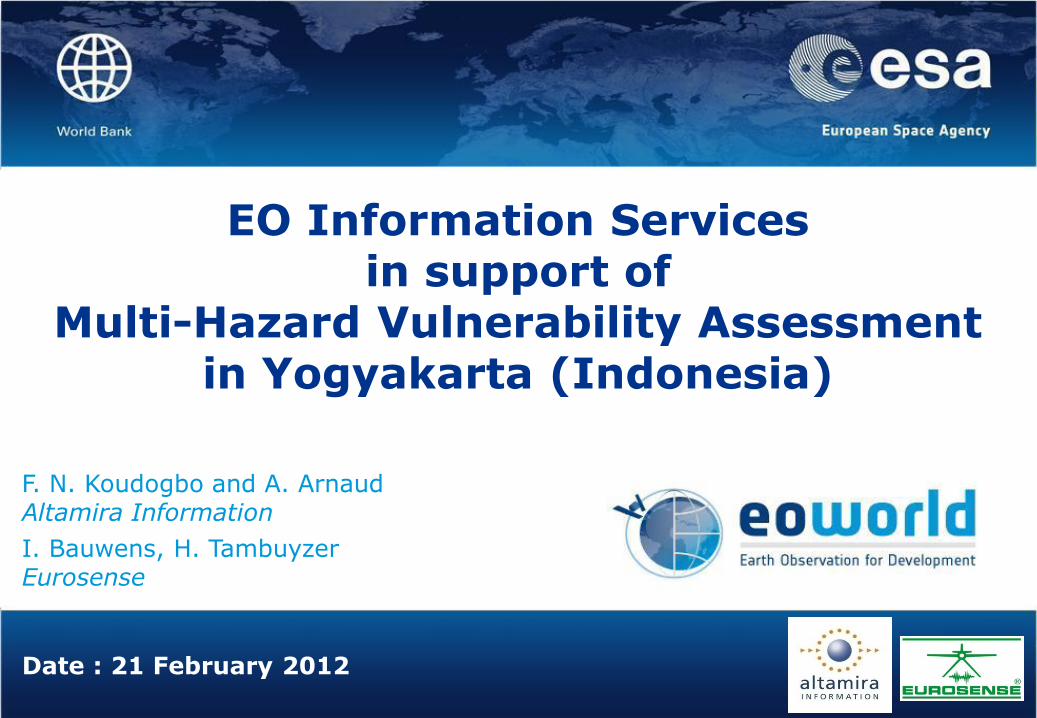
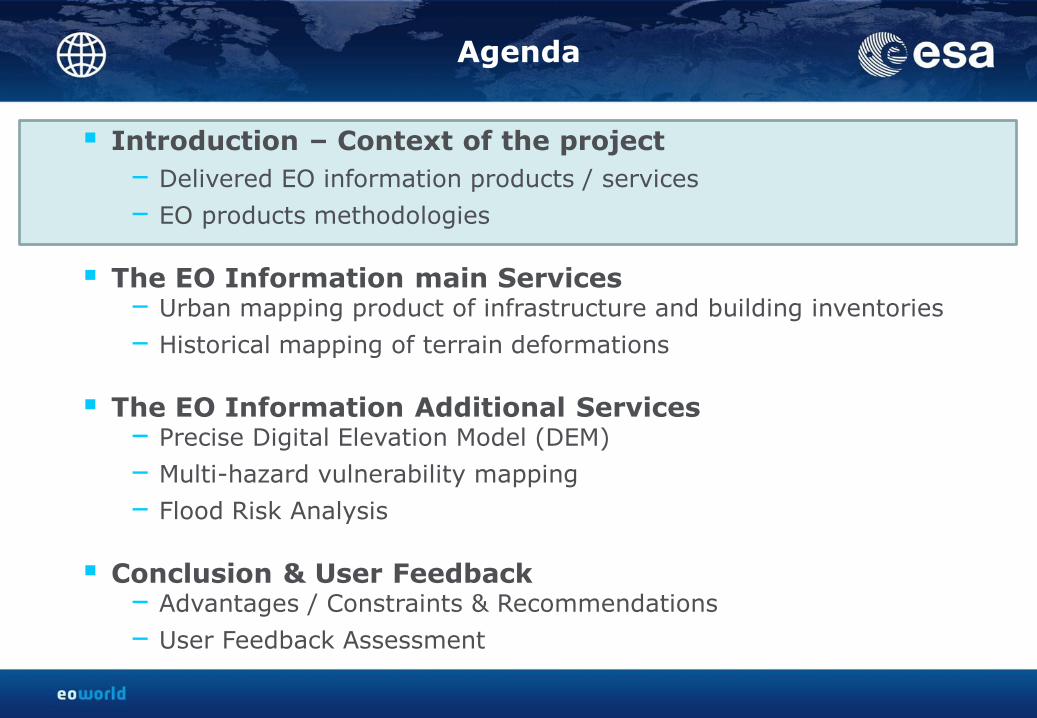
Introduction – Context of the project
– Delivered EO information products / services
– EO products methodologies
The EO Information main Services – Urban mapping product of infrastructure and building inventories
– Historical mapping of terrain deformations
The EO Information Additional Services – Precise Digital Elevation Model (DEM)
– Multi-hazard vulnerability mapping
– Flood Risk Analysis
Conclusion & User Feedback – Advantages / Constraints & Recommendations
– User Feedback Assessment
Delivered EO information Products/Services
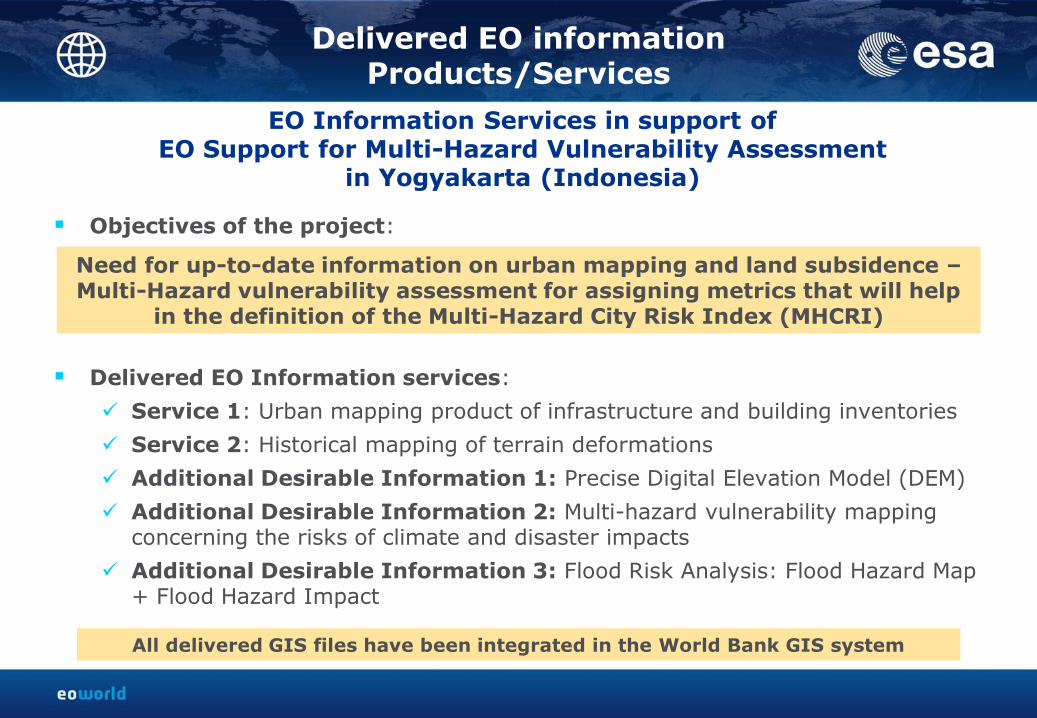
Objectives of the project:
Delivered EO Information services:
Service 1: Urban mapping product of infrastructure and building inventories
Service 2: Historical mapping of terrain deformations
Additional Desirable Information 1: Precise Digital Elevation Model (DEM)
Additional Desirable Information 2: Multi-hazard vulnerability mapping concerning the risks of climate and disaster impacts
Additional Desirable Information 3: Flood Risk Analysis: Flood Hazard Map + Flood Hazard Impact
Need for up-to-date information on urban mapping and land subsidence – Multi-Hazard vulnerability assessment for assigning metrics that will help
in the definition of the Multi-Hazard City Risk Index (MHCRI)
EO Information Services in support of EO Support for Multi-Hazard Vulnerability Assessment
in Yogyakarta (Indonesia)
All delivered GIS files have been integrated in the World Bank GIS system
EO information Products Methodologies Generation of Service 1 outputs
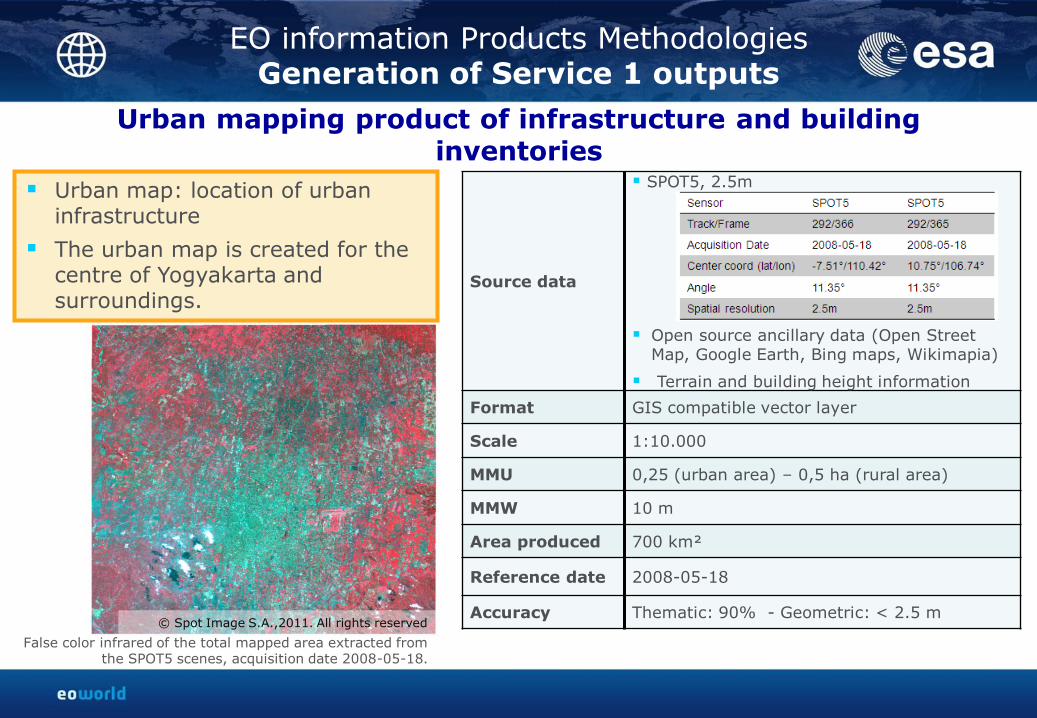
Urban map: location of urban infrastructure
The urban map is created for the centre of Yogyakarta and surroundings.
Source data
SPOT5, 2.5m
Open source ancillary data (Open Street Map, Google Earth, Bing maps, Wikimapia)
Terrain and building height information
Format GIS compatible vector layer
Scale 1:10.000
MMU 0,25 (urban area) – 0,5 ha (rural area)
MMW 10 m
Area produced 700 km²
Reference date 2008-05-18
Accuracy Thematic: 90% - Geometric: < 2.5 m
Urban mapping product of infrastructure and building inventories
© Spot Image S.A.,2011. All rights reserved
False color infrared of the total mapped area extracted from the SPOT5 scenes, acquisition date 2008-05-18.
EO information Products Methodologies Generation of Service 1 outputs
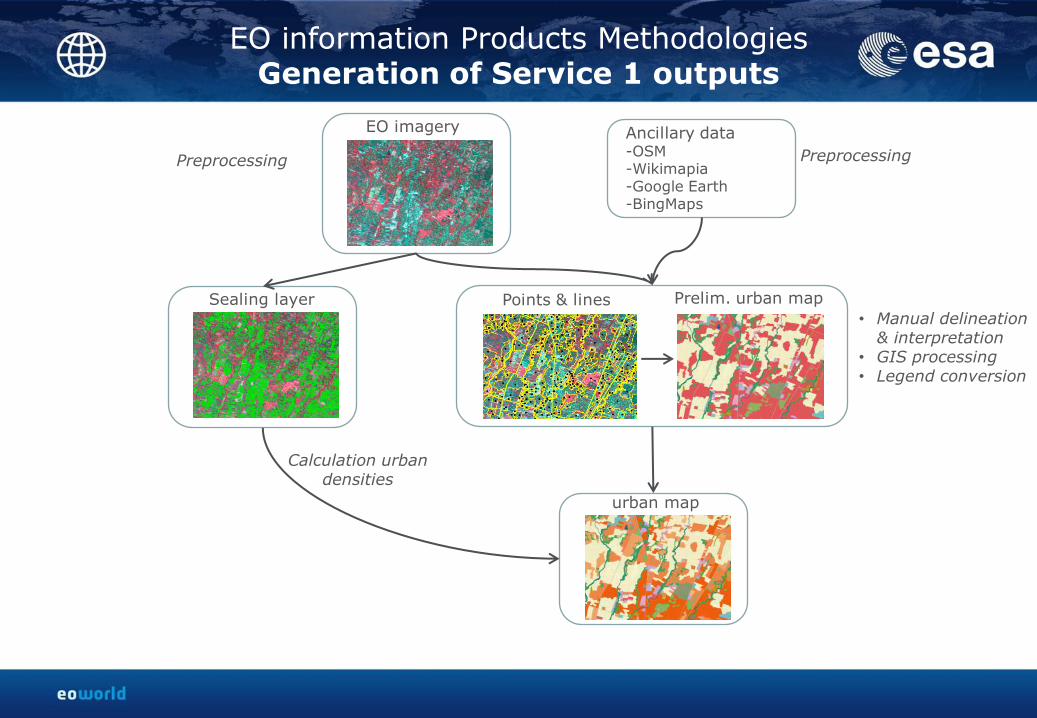
EO imagery Ancillary data -OSM -Wikimapia -Google Earth -BingMaps
Sealing layer Prelim. urban map
urban map
Calculation urban densities
Preprocessing Preprocessing
• Manual delineation & interpretation
• GIS processing • Legend conversion
Points & lines
EO information Products Methodologies Legend Conversion
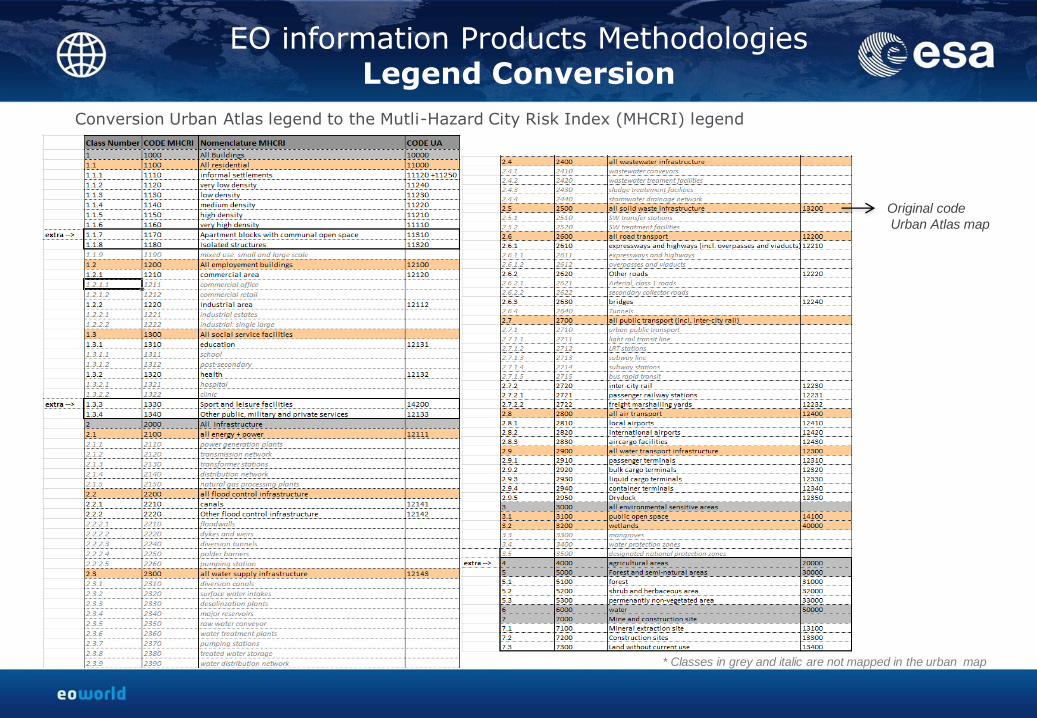
Conversion Urban Atlas legend to the Mutli-Hazard City Risk Index (MHCRI) legend
Original code
Urban Atlas map
* Classes in grey and italic are not mapped in the urban map
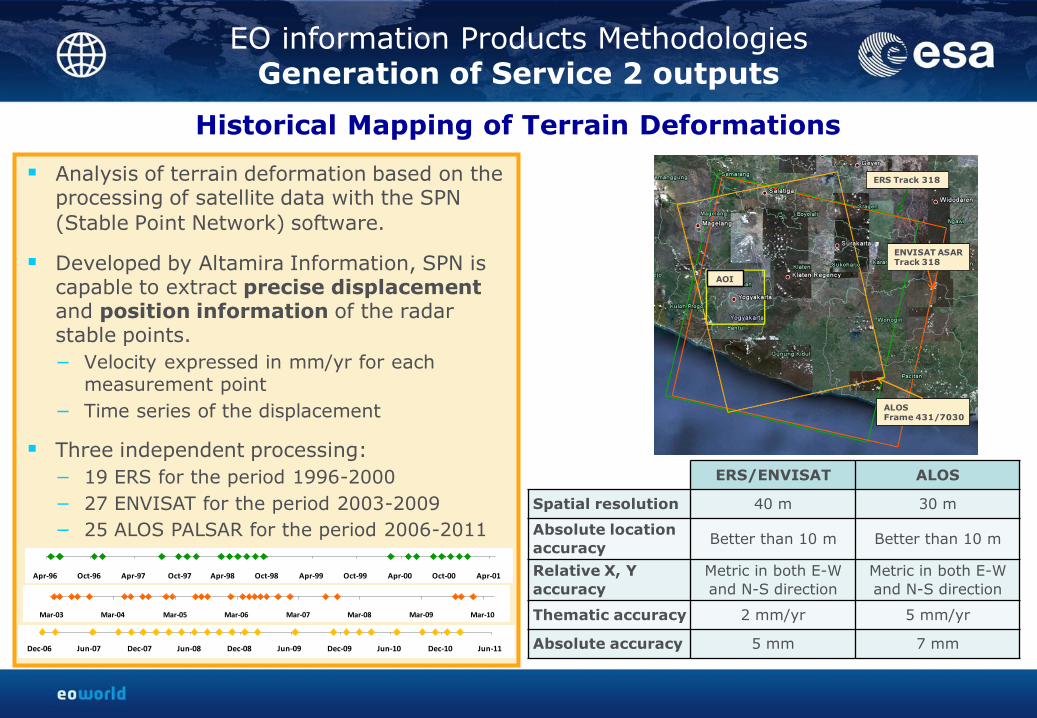
ERS/ENVISAT ALOS
Spatial resolution 40 m 30 m
Absolute location
accuracy Better than 10 m Better than 10 m
Relative X, Y
accuracy
Metric in both E-W
and N-S direction
Metric in both E-W
and N-S direction
Thematic accuracy 2 mm/yr 5 mm/yr
Absolute accuracy 5 mm 7 mm
1-Mar-03 29-Feb-04 28-Feb-05 28-Feb-06 28-Feb-07 28-Feb-08 27-Feb-09 27-Feb-10Mar-03 Mar-04 Mar-05 Mar-06 Mar-07 Mar-08 Mar-09 Mar-10
26-Mar-96 25-Sep-96 27-Mar-97 26-Sep-97 28-Mar-98 27-Sep-98 29-Mar-99 28-Sep-99 29-Mar-00 28-Sep-00 30-Mar-01Apr-96 Oct-96 Apr-97 Oct-97 Apr-98 Oct-98 Apr-99 Oct-99 Apr-00 Oct-00 Apr-01
29-Nov-06 30-May-07 28-Nov-07 28-May-08 26-Nov-08 27-May-09 25-Nov-09 26-May-10 24-Nov-10 25-May-11Dec-06 Jun-07 Dec-07 Jun-08 Dec-08 Jun-09 Dec-09 Jun-10 Dec-10 Jun-11
AOI
ERS Track 318
ENVISAT ASAR Track 318
ALOS Frame 431/7030
Historical Mapping of Terrain Deformations
Analysis of terrain deformation based on the processing of satellite data with the SPN
(Stable Point Network) software.
Developed by Altamira Information, SPN is capable to extract precise displacement and position information of the radar stable points.
− Velocity expressed in mm/yr for each measurement point
− Time series of the displacement
Three independent processing:
− 19 ERS for the period 1996-2000
− 27 ENVISAT for the period 2003-2009
− 25 ALOS PALSAR for the period 2006-2011
EO information Products Methodologies Generation of Service 2 outputs
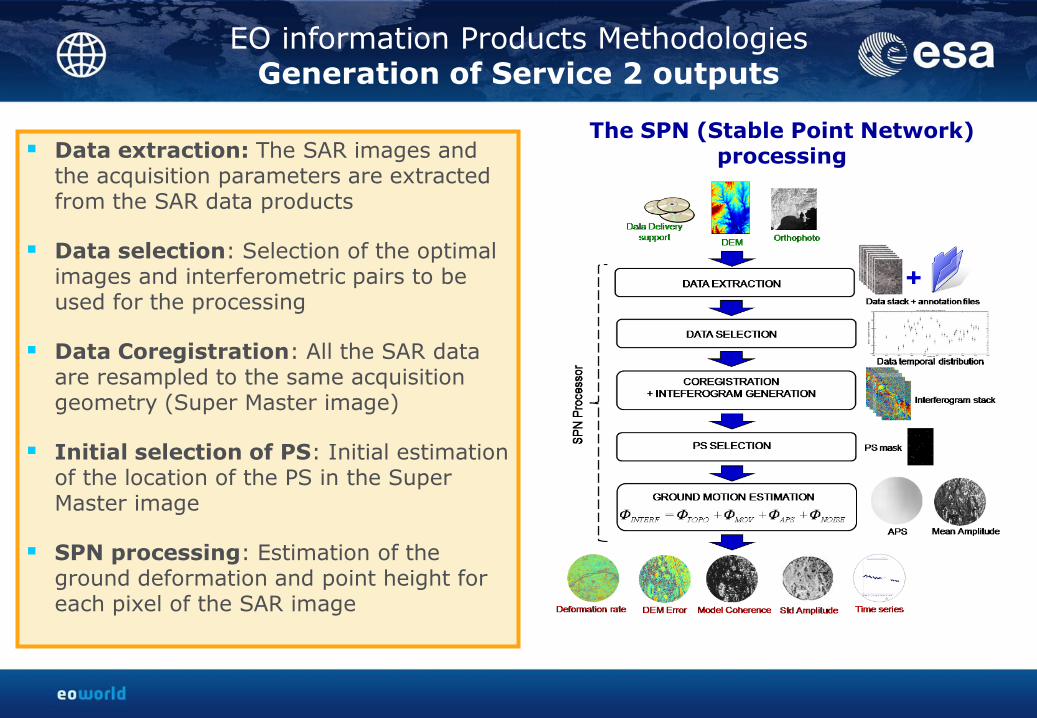
Data extraction: The SAR images and the acquisition parameters are extracted from the SAR data products
Data selection: Selection of the optimal images and interferometric pairs to be used for the processing
Data Coregistration: All the SAR data are resampled to the same acquisition geometry (Super Master image)
Initial selection of PS: Initial estimation of the location of the PS in the Super Master image
SPN processing: Estimation of the ground deformation and point height for each pixel of the SAR image
EO information Products Methodologies Generation of Service 2 outputs
The SPN (Stable Point Network) processing
EO information Products Methodologies Generation of Add Des Inf 1 outputs
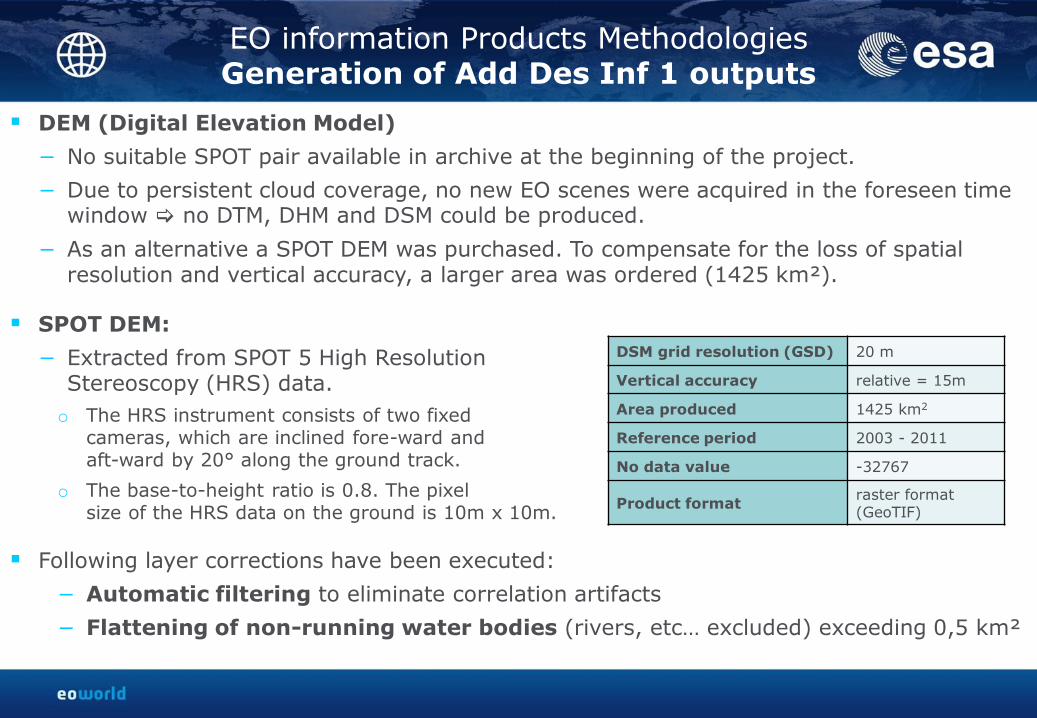
DEM (Digital Elevation Model)
− No suitable SPOT pair available in archive at the beginning of the project.
− Due to persistent cloud coverage, no new EO scenes were acquired in the foreseen time window no DTM, DHM and DSM could be produced.
− As an alternative a SPOT DEM was purchased. To compensate for the loss of spatial resolution and vertical accuracy, a larger area was ordered (1425 km²).
SPOT DEM:
− Extracted from SPOT 5 High Resolution Stereoscopy (HRS) data.
o The HRS instrument consists of two fixed cameras, which are inclined fore-ward and aft-ward by 20° along the ground track.
o The base-to-height ratio is 0.8. The pixel size of the HRS data on the ground is 10m x 10m.
Following layer corrections have been executed:
− Automatic filtering to eliminate correlation artifacts
− Flattening of non-running water bodies (rivers, etc… excluded) exceeding 0,5 km²
DSM grid resolution (GSD) 20 m
Vertical accuracy relative = 15m
Area produced 1425 km2
Reference period 2003 - 2011
No data value -32767
Product format raster format (GeoTIF)
EO information Products Methodologies Generation of Add Des Inf 2 outputs
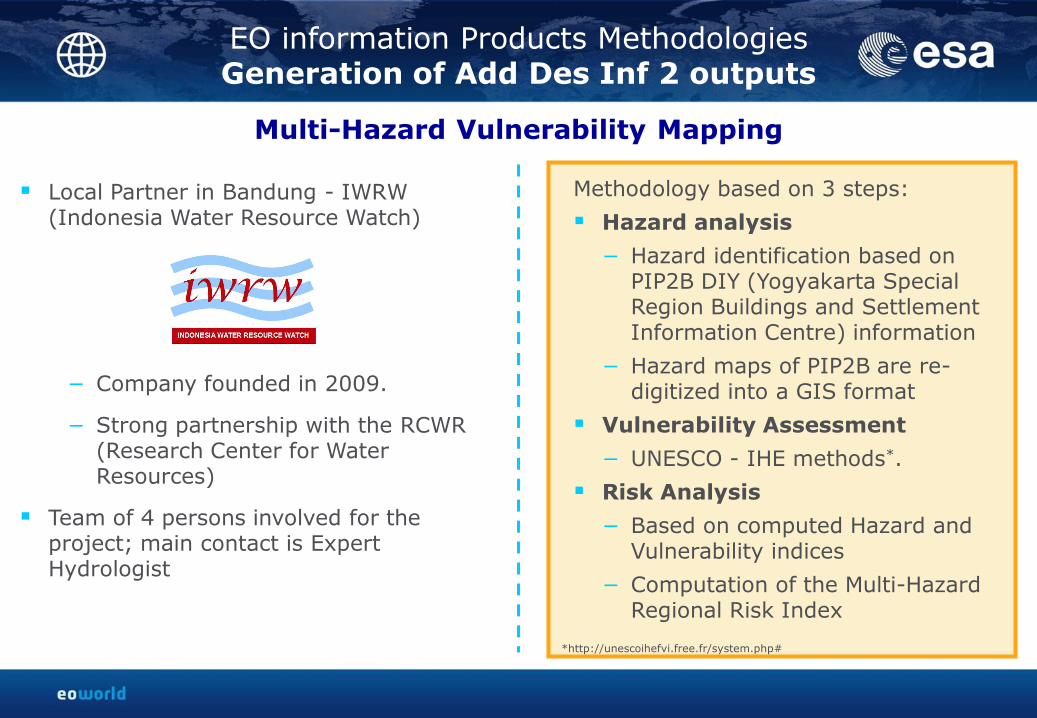
Local Partner in Bandung - IWRW (Indonesia Water Resource Watch)
− Company founded in 2009.
− Strong partnership with the RCWR (Research Center for Water Resources)
Team of 4 persons involved for the project; main contact is Expert Hydrologist
Methodology based on 3 steps:
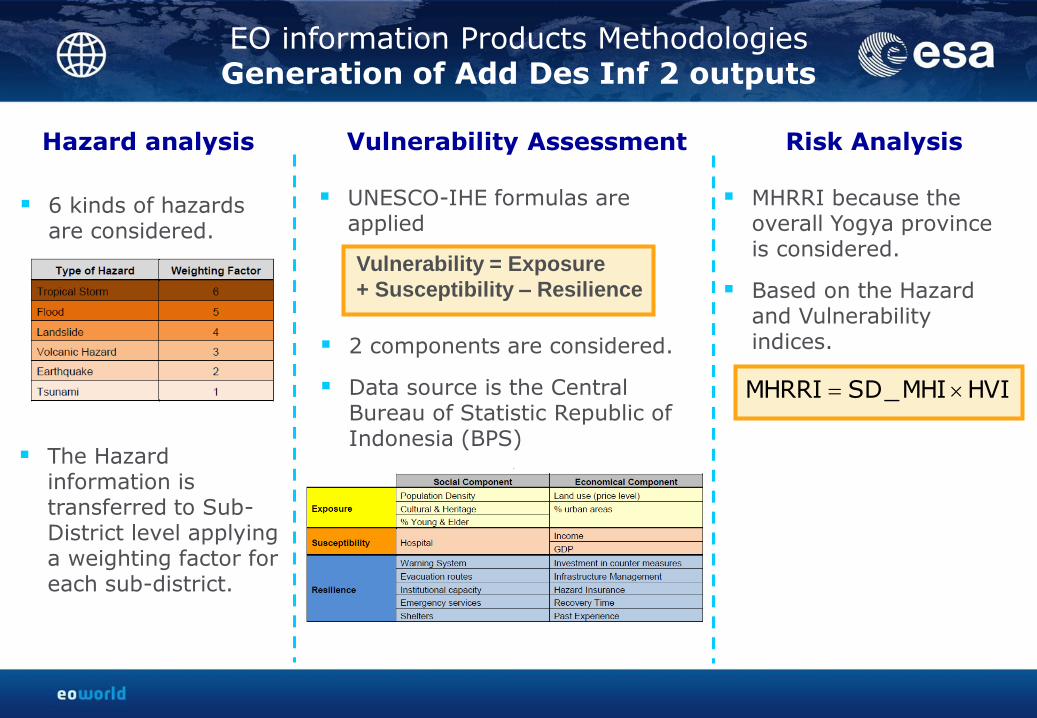
Hazard analysis
− Hazard identification based on PIP2B DIY (Yogyakarta Special Region Buildings and Settlement Information Centre) information
− Hazard maps of PIP2B are re-digitized into a GIS format
Vulnerability Assessment
− UNESCO - IHE methods*.
Risk Analysis
− Based on computed Hazard and Vulnerability indices
− Computation of the Multi-Hazard Regional Risk Index
Multi-Hazard Vulnerability Mapping
*http://unescoihefvi.free.fr/system.php#
EO information Products Methodologies Generation of Add Des Inf 2 outputs
Hazard analysis Vulnerability Assessment Risk Analysis
MHRRI because the overall Yogya province is considered.
Based on the Hazard and Vulnerability indices.
HVIMHI_SDMHRRI
Vulnerability = Exposure
+ Susceptibility – Resilience
2 components are considered.
Data source is the Central Bureau of Statistic Republic of Indonesia (BPS)
UNESCO-IHE formulas are applied
6 kinds of hazards are considered.
The Hazard information is transferred to Sub-District level applying a weighting factor for each sub-district.
EO information Products Methodologies Context for Add Des Inf 3
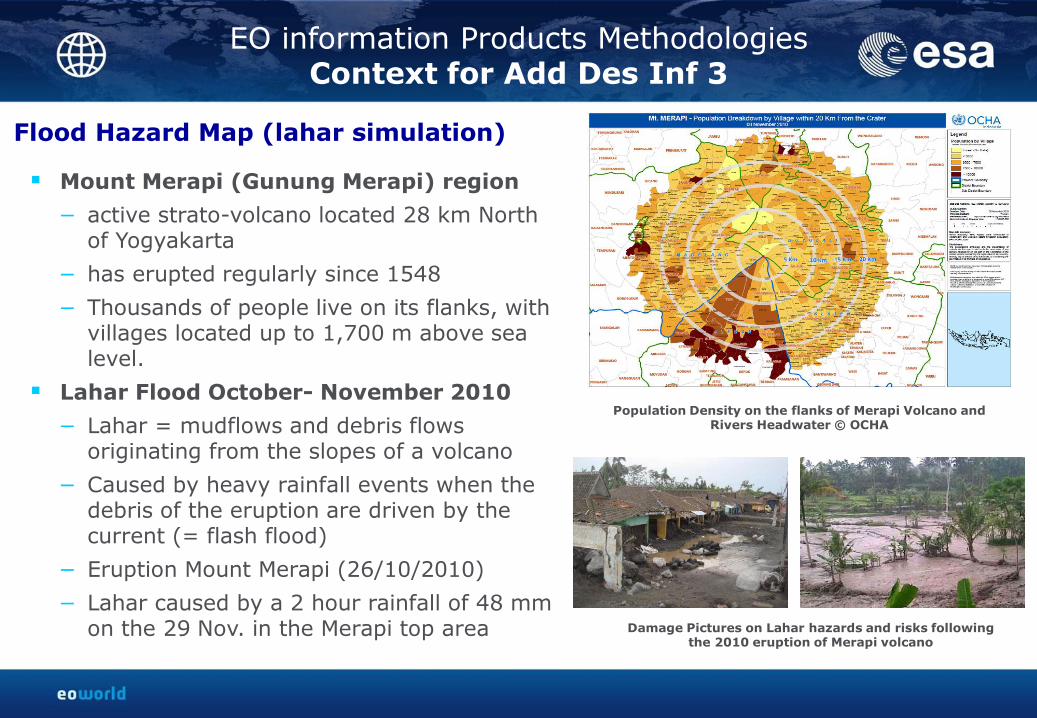
Mount Merapi (Gunung Merapi) region
− active strato-volcano located 28 km North of Yogyakarta
− has erupted regularly since 1548
− Thousands of people live on its flanks, with villages located up to 1,700 m above sea level.
Lahar Flood October- November 2010
− Lahar = mudflows and debris flows originating from the slopes of a volcano
− Caused by heavy rainfall events when the debris of the eruption are driven by the current (= flash flood)
− Eruption Mount Merapi (26/10/2010)
− Lahar caused by a 2 hour rainfall of 48 mm on the 29 Nov. in the Merapi top area
Flood Hazard Map (lahar simulation)
Damage Pictures on Lahar hazards and risks following the 2010 eruption of Merapi volcano
Population Density on the flanks of Merapi Volcano and Rivers Headwater © OCHA

EO information Products Methodologies Generation of Add Des Inf 3 outputs
Flood Hazard Map represents the result of a flood simulation for a past lahar event
AOI is at least 10 km buffer of Boyong & Code river over length of approx. 50 km.
FloodArea© software : a simplified 2D hydraulic model using the Manning equation
Flash Flood modelling
− Calculation volume of lahar
− Precipitation measurements in reference period (Bencana Banjir, nov 2010)
− Flow surge with a mean sediment concentration of 50% volume
− Reduction of river cross-section and higher friction parameter
Important local and expert information Volcanic Technology Development and Research Center (BPPTK)
Volcanology and Geological Disaster Mitigation Center (PVMBG)
Metereology, Climatology and Geophysics Agency (BMKG)
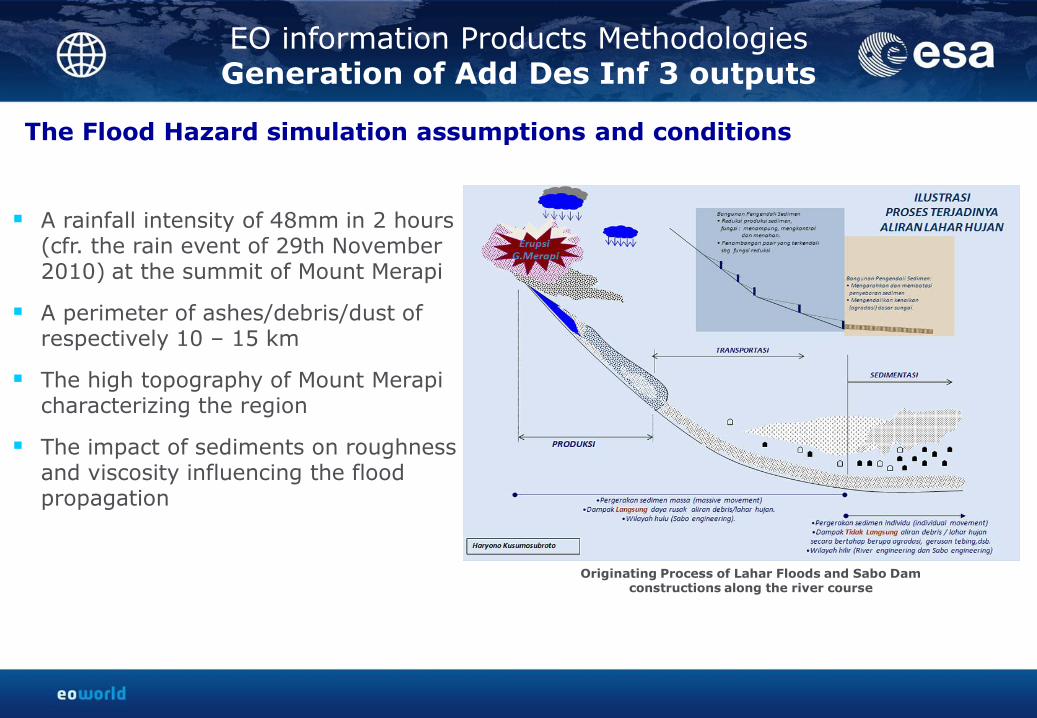
A rainfall intensity of 48mm in 2 hours (cfr. the rain event of 29th November 2010) at the summit of Mount Merapi
A perimeter of ashes/debris/dust of respectively 10 – 15 km
The high topography of Mount Merapi characterizing the region
The impact of sediments on roughness and viscosity influencing the flood propagation
Originating Process of Lahar Floods and Sabo Dam constructions along the river course
The Flood Hazard simulation assumptions and conditions
EO information Products Methodologies Generation of Add Des Inf 3 outputs
EO information Products Methodologies Generation of Add Des Inf 3 outputs
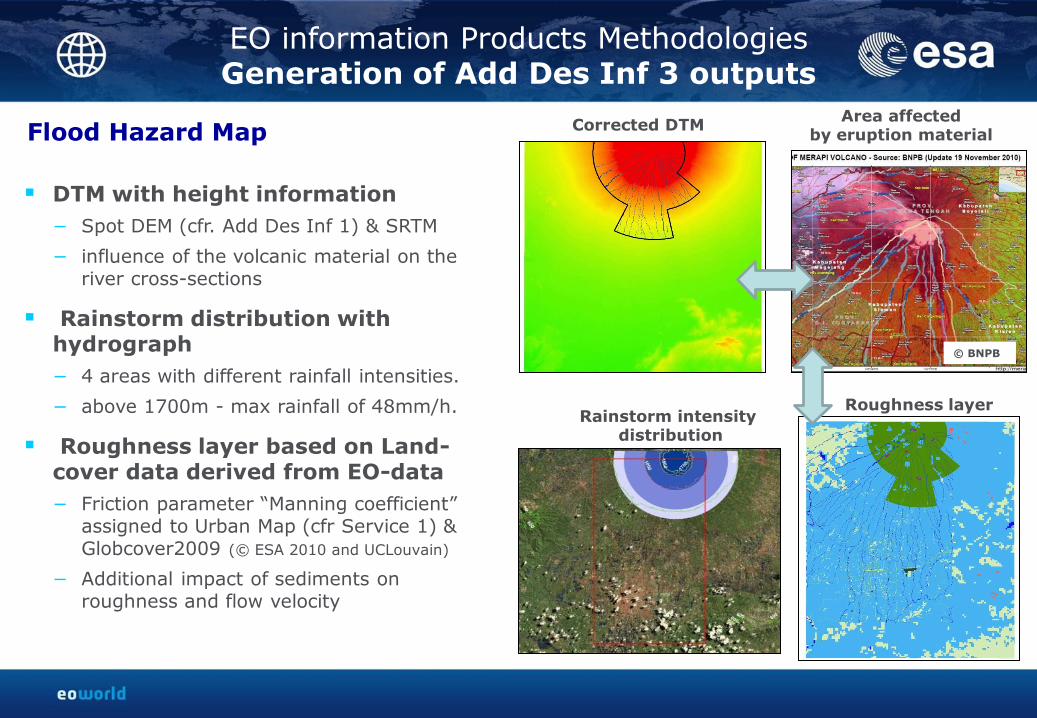
DTM with height information
− Spot DEM (cfr. Add Des Inf 1) & SRTM
− influence of the volcanic material on the river cross-sections
Rainstorm distribution with hydrograph
− 4 areas with different rainfall intensities.
− above 1700m - max rainfall of 48mm/h.
Roughness layer based on Land-cover data derived from EO-data
− Friction parameter “Manning coefficient” assigned to Urban Map (cfr Service 1) & Globcover2009 (© ESA 2010 and UCLouvain)
− Additional impact of sediments on roughness and flow velocity
Corrected DTM
Rainstorm intensity distribution
Roughness layer
Area affected by eruption material
© BNPB
Flood Hazard Map
Agenda
Introduction – Context of the project
– Delivered EO information products / services
– EO products methodologies
The EO Information main Services – Urban mapping product of infrastructure and building inventories
– Historical mapping of terrain deformations
The EO Information Additional Services – Precise Digital Elevation Model (DEM)
– Multi-hazard vulnerability mapping
– Flood Risk Analysis
Conclusion & User Feedback – Advantages / Constraints & Recommendations
– User Feedback Assessment
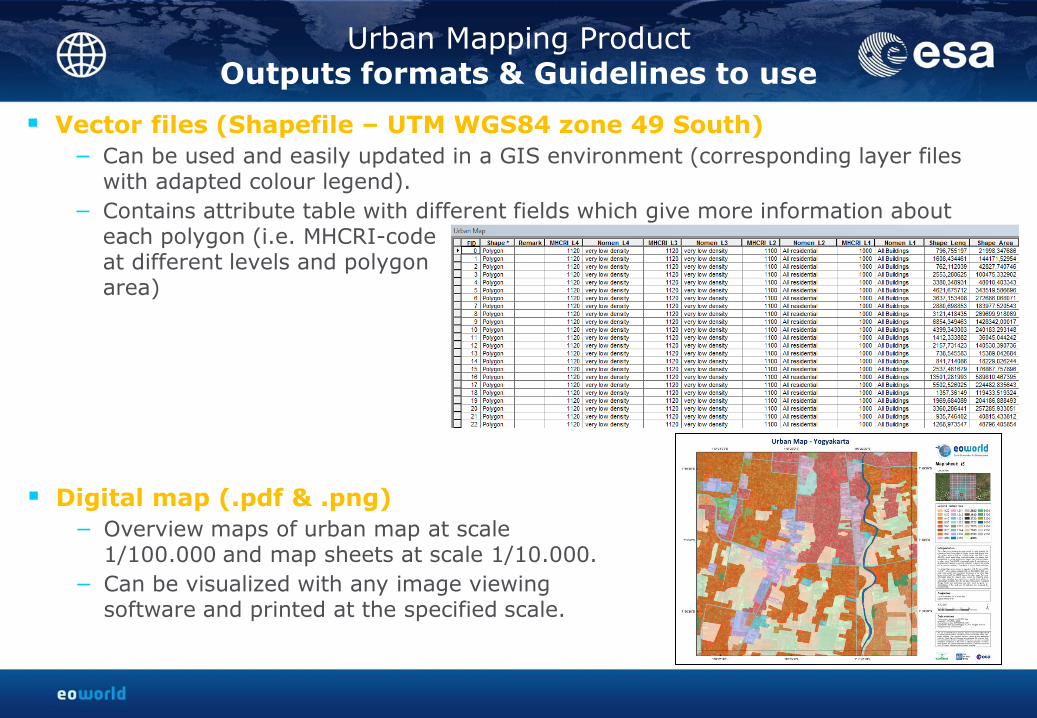
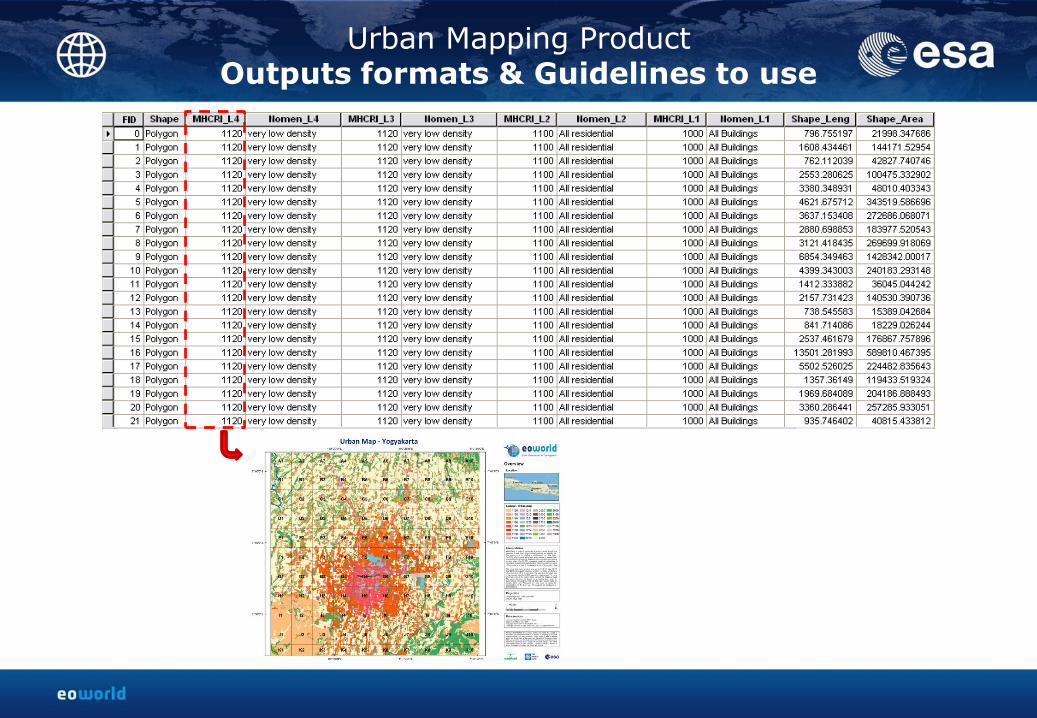
Urban Mapping Product Outputs formats & Guidelines to use
Vector files (Shapefile – UTM WGS84 zone 49 South)
− Can be used and easily updated in a GIS environment (corresponding layer files with adapted colour legend).
− Contains attribute table with different fields which give more information about each polygon (i.e. MHCRI-code at different levels and polygon area)
Digital map (.pdf & .png)
− Overview maps of urban map at scale 1/100.000 and map sheets at scale 1/10.000.
− Can be visualized with any image viewing software and printed at the specified scale.
Urban Mapping Product Outputs formats & Guidelines to use
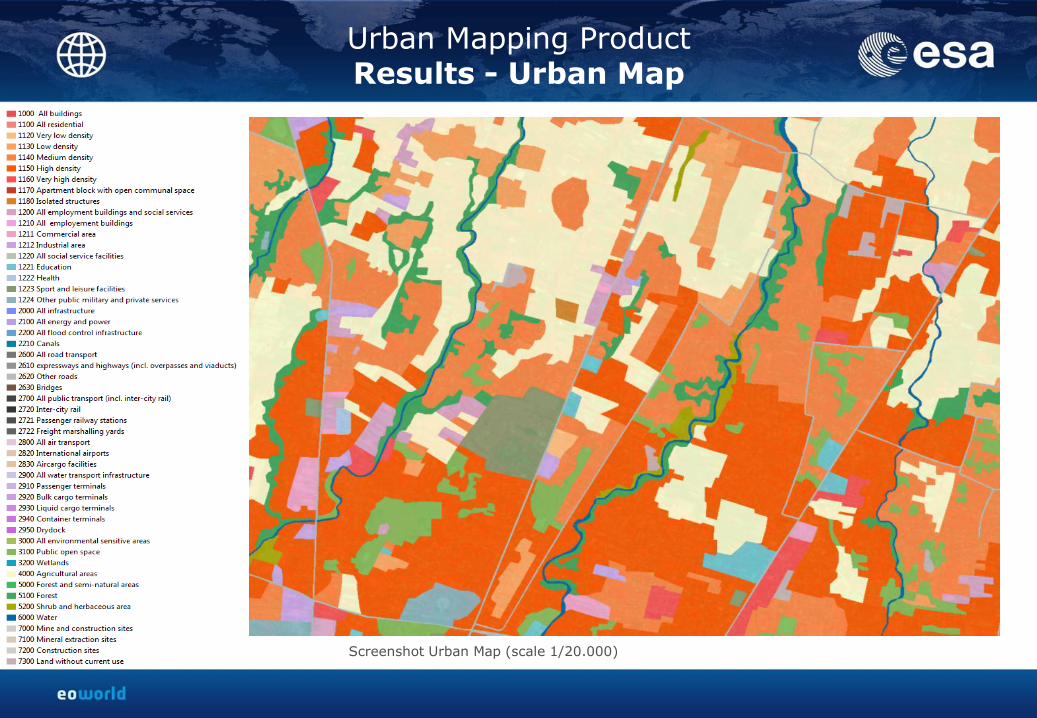
Urban Mapping Product Results - Urban Map
Screenshot Urban Map (scale 1/20.000)
© Spot Image S.A.,2011. All rights reserved
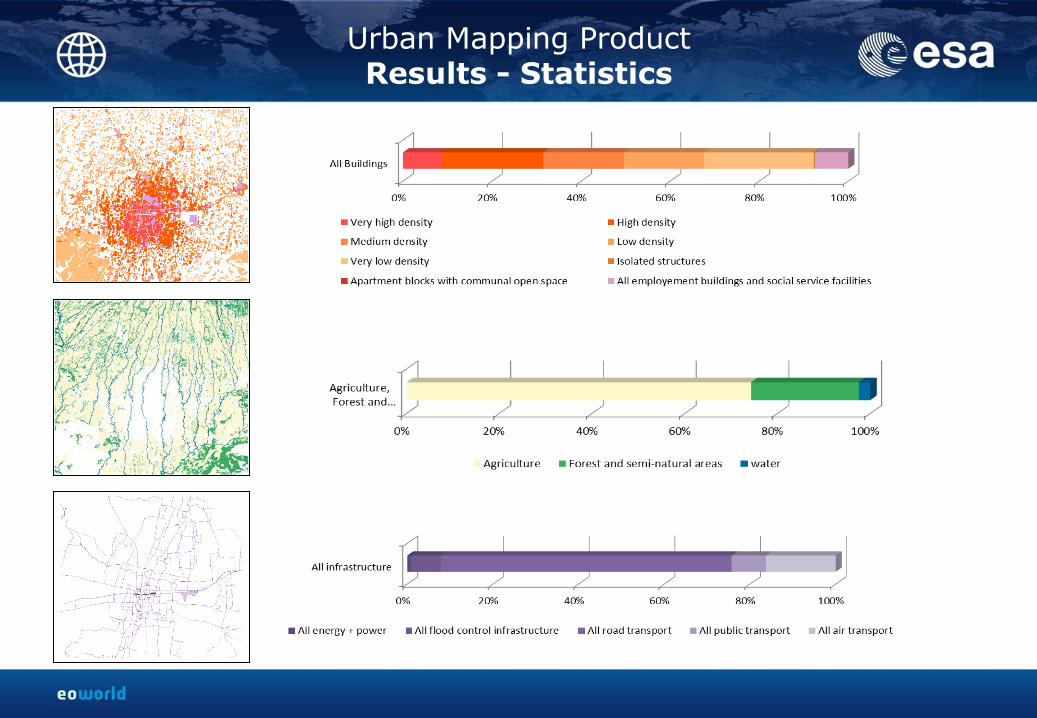
Urban Mapping Product Results - Statistics
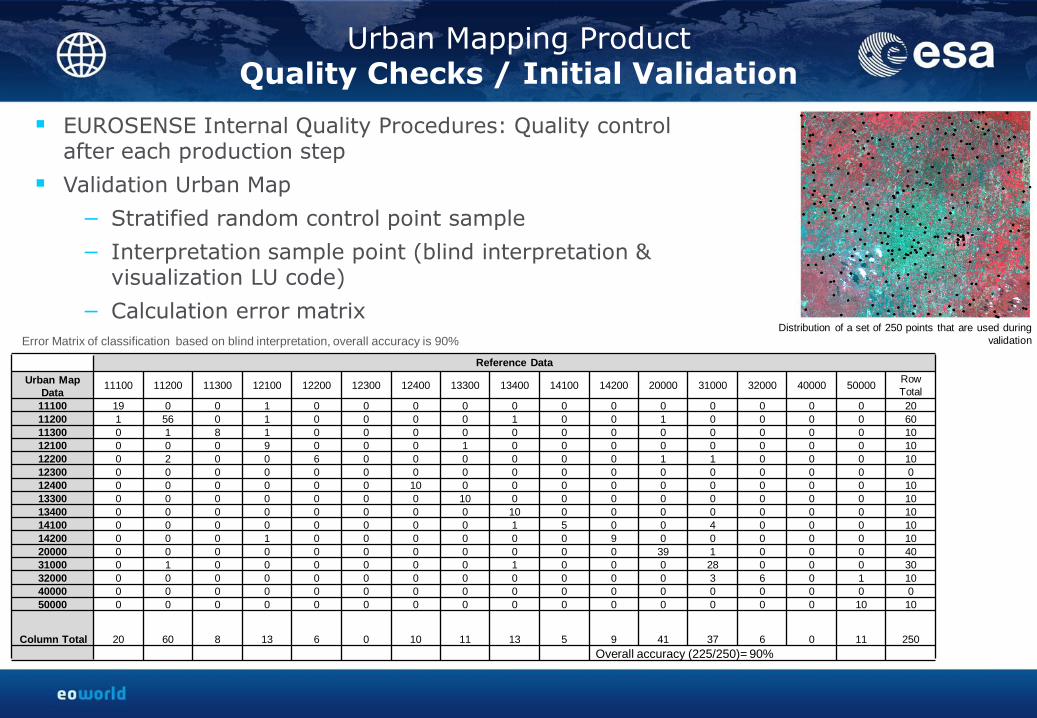
Urban Mapping Product Quality Checks / Initial Validation
EUROSENSE Internal Quality Procedures: Quality control after each production step
Validation Urban Map
− Stratified random control point sample
− Interpretation sample point (blind interpretation & visualization LU code)
− Calculation error matrix
Distribution of a set of 250 points that are used during
validation Error Matrix of classification based on blind interpretation, overall accuracy is 90%
Reference Data
Urban Map
Data 11100 11200 11300 12100 12200 12300 12400 13300 13400 14100 14200 20000 31000 32000 40000 50000
Row
Total
11100 19 0 0 1 0 0 0 0 0 0 0 0 0 0 0 0 20
11200 1 56 0 1 0 0 0 0 1 0 0 1 0 0 0 0 60
11300 0 1 8 1 0 0 0 0 0 0 0 0 0 0 0 0 10
12100 0 0 0 9 0 0 0 1 0 0 0 0 0 0 0 0 10
12200 0 2 0 0 6 0 0 0 0 0 0 1 1 0 0 0 10
12300 0 0 0 0 0 0 0 0 0 0 0 0 0 0 0 0 0
12400 0 0 0 0 0 0 10 0 0 0 0 0 0 0 0 0 10
13300 0 0 0 0 0 0 0 10 0 0 0 0 0 0 0 0 10
13400 0 0 0 0 0 0 0 0 10 0 0 0 0 0 0 0 10
14100 0 0 0 0 0 0 0 0 1 5 0 0 4 0 0 0 10
14200 0 0 0 1 0 0 0 0 0 0 9 0 0 0 0 0 10
20000 0 0 0 0 0 0 0 0 0 0 0 39 1 0 0 0 40
31000 0 1 0 0 0 0 0 0 1 0 0 0 28 0 0 0 30
32000 0 0 0 0 0 0 0 0 0 0 0 0 3 6 0 1 10
40000 0 0 0 0 0 0 0 0 0 0 0 0 0 0 0 0 0
50000 0 0 0 0 0 0 0 0 0 0 0 0 0 0 0 10 10
Column Total 20 60 8 13 6 0 10 11 13 5 9 41 37 6 0 11 250
Overall accuracy (225/250)= 90%
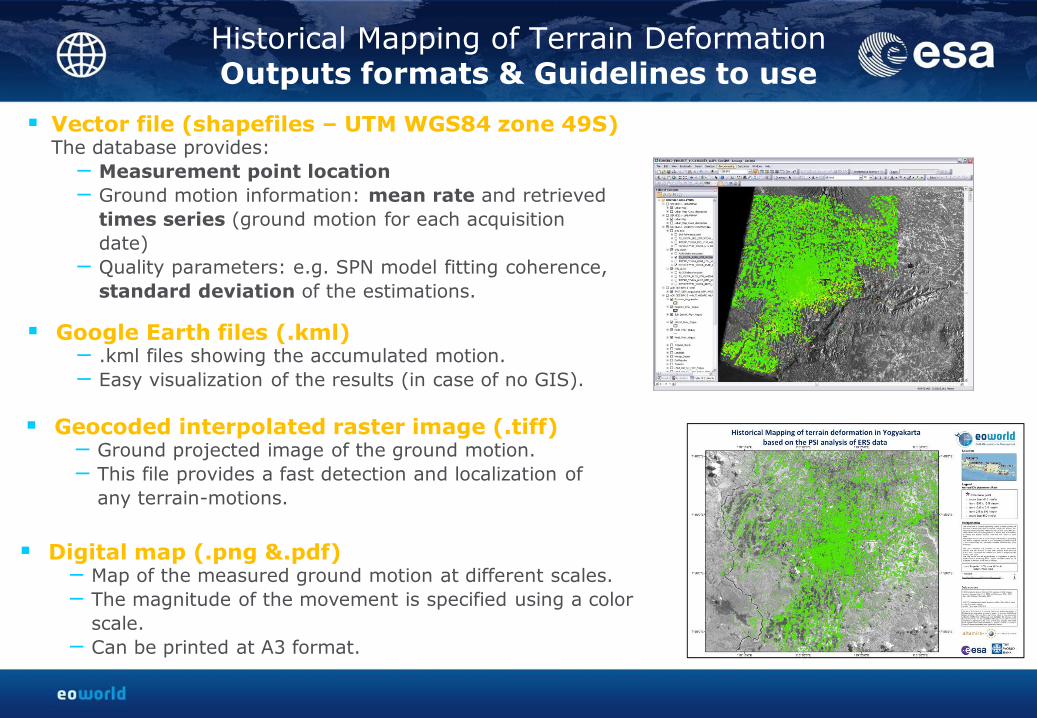
Historical Mapping of Terrain Deformation Outputs formats & Guidelines to use
Vector file (shapefiles – UTM WGS84 zone 49S) The database provides:
− Measurement point location
− Ground motion information: mean rate and retrieved
times series (ground motion for each acquisition
date)
− Quality parameters: e.g. SPN model fitting coherence,
standard deviation of the estimations.
Geocoded interpolated raster image (.tiff) − Ground projected image of the ground motion.
− This file provides a fast detection and localization of
any terrain-motions.
Digital map (.png &.pdf) − Map of the measured ground motion at different scales.
− The magnitude of the movement is specified using a color
scale.
− Can be printed at A3 format.
Google Earth files (.kml) − .kml files showing the accumulated motion.
− Easy visualization of the results (in case of no GIS).
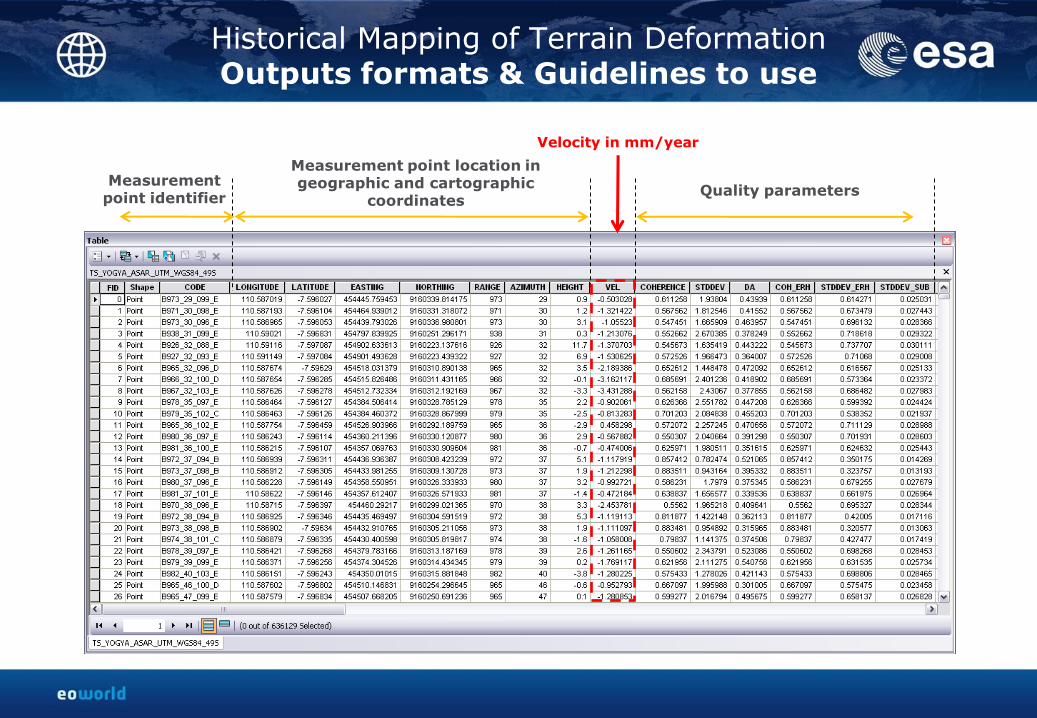
Measurement point identifier
Measurement point location in geographic and cartographic
coordinates Quality parameters
Velocity in mm/year
Historical Mapping of Terrain Deformation Outputs formats & Guidelines to use

Time series – evolution of the displacement (in mm) Accumulated displacement
over 6.5 years in mm
Historical Mapping of Terrain Deformation Outputs formats & Guidelines to use
-40
-30
-20
-10
0
10
20
Dis
pla
cem
en
t in
mm
Acquisition dates of the ENVISAT ASAR images
B973_37_098_B
-40
-30
-20
-10
0
10
20
Dis
pla
cem
en
t in
mm
Acquisition dates of the ENVISAT ASAR images
B973_37_098_B
B967_32_103_E
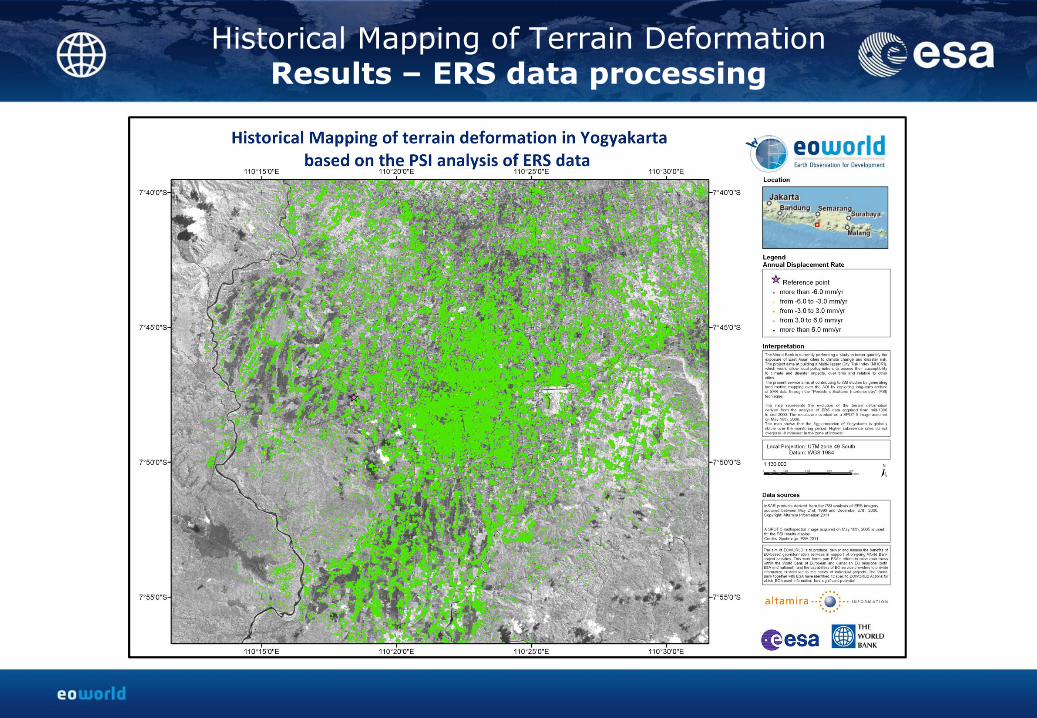
Historical Mapping of Terrain Deformation Results – ERS data processing

104612 measurement points have been selected (over 1300 km2).
They are mainly located in urban areas and over ground covered by rocks.
The land deformation in the area is displayed with a scale varying from red (>-6mm/yr) to blue (> 6 mm/yr) - The reference point is located in Gamping District (Sleman) in a stable area.
More than 99.8 % of the detected points are stables.
Historical Mapping of Terrain Deformation Results – ERS data processing
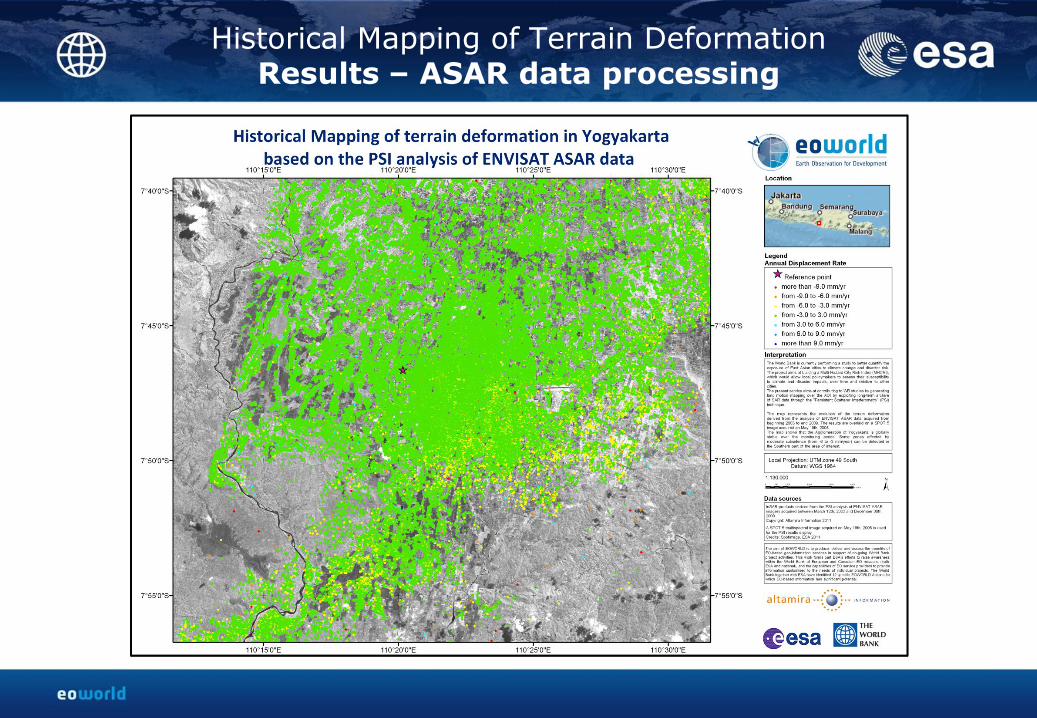
Historical Mapping of Terrain Deformation Results – ASAR data processing
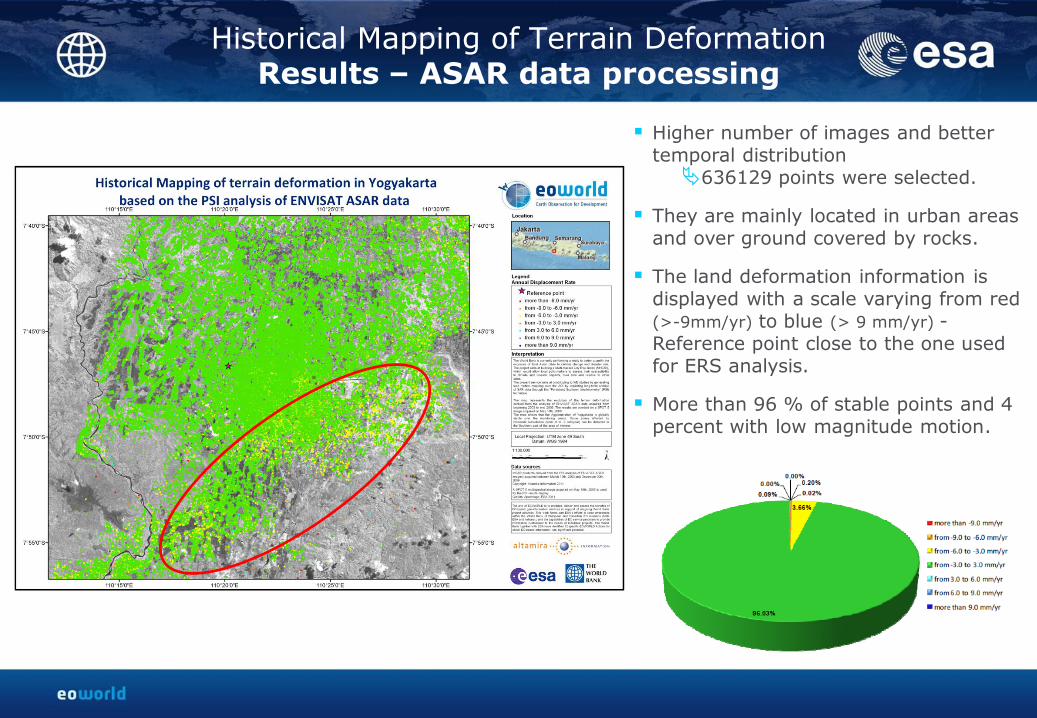
Higher number of images and better temporal distribution 636129 points were selected.
They are mainly located in urban areas and over ground covered by rocks.
The land deformation information is displayed with a scale varying from red (>-9mm/yr) to blue (> 9 mm/yr) - Reference point close to the one used for ERS analysis.
More than 96 % of stable points and 4 percent with low magnitude motion.
Historical Mapping of Terrain Deformation Results – ASAR data processing
B2736_6558_100_E
B2623_7853_102_D
B2626_7827_110_E
-60
-50
-40
-30
-20
-10
0
10
November-02 April-04 August-05 January-07 May-08 October-09
Dis
pla
cem
en
t (i
n m
m)
Acquisition dates of the ASAR images
B2736_6558_100_E
B2626_7827_110_E
B2623_7853_102_D
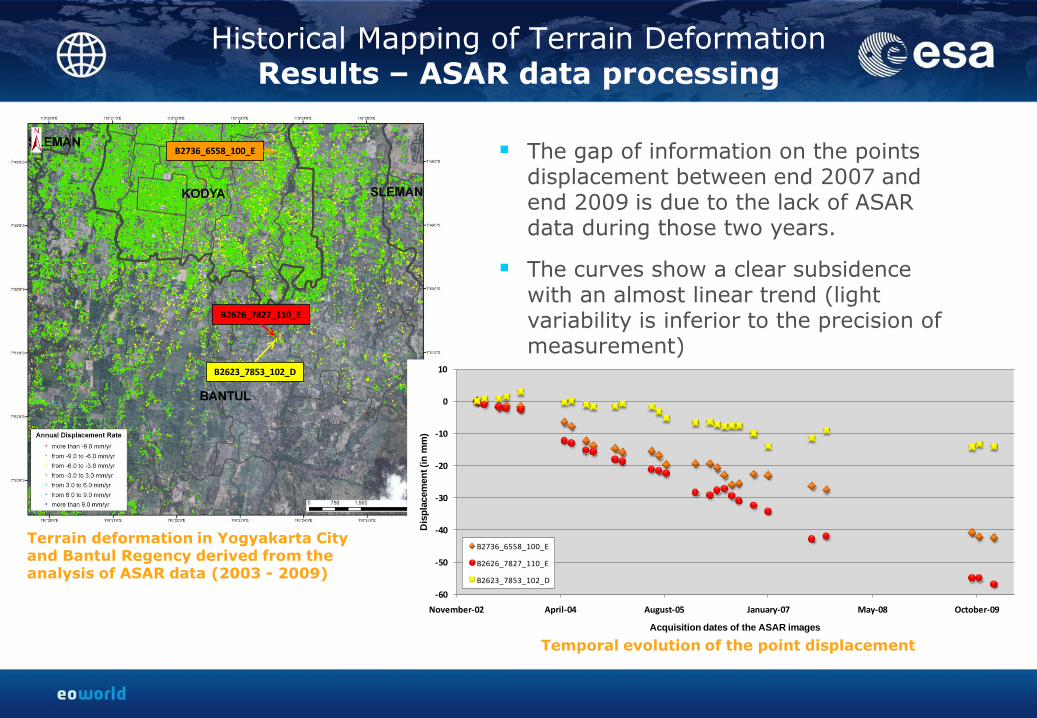
Terrain deformation in Yogyakarta City and Bantul Regency derived from the analysis of ASAR data (2003 - 2009)
Temporal evolution of the point displacement
The gap of information on the points displacement between end 2007 and end 2009 is due to the lack of ASAR data during those two years.
The curves show a clear subsidence with an almost linear trend (light variability is inferior to the precision of measurement)
Historical Mapping of Terrain Deformation Results – ASAR data processing
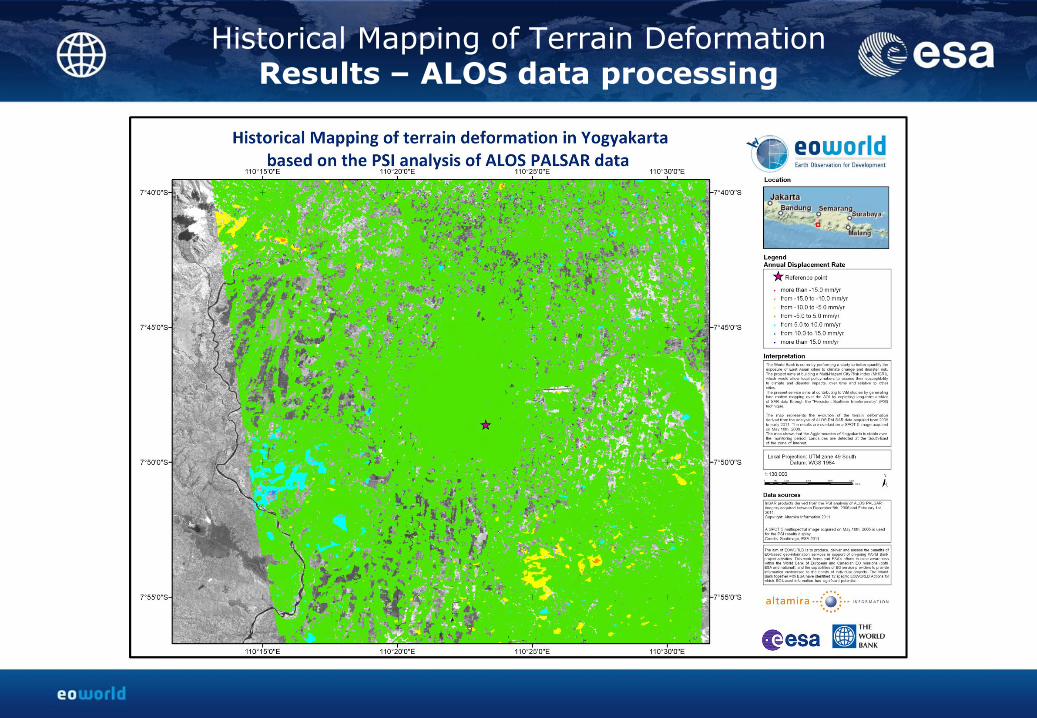
Historical Mapping of Terrain Deformation Results – ALOS data processing
Historical Mapping of Terrain Deformation Results – ALOS data processing
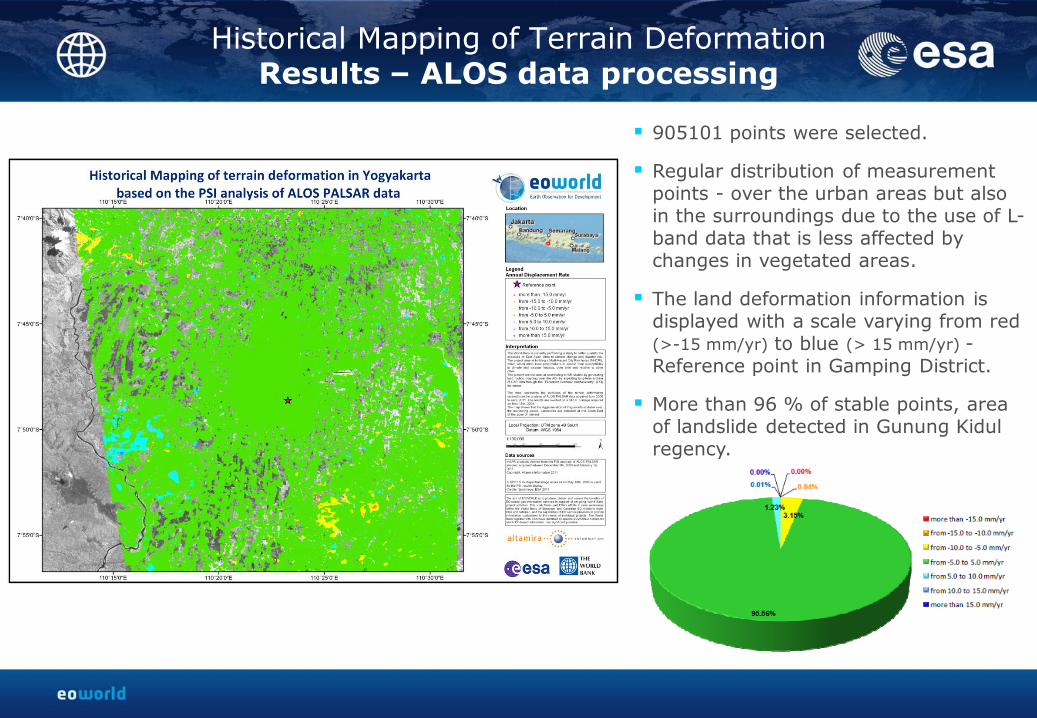
905101 points were selected.
Regular distribution of measurement points - over the urban areas but also in the surroundings due to the use of L-band data that is less affected by changes in vegetated areas.
The land deformation information is displayed with a scale varying from red (>-15 mm/yr) to blue (> 15 mm/yr) - Reference point in Gamping District.
More than 96 % of stable points, area of landslide detected in Gunung Kidul regency.

Historical Mapping of Terrain Deformation Results – Continuity of the time series
3-year temporal gap between the ERS and ASAR stacks, but overlap of 4 years between ASAR and ALOS analyses.
Comparison of ASAR and ALOS time series:
− Possible in areas where ASAR show high motion rates, considering the 7 mm absolute accuracy of the L-band measurements.
− One area selected as example in Sleman Regency; a good agreement between the time series has been found.
-120
-100
-80
-60
-40
-20
0
9/1/2002 1/14/2004 5/28/2005 10/10/2006 2/22/2008 7/6/2009 11/18/2010 4/1/2012
De
form
ati
on
(m
m)
Dates
ASAR (B2681_2519_100_E) vs ALOS(B785_2010_106_B)
ASAR data
ALOS data

Historical Mapping of Terrain Deformation Quality Checks / Initial Validation
The German Space Agency (DLR) has certified that the PSI processing of Altamira Information was conformed to the Terrafirma Validation Project
standards
Validation
Validated results with external measurements: precise leveling,
GPS, geodesic measurement, extensometers
Quality controls
PSI and InSAR processing steps are precisely controlled according to a quality
control protocol (certified by DLR). The protocol sets down a series of
automated and operator driven quality checks.
Technique developed in-house
Continuous investment in internal developments in PSI. Adaptation of the
technology to the project needs
Introduction – Context of the project
– Delivered EO information products / services
– EO products methodologies
The EO Information main Services – Urban mapping product of infrastructure and building inventories
– Historical mapping of terrain deformations
The EO Information Additional Services – Precise Digital Elevation Model (DEM)
– Multi-hazard vulnerability mapping
– Flood Risk Analysis
Conclusion & User Feedback – Advantages / Constraints & Recommendations
– User Feedback Assessment
Agenda
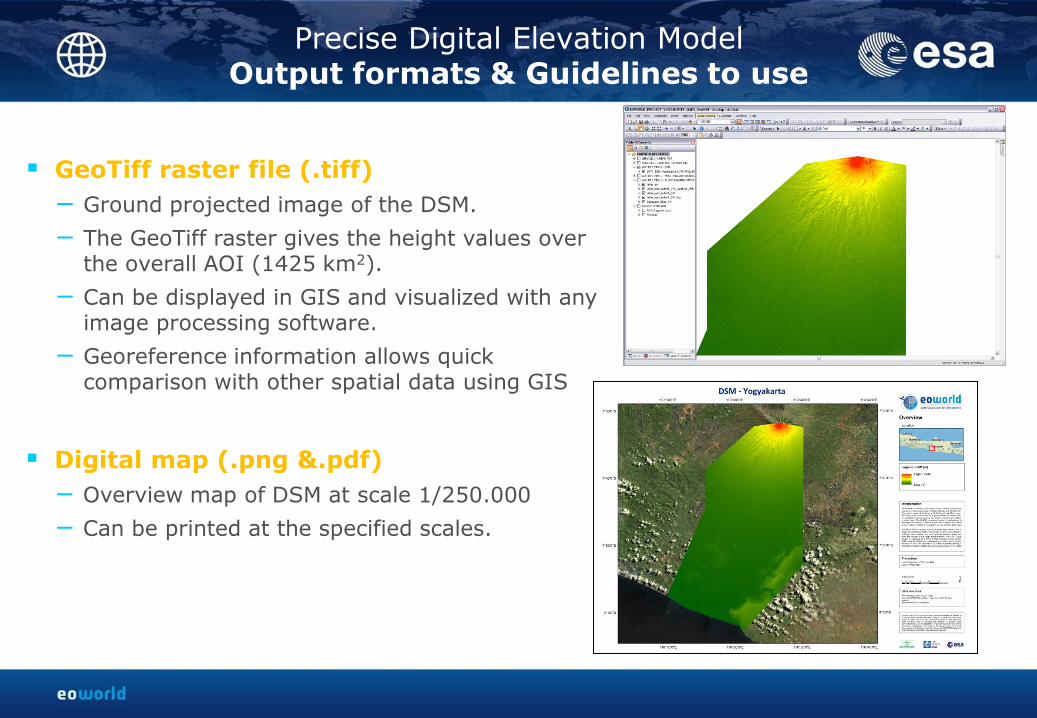
GeoTiff raster file (.tiff)
− Ground projected image of the DSM.
− The GeoTiff raster gives the height values over the overall AOI (1425 km2).
− Can be displayed in GIS and visualized with any image processing software.
− Georeference information allows quick comparison with other spatial data using GIS
Digital map (.png &.pdf)
− Overview map of DSM at scale 1/250.000
− Can be printed at the specified scales.
Precise Digital Elevation Model Output formats & Guidelines to use
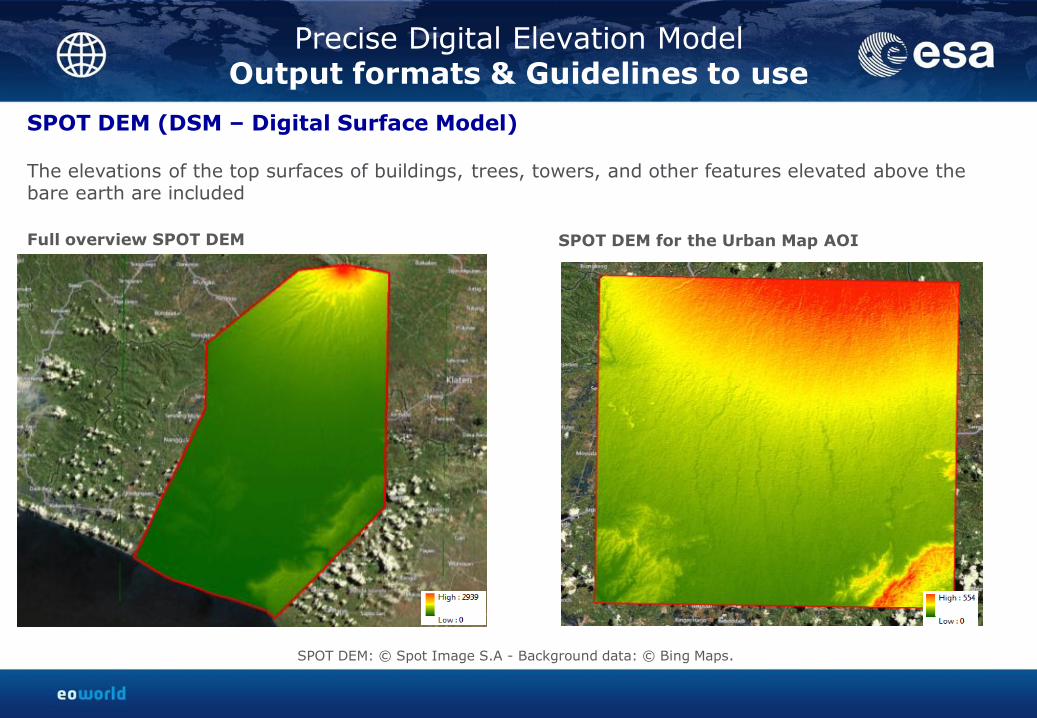
SPOT DEM (DSM – Digital Surface Model)
The elevations of the top surfaces of buildings, trees, towers, and other features elevated above the bare earth are included
SPOT DEM: © Spot Image S.A - Background data: © Bing Maps.
SPOT DEM for the Urban Map AOI Full overview SPOT DEM
Precise Digital Elevation Model Output formats & Guidelines to use
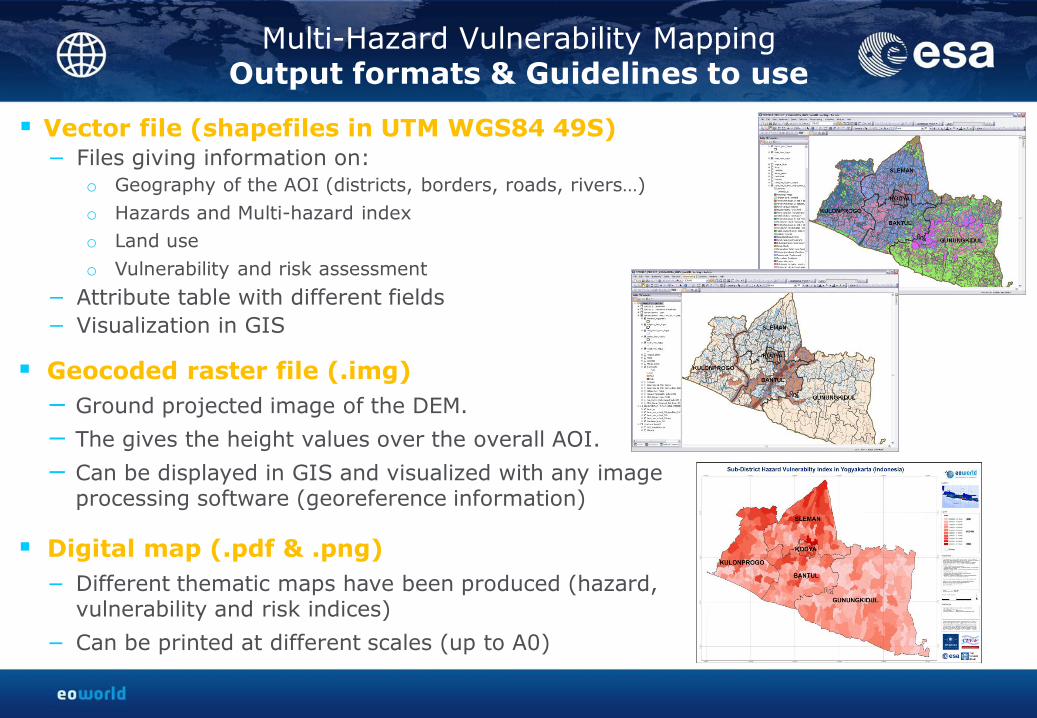
Digital map (.pdf & .png)
− Different thematic maps have been produced (hazard, vulnerability and risk indices)
− Can be printed at different scales (up to A0)
Vector file (shapefiles in UTM WGS84 49S) − Files giving information on:
o Geography of the AOI (districts, borders, roads, rivers…)
o Hazards and Multi-hazard index
o Land use
o Vulnerability and risk assessment
− Attribute table with different fields
− Visualization in GIS
Multi-Hazard Vulnerability Mapping Output formats & Guidelines to use
Geocoded raster file (.img)
− Ground projected image of the DEM.
− The gives the height values over the overall AOI.
− Can be displayed in GIS and visualized with any image processing software (georeference information)
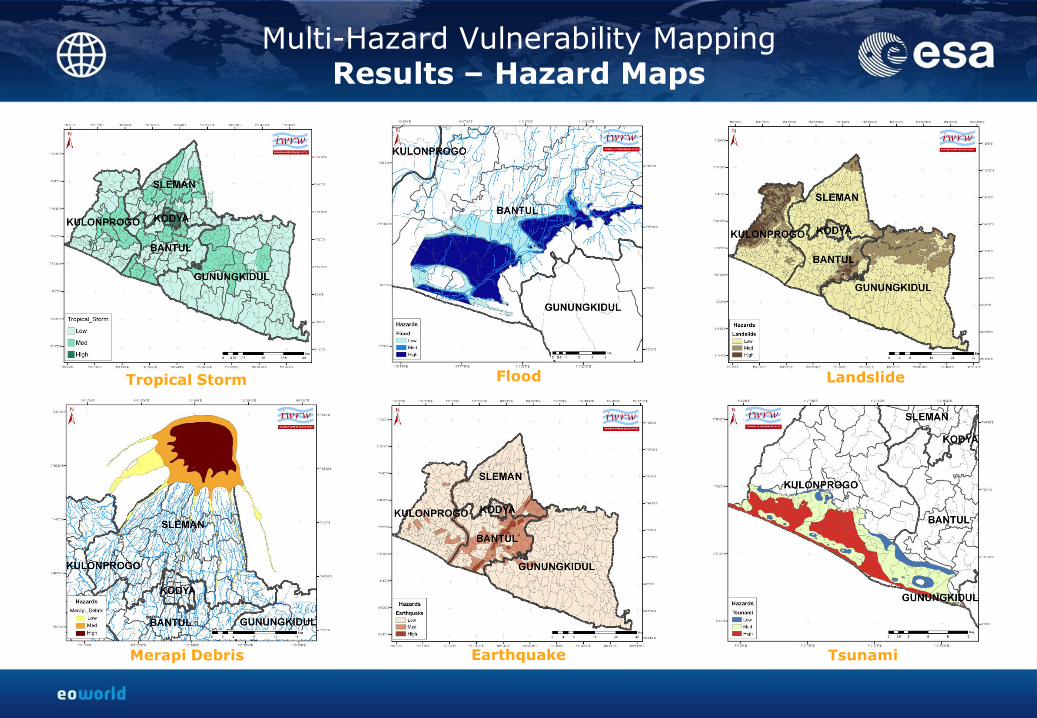
Tropical Storm
Merapi Debris Earthquake Tsunami
Landslide Flood
Multi-Hazard Vulnerability Mapping Results – Hazard Maps

Multi-Hazard Vulnerability Mapping Results – Multi-Hazard Indices
Multi-Hazard Index Sub-District Multi-Hazard Index
The multi-hazard information is transferred to Sub-District level (elementary cell of the mapping.)
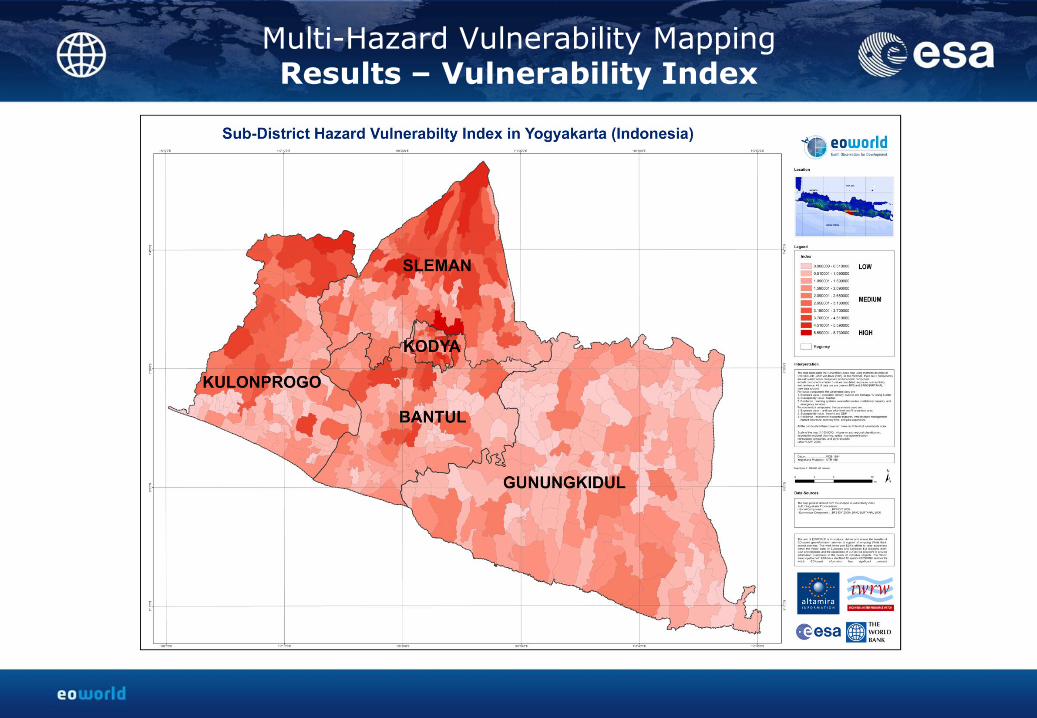
Multi-Hazard Vulnerability Mapping Results – Vulnerability Index
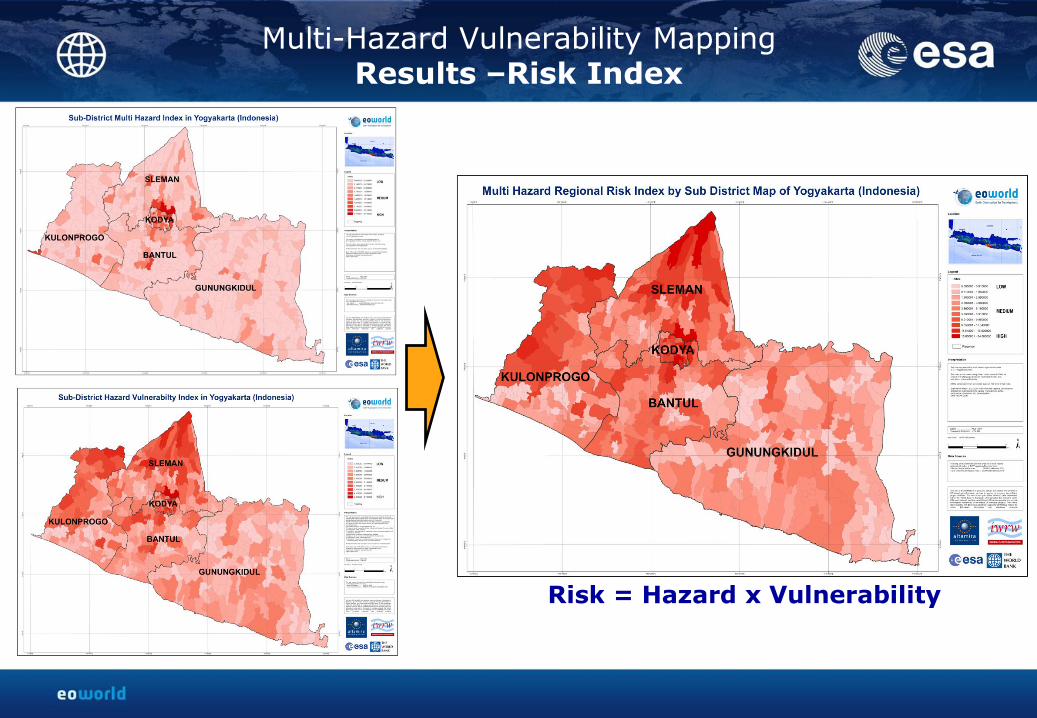
Risk = Hazard x Vulnerability
Multi-Hazard Vulnerability Mapping Results –Risk Index

Vector files (Shapefile – Projection UTM WGS84 49S)
− Attribute table with different fields (depending on the corresponding maps)
− Integration of GIS database (layer files) and easy update
− Statistical data for further analysis and indicator extraction
Digital map (.pdf & .png)
Overview maps and maps sheets for index
−Maximum water depth
−Impact on land use classes Easy printing and visualization by different delivery formats
Raster geodatabase (.gdb)
− 96 water depth rasters – 24h each 15 min
− 1 standard legend layer for complete raster geodatabase
Animation movie (.wmv)
− Provides crucial information about the propagation and lahar velocity
− Can be played on any standard pc
Flood Hazard Mapping Output formats & Guidelines to use

Flood Hazard map (max water depth raster) for the Merapi lahar event of November 2010, Yogyakarta (Indonesia), 1/150.000
Flood Hazard Mapping Results – Flood Hazard Map database
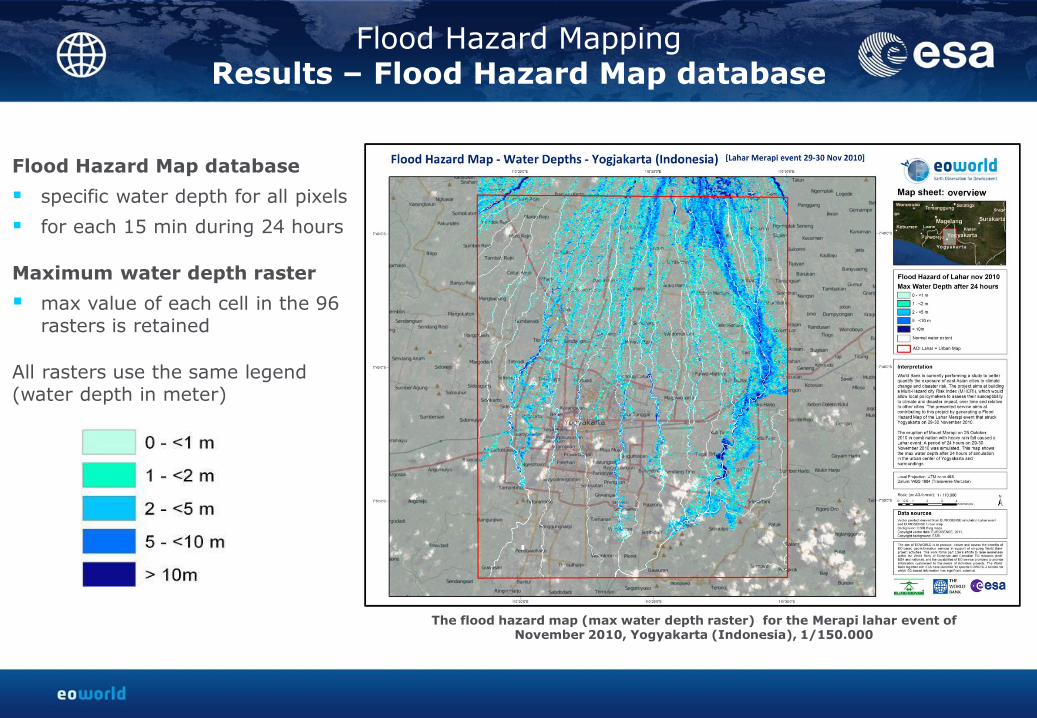
The flood hazard map (max water depth raster) for the Merapi lahar event of November 2010, Yogyakarta (Indonesia), 1/150.000
Flood Hazard Map database
specific water depth for all pixels
for each 15 min during 24 hours
Maximum water depth raster
max value of each cell in the 96 rasters is retained
All rasters use the same legend (water depth in meter)
Flood Hazard Mapping Results – Flood Hazard Map database
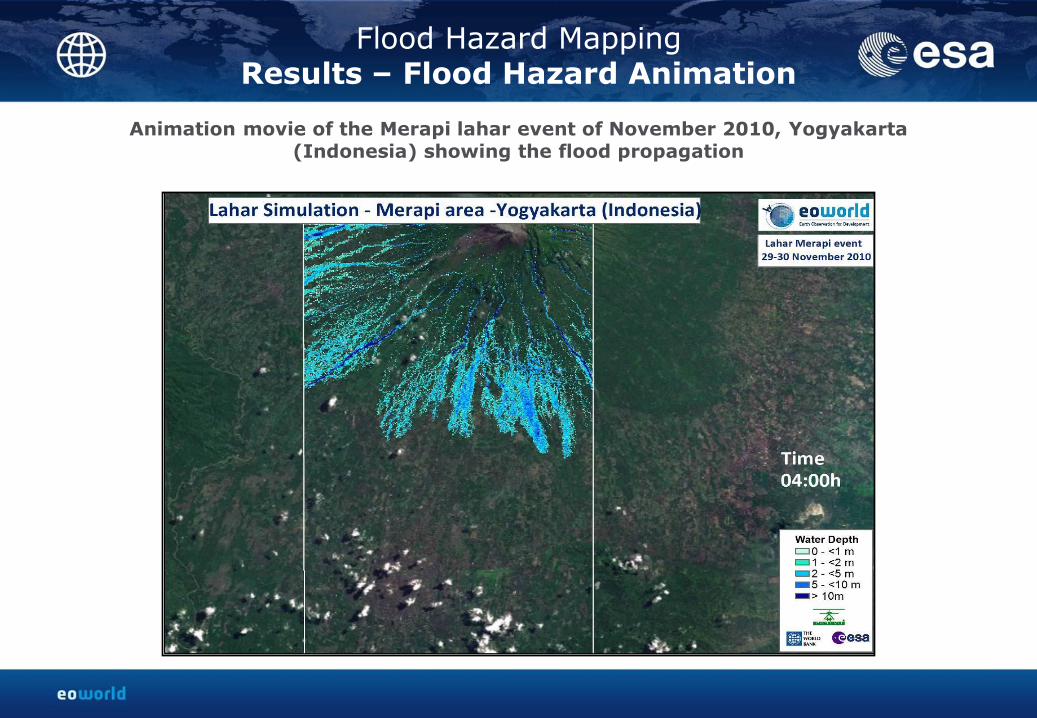
Animation movie of the Merapi lahar event of November 2010, Yogyakarta (Indonesia) showing the flood propagation
Flood Hazard Mapping Results – Flood Hazard Animation
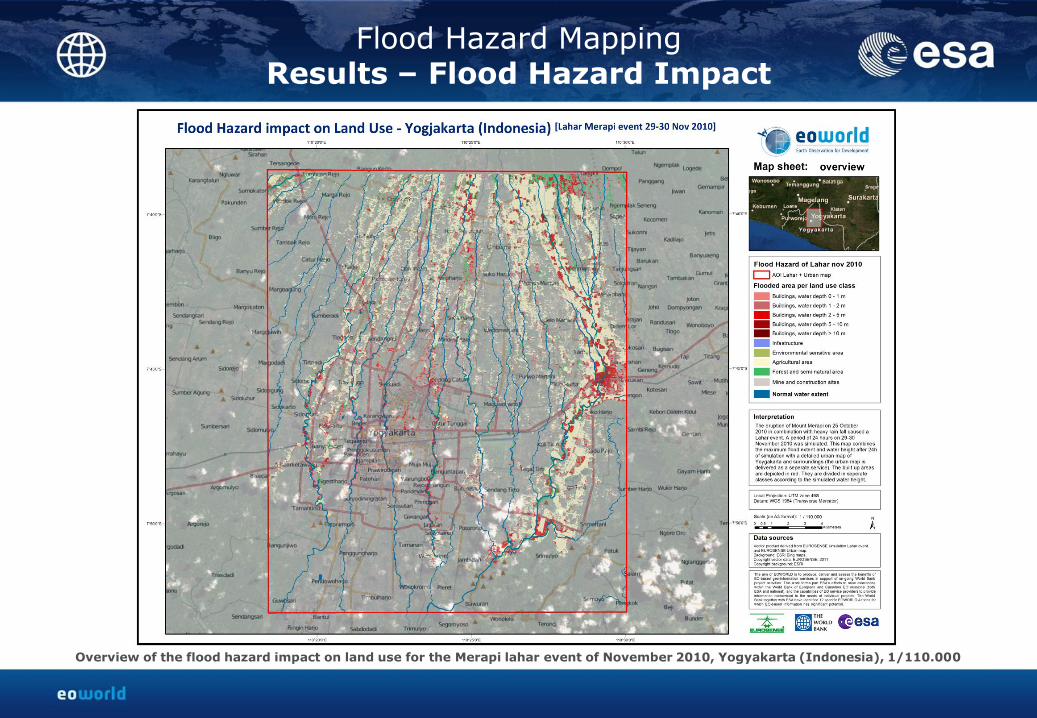
Flood Hazard Mapping Results – Flood Hazard Impact
Overview of the flood hazard impact on land use for the Merapi lahar event of November 2010, Yogyakarta (Indonesia), 1/110.000

Flood Hazard Mapping Results – Flood Hazard Impact
Flood Hazard Impact on land use classes
affected built-up area
using a gradient of colors representing the water depth
Overview of the flood hazard impact on land use for the Merapi lahar
event of November 2010, Yogyakarta (Indonesia), 1/110.000

Flood Hazard Mapping Quality checks, Initial Validation
Validation of the simulation process
FloodArea software validated by scientific & commercial references and qualification procedures in EC/ESA projects
Simulation is validated via repetitive cycle of calibration, adaptations in input layers and parameterization
Simulation result can only be as good as the input data (e.g. resolution, geolocation accuracy, vertical accuracy…)
Validation of the Flood Hazard Maps database
Risk zones
Flood Extent
By sources:
Local information in reports and articles of newspapers/press
Reference inundation maps
No scientific reference data available
Flooded regencies of Sleman, Bantul and Yogyakarta City
Risk zones
Flood Extent
Comparison between simulated extent and past flood map
Flood Hazard Mapping Quality checks, Initial Validation
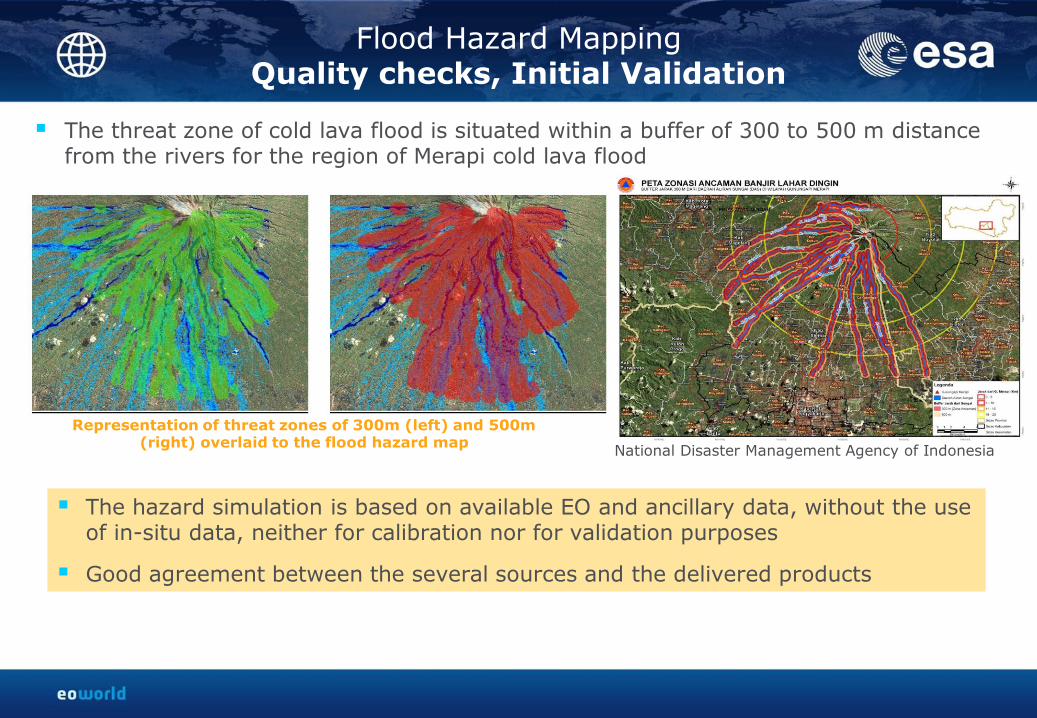
The threat zone of cold lava flood is situated within a buffer of 300 to 500 m distance
from the rivers for the region of Merapi cold lava flood
The hazard simulation is based on available EO and ancillary data, without the use of in-situ data, neither for calibration nor for validation purposes
Good agreement between the several sources and the delivered products
National Disaster Management Agency of Indonesia
Representation of threat zones of 300m (left) and 500m (right) overlaid to the flood hazard map
Agenda
Introduction – Context of the project
– Delivered EO information products / services
– EO products methodologies
The EO Information main Services – Urban mapping product of infrastructure and building inventories
– Historical mapping of terrain deformations
The EO Information Additional Services – Precise Digital Elevation Model (DEM)
– Multi-hazard vulnerability mapping
– Flood Risk Analysis
Conclusion & User Feedback – Advantages / Constraints & Recommendations
– User Feedback Assessment
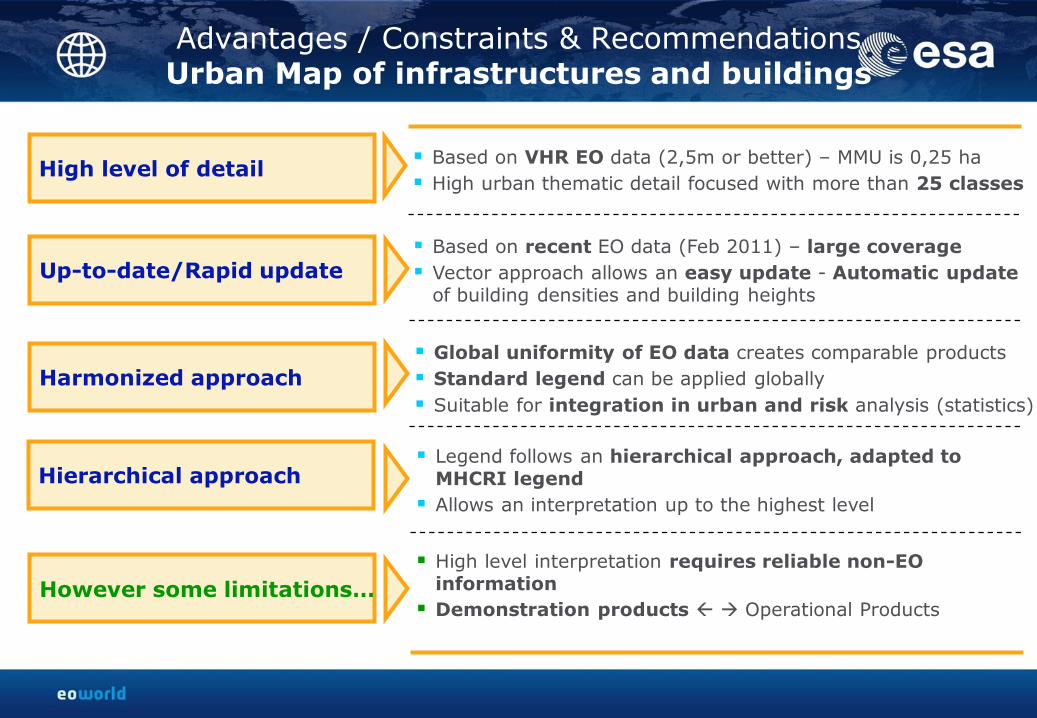
Up-to-date/Rapid update
Harmonized approach
Hierarchical approach
High level of detail
Global uniformity of EO data creates comparable products
Standard legend can be applied globally
Suitable for integration in urban and risk analysis (statistics)
Legend follows an hierarchical approach, adapted to MHCRI legend
Allows an interpretation up to the highest level
Based on VHR EO data (2,5m or better) – MMU is 0,25 ha
High urban thematic detail focused with more than 25 classes
However some limitations…
High level interpretation requires reliable non-EO information
Demonstration products Operational Products
Advantages / Constraints & Recommendations Urban Map of infrastructures and buildings
Based on recent EO data (Feb 2011) – large coverage
Vector approach allows an easy update - Automatic update of building densities and building heights
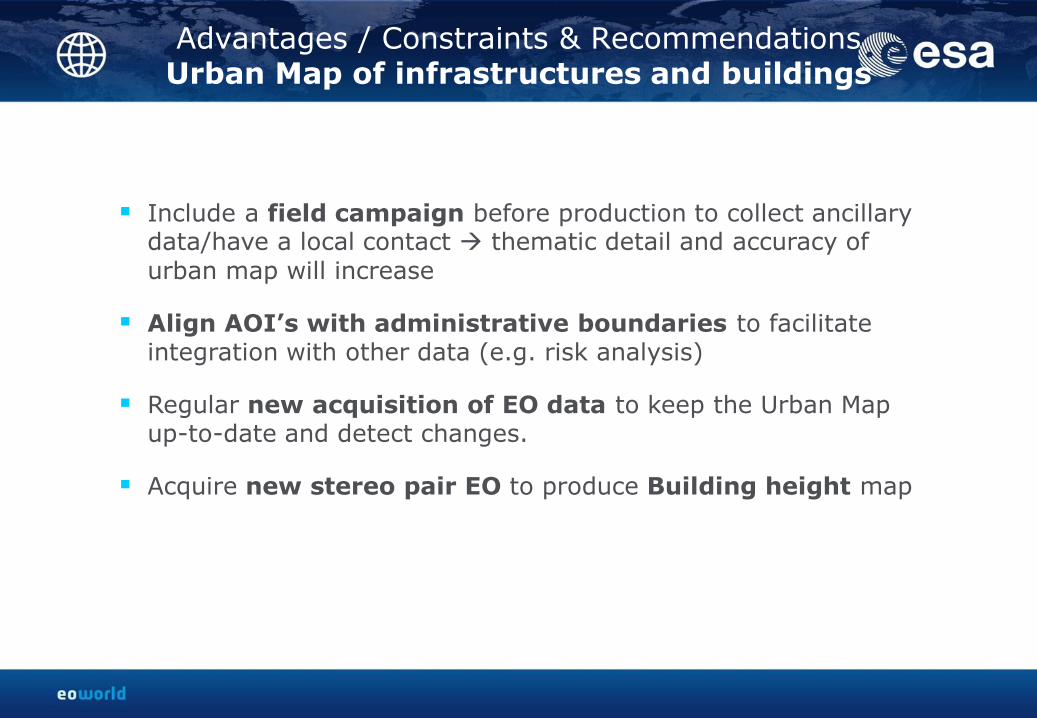
Advantages / Constraints & Recommendations Urban Map of infrastructures and buildings
Include a field campaign before production to collect ancillary data/have a local contact thematic detail and accuracy of urban map will increase
Align AOI’s with administrative boundaries to facilitate integration with other data (e.g. risk analysis)
Regular new acquisition of EO data to keep the Urban Map up-to-date and detect changes.
Acquire new stereo pair EO to produce Building height map

High quality measurement & Cost efficiency
Retrospective analysis
Up to date information
Large coverage
Extensive number of measurement points (in space) compared to other methods (close to 1M with ALOS).
Cost efficient, especially for large surfaces as no in-situ activities required
Sub-mm yearly rates, mm vertical accuracy, 2 m horizontal accuracy
Archive data available for historical ground motion analysis
Terrain deformation assessed over 14 years
Ground motion monitoring based on the latest ALOS archive (up to beginning 2011).
Large area monitoring compared to in-situ methods
Terrain deformation assessed over the ERS, ASAR and ALOS frames
Advantages / Constraints & Recommendations Historical Mapping of Terrain Deformation
Slight motion in Yogyakarta City cannot be assessed with
ALOS data
However some limitations...
Advantages / Constraints & Recommendations Historical Mapping of Terrain Deformation
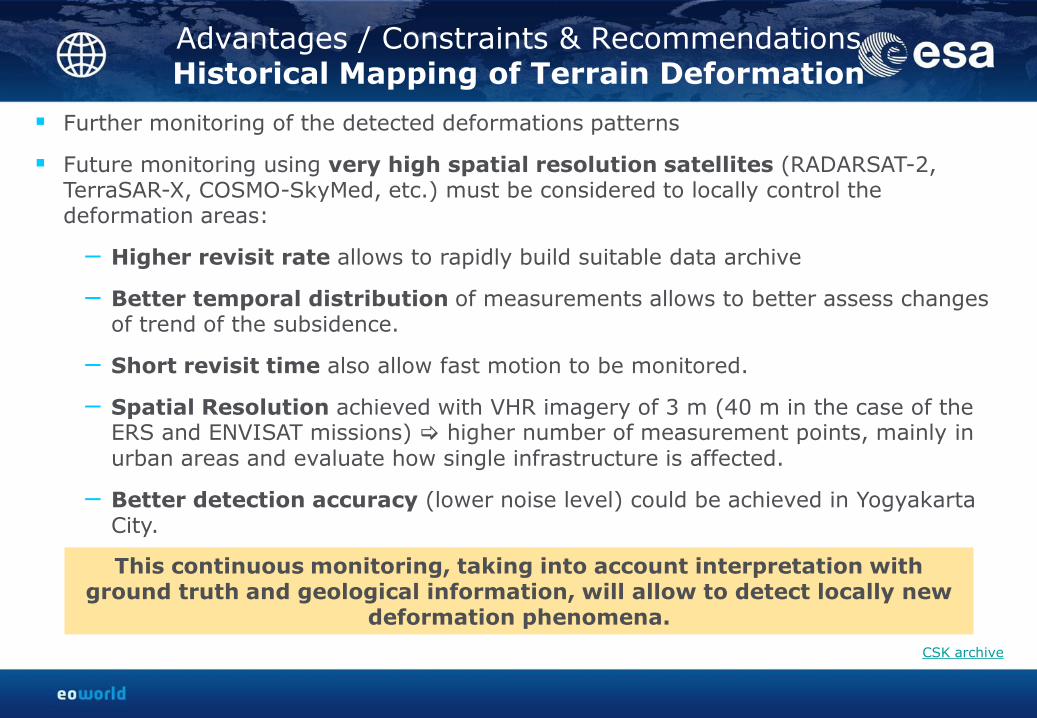
Further monitoring of the detected deformations patterns
Future monitoring using very high spatial resolution satellites (RADARSAT-2, TerraSAR-X, COSMO-SkyMed, etc.) must be considered to locally control the deformation areas:
− Higher revisit rate allows to rapidly build suitable data archive
− Better temporal distribution of measurements allows to better assess changes of trend of the subsidence.
− Short revisit time also allow fast motion to be monitored.
− Spatial Resolution achieved with VHR imagery of 3 m (40 m in the case of the ERS and ENVISAT missions) higher number of measurement points, mainly in urban areas and evaluate how single infrastructure is affected.
− Better detection accuracy (lower noise level) could be achieved in Yogyakarta City.
This continuous monitoring, taking into account interpretation with ground truth and geological information, will allow to detect locally new
deformation phenomena.
CSK archive

No DTM could be generated due to the lack of a suitable stereo data. Recommendations for service improvement would be:
− Acquire new EO stereo pairs
− Work with high resolution stereo couple data (e.g. 1m (Ikonos) or higher resolution)
− More than 1 stereo couple (different angles)
− Increased quality of images (radiometric, cloud free, etc.)
− Better ground control (planimetric and altimetric points)
Advantages / Constraints & Recommendations Precise Digital Elevation Model
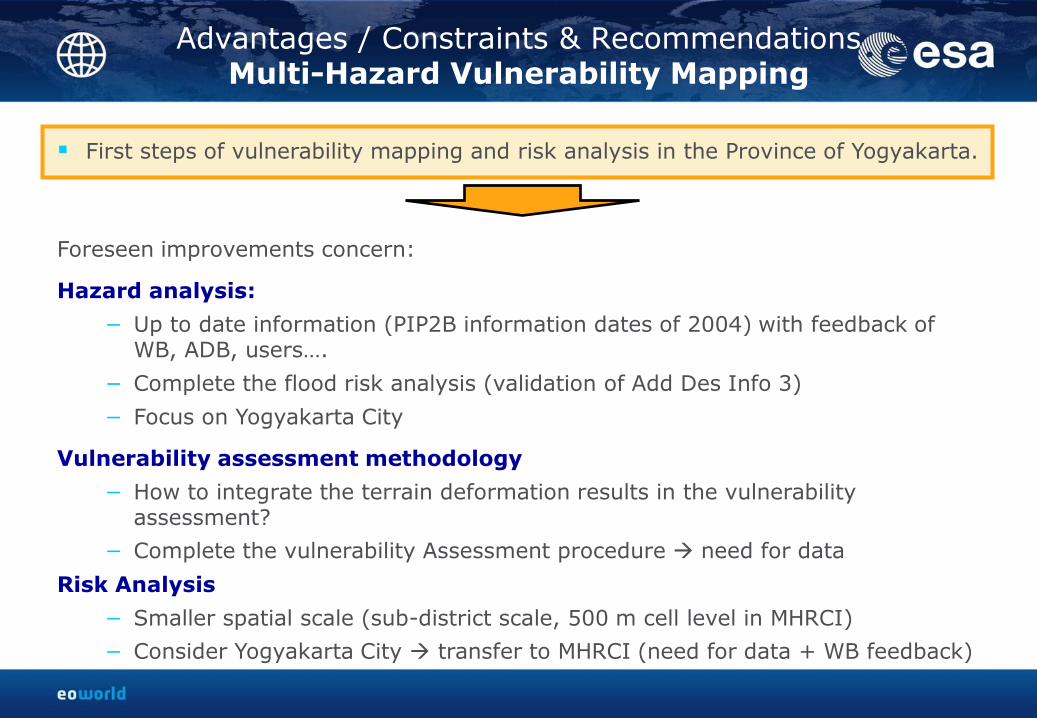
Advantages / Constraints & Recommendations Multi-Hazard Vulnerability Mapping
First steps of vulnerability mapping and risk analysis in the Province of Yogyakarta.
Foreseen improvements concern:
Hazard analysis:
− Up to date information (PIP2B information dates of 2004) with feedback of WB, ADB, users….
− Complete the flood risk analysis (validation of Add Des Info 3)
− Focus on Yogyakarta City
Vulnerability assessment methodology
− How to integrate the terrain deformation results in the vulnerability assessment?
− Complete the vulnerability Assessment procedure need for data
Risk Analysis
− Smaller spatial scale (sub-district scale, 500 m cell level in MHRCI)
− Consider Yogyakarta City transfer to MHRCI (need for data + WB feedback)
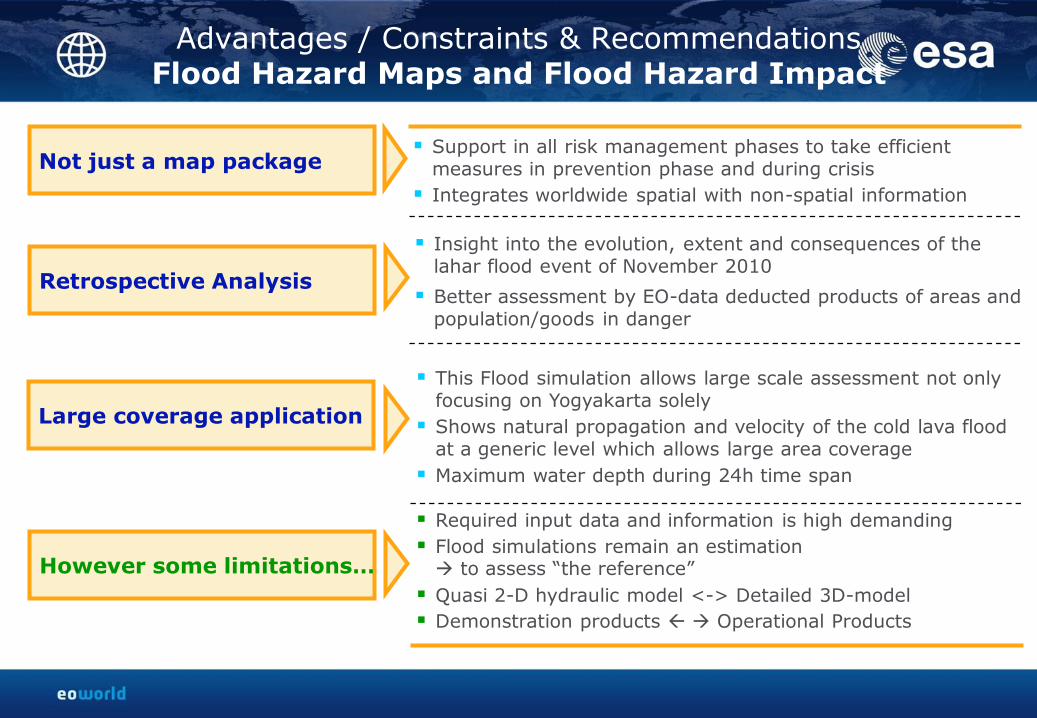
Retrospective Analysis
Large coverage application
Not just a map package
Insight into the evolution, extent and consequences of the lahar flood event of November 2010
Better assessment by EO-data deducted products of areas and population/goods in danger
This Flood simulation allows large scale assessment not only focusing on Yogyakarta solely
Shows natural propagation and velocity of the cold lava flood at a generic level which allows large area coverage
Maximum water depth during 24h time span
Support in all risk management phases to take efficient measures in prevention phase and during crisis
Integrates worldwide spatial with non-spatial information
However some limitations…
Required input data and information is high demanding
Flood simulations remain an estimation to assess “the reference”
Quasi 2-D hydraulic model <-> Detailed 3D-model
Demonstration products Operational Products
Advantages / Constraints & Recommendations Flood Hazard Maps and Flood Hazard Impact

Advantages / Constraints & Recommendations Flood Hazard Maps and Flood Hazard Impact
Integration of the map package and GIS data in local flood event database
The hazard simulation can be improved with the use of reference data
Use of the same model for simulation of other scenario’s (more extreme rainfall, smaller eruption, changes of land use,…) which can predict new events in the future
Combination with vulnerability and population data to assess risk and damage to population and goods damage functions and assets maps
Adaptation and customization for correspondence or integration into World Bank requirements

Next step is to assess your feedback and the one of the Users.
Assess to what extent the services responded to the specified user requirements and elaborate any potential improvements
necessary to resolve identified short-comings
Questionnaire with 25 questions to assess feedback in terms of usefulness, availability, reliability and affordability AI_eoworld_HCMC_YOGYA_User_Feedback_v1.0.pdf.
Organization of a follow-on teleconference (in 2-3 weeks) in order to get the most valuable feedback and define together the necessary improvements.
User Feedback Assessment Questionnaire

Date : 21 February 2012
Thank you
Questions & Discussions