Embed Size (px)
Citation preview
E.O. Paton Electric Welding Institute of the National Academy of Sciences of Ukraine
International Scientific-Technical and Production Journal
Published Monthly since 2000English translation of the monthly «Avtomaticheskaya Svarka» (Automatic Welding) journal published in Russian since 1948
EDITORIAL BOARD
Editor-in-Chief B.E. Paton
Scientists of PWI, Kyiv s.I. Kuchuk-Yatsenko (vice-chief ed.),
V.N. Lipodaev (vice-chief ed.), Yu.s. Borisov, G.M. Grigorenko,
A.T. Zelnichenko, V.V. Knysh, I.V. Krivtsun, Yu.N. Lankin,
L.M. Lobanov, V.D. Poznyakov, I.A. Ryabtsev, K.A. Yushchenko
Scientists of Ukrainian Universities V.V. Dmitrik, NTU «KhPI», Kharkov V.V. Kvasnitsky, NTUU «KPl», Kyiv E.P. Chvertko, NTUU «KPl», Kyiv
Foreign Scientists N.P. Alyoshin
N.E. Bauman MSTU, Moscow, Russia Guan Qiao
Beijing Aeronautical Institute, China M. Zinigrad
Ariel University, Israel V.I. Lysak
Volgograd STU, Russia Ya. Pilarczyk
Welding Institute, Gliwice, Poland U. Reisgen
Welding and Joining Institute, Aachen, Germany G.A. Turichin
St. Petersburg SPU, Russia
Founders E.O. Paton Electric Welding Institute, NASU
International Association «Welding»Publisher
International Association «Welding»Translators
A.A. Fomin, O.S. Kurochko, I.N. Kutianova Editor
N.G. Khomenko Electron galley
D.I. Sereda, T.Yu. SnegiryovaAddress
E.O. Paton Electric Welding Institute, International Association «Welding»
11 Kazimir Malevich Str. (former Bozhenko Str.), 03150, Kyiv, Ukraine
Tel.: (38044) 200 60 16, 200 82 77 Fax: (38044) 200 82 77, 200 81 45
E-mail: [email protected] www.patonpublishinghouse.com
State Registration Certificate
KV 4790 of 09.01.2001 ISSN 0957-798X
DOI: http://dx.doi.org/10.15407/tpwj
subscriptions $348, 12 issues per year,
air postage and packaging included. Back issues available.
All rights reserved. This publication and each of the articles contained
herein are protected by copyright. Permission to reproduce material contained in this
journal must be obtained in writing from the Publisher.
© PWI, International Association «Welding», 2018
Issue062018
C O N T E N T S
SCIENTIFIC AND TECHNICAL
Yushchenko K.A., Zadery B.A., Gakh I.S., Zvyagintseva A.V., Kapitanchuk L.M. and Khaskin Yu.V. Evolution of structure of oxide dispersion strengthened nickel alloys in fusion welding .............................. 2
Marchenko A.E., Trachevsky V.V. and Skorina N.V. Effect of liquid glass composition and structure on the strength of low-hydrogen electrode coatings ....................................................................................................... 9
Soloviov V.G. and Kuskov Yu.M. Influence of technological and electrical parameters of ESS in current-supplying mould on electrode melting rate and base metal penetration .................................................................. 20
Tsybulkin G.A. Algorithm of joint line «tracking» in tandem arc welding ........................................................................................................ 28
INDUSTRIAL
Falchenko Yu.V. and Petrushinets L.V. Modern methods of manufacturing three-layer panels of aluminium alloys (Review) ......................................... 32
Miara D., Matusiak J., Pietras A., Krystian M. and Dyner M. High speed friction welding of titanium alloys — structure and properties of joints ........................................................................................................ 40
NEWS
XII All-Ukrainian Festival of Science ............................................................ 43
2 ISSN 0957-798X THE PATON WELDING JOURNAL, No. 6, 2018
SCIENTIFIC AND TECHNICAL
DOI: http://dx.doi.org/10.15407/tpwj2018.06.01
Evolution of structurE of oxidE dispErsion strEngthEnEd nickEl alloys
in fusion wEldingk.a. yushchEnko, B.a. ZadEry, i.s. gakh,
a.v. ZvyagintsEva, l.M. kapitanchuk and yu.v. khaskinE.O. Paton Electric Welding Institute of the NAS of Ukraine
11 Kazimir Malevich Str., 03150, Kyiv, Ukraine. E-mail: [email protected]
Changes of nanodispersed structure of nickel ODS-alloys as a result of fusion welding were considered. Welded joints, produced at different modes of argonarc, electron beam and laser welding were investigated. It is shown that degra-dation of nanosized structure takes place in all considered cases. It is expressed mainly in change of strengthening particles up to microsized level, some variation of their chemical composition and morphology. A level of structure degradation depends on a level of overheating of weld pool metal, which in turn, is determined by value of specific power of heat source, welding rate, heat input and cooling nature. It is shown that the positive result, i.e minimum degradation of initial metal nanostructure, can be reached at optimum combination of the maximum technologically acceptable welding rate and heat input concentration, minimum margin and controlled distribution of power, which provide through penetration and formation of weld with parallel fusion surfaces. 19 Ref., 9 Figures.
K e y w o r d s : ODS-nickel alloys, fusion welding, weld pool, degradation of nanodispersed structure, particle coars-ening, welding rate, heat input nature, weld formation
Oxide dispersion strengthened nickel alloys and steels due to combination of unique properties exceeding characteristics of the materials strengthened by micron size particles [1–9] recently find more and more appli-cation as alternative structural material in perspective developments of nuclear mechanical engineering, aerospace equipment, energy generating branches, including renewable power sources, high-temperature heat exchangers, engine construction etc. [2, 10–13].
The main problem that should be solved for re-alizing the properties of these materials in industrial structures is to guarantee nanodimension structure during the whole process chain of their manufacture. The main characteristics of such a structure is size of the strengthening particles, their morphology, compo-sition, uniformity of distribution in matrix.
The particular difficulty for performance of this task during welding lies in high-temperature heating of metal, nonequilibrium of thermal, hydrodynamic, thermal deformation, solidification and other process-es accompanying formation of welded joint.
Probably, the maximum preservation of the pa-rameters of ODS-alloy nanostructure in their welding is possible with using the methods eliminating or min-imizing metal overheating above dissociation or melt-ing temperature as well as oxide coagulation during joint formation. These are diffusion, friction, friction stir and other welding methods. However, they have
limitations in their realizing, it is technical impossibil-ity of welding of structures with complex developed geometry, application of the methods under condi-tions of special production or repair, not proved tech-nology and equipment. And even growing in popular-ity in the recent time friction stir welding method does not always allow getting quality joint and keep initial structure [14–17]. Therefore, today it is a still relevant task to weld ODS-alloys using the methods of wide commercial application, namely argonarc (ArAW), laser (LW), electron beam (EBW).
Present work was carried out using single-phase nickel alloy Inconel MA758 (Ni–31Cr–1.0Fe–0.5Ti–0.3Al–0.6Y2O3) as a model one. Such a choice was caused by the need to eliminate negative effect of phase transformations on nanostructure formation. The welded samples of 1.5–2.0 mm thickness were cut by spark method from a rod produced by mechan-ical alloying method. The cut places were polished, the samples were rinsed by acetone in ultrasonic pool.
Welding experiments were carried out using the methods mentioned above.
Welding rate was the main parameter used for reg-ulation of heat input in weld metal. It allowed taking into account efficiency and mobility of impact as well as quality effect similarity on nature of heat input and weld pool hydrodynamics at different fusion welding methods. During the experiments the welding rate was
© K.A. YUSHCHENKO, B.A. ZADERY, I.S. GAKH, A.V. ZVYAGINTSEVA, L.M. KAPITANCHUK and Yu.V. KHASKIN, 2018
3ISSN 0957-798X THE PATON WELDING JOURNAL, No. 6, 2018
SCIENTIFIC AND TECHNICAL
varied in a wide range of values from 12 to 180 m/h. The values of other mode parameters were selected based on the need of achievement of through pene-tration and quality formation of the weld. It should be underlined that a significant difference of ther-mophysical characteristics of oxides and base metal (such as specific weight, melting temperature, oxides’ wetting, etc.) considerably complicates quality forma-tion of the welds. It is shown by undercuts, spattering, blowing-out and splashes of metal, floating of oxides, appearance of porosity and other defects.
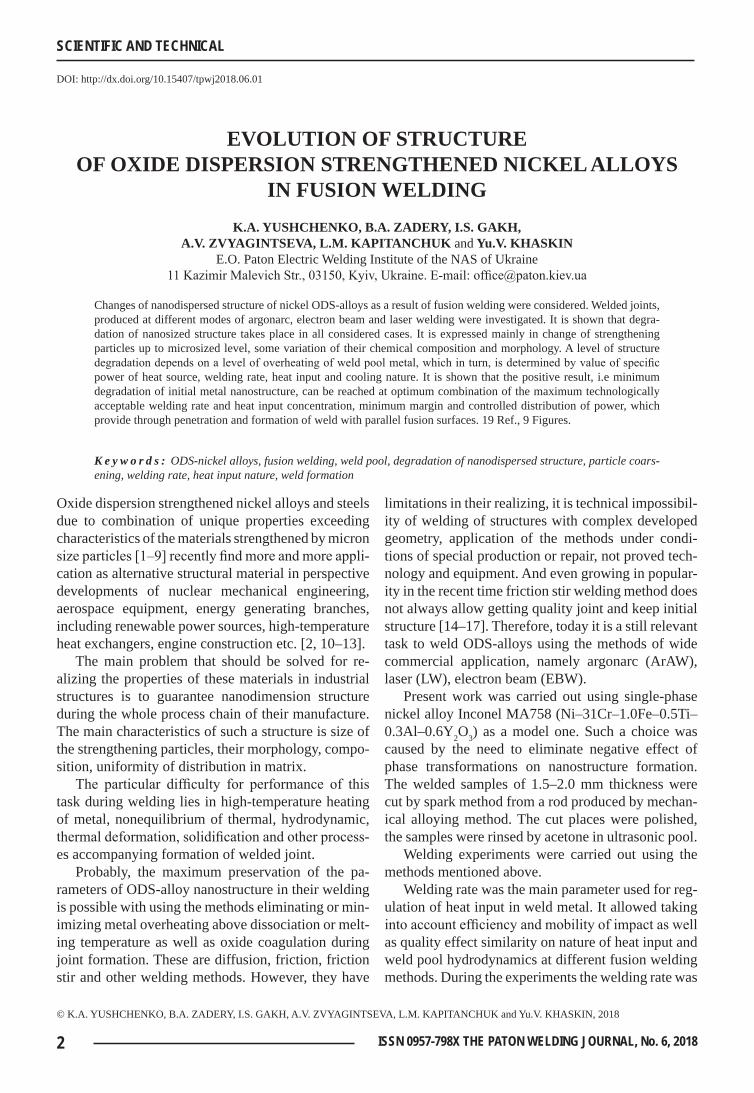
This is particularly obvious in welding at low rates. Weld metal, produced at 10–20 m/h rates, dif-fers by insufficient mixing, structural and chemical inhomogeneity, considerable coarsening and loss of nanosized oxides (Figure 1).
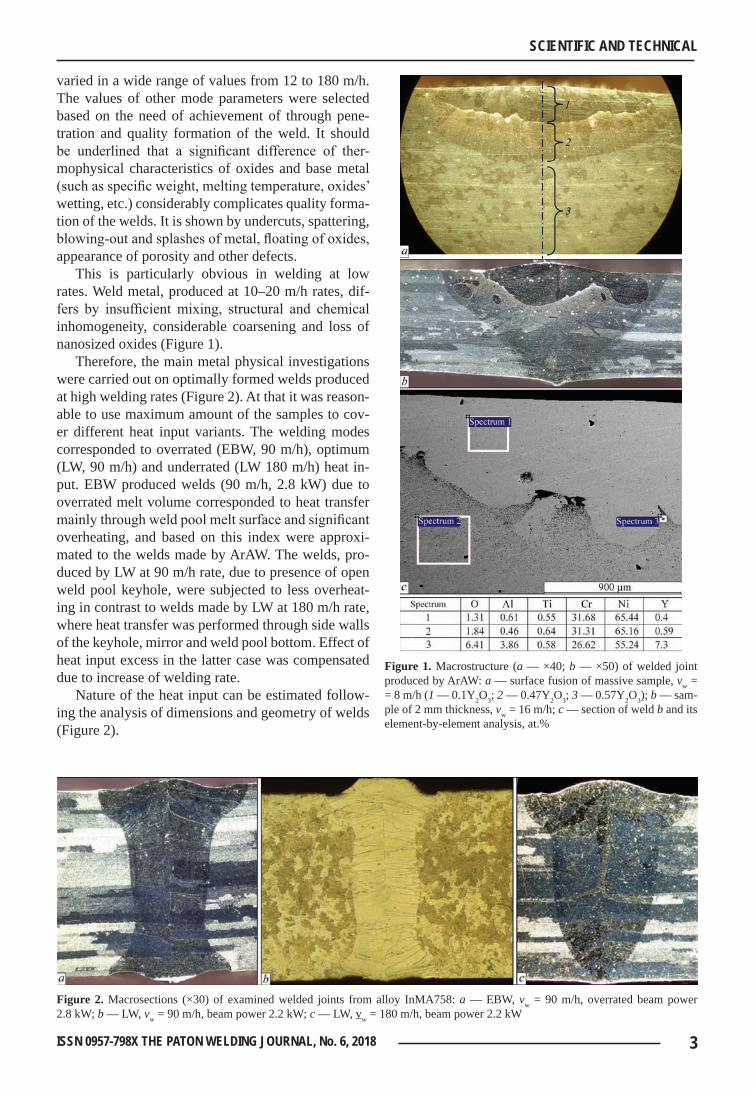
Therefore, the main metal physical investigations were carried out on optimally formed welds produced at high welding rates (Figure 2). At that it was reason-able to use maximum amount of the samples to cov-er different heat input variants. The welding modes corresponded to overrated (EBW, 90 m/h), optimum (LW, 90 m/h) and underrated (LW 180 m/h) heat in-put. EBW produced welds (90 m/h, 2.8 kW) due to overrated melt volume corresponded to heat transfer mainly through weld pool melt surface and significant overheating, and based on this index were approxi-mated to the welds made by ArAW. The welds, pro-duced by LW at 90 m/h rate, due to presence of open weld pool keyhole, were subjected to less overheat-ing in contrast to welds made by LW at 180 m/h rate, where heat transfer was performed through side walls of the keyhole, mirror and weld pool bottom. Effect of heat input excess in the latter case was compensated due to increase of welding rate.
Nature of the heat input can be estimated follow-ing the analysis of dimensions and geometry of welds (Figure 2).
figure 1. Macrostructure (a — ×40; b — ×50) of welded joint produced by ArAW: a — surface fusion of massive sample, vw = = 8 m/h (1 — 0.1Y2O3; 2 — 0.47Y2O3; 3 — 0.57Y2O3); b — sam-ple of 2 mm thickness, vw = 16 m/h; c — section of weld b and its element-by-element analysis, at.%
figure 2. Macrosections (×30) of examined welded joints from alloy InMA758: a — EBW, vw = 90 m/h, overrated beam power 2.8 kW; b — LW, vw = 90 m/h, beam power 2.2 kW; c — LW, vw = 180 m/h, beam power 2.2 kW
4 ISSN 0957-798X THE PATON WELDING JOURNAL, No. 6, 2018
SCIENTIFIC AND TECHNICAL
Presence, size, distribution in weld metal, change of morphology and composition of strengthening nanoparticles were determined using Auger mi-
croprobe JAMP-9500F of JEOL Company (Japan) equipped with energy-dispersion X-ray spectrometer INCAP Penta FETX3 (INCA 350 system) of Oxford Instruments Company (Great Britain). At that the par-ticles of minimum size up to 10 nm were determined.
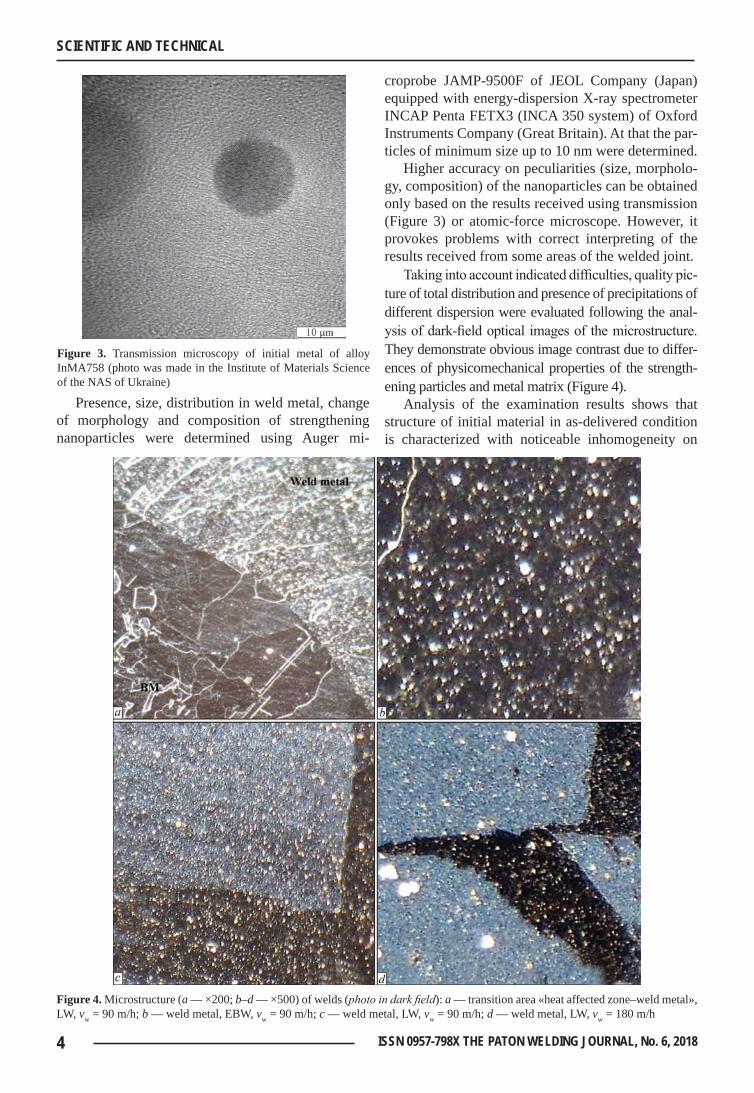
Higher accuracy on peculiarities (size, morpholo-gy, composition) of the nanoparticles can be obtained only based on the results received using transmission (Figure 3) or atomic-force microscope. However, it provokes problems with correct interpreting of the results received from some areas of the welded joint.
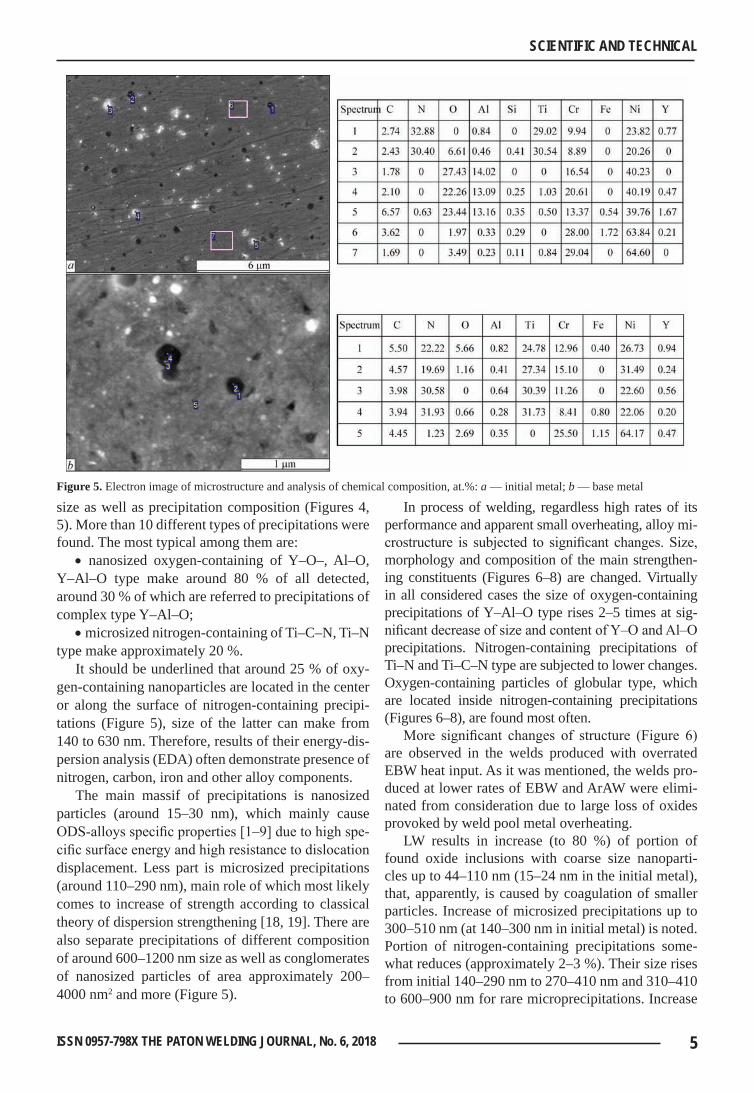
Taking into account indicated difficulties, quality pic-ture of total distribution and presence of precipitations of different dispersion were evaluated following the anal-ysis of dark-field optical images of the microstructure. They demonstrate obvious image contrast due to differ-ences of physicomechanical properties of the strength-ening particles and metal matrix (Figure 4).
Analysis of the examination results shows that structure of initial material in as-delivered condition is characterized with noticeable inhomogeneity on
figure 3. Transmission microscopy of initial metal of alloy InMA758 (photo was made in the Institute of Materials Science of the NAS of Ukraine)
figure 4. Microstructure (a — ×200; b–d — ×500) of welds (photo in dark field): a — transition area «heat affected zone–weld metal», LW, vw = 90 m/h; b — weld metal, EBW, vw = 90 m/h; c — weld metal, LW, vw = 90 m/h; d — weld metal, LW, vw = 180 m/h
5ISSN 0957-798X THE PATON WELDING JOURNAL, No. 6, 2018
SCIENTIFIC AND TECHNICAL
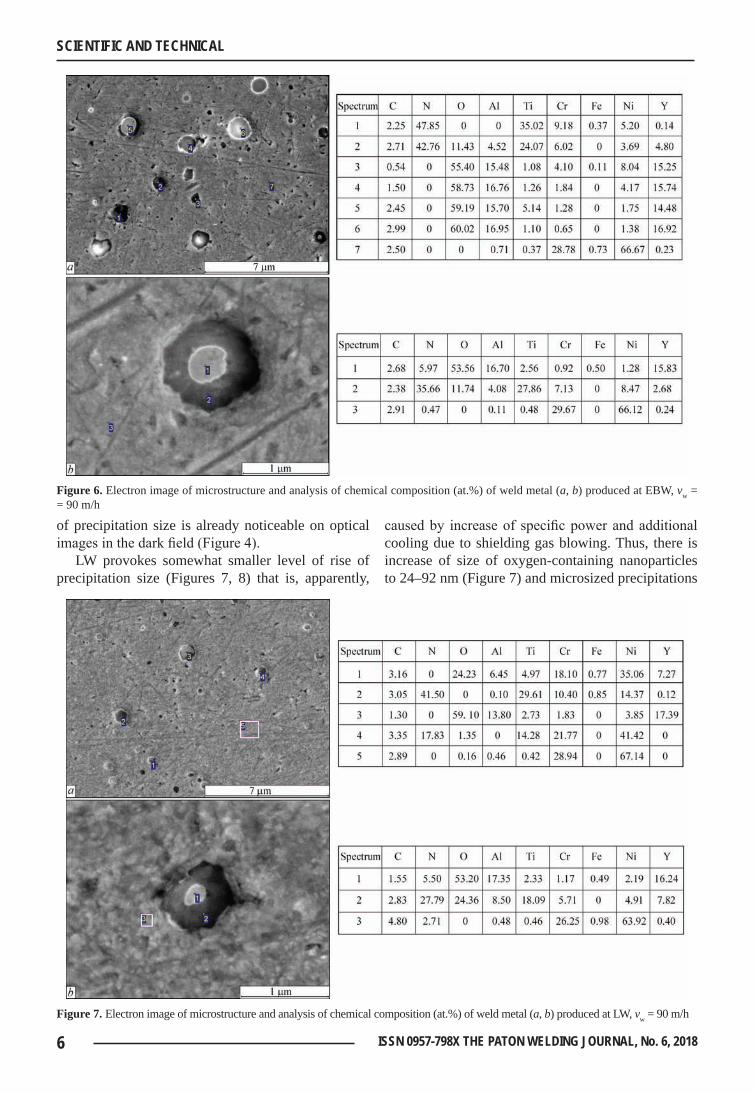
size as well as precipitation composition (Figures 4, 5). More than 10 different types of precipitations were found. The most typical among them are:
• nanosized oxygen-containing of Y–O–, Al–O, Y–Al–O type make around 80 % of all detected, around 30 % of which are referred to precipitations of complex type Y–Al–O;
• microsized nitrogen-containing of Ti–C–N, Ti–N type make approximately 20 %.
It should be underlined that around 25 % of oxy-gen-containing nanoparticles are located in the center or along the surface of nitrogen-containing precipi-tations (Figure 5), size of the latter can make from 140 to 630 nm. Therefore, results of their energy-dis-persion analysis (EDA) often demonstrate presence of nitrogen, carbon, iron and other alloy components.
The main massif of precipitations is nanosized particles (around 15–30 nm), which mainly cause ODS-alloys specific properties [1–9] due to high spe-cific surface energy and high resistance to dislocation displacement. Less part is microsized precipitations (around 110–290 nm), main role of which most likely comes to increase of strength according to classical theory of dispersion strengthening [18, 19]. There are also separate precipitations of different composition of around 600–1200 nm size as well as conglomerates of nanosized particles of area approximately 200–4000 nm2 and more (Figure 5).
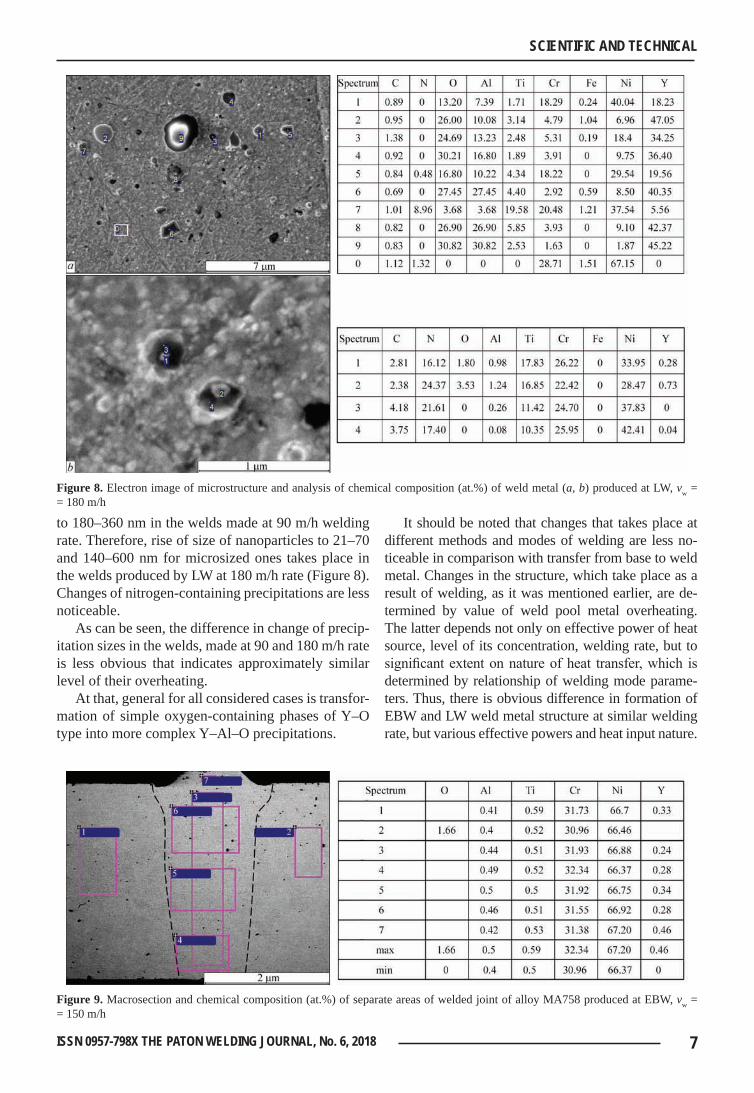
In process of welding, regardless high rates of its performance and apparent small overheating, alloy mi-crostructure is subjected to significant changes. Size, morphology and composition of the main strengthen-ing constituents (Figures 6–8) are changed. Virtually in all considered cases the size of oxygen-containing precipitations of Y–Al–O type rises 2–5 times at sig-nificant decrease of size and content of Y–O and Al–O precipitations. Nitrogen-containing precipitations of Ti–N and Ti–C–N type are subjected to lower changes. Oxygen-containing particles of globular type, which are located inside nitrogen-containing precipitations (Figures 6–8), are found most often.
More significant changes of structure (Figure 6) are observed in the welds produced with overrated EBW heat input. As it was mentioned, the welds pro-duced at lower rates of EBW and ArAW were elimi-nated from consideration due to large loss of oxides provoked by weld pool metal overheating.
LW results in increase (to 80 %) of portion of found oxide inclusions with coarse size nanoparti-cles up to 44–110 nm (15–24 nm in the initial metal), that, apparently, is caused by coagulation of smaller particles. Increase of microsized precipitations up to 300–510 nm (at 140–300 nm in initial metal) is noted. Portion of nitrogen-containing precipitations some-what reduces (approximately 2–3 %). Their size rises from initial 140–290 nm to 270–410 nm and 310–410 to 600–900 nm for rare microprecipitations. Increase
figure 5. Electron image of microstructure and analysis of chemical composition, at.%: a — initial metal; b — base metal
6 ISSN 0957-798X THE PATON WELDING JOURNAL, No. 6, 2018
SCIENTIFIC AND TECHNICAL
of precipitation size is already noticeable on optical images in the dark field (Figure 4).
LW provokes somewhat smaller level of rise of precipitation size (Figures 7, 8) that is, apparently,
caused by increase of specific power and additional cooling due to shielding gas blowing. Thus, there is increase of size of oxygen-containing nanoparticles to 24–92 nm (Figure 7) and microsized precipitations
figure 6. Electron image of microstructure and analysis of chemical composition (at.%) of weld metal (a, b) produced at EBW, vw = = 90 m/h
figure 7. Electron image of microstructure and analysis of chemical composition (at.%) of weld metal (a, b) produced at LW, vw = 90 m/h
7ISSN 0957-798X THE PATON WELDING JOURNAL, No. 6, 2018
SCIENTIFIC AND TECHNICAL
to 180–360 nm in the welds made at 90 m/h welding rate. Therefore, rise of size of nanoparticles to 21–70 and 140–600 nm for microsized ones takes place in the welds produced by LW at 180 m/h rate (Figure 8). Changes of nitrogen-containing precipitations are less noticeable.
As can be seen, the difference in change of precip-itation sizes in the welds, made at 90 and 180 m/h rate is less obvious that indicates approximately similar level of their overheating.
At that, general for all considered cases is transfor-mation of simple oxygen-containing phases of Y–O type into more complex Y–Al–O precipitations.
It should be noted that changes that takes place at different methods and modes of welding are less no-ticeable in comparison with transfer from base to weld metal. Changes in the structure, which take place as a result of welding, as it was mentioned earlier, are de-termined by value of weld pool metal overheating. The latter depends not only on effective power of heat source, level of its concentration, welding rate, but to significant extent on nature of heat transfer, which is determined by relationship of welding mode parame-ters. Thus, there is obvious difference in formation of EBW and LW weld metal structure at similar welding rate, but various effective powers and heat input nature.
figure 8. Electron image of microstructure and analysis of chemical composition (at.%) of weld metal (a, b) produced at LW, vw = = 180 m/h
figure 9. Macrosection and chemical composition (at.%) of separate areas of welded joint of alloy MA758 produced at EBW, vw = = 150 m/h
8 ISSN 0957-798X THE PATON WELDING JOURNAL, No. 6, 2018
SCIENTIFIC AND TECHNICAL
At the same time, difference of nanodispersion of strengthening particles in the structure of weld metal produced by LW at different rates, but at somewhat different nature of heat input is less noticeable.
It should also be noted that selection of method, technological means and modes of welding determine as well uniformity of particle distribution on weld section. At low welding rate there is loss of signifi-cant portion of nanoparticles by the weld as well as their very nonuniform distribution along its section. In welding at increased rates more uniform distribu-tion of the particles is reached (Figures 6–8), howev-er, in this case there is some rise of their concentration in the weld upper part (Figure 9) due to removal of forming nanoparticles by molten metal flow.
Taking into account examination results it can be concluded that final recommendations on procedure of fusion welding of ODS-alloys can be made after setting a compromise between the conditions of for-mation of acceptable quality welds and limitations of nanostructure degradation as well as in evaluation of mechanical properties change.
conclusions
1. It is determined that nickel ODS-alloy Inconel MA758, produced by mechanical alloying method, is characterized by presence of more than ten types of nanosized (15–100 nm) and microsized (140–610 nm) oxygen- and nitrogen-containing precipitations, no-ticeable chemical and structural inhomogeneity.
2. Presence of oxides in ODS-alloys to significant extent complicates quality formation of welds in fu-sion welding.
3. Obvious degradation of initial nanodispersed structure takes place in welding of ODS-alloys. Com-plete or partial loss of oxide strengthening nanopar-ticles in weld metal, their significant coagulation, change of morphology and chemical composition as well as formation of new phase precipitations is ob-served depending on method, conditions and modes of welding.
4. Level of structure degradation is mainly de-termined by value of weld pool metal overheating, which depends essentially on specific power of heat source, welding rate, nature of heat input and cooling in process of welding.
5. Technologically positive result can be reached due to optimization of heat input in weld pool by
means of increase of welding rate and concentration of heat source power at minimal margin of power and its controlled distribution on weld pool section.
1. Gessinger, G.Kh. (1988) Powder metallurgy of high-tempera-ture alloys. Chelyabinsk, Metallurgiya, Chelyab. Div. [in Rus-sian].
2. Valiev, F.Z., Aleksandrov, I.V. (2007) Volumetric nanostruc-tured metallic materials: Production, structure and proper-ties. Moscow, IKTs Akademkniga [in Russian].
3. Chebryakova, E.V. (2011) Peculiarities of mechanism of strengthening of metal matrices with nanoparticles of refrac-tory compounds. In: Proc. of All-Russian Conf. on Nanomate-rials NANO 2011. Moscow, IMET RAN [in Russian].
4. Gusev, A.I. (1998) Effect of nanostructural state in compact metals and joints. Uspekhi Fiz. Nauk, 168, 29–58 [in Russian].
5. Soni, P.R. (2000) Mechanical alloying: Fundamentals and applications. Cambridge, Cambridge Int. Sci. Publ.
6. He, X.D., Xin, Y., Li, M.W., Sun, Y. (2009) Microstructure and mechanical properties of ODS-Ni-based superalloy foil produced by EB-PVD. J. of Alloys and Compounds, 467(1–2), 347.
7. Gleiter, H. (2000) Nanostructured materials. Basic concepts and microstructure. Acta Mater., 48(1), 1–29.
8. Andrievsky, R.A., Glezer, A.M. (1999) Size effects in nano-crystalline materials. Peculiarities of structure. Fizika Metall-ov i Metallovedenie, 88(1), 50–73 [in Russian].
9. Rebinder, P.A. (1958) Physicochemical mechanics. Moscow [in Russian].
10. Janko, B. (1986) High-temperature alloys for gas turbines and other application. Brussels, D. Ridee.
11. Kondrik, A.I., Kovtun, G.P., Datsenko, O.A. et al. (2008) Modern materials for thermonuclear power engineering. Kharkov, NNTsKhPTI [in Russian].
12. Azerenkov, N.A., Kovtun, G.P., Litovchenko, S.V. (2009) Nanotekhnologies and nanomaterials in nuclear power en-gineering. In: Proc. of Int. Scient. Conf. on Physicochemi-cal Principles of Formation and Modification of Micro- and Nanostructures. FMMN, Zbirnyk Nauk. Prats. Kharkiv, NFTTsMON ta NANU, 2009, 152–157.
13. Kovtun, G.P., Verevkin, A.A. (2010) Nanomaterials: Technol-ogies and materials science (Review). Kharkov, NNTs KhPTI [in Russian].
14. Howard, S.M., Jasthi, DB, K., Arbegast, W.J. et al. (2004) Friction stir welding of MA957 oxide dispersion strengthened ferritic steel. In: Fusion materials semiannual progress report for the period ending. December 31, 55–60.
15. Hemilton, M.L. et al. (2000) Fabrication technology for ODS alloy MA957, PNL-13165.
16. Shinozaki, K et al. (1997) Metallurgical and mechanical prop-erties of ODS alloy MS956 friction welds. Welding J., 76(8), 289–299.
17. Feng, Z., Ren, W. (2006) Initial development in joining of ODS alloys using friction stir welding. Report No. ORNL/GEN4LTR-06-021.
18. Portnoj, K.I., Babich, V.N. (1974) Dispersion-hardened mate-rials. Moscow, Metallurgiya [in Russian].
19. Kelly, A., Nicholson, R. (1966) Dispersion hardening. Mos-cow, Metallurgiya [in Russian].
Received 12.04.2018
9ISSN 0957-798X THE PATON WELDING JOURNAL, No. 6, 2018
SCIENTIFIC AND TECHNICAL
DOI: http://dx.doi.org/10.15407/tpwj2018.06.02
EffEct of liQuid glass coMposition and structurE on thE strEngth
of low-hydrogEn ElEctrodE coatingsa.E. MarchEnko1, v.v. trachEvsky2 and n.v. skorina1
1E.O. Paton Electric Welding Institute of the NAS of Ukraine 11 Kazimir Malevich Str., 03150, Kyiv, Ukraine. E-mail: [email protected]
2Technical Center of the NAS of Ukraine 13 Pokrovskaya Str., 04070, Kyiv, Ukraine. E-mail: [email protected]
The paper presents the results of investigations of the strength of coatings of low-hydrogen electrodes, baked at 200, 300 and 400 °C, depending on the composition of liquid Li-, Na- and K-glasses, as well as their binary mixtures. Inves-tigation results were interpreted from the viewpoint of evolution of silicon-oxygen structure of liquid glasses under the conditions of changing kind and ratio of cations-modifiers, as well as the level of water content, related to the parame-ters of electrode heat treatment. Diagnostics of structural-functional self-organization of silicon-oxygen anions (SOA) in the liquid glass composition was performed with application of the data of nuclear magnetic resonance (NMR). NMR29Si spectrum was used. The generalized results were considered in terms of dominance of polycondensation mechanism. A correlation was established between the values of coating strength and ratio of bridge Q4, Q3, Q2 and non-bridge Q1 connectivities in SOA structure. 8 Ref., 4 Tables, 12 Figures.
K e y w o r d s : arc welding, welding electrodes, manufacturing technology, liquid glass, liquid glass structure, appli-cation of NMR spectroscopy method
Searching for methods to improve the mechanical strength of coatings of low-hydrogen electrodes is an urgent engineering problem:
• violation of the continuity of coatings during their transportation from the manufacturer to the user is the cause for an essential degradation of the quality of electrodes as industrial products;
• spalling and cracks arising in the low-strength coating, cause formation of pores, undercuts and oth-er critical defects in welds, resulting in degradation of their quality and lowering of operational reliability of welded structures;
• low strength of coatings essentially limits the possibilities for improvement of metallurgical charac-teristics of electrodes, such, in particular, as reaching a low and ultra-low content of hydrogen in the depos-ited metal, as well as reaching the specified resistance of the coating to absorption of atmospheric moisture. This can be achieved by deep dehydration of the coat-ing, as well as application of liquid glasses, the dry residue of which is non-hygroscopic, that, in its turn is associated with the need to provide its strength.
In view of the above problems, the levels of re-quirements to coating strength, similar to other quali-ty characteristics of electrode products, cannot be es-tablished. Demand practically continuously tightens these requirements. The scientific base underlying de-velopment of the respective compositions of electrode
coatings and their manufacture technology, should be also improved, accordingly.
Thus, it is necessary to understand the nature of strength of electrode coatings, clarify the causes for its evolution at the change of material composition and dehydration of liquid glass — the coating bind-er — at heat treatment of electrodes, as well as find effective techniques, eliminating manifestation of the above drawback.
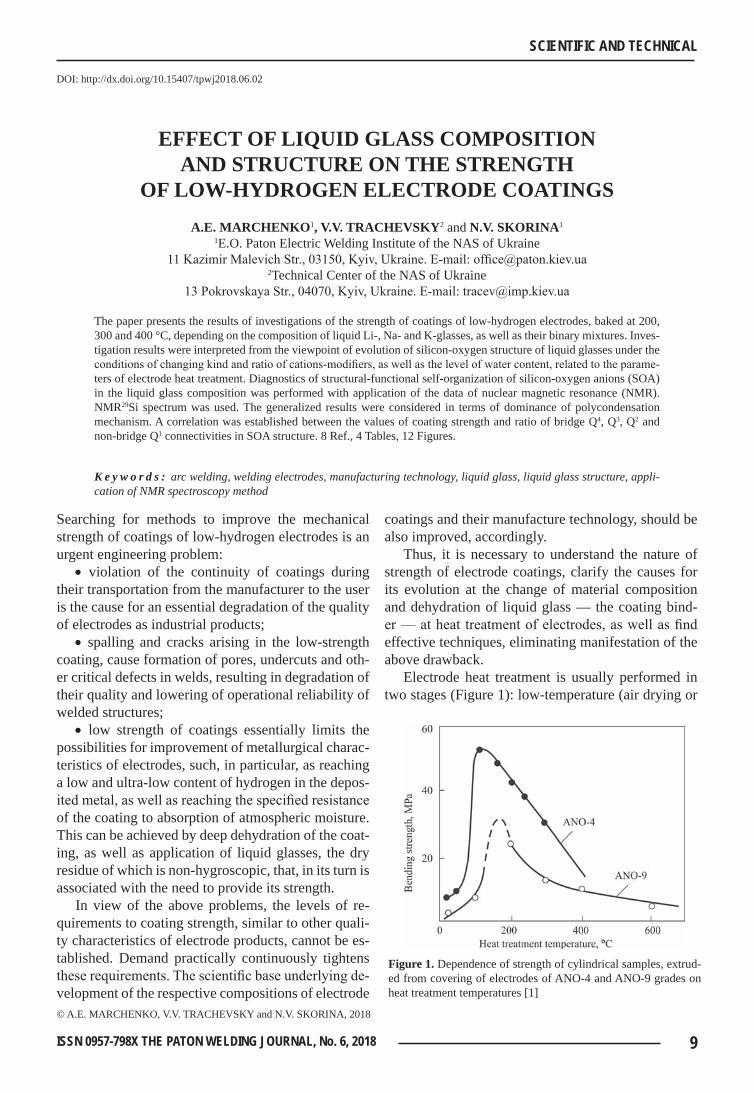
Electrode heat treatment is usually performed in two stages (Figure 1): low-temperature (air drying or
© A.E. MARCHENKO, V.V. TRACHEVSKY and N.V. SKORINA, 2018
figure 1. Dependence of strength of cylindrical samples, extrud-ed from covering of electrodes of ANO-4 and ANO-9 grades on heat treatment temperatures [1]
10 ISSN 0957-798X THE PATON WELDING JOURNAL, No. 6, 2018
SCIENTIFIC AND TECHNICAL
heating of electrodes up to the temperature of 140–160 °C) and high-temperature (heating and soaking at 200 °C for rutile and at 400 °C for low-hydrogen elec-trodes). At the first stage of the process, the coating acquires the specified strength and water resistance. The second stage is introduced with the purpose of achievement of the degree of dehydration, which is required to lower the hydrogen content in the depos-ited metal. However, coating strength at this stage is reduced considerably.
This can be due to dehydration of hydrated forms of silicon-oxygen anions (SOA) in the composition of liquid glass binder, the structure of which determines their binding properties.
The essence of the processes of strength formation proceeding in the coating during the low-temperature stage, can be presented in the case of liquid glass ce-ments — binding compositions of alkaline activation, the hardness of which is determined by molecular dis-tribution of liquid glass components [2]. Formation of silicon-oxygen frame, binding the filler particles into a strong «silicate stone», occurs due to connection of
polymer fragments of different dimensions. At dehy-dration, it is necessary to take into account water, both that initially introduced into the system as a solvent, and appearing at structure formation due to intermo-lecular and interfragment condensation.
Additives in the form of calcium silicate powders are used in classic liquid-glass cements to increase the degree of structuring [3]. Hardening of electrode coverings is promoted by marble powder — coating ingredient, which interacts with liquid glass through the reactions of ion exchange and substitution [4].
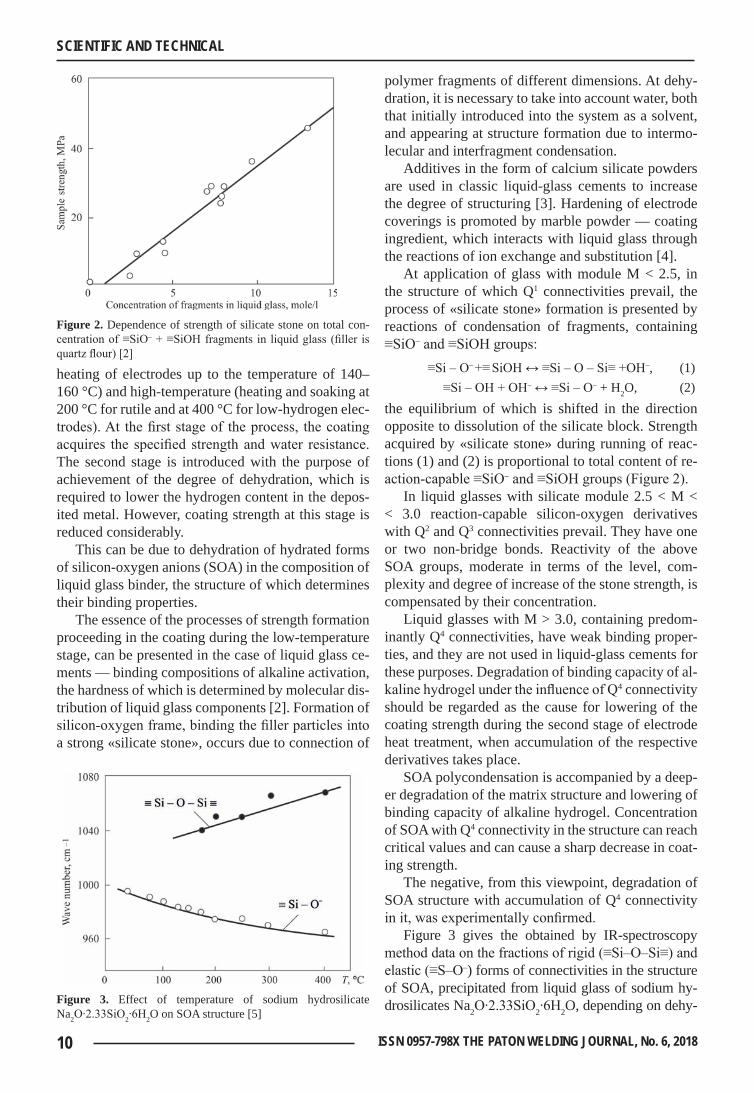
At application of glass with module M < 2.5, in the structure of which Q1 connectivities prevail, the process of «silicate stone» formation is presented by reactions of condensation of fragments, containing ≡SiO– and ≡SiOH groups: ≡Si – O– +≡ SiOH ↔ ≡Si – O – Si≡ +OH–, (1) ≡Si – OH + OH– ↔ ≡Si – O– + H2O, (2)the equilibrium of which is shifted in the direction opposite to dissolution of the silicate block. Strength acquired by «silicate stone» during running of reac-tions (1) and (2) is proportional to total content of re-action-capable ≡SiO– and ≡SiOH groups (Figure 2).
In liquid glasses with silicate module 2.5 < M < < 3.0 reaction-capable silicon-oxygen derivatives with Q2 and Q3 connectivities prevail. They have one or two non-bridge bonds. Reactivity of the above SOA groups, moderate in terms of the level, com-plexity and degree of increase of the stone strength, is compensated by their concentration.
Liquid glasses with M > 3.0, containing predom-inantly Q4 connectivities, have weak binding proper-ties, and they are not used in liquid-glass cements for these purposes. Degradation of binding capacity of al-kaline hydrogel under the influence of Q4 connectivity should be regarded as the cause for lowering of the coating strength during the second stage of electrode heat treatment, when accumulation of the respective derivatives takes place.
SOA polycondensation is accompanied by a deep-er degradation of the matrix structure and lowering of binding capacity of alkaline hydrogel. Concentration of SOA with Q4 connectivity in the structure can reach critical values and can cause a sharp decrease in coat-ing strength.
The negative, from this viewpoint, degradation of SOA structure with accumulation of Q4 connectivity in it, was experimentally confirmed.
Figure 3 gives the obtained by IR-spectroscopy method data on the fractions of rigid (≡Si–O–Si≡) and elastic (≡S–O–) forms of connectivities in the structure of SOA, precipitated from liquid glass of sodium hy-drosilicates Na2O∙2.33SiO2∙6H2O, depending on dehy-
figure 2. Dependence of strength of silicate stone on total con-centration of ≡SiO– + ≡SiOH fragments in liquid glass (filler is quartz flour) [2]
figure 3. Effect of temperature of sodium hydrosilicate Na2O∙2.33SiO2∙6H2O on SOA structure [5]
11ISSN 0957-798X THE PATON WELDING JOURNAL, No. 6, 2018
SCIENTIFIC AND TECHNICAL
dration temperature. One can see that increase of de-hydration temperature is indeed accompanied by SOA polymerization that results in enrichment of their struc-ture by rigid and brittle elements due to reduction of the fraction of elements with elastic bonds in it.
object and procedure of investigations. Coat-ings of test low-hydrogen electrodes, based on mo-no-alkaline (Li, Na, K) and binary (Li, Na-, Li, K- and Na, K-) liquid glasses with different ratio of alkaline components were selected for study. Binary mixtures were prepared by applying mono-alkaline liquid glasses (Table 1). Lithium glasses were synthesized by wet method, and sodium and potassium ones — by autoclave dissolution of silicate lumps of commercial quality.
Material composition, density ρ, viscosity η, prepa-ration methods, as well as the results of studying the features of binary glass structure with application of NMR-spectroscopy on 29Si nuclei are described in [6].
Structure of liquid glasses was presented as a com-bination of the fraction of (Q4, Q3, Q2 and Q1) con-nectivities of different complexity in SOA chains and frame, which was determined by the values of integral intensities of signals of 29Si atom nuclei with charac-teristic values of chemical shifts, measured at room temperature in the spectrometer of AVANSE 400 model of BRUKER Company, Germany [6].
As one can see (Table 1), mono-alkaline Li-, Na-, and K- liquid glasses were used to prepare the cov-erings, designed for assessment of coating strength, with the same consistency as in [6].
Unlike them, binary glasses were preliminarily brought to the level of viscosity of initial mono-alka-line glasses, by dilution by small water additives, with the aim of leveling the synergetic effect. In liquid Li, K-glasses, containing from 16.3 up to 50.0 wt.% of potassium component, the synergetic viscosity surge reached 20800 mPa∙s in the initial condition. There-fore, the degree of their dilution is much greater than that of the other glasses.
Covering with 24 % fraction of liquid glass was prepared in the intensive mixer. Capillary plastometer OB 1435 was used to form from the covering the sam-ples of a cylindrical shape of 4 mm diameter and 40–50 mm length, designed for strength assessment. The consistency of the absolute majority of the coverings allowed producing extrudate of the required quality.
Cracks were found in extrudate billets from four Li, Na-coverings and two Li, K-coverings, differing by a more rigid consistency. In this case, extrudate sam-ples for strength testing were taken from sections not affected by cracks.
After drying in air for one day the cylindrical sam-ples were soaked in the furnace at T = 150 °C, and then were baked for one hour stage-by-stage at the temperature of 200, 300 and 400 °C.
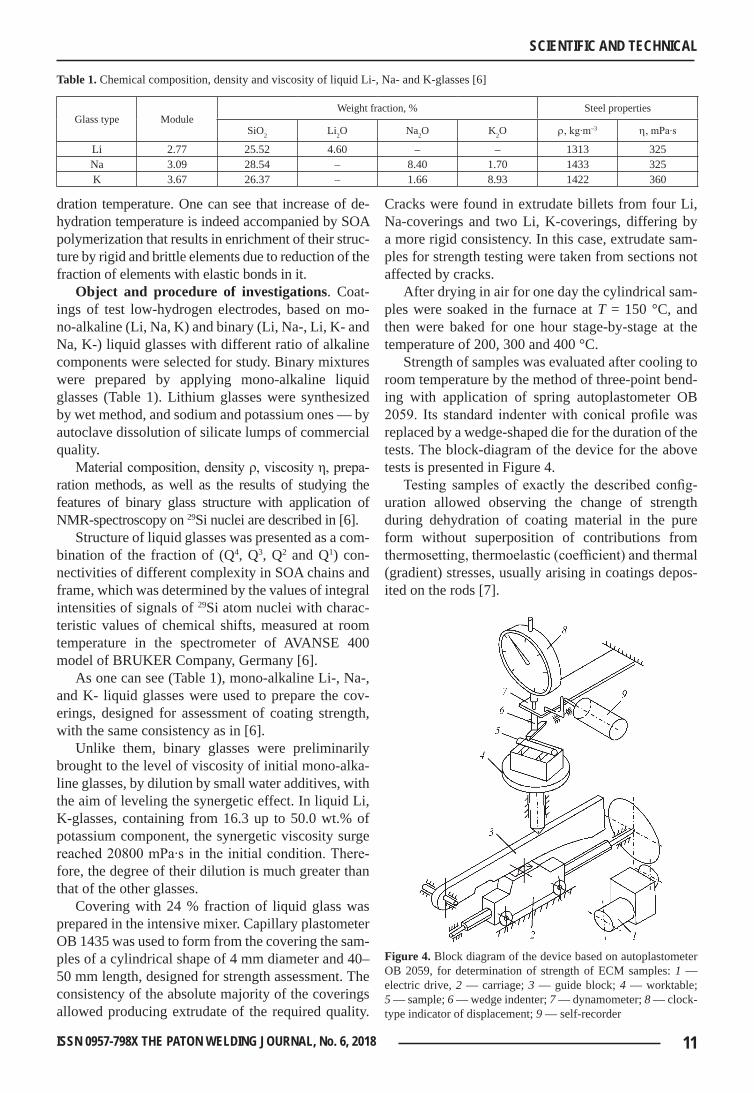
Strength of samples was evaluated after cooling to room temperature by the method of three-point bend-ing with application of spring autoplastometer OB 2059. Its standard indenter with conical profile was replaced by a wedge-shaped die for the duration of the tests. The block-diagram of the device for the above tests is presented in Figure 4.
Testing samples of exactly the described config-uration allowed observing the change of strength during dehydration of coating material in the pure form without superposition of contributions from thermosetting, thermoelastic (coefficient) and thermal (gradient) stresses, usually arising in coatings depos-ited on the rods [7].
table 1. Chemical composition, density and viscosity of liquid Li-, Na- and K-glasses [6]
Glass type ModuleWeight fraction, % Steel properties
SiO2 Li2O Na2O K2O r, kg∙m–3 h, mPa∙s
Li 2.77 25.52 4.60 – – 1313 325Na 3.09 28.54 – 8.40 1.70 1433 325K 3.67 26.37 – 1.66 8.93 1422 360
figure 4. Block diagram of the device based on autoplastometer OB 2059, for determination of strength of ECM samples: 1 — electric drive, 2 — carriage; 3 — guide block; 4 — worktable; 5 — sample; 6 — wedge indenter; 7 — dynamometer; 8 — clock-type indicator of displacement; 9 — self-recorder
12 ISSN 0957-798X THE PATON WELDING JOURNAL, No. 6, 2018
SCIENTIFIC AND TECHNICAL
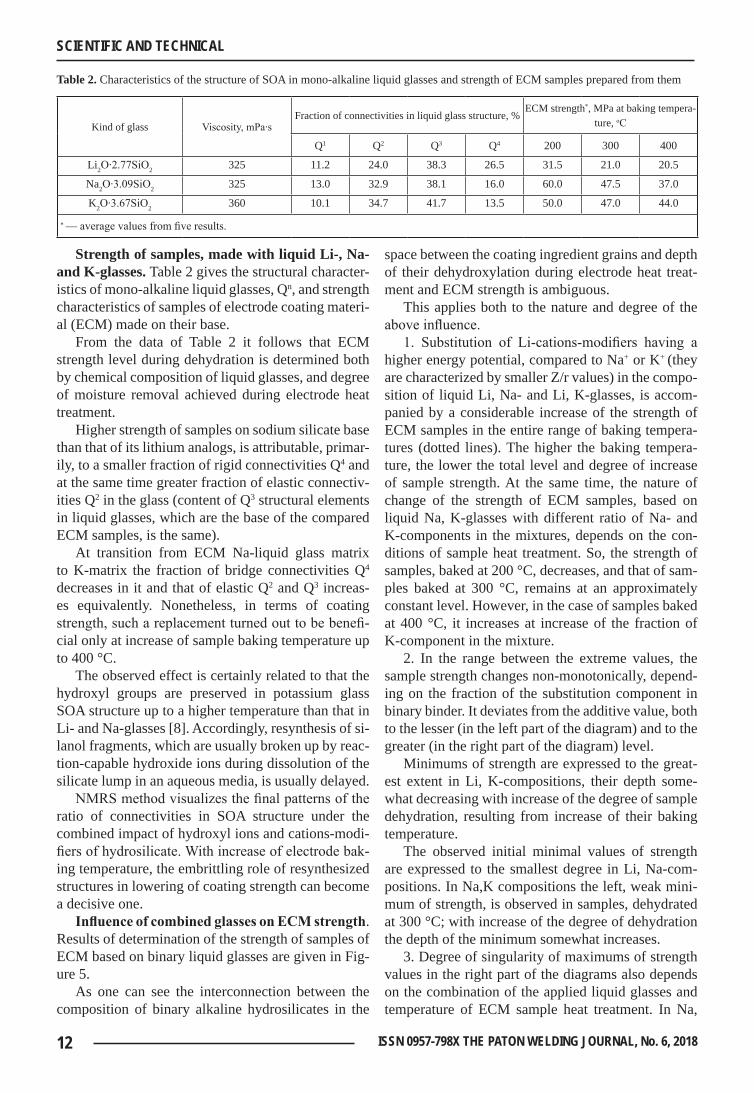
strength of samples, made with liquid li-, na- and k-glasses. Table 2 gives the structural character-istics of mono-alkaline liquid glasses, Qn, and strength characteristics of samples of electrode coating materi-al (ECM) made on their base.
From the data of Table 2 it follows that ECM strength level during dehydration is determined both by chemical composition of liquid glasses, and degree of moisture removal achieved during electrode heat treatment.
Higher strength of samples on sodium silicate base than that of its lithium analogs, is attributable, primar-ily, to a smaller fraction of rigid connectivities Q4 and at the same time greater fraction of elastic connectiv-ities Q2 in the glass (content of Q3 structural elements in liquid glasses, which are the base of the compared ECM samples, is the same).
At transition from ECM Na-liquid glass matrix to K-matrix the fraction of bridge connectivities Q4 decreases in it and that of elastic Q2 and Q3 increas-es equivalently. Nonetheless, in terms of coating strength, such a replacement turned out to be benefi-cial only at increase of sample baking temperature up to 400 °C.
The observed effect is certainly related to that the hydroxyl groups are preserved in potassium glass SOA structure up to a higher temperature than that in Li- and Na-glasses [8]. Accordingly, resynthesis of si-lanol fragments, which are usually broken up by reac-tion-capable hydroxide ions during dissolution of the silicate lump in an aqueous media, is usually delayed.
NMRS method visualizes the final patterns of the ratio of connectivities in SOA structure under the combined impact of hydroxyl ions and cations-modi-fiers of hydrosilicate. With increase of electrode bak-ing temperature, the embrittling role of resynthesized structures in lowering of coating strength can become a decisive one.
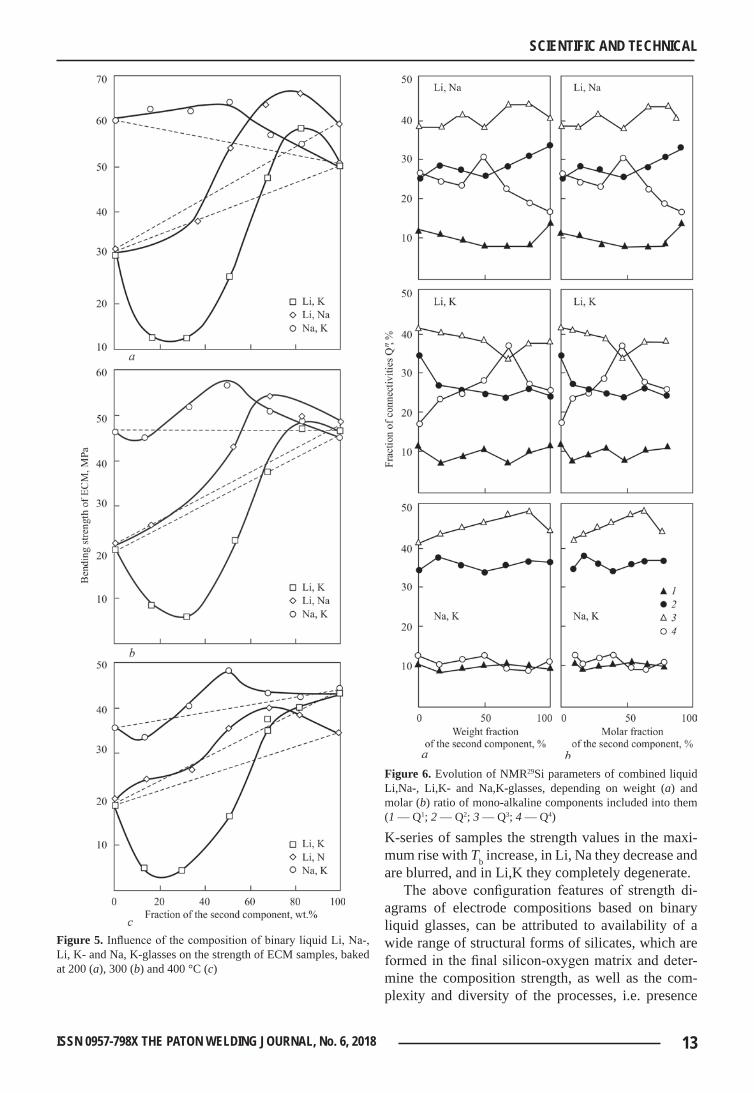
Influence of combined glasses on ECM strength. Results of determination of the strength of samples of ECM based on binary liquid glasses are given in Fig-ure 5.
As one can see the interconnection between the composition of binary alkaline hydrosilicates in the
space between the coating ingredient grains and depth of their dehydroxylation during electrode heat treat-ment and ECM strength is ambiguous.
This applies both to the nature and degree of the above influence.
1. Substitution of Li-cations-modifiers having a higher energy potential, compared to Na+ or K+ (they are characterized by smaller Z/r values) in the compo-sition of liquid Li, Na- and Li, K-glasses, is accom-panied by a considerable increase of the strength of ECM samples in the entire range of baking tempera-tures (dotted lines). The higher the baking tempera-ture, the lower the total level and degree of increase of sample strength. At the same time, the nature of change of the strength of ECM samples, based on liquid Na, K-glasses with different ratio of Na- and K-components in the mixtures, depends on the con-ditions of sample heat treatment. So, the strength of samples, baked at 200 °C, decreases, and that of sam-ples baked at 300 °C, remains at an approximately constant level. However, in the case of samples baked at 400 °C, it increases at increase of the fraction of K-component in the mixture.
2. In the range between the extreme values, the sample strength changes non-monotonically, depend-ing on the fraction of the substitution component in binary binder. It deviates from the additive value, both to the lesser (in the left part of the diagram) and to the greater (in the right part of the diagram) level.
Minimums of strength are expressed to the great-est extent in Li, K-compositions, their depth some-what decreasing with increase of the degree of sample dehydration, resulting from increase of their baking temperature.
The observed initial minimal values of strength are expressed to the smallest degree in Li, Na-com-positions. In Na,K compositions the left, weak mini-mum of strength, is observed in samples, dehydrated at 300 °C; with increase of the degree of dehydration the depth of the minimum somewhat increases.
3. Degree of singularity of maximums of strength values in the right part of the diagrams also depends on the combination of the applied liquid glasses and temperature of ECM sample heat treatment. In Na,
table 2. Characteristics of the structure of SOA in mono-alkaline liquid glasses and strength of ECM samples prepared from them
Kind of glass Viscosity, mPa∙sFraction of connectivities in liquid glass structure, %
ECM strength*, MPa at baking tempera-ture, оС
Q1 Q2 Q3 Q4 200 300 400
Li2O∙2.77SiO2 325 11.2 24.0 38.3 26.5 31.5 21.0 20.5
Na2O∙3.09SiO2 325 13.0 32.9 38.1 16.0 60.0 47.5 37.0
K2O∙3.67SiO2 360 10.1 34.7 41.7 13.5 50.0 47.0 44.0
* — average values from five results.
13ISSN 0957-798X THE PATON WELDING JOURNAL, No. 6, 2018
SCIENTIFIC AND TECHNICAL
K-series of samples the strength values in the maxi-mum rise with Tb increase, in Li, Na they decrease and are blurred, and in Li,K they completely degenerate.
The above configuration features of strength di-agrams of electrode compositions based on binary liquid glasses, can be attributed to availability of a wide range of structural forms of silicates, which are formed in the final silicon-oxygen matrix and deter-mine the composition strength, as well as the com-plexity and diversity of the processes, i.e. presence
figure 5. Influence of the composition of binary liquid Li, Na-, Li, K- and Na, K-glasses on the strength of ECM samples, baked at 200 (a), 300 (b) and 400 °C (c)
figure 6. Evolution of NMR29Si parameters of combined liquid Li,Na-, Li,K- and Na,K-glasses, depending on weight (a) and molar (b) ratio of mono-alkaline components included into them (1 — Q1; 2 — Q2; 3 — Q3; 4 — Q4)
14 ISSN 0957-798X THE PATON WELDING JOURNAL, No. 6, 2018
SCIENTIFIC AND TECHNICAL
of several directions of mutual transformation of the above forms.
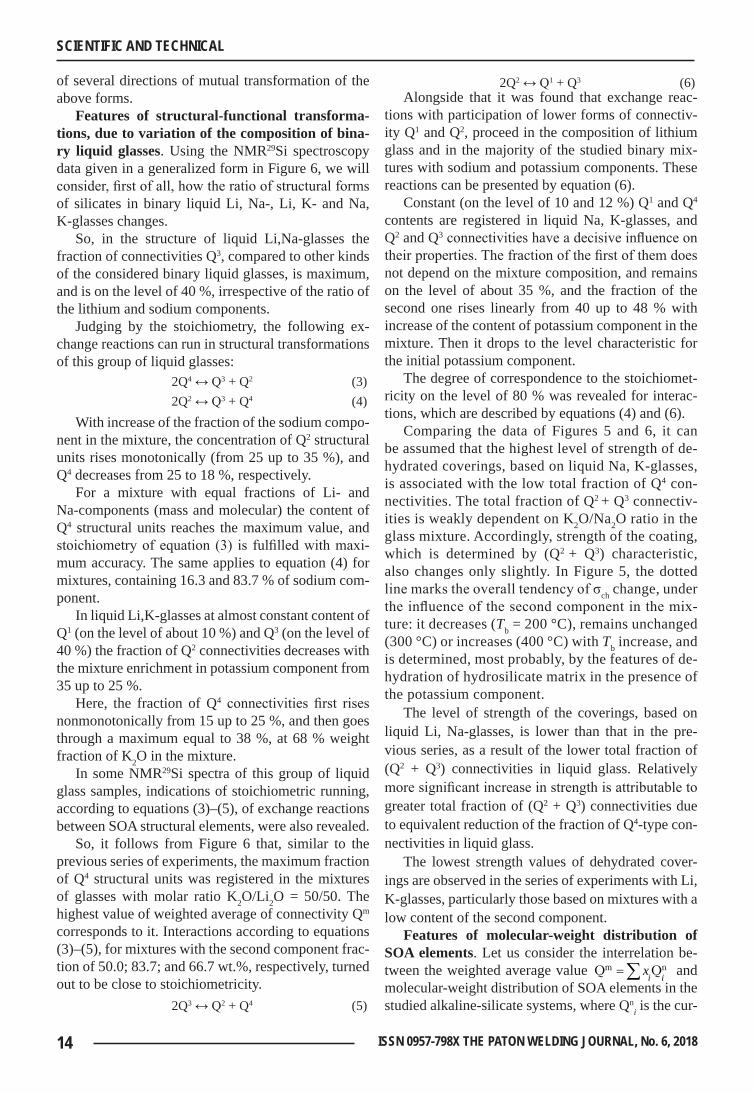
features of structural-functional transforma-tions, due to variation of the composition of bina-ry liquid glasses. Using the NMR29Si spectroscopy data given in a generalized form in Figure 6, we will consider, first of all, how the ratio of structural forms of silicates in binary liquid Li, Na-, Li, K- and Na, K-glasses changes.
So, in the structure of liquid Li,Na-glasses the fraction of connectivities Q3, compared to other kinds of the considered binary liquid glasses, is maximum, and is on the level of 40 %, irrespective of the ratio of the lithium and sodium components.
Judging by the stoichiometry, the following ex-change reactions can run in structural transformations of this group of liquid glasses: 2Q4 ↔ Q3 + Q2 (3) 2Q2 ↔ Q3 + Q4 (4)
With increase of the fraction of the sodium compo-nent in the mixture, the concentration of Q2 structural units rises monotonically (from 25 up to 35 %), and Q4 decreases from 25 to 18 %, respectively.
For a mixture with equal fractions of Li- and Na-components (mass and molecular) the content of Q4 structural units reaches the maximum value, and stoichiometry of equation (3) is fulfilled with maxi-mum accuracy. The same applies to equation (4) for mixtures, containing 16.3 and 83.7 % of sodium com-ponent.
In liquid Li,K-glasses at almost constant content of Q1 (on the level of about 10 %) and Q3 (on the level of 40 %) the fraction of Q2 connectivities decreases with the mixture enrichment in potassium component from 35 up to 25 %.
Here, the fraction of Q4 connectivities first rises nonmonotonically from 15 up to 25 %, and then goes through a maximum equal to 38 %, at 68 % weight fraction of K2O in the mixture.
In some NMR29Si spectra of this group of liquid glass samples, indications of stoichiometric running, according to equations (3)–(5), of exchange reactions between SOA structural elements, were also revealed.
So, it follows from Figure 6 that, similar to the previous series of experiments, the maximum fraction of Q4 structural units was registered in the mixtures of glasses with molar ratio K2O/Li2O = 50/50. The highest value of weighted average of connectivity Qm corresponds to it. Interactions according to equations (3)–(5), for mixtures with the second component frac-tion of 50.0; 83.7; and 66.7 wt.%, respectively, turned out to be close to stoichiometricity. 2Q3 ↔ Q2 + Q4 (5)
2Q2 ↔ Q1 + Q3 (6)Alongside that it was found that exchange reac-
tions with participation of lower forms of connectiv-ity Q1 and Q2, proceed in the composition of lithium glass and in the majority of the studied binary mix-tures with sodium and potassium components. These reactions can be presented by equation (6).
Constant (on the level of 10 and 12 %) Q1 and Q4 contents are registered in liquid Na, K-glasses, and Q2 and Q3 connectivities have a decisive influence on their properties. The fraction of the first of them does not depend on the mixture composition, and remains on the level of about 35 %, and the fraction of the second one rises linearly from 40 up to 48 % with increase of the content of potassium component in the mixture. Then it drops to the level characteristic for the initial potassium component.
The degree of correspondence to the stoichiomet-ricity on the level of 80 % was revealed for interac-tions, which are described by equations (4) and (6).
Comparing the data of Figures 5 and 6, it can be assumed that the highest level of strength of de-hydrated coverings, based on liquid Na, K-glasses, is associated with the low total fraction of Q4 con-nectivities. The total fraction of Q2 + Q3 connectiv-ities is weakly dependent on K2O/Na2O ratio in the glass mixture. Accordingly, strength of the coating, which is determined by (Q2 + Q3) characteristic, also changes only slightly. In Figure 5, the dotted line marks the overall tendency of σch change, under the influence of the second component in the mix-ture: it decreases (Tb = 200 °C), remains unchanged (300 °C) or increases (400 °C) with Tb increase, and is determined, most probably, by the features of de-hydration of hydrosilicate matrix in the presence of the potassium component.
The level of strength of the coverings, based on liquid Li, Na-glasses, is lower than that in the pre-vious series, as a result of the lower total fraction of (Q2 + Q3) connectivities in liquid glass. Relatively more significant increase in strength is attributable to greater total fraction of (Q2 + Q3) connectivities due to equivalent reduction of the fraction of Q4-type con-nectivities in liquid glass.
The lowest strength values of dehydrated cover-ings are observed in the series of experiments with Li, K-glasses, particularly those based on mixtures with a low content of the second component.
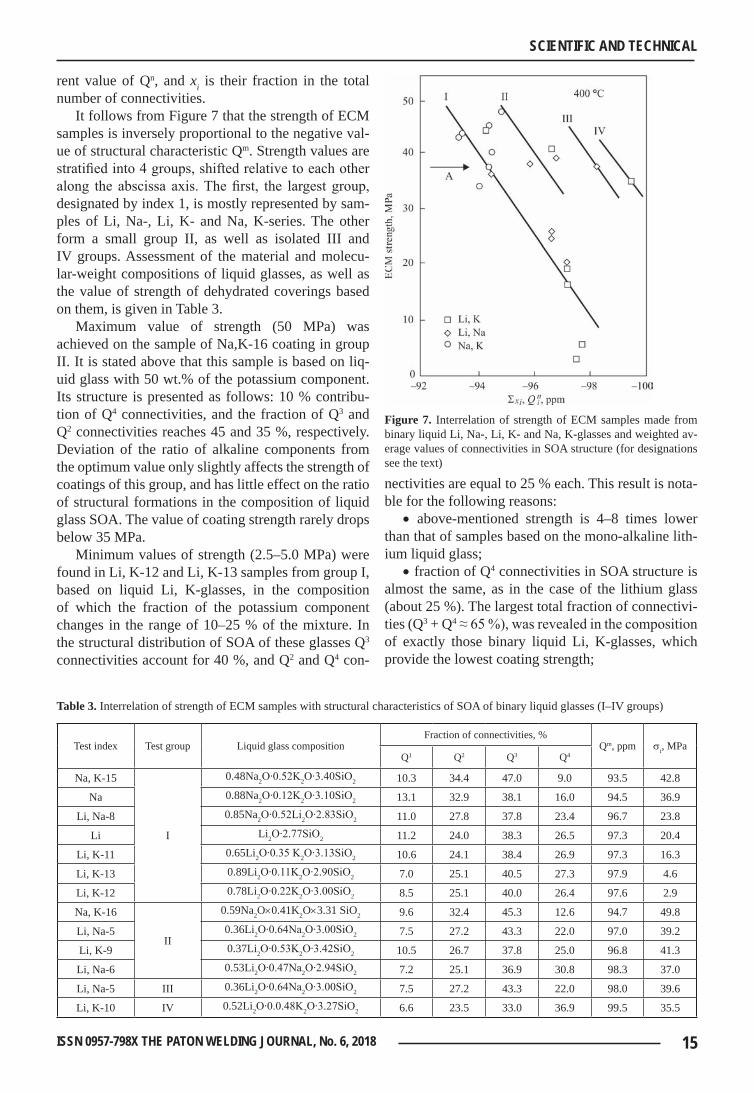
features of molecular-weight distribution of soa elements. Let us consider the interrelation be-tween the weighted average value m nQ Qi ix=∑ and molecular-weight distribution of SOA elements in the studied alkaline-silicate systems, where Qn
i is the cur-
15ISSN 0957-798X THE PATON WELDING JOURNAL, No. 6, 2018
SCIENTIFIC AND TECHNICAL
rent value of Qn, and xi is their fraction in the total number of connectivities.
It follows from Figure 7 that the strength of ECM samples is inversely proportional to the negative val-ue of structural characteristic Qm. Strength values are stratified into 4 groups, shifted relative to each other along the abscissa axis. The first, the largest group, designated by index 1, is mostly represented by sam-ples of Li, Na-, Li, K- and Na, K-series. The other form a small group II, as well as isolated III and IV groups. Assessment of the material and molecu-lar-weight compositions of liquid glasses, as well as the value of strength of dehydrated coverings based on them, is given in Table 3.
Maximum value of strength (50 MPa) was achieved on the sample of Na,K-16 coating in group II. It is stated above that this sample is based on liq-uid glass with 50 wt.% of the potassium component. Its structure is presented as follows: 10 % contribu-tion of Q4 connectivities, and the fraction of Q3 and Q2 connectivities reaches 45 and 35 %, respectively. Deviation of the ratio of alkaline components from the optimum value only slightly affects the strength of coatings of this group, and has little effect on the ratio of structural formations in the composition of liquid glass SOA. The value of coating strength rarely drops below 35 MPa.
Minimum values of strength (2.5–5.0 MPa) were found in Li, K-12 and Li, K-13 samples from group I, based on liquid Li, K-glasses, in the composition of which the fraction of the potassium component changes in the range of 10–25 % of the mixture. In the structural distribution of SOA of these glasses Q3 connectivities account for 40 %, and Q2 and Q4 con-
nectivities are equal to 25 % each. This result is nota-ble for the following reasons:
• above-mentioned strength is 4–8 times lower than that of samples based on the mono-alkaline lith-ium liquid glass;
• fraction of Q4 connectivities in SOA structure is almost the same, as in the case of the lithium glass (about 25 %). The largest total fraction of connectivi-ties (Q3 + Q4 ≈ 65 %), was revealed in the composition of exactly those binary liquid Li, K-glasses, which provide the lowest coating strength;
figure 7. Interrelation of strength of ECM samples made from binary liquid Li, Na-, Li, K- and Na, K-glasses and weighted av-erage values of connectivities in SOA structure (for designations see the text)
table 3. Interrelation of strength of ECM samples with structural characteristics of SOA of binary liquid glasses (I–IV groups)
Test index Test group Liquid glass compositionFraction of connectivities, %
Qm, ppm si, MPaQ1 Q2 Q3 Q4
Na, K-15
I
0.48Na2O∙0.52K2O∙3.40SiO2 10.3 34.4 47.0 9.0 93.5 42.8
Na 0.88Na2O∙0.12K2O∙3.10SiO2 13.1 32.9 38.1 16.0 94.5 36.9
Li, Na-8 0.85Na2O∙0.52Li2O∙2.83SiO2 11.0 27.8 37.8 23.4 96.7 23.8
Li Li2O∙2.77SiO2 11.2 24.0 38.3 26.5 97.3 20.4
Li, K-11 0.65Li2O∙0.35 K2O∙3.13SiO2 10.6 24.1 38.4 26.9 97.3 16.3
Li, K-13 0.89Li2O∙0.11K2O∙2.90SiO2 7.0 25.1 40.5 27.3 97.9 4.6
Li, K-12 0.78Li2O∙0.22K2O∙3.00SiO2 8.5 25.1 40.0 26.4 97.6 2.9
Na, K-16
II
0.59Na2O×0.41K2O×3.31 SiO2 9.6 32.4 45.3 12.6 94.7 49.8
Li, Na-5 0.36Li2O∙0.64Na2O∙3.00SiO2 7.5 27.2 43.3 22.0 97.0 39.2
Li, K-9 0.37Li2O∙0.53K2O∙3.42SiO2 10.5 26.7 37.8 25.0 96.8 41.3
Li, Na-6 0.53Li2O∙0.47Na2O∙2.94SiO2 7.2 25.1 36.9 30.8 98.3 37.0
Li, Na-5 III 0.36Li2O∙0.64Na2O∙3.00SiO2 7.5 27.2 43.3 22.0 98.0 39.6
Li, K-10 IV 0.52Li2O∙0.0.48K2O∙3.27SiO2 6.6 23.5 33.0 36.9 99.5 35.5
16 ISSN 0957-798X THE PATON WELDING JOURNAL, No. 6, 2018
SCIENTIFIC AND TECHNICAL
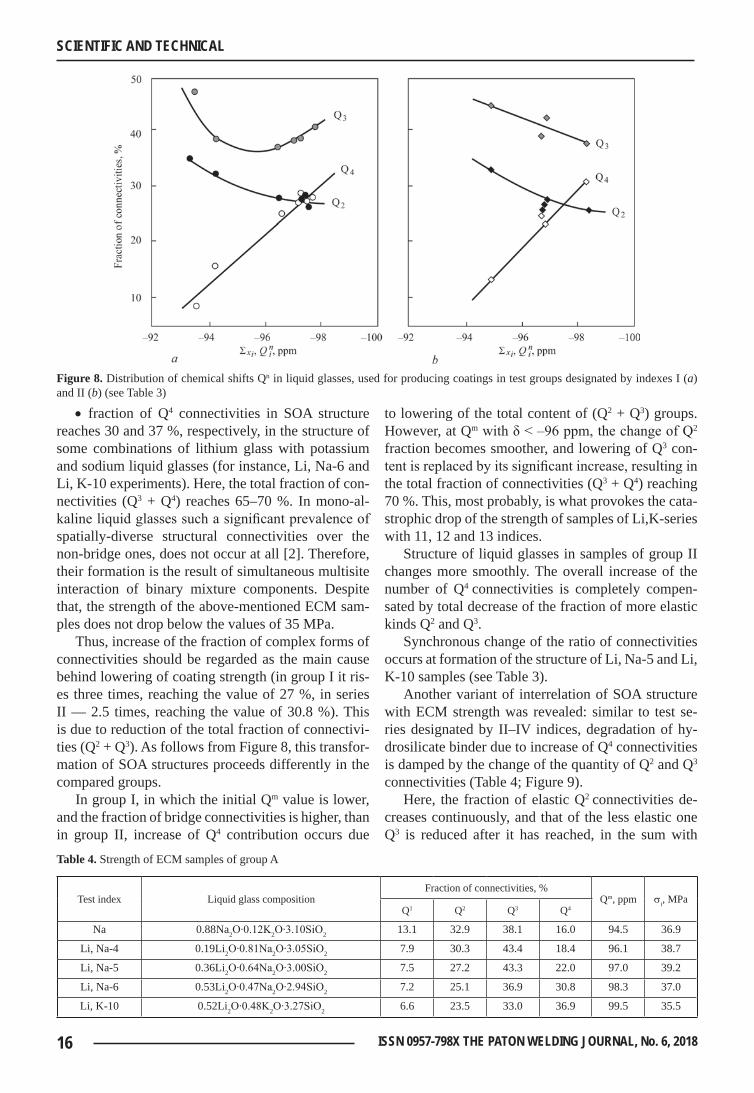
• fraction of Q4 connectivities in SOA structure reaches 30 and 37 %, respectively, in the structure of some combinations of lithium glass with potassium and sodium liquid glasses (for instance, Li, Na-6 and Li, K-10 experiments). Here, the total fraction of con-nectivities (Q3 + Q4) reaches 65–70 %. In mono-al-kaline liquid glasses such a significant prevalence of spatially-diverse structural connectivities over the non-bridge ones, does not occur at all [2]. Therefore, their formation is the result of simultaneous multisite interaction of binary mixture components. Despite that, the strength of the above-mentioned ECM sam-ples does not drop below the values of 35 MPa.
Thus, increase of the fraction of complex forms of connectivities should be regarded as the main cause behind lowering of coating strength (in group I it ris-es three times, reaching the value of 27 %, in series II — 2.5 times, reaching the value of 30.8 %). This is due to reduction of the total fraction of connectivi-ties (Q2 + Q3). As follows from Figure 8, this transfor-mation of SOA structures proceeds differently in the compared groups.
In group I, in which the initial Qm value is lower, and the fraction of bridge connectivities is higher, than in group II, increase of Q4 contribution occurs due
to lowering of the total content of (Q2 + Q3) groups. However, at Qm with δ < –96 ppm, the change of Q2 fraction becomes smoother, and lowering of Q3 con-tent is replaced by its significant increase, resulting in the total fraction of connectivities (Q3 + Q4) reaching 70 %. This, most probably, is what provokes the cata-strophic drop of the strength of samples of Li,K-series with 11, 12 and 13 indices.
Structure of liquid glasses in samples of group II changes more smoothly. The overall increase of the number of Q4 connectivities is completely compen-sated by total decrease of the fraction of more elastic kinds Q2 and Q3.
Synchronous change of the ratio of connectivities occurs at formation of the structure of Li, Na-5 and Li, K-10 samples (see Table 3).
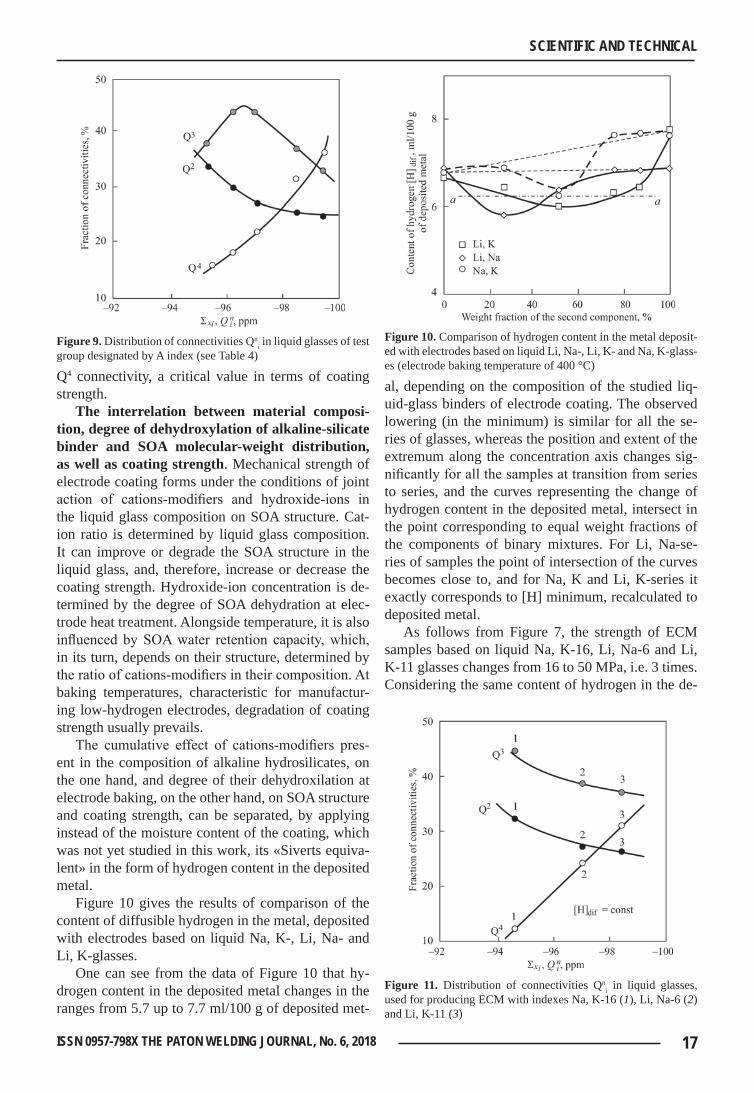
Another variant of interrelation of SOA structure with ECM strength was revealed: similar to test se-ries designated by II–IV indices, degradation of hy-drosilicate binder due to increase of Q4 connectivities is damped by the change of the quantity of Q2 and Q3 connectivities (Table 4; Figure 9).
Here, the fraction of elastic Q2 connectivities de-creases continuously, and that of the less elastic one Q3 is reduced after it has reached, in the sum with
figure 8. Distribution of chemical shifts Qn in liquid glasses, used for producing coatings in test groups designated by indexes I (a) and II (b) (see Table 3)
table 4. Strength of ECM samples of group A
Test index Liquid glass compositionFraction of connectivities, %
Qm, ppm si, MPaQ1 Q2 Q3 Q4
Na 0.88Na2O∙0.12K2O∙3.10SiO2 13.1 32.9 38.1 16.0 94.5 36.9
Li, Na-4 0.19Li2O∙0.81Na2O∙3.05SiO2 7.9 30.3 43.4 18.4 96.1 38.7
Li, Na-5 0.36Li2O∙0.64Na2O∙3.00SiO2 7.5 27.2 43.3 22.0 97.0 39.2
Li, Na-6 0.53Li2O∙0.47Na2O∙2.94SiO2 7.2 25.1 36.9 30.8 98.3 37.0
Li, K-10 0.52Li2O∙0.48K2O∙3.27SiO2 6.6 23.5 33.0 36.9 99.5 35.5
17ISSN 0957-798X THE PATON WELDING JOURNAL, No. 6, 2018
SCIENTIFIC AND TECHNICAL
Q4 connectivity, a critical value in terms of coating strength.
the interrelation between material composi-tion, degree of dehydroxylation of alkaline-silicate binder and soa molecular-weight distribution, as well as coating strength. Mechanical strength of electrode coating forms under the conditions of joint action of cations-modifiers and hydroxide-ions in the liquid glass composition on SOA structure. Cat-ion ratio is determined by liquid glass composition. It can improve or degrade the SOA structure in the liquid glass, and, therefore, increase or decrease the coating strength. Hydroxide-ion concentration is de-termined by the degree of SOA dehydration at elec-trode heat treatment. Alongside temperature, it is also influenced by SOA water retention capacity, which, in its turn, depends on their structure, determined by the ratio of cations-modifiers in their composition. At baking temperatures, characteristic for manufactur-ing low-hydrogen electrodes, degradation of coating strength usually prevails.
The cumulative effect of cations-modifiers pres-ent in the composition of alkaline hydrosilicates, on the one hand, and degree of their dehydroxilation at electrode baking, on the other hand, on SOA structure and coating strength, can be separated, by applying instead of the moisture content of the coating, which was not yet studied in this work, its «Siverts equiva-lent» in the form of hydrogen content in the deposited metal.
Figure 10 gives the results of comparison of the content of diffusible hydrogen in the metal, deposited with electrodes based on liquid Na, K-, Li, Na- and Li, K-glasses.
One can see from the data of Figure 10 that hy-drogen content in the deposited metal changes in the ranges from 5.7 up to 7.7 ml/100 g of deposited met-
al, depending on the composition of the studied liq-uid-glass binders of electrode coating. The observed lowering (in the minimum) is similar for all the se-ries of glasses, whereas the position and extent of the extremum along the concentration axis changes sig-nificantly for all the samples at transition from series to series, and the curves representing the change of hydrogen content in the deposited metal, intersect in the point corresponding to equal weight fractions of the components of binary mixtures. For Li, Na-se-ries of samples the point of intersection of the curves becomes close to, and for Na, K and Li, K-series it exactly corresponds to [H] minimum, recalculated to deposited metal.
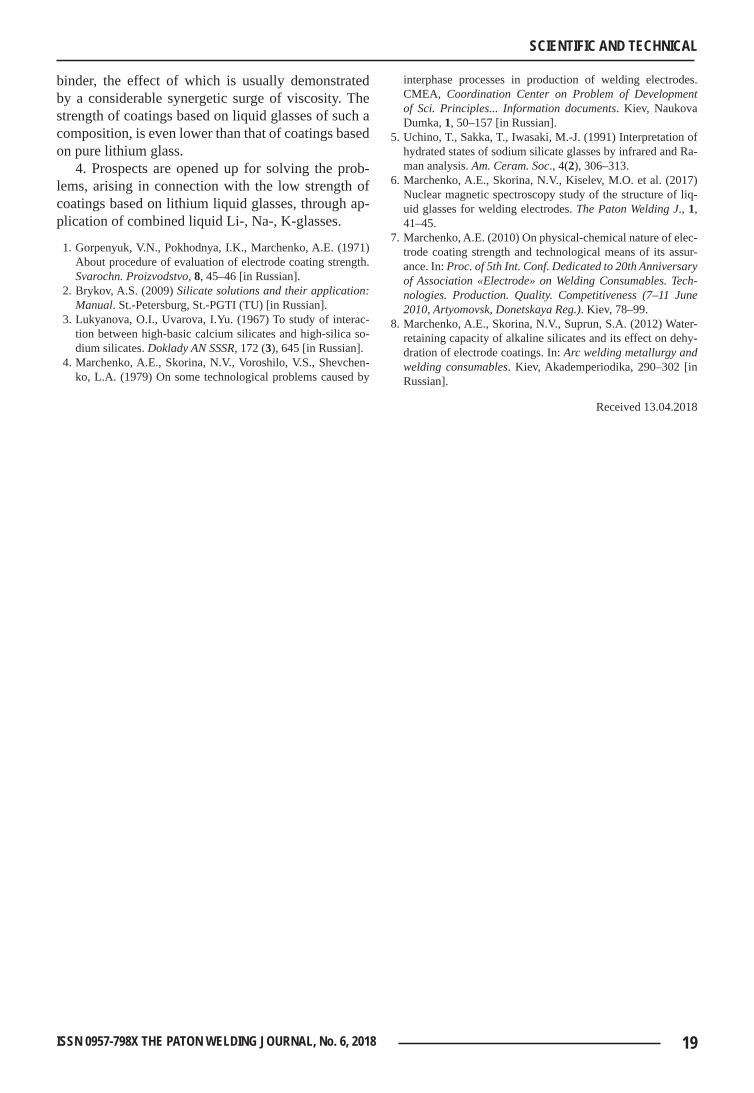
As follows from Figure 7, the strength of ECM samples based on liquid Na, K-16, Li, Na-6 and Li, K-11 glasses changes from 16 to 50 MPa, i.e. 3 times. Considering the same content of hydrogen in the de-
figure 9. Distribution of connectivities Qni in liquid glasses of test
group designated by A index (see Table 4)figure 10. Comparison of hydrogen content in the metal deposit-ed with electrodes based on liquid Li, Na-, Li, K- and Na, K-glass-es (electrode baking temperature of 400 °C)
figure 11. Distribution of connectivities Qni in liquid glasses,
used for producing ECM with indexes Na, K-16 (1), Li, Na-6 (2) and Li, K-11 (3)
18 ISSN 0957-798X THE PATON WELDING JOURNAL, No. 6, 2018
SCIENTIFIC AND TECHNICAL
posited metal, we can assume that moisture content of initial electrode coatings remains unchanged. There-fore, three times change of ECM strength is due to the dynamics of structural components of SOA of binder composition under the influence of cations-modifiers. This is confirmed by the data in Figure 11.
The sample of Na,K-16 coating is the most de-hydrated. Nonetheless, it is the strongest one in Na, K-series. This is indicative of the fact that lowering of the strength of ECM structure during dehydra-tion of binary binder can be compensated by such a transformation of SOA structure under the impact of the change of the ratio of alkaline modifiers content, which will be favourable for strength formation. For one composition of the binder, the above transforma-tion partially, and for another — completely compen-sates, and for the third one it even exceeds the low-ering of strength, due to dehydration of the alkaline silicate binder.
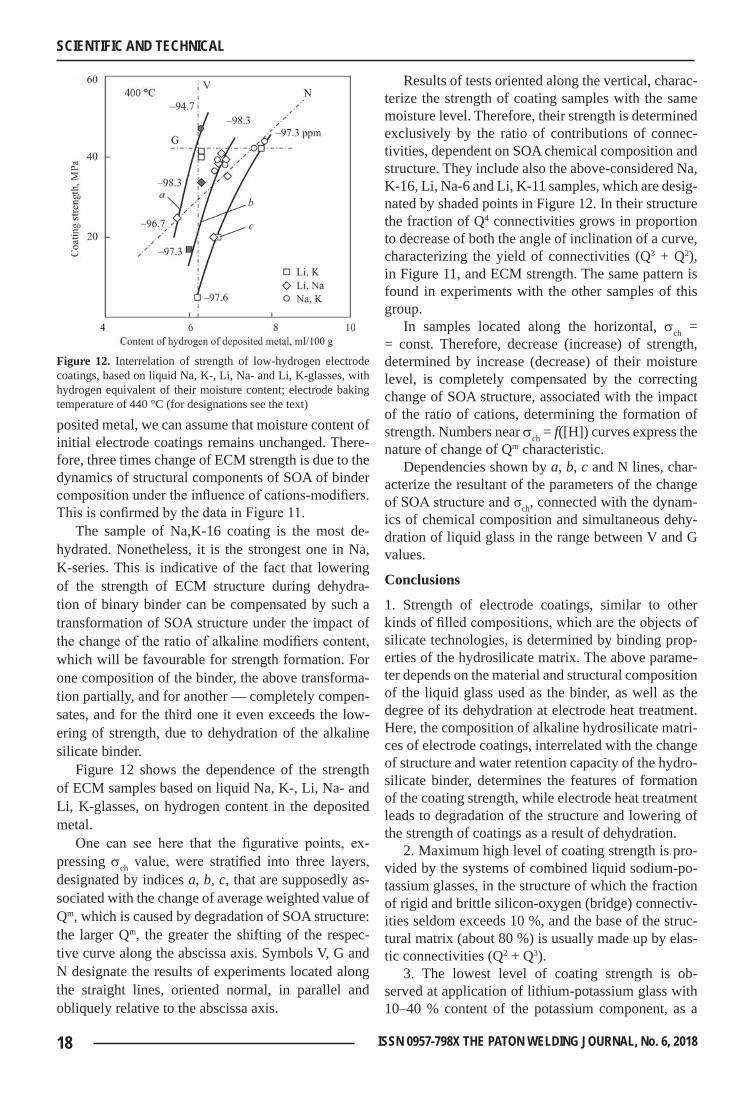
Figure 12 shows the dependence of the strength of ECM samples based on liquid Na, K-, Li, Na- and Li, K-glasses, on hydrogen content in the deposited metal.
One can see here that the figurative points, ex-pressing sch value, were stratified into three layers, designated by indices a, b, c, that are supposedly as-sociated with the change of average weighted value of Qm, which is caused by degradation of SOA structure: the larger Qm, the greater the shifting of the respec-tive curve along the abscissa axis. Symbols V, G and N designate the results of experiments located along the straight lines, oriented normal, in parallel and obliquely relative to the abscissa axis.
Results of tests oriented along the vertical, charac-terize the strength of coating samples with the same moisture level. Therefore, their strength is determined exclusively by the ratio of contributions of connec-tivities, dependent on SOA chemical composition and structure. They include also the above-considered Na, K-16, Li, Na-6 and Li, K-11 samples, which are desig-nated by shaded points in Figure 12. In their structure the fraction of Q4 connectivities grows in proportion to decrease of both the angle of inclination of a curve, characterizing the yield of connectivities (Q3 + Q2), in Figure 11, and ECM strength. The same pattern is found in experiments with the other samples of this group.
In samples located along the horizontal, sch = = const. Therefore, decrease (increase) of strength, determined by increase (decrease) of their moisture level, is completely compensated by the correcting change of SOA structure, associated with the impact of the ratio of cations, determining the formation of strength. Numbers near sch = f([H]) curves express the nature of change of Qm characteristic.
Dependencies shown by a, b, c and N lines, char-acterize the resultant of the parameters of the change of SOA structure and σch, connected with the dynam-ics of chemical composition and simultaneous dehy-dration of liquid glass in the range between V and G values.
conclusions
1. Strength of electrode coatings, similar to other kinds of filled compositions, which are the objects of silicate technologies, is determined by binding prop-erties of the hydrosilicate matrix. The above parame-ter depends on the material and structural composition of the liquid glass used as the binder, as well as the degree of its dehydration at electrode heat treatment. Here, the composition of alkaline hydrosilicate matri-ces of electrode coatings, interrelated with the change of structure and water retention capacity of the hydro-silicate binder, determines the features of formation of the coating strength, while electrode heat treatment leads to degradation of the structure and lowering of the strength of coatings as a result of dehydration.
2. Maximum high level of coating strength is pro-vided by the systems of combined liquid sodium-po-tassium glasses, in the structure of which the fraction of rigid and brittle silicon-oxygen (bridge) connectiv-ities seldom exceeds 10 %, and the base of the struc-tural matrix (about 80 %) is usually made up by elas-tic connectivities (Q2 + Q3).
3. The lowest level of coating strength is ob-served at application of lithium-potassium glass with 10–40 % content of the potassium component, as a
figure 12. Interrelation of strength of low-hydrogen electrode coatings, based on liquid Na, K-, Li, Na- and Li, K-glasses, with hydrogen equivalent of their moisture content; electrode baking temperature of 440 °C (for designations see the text)
19ISSN 0957-798X THE PATON WELDING JOURNAL, No. 6, 2018
SCIENTIFIC AND TECHNICAL
binder, the effect of which is usually demonstrated by a considerable synergetic surge of viscosity. The strength of coatings based on liquid glasses of such a composition, is even lower than that of coatings based on pure lithium glass.
4. Prospects are opened up for solving the prob-lems, arising in connection with the low strength of coatings based on lithium liquid glasses, through ap-plication of combined liquid Li-, Na-, K-glasses.
1. Gorpenyuk, V.N., Pokhodnya, I.K., Marchenko, A.E. (1971) About procedure of evaluation of electrode coating strength. Svarochn. Proizvodstvo, 8, 45–46 [in Russian].
2. Brykov, A.S. (2009) Silicate solutions and their application: Manual. St.-Petersburg, St.-PGTI (TU) [in Russian].
3. Lukyanova, O.I., Uvarova, I.Yu. (1967) To study of interac-tion between high-basic calcium silicates and high-silica so-dium silicates. Doklady AN SSSR, 172 (3), 645 [in Russian].
4. Marchenko, A.E., Skorina, N.V., Voroshilo, V.S., Shevchen-ko, L.A. (1979) On some technological problems caused by
interphase processes in production of welding electrodes. CMEA, Coordination Center on Problem of Development of Sci. Principles... Information documents. Kiev, Naukova Dumka, 1, 50–157 [in Russian].
5. Uchino, T., Sakka, T., Iwasaki, M.-J. (1991) Interpretation of hydrated states of sodium silicate glasses by infrared and Ra-man analysis. Am. Ceram. Soc., 4(2), 306–313.
6. Marchenko, A.E., Skorina, N.V., Kiselev, M.O. et al. (2017) Nuclear magnetic spectroscopy study of the structure of liq-uid glasses for welding electrodes. The Paton Welding J., 1, 41–45.
7. Marchenko, A.E. (2010) On physical-chemical nature of elec-trode coating strength and technological means of its assur-ance. In: Proc. of 5th Int. Conf. Dedicated to 20th Anniversary of Association «Electrode» on Welding Consumables. Tech-nologies. Production. Quality. Competitiveness (7–11 June 2010, Artyomovsk, Donetskaya Reg.). Kiev, 78–99.
8. Marchenko, A.E., Skorina, N.V., Suprun, S.A. (2012) Water-retaining capacity of alkaline silicates and its effect on dehy-dration of electrode coatings. In: Arc welding metallurgy and welding consumables. Kiev, Akademperiodika, 290–302 [in Russian].
Received 13.04.2018
20 ISSN 0957-798X THE PATON WELDING JOURNAL, No. 6, 2018
SCIENTIFIC AND TECHNICAL
DOI: http://dx.doi.org/10.15407/tpwj2018.06.03
influEncE of tEchnological and ElEctrical paraMEtErs of Ess
in currEnt-supplying Mould on ElEctrodE MElting ratE and BasE MEtal pEnEtration
v.g. soloviov and yu.M. kuskovE.O. Paton Electric Welding Institute of the NAS of Ukraine
11 Kazimir Malevich Str., 03150, Kyiv, Ukraine. E-mail: [email protected]
A calculation experiment was conducted which showed that the controllable electrical parameters of the ESS process can be used to regulate the metal pool shape and electrode melting rate. Dependencies between the depth of electrode deepening into the slag pool, average depth of penetration and uniformity of base metal penetration relative to average penetration depth were determined. A method was proposed for calculation of the depth of electrode deepening into the slag pool by the ratio of currents in CSM. Comparative analysis of three types of single-circuit diagrams of the mould connection to the power source was performed, and an optimum diagram for the required criteria of surfacing quality was proposed. 8 Ref., 1 Table, 12 Figures.
K e y w o r d s : current-supplying mould, experiment, automation, metal pool, regulation, penetration, bottom plate, electrode, conductivity, diagram of power supply
The electrostatic field generated by the potential difference between the current-carrying parts of the mould is nonuniform due to a complex configuration of inner elements of the mould and their mutual ar-rangement, even if to assume that the rotation of a liquid slag pool provides homogenization of its prop-erties. First of all, the shape of equipotential surfaces of the field is affected by the value of electrode deep-ening into the slag pool, its diameter and shape, as well as the used type of diagram for connection of the current-supplying mould (CSM) to the power source. The intensity of electric field at each point of the slag pool determines the force and direction of the electric energy flows, which in turn determines the distribu-tion of thermal energy at ESS, influences the electrode melting behavior, uniformity and average penetration depth of product and also the character of a liquid metal crystallization. The problems of mathemati-cal modeling of electrical parameters of electroslag processes were given attention in many works, for example [1–4], however, there are almost no works on modeling and studying the influence of electrical parameters on the uniformity and average penetration depth of product at ESS in current-supplying mould.
In the work [5], as a result of modeling the elec-tric field in slag pool in the CSM on electrically con-ductive paper, the authors made the conclusion that a middle section of the mould, due to its electrical
conductivity, shunts a part of the slag pool, shifts the region of prevailing heat release into the near-wall re-gion of the mould, leaving a central zone to be rela-tively cold. However, directly at the mould wall itself, the metal pool remains cold due to the mould water cooling and, due to that, the pool can acquire a specif-ic form of «sombrero».
The authors of the work [6] make a conclusion that varying the values of currents passing to the electrode and mould during surfacing using a «potential» elec-trode, it is possible to significantly change the shape of the metal pool bottom: from the concave cone-shaped, characteristic for the conventional ESR process, to the convex one in the central part of the deposited layer, inherent in surfacing without electrode.
The aim of the work is to perform mathematical modeling of distribution of the slag pool potential in the CSM by using the PDETool MATLAB package and to conduct a calculation experiment, which will answer the following questions:
• how to use the controllable electrical parame-ters to regulate the metal pool shape and the electrode melting rate;
• how the value of electrode deepening into the slag pool effects the average penetration depth of product and the uniformity of penetration relative to the average penetration depth;
© V.G. SOLOVIOV and Yu.M. KUSKOV, 2018
21ISSN 0957-798X THE PATON WELDING JOURNAL, No. 6, 2018
SCIENTIFIC AND TECHNICAL
• how to use the values of the controllable elec-trical parameters to calculate the value of electrode deepening into the slag pool;
• which single-circuit diagram (of three types) of the mould connection to the power source is the most optimal for solution of the put problem;
• in which cases it is necessary to use the CSM power supply diagram: single- or two-circuit diagram.
One of the standard boundary value problems in PDETool [7] is the electrostatic problem, which was used in this work, since the subject of study was the distribution of electric field intensity in a slag pool between the electrode surfaces, graphite lining of a current-carrying section of the mould and the bottom plate, to which the potential was applied.
In the proposed statement of the problem, it was assumed that the object has an axial symmetry. There-fore, the two-dimensional model is represented in a cylindrical coordinate system. Moreover, the rotation of the molten slag pool around the mould axis pro-vides an axial homogenization of its properties. We assume that there is a qualitative effect of the electro-static field and its nonuniformity near the surface of the bottom plate (product) on the nonuniformity and penetration depth of the upper layer of the product in accordance with the Joule–Lenz law. The boundary conditions of the slag pool surface and the forming section of the mould are taken in accordance with the conditions of the Neumann problem, while those for the boundaries of the electrode surfaces, the mould graphite bushing and the bottom plate were taken in accordance with the Dirichlet problem conditions.
The accepted model and the carried out calculation experiment do not pretend to obtaining numerical in-terrelations of input and output variables which could be used in surfacing, but allow evaluating the qualita-tive relationship of the mentioned variables, correctly planning and simplifying the experimental surfacing to obtain the quantitative interrelations.
The equation of electrostatics with respect to a sca-lar electric potential is
0( ) ,div V− e∇ = re
where e is the relative dielectric permeability of the medium; e0 = 8.85∙10–12 F/m is the absolute dielectric permeability of vacuum (basic electric constant); V is the scalar electric potential; r is the scalar field of the volumetric density of electric charge.
The value of relative dielectric permeability of slag is accepted as e = 70. In connection with the lack of data on this parameter in the literature, the value e for this parameter is assumed equal to the relative di-electric permeability of sea water. To solve the bound-ary value problem of Dirichlet r = hV (where r is the
electric potential; h is the weight coefficient), the val-ue h = 1, and the value of the scalar electrical potential V = 100 of conventional units were accepted, which provides the evaluation of voltages between the equi-potential lines in a percentage relation. To solve the Neumann boundary value problem ε∇V + qV = g, q is the coefficient determining the influence of V value in the model, taken equal to 0.7, and g is the charge on side surfaces of a forming section of the mould, is accepted as equal to <10–10 C, i.e. g = 0. For a slag pool r = 0. Visualization of scalar elliptic PDEs al-lowed using the «method of graphic images», which is successfully applied in the calculation of fields of charged bodies, located near plane or cylindrical con-ducting surfaces [8].
problem statement. As a result of modeling, it is necessary to determine the nature of effect of values of the electrode diameter de, the electrode deepening into the slag pool hd, the level of the metal pool hm rel-ative to the level of the lower edge of the current-car-rying section of the mould on the controllable electri-cal parameters of ESS in CSM.
The geometric characteristics and constants of the model are:
• inner diameter of the mould forming part is 180 mm;
• cylindrical electrode of diameter de: 40 (a), 90 (b) and 130 mm (c);
• two-section mould (without middle section);• height of graphite lining wetted with slag (wet
part), 20 mm;• distance from the bottom edge of graphite lining
to the metal pool mirror hm: 30 (a), 50 (b) and 80 mm (c). The depth of the slag pool is, respectively, hs: 50 (a), 70 (b) and 100 mm (c).
• value of electrode deepening into the slag pool hd: 10 (a), 20 (b) and 40 mm (c).
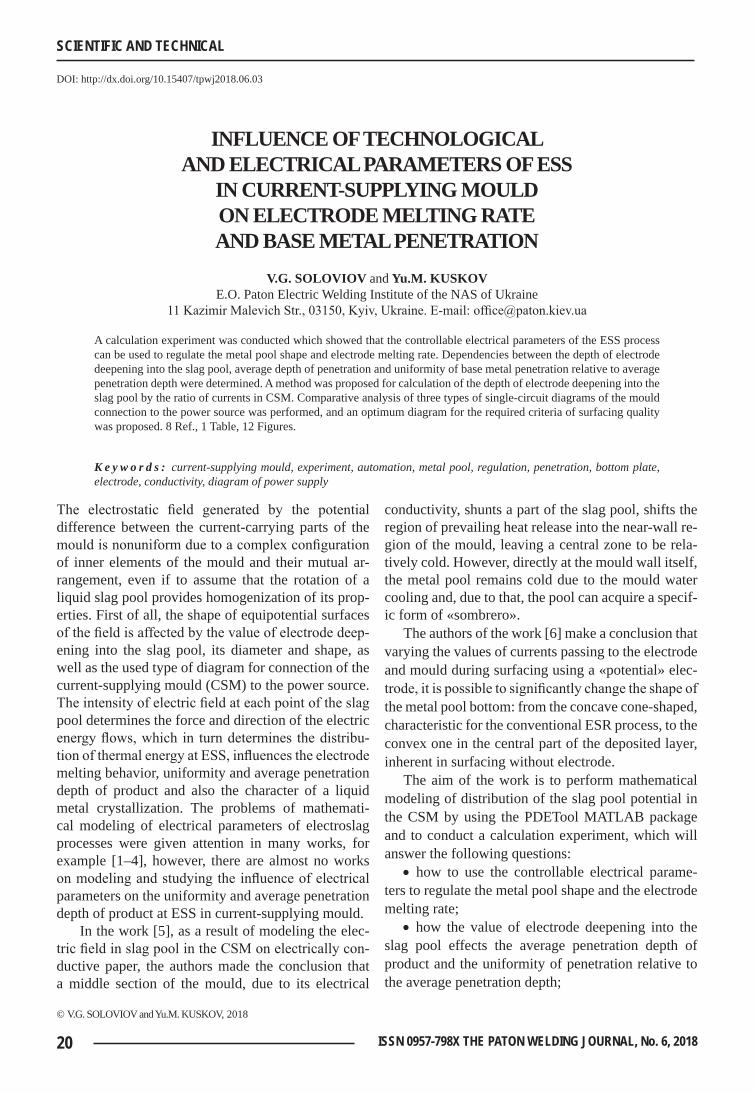
Figure 1 shows the examples of models of elec-trostatic fields for CSM with different diagrams of connections to the source, different diameters of elec-trodes, with different depths of slag pool and different values of electrode deepening.
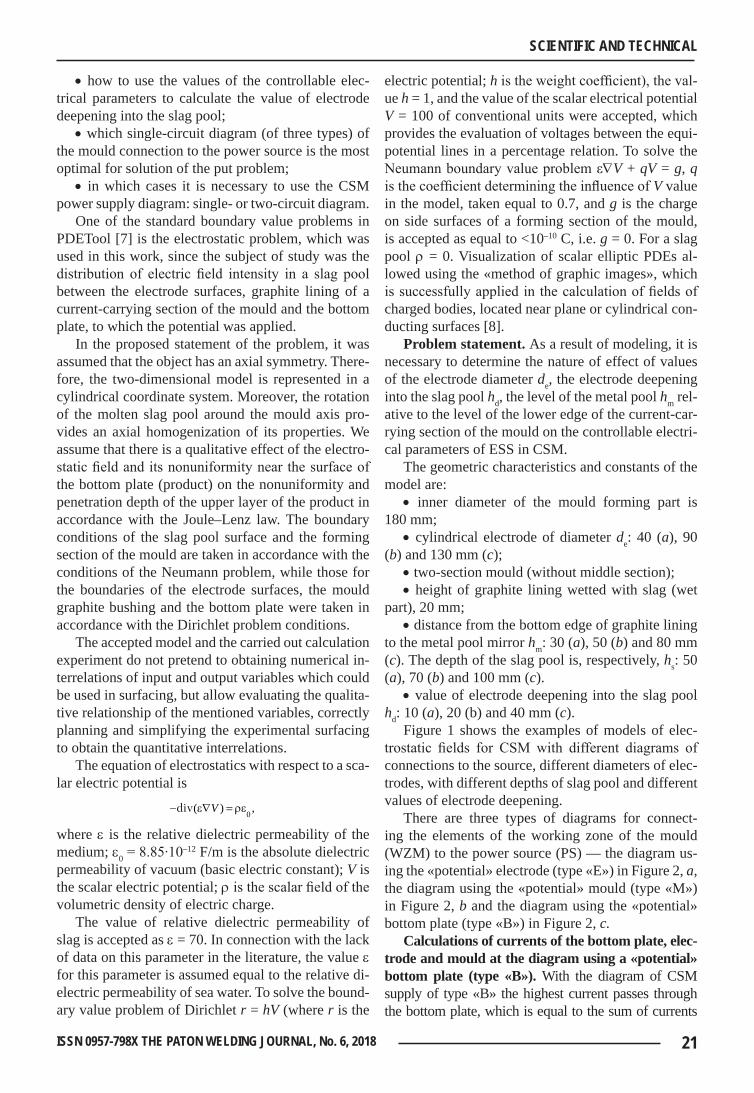
There are three types of diagrams for connect-ing the elements of the working zone of the mould (WZM) to the power source (PS) — the diagram us-ing the «potential» electrode (type «E») in Figure 2, a, the diagram using the «potential» mould (type «M») in Figure 2, b and the diagram using the «potential» bottom plate (type «B») in Figure 2, c.
calculations of currents of the bottom plate, elec-trode and mould at the diagram using a «potential» bottom plate (type «B»). With the diagram of CSM supply of type «B» the highest current passes through the bottom plate, which is equal to the sum of currents
22 ISSN 0957-798X THE PATON WELDING JOURNAL, No. 6, 2018
SCIENTIFIC AND TECHNICAL
passing through the electrode and mould. In this way, the best heating of product is provided, but the efficiency of melting the electrode is lower than, for example, in connecting CSM to the source according to the diagram with a «potential» electrode (type «E»).
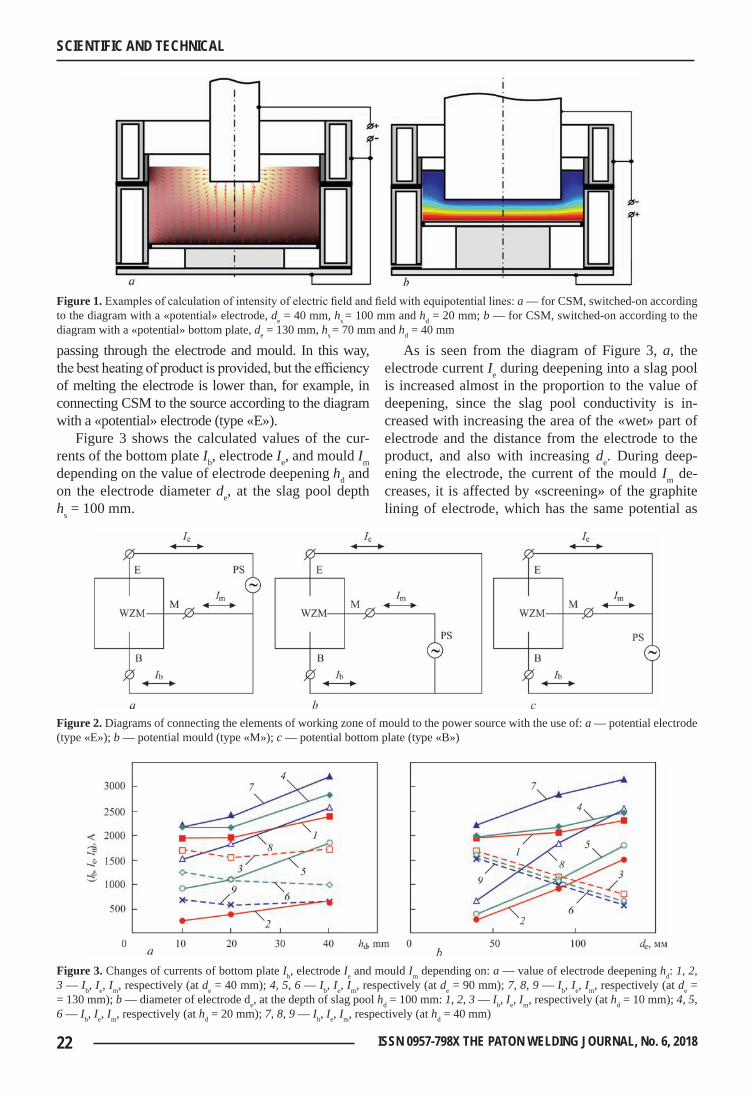
Figure 3 shows the calculated values of the cur-rents of the bottom plate Ib, electrode Ie, and mould Im depending on the value of electrode deepening hd and on the electrode diameter de, at the slag pool depth hs = 100 mm.
As is seen from the diagram of Figure 3, a, the electrode current Ie during deepening into a slag pool is increased almost in the proportion to the value of deepening, since the slag pool conductivity is in-creased with increasing the area of the «wet» part of electrode and the distance from the electrode to the product, and also with increasing de. During deep-ening the electrode, the current of the mould Im de-creases, it is affected by «screening» of the graphite lining of electrode, which has the same potential as
figure 1. Examples of calculation of intensity of electric field and field with equipotential lines: a — for CSM, switched-on according to the diagram with a «potential» electrode, de = 40 mm, hs = 100 mm and hd = 20 mm; b — for CSM, switched-on according to the diagram with a «potential» bottom plate, de = 130 mm, hs = 70 mm and hd = 40 mm
figure 2. Diagrams of connecting the elements of working zone of mould to the power source with the use of: a — potential electrode (type «E»); b — potential mould (type «M»); c — potential bottom plate (type «B»)
figure 3. Changes of currents of bottom plate Ib, electrode Ie and mould Im depending on: a — value of electrode deepening hd: 1, 2, 3 — Ib, Ie, Im, respectively (at de = 40 mm); 4, 5, 6 — Ib, Ie, Im, respectively (at de = 90 mm); 7, 8, 9 — Ib, Ie, Im, respectively (at de = = 130 mm); b — diameter of electrode de, at the depth of slag pool hd = 100 mm: 1, 2, 3 — Ib, Ie, Im, respectively (at hd = 10 mm); 4, 5, 6 — Ib, Ie, Im, respectively (at hd = 20 mm); 7, 8, 9 — Ib, Ie, Im, respectively (at hd = 40 mm)
23ISSN 0957-798X THE PATON WELDING JOURNAL, No. 6, 2018
SCIENTIFIC AND TECHNICAL
the graphite lining, and which during deepening into the slag pool and approaching a product, undertakes a greater percentage of the source total current. With deepening the electrode, the current of the bottom plate Ib increases. It should be taken into account that Im and Ie at de = 90 mm are close in values, and at deep-ening to 20 mm, they are even equal. At de = 40 mm, the current of the mould Im exceeds the current of the electrode Ie, and at de = 130 mm, we observe the oth-er situation: the electrode current exceeds the mould current. From the diagram in Figure 3, b, a weak in-fluence of the electrode diameter de on the current of bottom plate Ib and its strong influence on Ie and Im are seen at the small deepening of the electrode.
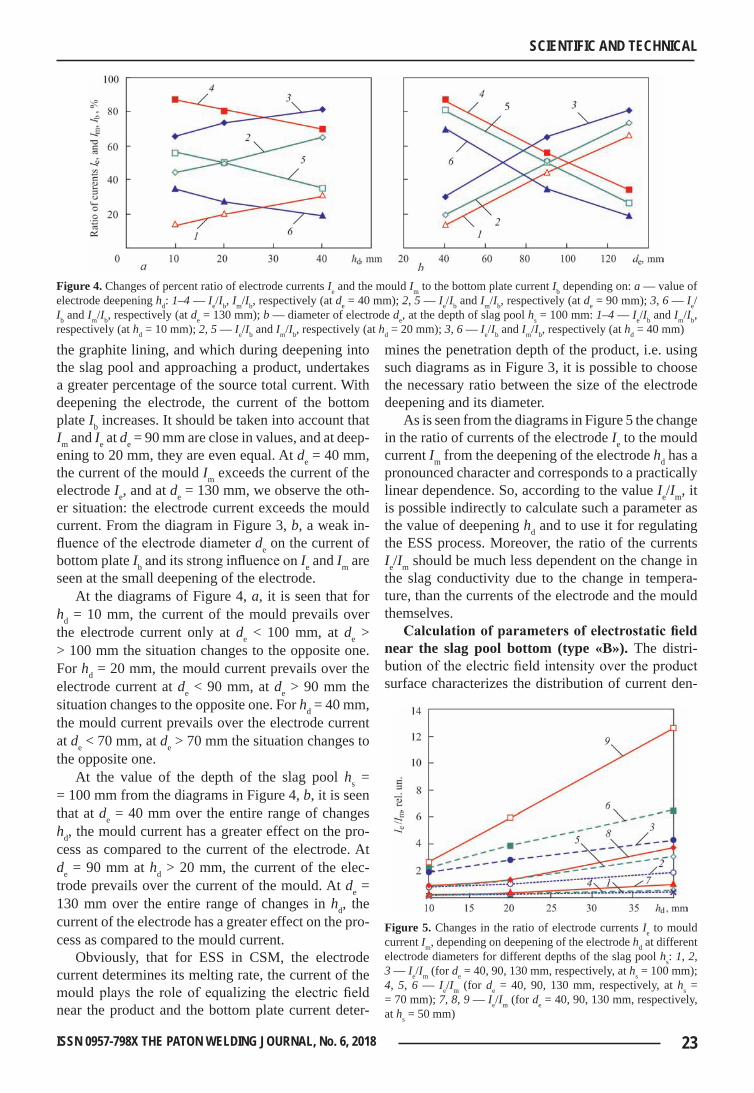
At the diagrams of Figure 4, a, it is seen that for hd = 10 mm, the current of the mould prevails over the electrode current only at de < 100 mm, at de > > 100 mm the situation changes to the opposite one. For hd = 20 mm, the mould current prevails over the electrode current at de < 90 mm, at de > 90 mm the situation changes to the opposite one. For hd = 40 mm, the mould current prevails over the electrode current at de < 70 mm, at de > 70 mm the situation changes to the opposite one.
At the value of the depth of the slag pool hs = = 100 mm from the diagrams in Figure 4, b, it is seen that at de = 40 mm over the entire range of changes hd, the mould current has a greater effect on the pro-cess as compared to the current of the electrode. At de = 90 mm at hd > 20 mm, the current of the elec-trode prevails over the current of the mould. At de = 130 mm over the entire range of changes in hd, the current of the electrode has a greater effect on the pro-cess as compared to the mould current.
Obviously, that for ESS in CSM, the electrode current determines its melting rate, the current of the mould plays the role of equalizing the electric field near the product and the bottom plate current deter-
mines the penetration depth of the product, i.e. using such diagrams as in Figure 3, it is possible to choose the necessary ratio between the size of the electrode deepening and its diameter.
As is seen from the diagrams in Figure 5 the change in the ratio of currents of the electrode Ie to the mould current Im from the deepening of the electrode hd has a pronounced character and corresponds to a practically linear dependence. So, according to the value Ie/Im, it is possible indirectly to calculate such a parameter as the value of deepening hd and to use it for regulating the ESS process. Moreover, the ratio of the currents Ie/Im should be much less dependent on the change in the slag conductivity due to the change in tempera-ture, than the currents of the electrode and the mould themselves.
Calculation of parameters of electrostatic field near the slag pool bottom (type «B»). The distri-bution of the electric field intensity over the product surface characterizes the distribution of current den-
figure 4. Changes of percent ratio of electrode currents Ie and the mould Im to the bottom plate current Ib depending on: a — value of electrode deepening hd: 1–4 — Ie/Ib, Im/Ib, respectively (at de = 40 mm); 2, 5 — Ie/Ib and Im/Ib, respectively (at de = 90 mm); 3, 6 — Ie/Ib and Im/Ib, respectively (at de = 130 mm); b — diameter of electrode de, at the depth of slag pool hs = 100 mm: 1–4 — Ie/Ib and Im/Ib, respectively (at hd = 10 mm); 2, 5 — Ie/Ib and Im/Ib, respectively (at hd = 20 mm); 3, 6 — Ie/Ib and Im/Ib, respectively (at hd = 40 mm)
figure 5. Changes in the ratio of electrode currents Ie to mould current Im, depending on deepening of the electrode hd at different electrode diameters for different depths of the slag pool hs: 1, 2, 3 — Ie/Im (for de = 40, 90, 130 mm, respectively, at hs = 100 mm); 4, 5, 6 — Ie/Im (for de = 40, 90, 130 mm, respectively, at hs = = 70 mm); 7, 8, 9 — Ie/Im (for de = 40, 90, 130 mm, respectively, at hs = 50 mm)
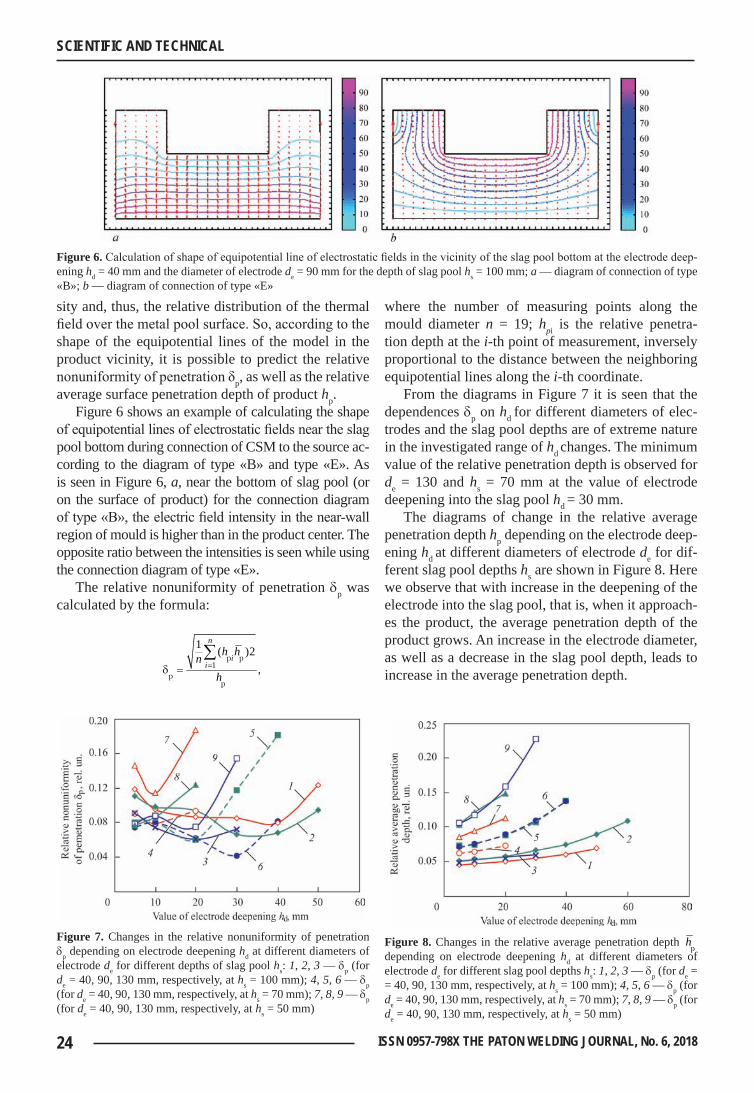
24 ISSN 0957-798X THE PATON WELDING JOURNAL, No. 6, 2018
SCIENTIFIC AND TECHNICAL
sity and, thus, the relative distribution of the thermal field over the metal pool surface. So, according to the shape of the equipotential lines of the model in the product vicinity, it is possible to predict the relative nonuniformity of penetration δp, as well as the relative average surface penetration depth of product hp.
Figure 6 shows an example of calculating the shape of equipotential lines of electrostatic fields near the slag pool bottom during connection of CSM to the source ac-cording to the diagram of type «B» and type «E». As is seen in Figure 6, a, near the bottom of slag pool (or on the surface of product) for the connection diagram of type «B», the electric field intensity in the near-wall region of mould is higher than in the product center. The opposite ratio between the intensities is seen while using the connection diagram of type «E».
The relative nonuniformity of penetration dp was calculated by the formula:
1
1 ( )2,
p p
pp
n
ii
h hnh
=d =∑
where the number of measuring points along the mould diameter n = 19; hpi is the relative penetra-tion depth at the i-th point of measurement, inversely proportional to the distance between the neighboring equipotential lines along the i-th coordinate.
From the diagrams in Figure 7 it is seen that the dependences dp on hd for different diameters of elec-trodes and the slag pool depths are of extreme nature in the investigated range of hd changes. The minimum value of the relative penetration depth is observed for de = 130 and hs = 70 mm at the value of electrode deepening into the slag pool hd = 30 mm.
The diagrams of change in the relative average penetration depth hp depending on the electrode deep-ening hd at different diameters of electrode de for dif-ferent slag pool depths hs are shown in Figure 8. Here we observe that with increase in the deepening of the electrode into the slag pool, that is, when it approach-es the product, the average penetration depth of the product grows. An increase in the electrode diameter, as well as a decrease in the slag pool depth, leads to increase in the average penetration depth.
figure 6. Calculation of shape of equipotential line of electrostatic fields in the vicinity of the slag pool bottom at the electrode deep-ening hd = 40 mm and the diameter of electrode de = 90 mm for the depth of slag pool hs = 100 mm; a — diagram of connection of type «B»; b — diagram of connection of type «E»
figure 7. Changes in the relative nonuniformity of penetration dp depending on electrode deepening hd at different diameters of electrode de for different depths of slag pool hs: 1, 2, 3 — dp (for de = 40, 90, 130 mm, respectively, at hs = 100 mm); 4, 5, 6 — dp (for de = 40, 90, 130 mm, respectively, at hs = 70 mm); 7, 8, 9 — dp (for de = 40, 90, 130 mm, respectively, at hs = 50 mm)
figure 8. Changes in the relative average penetration depth p
h depending on electrode deepening hd at different diameters of electrode de for different slag pool depths hs: 1, 2, 3 — dp (for de = = 40, 90, 130 mm, respectively, at hs = 100 mm); 4, 5, 6 — dp (for de = 40, 90, 130 mm, respectively, at hs = 70 mm); 7, 8, 9 — dp (for de = 40, 90, 130 mm, respectively, at hs = 50 mm)
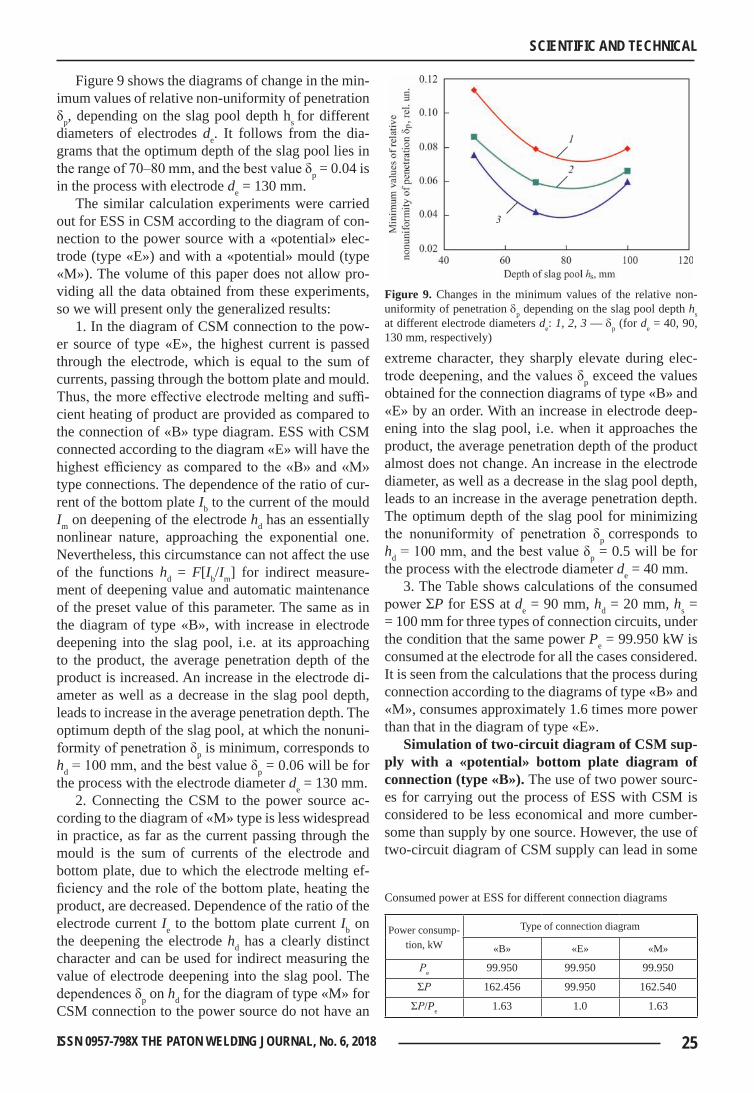
25ISSN 0957-798X THE PATON WELDING JOURNAL, No. 6, 2018
SCIENTIFIC AND TECHNICAL
Figure 9 shows the diagrams of change in the min-imum values of relative non-uniformity of penetration δp, depending on the slag pool depth hs for different diameters of electrodes de. It follows from the dia-grams that the optimum depth of the slag pool lies in the range of 70–80 mm, and the best value δp = 0.04 is in the process with electrode de = 130 mm.
The similar calculation experiments were carried out for ESS in CSM according to the diagram of con-nection to the power source with a «potential» elec-trode (type «E») and with a «potential» mould (type «M»). The volume of this paper does not allow pro-viding all the data obtained from these experiments, so we will present only the generalized results:
1. In the diagram of CSM connection to the pow-er source of type «E», the highest current is passed through the electrode, which is equal to the sum of currents, passing through the bottom plate and mould. Thus, the more effective electrode melting and suffi-cient heating of product are provided as compared to the connection of «B» type diagram. ESS with CSM connected according to the diagram «E» will have the highest efficiency as compared to the «B» and «M» type connections. The dependence of the ratio of cur-rent of the bottom plate Ib to the current of the mould Im on deepening of the electrode hd has an essentially nonlinear nature, approaching the exponential one. Nevertheless, this circumstance can not affect the use of the functions hd = F[Ib/Im] for indirect measure-ment of deepening value and automatic maintenance of the preset value of this parameter. The same as in the diagram of type «B», with increase in electrode deepening into the slag pool, i.e. at its approaching to the product, the average penetration depth of the product is increased. An increase in the electrode di-ameter as well as a decrease in the slag pool depth, leads to increase in the average penetration depth. The optimum depth of the slag pool, at which the nonuni-formity of penetration δp is minimum, corresponds to hd = 100 mm, and the best value δp = 0.06 will be for the process with the electrode diameter de = 130 mm.
2. Connecting the CSM to the power source ac-cording to the diagram of «M» type is less widespread in practice, as far as the current passing through the mould is the sum of currents of the electrode and bottom plate, due to which the electrode melting ef-ficiency and the role of the bottom plate, heating the product, are decreased. Dependence of the ratio of the electrode current Ie to the bottom plate current Ib on the deepening the electrode hd has a clearly distinct character and can be used for indirect measuring the value of electrode deepening into the slag pool. The dependences δp on hd for the diagram of type «M» for CSM connection to the power source do not have an
extreme character, they sharply elevate during elec-trode deepening, and the values δp exceed the values obtained for the connection diagrams of type «B» and «E» by an order. With an increase in electrode deep-ening into the slag pool, i.e. when it approaches the product, the average penetration depth of the product almost does not change. An increase in the electrode diameter, as well as a decrease in the slag pool depth, leads to an increase in the average penetration depth. The optimum depth of the slag pool for minimizing the nonuniformity of penetration δp corresponds to hd = 100 mm, and the best value δp = 0.5 will be for the process with the electrode diameter de = 40 mm.
3. The Table shows calculations of the consumed power ΣP for ESS at de = 90 mm, hd = 20 mm, hs = = 100 mm for three types of connection circuits, under the condition that the same power Pe = 99.950 kW is consumed at the electrode for all the cases considered. It is seen from the calculations that the process during connection according to the diagrams of type «B» and «M», consumes approximately 1.6 times more power than that in the diagram of type «E».
simulation of two-circuit diagram of csM sup-ply with a «potential» bottom plate diagram of connection (type «B»). The use of two power sourc-es for carrying out the process of ESS with CSM is considered to be less economical and more cumber-some than supply by one source. However, the use of two-circuit diagram of CSM supply can lead in some
figure 9. Changes in the minimum values of the relative non-uniformity of penetration dp depending on the slag pool depth hs at different electrode diameters de: 1, 2, 3 — dp (for de = 40, 90, 130 mm, respectively)
Consumed power at ESS for different connection diagrams
Power consump-tion, kW
Type of connection diagram
«B» «E» «M»
Рe 99.950 99.950 99.950
ΣР 162.456 99.950 162.540
ΣР/Pe 1.63 1.0 1.63
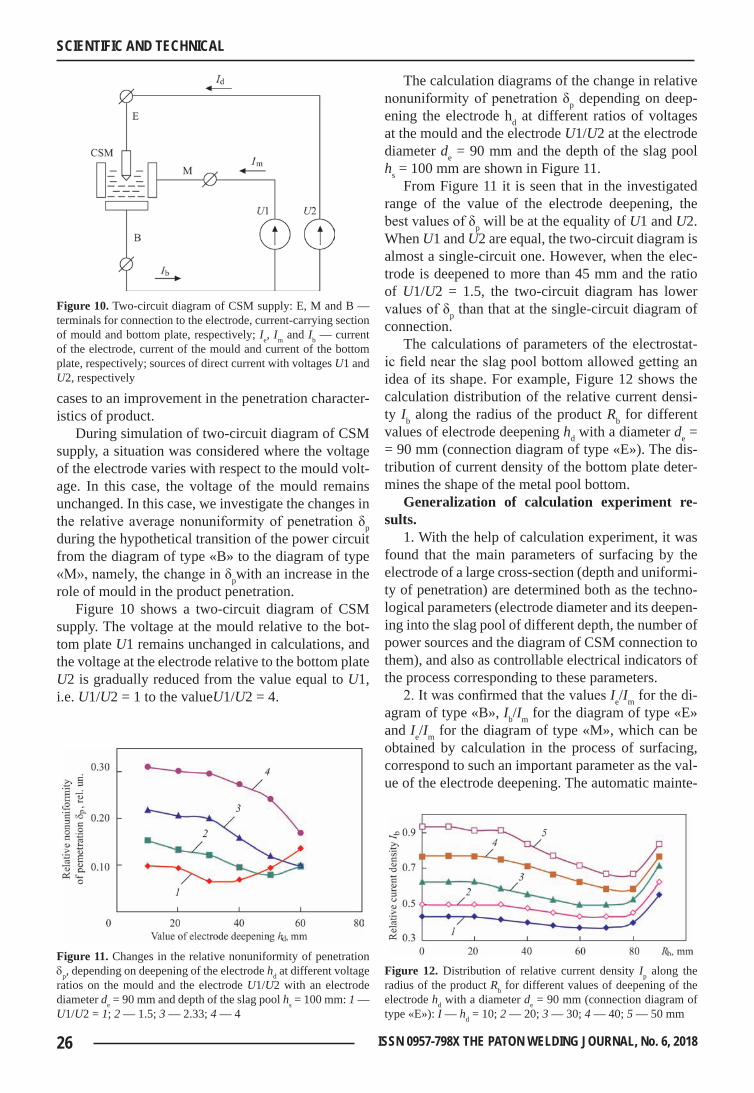
26 ISSN 0957-798X THE PATON WELDING JOURNAL, No. 6, 2018
SCIENTIFIC AND TECHNICAL
cases to an improvement in the penetration character-istics of product.
During simulation of two-circuit diagram of CSM supply, a situation was considered where the voltage of the electrode varies with respect to the mould volt-age. In this case, the voltage of the mould remains unchanged. In this case, we investigate the changes in the relative average nonuniformity of penetration δp during the hypothetical transition of the power circuit from the diagram of type «B» to the diagram of type «M», namely, the change in δpwith an increase in the role of mould in the product penetration.
Figure 10 shows a two-circuit diagram of CSM supply. The voltage at the mould relative to the bot-tom plate U1 remains unchanged in calculations, and the voltage at the electrode relative to the bottom plate U2 is gradually reduced from the value equal to U1, i.e. U1/U2 = 1 to the valueU1/U2 = 4.
The calculation diagrams of the change in relative nonuniformity of penetration δp depending on deep-ening the electrode hd at different ratios of voltages at the mould and the electrode U1/U2 at the electrode diameter de = 90 mm and the depth of the slag pool hs = 100 mm are shown in Figure 11.
From Figure 11 it is seen that in the investigated range of the value of the electrode deepening, the best values of δp will be at the equality of U1 and U2. When U1 and U2 are equal, the two-circuit diagram is almost a single-circuit one. However, when the elec-trode is deepened to more than 45 mm and the ratio of U1/U2 = 1.5, the two-circuit diagram has lower values of δp than that at the single-circuit diagram of connection.
The calculations of parameters of the electrostat-ic field near the slag pool bottom allowed getting an idea of its shape. For example, Figure 12 shows the calculation distribution of the relative current densi-ty Ib along the radius of the product Rb for different values of electrode deepening hd with a diameter de = = 90 mm (connection diagram of type «E»). The dis-tribution of current density of the bottom plate deter-mines the shape of the metal pool bottom.
generalization of calculation experiment re-sults.
1. With the help of calculation experiment, it was found that the main parameters of surfacing by the electrode of a large cross-section (depth and uniformi-ty of penetration) are determined both as the techno-logical parameters (electrode diameter and its deepen-ing into the slag pool of different depth, the number of power sources and the diagram of CSM connection to them), and also as controllable electrical indicators of the process corresponding to these parameters.
2. It was confirmed that the values Ie/Im for the di-agram of type «B», Ib/Im for the diagram of type «E» and Ie/Im for the diagram of type «M», which can be obtained by calculation in the process of surfacing, correspond to such an important parameter as the val-ue of the electrode deepening. The automatic mainte-
figure 10. Two-circuit diagram of CSM supply: E, M and B — terminals for connection to the electrode, current-carrying section of mould and bottom plate, respectively; Ie, Im and Ib — current of the electrode, current of the mould and current of the bottom plate, respectively; sources of direct current with voltages U1 and U2, respectively
figure 11. Changes in the relative nonuniformity of penetration dp, depending on deepening of the electrode hd at different voltage ratios on the mould and the electrode U1/U2 with an electrode diameter de = 90 mm and depth of the slag pool hs = 100 mm: 1 — U1/U2 = 1; 2 — 1.5; 3 — 2.33; 4 — 4
figure 12. Distribution of relative current density Ip along the radius of the product Rb for different values of deepening of the electrode hd with a diameter de = 90 mm (connection diagram of type «E»): I — hd = 10; 2 — 20; 3 — 30; 4 — 40; 5 — 50 mm
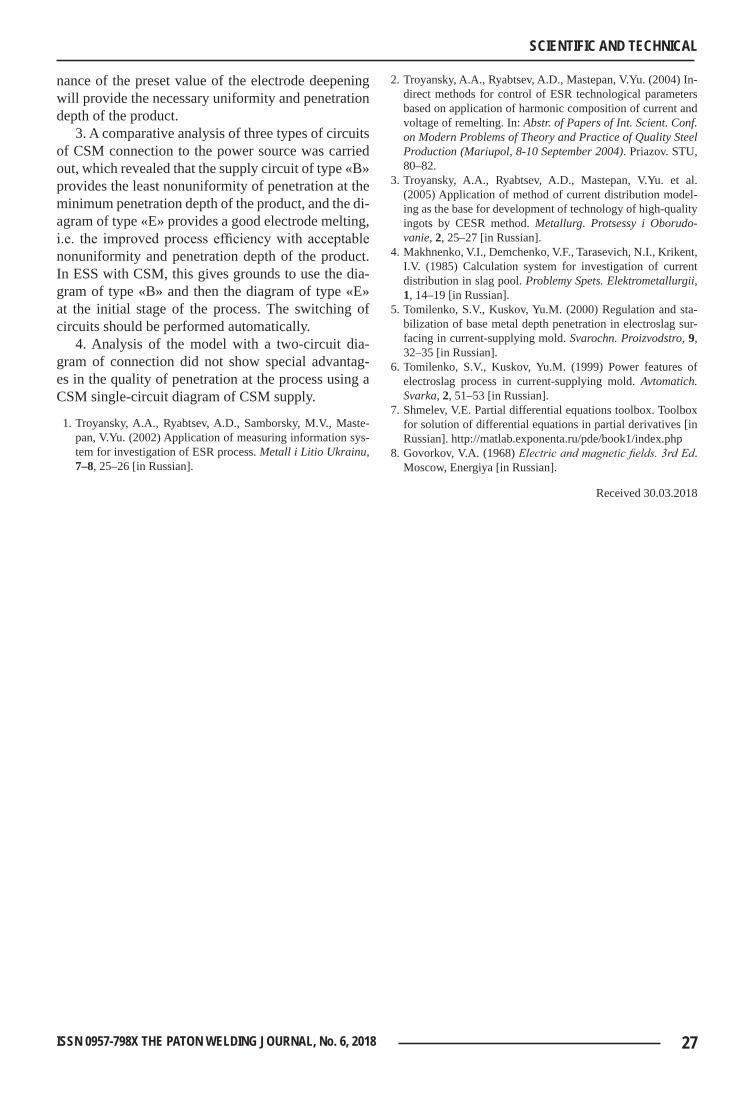
27ISSN 0957-798X THE PATON WELDING JOURNAL, No. 6, 2018
SCIENTIFIC AND TECHNICAL
nance of the preset value of the electrode deepening will provide the necessary uniformity and penetration depth of the product.
3. A comparative analysis of three types of circuits of CSM connection to the power source was carried out, which revealed that the supply circuit of type «B» provides the least nonuniformity of penetration at the minimum penetration depth of the product, and the di-agram of type «E» provides a good electrode melting, i.e. the improved process efficiency with acceptable nonuniformity and penetration depth of the product. In ESS with CSM, this gives grounds to use the dia-gram of type «B» and then the diagram of type «E» at the initial stage of the process. The switching of circuits should be performed automatically.
4. Analysis of the model with a two-circuit dia-gram of connection did not show special advantag-es in the quality of penetration at the process using a CSM single-circuit diagram of CSM supply.
1. Troyansky, A.A., Ryabtsev, A.D., Samborsky, M.V., Maste-pan, V.Yu. (2002) Application of measuring information sys-tem for investigation of ESR process. Metall i Litio Ukrainu, 7–8, 25–26 [in Russian].
2. Troyansky, A.A., Ryabtsev, A.D., Mastepan, V.Yu. (2004) In-direct methods for control of ESR technological parameters based on application of harmonic composition of current and voltage of remelting. In: Abstr. of Papers of Int. Scient. Conf. on Modern Problems of Theory and Practice of Quality Steel Production (Mariupol, 8-10 September 2004). Priazov. STU, 80–82.
3. Troyansky, A.A., Ryabtsev, A.D., Mastepan, V.Yu. et al. (2005) Application of method of current distribution model-ing as the base for development of technology of high-quality ingots by CESR method. Metallurg. Protsessy i Oborudo-vanie, 2, 25–27 [in Russian].
4. Makhnenko, V.I., Demchenko, V.F., Tarasevich, N.I., Krikent, I.V. (1985) Calculation system for investigation of current distribution in slag pool. Problemy Spets. Elektrometallurgii, 1, 14–19 [in Russian].
5. Tomilenko, S.V., Kuskov, Yu.M. (2000) Regulation and sta-bilization of base metal depth penetration in electroslag sur-facing in current-supplying mold. Svarochn. Proizvodstro, 9, 32–35 [in Russian].
6. Tomilenko, S.V., Kuskov, Yu.M. (1999) Power features of electroslag process in current-supplying mold. Avtomatich. Svarka, 2, 51–53 [in Russian].
7. Shmelev, V.E. Partial differential equations toolbox. Toolbox for solution of differential equations in partial derivatives [in Russian]. http://matlab.exponenta.ru/pde/book1/index.php
8. Govorkov, V.A. (1968) Electric and magnetic fields. 3rd Ed. Moscow, Energiya [in Russian].
Received 30.03.2018
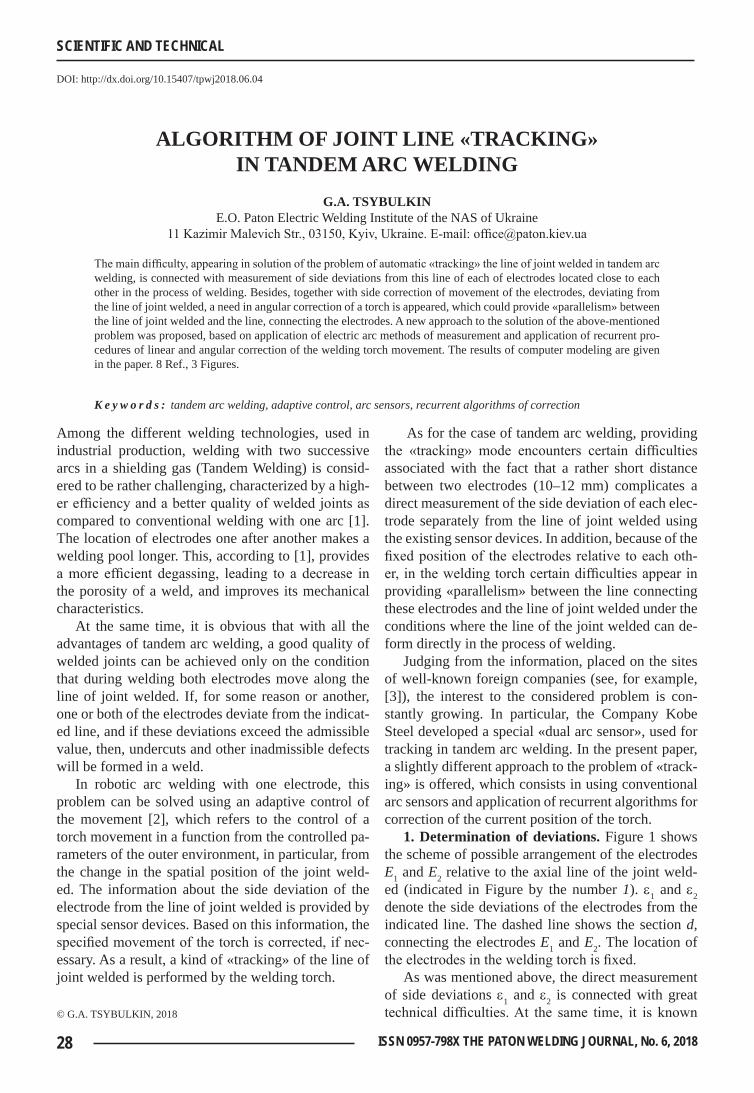
28 ISSN 0957-798X THE PATON WELDING JOURNAL, No. 6, 2018
SCIENTIFIC AND TECHNICAL
DOI: http://dx.doi.org/10.15407/tpwj2018.06.04
algorithM of Joint linE «tracking» in tandEM arc wElding
g.a. tsyBulkinE.O. Paton Electric Welding Institute of the NAS of Ukraine
11 Kazimir Malevich Str., 03150, Kyiv, Ukraine. E-mail: [email protected]
The main difficulty, appearing in solution of the problem of automatic «tracking» the line of joint welded in tandem arc welding, is connected with measurement of side deviations from this line of each of electrodes located close to each other in the process of welding. Besides, together with side correction of movement of the electrodes, deviating from the line of joint welded, a need in angular correction of a torch is appeared, which could provide «parallelism» between the line of joint welded and the line, connecting the electrodes. A new approach to the solution of the above-mentioned problem was proposed, based on application of electric arc methods of measurement and application of recurrent pro-cedures of linear and angular correction of the welding torch movement. The results of computer modeling are given in the paper. 8 Ref., 3 Figures.
K e y w o r d s : tandem arc welding, adaptive control, arc sensors, recurrent algorithms of correction
Among the different welding technologies, used in industrial production, welding with two successive arcs in a shielding gas (Tandem Welding) is consid-ered to be rather challenging, characterized by a high-er efficiency and a better quality of welded joints as compared to conventional welding with one arc [1]. The location of electrodes one after another makes a welding pool longer. This, according to [1], provides a more efficient degassing, leading to a decrease in the porosity of a weld, and improves its mechanical characteristics.
At the same time, it is obvious that with all the advantages of tandem arc welding, a good quality of welded joints can be achieved only on the condition that during welding both electrodes move along the line of joint welded. If, for some reason or another, one or both of the electrodes deviate from the indicat-ed line, and if these deviations exceed the admissible value, then, undercuts and other inadmissible defects will be formed in a weld.
In robotic arc welding with one electrode, this problem can be solved using an adaptive control of the movement [2], which refers to the control of a torch movement in a function from the controlled pa-rameters of the outer environment, in particular, from the change in the spatial position of the joint weld-ed. The information about the side deviation of the electrode from the line of joint welded is provided by special sensor devices. Based on this information, the specified movement of the torch is corrected, if nec-essary. As a result, a kind of «tracking» of the line of joint welded is performed by the welding torch.
As for the case of tandem arc welding, providing the «tracking» mode encounters certain difficulties associated with the fact that a rather short distance between two electrodes (10–12 mm) complicates a direct measurement of the side deviation of each elec-trode separately from the line of joint welded using the existing sensor devices. In addition, because of the fixed position of the electrodes relative to each oth-er, in the welding torch certain difficulties appear in providing «parallelism» between the line connecting these electrodes and the line of joint welded under the conditions where the line of the joint welded can de-form directly in the process of welding.
Judging from the information, placed on the sites of well-known foreign companies (see, for example, [3]), the interest to the considered problem is con-stantly growing. In particular, the Company Kobe Steel developed a special «dual arc sensor», used for tracking in tandem arc welding. In the present paper, a slightly different approach to the problem of «track-ing» is offered, which consists in using conventional arc sensors and application of recurrent algorithms for correction of the current position of the torch.
1. determination of deviations. Figure 1 shows the scheme of possible arrangement of the electrodes E1 and E2 relative to the axial line of the joint weld-ed (indicated in Figure by the number 1). e1 and e2 denote the side deviations of the electrodes from the indicated line. The dashed line shows the section d, connecting the electrodes E1 and E2. The location of the electrodes in the welding torch is fixed.
As was mentioned above, the direct measurement of side deviations e1 and e2 is connected with great technical difficulties. At the same time, it is known © G.A. TSYBULKIN, 2018
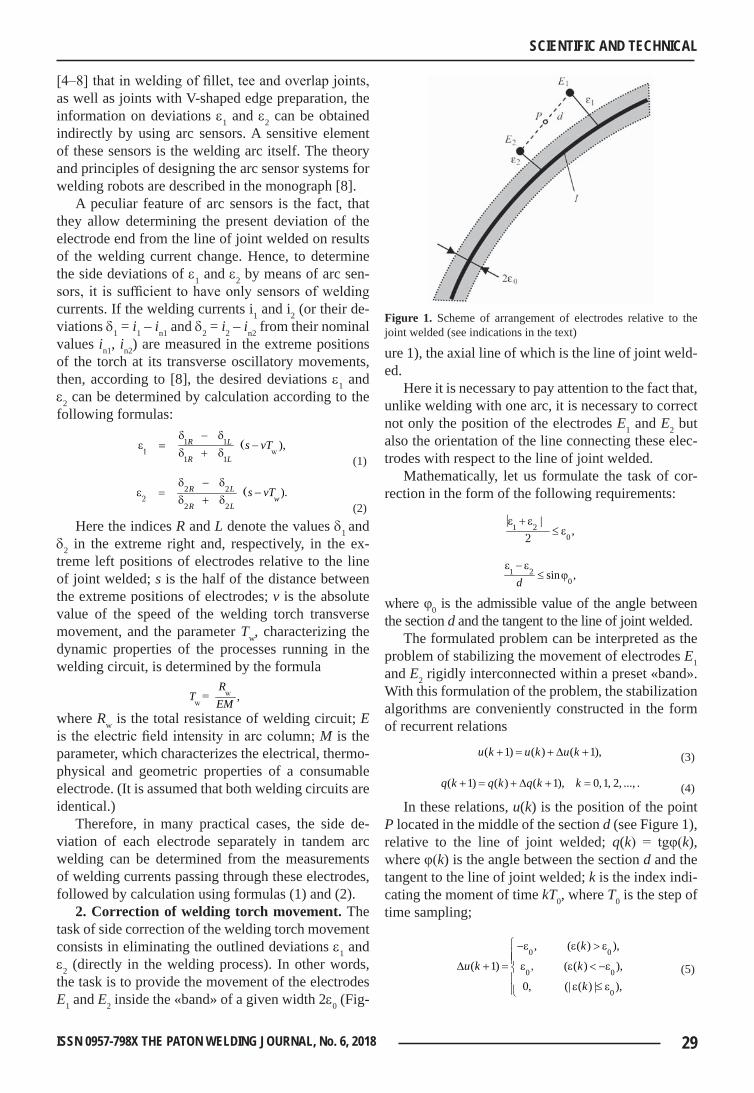
29ISSN 0957-798X THE PATON WELDING JOURNAL, No. 6, 2018
SCIENTIFIC AND TECHNICAL
[4–8] that in welding of fillet, tee and overlap joints, as well as joints with V-shaped edge preparation, the information on deviations e1 and e2 can be obtained indirectly by using arc sensors. A sensitive element of these sensors is the welding arc itself. The theory and principles of designing the arc sensor systems for welding robots are described in the monograph [8].
A peculiar feature of arc sensors is the fact, that they allow determining the present deviation of the electrode end from the line of joint welded on results of the welding current change. Hence, to determine the side deviations of e1 and e2 by means of arc sen-sors, it is sufficient to have only sensors of welding currents. If the welding currents i1 and i2 (or their de-viations d1 = i1 – in1 and d2 = i2 – in2 from their nominal values in1, in2) are measured in the extreme positions of the torch at its transverse oscillatory movements, then, according to [8], the desired deviations e1 and e2 can be determined by calculation according to the following formulas:
1 1
1 1),
1 w
(
R L
R Ls vT
d − de = −
d + d (1)
2 2
2 2).
2
(
R L
wR L
s vTd − d
e = −d + d
(2)Here the indices R and L denote the values d1 and
d2 in the extreme right and, respectively, in the ex-treme left positions of electrodes relative to the line of joint welded; s is the half of the distance between the extreme positions of electrodes; v is the absolute value of the speed of the welding torch transverse movement, and the parameter Tw, characterizing the dynamic properties of the processes running in the welding circuit, is determined by the formula
,w
w =
RT EM
where Rw is the total resistance of welding circuit; E is the electric field intensity in arc column; M is the parameter, which characterizes the electrical, thermo-physical and geometric properties of a consumable electrode. (It is assumed that both welding circuits are identical.)
Therefore, in many practical cases, the side de-viation of each electrode separately in tandem arc welding can be determined from the measurements of welding currents passing through these electrodes, followed by calculation using formulas (1) and (2).
2. correction of welding torch movement. The task of side correction of the welding torch movement consists in eliminating the outlined deviations e1 and e2 (directly in the welding process). In other words, the task is to provide the movement of the electrodes E1 and E2 inside the «band» of a given width 2e0 (Fig-
ure 1), the axial line of which is the line of joint weld-ed.
Here it is necessary to pay attention to the fact that, unlike welding with one arc, it is necessary to correct not only the position of the electrodes E1 and E2 but also the orientation of the line connecting these elec-trodes with respect to the line of joint welded.
Mathematically, let us formulate the task of cor-rection in the form of the following requirements:
1
0
|,2
|
2
e + e≤ e
1
0sin ,2
de − e
≤ ϕ
where φ0 is the admissible value of the angle between the section d and the tangent to the line of joint welded.
The formulated problem can be interpreted as the problem of stabilizing the movement of electrodes E1 and E2 rigidly interconnected within a preset «band». With this formulation of the problem, the stabilization algorithms are conveniently constructed in the form of recurrent relations
( 1) ( ) ( 1),u k u k u k+ = + ∆ + (3)
( 1) ( ) ( 1), 0,1, 2, ..., .q k q k q k k+ = + ∆ + = (4)In these relations, u(k) is the position of the point
P located in the middle of the section d (see Figure 1), relative to the line of joint welded; q(k) = tgφ(k), where φ(k) is the angle between the section d and the tangent to the line of joint welded; k is the index indi-cating the moment of time kT0, where T0 is the step of time sampling;
0 0
0 0
0
, ( ( ) ),
( 1) ( ( ) ),
0, (| ( ) | ),
,
k
u k k
k
−e e > e∆ + = e e < −e e ≤ e
(5)
figure 1. Scheme of arrangement of electrodes relative to the joint welded (see indications in the text)
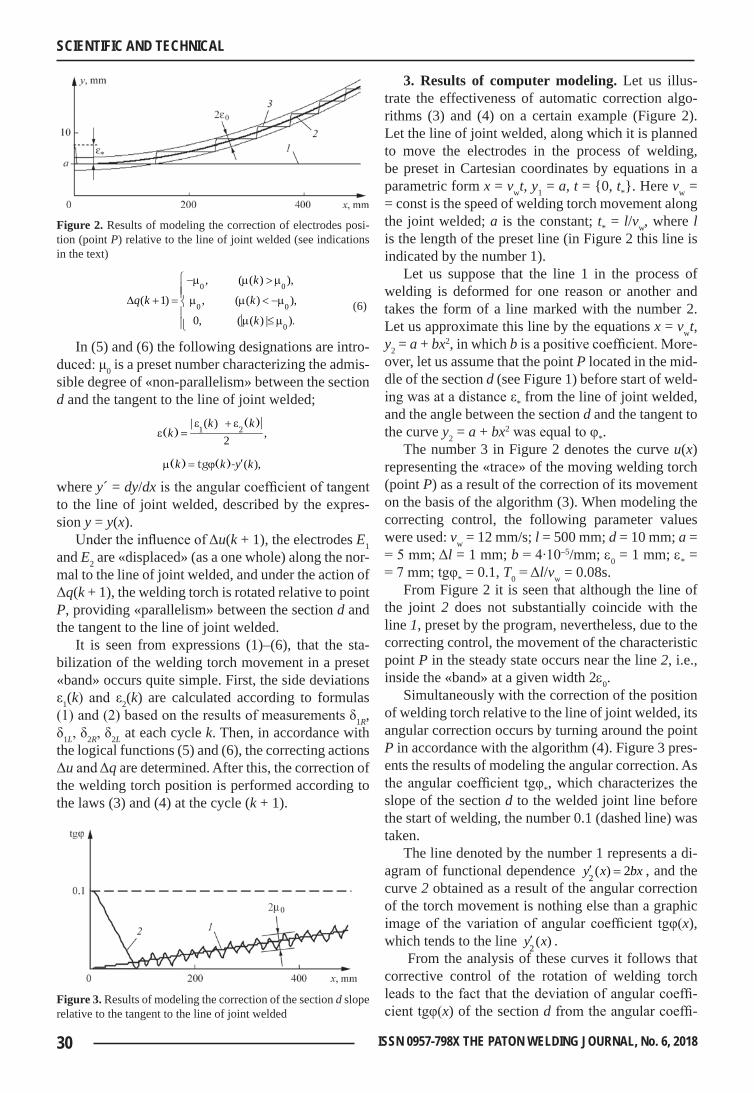
30 ISSN 0957-798X THE PATON WELDING JOURNAL, No. 6, 2018
SCIENTIFIC AND TECHNICAL
0 0
0 0
0
, ( ( ) ),
( 1) , ( ( ) ),
0, ( ( ) | )| .
k
q k k
k
−m m > m∆ + = m m < −m m ≤ m
(6)
In (5) and (6) the following designations are intro-duced: μ0 is a preset number characterizing the admis-sible degree of «non-parallelism» between the section d and the tangent to the line of joint welded;
1| ( )
,22
( )|( )
k kk
e + ee =
( ),( ) tg ( )-k k y k′m = ϕ where y´ = dy/dx is the angular coefficient of tangent to the line of joint welded, described by the expres-sion y = y(x).
Under the influence of Δu(k + 1), the electrodes E1 and E2 are «displaced» (as a one whole) along the nor-mal to the line of joint welded, and under the action of Δq(k + 1), the welding torch is rotated relative to point P, providing «parallelism» between the section d and the tangent to the line of joint welded.
It is seen from expressions (1)–(6), that the sta-bilization of the welding torch movement in a preset «band» occurs quite simple. First, the side deviations ε1(k) and ε2(k) are calculated according to formulas (1) and (2) based on the results of measurements δ1R, δ1L, δ2R, δ2L at each cycle k. Then, in accordance with the logical functions (5) and (6), the correcting actions Δu and Δq are determined. After this, the correction of the welding torch position is performed according to the laws (3) and (4) at the cycle (k + 1).
3. results of computer modeling. Let us illus-trate the effectiveness of automatic correction algo-rithms (3) and (4) on a certain example (Figure 2). Let the line of joint welded, along which it is planned to move the electrodes in the process of welding, be preset in Cartesian coordinates by equations in a parametric form x = vwt, y1 = a, t = {0, t*}. Here vw = = const is the speed of welding torch movement along the joint welded; a is the constant; t* = l/vw, where l is the length of the preset line (in Figure 2 this line is indicated by the number 1).
Let us suppose that the line 1 in the process of welding is deformed for one reason or another and takes the form of a line marked with the number 2. Let us approximate this line by the equations x = vwt, y2 = a + bx2, in which b is a positive coefficient. More-over, let us assume that the point P located in the mid-dle of the section d (see Figure 1) before start of weld-ing was at a distance ε* from the line of joint welded, and the angle between the section d and the tangent to the curve y2 = a + bx2 was equal to φ*.
The number 3 in Figure 2 denotes the curve u(x) representing the «trace» of the moving welding torch (point P) as a result of the correction of its movement on the basis of the algorithm (3). When modeling the correcting control, the following parameter values were used: vw = 12 mm/s; l = 500 mm; d = 10 mm; a = = 5 mm; Δl = 1 mm; b = 4∙10–5/mm; e0 = 1 mm; e* = = 7 mm; tgφ* = 0.1, T0 = Δl/vw = 0.08s.
From Figure 2 it is seen that although the line of the joint 2 does not substantially coincide with the line 1, preset by the program, nevertheless, due to the correcting control, the movement of the characteristic point P in the steady state occurs near the line 2, i.e., inside the «band» at a given width 2e0.
Simultaneously with the correction of the position of welding torch relative to the line of joint welded, its angular correction occurs by turning around the point P in accordance with the algorithm (4). Figure 3 pres-ents the results of modeling the angular correction. As the angular coefficient tgφ*, which characterizes the slope of the section d to the welded joint line before the start of welding, the number 0.1 (dashed line) was taken.
The line denoted by the number 1 represents a di-agram of functional dependence 2 ( ) 2y x bx′ = , and the curve 2 obtained as a result of the angular correction of the torch movement is nothing else than a graphic image of the variation of angular coefficient tgφ(x), which tends to the line 2 ( )y x′ .
From the analysis of these curves it follows that corrective control of the rotation of welding torch leads to the fact that the deviation of angular coeffi-cient tgφ(x) of the section d from the angular coeffi-
figure 2. Results of modeling the correction of electrodes posi-tion (point P) relative to the line of joint welded (see indications in the text)
figure 3. Results of modeling the correction of the section d slope relative to the tangent to the line of joint welded
31ISSN 0957-798X THE PATON WELDING JOURNAL, No. 6, 2018
SCIENTIFIC AND TECHNICAL
cient of the tangent to the welded joint line 2 ( )y x′ in the steady state does not exceed the preset value.
Therefore, the general conclusion follows that due to the use of arc sensors as a source of present in-formation about the deviations of electrodes from the line of joint welded and the application of recurrent procedures for correcting the movement of welding torch, control of tandem arc welding acquires adap-tive properties. Its peculiarity consists in the fact that not only the positions of electrodes (as a one whole) are corrected in the welding process, but also their orientation relative to the line of joint welded, which provides a high accuracy of electrodes movement along the joint welded. This creates prerequisites for the provision of sufficiently high technological indi-cators inherent in tandem arc welding.
1. Dilthey, U., Stein, L., Woeste, K., Reich, F. (2003) Latest de-velopment and trends in high-efficient welding technologies. The Paton Welding J., 10–11, 146–152.
2. Tsybulkin, G.A. (2014) Adaptive control in arc welding. Kiev, Stal [in Russian].
3. Kobe Steel Company. http://www.kobelco.co.jp/english/weld-ing/files/KWT_2012_2TH.pdf
4. Akulov, L.M., Bukhovets, T.K., Stolovich, A.Yu. (2001) Sys-tem of weld line tracking by arc. In: Proc. of 2nd Int. Symp. on Welding and Related Technologies (Minsk, Belarus), 136–137 [in Russian].
5. Dolinenko, V.V. (1989) Evaluation and control of torch posi-tion using electric parameters of welding arc: Syn. Of Thesis for Cand. of Techn. Sci. Degree. Kiev [in Russian].
6. Yongyi, A., Li, Y. (1991) Arc sensor used in MIG/MAG weld tracking. Transact. China Welding Inst., 12(3), 155–160.
7. Sugitani, Y. (2000) Making best use of the arc sensor. J. of the Jap. Weld. Soc., 69(2), 46–50.
8. Tsybulkin, G.A. (2011) Arc sensor systems for welding ro-bots. Kiev, Stal [in Russian].
Received 25.04.2018
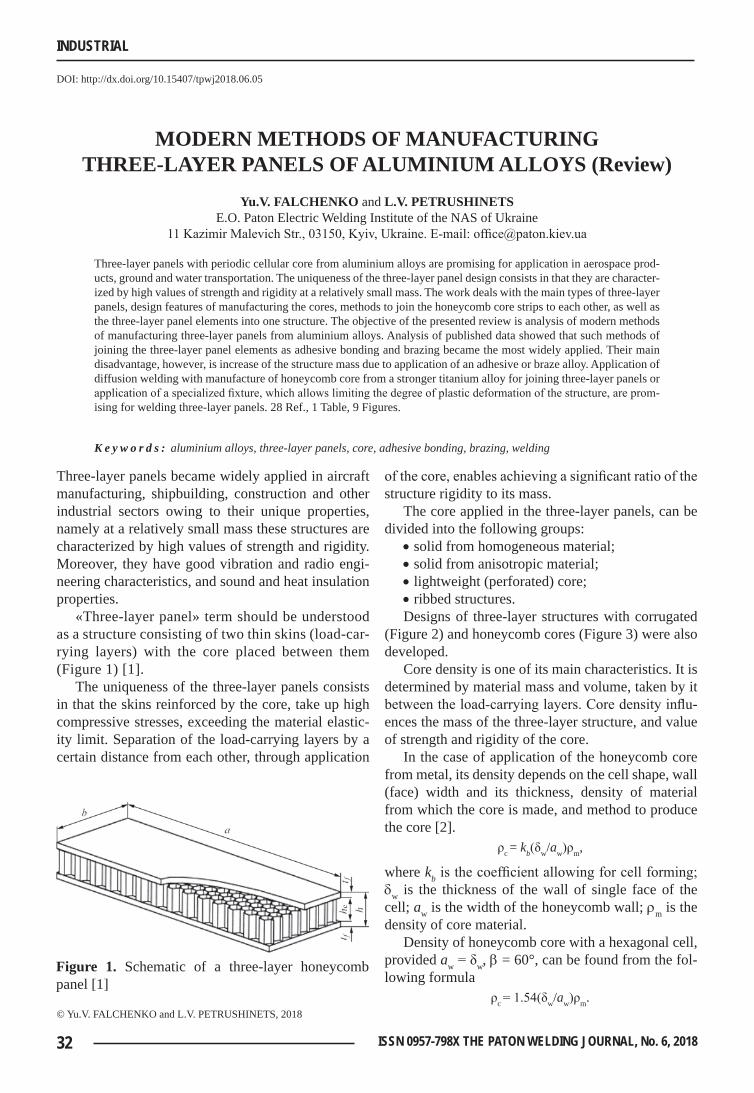
32 ISSN 0957-798X THE PATON WELDING JOURNAL, No. 6, 2018
INDUSTRIAL
DOI: http://dx.doi.org/10.15407/tpwj2018.06.05
ModErn MEthods of Manufacturing thrEE-layEr panEls of aluMiniuM alloys (review)
yu.v. falchEnko and l.v. pEtrushinEtsE.O. Paton Electric Welding Institute of the NAS of Ukraine
11 Kazimir Malevich Str., 03150, Kyiv, Ukraine. E-mail: [email protected]
Three-layer panels with periodic cellular core from aluminium alloys are promising for application in aerospace prod-ucts, ground and water transportation. The uniqueness of the three-layer panel design consists in that they are character-ized by high values of strength and rigidity at a relatively small mass. The work deals with the main types of three-layer panels, design features of manufacturing the cores, methods to join the honeycomb core strips to each other, as well as the three-layer panel elements into one structure. The objective of the presented review is analysis of modern methods of manufacturing three-layer panels from aluminium alloys. Analysis of published data showed that such methods of joining the three-layer panel elements as adhesive bonding and brazing became the most widely applied. Their main disadvantage, however, is increase of the structure mass due to application of an adhesive or braze alloy. Application of diffusion welding with manufacture of honeycomb core from a stronger titanium alloy for joining three-layer panels or application of a specialized fixture, which allows limiting the degree of plastic deformation of the structure, are prom-ising for welding three-layer panels. 28 Ref., 1 Table, 9 Figures.
K e y w o r d s : aluminium alloys, three-layer panels, core, adhesive bonding, brazing, welding
Three-layer panels became widely applied in aircraft manufacturing, shipbuilding, construction and other industrial sectors owing to their unique properties, namely at a relatively small mass these structures are characterized by high values of strength and rigidity. Moreover, they have good vibration and radio engi-neering characteristics, and sound and heat insulation properties.
«Three-layer panel» term should be understood as a structure consisting of two thin skins (load-car-rying layers) with the core placed between them (Figure 1) [1].
The uniqueness of the three-layer panels consists in that the skins reinforced by the core, take up high compressive stresses, exceeding the material elastic-ity limit. Separation of the load-carrying layers by a certain distance from each other, through application
of the core, enables achieving a significant ratio of the structure rigidity to its mass.
The core applied in the three-layer panels, can be divided into the following groups:
• solid from homogeneous material;• solid from anisotropic material;• lightweight (perforated) core;• ribbed structures.Designs of three-layer structures with corrugated
(Figure 2) and honeycomb cores (Figure 3) were also developed.
Core density is one of its main characteristics. It is determined by material mass and volume, taken by it between the load-carrying layers. Core density influ-ences the mass of the three-layer structure, and value of strength and rigidity of the core.
In the case of application of the honeycomb core from metal, its density depends on the cell shape, wall (face) width and its thickness, density of material from which the core is made, and method to produce the core [2]. ρc = kb(δw/aw)ρm,
where kb is the coefficient allowing for cell forming; dw is the thickness of the wall of single face of the cell; aw is the width of the honeycomb wall; rm is the density of core material.
Density of honeycomb core with a hexagonal cell, provided aw = δw, b = 60°, can be found from the fol-lowing formula ρc = 1.54(δw/aw)ρm.
© Yu.V. FALCHENKO and L.V. PETRUSHINETS, 2018
figure 1. Schematic of a three-layer honeycomb panel [1]
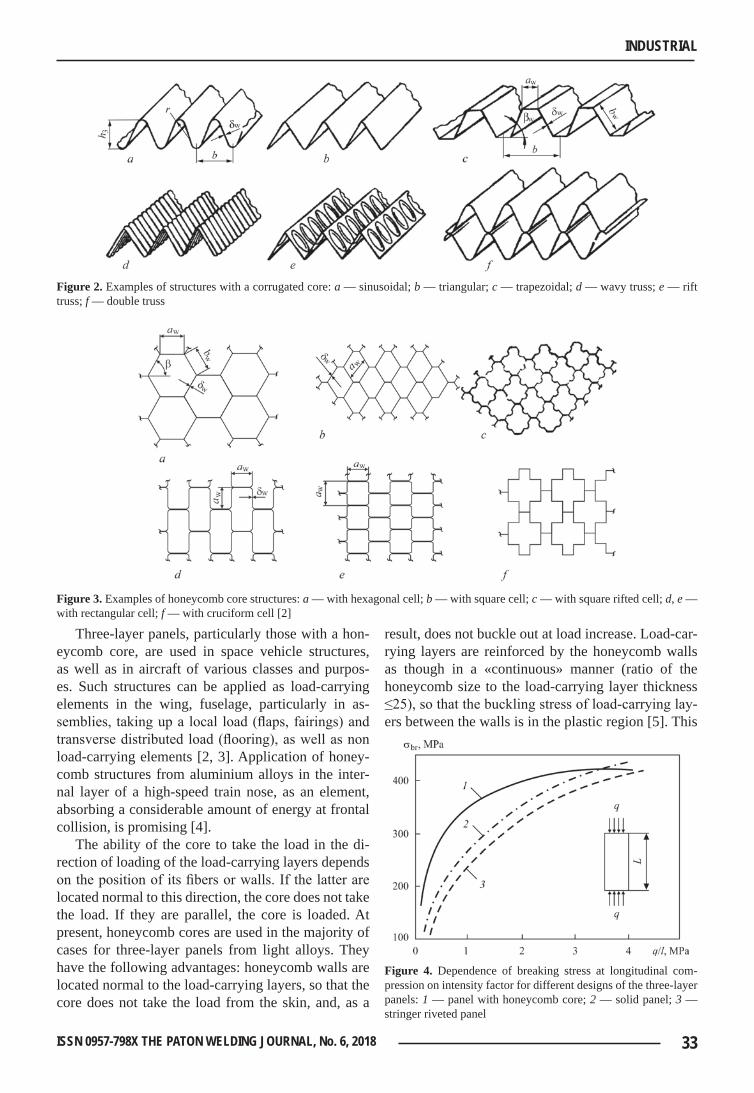
33ISSN 0957-798X THE PATON WELDING JOURNAL, No. 6, 2018
INDUSTRIAL
Three-layer panels, particularly those with a hon-eycomb core, are used in space vehicle structures, as well as in aircraft of various classes and purpos-es. Such structures can be applied as load-carrying elements in the wing, fuselage, particularly in as-semblies, taking up a local load (flaps, fairings) and transverse distributed load (flooring), as well as non load-carrying elements [2, 3]. Application of honey-comb structures from aluminium alloys in the inter-nal layer of a high-speed train nose, as an element, absorbing a considerable amount of energy at frontal collision, is promising [4].
The ability of the core to take the load in the di-rection of loading of the load-carrying layers depends on the position of its fibers or walls. If the latter are located normal to this direction, the core does not take the load. If they are parallel, the core is loaded. At present, honeycomb cores are used in the majority of cases for three-layer panels from light alloys. They have the following advantages: honeycomb walls are located normal to the load-carrying layers, so that the core does not take the load from the skin, and, as a
result, does not buckle out at load increase. Load-car-rying layers are reinforced by the honeycomb walls as though in a «continuous» manner (ratio of the honeycomb size to the load-carrying layer thickness ≤25), so that the buckling stress of load-carrying lay-ers between the walls is in the plastic region [5]. This
figure 2. Examples of structures with a corrugated core: a — sinusoidal; b — triangular; c — trapezoidal; d — wavy truss; e — rift truss; f — double truss
figure 3. Examples of honeycomb core structures: a — with hexagonal cell; b — with square cell; c — with square rifted cell; d, e — with rectangular cell; f — with cruciform cell [2]
figure 4. Dependence of breaking stress at longitudinal com-pression on intensity factor for different designs of the three-layer panels: 1 — panel with honeycomb core; 2 — solid panel; 3 — stringer riveted panel
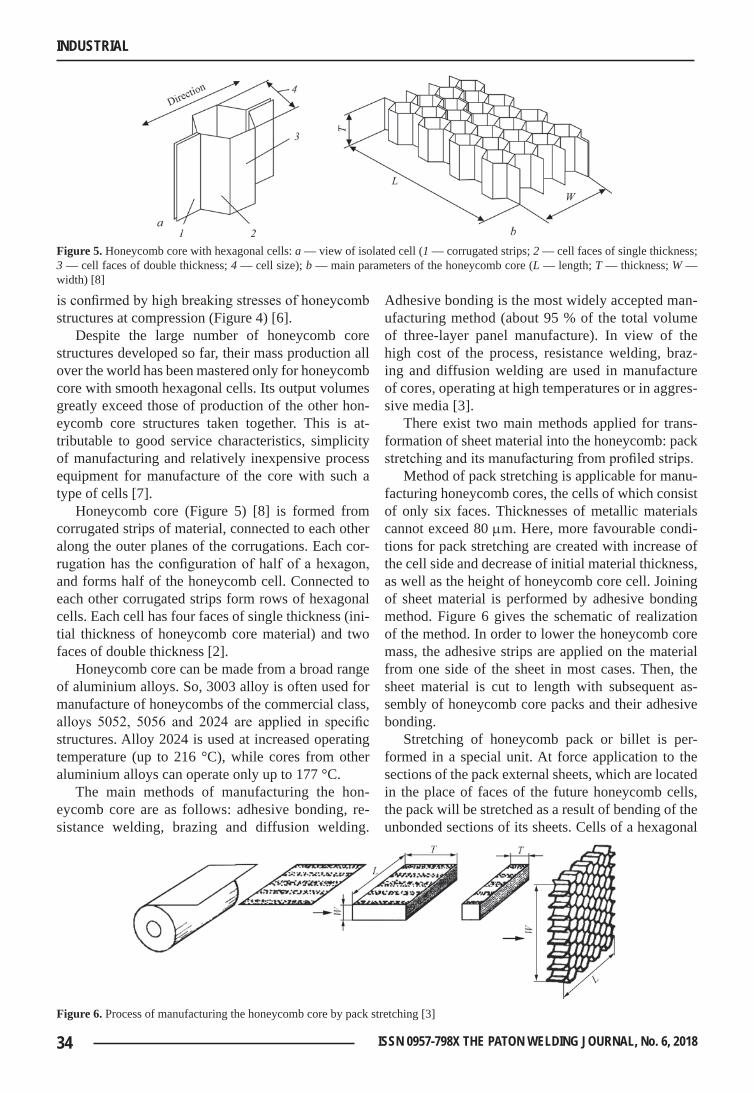
34 ISSN 0957-798X THE PATON WELDING JOURNAL, No. 6, 2018
INDUSTRIAL
is confirmed by high breaking stresses of honeycomb structures at compression (Figure 4) [6].
Despite the large number of honeycomb core structures developed so far, their mass production all over the world has been mastered only for honeycomb core with smooth hexagonal cells. Its output volumes greatly exceed those of production of the other hon-eycomb core structures taken together. This is at-tributable to good service characteristics, simplicity of manufacturing and relatively inexpensive process equipment for manufacture of the core with such a type of cells [7].
Honeycomb core (Figure 5) [8] is formed from corrugated strips of material, connected to each other along the outer planes of the corrugations. Each cor-rugation has the configuration of half of a hexagon, and forms half of the honeycomb cell. Connected to each other corrugated strips form rows of hexagonal cells. Each cell has four faces of single thickness (ini-tial thickness of honeycomb core material) and two faces of double thickness [2].
Honeycomb core can be made from a broad range of aluminium alloys. So, 3003 alloy is often used for manufacture of honeycombs of the commercial class, alloys 5052, 5056 and 2024 are applied in specific structures. Alloy 2024 is used at increased operating temperature (up to 216 °C), while cores from other aluminium alloys can operate only up to 177 °C.
The main methods of manufacturing the hon-eycomb core are as follows: adhesive bonding, re-sistance welding, brazing and diffusion welding.
Adhesive bonding is the most widely accepted man-ufacturing method (about 95 % of the total volume of three-layer panel manufacture). In view of the high cost of the process, resistance welding, braz-ing and diffusion welding are used in manufacture of cores, operating at high temperatures or in aggres-sive media [3].
There exist two main methods applied for trans-formation of sheet material into the honeycomb: pack stretching and its manufacturing from profiled strips.
Method of pack stretching is applicable for manu-facturing honeycomb cores, the cells of which consist of only six faces. Thicknesses of metallic materials cannot exceed 80 mm. Here, more favourable condi-tions for pack stretching are created with increase of the cell side and decrease of initial material thickness, as well as the height of honeycomb core cell. Joining of sheet material is performed by adhesive bonding method. Figure 6 gives the schematic of realization of the method. In order to lower the honeycomb core mass, the adhesive strips are applied on the material from one side of the sheet in most cases. Then, the sheet material is cut to length with subsequent as-sembly of honeycomb core packs and their adhesive bonding.
Stretching of honeycomb pack or billet is per-formed in a special unit. At force application to the sections of the pack external sheets, which are located in the place of faces of the future honeycomb cells, the pack will be stretched as a result of bending of the unbonded sections of its sheets. Cells of a hexagonal
figure 5. Honeycomb core with hexagonal cells: a — view of isolated cell (1 — corrugated strips; 2 — cell faces of single thickness; 3 — cell faces of double thickness; 4 — cell size); b — main parameters of the honeycomb core (L — length; T — thickness; W — width) [8]
figure 6. Process of manufacturing the honeycomb core by pack stretching [3]
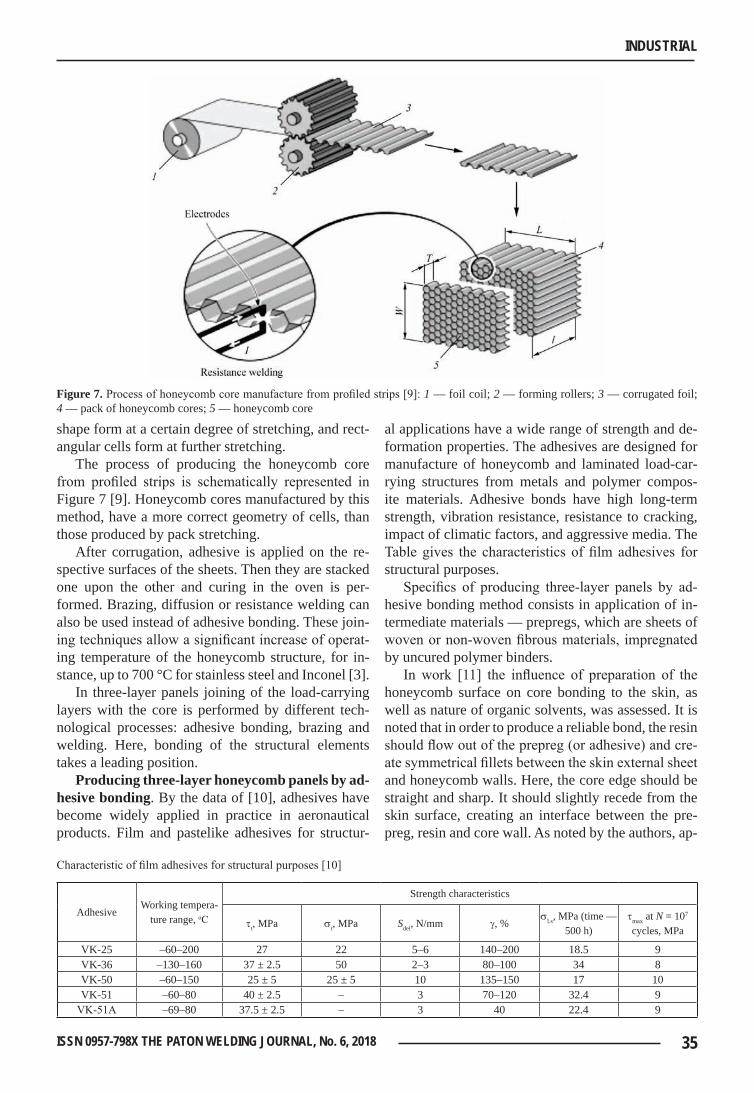
35ISSN 0957-798X THE PATON WELDING JOURNAL, No. 6, 2018
INDUSTRIAL
shape form at a certain degree of stretching, and rect-angular cells form at further stretching.
The process of producing the honeycomb core from profiled strips is schematically represented in Figure 7 [9]. Honeycomb cores manufactured by this method, have a more correct geometry of cells, than those produced by pack stretching.
After corrugation, adhesive is applied on the re-spective surfaces of the sheets. Then they are stacked one upon the other and curing in the oven is per-formed. Brazing, diffusion or resistance welding can also be used instead of adhesive bonding. These join-ing techniques allow a significant increase of operat-ing temperature of the honeycomb structure, for in-stance, up to 700 °C for stainless steel and Inconel [3].
In three-layer panels joining of the load-carrying layers with the core is performed by different tech-nological processes: adhesive bonding, brazing and welding. Here, bonding of the structural elements takes a leading position.
producing three-layer honeycomb panels by ad-hesive bonding. By the data of [10], adhesives have become widely applied in practice in aeronautical products. Film and pastelike adhesives for structur-
al applications have a wide range of strength and de-formation properties. The adhesives are designed for manufacture of honeycomb and laminated load-car-rying structures from metals and polymer compos-ite materials. Adhesive bonds have high long-term strength, vibration resistance, resistance to cracking, impact of climatic factors, and aggressive media. The Table gives the characteristics of film adhesives for structural purposes.
Specifics of producing three-layer panels by ad-hesive bonding method consists in application of in-termediate materials — prepregs, which are sheets of woven or non-woven fibrous materials, impregnated by uncured polymer binders.
In work [11] the influence of preparation of the honeycomb surface on core bonding to the skin, as well as nature of organic solvents, was assessed. It is noted that in order to produce a reliable bond, the resin should flow out of the prepreg (or adhesive) and cre-ate symmetrical fillets between the skin external sheet and honeycomb walls. Here, the core edge should be straight and sharp. It should slightly recede from the skin surface, creating an interface between the pre-preg, resin and core wall. As noted by the authors, ap-
figure 7. Process of honeycomb core manufacture from profiled strips [9]: 1 — foil coil; 2 — forming rollers; 3 — corrugated foil; 4 — pack of honeycomb cores; 5 — honeycomb core
Characteristic of film adhesives for structural purposes [10]
AdhesiveWorking tempera-
ture range, оС
Strength characteristics
tt, MPa st, MPa Sdel, N/mm g, %sl.s, MPa (time —
500 h)tmax at N = 107 cycles, MPa
VK-25 –60–200 27 22 5–6 140–200 18.5 9VK-36 –130–160 37 ± 2.5 50 2–3 80–100 34 8VK-50 –60–150 25 ± 5 25 ± 5 10 135–150 17 10VK-51 –60–80 40 ± 2.5 – 3 70–120 32.4 9
VK-51А –69–80 37.5 ± 2.5 – 3 40 22.4 9
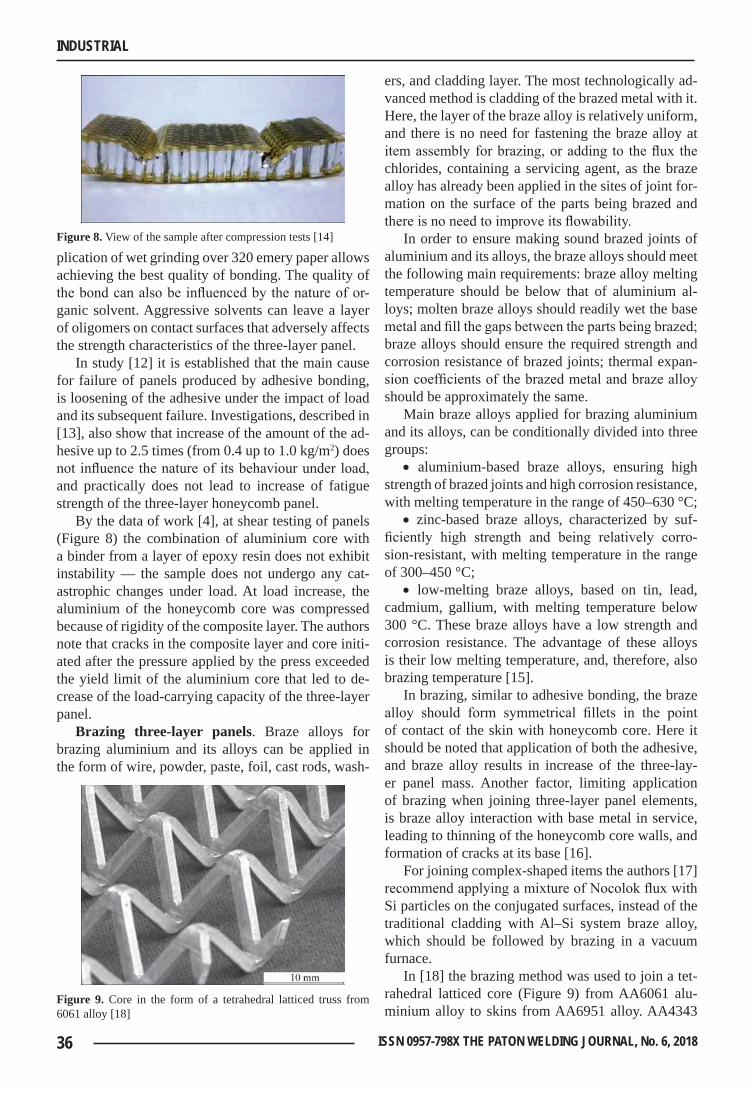
36 ISSN 0957-798X THE PATON WELDING JOURNAL, No. 6, 2018
INDUSTRIAL
plication of wet grinding over 320 emery paper allows achieving the best quality of bonding. The quality of the bond can also be influenced by the nature of or-ganic solvent. Aggressive solvents can leave a layer of oligomers on contact surfaces that adversely affects the strength characteristics of the three-layer panel.
In study [12] it is established that the main cause for failure of panels produced by adhesive bonding, is loosening of the adhesive under the impact of load and its subsequent failure. Investigations, described in [13], also show that increase of the amount of the ad-hesive up to 2.5 times (from 0.4 up to 1.0 kg/m2) does not influence the nature of its behaviour under load, and practically does not lead to increase of fatigue strength of the three-layer honeycomb panel.
By the data of work [4], at shear testing of panels (Figure 8) the combination of aluminium core with a binder from a layer of epoxy resin does not exhibit instability — the sample does not undergo any cat-astrophic changes under load. At load increase, the aluminium of the honeycomb core was compressed because of rigidity of the composite layer. The authors note that cracks in the composite layer and core initi-ated after the pressure applied by the press exceeded the yield limit of the aluminium core that led to de-crease of the load-carrying capacity of the three-layer panel.
Brazing three-layer panels. Braze alloys for brazing aluminium and its alloys can be applied in the form of wire, powder, paste, foil, cast rods, wash-
ers, and cladding layer. The most technologically ad-vanced method is cladding of the brazed metal with it. Here, the layer of the braze alloy is relatively uniform, and there is no need for fastening the braze alloy at item assembly for brazing, or adding to the flux the chlorides, containing a servicing agent, as the braze alloy has already been applied in the sites of joint for-mation on the surface of the parts being brazed and there is no need to improve its flowability.
In order to ensure making sound brazed joints of aluminium and its alloys, the braze alloys should meet the following main requirements: braze alloy melting temperature should be below that of aluminium al-loys; molten braze alloys should readily wet the base metal and fill the gaps between the parts being brazed; braze alloys should ensure the required strength and corrosion resistance of brazed joints; thermal expan-sion coefficients of the brazed metal and braze alloy should be approximately the same.
Main braze alloys applied for brazing aluminium and its alloys, can be conditionally divided into three groups:
• aluminium-based braze alloys, ensuring high strength of brazed joints and high corrosion resistance, with melting temperature in the range of 450–630 °C;
• zinc-based braze alloys, characterized by suf-ficiently high strength and being relatively corro-sion-resistant, with melting temperature in the range of 300–450 °C;
• low-melting braze alloys, based on tin, lead, cadmium, gallium, with melting temperature below 300 °C. These braze alloys have a low strength and corrosion resistance. The advantage of these alloys is their low melting temperature, and, therefore, also brazing temperature [15].
In brazing, similar to adhesive bonding, the braze alloy should form symmetrical fillets in the point of contact of the skin with honeycomb core. Here it should be noted that application of both the adhesive, and braze alloy results in increase of the three-lay-er panel mass. Another factor, limiting application of brazing when joining three-layer panel elements, is braze alloy interaction with base metal in service, leading to thinning of the honeycomb core walls, and formation of cracks at its base [16].
For joining complex-shaped items the authors [17] recommend applying a mixture of Nocolok flux with Si particles on the conjugated surfaces, instead of the traditional cladding with Al–Si system braze alloy, which should be followed by brazing in a vacuum furnace.
In [18] the brazing method was used to join a tet-rahedral latticed core (Figure 9) from AA6061 alu-minium alloy to skins from AA6951 alloy. AA4343
figure 8. View of the sample after compression tests [14]
figure 9. Core in the form of a tetrahedral latticed truss from 6061 alloy [18]
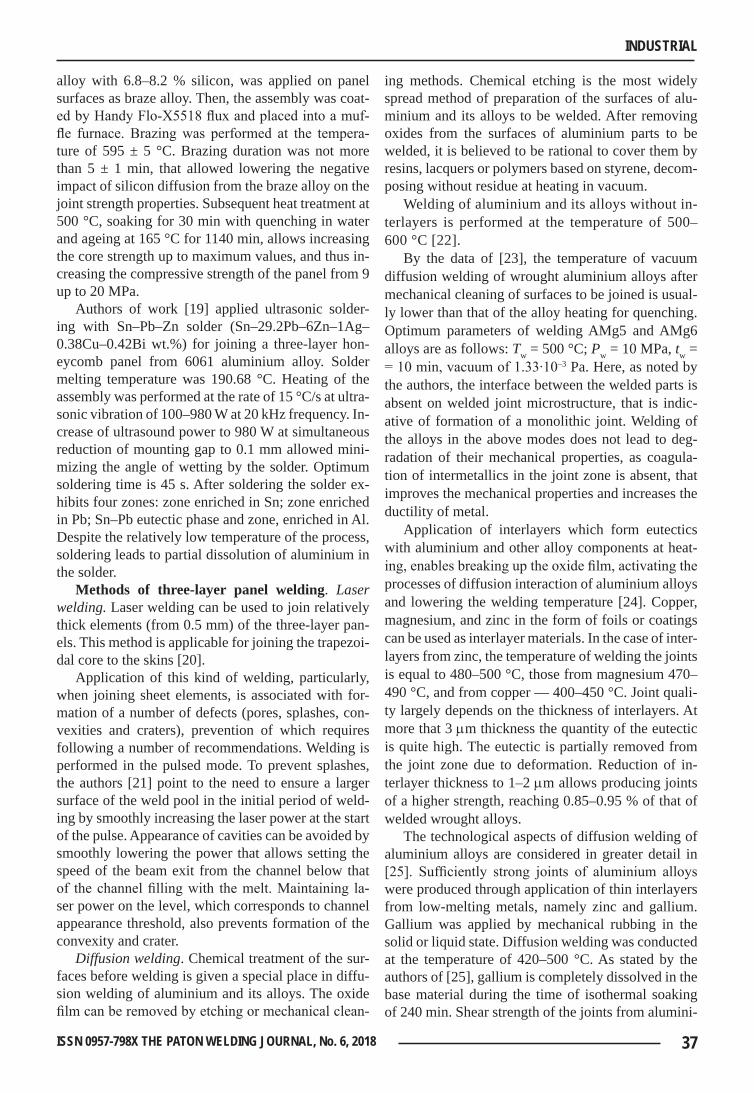
37ISSN 0957-798X THE PATON WELDING JOURNAL, No. 6, 2018
INDUSTRIAL
alloy with 6.8–8.2 % silicon, was applied on panel surfaces as braze alloy. Then, the assembly was coat-ed by Handy Flo-X5518 flux and placed into a muf-fle furnace. Brazing was performed at the tempera-ture of 595 ± 5 °C. Brazing duration was not more than 5 ± 1 min, that allowed lowering the negative impact of silicon diffusion from the braze alloy on the joint strength properties. Subsequent heat treatment at 500 °C, soaking for 30 min with quenching in water and ageing at 165 °C for 1140 min, allows increasing the core strength up to maximum values, and thus in-creasing the compressive strength of the panel from 9 up to 20 MPa.
Authors of work [19] applied ultrasonic solder-ing with Sn–Pb–Zn solder (Sn–29.2Pb–6Zn–1Ag–0.38Cu–0.42Bi wt.%) for joining a three-layer hon-eycomb panel from 6061 aluminium alloy. Solder melting temperature was 190.68 °C. Heating of the assembly was performed at the rate of 15 °C/s at ultra-sonic vibration of 100–980 W at 20 kHz frequency. In-crease of ultrasound power to 980 W at simultaneous reduction of mounting gap to 0.1 mm allowed mini-mizing the angle of wetting by the solder. Optimum soldering time is 45 s. After soldering the solder ex-hibits four zones: zone enriched in Sn; zone enriched in Pb; Sn–Pb eutectic phase and zone, enriched in Al. Despite the relatively low temperature of the process, soldering leads to partial dissolution of aluminium in the solder.
Methods of three-layer panel welding. Laser welding. Laser welding can be used to join relatively thick elements (from 0.5 mm) of the three-layer pan-els. This method is applicable for joining the trapezoi-dal core to the skins [20].
Application of this kind of welding, particularly, when joining sheet elements, is associated with for-mation of a number of defects (pores, splashes, con-vexities and craters), prevention of which requires following a number of recommendations. Welding is performed in the pulsed mode. To prevent splashes, the authors [21] point to the need to ensure a larger surface of the weld pool in the initial period of weld-ing by smoothly increasing the laser power at the start of the pulse. Appearance of cavities can be avoided by smoothly lowering the power that allows setting the speed of the beam exit from the channel below that of the channel filling with the melt. Maintaining la-ser power on the level, which corresponds to channel appearance threshold, also prevents formation of the convexity and crater.
Diffusion welding. Chemical treatment of the sur-faces before welding is given a special place in diffu-sion welding of aluminium and its alloys. The oxide film can be removed by etching or mechanical clean-
ing methods. Chemical etching is the most widely spread method of preparation of the surfaces of alu-minium and its alloys to be welded. After removing oxides from the surfaces of aluminium parts to be welded, it is believed to be rational to cover them by resins, lacquers or polymers based on styrene, decom-posing without residue at heating in vacuum.
Welding of aluminium and its alloys without in-terlayers is performed at the temperature of 500–600 °C [22].
By the data of [23], the temperature of vacuum diffusion welding of wrought aluminium alloys after mechanical cleaning of surfaces to be joined is usual-ly lower than that of the alloy heating for quenching. Optimum parameters of welding AMg5 and AMg6 alloys are as follows: Tw = 500 °C; Pw = 10 MPa, tw = = 10 min, vacuum of 1.33∙10–3 Pa. Here, as noted by the authors, the interface between the welded parts is absent on welded joint microstructure, that is indic-ative of formation of a monolithic joint. Welding of the alloys in the above modes does not lead to deg-radation of their mechanical properties, as coagula-tion of intermetallics in the joint zone is absent, that improves the mechanical properties and increases the ductility of metal.
Application of interlayers which form eutectics with aluminium and other alloy components at heat-ing, enables breaking up the oxide film, activating the processes of diffusion interaction of aluminium alloys and lowering the welding temperature [24]. Copper, magnesium, and zinc in the form of foils or coatings can be used as interlayer materials. In the case of inter-layers from zinc, the temperature of welding the joints is equal to 480–500 °C, those from magnesium 470–490 °C, and from copper — 400–450 °C. Joint quali-ty largely depends on the thickness of interlayers. At more that 3 mm thickness the quantity of the eutectic is quite high. The eutectic is partially removed from the joint zone due to deformation. Reduction of in-terlayer thickness to 1–2 mm allows producing joints of a higher strength, reaching 0.85–0.95 % of that of welded wrought alloys.
The technological aspects of diffusion welding of aluminium alloys are considered in greater detail in [25]. Sufficiently strong joints of aluminium alloys were produced through application of thin interlayers from low-melting metals, namely zinc and gallium. Gallium was applied by mechanical rubbing in the solid or liquid state. Diffusion welding was conducted at the temperature of 420–500 °C. As stated by the authors of [25], gallium is completely dissolved in the base material during the time of isothermal soaking of 240 min. Shear strength of the joints from alumini-
38 ISSN 0957-798X THE PATON WELDING JOURNAL, No. 6, 2018
INDUSTRIAL
um-magnesium alloys AMg6 and 01570 through gal-lium underlayer is equal to 180–210 MPa.
More effective is application of a copper interlay-er of 0.8–1.0 mm thickness. At isothermal soaking for 20–30 min and diffusion welding temperature of 500 °C, the process of material recrystallization is ac-tively developing in the joint zone.
Analyzing the results of Auger spectral analysis the authors come to the conclusion that Al–Mg–Cu alloy of eutectic composition forms on the contact boundary as a result of interdiffusion at the stage of isothermal soaking. Presence of the liquid phase pro-motes breaking up of the oxide film.
Effect of superplasticity is realized in welding 01570 alloy. Recrystallization of the alloy joint zone occurs at the temperature of 472–477 °C and pro-ceeds actively at contact with thin copper interlayer. Strength at shear testing of the joint of 01570 alloy through an interlayer of copper 1 mm thick reaches 260 MPa. Readily reproducible values (± 15 MPa) are achieved in the case, if the coating is applied on both the surfaces being joined (0.5 mm on each).
Work [26] gives the results of studies on diffusion welding in vacuum of three-layer panels with plate-like, cellular and corrugated cores, produced with application of forming devices. Investigations were conducted on alloys of Al–Mg, Al–Zn–Mg, and Al–Cu–Mg systems. Sheet thickness was equal to 2 mm, panel size was 500x500 mm, building height was up to 30 mm. Prior to welding the blanks were degreased with subsequent chemical etching in 70 % nitric acid. Then ion etching was performed on the respective surfaces of the skins and core, which was followed by deposition of copper (or mechanical cleaning by a metal brush). Diffusion welding was conducted in the following mode: welding temperature of 500–510 °C, pressure of 5–10 MPa, and welding time from 30 to 60 min. In welding sheet blanks common grains form in the joint zone in all three cases, and isolated discontinuities are also observed in the alloy of Al–Mg system. Subsequent heat treatment of the joints from alloys of Al–Zn–Mg and Al–Cu–Mg systems (quenching + ageing) allows increasing strength up to the level close to the base material. Shown is the possibility of producing a sound joint of aluminium alloys without a copper underlayer, due to increasing the degree of deformation. Samples in which metal deformation in the joint zone was equal to 70–90 % (370–420 MPa) had maximum shear strength.
Proceeding from the above, one can come to the conclusion that diffusion welding in vacuum is a promising method for joining the skins to the thin-walled core, as this process does not have the weight-ing and weakening effect of the adhesive and braze
alloy on the performance of the three-layer panel. However, as was shown above, at diffusion welding of aluminium alloys the recommended parameters are temperature Tw = 500–600 °C, and specific pressure Pw = 5–10 MPa. These parameters of the process can-not be applied in welding the three-layer panels from aluminium alloys, because of the loss of stability by the thin-walled core, that makes it necessary to low-er the heating temperature and search for technolog-ical solutions, that would provide a permanent joint. Solution of the arisen problem can be application of forming devices that will allow avoiding unlimited deformation of the core [27], or welding of combined panels, in which the honeycomb core is made of a stronger material, for instance, titanium alloy, and the skin is from aluminium alloy [28]. During welding at the respective temperature under pressure the titani-um alloy ribs are embedded into the aluminium alloy, and the aluminium fills all the gaps between the pro-trusions due to creep. This process is accompanied by fragmentation of the brittle oxide film on aluminium, thus promoting formation of a strong joint.
1. Paik, J.K., Thaymballi, A.K., Kim, G.S. (1999) The strength characteristics of aluminum honeycomb sandwich panels. Thin-Walled Structures, 35, 205–231.
2. Panin, V.F., Gladkov, Yu.A. (1991) Structures with filler ma-terial: Refer. book. Moscow, Mashinostroenie [in Russian].
3. Bitzer, T. (1997) Honeycomb technology. Materials, de-sign, manufacturing, applications and testing. Springer-Sci-ence+Business Media Dordrecht.
4. Amraei, M., Shahravi, M., Noori, Z. et al. (2013) Applica-tion of aluminium honeycomb sandwich panel as an energy absorber of high-speed train nose. J. of Composite Materials, 48(9), 1027–1037.
5. Khertel G. (1965) Thin-walled structures (structural ele-ments, determination of accurate sizes and design in aircraft construction and other engineering fields). Moscow, Mashi-nostroenie [in Russian].
6. Slivinsky, V.I., Tkachenko, G.V., Slivinsky, M.V. (2005) Effi-ciency of application of honeycomb structures in flying vehi-cles. Vestnik Sib. Aerokosmich. Un-ta im. Akad. M.F. Reshetn-yova, 4, 169–173 [in Russian].
7. Ivanov, A.A., Kashin, S.M., Semenov, V.I. (2000) New gen-eration of honeycomb filler materials for aerospace engineer-ing. Moscow, Energoatomizdat [in Russian].
8. Kindinger, J. (2001) Lightweight structural cores. ASM Hand-book, Vol. 21: Composites, 3, 180–183.
9. Haydn N.G.Wadleya, Norman, A. Fleckb, Anthony G. Evans (2003) Fabrication and structural performance of periodic cel-lular metal sandwich structures. Composite Sci. and Technol-ogy, 63, 2331–2343.
10. Lukina, N.F., Anikhovskaya, L.I., Dementieva, L.A. et al. (2007) Adhesives and adhesive materials for items of aircraft engineering. Svarochn. Proizvodstvo, 5, 19–27 [in Russian].
11. Khan, S., Loken H.Y. (2007) Bonding of sandwich struc-tures — the facesheet/honeycomb interface — a phenome-nological study. In: Proc. of SAMPE 2007 (Baltimore, June 2007), 1–9.
12. Yi-Ming Jen, Li-Yen Chang (2009) Effect of thickness of face sheet on the bending fatigue strength of aluminum hon-
39ISSN 0957-798X THE PATON WELDING JOURNAL, No. 6, 2018
INDUSTRIAL
eycomb sandwich beams. Engineering Failure Analysis, 16, 1282–1293.
13. Yi-Ming Jen, Chin-Wei Ko, Hong-Bin Lin (2009) Effect of the amount of adhesive on the bending fatigue strength of ad-hesively bonded aluminum honeycomb sandwich beams. Int. J. of Fatigue. 31, 455–462.
14. Shuliang Cheng, Xuya Zhao, Yajun Xin et al. (2015) Experi-mental study on shear property of integrated sandwich panel of aluminum honeycomb and epoxy resin. The Open Mechan-ical Engin. J., 9, 1000–1006.
15. Nikitinsky, A.M. (1983) Brazing of aluminium and its alloys. Moscow, Mashinostroenie [in Russian].
16. Sporer, D., Fortuna, D. (2014) Selecting materials for brazing a honeycomb in turbine engines. Welding J., 93(2), 44–48.
17. Kumagai, M. (2003) Recent technological developments in welding of aluminium and its alloys. Welding Int., 17(3), 173–181.
18. Gregory, W. Kooistra,Vikram, S. Deshpande, Haydn N.G. Wadley (2004) Compressive behavior of age hardenable tet-rahedral lattice truss structures made from aluminium. Acta Materialia, 52, 4229–4237.
19. Ding Min, Zhang Pei-lei, Zhang Zhen-Yu et al. (2010) A nov-el assembly technology of aluminum alloy honeycomb struc-ture. Int. J. Adv. Manuf. Technol., 46, 1253–1258.
20. Ferraris, S., Volpone, L.M. (2005) Aluminum alloys in third millennium shipbuilding: Materials, technologies, perspec-
tives. In: Proc. of 5th Int. Forum on Aluminium Ships (Tokyo, Japan, 11–13 October 2005), 1–11.
21. Levin, Yu.Yu., Erofeev, V.A. (2008) Calculation of parame-ters of pulsed laser welding of thin aluminium alloys. Sva-rochn. Proizvodstvo, 4, 20–24 [in Russian].
22. Bachin, V.A., Kvasnitsky, V.F., Kotelnikov, D.I. et al. (1991) Theory, technology and equipment for diffusion welding. Moscow, Mashinostroenie [in Russian].
23. Kozakov, N.F. (1968) Diffusion welding in vacuum. Moscow, Mashinostroenie [in Russian].
24. Gurevich, S.M. (1990) Reference book on welding. Kiev, Naukova Dumka [in Russian].
25. Sergeev, A.V. (1990) Diffusion welding of aluminium alloys. In: Achievements and perspectives of development of diffu-sion welding. Moscow, 48–54 [in Russian].
26. Chudin, V.N., Timokhov, A.P., Terentiev, M.M. et al. (1992) Diffusion welding of hollow structures of high-strength alu-minium alloy sheets. Svarochn. Proizvodstvo, 10, 5–7.
27. Falchenko, Yu.V., Ustinov, A.I., Petrushynets, L.V. et al. (2017) Device for diffusion welding of three-layer honeycomb panels. Pat. 113424 Ukraine, Int. Cl. B23K 20/00, B23K 20/14 [in Ukrainian].
28. Bashurin, A.V., Mastikhin, E.Yu., Kolmykov, V.I. (2010) Dif-fusion welding of hollow bimetal panels. Zagotov. Proizvod-stva v Mashinostroenii, 1, 13–15 [in Russian].
Received 25.04.2018
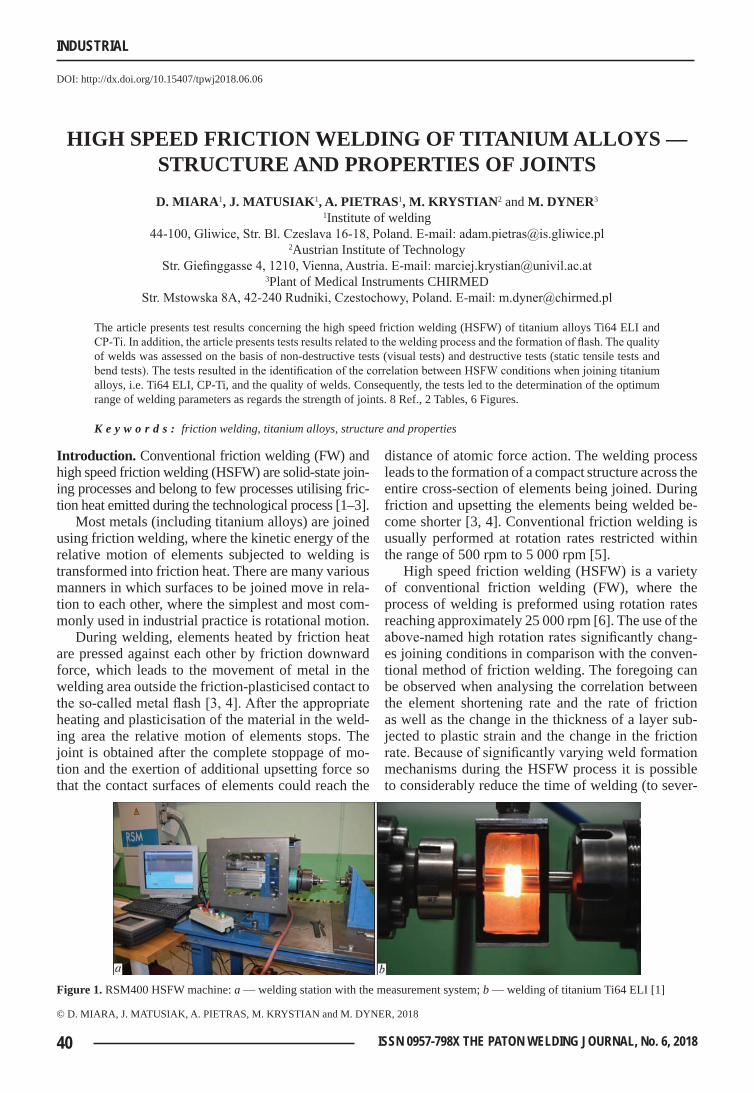
40 ISSN 0957-798X THE PATON WELDING JOURNAL, No. 6, 2018
INDUSTRIAL
DOI: http://dx.doi.org/10.15407/tpwj2018.06.06
high spEEd friction wElding of titaniuM alloys — structurE and propErtiEs of Jointsd. Miara1, J. Matusiak1, a. piEtras1, M. krystian2 and M. dynEr3
1Institute of welding 44-100, Gliwice, Str. Bl. Czeslava 16-18, Poland. E-mail: [email protected]
2Austrian Institute of Technology Str. Giefinggasse 4, 1210, Vienna, Austria. E-mail: [email protected]
3Plant of Medical Instruments CHIRMED Str. Mstowska 8A, 42-240 Rudniki, Czestochowy, Poland. E-mail: [email protected]
The article presents test results concerning the high speed friction welding (HSFW) of titanium alloys Ti64 ELI and CP-Ti. In addition, the article presents tests results related to the welding process and the formation of flash. The quality of welds was assessed on the basis of non-destructive tests (visual tests) and destructive tests (static tensile tests and bend tests). The tests resulted in the identification of the correlation between HSFW conditions when joining titanium alloys, i.e. Ti64 ELI, CP-Ti, and the quality of welds. Consequently, the tests led to the determination of the optimum range of welding parameters as regards the strength of joints. 8 Ref., 2 Tables, 6 Figures.
K e y w o r d s : friction welding, titanium alloys, structure and properties
introduction. Conventional friction welding (FW) and high speed friction welding (HSFW) are solid-state join-ing processes and belong to few processes utilising fric-tion heat emitted during the technological process [1–3].
Most metals (including titanium alloys) are joined using friction welding, where the kinetic energy of the relative motion of elements subjected to welding is transformed into friction heat. There are many various manners in which surfaces to be joined move in rela-tion to each other, where the simplest and most com-monly used in industrial practice is rotational motion.
During welding, elements heated by friction heat are pressed against each other by friction downward force, which leads to the movement of metal in the welding area outside the friction-plasticised contact to the so-called metal flash [3, 4]. After the appropriate heating and plasticisation of the material in the weld-ing area the relative motion of elements stops. The joint is obtained after the complete stoppage of mo-tion and the exertion of additional upsetting force so that the contact surfaces of elements could reach the
distance of atomic force action. The welding process leads to the formation of a compact structure across the entire cross-section of elements being joined. During friction and upsetting the elements being welded be-come shorter [3, 4]. Conventional friction welding is usually performed at rotation rates restricted within the range of 500 rpm to 5 000 rpm [5].
High speed friction welding (HSFW) is a variety of conventional friction welding (FW), where the process of welding is preformed using rotation rates reaching approximately 25 000 rpm [6]. The use of the above-named high rotation rates significantly chang-es joining conditions in comparison with the conven-tional method of friction welding. The foregoing can be observed when analysing the correlation between the element shortening rate and the rate of friction as well as the change in the thickness of a layer sub-jected to plastic strain and the change in the friction rate. Because of significantly varying weld formation mechanisms during the HSFW process it is possible to considerably reduce the time of welding (to sever-
© D. MIARA, J. MATUSIAK, A. PIETRAS, M. KRYSTIAN and M. DYNER, 2018
figure 1. RSM400 HSFW machine: a — welding station with the measurement system; b — welding of titanium Ti64 ELI [1]
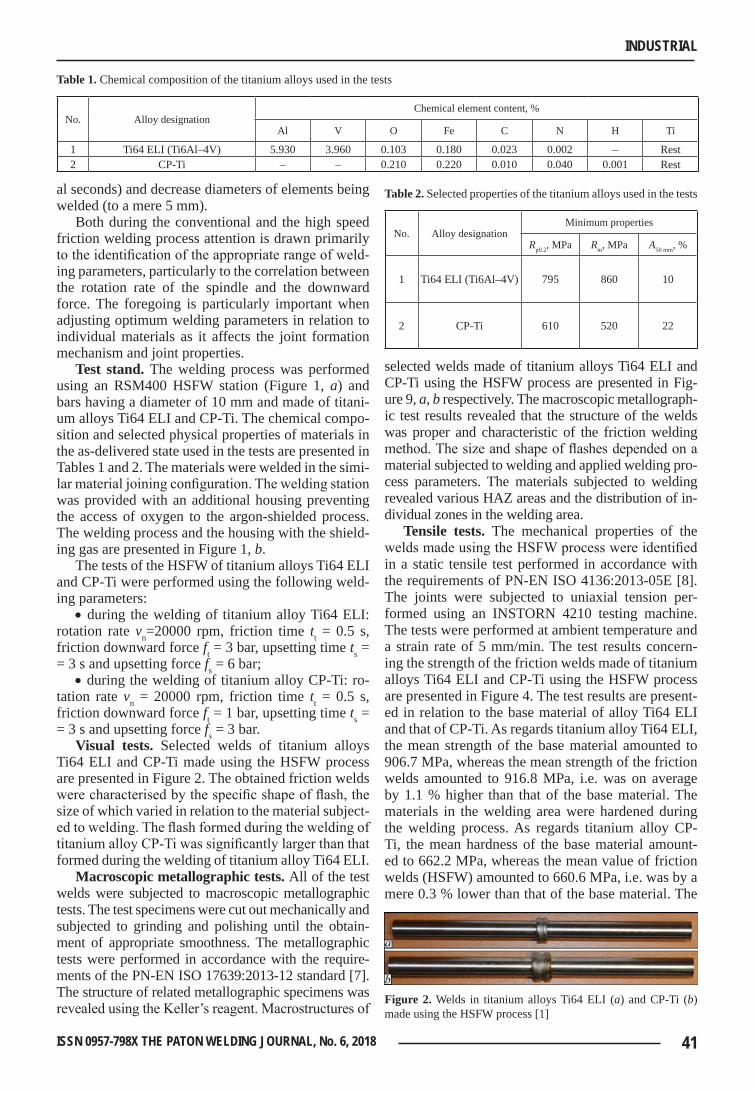
41ISSN 0957-798X THE PATON WELDING JOURNAL, No. 6, 2018
INDUSTRIAL
al seconds) and decrease diameters of elements being welded (to a mere 5 mm).
Both during the conventional and the high speed friction welding process attention is drawn primarily to the identification of the appropriate range of weld-ing parameters, particularly to the correlation between the rotation rate of the spindle and the downward force. The foregoing is particularly important when adjusting optimum welding parameters in relation to individual materials as it affects the joint formation mechanism and joint properties.
test stand. The welding process was performed using an RSM400 HSFW station (Figure 1, a) and bars having a diameter of 10 mm and made of titani-um alloys Ti64 ELI and CP-Ti. The chemical compo-sition and selected physical properties of materials in the as-delivered state used in the tests are presented in Tables 1 and 2. The materials were welded in the simi-lar material joining configuration. The welding station was provided with an additional housing preventing the access of oxygen to the argon-shielded process. The welding process and the housing with the shield-ing gas are presented in Figure 1, b.
The tests of the HSFW of titanium alloys Ti64 ELI and CP-Ti were performed using the following weld-ing parameters:
• during the welding of titanium alloy Ti64 ELI: rotation rate vn=20000 rpm, friction time tt = 0.5 s, friction downward force ft = 3 bar, upsetting time ts = = 3 s and upsetting force fs = 6 bar;
• during the welding of titanium alloy CP-Ti: ro-tation rate vn = 20000 rpm, friction time tt = 0.5 s, friction downward force ft = 1 bar, upsetting time ts = = 3 s and upsetting force fs = 3 bar.
visual tests. Selected welds of titanium alloys Ti64 ELI and CP-Ti made using the HSFW process are presented in Figure 2. The obtained friction welds were characterised by the specific shape of flash, the size of which varied in relation to the material subject-ed to welding. The flash formed during the welding of titanium alloy CP-Ti was significantly larger than that formed during the welding of titanium alloy Ti64 ELI.
Macroscopic metallographic tests. All of the test welds were subjected to macroscopic metallographic tests. The test specimens were cut out mechanically and subjected to grinding and polishing until the obtain-ment of appropriate smoothness. The metallographic tests were performed in accordance with the require-ments of the PN-EN ISO 17639:2013-12 standard [7]. The structure of related metallographic specimens was revealed using the Keller’s reagent. Macrostructures of
selected welds made of titanium alloys Ti64 ELI and CP-Ti using the HSFW process are presented in Fig-ure 9, a, b respectively. The macroscopic metallograph-ic test results revealed that the structure of the welds was proper and characteristic of the friction welding method. The size and shape of flashes depended on a material subjected to welding and applied welding pro-cess parameters. The materials subjected to welding revealed various HAZ areas and the distribution of in-dividual zones in the welding area.
tensile tests. The mechanical properties of the welds made using the HSFW process were identified in a static tensile test performed in accordance with the requirements of PN-EN ISO 4136:2013-05E [8]. The joints were subjected to uniaxial tension per-formed using an INSTORN 4210 testing machine. The tests were performed at ambient temperature and a strain rate of 5 mm/min. The test results concern-ing the strength of the friction welds made of titanium alloys Ti64 ELI and CP-Ti using the HSFW process are presented in Figure 4. The test results are present-ed in relation to the base material of alloy Ti64 ELI and that of CP-Ti. As regards titanium alloy Ti64 ELI, the mean strength of the base material amounted to 906.7 MPa, whereas the mean strength of the friction welds amounted to 916.8 MPa, i.e. was on average by 1.1 % higher than that of the base material. The materials in the welding area were hardened during the welding process. As regards titanium alloy CP-Ti, the mean hardness of the base material amount-ed to 662.2 MPa, whereas the mean value of friction welds (HSFW) amounted to 660.6 MPa, i.e. was by a mere 0.3 % lower than that of the base material. The
table 1. Chemical composition of the titanium alloys used in the tests
No. Alloy designationChemical element content, %
Al V O Fe C N H Ti
1 Ti64 ELI (Ti6Al–4V) 5.930 3.960 0.103 0.180 0.023 0.002 – Rest2 CP-Ti – – 0.210 0.220 0.010 0.040 0.001 Rest
table 2. Selected properties of the titanium alloys used in the tests
No. Alloy designationMinimum properties
Rp0.2, MPa Rm, MPa A50 mm, %
1 Ti64 ELI (Ti6Al–4V) 795 860 10
2 CP-Ti 610 520 22
figure 2. Welds in titanium alloys Ti64 ELI (a) and CP-Ti (b) made using the HSFW process [1]
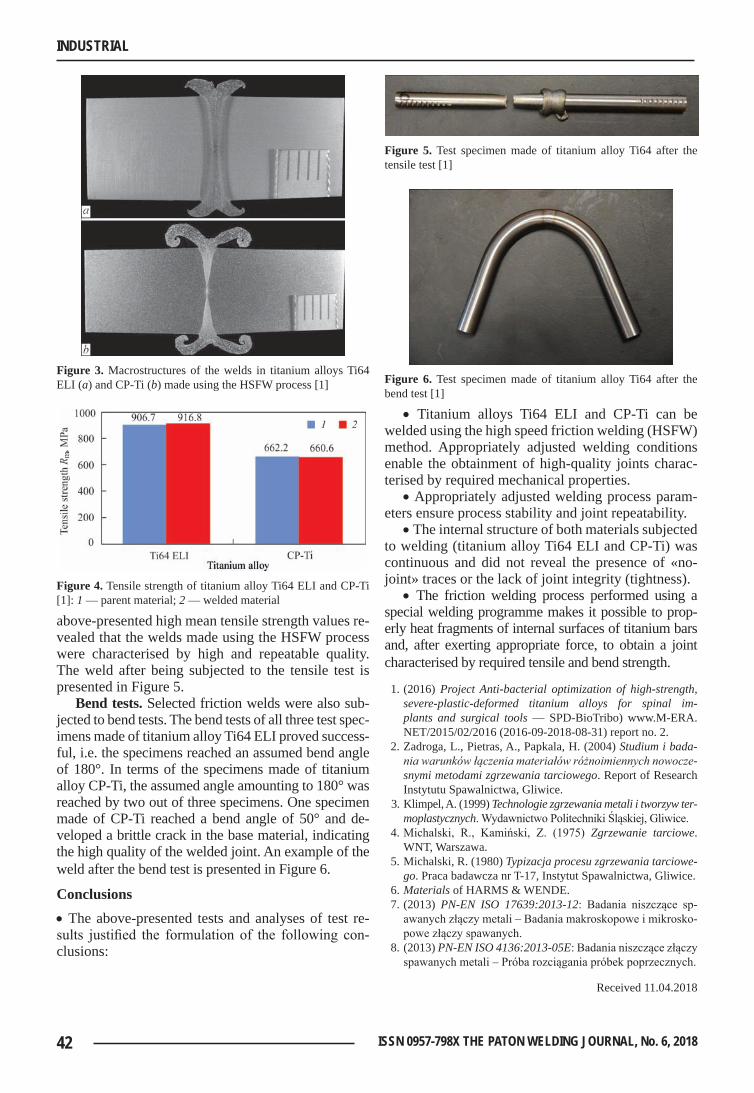
42 ISSN 0957-798X THE PATON WELDING JOURNAL, No. 6, 2018
INDUSTRIAL
above-presented high mean tensile strength values re-vealed that the welds made using the HSFW process were characterised by high and repeatable quality. The weld after being subjected to the tensile test is presented in Figure 5.
Bend tests. Selected friction welds were also sub-jected to bend tests. The bend tests of all three test spec-imens made of titanium alloy Ti64 ELI proved success-ful, i.e. the specimens reached an assumed bend angle of 180°. In terms of the specimens made of titanium alloy CP-Ti, the assumed angle amounting to 180° was reached by two out of three specimens. One specimen made of CP-Ti reached a bend angle of 50° and de-veloped a brittle crack in the base material, indicating the high quality of the welded joint. An example of the weld after the bend test is presented in Figure 6.
conclusions• The above-presented tests and analyses of test re-sults justified the formulation of the following con-clusions:
• Titanium alloys Ti64 ELI and CP-Ti can be welded using the high speed friction welding (HSFW) method. Appropriately adjusted welding conditions enable the obtainment of high-quality joints charac-terised by required mechanical properties.
• Appropriately adjusted welding process param-eters ensure process stability and joint repeatability.
• The internal structure of both materials subjected to welding (titanium alloy Ti64 ELI and CP-Ti) was continuous and did not reveal the presence of «no-joint» traces or the lack of joint integrity (tightness).
• The friction welding process performed using a special welding programme makes it possible to prop-erly heat fragments of internal surfaces of titanium bars and, after exerting appropriate force, to obtain a joint characterised by required tensile and bend strength.
1. (2016) Project Anti-bacterial optimization of high-strength, severe-plastic-deformed titanium alloys for spinal im-plants and surgical tools — SPD-BioTribo) www.M-ERA.NET/2015/02/2016 (2016-09-2018-08-31) report no. 2.
2. Zadroga, L., Pietras, A., Papkala, H. (2004) Studium i bada-nia warunków łączenia materiałów różnoimiennych nowocze-snymi metodami zgrzewania tarciowego. Report of Research Instytutu Spawalnictwa, Gliwice.
3. Klimpel, A. (1999) Technologie zgrzewania metali i tworzyw ter-moplastycznych. Wydawnictwo Politechniki Śląskiej, Gliwice.
4. Michalski, R., Kamiński, Z. (1975) Zgrzewanie tarciowe. WNT, Warszawa.
5. Michalski, R. (1980) Typizacja procesu zgrzewania tarciowe-go. Praca badawcza nr T-17, Instytut Spawalnictwa, Gliwice.
6. Materials of HARMS & WENDE.7. (2013) PN-EN ISO 17639:2013-12: Badania niszczące sp-
awanych złączy metali – Badania makroskopowe i mikrosko-powe złączy spawanych.
8. (2013) PN-EN ISO 4136:2013-05E: Badania niszczące złączy spawanych metali – Próba rozciągania próbek poprzecznych.
Received 11.04.2018
figure 3. Macrostructures of the welds in titanium alloys Ti64 ELI (a) and CP-Ti (b) made using the HSFW process [1]
figure 4. Tensile strength of titanium alloy Ti64 ELI and CP-Ti [1]: 1 — parent material; 2 — welded material
figure 5. Test specimen made of titanium alloy Ti64 after the tensile test [1]
figure 6. Test specimen made of titanium alloy Ti64 after the bend test [1]
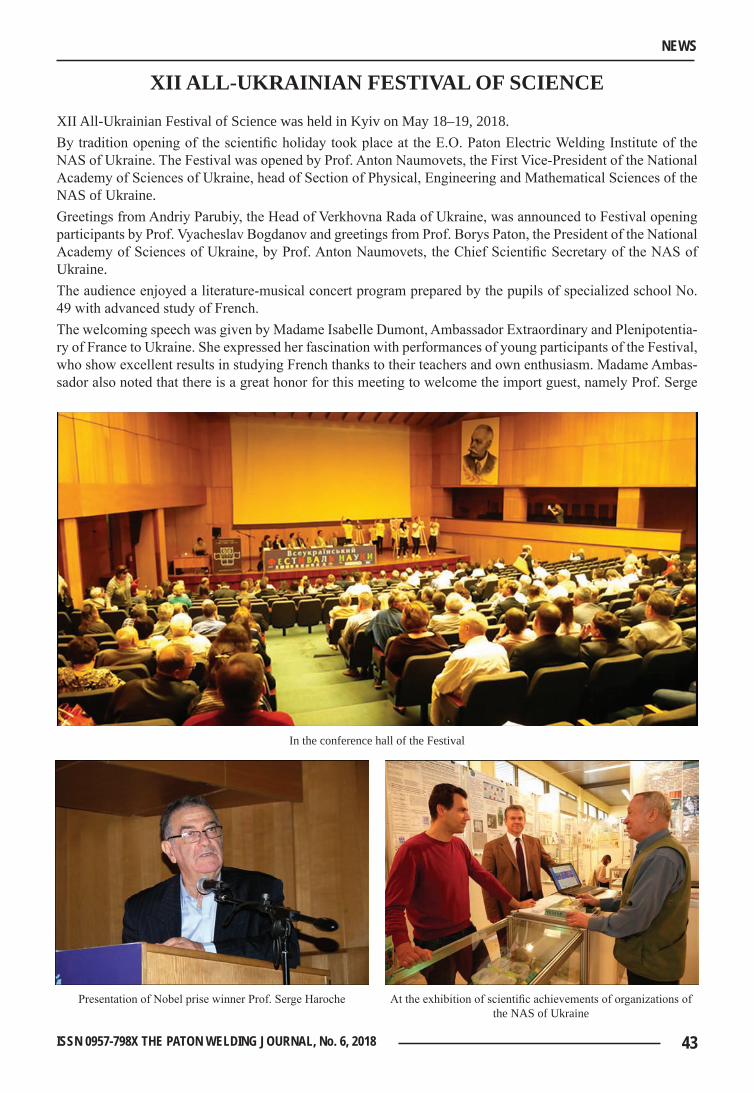
43ISSN 0957-798X THE PATON WELDING JOURNAL, No. 6, 2018
NEWS
XII All-UkrAInIAn FestIvAl oF scIence
XII All-Ukrainian Festival of Science was held in Kyiv on May 18–19, 2018.By tradition opening of the scientific holiday took place at the E.O. Paton Electric Welding Institute of the NAS of Ukraine. The Festival was opened by Prof. Anton Naumovets, the First Vice-President of the National Academy of Sciences of Ukraine, head of Section of Physical, Engineering and Mathematical Sciences of the NAS of Ukraine.Greetings from Andriy Parubiy, the Head of Verkhovna Rada of Ukraine, was announced to Festival opening participants by Prof. Vyacheslav Bogdanov and greetings from Prof. Borys Paton, the President of the National Academy of Sciences of Ukraine, by Prof. Anton Naumovets, the Chief Scientific Secretary of the NAS of Ukraine.The audience enjoyed a literature-musical concert program prepared by the pupils of specialized school No. 49 with advanced study of French.The welcoming speech was given by Madame Isabelle Dumont, Ambassador Extraordinary and Plenipotentia-ry of France to Ukraine. She expressed her fascination with performances of young participants of the Festival, who show excellent results in studying French thanks to their teachers and own enthusiasm. Madame Ambas-sador also noted that there is a great honor for this meeting to welcome the import guest, namely Prof. Serge
In the conference hall of the Festival
Presentation of Nobel prise winner Prof. Serge Haroche At the exhibition of scientific achievements of organizations of the NAS of Ukraine
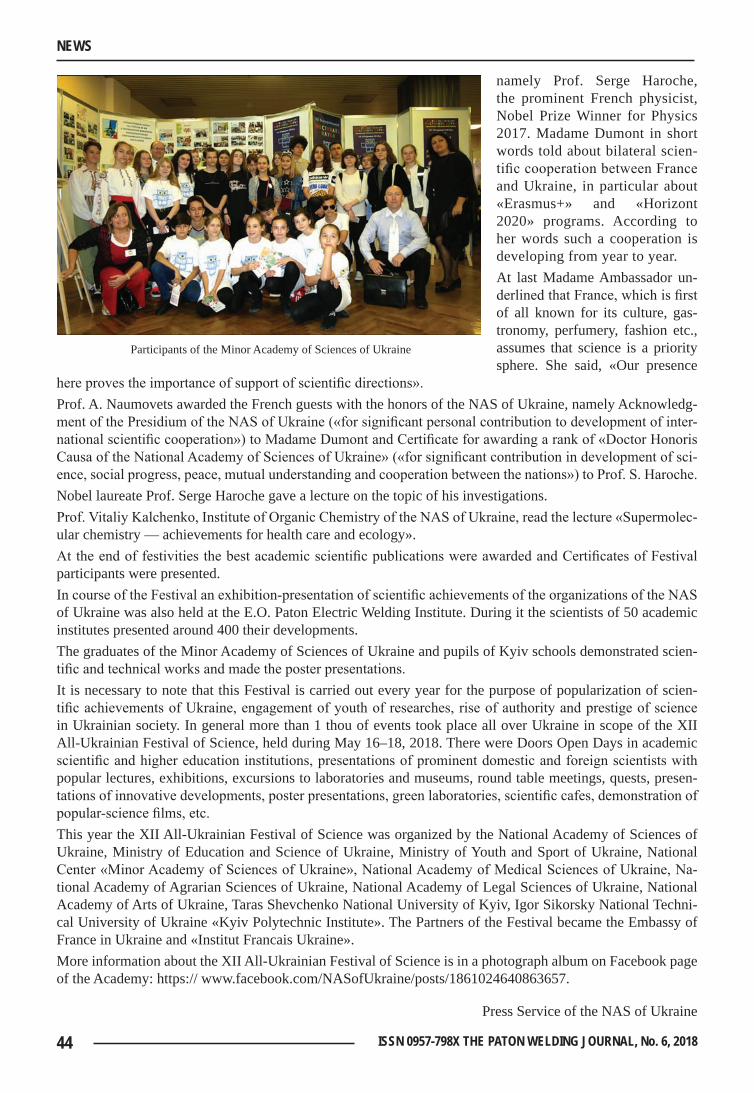
44 ISSN 0957-798X THE PATON WELDING JOURNAL, No. 6, 2018
NEWS
namely Prof. Serge Haroche, the prominent French physicist, Nobel Prize Winner for Physics 2017. Madame Dumont in short words told about bilateral scien-tific cooperation between France and Ukraine, in particular about «Erasmus+» and «Horizont 2020» programs. According to her words such a cooperation is developing from year to year.At last Madame Ambassador un-derlined that France, which is first of all known for its culture, gas-tronomy, perfumery, fashion etc., assumes that science is a priority sphere. She said, «Our presence
here proves the importance of support of scientific directions».Prof. A. Naumovets awarded the French guests with the honors of the NAS of Ukraine, namely Acknowledg-ment of the Presidium of the NAS of Ukraine («for significant personal contribution to development of inter-national scientific cooperation») to Madame Dumont and Certificate for awarding a rank of «Doctor Honoris Causa of the National Academy of Sciences of Ukraine» («for significant contribution in development of sci-ence, social progress, peace, mutual understanding and cooperation between the nations») to Prof. S. Haroche.Nobel laureate Prof. Serge Haroche gave a lecture on the topic of his investigations.Prof. Vitaliy Kalchenko, Institute of Organic Chemistry of the NAS of Ukraine, read the lecture «Supermolec-ular chemistry — achievements for health care and ecology».At the end of festivities the best academic scientific publications were awarded and Certificates of Festival participants were presented.In course of the Festival an exhibition-presentation of scientific achievements of the organizations of the NAS of Ukraine was also held at the E.O. Paton Electric Welding Institute. During it the scientists of 50 academic institutes presented around 400 their developments.The graduates of the Minor Academy of Sciences of Ukraine and pupils of Kyiv schools demonstrated scien-tific and technical works and made the poster presentations.It is necessary to note that this Festival is carried out every year for the purpose of popularization of scien-tific achievements of Ukraine, engagement of youth of researches, rise of authority and prestige of science in Ukrainian society. In general more than 1 thou of events took place all over Ukraine in scope of the XII All-Ukrainian Festival of Science, held during May 16–18, 2018. There were Doors Open Days in academic scientific and higher education institutions, presentations of prominent domestic and foreign scientists with popular lectures, exhibitions, excursions to laboratories and museums, round table meetings, quests, presen-tations of innovative developments, poster presentations, green laboratories, scientific cafes, demonstration of popular-science films, etc.This year the XII All-Ukrainian Festival of Science was organized by the National Academy of Sciences of Ukraine, Ministry of Education and Science of Ukraine, Ministry of Youth and Sport of Ukraine, National Center «Minor Academy of Sciences of Ukraine», National Academy of Medical Sciences of Ukraine, Na-tional Academy of Agrarian Sciences of Ukraine, National Academy of Legal Sciences of Ukraine, National Academy of Arts of Ukraine, Taras Shevchenko National University of Kyiv, Igor Sikorsky National Techni-cal University of Ukraine «Kyiv Polytechnic Institute». The Partners of the Festival became the Embassy of France in Ukraine and «Institut Francais Ukraine».More information about the XII All-Ukrainian Festival of Science is in a photograph album on Facebook page of the Academy: https:// www.facebook.com/NASofUkraine/posts/1861024640863657.
Press Service of the NAS of Ukraine
Participants of the Minor Academy of Sciences of Ukraine