Embed Size (px)
Citation preview
Enzyme Induced Carbonate Precipitation (EICP) for Soil Improvement
by
Abdullah A Almajed
A Dissertation Presented in Partial Fulfillment
of the Requirements for the Degree
Doctor of Philosophy
Approved June 2017 by the
Graduate Supervisory Committee:
Edward Kavazanjian, Chair
Claudia Zapata
Nasser M. Hamdan
ARIZONA STATE UNIVERSITY
August 2017
i
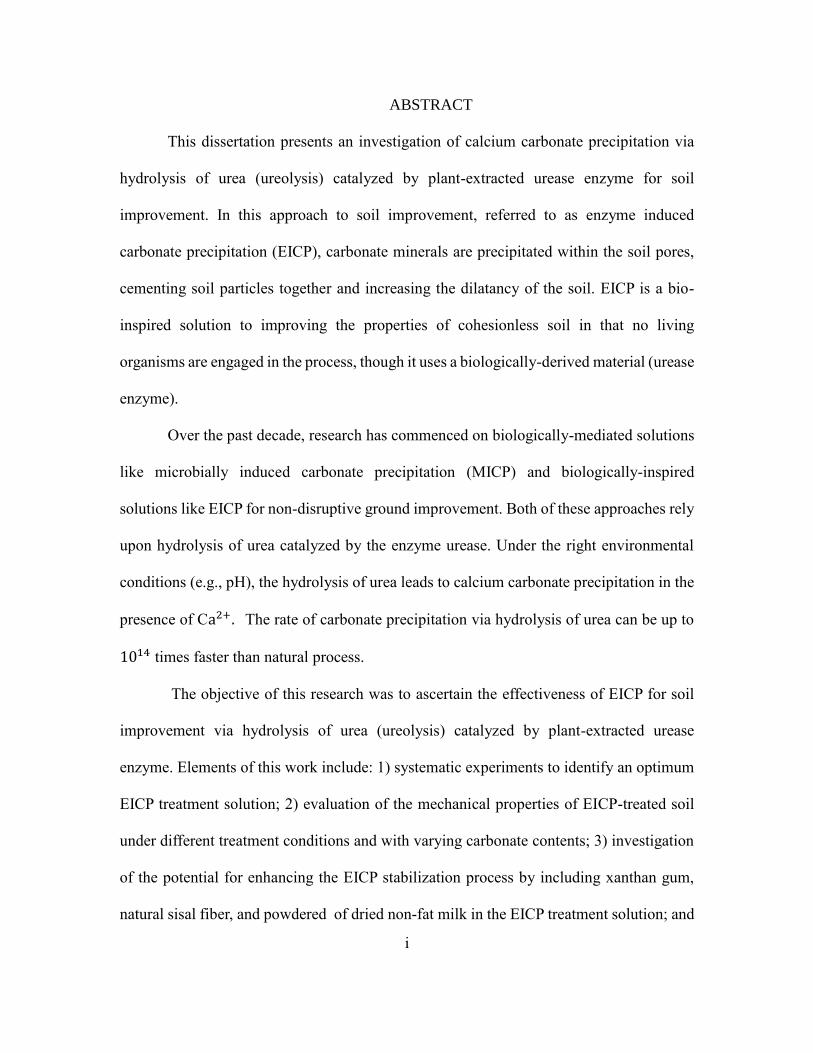
ABSTRACT
This dissertation presents an investigation of calcium carbonate precipitation via
hydrolysis of urea (ureolysis) catalyzed by plant-extracted urease enzyme for soil
improvement. In this approach to soil improvement, referred to as enzyme induced
carbonate precipitation (EICP), carbonate minerals are precipitated within the soil pores,
cementing soil particles together and increasing the dilatancy of the soil. EICP is a bio-
inspired solution to improving the properties of cohesionless soil in that no living
organisms are engaged in the process, though it uses a biologically-derived material (urease
enzyme).
Over the past decade, research has commenced on biologically-mediated solutions
like microbially induced carbonate precipitation (MICP) and biologically-inspired
solutions like EICP for non-disruptive ground improvement. Both of these approaches rely
upon hydrolysis of urea catalyzed by the enzyme urease. Under the right environmental
conditions (e.g., pH), the hydrolysis of urea leads to calcium carbonate precipitation in the
presence of Ca2+. The rate of carbonate precipitation via hydrolysis of urea can be up to
1014 times faster than natural process.
The objective of this research was to ascertain the effectiveness of EICP for soil
improvement via hydrolysis of urea (ureolysis) catalyzed by plant-extracted urease
enzyme. Elements of this work include: 1) systematic experiments to identify an optimum
EICP treatment solution; 2) evaluation of the mechanical properties of EICP-treated soil
under different treatment conditions and with varying carbonate contents; 3) investigation
of the potential for enhancing the EICP stabilization process by including xanthan gum,
natural sisal fiber, and powdered of dried non-fat milk in the EICP treatment solution; and
ii
4) bench-scale studies of the use of EICP to make sub-horizontal columns of cemented soil
for soil nailing and vertical columns of cemented soil for foundation support. As part of
this research, the effect of three preparation methods (mix-and-compact, percolation, and
injection) was also examined as was the influence of the grain size of soil. The results of
this study should help make the EICP technique an attractive option for geotechnical
engineers for ground improvement and stimulate the development and use of other
biogeotechnical techniques for civil engineering purposes.

iii
DEDICATION
This dissertation is dedicated to my parents, Abdulrahman and Asmaa Almajed,
who have on all occasions supported me and motivated me to achieve my goals. Also, this
dissertation is dedicated to my wife and best friend, Amnah Alsaid, who has supported me
and taken care of me and my daughter, and allows me to pursue my degree without facing
a lot of obstacles, thank you a lot.
iv
ACKNOWLEDGMENTS
I would like to express my gratitude to my advisor, Prof. Edward Kavazanjian, for
his enthusiasm, encouragement, guidance, and mentorship throughout my graduate studies
at Arizona State University. His instruction and knowledge have been crucial to my
success. In the absence of his help, I may not have been eligible to finish my dissertation
in less than three years. I am so thankful for his valuable time that he spent with me to help
me with what I needed from classwork to research.
I would also like to thank the members of my committee, Dr. Claudia Zapata and
Dr. Nasser Hamdan, for their guidance and support during my research. Dr. Zapata allowed
me to work and use equipment in her laboratory which made my life easier. Also, I am very
grateful to Dr. Hamdan for his constant willingness to help me, right from the time of being
a graduate student to being a committee member. His ideas and knowledge are appreciated.
I would like to offer a special thanks to Jeffrey Long, Peter Goguen, Sean
O’Donnell, and Angel Gutierrez for training me in the laboratory. Also, Ramadan Salim,
Jesus Esquivel, and Faisal Alfaisl who have helped me during my graduate career.
I would like to express my thanks to Dr. Hamed Khodadadi Tirkolaeifor all his help.
His ideas and flexibility in running some of the tests were of the highest value to my work.
Finally, I would like to acknowledge the support for this work that was funded by
King Saud University (KSU), not only for the funding, but also for giving me this chance
to study abroad and meet these very interesting people. Also, special thanks to the National
Science Foundation (NSF) under NSF CA No. EEC-1449501 for supporting me with all
the supply materials that I needed during my experiments. I am very joyful for all this
support.
v
TABLE OF CONTENTS
Page
LIST OF TABLES .............................................................................................................. x
LIST OF FIGURES ......................................................................................................... xii
CHAPTER
1 INTRODUCTION ..................................................................................................... 1
Objective ........................................................................................................... 1
Background ....................................................................................................... 1
Potential Applications of EICP ......................................................................... 4
Potential Advantages of EICP Compared to MICP .......................................... 4
Potential Disadvantages of EICP ...................................................................... 5
Organization ...................................................................................................... 6
2 LITERATURE REVIEW .......................................................................................... 7
Introduction ....................................................................................................... 7
The Chemistry of Urea Hydrolysis ................................................................... 8
Ground Improvement via Urea Hydrolysis ..................................................... 10
MICP Studies on Soil Strength ....................................................................... 11
Previous Studies of EICP ................................................................................ 18
vi
CHAPTER Page
3 BASELINE INVESTIGATION ON ENZYME INDUCED CALCIUM
CARBONATE PRECIPITATION............................................................................... 25
Introduction ........................................................................................................... 25
Falcon Tube Tests.................................................................................................. 27
Optimum EICP solution ........................................................................................ 27
Reusability of Effluent .......................................................................................... 29
Effect of Calcite Seeds on Mineralogy of the Precipitates ................................... 30
Falcon Tube Tests Results ..................................................................................... 30
Result of the Optimum EICP Solution ............................................................ 30
Results of Reusability of Effluent ................................................................... 35
Effect of Pre-existing Calcite Seeds on Mineralogy of the
Precipitates ..................................................................................................... 37
Soil Column Tests ................................................................................................. 40
Soil Column Treatment ................................................................................... 40
Effect of Relative Density on Strength of the Treated Samples by Using
Mix-and-Compact ........................................................................................... 42
Micro Scale Identification Analysis ................................................................ 42
Soil Column Results ............................................................................................ 42
EICP treatment of soil column ........................................................................ 42
Effect of Water Rinsing on EICP-Treated Sand .............................................. 47
Effect of Calcite Seeding ................................................................................ 51
Conclusion ............................................................................................................ 51
vii
CHAPTER Page
4 ENHANCEMENT OF EICP FOR SOIL IMPROVEMENT USING FIBERS AND
HYDROGELS ............................................................................................................ 53
Introduction ........................................................................................................... 53
Experimental Methods and Procedures ................................................................ 53
Column Preparation ........................................................................................ 53
Adding Xanthan Gum to Dry Soil .................................................................. 56
Adding Xanthan Gum to the EICP Solution ................................................... 57
Adding Sisal Fibers ......................................................................................... 57
Unconfined Compressive Strength (UCS) Testing ......................................... 58
Scanning Electron Microscope (SEM) Imaging ............................................. 59
Acid Digestion ................................................................................................ 59
Results and Discussion ......................................................................................... 60
Xanthan Gum Mixed with Dry Soil ............................................................... 60
Xanthan Gum as a Part of EICP Solution ....................................................... 65
Sisal Fiber ....................................................................................................... 70
UCS Testing .................................................................................................... 70
SEM Imaging of Cemented Sample with Sisal Fiber ..................................... 74
Conclusion ............................................................................................................ 75
5 MODIFYING EICP SOLUTION BY ADDING AN ORGANIC ADDITIVES .... 77
Introduction ........................................................................................................... 77
Materials and Methods .......................................................................................... 78
viii
CHAPTER Page
EICP Treatment Solutions ............................................................................... 78
Sample Preparation ......................................................................................... 80
Sample Curing ................................................................................................ 80
UCS Testing .................................................................................................... 81
Triaxial Testing ............................................................................................... 81
Acid Digestion ................................................................................................ 81
Micro Scale Identification Analysis................................................................ 82
Results .................................................................................................................. 82
Tests Using EICP Solution 1 .......................................................................... 82
Tests Using EICP Solution 2 .......................................................................... 84
Tests Using EICP Solution 3 .......................................................................... 87
Tests Using EICP Solution 4 .......................................................................... 88
Tests Using EICP Solution 5 .......................................................................... 90
Triaxial Testing ............................................................................................... 91
Interpretation of Results ........................................................................................ 95
Conclusion ............................................................................................................ 99
6 COLUMNAR IMPROVEMENT OF SOIL AND INVESTIGATE DIFFERENT
PREPARATION METHODS FOR CREATING COLUMN ................................ 101
Introduction ......................................................................................................... 101
ix
CHAPTER Page
Sub-Horizontal Columns .................................................................................... 102
Experimental Methods and Procedures ....................................................... 102
Results and Discussion ...................................................................................... 103
Vertical Columns ................................................................................................. 105
Experimental Methods and Procedures ........................................................ 105
Soil A: Ottawa 20-30 Silica Sand ................................................................. 105
Soil B: F-60 Silica Sand ................................................................................ 107
Results of EICP Column Experiments .......................................................... 112
Discussion ........................................................................................................... 117
Differences in EICP Cementation in Ottawa 20-30 Versus F-60
Silica Sand .................................................................................................... 117
Conclusion .......................................................................................................... 120
7 CONCLUSION AND RECOMMENDATION FOR FURTHER STUDY ......... 121
Summary ............................................................................................................. 121
Conclusion .......................................................................................................... 123
Recommendation for Further Study.................................................................... 126
REFERENCES ...................................................................................................... 128
x
LIST OF TABLES
Table Page
1 Summary of Falcon Tube Tests ............................................................................. 28
2 Precipitation Mass and Precipitation Ratio for the Falcon Tube Tests……......…31
3 Results of EICP Treatment of Soil Columns with Relative Density of 45% by
Using Mix-and-Compact and Percolation ............................................................ 43
4 Strength of EICP-Treated Columns by Using Mix-and-Compact at Different
Relative Densities ................................................................................................. 47
5 Results of USC tests at 1.1% (w/w) Xanthan Gum Mixed with Dry Soil ............ 61
6 Compares the UCS Strength, Strain at Failure (εf), and Carbonate Content for
Specimens Prepared with and Without the Addition of Powder Xanthan Gum ... 64
7 Results and Observation from Using Xanthan Gum as Part of the EICP Solution
............................................................................................................................... 66
8 Compares the UCS Strength, Strain at Failure (εF), and Carbonate Content for
Specimens Prepared with and Without the Addition Xanthan Gum as a Part of the
EICP Solution ...................................................................................................... 68
9 Summary of the Results of Using Sisal Fiber (10 mm Length) ............................ 72
10 Results of UCS and Carbonate Precipitation Using Solution 1 ............................ 83
11 Results of UCS and Carbonate Precipitation Using Solution 2 ............................ 85
12 Results of UCS and Carbonate Precipitation Using Solution 3 ............................ 87
13 Results of UCS and Carbonate Precipitation Using Solution 4 ............................ 88
14 Results of UCS and Carbonate Precipitation Using Solution 5 ............................ 90
15 Summaries the From Undrained Triaxial Tests ..................................................... 92
xi
Table Page
16 Summary of EICP Solution Tests ......................................................................... 96
17 Physical Characteristics of Ottawa 20-30 (Czupak 2011) .................................. 106
18 Results from Columns Using the Percolation Method ....................................... 114
19 Results from Columns Using the Injection Method ........................................... 115
20 Results from Columns Using the Mix-and-Compact Method ............................ 116
xii
LIST OF FIGURES
Figure Page
1 Speciation of Total Carbonate Co3in Seawater vs. PH (Jacob 1999) ...................... 9
2 Set-Up for Large Scale Experiment (100m3), from van Paassen et al. (2010)) .... 14
3 MICP Via Stimulation for Larger Circular Tank, from Gomez et al. (2016) ........ 18
4 Relation Between Urease Concentration and CaCO3 Precipitation Ratio
(Neupane et al. (2013)) ........................................................................................ 20
5 Changes in Precipitation Ratio Versus Enzyme Concentration and Initial
Electrical Conductivity of EICP Solution in (a) Precipitation Ratio and
Conductivity Plane, (b) Precipitation Ratio and Urease Concentration Plane, and
(c) Precipitation Ratio and Urease Concentration Plane ....................................... 34
6 Electrical Conductivity Versus Concentration of Calcium Chloride and Urea ..... 35
7 Morphology of the Precipitates From (A) Unseeded, and (B) Calcite-Seeded EICP
Solutions. .............................................................................................................. 39
8 Layout of The Soil Columns Used for EICP Treatment ....................................... 41
9 EICP-Treated Samples by Using Mix-and-Compact (Left) and Percolation (Right)
Methods................................................................................................................. 45
10 Precipitation Between Particles Along Flow Path in Percolation Method ........... 45
11 Strength Versus Percentage of Precipitation Mass in EICP-Treated Samples
Prepared Using Percolation Method …………………………………..………...46
12 SEM Micrographs of EICP-Treated Soil (A) Before and (B) After Water Rinsing.
............................................................................................................................... 49
13 XRD Analysis of The Treated Soil (A) Before and (B) After Water Rinsing ....... 50
xiii
Figure Page
14 FTIR Spectra of The Treated Soil Before and After Water Rinse ......................... 51
15 Samples Were Setting on the Pedestal After Treatment ........................................ 54
16 Shear Planes for Specimen 3b ............................................................................... 61
17 Relationship Between Axial Normal Stress and Axial Strain for Samples Prepared
by Adding Xanthan Gum as Dry Powder at U:C= 1. 75 M:1 M .......................... 62
18 Relationship Between Axial Normal Stress and Axial Strain for Samples Prepared
by Adding Xanthan Gum as Dry Powder at U:C= 0.875 M:0.5 M ...................... 62
19 SEM Images from Sample Prepared by Mix and Compact with Xanthan Gum
Mixed into the Soil as Powder .............................................................................. 65
20 Bulging Failure when Xanthan Gum Used as Part of EICP Solution ................... 67
21 Relationship Between Axial Normal Stress and Axial Strain for Samples Prepared
by Adding Xanthan Gum to the EICP Solution at U:C=1. 75 M:1 M. ................. 68
22 Relationship Between Axial Normal Stress and Axial Strain for Samples Prepared
by Adding Xanthan Gum to the EICP Solution at U:C=0.8 75 M:0.5 M ............. 68
23 SEM Images from Sample Prepared When Xanthan Gum Used as Part of EICP
Solution ................................................................................................................. 70
24 Excessive of Fiber Showed Negative Impact on Strength .................................... 71
25 Column After Treatment and Before UCS ............................................................ 71
26 Relationship Between the Percentages of Sisal Fibers and the Peak Strength ..... 73
27 (a) MICP Treated-Sand With Fiber, Li etal (2015), and (b) EICP Treated-Sand
With Fiber (This Study) ........................................................................................ 74
xiv
Figure Page
28 Illustrative SEM Images of Calcite Crystals with Fiber at Different
Magnifications and Locations ............................................................................... 75
29 SEM of Samples Treated Using Solution 1 (Baseline Solution) ......................... 83
30 SEM Images Using EICP Solution 2: (A) CaCO3 at Inter-Particle Contact Points,
(B) Inter-Particle Cementation, (C) Broken CaCO3 at Inter-Particle Contact ...... 86
31 Rhombohedral Calcite Crystals at Inter-Particle Contact Points (Left). The Results
of EDX Analysis Confirm the Presence of the Elements Constituting Calcium
Carbonate and Silica (Right). ................................................................................ 86
32 XRD Spectrum Showing the Corresponding Peaks of Calcite Crystal Phase and
Silica Sand. (S: Silica Sand and C: The Calcite). ................................................. 86
33 SEM Of Samples Treated Using EICP Solution 3 ................................................ 87
34 SEM Of Samples Treated Using EICP Solution 4 ................................................ 89
35 SEM Images Using Solution 5, Showing The CaCO3 Cementation at Inter-Particle
Contact Points (Solid-Arrow), and Broken CaCO3 at Inter-Partilce Contact (Dotted
Line). ..................................................................................................................... 91
36 Effective Vertical Stress (A), q vs. p (B), and Excess Pore Pressure (C) From
Undrained Testing Specimens at An Initial Relative Density of 40% and a Different
Confining Stress of 50, 100, And 150 kPa. (Non-Treated Sample Results Were
Taken From O' Donnell, S. (2016)………..……...................................................93
37 Mohr Circles for Different Confining Pressure .................................................... 94
xv
Figure Page
38 UCS Versus CaCO3 Content for Solution 1-5 ....................................................... 96
39 UCS Versus CaCO3 Content for both EICP and MICP ........................................ 97
40 A: Shear Failure Pattern from Unconfined Compression When Fresh Dried Non-
fat Milk Not Used, B: Vertical Failure Plane From Unconfined Compression. as
Shown, Top and Bottom Surface of the Sample Were Flattened by Using Plastic
Steel Putty.. ........................................................................................................... 98
41 Soil Nail Experiment: (A) Application of Normal Load; (B) Top View of
Cemented Tubes and Vertical Cemented Zone Near 23 cm; (C) Cylindrically
Cemented Soil Mass Around (Clear) Injection Tube .......................................... 104
42 Soil Nail Experiment Results: (A) SEM Image Showing the Calcite Phase (Small
Arrow) And Silica Sand (Large Arrows) (B) XRD Results Showing Evidence of
Calcite. (S: Silica Sand And C: The Calcite). ..................................................... 104
43 A) Extraction of Cemented F-60 Silica Sand from the 101.6 mm x 254.8 mm (4”
x 10”) Column, B) Pieces of Cemented Sand After Extraction .......................... 112
44 SEM Images for Samples Prepared Using the Three Treatments Methods; 1) Mix-
and- Compact; 2) Percolation; and 3) Injection .................................................. 117
45 Stress-Strain Behavior in Unconfined Compression of Ottawa 20-30 Sand for
Three Preparation Methods ................................................................................. 119
46 Stress-Strain Behavior in Unconfined Compression of F-60 Sand for Three
Preparation Methods ........................................................................................... 119
1
CHAPTER 1
INTRODUCTION
OBJECTIVE
The objective of this research is to investigate factors that affect the use of enzyme-
induced carbonate precipitation (EICP) via hydrolysis of urea (ureolysis) catalyzed by
plant-extracted urease enzyme for soil improvement. A key element of this research was
the systematic identification of an optimum EICP treatment solution. The strength and
ductility of EICP-treated soil was studied under different treatment conditions (sample
preparation methods and admixture) and with varying carbonate content. Sample
preparation methods include mix-and-compact, percolation, and injection. Admixtures
investigated included xanthan gum, sisal fibers, and organic additives. This study also
worked towards eliminating, or at least controlling, the drawbacks of the EICP technique
to make it a more attractive option for ground improvement, encouraging the use of
biological techniques over conventional methods where possible to enhance sustainability
in civil engineering.
BACKGROUND
Techniques used in practice to enhance the mechanical properties of granular soil,
include stone columns, vibroflotation, removal and re-compaction, dynamic compaction,
and chemical grouting. Increasing concerns regarding the sustainability of these
conventional soil improvement techniques have driven geotechnical engineers to seek
ground improvement solutions that employ biologically-based techniques. These
biological-based techniques can be divided into two categories: bio-mediated techniques,
2
which use living organisms for soil improvement; and bio-inspired techniques, which
mimic biological processes without actually involving living organisms.
Microbially induced carbonate precipitation (MICP) is a bio-mediated technique
that has been investigated for the past decade as an alternative to Portland cement for
ground improvement (Dejong et al., 2013). One of the main advantages of MICP over
Portland cement for ground improvement is that MICP is non-disruptive. Another appeal
of using MICP in place of Portland cement is that doing so certainly reduces cement
manufacture-related emissions including carbon dioxide (CO2) and sulfur dioxide (SO2).
Studies suggest that cementation using MICP can address a variety of significant
geotechnical problems in granular soils including the bearing capacity of shallow
foundations, excavation stability, erosion and scour, under-seepage of levees, tunneling in
running or flowing ground, seismic settlement, and liquefaction (Dejong et al.,
2010; Kavazanjian and Karatas, 2008; van Paassen et al., 2010).
MICP relies upon calcium carbonate (CaCO3) precipitation to induce inter-particle
binding cementation in sandy soil, limiting their mobility and enhancing the strength and
stiffness of the soil (Harkes et al., 2010). CaCO3 precipitation may also fill the voids of the
soil, decreasing soil porosity, decreasing the tendency for volume decrease that leads to
liquefaction (Andrus and Chung, 1995), and increasing the tendency for volume expansion
(dilatancy) during shear (Yang et al. 2016). Additionally, the precipitated CaCO3 is strong
and is resistant to dissolution, dissolving slowly on a geological scale under normal
conditions (van Paassen et al., 2010b).
CaCO3 precipitation using bacterial cells containing urease enzyme is a bio-
mediated technique (Harkes et al., 2010). Several studies have been conducted on using
3
CaCO3 precipitation facilitated by bacterial urease, sometimes referred to as bio-grouting,
as a method to strengthen soil (e.g., van Paassen et al., 2009; Whiffin et al., 2007; Harkes et
al., 2010). CaCO3 precipitation using free urease enzyme, referred to herein as Enzyme
Induced Carbonate Precipitation (EICP), is a much-less studied technique for soil
improvement. EICP may be considered a bio-inspired technique as no living organism is
directly involved in the precipitation process. Over the past 6 years, EICP has been
investigated as an alternative technique to MICP for soil improvement by Dilrukshi and
Kawasaki (2016), Hamdan (2015), Hamdan et al. (2013), Hamdan and Kavazanjian (2016),
Kavazanjian and Hamdan (2015), Neupane et al. (2013, 2015a and 2015b), Putra et al.
(2016), and Yasuhara et al. (2011 and 2012).
The free urease enzyme used in most EICP studies to date has been isolated from
plants, including soybean, jack bean, watermelon seed, and pea plants (Kayastha and Das
1999; Das et al. 2002). The Jack bean, a drought resistant relative of the soybean, is the
most common source of free urease. The enzyme is the most expensive component of the
EICP solution. It has a size of 12 nm per subunit and is soluble in water, facilitating its
transport within the pores of soils (Blakely and Zerner, 1984). As the CaCO3 precipitation
reaction through EICP does not employ living organisms, it is not limited by oxygen
availability as when using MICP for deep soil treatment. Furthermore, MICP requires
nutrients for bacterial activity, is subject to competing effects of other microorganisms, or
rely upon cell attachment to soil particles. For these reasons, EICP possesses many
practical advantages over MICP. Another advantage of EICP over MICP in some cases is
that the reaction process in EICP occurs more rapidly than MICP, making it particularly
useful for some applications in arid and semi-arid environments.
4
POTENTIAL APPLICATIONS OF EICP
Enzyme-induced carbonate precipitation has a wide range of potential applications
in geotechnical engineering. This wide range of applications is due in part to the smaller
size of the free urease enzyme used in EICP compared to that of the ureolytic bacteria used
in MICP. Potential applications of EICP include fugitive dust mitigation, surface water
erosion control, the creation of subsurface barriers, excavation stabilization, remediation
of cracks in concrete, soil nailing, liquefaction mitigation, and foundation support. While
still in early stages of development, EICP application has demonstrated the ability to
significantly reduce fugitive dust levels (Knorr 2014; Hamdan 2015; Bang et al.2009;
Meyer et al.2011). Both EICP and MICP can be used to mitigate fugitive dust. However,
EICP has practical advantages over MICP since the reaction process in EICP occurs more
rapidly than in MICP.
POTENTIAL ADVANTAGES OF EICP COMPARED TO MICP
The small size of the solubilized free urease enzyme used in EICP provides it with
a unique advantage over microbial urease for engineering implementations that demand
penetration into finer grained soils, such as silt. The small urease enzyme sub-unit, on the
order of 12 nm in dimension, allows the EICP solution to diffuse into finer soils in which
ureolytic microbes, typically sized between 300 and 500 nm, either cannot penetrate or,
when combined with CaCO3 precipitation, result in of the bio-plugging (clogging of soil
pores), inhibiting transport of nutrients and substrate in to the soil. The water solubility of
the free urease enzyme enables it to enter any pore that water could reach, minimizing the
risk of bio-plugging.
5
Another potential advantage of using free urease enzyme is the decrease in the
enzymatic activity and functionality over time (Pettit et al., 1976; Marzadori et al., 1998),
potentially reducing long term environmental impacts. Ephemeral urease activity would be
better in accomplishing short-term engineering goals, after which the enzyme will degrade,
avoiding potential long-term biological impacts. Though the free urease enzyme is
expected to degrade quickly, the consumed urease sorbed to soil particles can persist for a
longer time without any loss of function or proteolytic degradation (Pettit et al., 1976).
Using free urease enzyme is also much simpler than using ureolytic microbes, as there is
no need to culture or stimulate bacteria.
POTENTIAL DISADVANTAGES OF EICP
There are several potential disadvantages of using free urease enzyme in place of
ureolytic microbial urease. Using free enzyme may result in a lack of nucleation points in
the soil for calcium carbonate precipitation; MICP microbes typically adhere themselves
to the soil particles, providing nucleation points for mineral precipitation. In addition, the
rapid precipitation of carbonate in EICP can be disadvantageous because it can result in
the formation of vaterite and amorphous CaCO3. These polymorphs of CaCO3 are less
structured, and more easily dissolved in water than the calcite phase of CaCO3 (van
Paassen, 2009). Another disadvantage of the free enzyme is its relatively high cost. The
cost of the free urease enzyme accounts for an estimated 57%–98% of the total cost of
applying EICP for practical applications, since lab-grade materials are used in most EICP
trials. Another disadvantage of using both EICP and MICP, is that they produce the
ammonium chloride (NH4Cl) a recognized ground water contaminant, as a byproduct of
their reactions.
6
ORGANIZATION
This dissertation is organized into the following sections:
a) Chapter 1 describes the objective of this study and briefly discusses potential
applications of EICP and the advantages and disadvantages of EICP;
b) Chapter 2 presents a review of the relevant literature on the use of CaCO3
precipitation for soil improvement through MICP and EICP;
c) Chapter 3 describes initial investigations of the EICP technique for soil
improvement, including a systematic evaluation of the optimal concentration of
constituents in the EICP solution;
d) Chapter 4 presents the results of studies on the enhancement of EICP for soil
improvement using sisal fiber and xanthan gum;
e) Chapter 5 presents the results of studies of beneficially modifying the EICP by
using an organic additive;
f) In Chapter 6 the strength of EICP treated specimens using different preparation
methods and different gradations of sand is presented; and
g) Chapter 7 provides a summary, conclusions, and suggestions for future research.
7
CHAPTER 2
LITERATURE REVIEW
INTRODUCTION
In numerous areas of the world, the mechanical properties of soils are inadequate
for the desired utilization of the land: roads and railroads require constant maintenance;
embankments, dunes, and slopes can easily become unsteady due to weak soil; earthquakes
can lead to soil liquefaction, destroying local infrastructure. Conventional ground
improvement methods, such as compaction, inserting piles, or mixing the soil with cement
or lime, can be used to stabilize the soil and solve some of these problems (Karol, 2003).
However, these traditional methods have several limitations. Some of them are expensive
and time consuming, and some require specialized machinery. Furthermore, some of these
traditional methods may have significant negative environmental impacts.
Diagenesis, including the formation of natural carbonate-cemented sands and
carbonate rocks, occurs because of physical, chemical, and biological processes that
naturally stabilize soil. Sediments are packed together and bound by naturally precipitated
minerals. However, these natural actions that form cemented sand from loose sand are very
slow, taking potentially hundreds of thousands of years to transition from a layer of
cohesionless earth to a cemented sand.
Directed biological processes can be used to speed up the natural processes that
form cemented sand by changing the chemistry of pore water, leading to faster mineral
precipitation. Over the past 15 years, geotechnical engineers have investigated a variety of
biological processes to induce mineral precipitation in soil. The most common biological
8
technique investigated in these studies is the use of urea hydrolysis to induce carbonate
precipitation in soil.
THE CHEMISTRY OF UREA HYDROLYSIS
Urea hydrolysis refers to the chemical reaction where urea is hydrolyzed into
ammonia (NH3) and carbon dioxide (CO2) in the presence of water. These reactions
products speciate into ammonium (NH4) and carbonate (CO32-) ions. These products of
ureolysis can induce carbonate precipitation in the presence of suitable divalent cations
such as calcium ions. Calcium chloride (CaCl2) is one potential source of the calcium ions.
The urease enzyme acts as a catalyst for the hydrolysis reaction. The following is the
chemical equation of urea hydrolysis.
CO (NH2)2 + 2H2O Urease 2NH4+ + CO3
2- (1)
The reaction above increases the alkalinity and pH of the solution creating an ideal
condition for carbonate precipitation in the presence of divalent cations, e.g., Ca2+. The pH
increases as a result of ammonia reacting with water, producing OH- ions. When a sufficient
concentration of the appropriate cation is present, this rise in the pH will result in the
development of inorganic carbon leading toward carbonate concentration that then
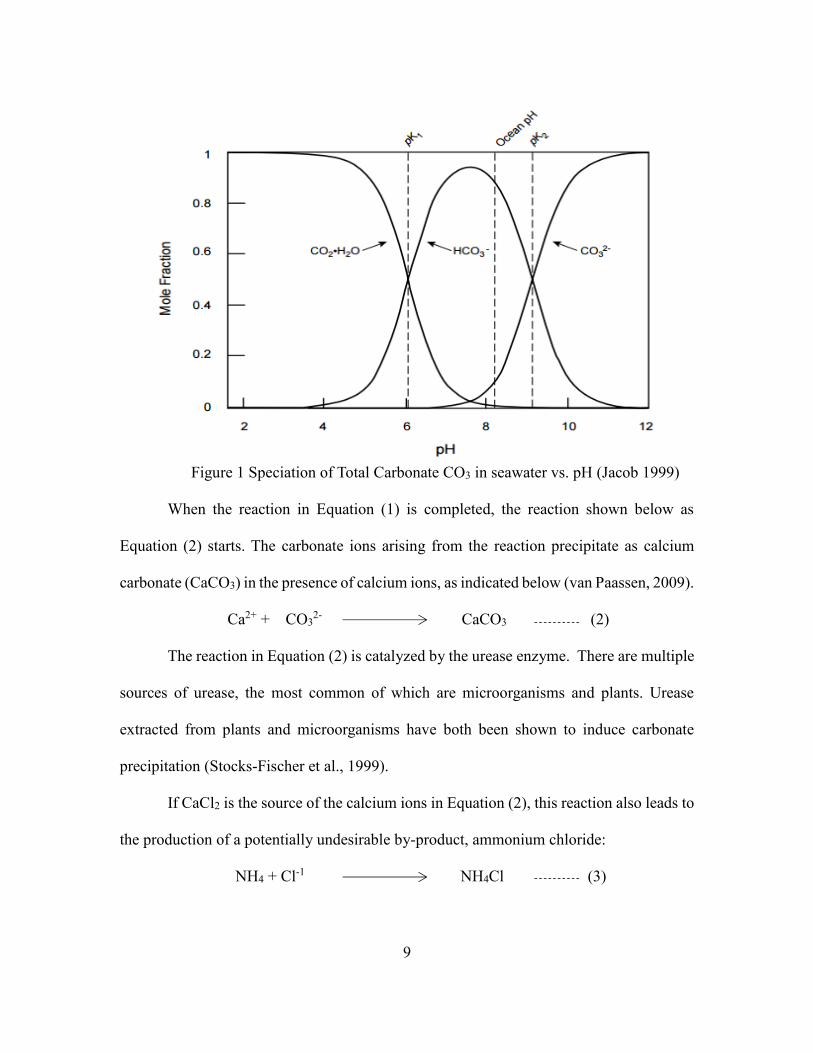
produces carbonate precipitation (Karatas et al. 2008). Jacob (1999) elucidated the
connection between pH and carbonate precipitation in water, showing that a higher pH
leads to greater production of carbonate CO32- as shown below in Figure 1.
9
Figure 1 Speciation of Total Carbonate CO3 in seawater vs. pH (Jacob 1999)
When the reaction in Equation (1) is completed, the reaction shown below as
Equation (2) starts. The carbonate ions arising from the reaction precipitate as calcium
carbonate (CaCO3) in the presence of calcium ions, as indicated below (van Paassen, 2009).
Ca2+ + CO32- CaCO3 (2)
The reaction in Equation (2) is catalyzed by the urease enzyme. There are multiple
sources of urease, the most common of which are microorganisms and plants. Urease
extracted from plants and microorganisms have both been shown to induce carbonate
precipitation (Stocks-Fischer et al., 1999).
If CaCl2 is the source of the calcium ions in Equation (2), this reaction also leads to
the production of a potentially undesirable by-product, ammonium chloride:
NH4 + Cl-1 NH4Cl (3)
10
GROUND IMPROVEMENT VIA UREA HYDROLYSIS
The objective of urea hydrolysis in ground improvement is to induce carbonate
precipitation in the soil. Urea hydrolysis is just one of several methods that can induce
carbonate precipitation in soil, but it has proven to an efficient method (DeJong et al.,
2013). Other processes that can induce carbonate precipitation include sulfate reduction,
iron reduction, denitrification, and ankerite precipitation (Karatas et al. 2008 and DeJong
et al., 2013). Carbonate precipitation can fill the pore space between two particles of sand
and if it occurs at particle content can cement them together.
In 1984, engineers began to use carbonate precipitation for an engineering
technique known as “Cleaning in Place,” or CIP. In CIP, carbonate precipitation is used
to fill the pores in pervious zones in boreholes for oil wells to stop the oil from spreading
horizontally and to control the path of the oil’s flow (Hitzman, 1984; Mclnerney et al.,
1985; Ferris and Stehmeir, 1992; Nemati and Voordouw, 2005). In addition to sealing oil
well boreholes, a wide array of applications for calcite precipitation via urea hydrolysis
have been proposed. These include the restoration of calcareous stone materials (Tiano et
al., 1995; Stocks-Fisher et al., 1999), bio-remediation (Ferris, 2003; Fujita et al., 2000),
and water treatment (Hammes et al., 2003).
Most of the studies to date on bio-geotechnical ground improvement are based on
carbonate precipitation via urea hydrolysis. Most of the researchers performing these
studies rely upon ureolytic bacteria such as Sporsarcina Pasteurii as source of the urease
enzyme. Sporsarcina Pasteurii DSM33 (DSMZ, FRG) is the most popular ureolytic
bacteria employed in MICP process for ground improvement. Typically, the ureolytic
bacteria used in MICP are grown in the ex-situ under controlled conditions and then
11
inserted into the soil with a solution of urea and calcium chloride (DeJong et al., 2006;
Whiffin et al., 2007; van Paassan, 2009; van Paassen, et al. 2010). However, recent studies
have explored stimulation of ureolytic bacteria in situ, followed by introduction of a urea
and calcium chloride solution (Burbank et al. 2012;Gomez et al. 2016)
Recently, laboratory studies have explored using free urease enzyme extracted from
plants to induce carbonate precipitation for soil improvement (Nemati and Voordouw,
2003; Whiffin, 2004; Yasuhara, 2011, 2012; Neupane et al., 2013, 2015; Kavazanjian and
Hamdan, 2015; Knorr, 2014; Hamdan and Kavazanjian, 2016). Use of free enzyme has
been referred to as enzyme induce carbonate precipitation (EICP). The best known and
most studied free urease enzyme is that extracted from the jack bean plant,
Canavaliaensiformis (Jones and Mobley, 1989; Jabri et al., 1992). There have been limited
studies comparing the effects on carbonate precipitation of ureolytic bacteria and plant
derived using free urease enzyme. Whiffin (2004) reported higher strength and
precipitation in sand cemented via carbonate precipitation using free urease enzyme than
sand cemented using ureolytic bacteria. Whiffin (2004) attributed this higher strength and
greater precipitation achieved using free urease enzyme to the small size of the free urease
enzyme and its lower activity, which resulted in higher precipitation of calcite crystals.
MICP STUDIES ON SOIL STRENGTH
Whiffin (2004) was the first person to conduct a detailed investigation of the
impacts of MICP on the physical characteristics of soil. Whiffin (2004) performed triaxial
shear strength tests on MICP-treated Koolschijn sand and 90% Koolschijn sand mixed with
10% peat. The results showed that the shear strength for Koolschijn sand was 1800 kPa,
whereas Koolschijn sand mixed with 10% peat showed no improvement compared to
12
untreated Koolschijn sand. Whiffin (2004) reported that increasing numbers of cycles of
treatment in Koolschijn sand mixed with 10% peat led to improved shear strength. Whiffin
inserted varying amounts of urea, CaCl2, and ureolytic bacteria into these soils to catalyze
CaCO3 precipitation. Higher concentrations of urea caused an increase in the
compressional wave (P-wave) velocity and shear strength of the specimen. Additionally,
Whiffin (2004) tested the strength and stiffness of these soils in order to understand the
effects of biocementation. Biocementation refers to binding between particles of sand
through the precipitation of CaCO3. Whiffin (2004) reported that Koolschijn sand, treated
through biocementation, showed an eight-fold increase in the shear strength compared to
untreated sand. However, the basis of this statement is not clear since the confining
pressure, friction angle, and cohesion were not reported. Furthermore, Whiffin et al. (2007)
report that, to achieve a measurable unconfined compressive strength (UCS), the
percentage of CaCO3 precipitated into sand should be at least 3.5% (w/w).
Dejong et al. (2006) compared shear strength among MICP-treated and untreated
samples of Ottawa 50-70 silica sand in loose and dense conditions (i.e., at 35% and 70%
relative density, respectively). The concentration of the solution that was injected into the
samples were 0.33 M Urea, 0.95 M calcium chloride, and 2 x 10⁶ cells/mL
BacillusPasteurii. The results showed an increase in shear wave velocity with the number
of treatment cycles. After one cycle of treatment, 180 m/s for dense sand, and
approximately 155 m/s for loose sand. However, after ten cycles of treatments, the shear
wave velocity reached approximately 540 m/s for both conditions. The shear wave velocity
of the untreated sand was around 125 m/s. Dejong et al. (2006) noted that there are several
factors that must be considered in order to achieve a favorable outcome when treating soil
13
via MICP, including pH of the pore fluid, concentration of microbes, oxygen supply,
number of treatment cycles, and availability of ionic calcium.
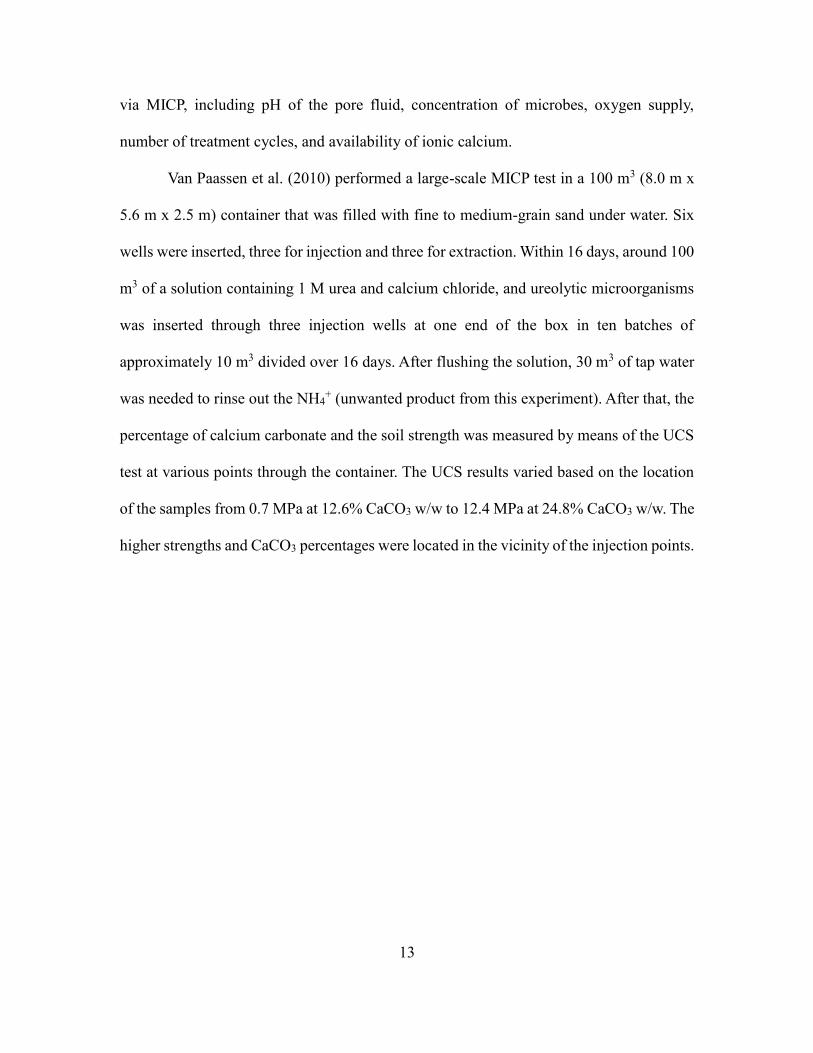
Van Paassen et al. (2010) performed a large-scale MICP test in a 100 m3 (8.0 m x
5.6 m x 2.5 m) container that was filled with fine to medium-grain sand under water. Six
wells were inserted, three for injection and three for extraction. Within 16 days, around 100
m3 of a solution containing 1 M urea and calcium chloride, and ureolytic microorganisms
was inserted through three injection wells at one end of the box in ten batches of
approximately 10 m3 divided over 16 days. After flushing the solution, 30 m3 of tap water
was needed to rinse out the NH4+ (unwanted product from this experiment). After that, the
percentage of calcium carbonate and the soil strength was measured by means of the UCS
test at various points through the container. The UCS results varied based on the location
of the samples from 0.7 MPa at 12.6% CaCO3 w/w to 12.4 MPa at 24.8% CaCO3 w/w. The
higher strengths and CaCO3 percentages were located in the vicinity of the injection points.
14
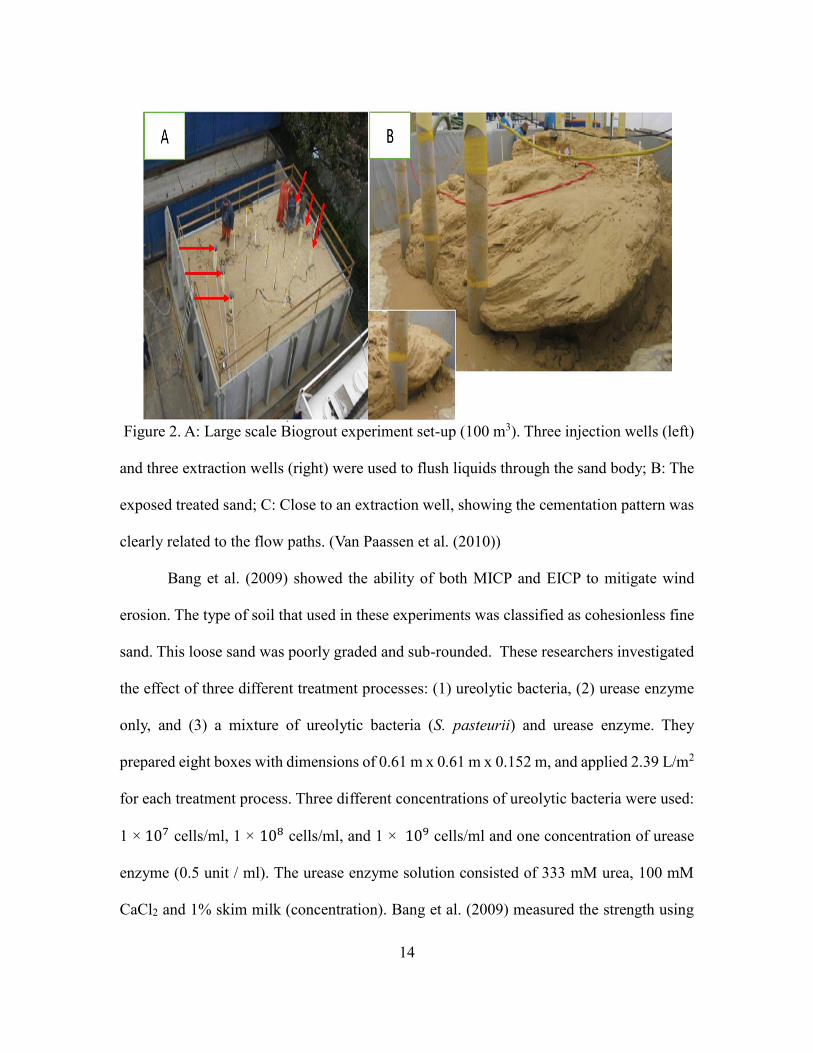
Figure 2. A: Large scale Biogrout experiment set-up (100 m3). Three injection wells (left)
and three extraction wells (right) were used to flush liquids through the sand body; B: The
exposed treated sand; C: Close to an extraction well, showing the cementation pattern was
clearly related to the flow paths. (Van Paassen et al. (2010))
Bang et al. (2009) showed the ability of both MICP and EICP to mitigate wind
erosion. The type of soil that used in these experiments was classified as cohesionless fine
sand. This loose sand was poorly graded and sub-rounded. These researchers investigated
the effect of three different treatment processes: (1) ureolytic bacteria, (2) urease enzyme
only, and (3) a mixture of ureolytic bacteria (S. pasteurii) and urease enzyme. They
prepared eight boxes with dimensions of 0.61 m x 0.61 m x 0.152 m, and applied 2.39 L/m2
for each treatment process. Three different concentrations of ureolytic bacteria were used:
1 × 10⁷ cells/ml, 1 × 10⁸ cells/ml, and 1 × 10⁹ cells/ml and one concentration of urease
enzyme (0.5 unit / ml). The urease enzyme solution consisted of 333 mM urea, 100 mM
CaCl2 and 1% skim milk (concentration). Bang et al. (2009) measured the strength using
C
15
Torvane and conducted wind tunnel tests to measure the amount of soil loss. Their results
indicated that the bacteria concentrations were not a significant parameter. Also, their
results indicated that the urease enzyme treatment gave the highest strength and resulted in
the lowest amount of sand detachment (soil loss).
Meyer et al. (2011) investigated the effect of using MICP for fugitive dust
mitigation using wind tunnel tests. They looked at the effect of different concentrations of
ureolytic bacteria (S. pasteurii), temperature and humidity, and effects of soil type (washed
and unwashed sand). The type of soil that was used classified as well-graded sand.
Different concentrations of bacteria were used (from 1 × 10⁵ cells/ml to 1 × 10⁹ cells/ml)
and samples were cured at different temperatures (20, 30, and 45 degrees Celsius) and two
relative humidities (20% and 100%). Meyer et al. (2011) found that a higher concentration
of ureolytic bacteria led to the lowest percentage of soil loss. Meyer et al. (2011) observed
there was a difference between the washed sand and unwashed sand. They conjectured that
the taking away of the finer soil by washing led to filling the voids of the specimen with
carbonate precipitation. Moreover, they found that low humidity with high temperature led
to decrease in soil loss compared to high humidity with low temperature.
Al Qabany et al. (2012) investigated the optimum level and efficiency of
Sporosarcina Pasteurii in inducing the precipitation of CaCO3 using medium to coarse
sand (grain size between 90 µm to 300 µm). Their results showed that the input rates for
urea and CaCl2 should be below 0.042 Molar/L/h and that the concentration of the solution
of urea and CaCl2 should be less than 1 M to achieve 100% efficiency. Their study showed
that lower concentrations will provide more uniform cementation and less clogging than
higher concentrations.
16
Cheng et al. (2013), performed laboratory tests on two types of sands (Cook
Industrial, Minerals Pty. Ltd., Western Australia) fine and course sand respectively. Both
of these sands were identified as poorly graded sand with a specific gravity of 2.62. Four
different degrees of saturation (20%, 40%, 80%, and 100%) were used. Samples were
prepared into a PVC column 16 cm in height with a 5.48 cm inner diameter using
percolation method. They performed permeability tests, freeze-thaw durability, UCS, and
consolidated undrained triaxial tests. Cheng et al. (2013) report that higher strength with
less precipitated carbonate was achieved at lower degrees of saturation than the samples
with higher degrees of saturation. In the unsaturated samples, carbonate crystals formed
primary at the particle contact points, which may explain why they were stronger compared
to the more highly-saturated samples. The results of Cheng et al. (2013) suggest that the
location of the precipitated CaCO3 in a sample can be more important than the quantity.
Gomez et al. (2014) showed that MICP can be accomplished via bio-stimulations,
i.e., by stimulating indigenous ureolytic bacteria in situ. Soil columns 10.2 cm high by 5.1
cm in diameter were used with filters at the bottom to reduce the loss of sand. Eight
different types of sand were used and all of them were classified as poorly graded sand
(SP). These samples were prepared at target relative densities of approximately 50%. For
the first 10 days, these samples were treated with a stimulation solution containing 0.5 M
urea, 0.0125 mol/L ammonium chloride, 0.17 mol/L sodium acetate, and 0.1 g/L yeast
extract to stimulate native ureolytic microbes. Next, they were treated with a cementation
solution containing 0.5 M urea and 0.25 M calcium chloride from day 11 up to day 20. The
cementation solution contained the ingredients of the stimulation solution plus calcium
chloride dihydrate. The total amounts of solution applied to each specimen were around
17
300 ml (1.5 pore volume) twice a day. They found that the highest value for unconfined
compressive strength was 5.3 MPa, with 13.2% CaCO3 after 10 days of treatment with the
cementation solution.
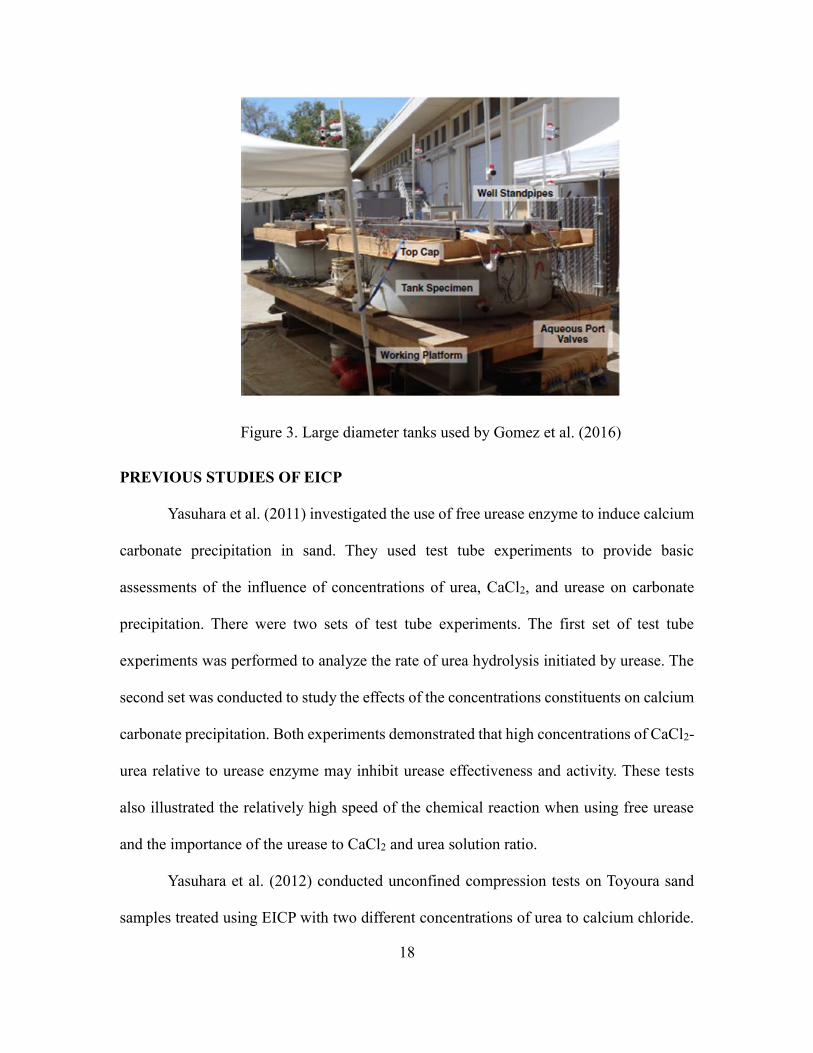
Gomez et al. (2016) examined MICP via stimulation of indigenous microbes on a
larger scale to improve the mechanical properties of soil. They used two large circular
tanks, 1.7 m in diameter and 0.5 m as height. In each tank, three wells were employed to
inject the combined stimulation, augmentation solution, and cementation solution. They
used a local sand, classified as poorly graded sand. The sand was placed with target relative
density of 45%. Figure 3 demonstrates the set-up of these two tanks. Each well was injected
with a different concentration of the solution. For the first five days of treatment, 0.5 pore
volume of stimulation solution was injected into each well. Then followed by 0.75 pore
volume of cementation solution into each well. Each well received at the end 1.5 pore
volume of solution. Cone penetration tests (CPT) and shear wave velocity tests were
conducted before and after treatment. The results showed an increased in the soil’s shear
wave velocity to 961m/s and CPT tip resistance 30.1MPa from initial values of
approximately 131 m/s and 5.3 MPa for the untreated soil.
18
Figure 3. Large diameter tanks used by Gomez et al. (2016)
PREVIOUS STUDIES OF EICP
Yasuhara et al. (2011) investigated the use of free urease enzyme to induce calcium
carbonate precipitation in sand. They used test tube experiments to provide basic
assessments of the influence of concentrations of urea, CaCl2, and urease on carbonate
precipitation. There were two sets of test tube experiments. The first set of test tube
experiments was performed to analyze the rate of urea hydrolysis initiated by urease. The
second set was conducted to study the effects of the concentrations constituents on calcium
carbonate precipitation. Both experiments demonstrated that high concentrations of CaCl2-
urea relative to urease enzyme may inhibit urease effectiveness and activity. These tests
also illustrated the relatively high speed of the chemical reaction when using free urease
and the importance of the urease to CaCl2 and urea solution ratio.
Yasuhara et al. (2012) conducted unconfined compression tests on Toyoura sand
samples treated using EICP with two different concentrations of urea to calcium chloride.
19
The lower concentration was 0.5 M urea, 0.5 M CaCl2, and 1 g/l00 ml of urease enzyme.
The higher concentration was 1 M urea, 1 M CaCl2, and 1 g/l of urease enzyme. In these
experiments, urease (Kishida Chemical Co., Ltd.: 020-83242) was mixed into the sand as
a powder. Note that no information was provided about the urease activity, if it was high
or low. The test specimens were 101.6 mm in height and 50.8 mm in diameter. In these
experiments, 100 ml of a CaCl2-urea solution (0.80 pore volume) was injected in the
samples. After this mixing, a CaCl2-urea solution was injected into the sand. This injection
was repeated between four to eight times in half-hour intervals for both concentrations.
The UCS of the treated samples with low concentration, (U:C = 0.5 M), was a maximum
of 890 kPa after eight cycles of treatment and 6.76% CaCO3. However, a UCS of 1.6 MPa
after four cycles of treatment and 5.1% CaCO3 was obtained when the high concentration
of urea and calcium chloride was applied.
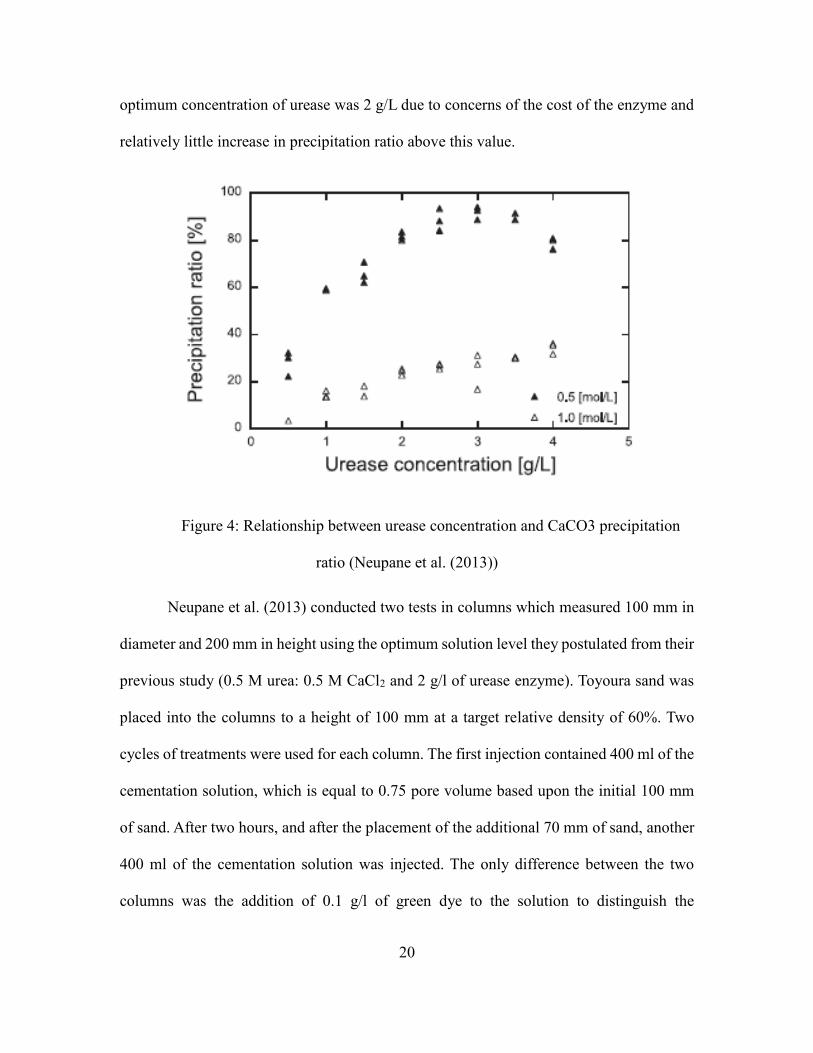
Neupane et al. (2013) also conducted test tube tests to find the optimum
concentration for EICP for improving soil properties. Their results indicate that higher
precipitation efficiency was achieved at lower concentrations of urea and calcium chloride.
They used high urease activity (Kishida Chemical, 2950U/g) and concentrations of urease
from 1 to 4 g/l. Urea and CaCl2 concentrations of 0.5 mol/L and 1.0 mol/L were used in
this study. The precipitation ratio, defined as the ratio of the precipitated mass of CaCO3 to
the theoretical maximum mass of CaCO3 was observed to decrease after the urease
concentration exceeded 3 g/l, as illustrated in Figure 4. Neupane et al. (2013) postulate that
the decline in the precipitation ratio after 3 g/l may have occurred because stored urease
solution loses some of its activity within a matter of hours. They also decided that the
20
optimum concentration of urease was 2 g/L due to concerns of the cost of the enzyme and
relatively little increase in precipitation ratio above this value.
Figure 4: Relationship between urease concentration and CaCO3 precipitation
ratio (Neupane et al. (2013))
Neupane et al. (2013) conducted two tests in columns which measured 100 mm in
diameter and 200 mm in height using the optimum solution level they postulated from their
previous study (0.5 M urea: 0.5 M CaCl2 and 2 g/l of urease enzyme). Toyoura sand was
placed into the columns to a height of 100 mm at a target relative density of 60%. Two
cycles of treatments were used for each column. The first injection contained 400 ml of the
cementation solution, which is equal to 0.75 pore volume based upon the initial 100 mm
of sand. After two hours, and after the placement of the additional 70 mm of sand, another
400 ml of the cementation solution was injected. The only difference between the two
columns was the addition of 0.1 g/l of green dye to the solution to distinguish the
21
cementation in one column. During the second injection, the cementation solution did not
penetrate completely through the soil because of the precipitation that occurred after the
first injection. The first injection was under gravity flow. During the second injection, the
pressure on the top of the injection tube was increased to 30 kPa to maintain the rate of
flow. Following treatment, the columns contained comparable amounts of CaCO3: around
3% at 10 mm beneath the injection tube and 1.6% at 50 mm beneath the injection tube.
Subsequently, these investigators treated four drums of soil 850 mm in height and 560 mm
in diameter using the same injection technique with 30 L of the solution for each injection.
They found that more cycles of treatment resulted in increased precipitation.
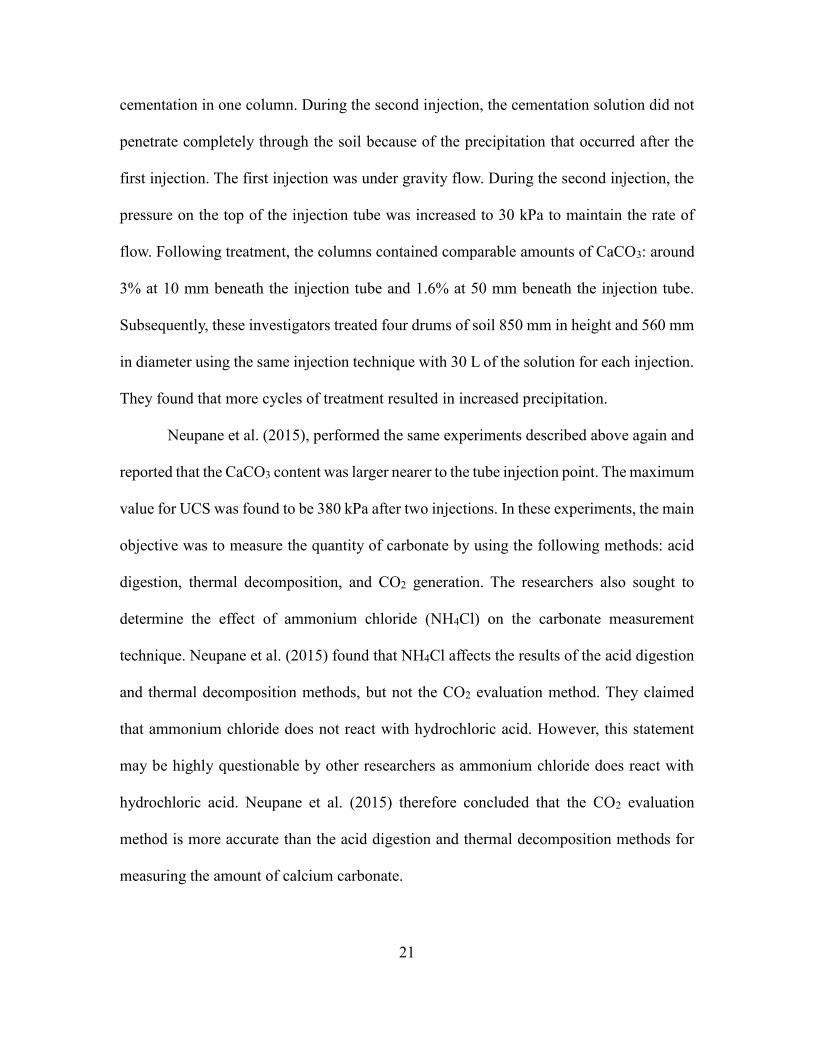
Neupane et al. (2015), performed the same experiments described above again and
reported that the CaCO3 content was larger nearer to the tube injection point. The maximum
value for UCS was found to be 380 kPa after two injections. In these experiments, the main
objective was to measure the quantity of carbonate by using the following methods: acid
digestion, thermal decomposition, and CO2 generation. The researchers also sought to
determine the effect of ammonium chloride (NH4Cl) on the carbonate measurement
technique. Neupane et al. (2015) found that NH4Cl affects the results of the acid digestion
and thermal decomposition methods, but not the CO2 evaluation method. They claimed
that ammonium chloride does not react with hydrochloric acid. However, this statement
may be highly questionable by other researchers as ammonium chloride does react with
hydrochloric acid. Neupane et al. (2015) therefore concluded that the CO2 evaluation
method is more accurate than the acid digestion and thermal decomposition methods for
measuring the amount of calcium carbonate.
22
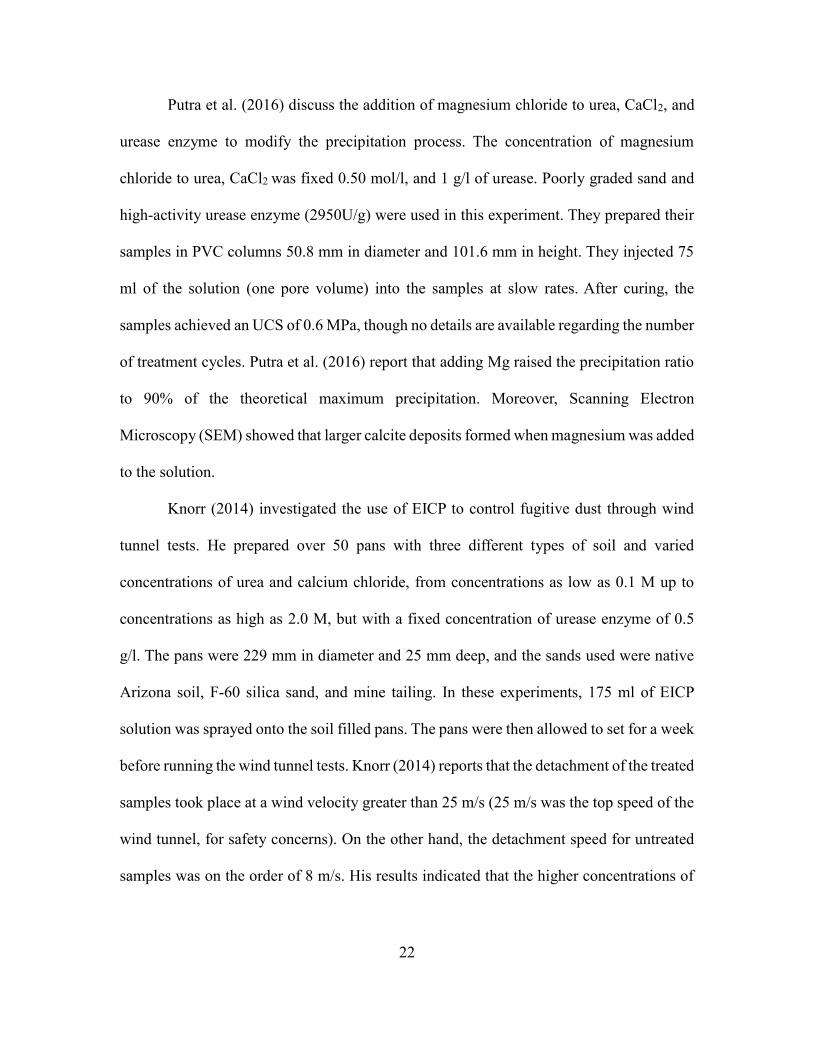
Putra et al. (2016) discuss the addition of magnesium chloride to urea, CaCl2, and
urease enzyme to modify the precipitation process. The concentration of magnesium
chloride to urea, CaCl2 was fixed 0.50 mol/l, and 1 g/l of urease. Poorly graded sand and
high-activity urease enzyme (2950U/g) were used in this experiment. They prepared their
samples in PVC columns 50.8 mm in diameter and 101.6 mm in height. They injected 75
ml of the solution (one pore volume) into the samples at slow rates. After curing, the
samples achieved an UCS of 0.6 MPa, though no details are available regarding the number
of treatment cycles. Putra et al. (2016) report that adding Mg raised the precipitation ratio
to 90% of the theoretical maximum precipitation. Moreover, Scanning Electron
Microscopy (SEM) showed that larger calcite deposits formed when magnesium was added
to the solution.
Knorr (2014) investigated the use of EICP to control fugitive dust through wind
tunnel tests. He prepared over 50 pans with three different types of soil and varied
concentrations of urea and calcium chloride, from concentrations as low as 0.1 M up to
concentrations as high as 2.0 M, but with a fixed concentration of urease enzyme of 0.5
g/l. The pans were 229 mm in diameter and 25 mm deep, and the sands used were native
Arizona soil, F-60 silica sand, and mine tailing. In these experiments, 175 ml of EICP
solution was sprayed onto the soil filled pans. The pans were then allowed to set for a week
before running the wind tunnel tests. Knorr (2014) reports that the detachment of the treated
samples took place at a wind velocity greater than 25 m/s (25 m/s was the top speed of the
wind tunnel, for safety concerns). On the other hand, the detachment speed for untreated
samples was on the order of 8 m/s. His results indicated that the higher concentrations of
23
urea and calcium chloride led to increased wind erosion resistance SEM images showed
that there was carbonate precipitation on the surface of the sand.
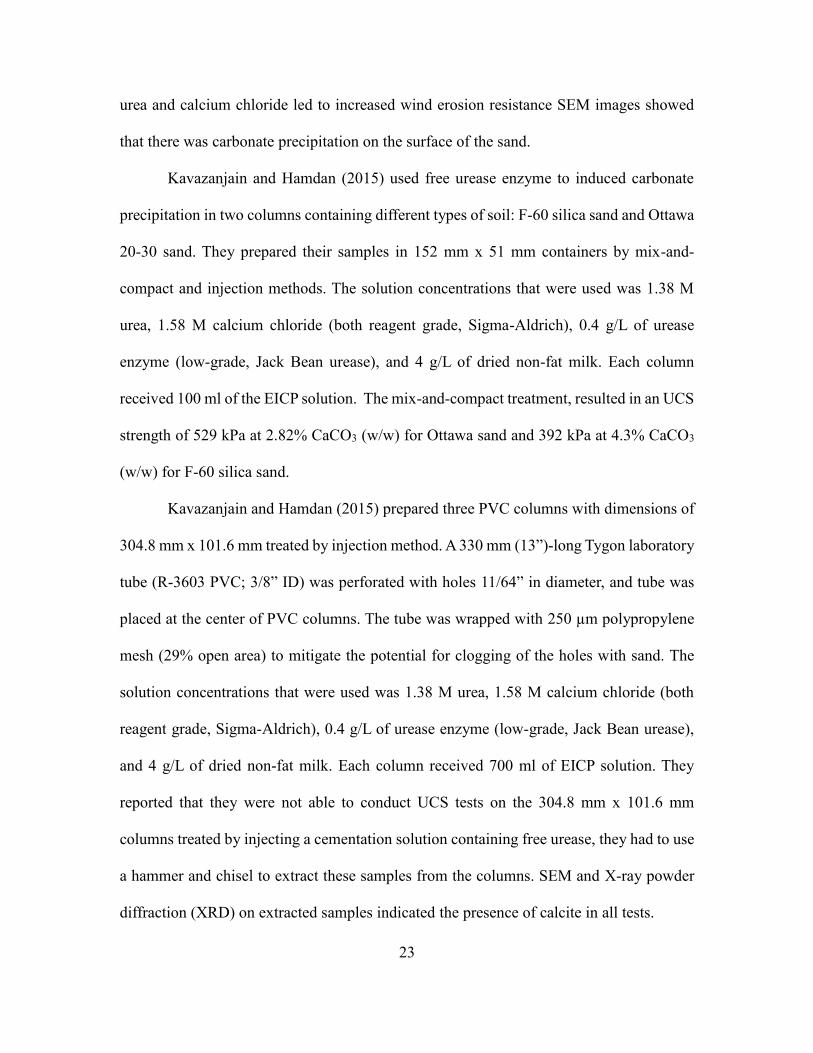
Kavazanjain and Hamdan (2015) used free urease enzyme to induced carbonate
precipitation in two columns containing different types of soil: F-60 silica sand and Ottawa
20-30 sand. They prepared their samples in 152 mm x 51 mm containers by mix-and-
compact and injection methods. The solution concentrations that were used was 1.38 M
urea, 1.58 M calcium chloride (both reagent grade, Sigma-Aldrich), 0.4 g/L of urease
enzyme (low-grade, Jack Bean urease), and 4 g/L of dried non-fat milk. Each column
received 100 ml of the EICP solution. The mix-and-compact treatment, resulted in an UCS
strength of 529 kPa at 2.82% CaCO3 (w/w) for Ottawa sand and 392 kPa at 4.3% CaCO3
(w/w) for F-60 silica sand.
Kavazanjain and Hamdan (2015) prepared three PVC columns with dimensions of
304.8 mm x 101.6 mm treated by injection method. A 330 mm (13”)-long Tygon laboratory
tube (R-3603 PVC; 3/8” ID) was perforated with holes 11/64” in diameter, and tube was
placed at the center of PVC columns. The tube was wrapped with 250 µm polypropylene
mesh (29% open area) to mitigate the potential for clogging of the holes with sand. The
solution concentrations that were used was 1.38 M urea, 1.58 M calcium chloride (both
reagent grade, Sigma-Aldrich), 0.4 g/L of urease enzyme (low-grade, Jack Bean urease),
and 4 g/L of dried non-fat milk. Each column received 700 ml of EICP solution. They
reported that they were not able to conduct UCS tests on the 304.8 mm x 101.6 mm
columns treated by injecting a cementation solution containing free urease, they had to use
a hammer and chisel to extract these samples from the columns. SEM and X-ray powder
diffraction (XRD) on extracted samples indicated the presence of calcite in all tests.

24
Hamdan (2015) and Hamdan et al. (2016) studied the use of xanthan gum, guar
gum, and inert polyol-cellulose hydrogels to improve the efficiency of EICP in unsaturated
soil via surficial spraying and percolation. They hypothesized that the viscosity of these
mixtures would direct the precipitation reaction to the contact points between soil particles.
They tested their hypothesis through two experiments. The first one used 50 ml glass
beakers to assess the precipitation of EICP without adding soil. The second experiment
involved filling paper cups with F-60 silica sand and pouring the EICP solution with and
without hydrogel onto the soil. The ratio of Urea to CaCl2 was always 1.5:1 in these
experiments, but the initial concentration of Urea was varied from 2 M to 0.4 M. Using
both high and low activity of urease enzyme. From the glass beaker experiment, through
the observation of gas bubbles, these investigators deduced that hydrogel can reduce gas
generation (i.e., ammonia (NH3) and carbon dioxide (CO2)) without any effect on carbonate
precipitation. The paper cup experiments illustrated that including xanthan gum and guar
gum in the cementation solution resulted in less penetration and harder crust thickness than
inert polyol-cellulose. Hamdan et al. (2016) report that salts were not removed after rinsing
specimens treated with a cementation solution containing a hydrogel because the hydrogel
polymer coated the sand particles and was not easily removed.
25
CHAPTER 3
BASELINE INVESTIGATION ON ENZYME INDUCED CALCIUM
CARBONATE PRECIPITATION
INTRODUCTION
This chapter presents a baseline study on enzyme induced calcium carbonate
precipitation (EICP), a bio-inspired technique for soil improvement. This study aims to
investigate the primary aspects of EICP-treatment of soil. For this purpose, a series of test
tube experiments were carried out to determine the optimum recipe for EICP treatment.
Next, the effectiveness of two different soil treatment methods (i.e., percolation and mix-
and-compact) was evaluated. The mineralogy of the precipitates generated using both
methods was examined. The effect of providing calcite seeds in the soil as nucleation sites
on mineralogy was also evaluated. Treatment effluent was evaluated to see if it can be used
as a source of enzyme and as a source of substrates for further treatment. The effect of
water rinsing on treated soil samples (to wash out the soluble substances, e.g., salts) was
also assessed.
Sustainability concerns associated with conventional soil improvement techniques
have motivated geotechnical engineers to move toward biologically-based solutions. The
techniques which have been so far introduced in this regard can be divided into bio-
mediated techniques which use living organisms for soil improvement, and bio-inspired
techniques which mimic biological processes without any participation of living
organisms. Microbially induced carbonate precipitation (MICP), a bio-mediated technique,
has received the most attention by researchers studying biological-based-solutions (Chu et
al. 2012; DeJong et al. 2006; Montoya and DeJong 2015; van Paassen 2009; Whiffin et al.
26
2007). In MICP, calcium chloride, urea, ureolytic bacterial cells, and appropriate nutrients
for bacterial growth are introduced into granular soil to precipitate calcium carbonate.
Calcium carbonate precipitation improves the strength, stiffness, and dilatancy of the soil
by pore-filling, particle roughening, and inter-particle binding (Yang et al. 2016). MICP
will also decrease the permeability of the soil, though the effect is minimal until relatively
larger amount of carbonate is precipitated (Cuthbert et al. 2013).
In MICP, ureolytic bacteria play a catalyzing role through generation of urease
enzyme. Bacterial cells also act as nucleation sites through adsorption of calcium ions to
their negatively charged surface, creating localized supersaturation (Al-Thawadi 2008).
However, relying upon bacteria as the source of urease for MICP creates many unknowns
and uncertainties (e.g. physical non-homogeneity, limited oxygen availability, complex
pore fluid chemistry, presence of other microorganisms, etc.) that can raise difficulties.
These difficulties may include controlling bacterial growth and their enzymatic activity,
bacterial cell attachment to soil particles, and interaction between target species and other
microorganisms in soil. In addition, MICP via bio-augmentation (i.e., by introducing
exogenous bacteria to the soil) in general cannot be applied into soil with pores (or more
properly pore throats) smaller than the ureolytic bacteria. Bio-stimulation, in which
indigenous ureolytic bacterial cells are activated in-situ, has been developed to overcome
some of these difficulties (Burbank et al. 2011 and 2012; Gomez et al. 2014 and 2016).
EICP is expected to eliminate some of the challenges caused by using bacterial
cells. In EICP, free urease enzyme is used as the catalyst for hydrolysis of urea. Urease can
be isolated from plants and plant product such as jack beans and watermelon seeds. Free
urease has a size on the order of 12 nm per subunit (Blakely and Zerner 1984) and is soluble
27
in water, facilitating its transport within the pores of soil. Using EICP, there are no concerns
about oxygen availability for deep soil treatment, providing nutrients for bacterial activity,
the competing effect of other microorganisms, or cell attachment to soil particles. However,
the EICP approach lacks the nucleation sites provided by bacteria, which may cause
disorder in precipitation morphology. The rapid rate of precipitation that can be associated
with EICP can also adversely affect carbonate morphology. Furthermore, the urease
enzymes available in the market are also expensive, as they are of medical grade and are
produced in small quantities.
FALCON TUBE TESTS
Optimum EICP solution
Initial tests were carried out without soil in 50-ml Falcon test tubes containing 20
ml of EICP solution. The EICP solutions were prepared by dissolving different
concentrations of calcium chloride, urea and enzyme into deionized water. The calcium
chloride dihydrate, CaCl2.2H2O, and urea used is this study were from VWR. The enzyme
used throughout the study was low activity jack bean-extracted urease without a specific
average activity from Fisher Scientific. However, the results from testing at ASU showed
that the average activity of the urease used in this study was around3500 U/g. In order to
remove impurities, the enzyme solution was filtered using 0.45 µm syringe filters. Fresh
enzyme solution was always used. Various concentrations of CaCl2, urea, and urease
enzyme were tested in order to find the optimum EICP solution. Table 1 presents the 37-
different concentrations of constituents used in these tests. The electrical conductivity of
the calcium chloride and urea in solution, hereinafter called initial electrical conductivity
of EICP solution, was measured prior to adding enzyme. The initial electrical conductivity
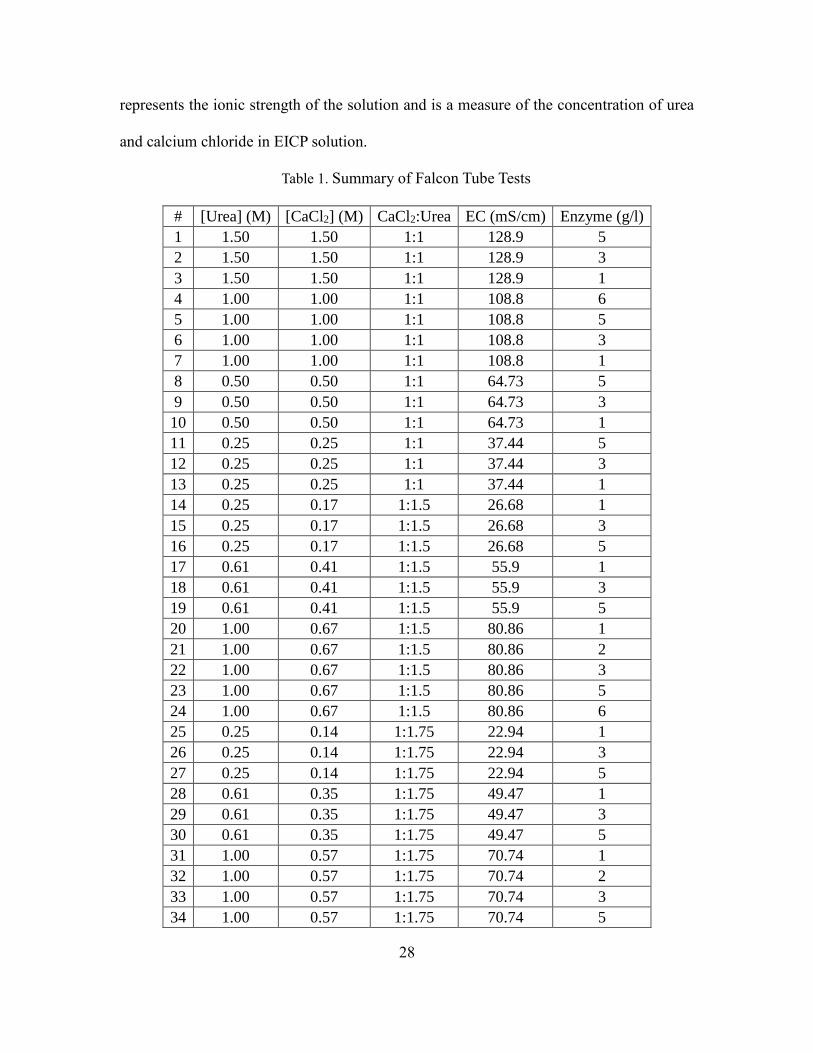
28
represents the ionic strength of the solution and is a measure of the concentration of urea
and calcium chloride in EICP solution.
Table 1. Summary of Falcon Tube Tests
# [Urea] (M) [CaCl2] (M) CaCl2:Urea EC (mS/cm) Enzyme (g/l)
1 1.50 1.50 1:1 128.9 5
2 1.50 1.50 1:1 128.9 3
3 1.50 1.50 1:1 128.9 1
4 1.00 1.00 1:1 108.8 6
5 1.00 1.00 1:1 108.8 5
6 1.00 1.00 1:1 108.8 3
7 1.00 1.00 1:1 108.8 1
8 0.50 0.50 1:1 64.73 5
9 0.50 0.50 1:1 64.73 3
10 0.50 0.50 1:1 64.73 1
11 0.25 0.25 1:1 37.44 5
12 0.25 0.25 1:1 37.44 3
13 0.25 0.25 1:1 37.44 1
14 0.25 0.17 1:1.5 26.68 1
15 0.25 0.17 1:1.5 26.68 3
16 0.25 0.17 1:1.5 26.68 5
17 0.61 0.41 1:1.5 55.9 1
18 0.61 0.41 1:1.5 55.9 3
19 0.61 0.41 1:1.5 55.9 5
20 1.00 0.67 1:1.5 80.86 1
21 1.00 0.67 1:1.5 80.86 2
22 1.00 0.67 1:1.5 80.86 3
23 1.00 0.67 1:1.5 80.86 5
24 1.00 0.67 1:1.5 80.86 6
25 0.25 0.14 1:1.75 22.94 1
26 0.25 0.14 1:1.75 22.94 3
27 0.25 0.14 1:1.75 22.94 5
28 0.61 0.35 1:1.75 49.47 1
29 0.61 0.35 1:1.75 49.47 3
30 0.61 0.35 1:1.75 49.47 5
31 1.00 0.57 1:1.75 70.74 1
32 1.00 0.57 1:1.75 70.74 2
33 1.00 0.57 1:1.75 70.74 3
34 1.00 0.57 1:1.75 70.74 5
29
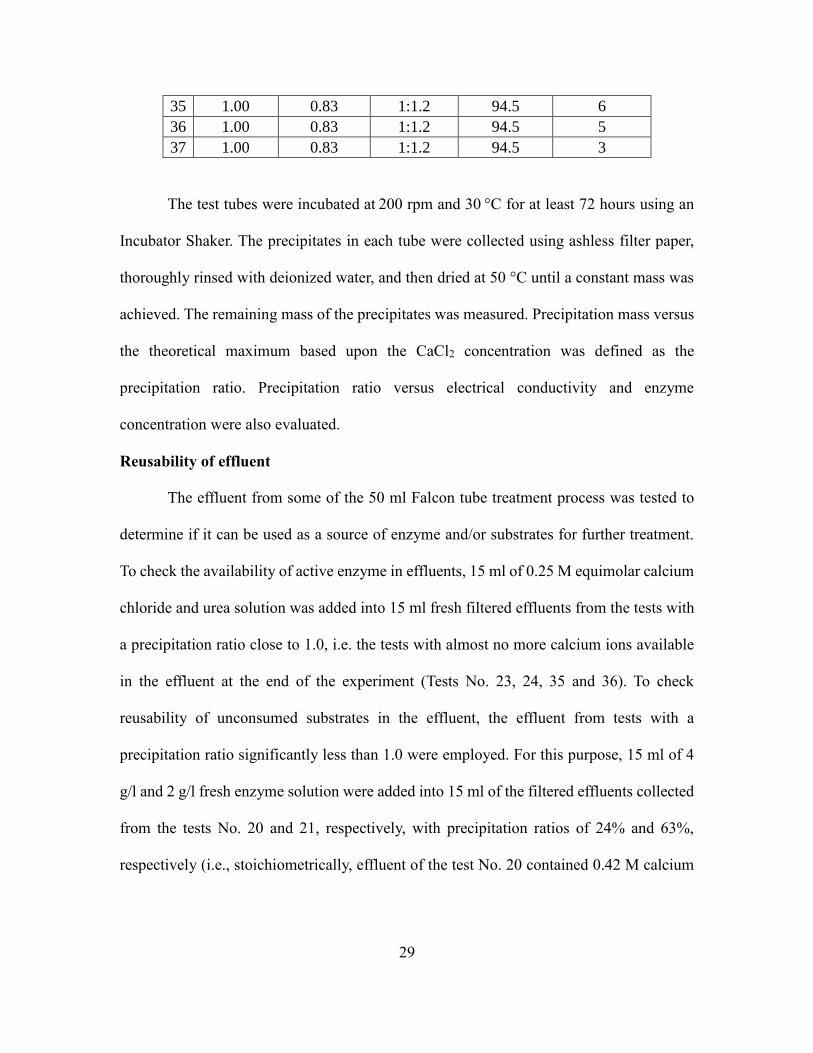
35 1.00 0.83 1:1.2 94.5 6
36 1.00 0.83 1:1.2 94.5 5
37 1.00 0.83 1:1.2 94.5 3
The test tubes were incubated at 200 rpm and 30 °C for at least 72 hours using an
Incubator Shaker. The precipitates in each tube were collected using ashless filter paper,
thoroughly rinsed with deionized water, and then dried at 50 °C until a constant mass was
achieved. The remaining mass of the precipitates was measured. Precipitation mass versus
the theoretical maximum based upon the CaCl2 concentration was defined as the
precipitation ratio. Precipitation ratio versus electrical conductivity and enzyme
concentration were also evaluated.
Reusability of effluent
The effluent from some of the 50 ml Falcon tube treatment process was tested to
determine if it can be used as a source of enzyme and/or substrates for further treatment.
To check the availability of active enzyme in effluents, 15 ml of 0.25 M equimolar calcium
chloride and urea solution was added into 15 ml fresh filtered effluents from the tests with
a precipitation ratio close to 1.0, i.e. the tests with almost no more calcium ions available
in the effluent at the end of the experiment (Tests No. 23, 24, 35 and 36). To check
reusability of unconsumed substrates in the effluent, the effluent from tests with a
precipitation ratio significantly less than 1.0 were employed. For this purpose, 15 ml of 4
g/l and 2 g/l fresh enzyme solution were added into 15 ml of the filtered effluents collected
from the tests No. 20 and 21, respectively, with precipitation ratios of 24% and 63%,
respectively (i.e., stoichiometrically, effluent of the test No. 20 contained 0.42 M calcium

30
chloride and 0.63 M urea unconsumed, and the effluent of the test No. 21 contained 0.25
M calcium chloride and 0.37 M urea unconsumed).
Effect of Calcite Seeds on Mineralogy of the Precipitates
In order to investigate the effect of calcite seeds on the mineralogy of the
precipitates, Test No. 22 was performed with 1% calcite seeds (by mass of the maximum
theoretical carbonate precipitation) added into the EICP solution.
Falcon Tube Test Results
Results of the Optimum EICP solution
The Falcon tube tests were carried out to find the optimum recipe for EICP solution
for use in further soil treatment. The optimum EICP solution was considered to be the best
concentration of ingredients (i.e. calcium chloride, urea and urease enzyme) resulting in
both high precipitation mass and precipitation ratio. The objective was to minimum
consumption of enzyme for production of the desired quantity of carbonate as the enzyme
is the most expensive component of the EICP solution. In this study, considering the price
for the laboratory grade chemicals, the enzyme constitutes 57% - 98% of the cost of the
EICP solution. Precipitation mass and precipitation ratio for each test concentrations are
presents in Table 2.
Changes in precipitation ratio versus enzyme concentration and initial electrical
conductivity of EICP solution are illustrated in Figures 5a,5b, and 5c. The initial electrical
conductivity of the solution changes as the concentration of calcium chloride and urea is
varied as illustrated in Figure 6. As an ionic compound, the increase in conductivity with
increasing concentration of calcium chloride is expected. However, it is observed that urea
slightly suppresses the ionic strength of the solution at higher concentrations even though
31
it is a covalent compound. For instance, the electrical conductivity of the solution
containing 1 M calcium chloride and 1 M urea is 108.8 mS/cm while for the solution with
the same concentration of calcium chloride and 1.5 M urea the electrical conductivity is
104.5 mS/cm. The influence of urea on electrical conductivity could be attributed to a
reduction in mobility of ions in solutions containing a high concentration of urea.
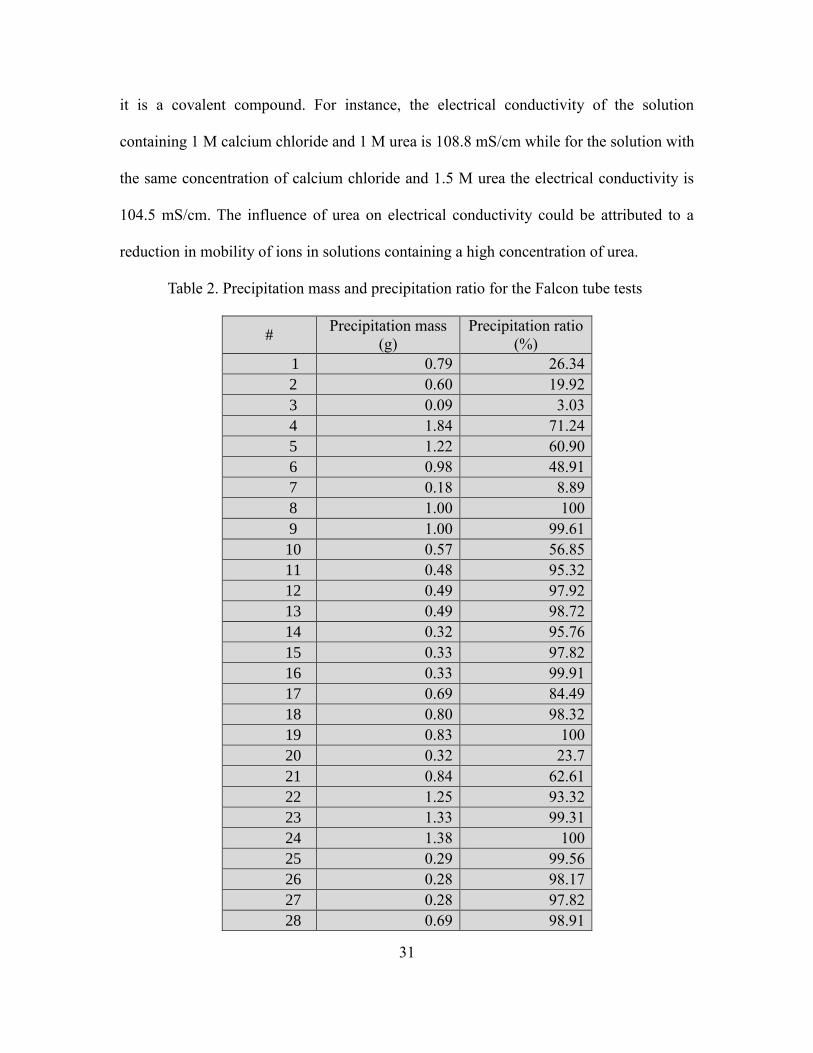
Table 2. Precipitation mass and precipitation ratio for the Falcon tube tests
# Precipitation mass
(g)
Precipitation ratio
(%)
1 0.79 26.34
2 0.60 19.92
3 0.09 3.03
4 1.84 71.24
5 1.22 60.90
6 0.98 48.91
7 0.18 8.89
8 1.00 100
9 1.00 99.61
10 0.57 56.85
11 0.48 95.32
12 0.49 97.92
13 0.49 98.72
14 0.32 95.76
15 0.33 97.82
16 0.33 99.91
17 0.69 84.49
18 0.80 98.32
19 0.83 100
20 0.32 23.7
21 0.84 62.61
22 1.25 93.32
23 1.33 99.31
24 1.38 100
25 0.29 99.56
26 0.28 98.17
27 0.28 97.82
28 0.69 98.91
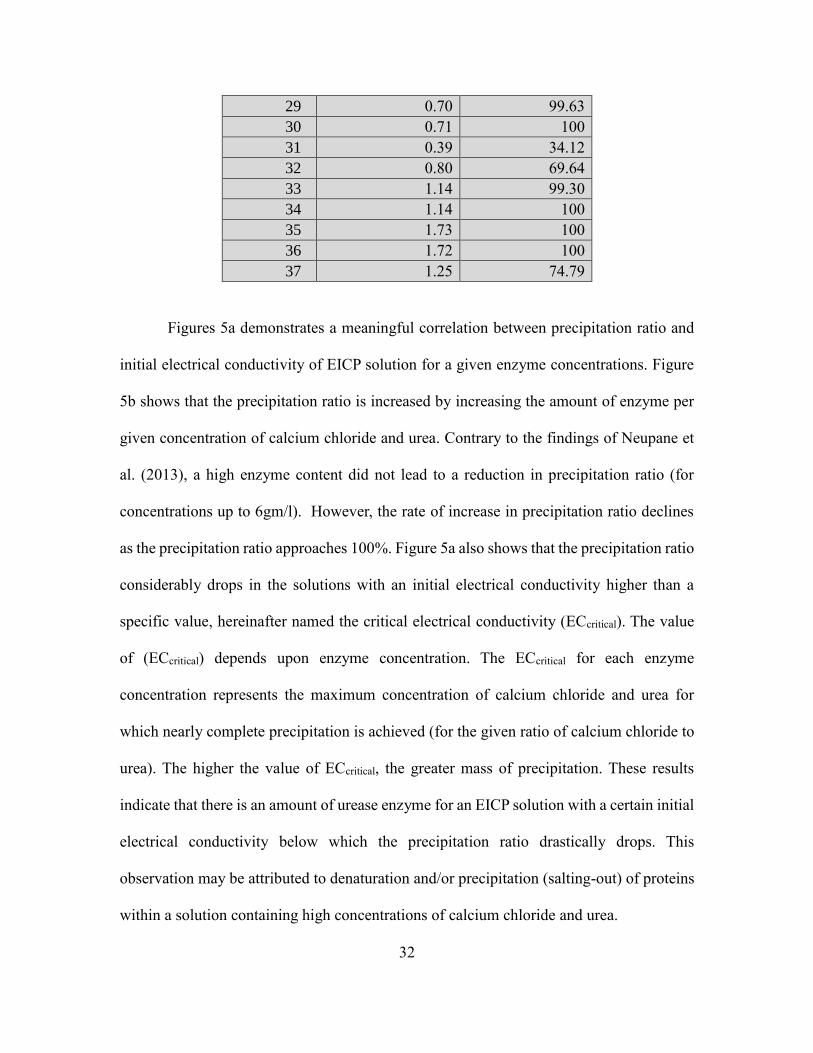
32
29 0.70 99.63
30 0.71 100
31 0.39 34.12
32 0.80 69.64
33 1.14 99.30
34 1.14 100
35 1.73 100
36 1.72 100
37 1.25 74.79
Figures 5a demonstrates a meaningful correlation between precipitation ratio and
initial electrical conductivity of EICP solution for a given enzyme concentrations. Figure
5b shows that the precipitation ratio is increased by increasing the amount of enzyme per
given concentration of calcium chloride and urea. Contrary to the findings of Neupane et
al. (2013), a high enzyme content did not lead to a reduction in precipitation ratio (for
concentrations up to 6gm/l). However, the rate of increase in precipitation ratio declines
as the precipitation ratio approaches 100%. Figure 5a also shows that the precipitation ratio
considerably drops in the solutions with an initial electrical conductivity higher than a
specific value, hereinafter named the critical electrical conductivity (ECcritical). The value
of (ECcritical) depends upon enzyme concentration. The ECcritical for each enzyme
concentration represents the maximum concentration of calcium chloride and urea for
which nearly complete precipitation is achieved (for the given ratio of calcium chloride to
urea). The higher the value of ECcritical, the greater mass of precipitation. These results
indicate that there is an amount of urease enzyme for an EICP solution with a certain initial
electrical conductivity below which the precipitation ratio drastically drops. This
observation may be attributed to denaturation and/or precipitation (salting-out) of proteins
within a solution containing high concentrations of calcium chloride and urea.
33
Figure 5a, 5b, 5c and 6, provide a systematic way for estimation of precipitation
mass and precipitation ratio for a given concentration and proportion of calcium chloride,
urea and urease enzyme. Figure 6 gives the initial electrical conductivity for each
concentration of calcium chloride and urea. The required amount of enzyme to obtain a
high precipitation ratio can then be estimated using the graph in Figure 5a.
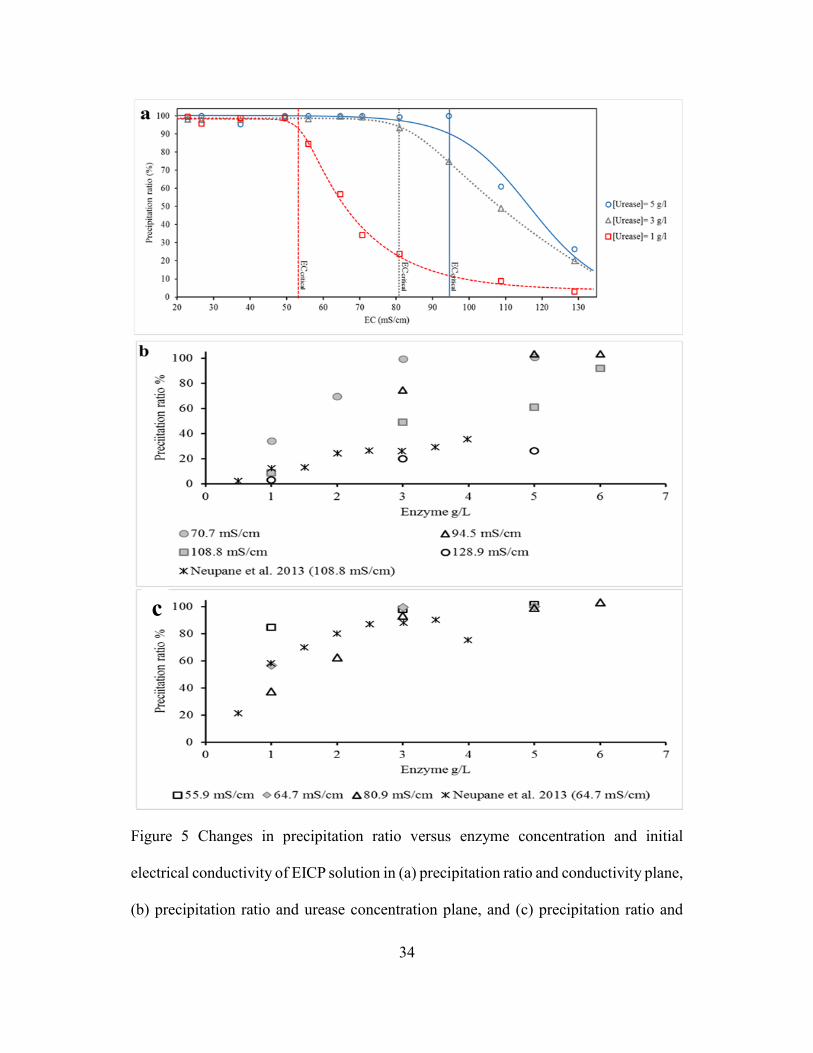
34
c
Figure 5 Changes in precipitation ratio versus enzyme concentration and initial
electrical conductivity of EICP solution in (a) precipitation ratio and conductivity plane,
(b) precipitation ratio and urease concentration plane, and (c) precipitation ratio and
urease concentration plane.
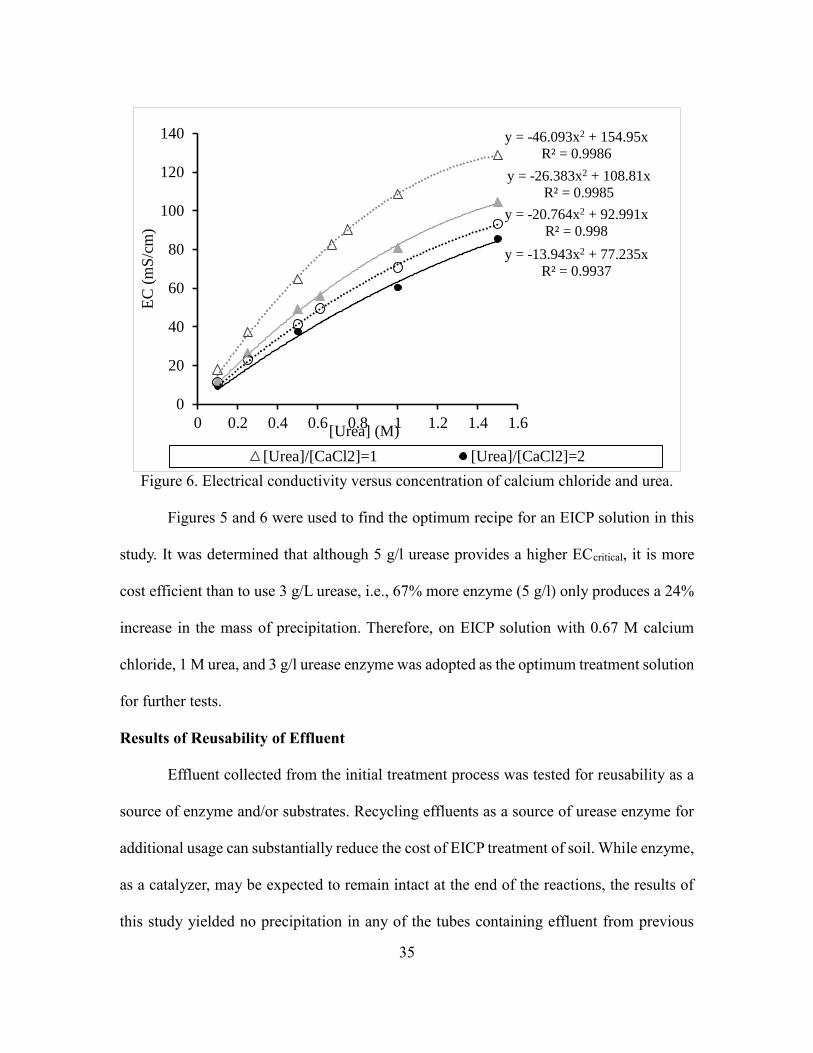
35
Figure 6. Electrical conductivity versus concentration of calcium chloride and urea.
Figures 5 and 6 were used to find the optimum recipe for an EICP solution in this
study. It was determined that although 5 g/l urease provides a higher ECcritical, it is more
cost efficient than to use 3 g/L urease, i.e., 67% more enzyme (5 g/l) only produces a 24%
increase in the mass of precipitation. Therefore, on EICP solution with 0.67 M calcium
chloride, 1 M urea, and 3 g/l urease enzyme was adopted as the optimum treatment solution
for further tests.
Results of Reusability of Effluent
Effluent collected from the initial treatment process was tested for reusability as a
source of enzyme and/or substrates. Recycling effluents as a source of urease enzyme for
additional usage can substantially reduce the cost of EICP treatment of soil. While enzyme,
as a catalyzer, may be expected to remain intact at the end of the reactions, the results of
this study yielded no precipitation in any of the tubes containing effluent from previous
y = -46.093x2 + 154.95x
R² = 0.9986
y = -13.943x2 + 77.235x
R² = 0.9937
y = -26.383x2 + 108.81x
R² = 0.9985
y = -20.764x2 + 92.991x
R² = 0.998
0
20
40
60
80
100
120
140
0 0.2 0.4 0.6 0.8 1 1.2 1.4 1.6
EC
(m
S/c
m)
[Urea] (M)
[Urea]/[CaCl2]=1 [Urea]/[CaCl2]=2
36
treatment process. This result suggests that urease enzyme in the previously-used EICP
solution is either absent or deactivated (i.e., denatured and/or precipitated (salted-out)
during previous precipitation reactions). Excessive increase in ionic strength of a solution
can lead to precipitation of proteins. The high chaotropic effect of the ammonium by-
product in the solution can cause enzyme denaturation. Chaotropes encourage enzyme
extension and denaturation through disrupting the hydrogen bonding network between
water molecules and consequently weakening the hydrophobic effect.
To check reusability of effluent as a source of substrates, fresh enzyme was added
into the effluent obtained from a residual EICP solution from tests with a precipitation ratio
less than 1 (i.e. an EICP solution containing unconsumed calcium chloride and urea). It
was observed that adding fresh enzyme solution into the effluents obtained from the tests
No. 20 and 21 resulted in 0.49 g and 0.17 g calcium carbonate precipitation, respectively.
Subtracting the amount of calcium ions precipitated at previous stage, these amounts of
precipitation correspond to a precipitation ratio 79% and 46% for the effluents of tests No.
20 and 21, respectively. Note that a fresh EICP solution with the same concentration of
calcium chloride, urea and enzyme gives a precipitation ratio of nearly 100%. The reduced
precipitation ratio in the effluent may be attributed to loss of an enzymatic activity due to
the presence of the ammonium by product. Furthermore, a chaotropic agent in the effluents
and/or to the ionic strength of the effluent. These factors help explained why the effluent
obtained from the Test No. 21, which contains a higher ammonium content from the
previous precipitation process than the effluent obtained from Test 20, yielded a lower
precipitation ratio than Test No. 20.

37
Additional Falcon tube tests were performed after subsequent testing suggested that
the non-fat dried milk used in these experiments had expired and was no longer effective,
these tests were conducted in the same manner as described above except that fresh dried
non-fat milk was used in the EICP solution. Again, the test results suggest that urease
enzyme in the effluent from EICP treatment cannot be reused for further EICP treatment.
Results of pre-existing calcite seeds on mineralogy of the precipitates
Precipitated calcium carbonate can appear as amorphous (i.e. a non-crystalline
phase) and five different crystalline phases (polymorphs of calcite, aragonite, vaterite,
monohydrocalcite and ikaite, in decreasing order of stability). Rhombohedral calcite is the
most desirable polymorph for geotechnical application due to its thermodynamic stability.
For calcite crystallization, the solute molecules in a saturated solution must encounter a
solid surface (by chance or by intermolecular force) that acts as a nucleation site (De Yoreo
and Vekilov 2003). Dust particles, bacterial cells, nascent crystals, and foreign seed crystals
are examples of nucleation sites. In the absence of nucleation sites, the solute molecules
move freely in the solution in a random flow. The interaction and collision between solute
molecules form a basis for the resulting crystal lattice. Placing nucleation sites into solution
allows the solute molecules to diffuse across their surface lattice instead of moving
randomly around, i.e., provides a surface diffusion mechanism. In the other words, the
surface lattice of the nucleation site provides an arrangement pattern for the solute
molecules and subsequent a crystal growth. Hence, seeding the precipitation solution with
rhombohedral calcite crystals was expected to facilitate increased rhombohedral calcite
precipitation (by mass of maximum carbonate theoretical precipitation). Therefore, calcite
seeds were added into several Falcon tubes in order to examine the effect of seeding with
38
calcite on nucleation and the mineralogy of the precipitates. SEM images of the precipitates
harvested from the seeded solution show densely aggregated rhombohedral calcite crystals
whereas the precipitates from the unseeded solution show a disordered morphology as
illustrated in Figure 7. This result suggests that it is more likely to get rhombohedral calcite
precipitation from an EICP treatment of a soil already containing calcite, although the
presence of inhibiting matter such as magnesium ions and organic compounds may disturb
calcite crystal formation (Loste et al. 2003).
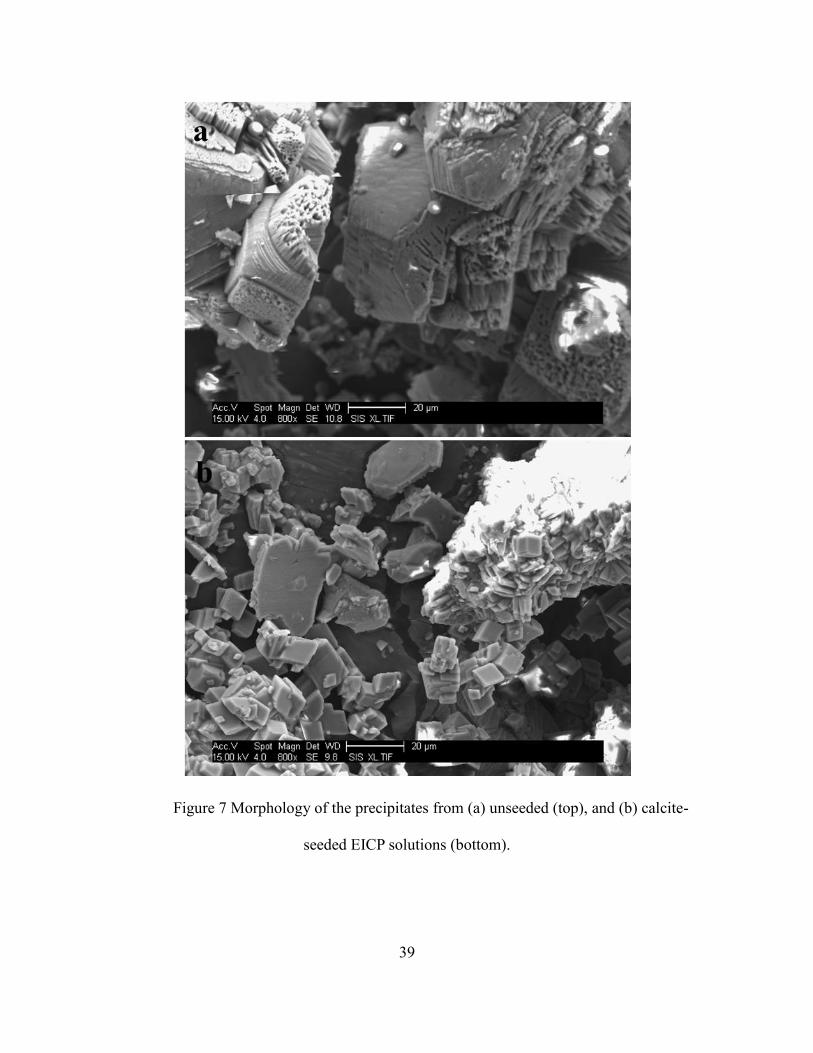
39
Figure 7 Morphology of the precipitates from (a) unseeded (top), and (b) calcite-
seeded EICP solutions (bottom).
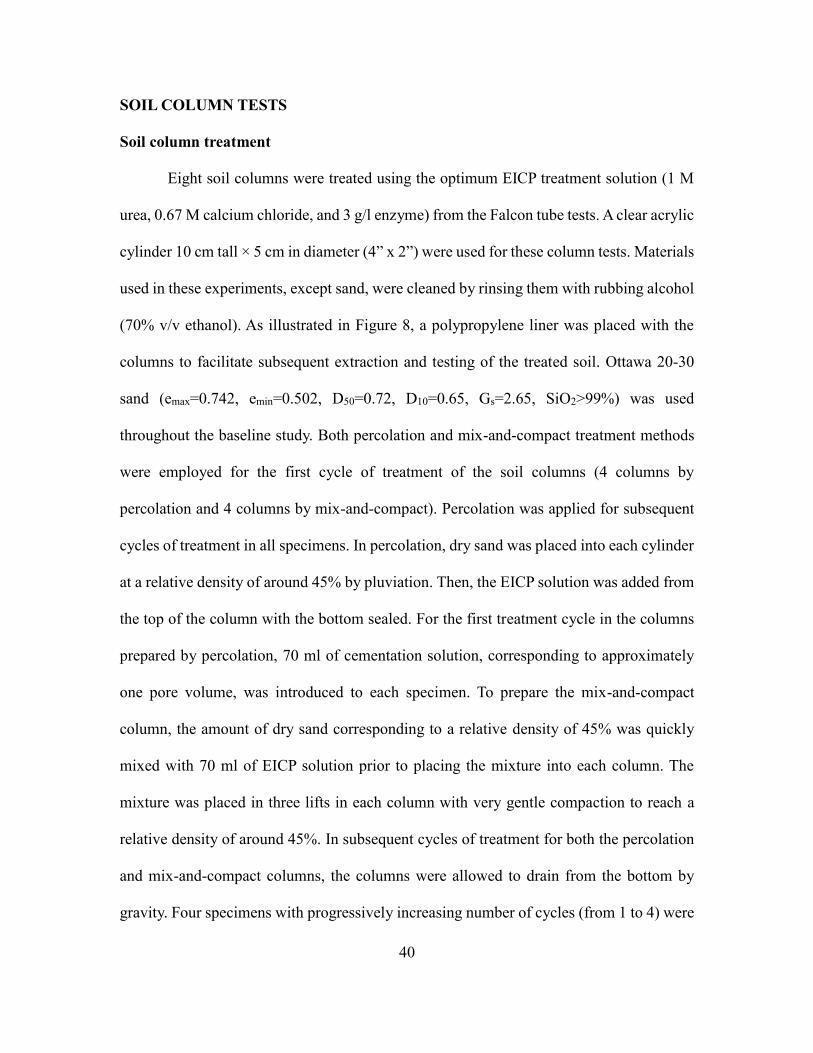
40
SOIL COLUMN TESTS
Soil column treatment
Eight soil columns were treated using the optimum EICP treatment solution (1 M
urea, 0.67 M calcium chloride, and 3 g/l enzyme) from the Falcon tube tests. A clear acrylic
cylinder 10 cm tall × 5 cm in diameter (4” x 2”) were used for these column tests. Materials
used in these experiments, except sand, were cleaned by rinsing them with rubbing alcohol
(70% v/v ethanol). As illustrated in Figure 8, a polypropylene liner was placed with the
columns to facilitate subsequent extraction and testing of the treated soil. Ottawa 20-30
sand (emax=0.742, emin=0.502, D50=0.72, D10=0.65, Gs=2.65, SiO2>99%) was used
throughout the baseline study. Both percolation and mix-and-compact treatment methods
were employed for the first cycle of treatment of the soil columns (4 columns by
percolation and 4 columns by mix-and-compact). Percolation was applied for subsequent
cycles of treatment in all specimens. In percolation, dry sand was placed into each cylinder
at a relative density of around 45% by pluviation. Then, the EICP solution was added from
the top of the column with the bottom sealed. For the first treatment cycle in the columns
prepared by percolation, 70 ml of cementation solution, corresponding to approximately
one pore volume, was introduced to each specimen. To prepare the mix-and-compact
column, the amount of dry sand corresponding to a relative density of 45% was quickly
mixed with 70 ml of EICP solution prior to placing the mixture into each column. The
mixture was placed in three lifts in each column with very gentle compaction to reach a
relative density of around 45%. In subsequent cycles of treatment for both the percolation
and mix-and-compact columns, the columns were allowed to drain from the bottom by
gravity. Four specimens with progressively increasing number of cycles (from 1 to 4) were
41
prepared for each method of sample preparation. 50 ml, 40 ml, and 40 ml of solution was
added with the bottom closed for cycles 2, 3, and 4, respectively.
In both methods of sample preparation, the samples were left to cure for 7 days at
room temperature after each cycle of treatment. After curing, each column was drained by
gravity by perforating the base with a syringe needle and the samples were rinsed with one
pore volume (i.e. ~70 ml) of deionized water. After rinsing, specimens were oven-dried at
50 °C until a constant mass was achieved. Unconfined compressive strength (UCS) tests
were then conducted to evaluate the strength of the oven dried samples.
After the UCS test, the mass of calcium carbonate precipitated in each sample was
determined through acid digestion. In this method, each treated sample was soaked into 4
M Hydrochloric acid (HCl) for 20 minutes to dissolve the carbonate precipitates. The
decrease in mass of the specimen before and after acid digestion was taken as the net mass
of carbonate precipitation in the soil.
Figure 8. Layout of the soil columns used for treatment
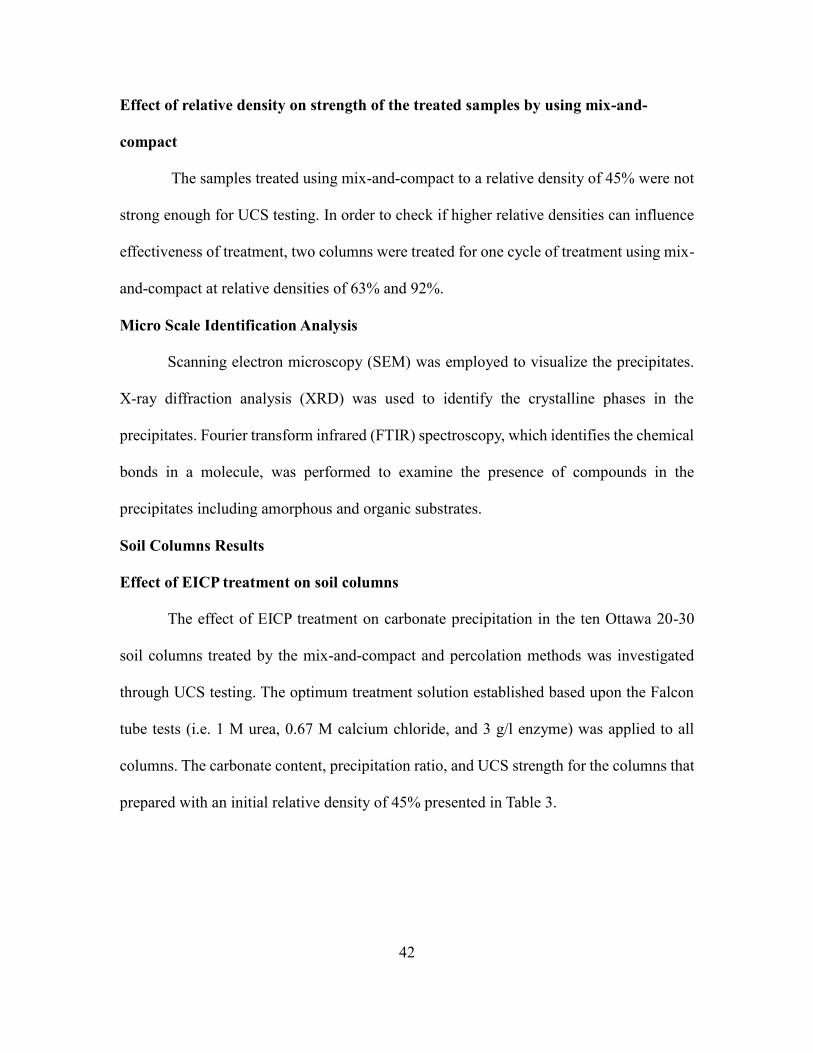
42
Effect of relative density on strength of the treated samples by using mix-and-
compact
The samples treated using mix-and-compact to a relative density of 45% were not
strong enough for UCS testing. In order to check if higher relative densities can influence
effectiveness of treatment, two columns were treated for one cycle of treatment using mix-
and-compact at relative densities of 63% and 92%.
Micro Scale Identification Analysis
Scanning electron microscopy (SEM) was employed to visualize the precipitates.
X-ray diffraction analysis (XRD) was used to identify the crystalline phases in the
precipitates. Fourier transform infrared (FTIR) spectroscopy, which identifies the chemical
bonds in a molecule, was performed to examine the presence of compounds in the
precipitates including amorphous and organic substrates.
Soil Columns Results
Effect of EICP treatment on soil columns
The effect of EICP treatment on carbonate precipitation in the ten Ottawa 20-30
soil columns treated by the mix-and-compact and percolation methods was investigated
through UCS testing. The optimum treatment solution established based upon the Falcon
tube tests (i.e. 1 M urea, 0.67 M calcium chloride, and 3 g/l enzyme) was applied to all
columns. The carbonate content, precipitation ratio, and UCS strength for the columns that
prepared with an initial relative density of 45% presented in Table 3.
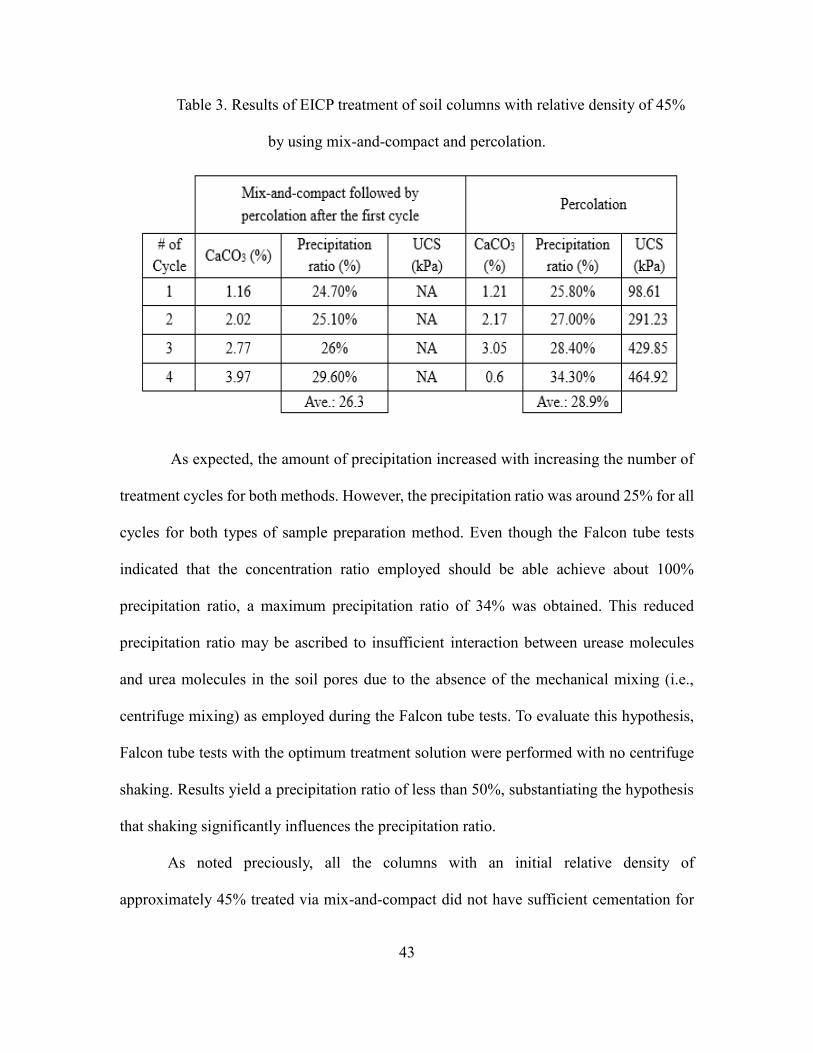
43
Table 3. Results of EICP treatment of soil columns with relative density of 45%
by using mix-and-compact and percolation.
As expected, the amount of precipitation increased with increasing the number of
treatment cycles for both methods. However, the precipitation ratio was around 25% for all
cycles for both types of sample preparation method. Even though the Falcon tube tests
indicated that the concentration ratio employed should be able achieve about 100%
precipitation ratio, a maximum precipitation ratio of 34% was obtained. This reduced
precipitation ratio may be ascribed to insufficient interaction between urease molecules
and urea molecules in the soil pores due to the absence of the mechanical mixing (i.e.,
centrifuge mixing) as employed during the Falcon tube tests. To evaluate this hypothesis,
Falcon tube tests with the optimum treatment solution were performed with no centrifuge
shaking. Results yield a precipitation ratio of less than 50%, substantiating the hypothesis
that shaking significantly influences the precipitation ratio.
As noted preciously, all the columns with an initial relative density of
approximately 45% treated via mix-and-compact did not have sufficient cementation for
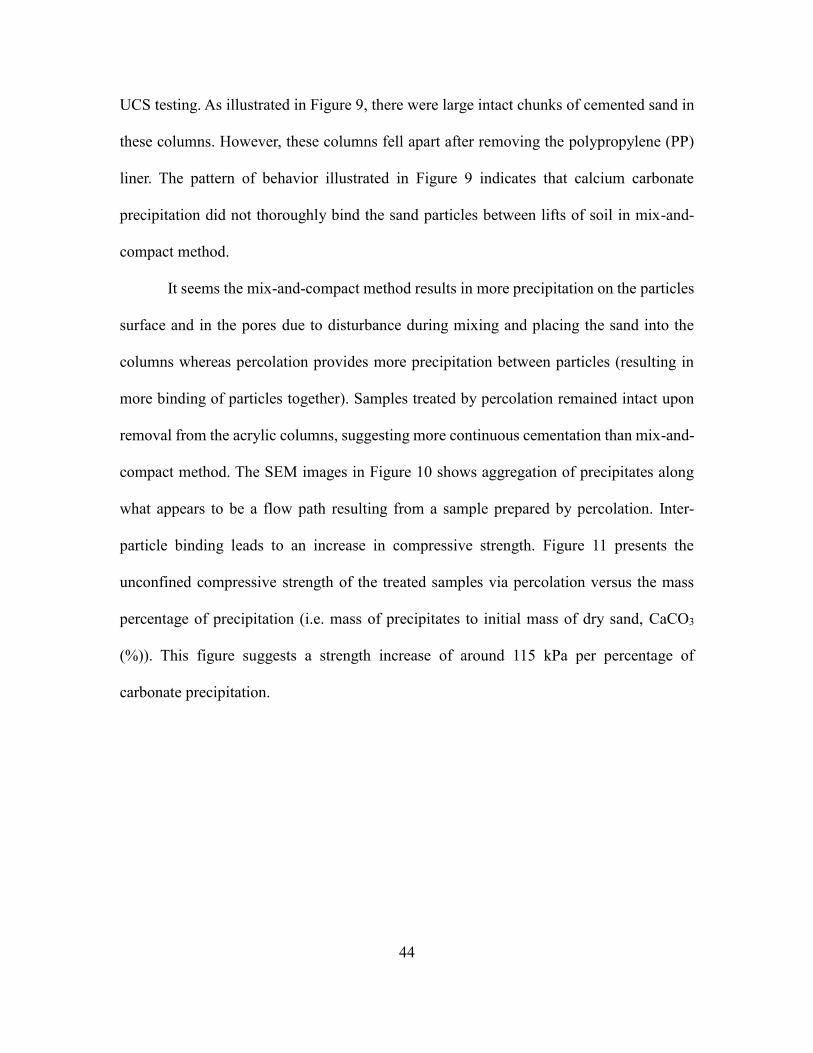
44
UCS testing. As illustrated in Figure 9, there were large intact chunks of cemented sand in
these columns. However, these columns fell apart after removing the polypropylene (PP)
liner. The pattern of behavior illustrated in Figure 9 indicates that calcium carbonate
precipitation did not thoroughly bind the sand particles between lifts of soil in mix-and-
compact method.
It seems the mix-and-compact method results in more precipitation on the particles
surface and in the pores due to disturbance during mixing and placing the sand into the
columns whereas percolation provides more precipitation between particles (resulting in
more binding of particles together). Samples treated by percolation remained intact upon
removal from the acrylic columns, suggesting more continuous cementation than mix-and-
compact method. The SEM images in Figure 10 shows aggregation of precipitates along
what appears to be a flow path resulting from a sample prepared by percolation. Inter-
particle binding leads to an increase in compressive strength. Figure 11 presents the
unconfined compressive strength of the treated samples via percolation versus the mass
percentage of precipitation (i.e. mass of precipitates to initial mass of dry sand, CaCO3
(%)). This figure suggests a strength increase of around 115 kPa per percentage of
carbonate precipitation.
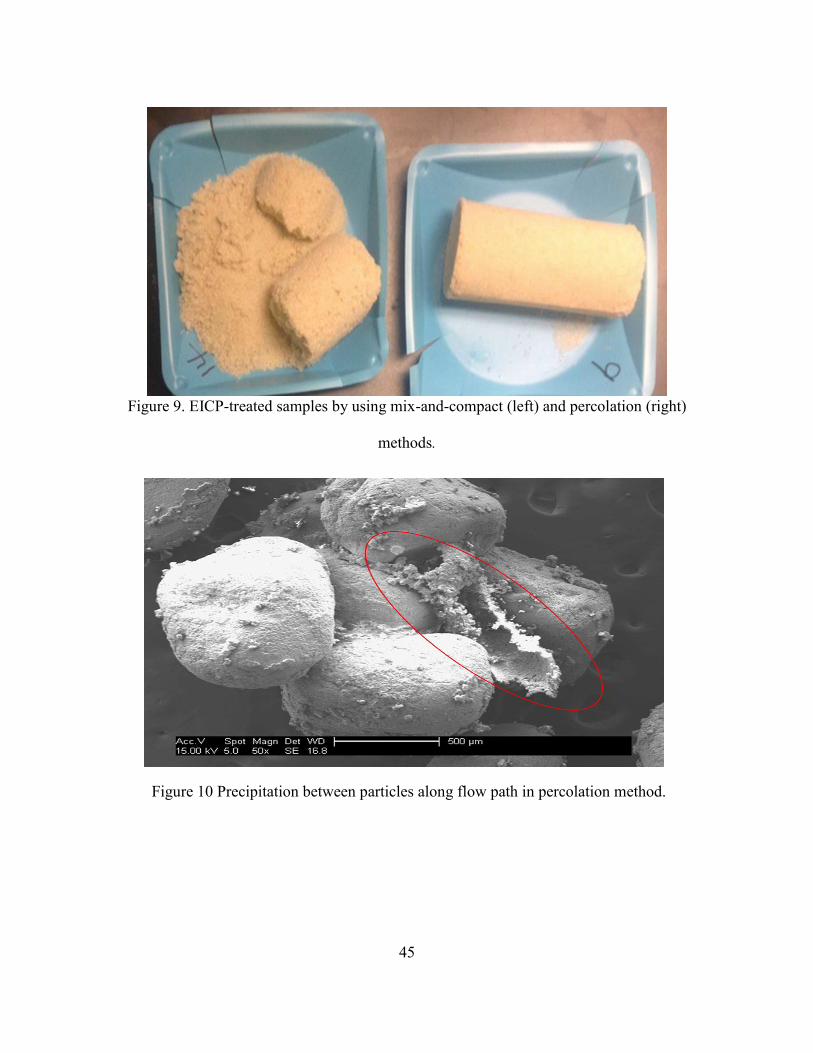
45
Figure 9. EICP-treated samples by using mix-and-compact (left) and percolation (right)
methods.
Figure 10 Precipitation between particles along flow path in percolation method.
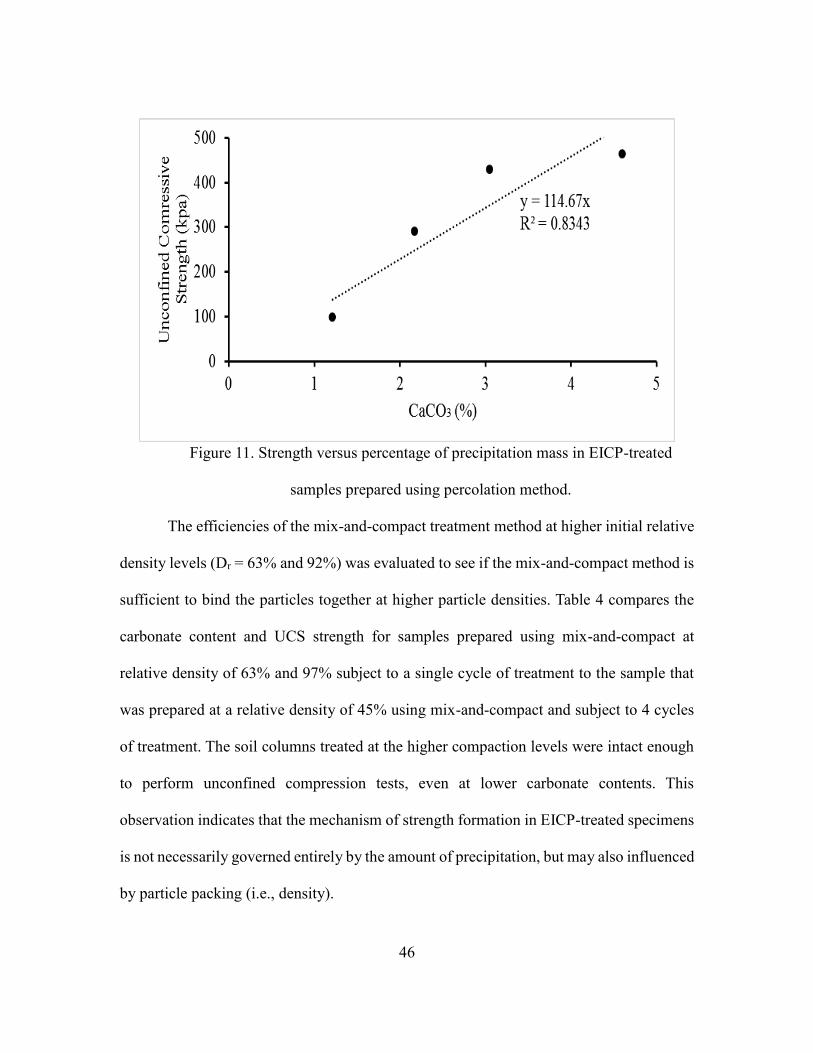
46
Figure 11. Strength versus percentage of precipitation mass in EICP-treated
samples prepared using percolation method.
The efficiencies of the mix-and-compact treatment method at higher initial relative
density levels (Dr = 63% and 92%) was evaluated to see if the mix-and-compact method is
sufficient to bind the particles together at higher particle densities. Table 4 compares the
carbonate content and UCS strength for samples prepared using mix-and-compact at
relative density of 63% and 97% subject to a single cycle of treatment to the sample that
was prepared at a relative density of 45% using mix-and-compact and subject to 4 cycles
of treatment. The soil columns treated at the higher compaction levels were intact enough
to perform unconfined compression tests, even at lower carbonate contents. This
observation indicates that the mechanism of strength formation in EICP-treated specimens
is not necessarily governed entirely by the amount of precipitation, but may also influenced
by particle packing (i.e., density).
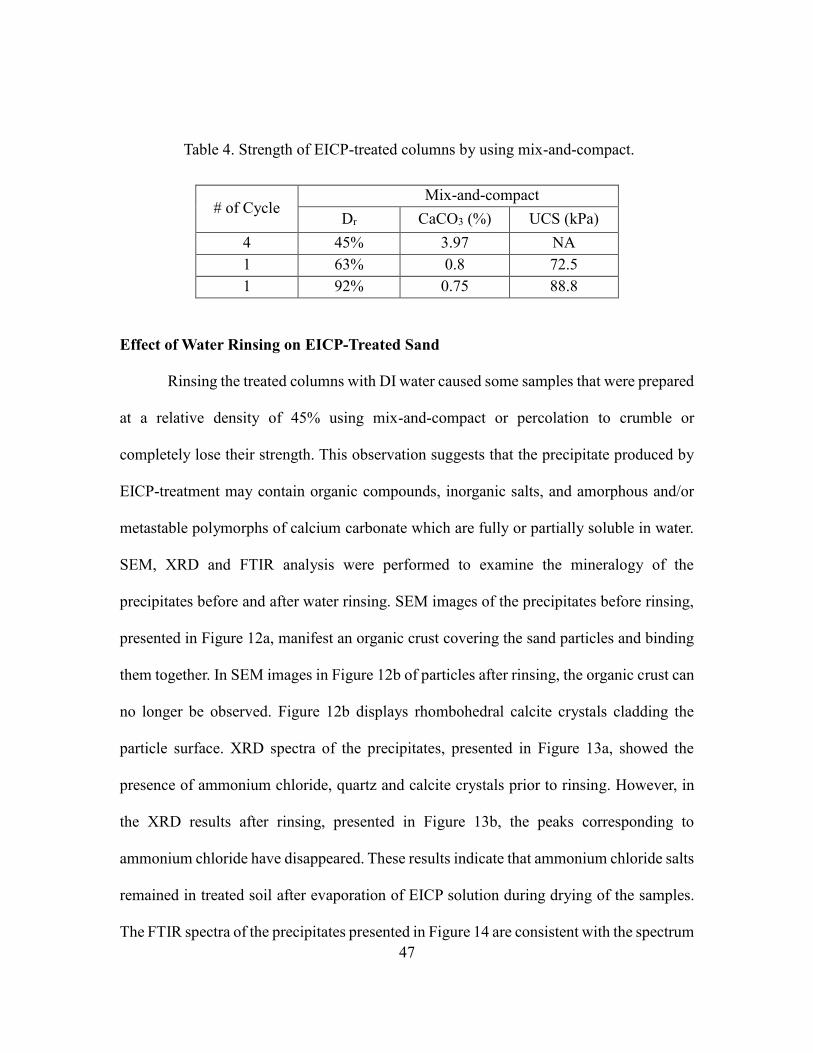
47
Table 4. Strength of EICP-treated columns by using mix-and-compact.
# of Cycle Mix-and-compact
Dr CaCO3 (%) UCS (kPa)
4 45% 3.97 NA
1 63% 0.8 72.5
1 92% 0.75 88.8
Effect of Water Rinsing on EICP-Treated Sand
Rinsing the treated columns with DI water caused some samples that were prepared
at a relative density of 45% using mix-and-compact or percolation to crumble or
completely lose their strength. This observation suggests that the precipitate produced by
EICP-treatment may contain organic compounds, inorganic salts, and amorphous and/or
metastable polymorphs of calcium carbonate which are fully or partially soluble in water.
SEM, XRD and FTIR analysis were performed to examine the mineralogy of the
precipitates before and after water rinsing. SEM images of the precipitates before rinsing,
presented in Figure 12a, manifest an organic crust covering the sand particles and binding
them together. In SEM images in Figure 12b of particles after rinsing, the organic crust can
no longer be observed. Figure 12b displays rhombohedral calcite crystals cladding the
particle surface. XRD spectra of the precipitates, presented in Figure 13a, showed the
presence of ammonium chloride, quartz and calcite crystals prior to rinsing. However, in
the XRD results after rinsing, presented in Figure 13b, the peaks corresponding to
ammonium chloride have disappeared. These results indicate that ammonium chloride salts
remained in treated soil after evaporation of EICP solution during drying of the samples.
The FTIR spectra of the precipitates presented in Figure 14 are consistent with the spectrum
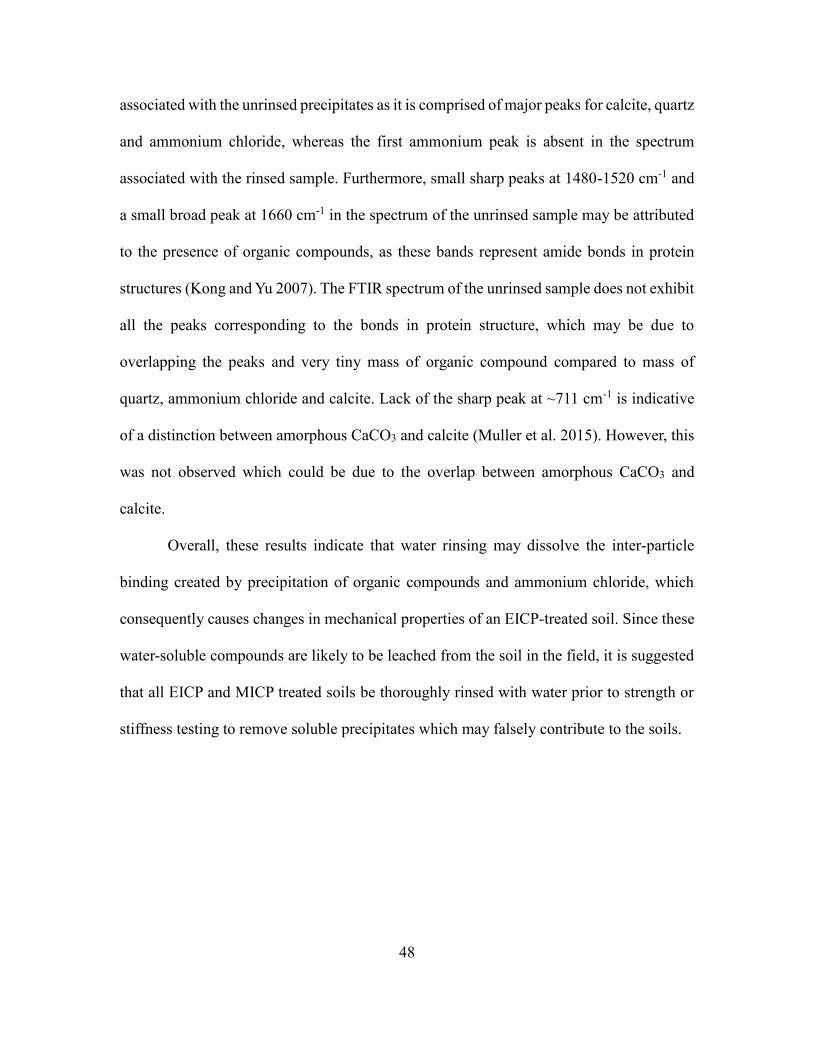
48
associated with the unrinsed precipitates as it is comprised of major peaks for calcite, quartz
and ammonium chloride, whereas the first ammonium peak is absent in the spectrum
associated with the rinsed sample. Furthermore, small sharp peaks at 1480-1520 cm-1 and
a small broad peak at 1660 cm-1 in the spectrum of the unrinsed sample may be attributed
to the presence of organic compounds, as these bands represent amide bonds in protein
structures (Kong and Yu 2007). The FTIR spectrum of the unrinsed sample does not exhibit
all the peaks corresponding to the bonds in protein structure, which may be due to
overlapping the peaks and very tiny mass of organic compound compared to mass of
quartz, ammonium chloride and calcite. Lack of the sharp peak at ~711 cm-1 is indicative
of a distinction between amorphous CaCO3 and calcite (Muller et al. 2015). However, this
was not observed which could be due to the overlap between amorphous CaCO3 and
calcite.
Overall, these results indicate that water rinsing may dissolve the inter-particle
binding created by precipitation of organic compounds and ammonium chloride, which
consequently causes changes in mechanical properties of an EICP-treated soil. Since these
water-soluble compounds are likely to be leached from the soil in the field, it is suggested
that all EICP and MICP treated soils be thoroughly rinsed with water prior to strength or
stiffness testing to remove soluble precipitates which may falsely contribute to the soils.
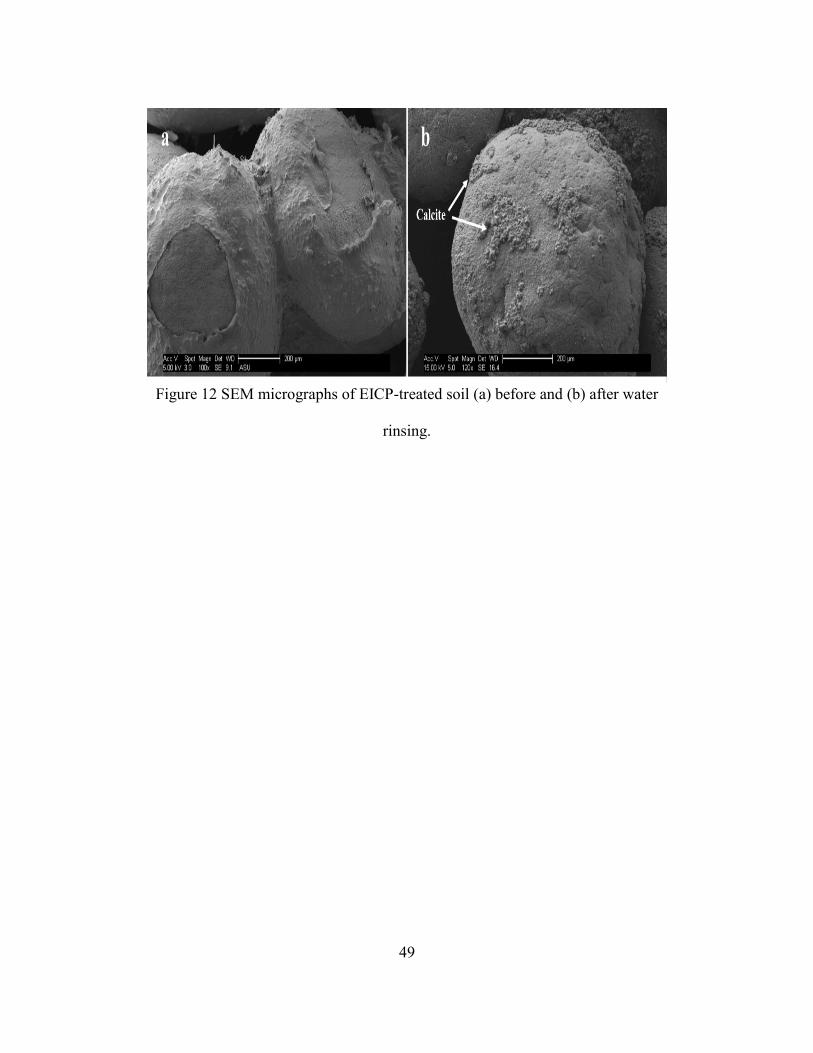
49
Figure 12 SEM micrographs of EICP-treated soil (a) before and (b) after water
rinsing.
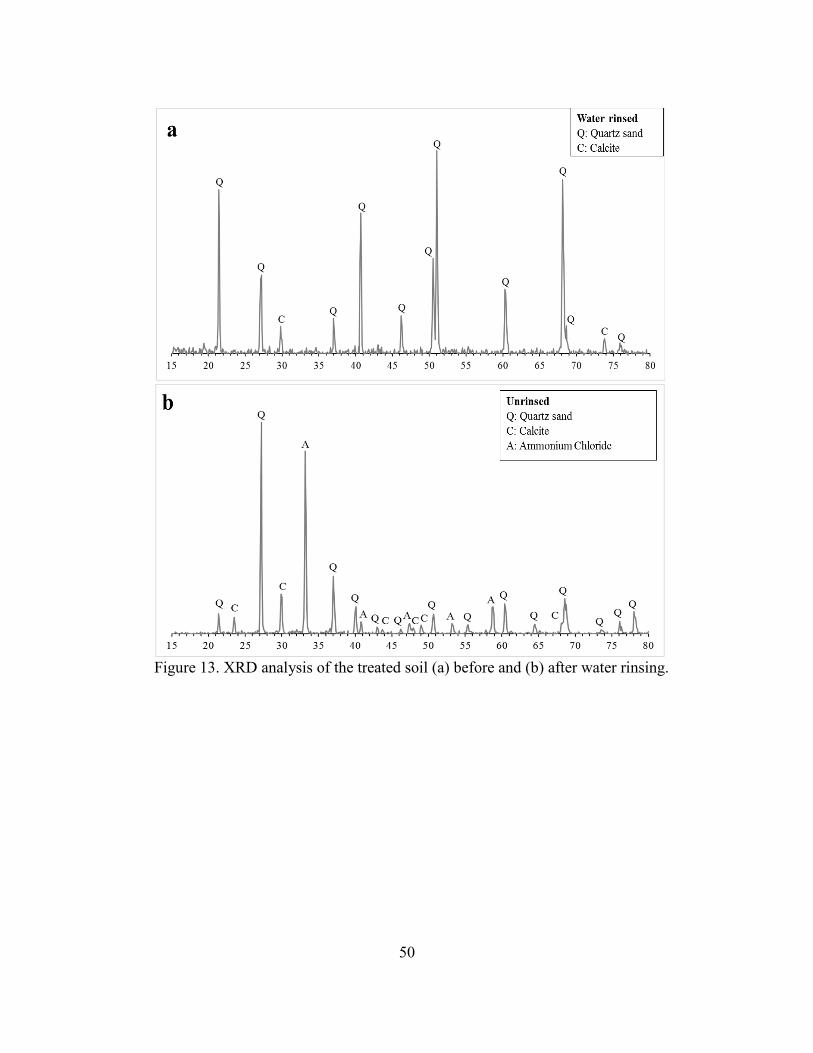
50
Figure 13. XRD analysis of the treated soil (a) before and (b) after water rinsing.
51
Figure 14. FTIR spectra of the treated soil before and after water rinse.
Effect of Calcite Seeding
A test was also conducted in which the calcite seeds were mixed into the soil
before the EICP solution was applied. The UCS of the sample treated in this manner was
1268 kPa after four cycles of treatment, compared to the UCS of 464 kPa obtained after
four cycle treatment of soil without the addition of calcite seeds. However, the calcite
content of the specimen in which the seeds were mixed with the soil was not measured
and precipitation ratio is unknown.
CONCLUSION
A systematic evaluation of precipitation ratio and the mass of precipitation as a
function of the concentrations of calcium chloride, urea, and urease enzyme was conducted.
Through this systematic evaluation, an optimum recipe for EICP treatment of 1 M urea,
0.67 M CaCl2 and 3 g/l urease enzyme was established. It was also demonstrated that the
effluent from prior EICP treatment cannot be used as a source of enzyme for additional
52
treatment. However, unconsumed calcium chloride and urea in the effluent from an
incomplete treatment process can be precipitated by adding fresh enzyme, suggesting the
potential to reuse the effluent containing unconsumed calcium chloride and urea as a source
of these substrates. This is an important conclusion, as the maximum precipitation ratio
achieved in treatment of soil columns was only 34%.
SEM images suggests that the presence of calcite seeds in an EICP treatment
solution can improve the morphology of the precipitates. An additional test conducted with
the calcite sees mixed into the soil before the EICP solution was applied yielded a high
UCS (1268 kPa versus 429 kPa). However, the calcite content of the specimen in which
the seeds were mixed with the soil was not measured and precipitation ratio is unknown.
It was found that EICP-treatment of soil via the mix-and-compact method may not
provide efficient inter-particle binding in soil in a loose condition. The percolation method
was observed to be more efficient in inter-particle binding for loose soils. The SEM images
suggest that methods which promote more interaction between urease molecules and
substrate in the pores during treatment, such as continuous flow, will provide a higher
precipitation ratio. Specimens prepared by percolation exhibited a strength increase of
around 115 kPa per unit mass percentage of carbonate precipitation. Rinsing the treated
soil with DI water caused loss of some precipitates, indicating that EICP treated soil should
always be thoroughly rinsed with water prior to measuring mechanical properties (as done
in this study).
53
CHAPTER 4
ENHANCEMENT OF EICP FOR SOIL IMPROVEMENT USING FIBERS
AND HYDROGELS
INTRODUCTION
This chapter presents the materials, methods, and results from experiments to
enhance Enzyme Induced Carbonate Precipitation (EICP) through the addition of natural
fibers (in the form of sisal fibers) and hydrogels to the soil matrix. Hydrogels and sisal
fibers can potentially enhance the performance of EICP-treated soil by increasing its
strength and ductility, extending its applicability for ground improvement and other
purposes.
All soil columns in this chapter were made using the mix-and-compact method
with an initial target relative density of 90%. The objectives of the experiments described
in this chapter included the following: (1) finding the optimum amount of sisal fibers or
xanthan gum hydrogel to mix into the soil to enhance strength and ductility; (2) observing
the effects of sisal fibers and hydrogels on binding between two particles using SEM
images; and (3) determining how fibers and hydrogels may interfere with EICP. Overall,
the question addressed here in this chapter is how can fibers and hydrogels make EICP a
more effective process for soil improvement?
EXPERIMENTAL METHODS AND PROCEDURES
Column Preparation
Materials used in these experiments, except sand, were cleaned by rinsing them
with rubbing alcohol (70% v/v ethanol). All the soil columns used in these experiments
used Ottawa 20-30 silica sand (US Silica Company), a uniform quartz sand with a mean
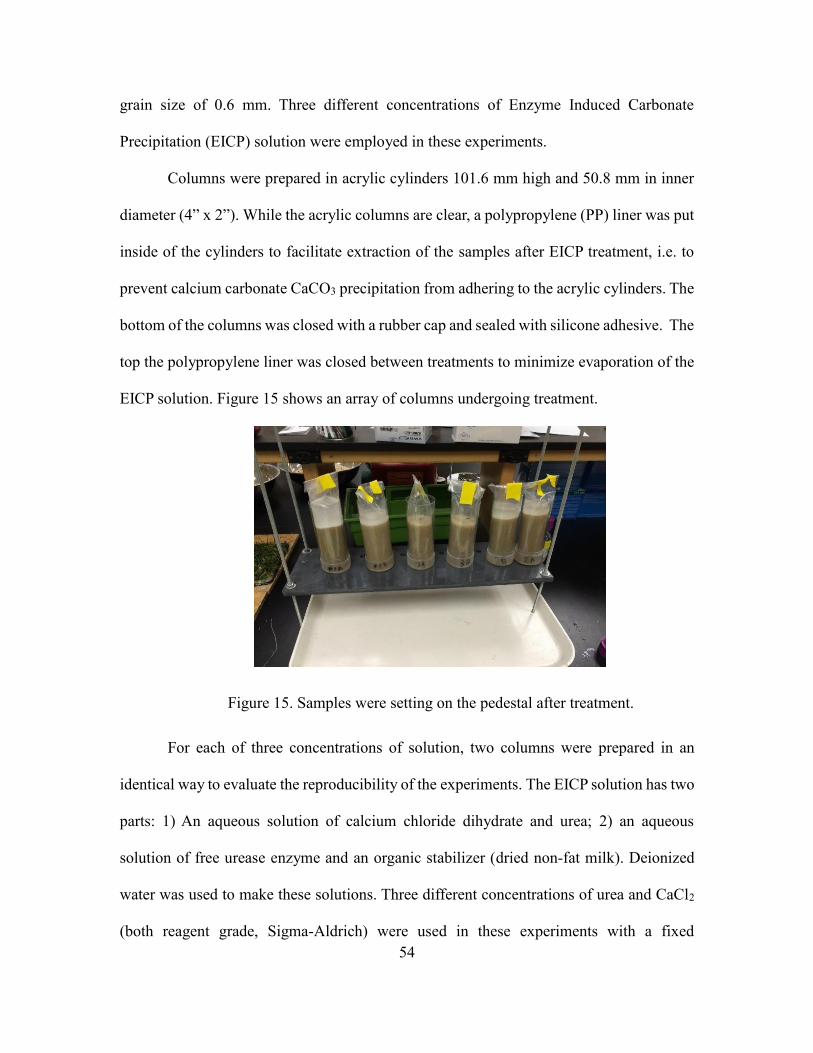
54
grain size of 0.6 mm. Three different concentrations of Enzyme Induced Carbonate
Precipitation (EICP) solution were employed in these experiments.
Columns were prepared in acrylic cylinders 101.6 mm high and 50.8 mm in inner
diameter (4” x 2”). While the acrylic columns are clear, a polypropylene (PP) liner was put
inside of the cylinders to facilitate extraction of the samples after EICP treatment, i.e. to
prevent calcium carbonate CaCO3 precipitation from adhering to the acrylic cylinders. The
bottom of the columns was closed with a rubber cap and sealed with silicone adhesive. The
top the polypropylene liner was closed between treatments to minimize evaporation of the
EICP solution. Figure 15 shows an array of columns undergoing treatment.
Figure 15. Samples were setting on the pedestal after treatment.
For each of three concentrations of solution, two columns were prepared in an
identical way to evaluate the reproducibility of the experiments. The EICP solution has two
parts: 1) An aqueous solution of calcium chloride dihydrate and urea; 2) an aqueous
solution of free urease enzyme and an organic stabilizer (dried non-fat milk). Deionized
water was used to make these solutions. Three different concentrations of urea and CaCl2
(both reagent grade, Sigma-Aldrich) were used in these experiments with a fixed

55
concentration of urease enzyme (Fisher Scientific, low-grade Jack Bean Urease, ≈ 1500-
2500 U/g activity based on our lab measurement at ASU). The urea: CaCl2 concentrations
were 2.65 M:1.51 M, 1.75 M:1 M, and 0.875 M:0.5 M. The cementation solution consisted
of 0.85 g/L low activity urease and 4.0 g/L of dried non-fat milk as stabilizer.
In these experiments, every column was prepared using the mix-and-compact
method according to ASTM method D2168. First, the cementation solution was poured
into a bowl containing the soil, then the soil and solution were thoroughly mixed. Second,
the soil was placed into the cylinder in three layers and every layer was compacted
approximately 25 times with a small hammer. The hammer weight was 11.56 N (2.6 Ib)
and it had a diameter of approximately 10.20 mm. The soil was gently tamped with the
hammer. Each column was filled with a mixture of 350 gm (dry mass) Ottawa 20-30 sand
and 75 ml (approximately one pore volume) of the cementation solution. After tamping,
the top of the first and second layer was scarified prior to adding the next layer in order to
increase the interaction between these layers.
After preparing the columns, all column was left on the pedestal (as shown in Figure
15) for three days with the PP liner taped closed with duct tape to minimize evaporation.
After four days, the columns were drained by punching holes at the bottom of the rubber
caps with a 20-gauge needle. The holes were made with a needle to avoid losing soil from
the column (as there was no a screen at the bottom of the columns). The cementation
solution that drained from each column was collected and pH of the solution was recorded.
Then, all columns were flushed with at least 100 ml (approximately 1.3 per volumes) of
18.2 MΩ deionized (DI) water to flush salt and organic material from the column.
56
Adding Xanthan Gum to Dry Soil
A biodegradable hydrogel, xanthan gum, was mixed with the dry soil in an attempt
to enhance the cementation process. Hamdan (2015) has previously conducted studies on
EICP enhanced with xanthan gum to create soil crust for wind erosion control. In that work,
the percentage of xanthan gum was about 1.1% by dry weight of soil. Also, Martin et al.
(1996) used xanthan gum to enhance the strength and reduce the permeability of a silty
soil. They found the optimum amount of xanthan gum was from 1% to 2%. They
recommended using around 1% since there was little difference between results for these
two percentages.
In the tests conducted herein, 1.1% xanthan gum (by dry weight of sand) was
employed. Xanthan gum was added as a powder directly to the soil and mixed with the soil
in the bowl before adding the cementation solution. Three different EICP solution
formulations were used to create six columns (two with each formulation):
1) 0.875 M of urea; 0.50 M of CaCl2-2H2O; 0.85 g/L urease enzyme and (4.0 g/L
stabilizer)
2) 1.75 M of urea; 1.00 M of CaCl2-2H2O; 0.85 g/L urease enzyme and (4.0 g/L
stabilizer)
3) 2.65 M of urea; 1.51 M of CaCl2-2H2O; 0.85 g/L urease enzyme and (4.0 g/L
stabilizer)
The xanthan gum columns could not be flushed with DI water after compaction due
to the xanthan gum clogging the voids. Instead, these columns were soaked in a bowl that
contained DI water for 20 minutes. After soaking, columns were put in the oven at 40 C0
for four days prior to UCS testing.
57
Adding Xanthan Gum to the EICP Solution
Experiments in which the hydrogel was mixed with the EICP solution employed a
similar procedure as that described in the previous Section. The only difference was that
the xanthan gum was mixed with urea-CaCl2 solution. Once the hydrogel dissolved in the
urea-CaCl2 solution, the urease enzyme and dried non-fat milk were mixed with urea-CaCl2
solution. Then the resulting the EICP solution was added to the soil, mixed in a bowl, and
compacted in three lifts into the acrylic cylinders. An additional six columns (two for each
EICP mixture) were prepared using xanthan gum mixed with the EICP solution. Similar to
the samples created using dry xanthan gum powder, after compaction and curing these
columns were soaked in DI water for 20 minutes, dried in the oven at 40 Co for one month,
and then capped for UCS testing.
Adding Sisal Fibers
A set of experiments was conducted to evaluate the benefit of including sisal fibers
in the EICP formulation. Sisal fibers are natural fibers with a tensile strength exceeding
that of steel. Sisal fibers are derived from the sisal plant, native to Brazil (Gross et al.1979).
Before flowering, sisal plants produce between 200 to 250 leaves. Sisal leaves contain 4%
fiber, 8% dry matter, 1% cuticle and 87% water (Mukherjee and Satyanaray, 1984). Each
leaf contains between 700 to 1400 fiber bundles. These fiber bundles are 0.5 to 1.0 m in
length (Oksman et al.2002). Sisal fibers stretch from the base to the tip of the plant and
maintain high mechanical strength (Nutman1937). Sisal fiber reinforced cement
composites have shown a large amount of ductility (de Andrade Silva et al. 2011).
The EICP solution formulation for the sisal fibers experiments was kept at 0.875 M
of urea, 0.50 M of CaCl2-2H2O, 0.85 g/l urease enzyme, and 4.0 g/l of dried non-fat milk
58
stabilizer. Based upon a review of the literature (Hejazi et al. 2012), a fiber content of
0.75% (w/w soil) was chosen. Fiber lengths of 10 mm and 20 mm were initially employed.
Unfortunately, the 20 mm fibers did not generate any specimens suitable for UCS testing.
An additional column made with 20 mm fibers at 0.85% w/w soil for curiosity, also failed
to yield a specimen suitable for strength testing.
Following the initial experiments with a fiber content of 0.75% w/w dry soil, six
columns were prepared with 10 mm at lower percentages of fiber per dry mass of dry soil.
Duplicate soil columns with fiber content of 0.2, 0.3, and 0.4% w/w soil were prepared.
Unconfined Compressive Strength (UCS) Testing
All columns were extracted from the acrylic cylinders and the polypropylene (PP)
liner was removed to prepare the columns for unconfined compressive strength (UCS)
testing. The top and the bottom of these columns had to be leveled before running the UCS
test. Initially sand paper was used in an attempt to level the top and bottom surface of the
columns. However, the sand particles abraded easily and surfaces could not be leveled with
this procedure. Next, capping with sulfur at the top and the bottom was attempted.
However, heat that generated by the sulfur caps also had a deleterious which effect on the
columns, making the top and bottom of the columns disintegrate. Through trial and error,
Devcon glue was found to be the best way to make the top and the bottom surfaces flat and
smooth without affecting the columns themselves.
The capping procedure using Devcon glue was as follows. First, the top and the
bottom platens for the column were wiped with clean cloth until the surface was very clean.
Then waxed paper was placed on the surface of the platens to avoid adhesion between the
platen and the column. The glue is a two-part composition (a white part and black part).

59
The white part is mixed with the black part at a ratio of 1:1.7. Then a spoon was used to
put the glue on the top of the column and put the column against the top platen
perpendicular to the surface and wait for at least 30 minutes for the glue to dry. The
procedure was repeated for the bottom of the column and then the column was ready for
UCS testing. Two columns were prepared and tested with EICP solution but with zero fiber
or xanthan gum but with 0.875 M of urea, 0.50 M of CaCl2-2H2O, 0.85 g/l urease enzyme,
and 4.0 g/l of dried non-fat milk as control columns for comparison to earlier test results.
Scanning Electron Microscope (SEM) Imaging
After UCS testing, intact chunks of cemented sand were subject to SEM imaging.
The AFEI/Philips XL-30 Field Emission Environmental Scanning Electron Microscope
(ESEM) was used to image the morphological features on coated (gold-palladium, 50-50)
pieces of the cemented soil.
Acid Digestion
The CaCO3 content of intact pieces of the cemented soil was evaluated by washing
the samples with 4 M hydrochloric acid (HCl) solution to dissolve the precipitated of
CaCO3 (the columns had previously been flushed with DI water to remove salts and
organics). Then the samples were washed with DI water and placed in an oven at 105
Celsius for 24 hours. The difference in weight between the original specimen and the oven-
dried specimen was considered to be the weight carbonate that was precipitated in the
specimen.
60
RESULTS AND DISCUSSION
Xanthan Gum Mixed with Dry Soil
After extraction from acrylic cylinder columns, xanthan gum/dry powder columns
1A and 1B, with the highest concentrations of urea-CaCl2 (2.65 M: 1.5 M), were easily
deformed in a plastic manner and were not suitable for UCS testing. The other xanthan
gum/dry power columns were subject to USC tests. Table 5 summarizes the results of the
UCS testing on the columns prepared by mixing powdered xanthan gum into the soil. All
column subjected to UCS testing failed along a shear plane at approximately 45 degrees,
as illustrated in Figure 16. The percentage of CaCO3 in Table 5 was calculated using the
acid digestion procedure described previously in. Figures 17 and 18 shows the stress-strain
curves from UCS testing. These figures show relatively good reproducibility of results,
despite the somewhat lower strength for sample 2A compared to sample 2B.
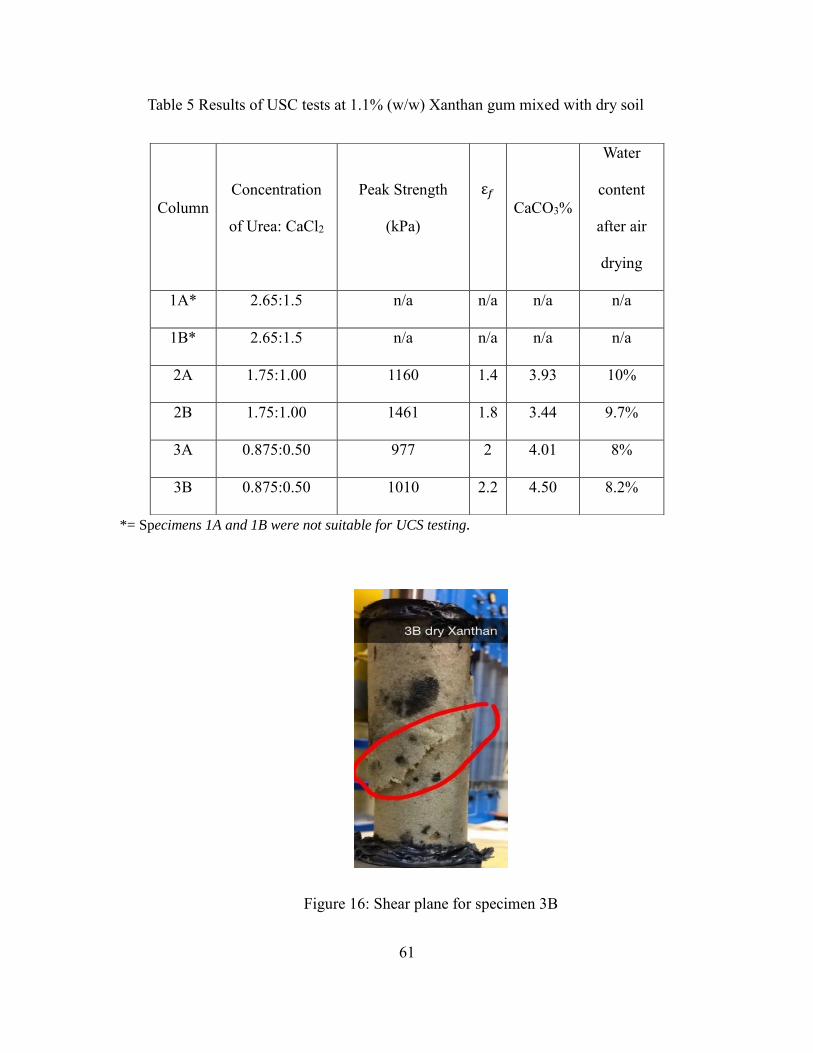
61
Table 5 Results of USC tests at 1.1% (w/w) Xanthan gum mixed with dry soil
*= Specimens 1A and 1B were not suitable for UCS testing.
Figure 16: Shear plane for specimen 3B
Column
Concentration
of Urea: CaCl2
Peak Strength
(kPa)
ε𝑓
CaCO3%
Water
content
after air
drying
1A* 2.65:1.5 n/a n/a n/a n/a
1B* 2.65:1.5 n/a n/a n/a n/a
2A 1.75:1.00 1160 1.4 3.93 10%
2B 1.75:1.00 1461 1.8 3.44 9.7%
3A 0.875:0.50 977 2 4.01 8%
3B 0.875:0.50 1010 2.2 4.50 8.2%
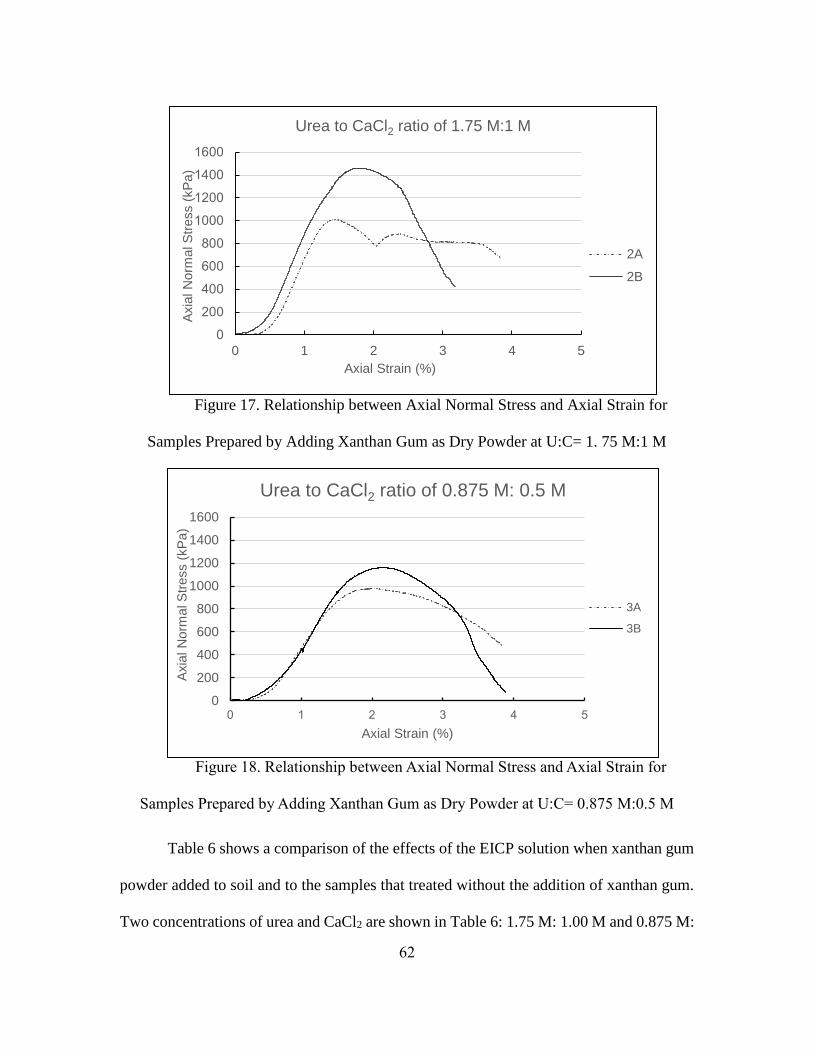
62
Figure 17. Relationship between Axial Normal Stress and Axial Strain for
Samples Prepared by Adding Xanthan Gum as Dry Powder at U:C= 1. 75 M:1 M
Figure 18. Relationship between Axial Normal Stress and Axial Strain for
Samples Prepared by Adding Xanthan Gum as Dry Powder at U:C= 0.875 M:0.5 M
Table 6 shows a comparison of the effects of the EICP solution when xanthan gum
powder added to soil and to the samples that treated without the addition of xanthan gum.
Two concentrations of urea and CaCl2 are shown in Table 6: 1.75 M: 1.00 M and 0.875 M:
0 1 2 3 4 5
Axia
l N
orm
al S
tress (
kP
a)
Axial Strain (%)
Urea to CaCl2 ratio of 1.75 M:1 M
2A
2B
0
200
400
600
800
1000
1200
1400
1600
Axia
l N
orm
al S
tress (
kP
a)
Axial Strain (%)
Urea to CaCl2 ratio of 0.875 M: 0.5 M
3A
3B
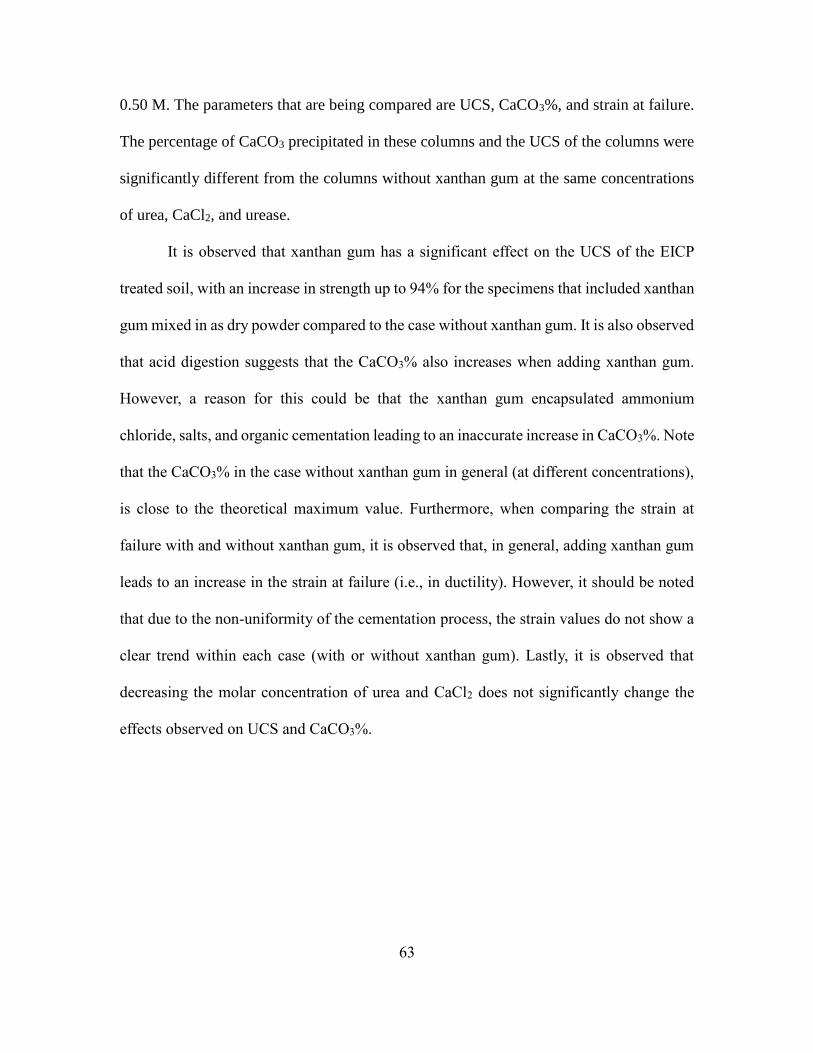
63
0.50 M. The parameters that are being compared are UCS, CaCO3%, and strain at failure.
The percentage of CaCO3 precipitated in these columns and the UCS of the columns were
significantly different from the columns without xanthan gum at the same concentrations
of urea, CaCl2, and urease.
It is observed that xanthan gum has a significant effect on the UCS of the EICP
treated soil, with an increase in strength up to 94% for the specimens that included xanthan
gum mixed in as dry powder compared to the case without xanthan gum. It is also observed
that acid digestion suggests that the CaCO3% also increases when adding xanthan gum.
However, a reason for this could be that the xanthan gum encapsulated ammonium
chloride, salts, and organic cementation leading to an inaccurate increase in CaCO3%. Note
that the CaCO3% in the case without xanthan gum in general (at different concentrations),
is close to the theoretical maximum value. Furthermore, when comparing the strain at
failure with and without xanthan gum, it is observed that, in general, adding xanthan gum
leads to an increase in the strain at failure (i.e., in ductility). However, it should be noted
that due to the non-uniformity of the cementation process, the strain values do not show a
clear trend within each case (with or without xanthan gum). Lastly, it is observed that
decreasing the molar concentration of urea and CaCl2 does not significantly change the
effects observed on UCS and CaCO3%.
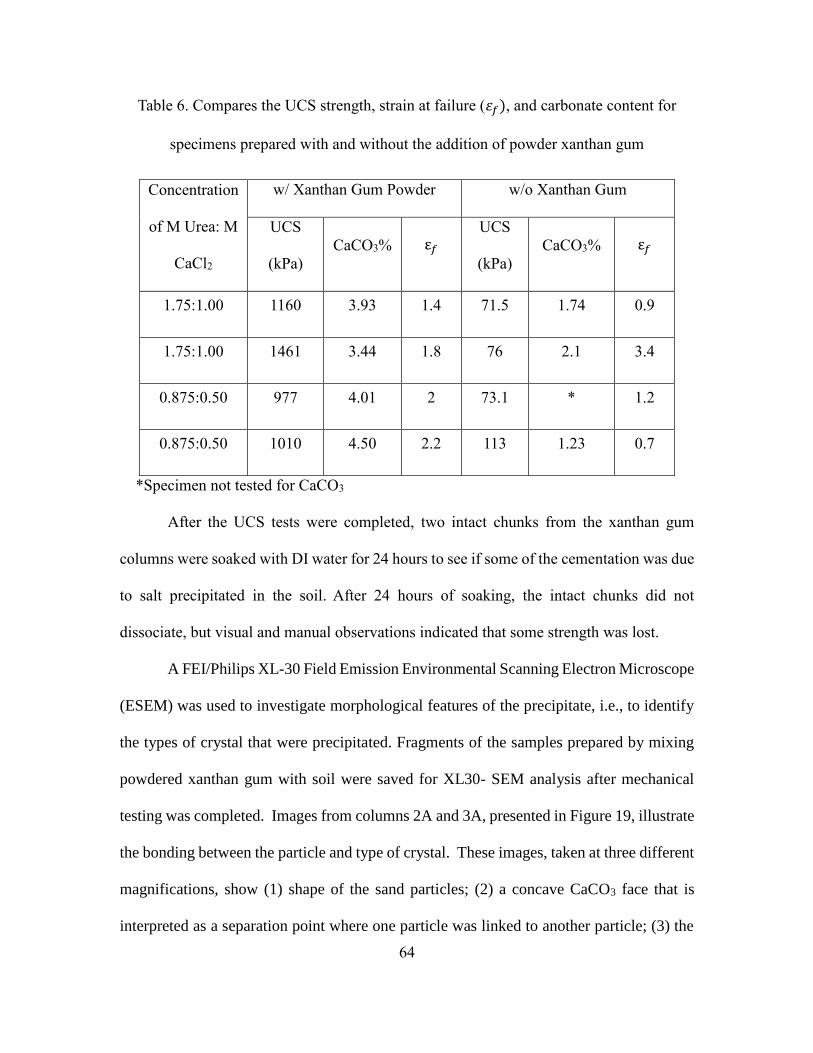
64
Table 6. Compares the UCS strength, strain at failure (𝜀𝑓), and carbonate content for
specimens prepared with and without the addition of powder xanthan gum
Concentration
of M Urea: M
CaCl2
w/ Xanthan Gum Powder w/o Xanthan Gum
UCS
(kPa)
CaCO3% ε𝑓 UCS
(kPa)
CaCO3% ε𝑓
1.75:1.00 1160 3.93 1.4 71.5 1.74 0.9
1.75:1.00 1461 3.44 1.8 76 2.1 3.4
0.875:0.50 977 4.01 2 73.1 * 1.2
0.875:0.50 1010 4.50 2.2 113 1.23 0.7
*Specimen not tested for CaCO3
After the UCS tests were completed, two intact chunks from the xanthan gum
columns were soaked with DI water for 24 hours to see if some of the cementation was due
to salt precipitated in the soil. After 24 hours of soaking, the intact chunks did not
dissociate, but visual and manual observations indicated that some strength was lost.
A FEI/Philips XL-30 Field Emission Environmental Scanning Electron Microscope
(ESEM) was used to investigate morphological features of the precipitate, i.e., to identify
the types of crystal that were precipitated. Fragments of the samples prepared by mixing
powdered xanthan gum with soil were saved for XL30- SEM analysis after mechanical
testing was completed. Images from columns 2A and 3A, presented in Figure 19, illustrate
the bonding between the particle and type of crystal. These images, taken at three different
magnifications, show (1) shape of the sand particles; (2) a concave CaCO3 face that is
interpreted as a separation point where one particle was linked to another particle; (3) the
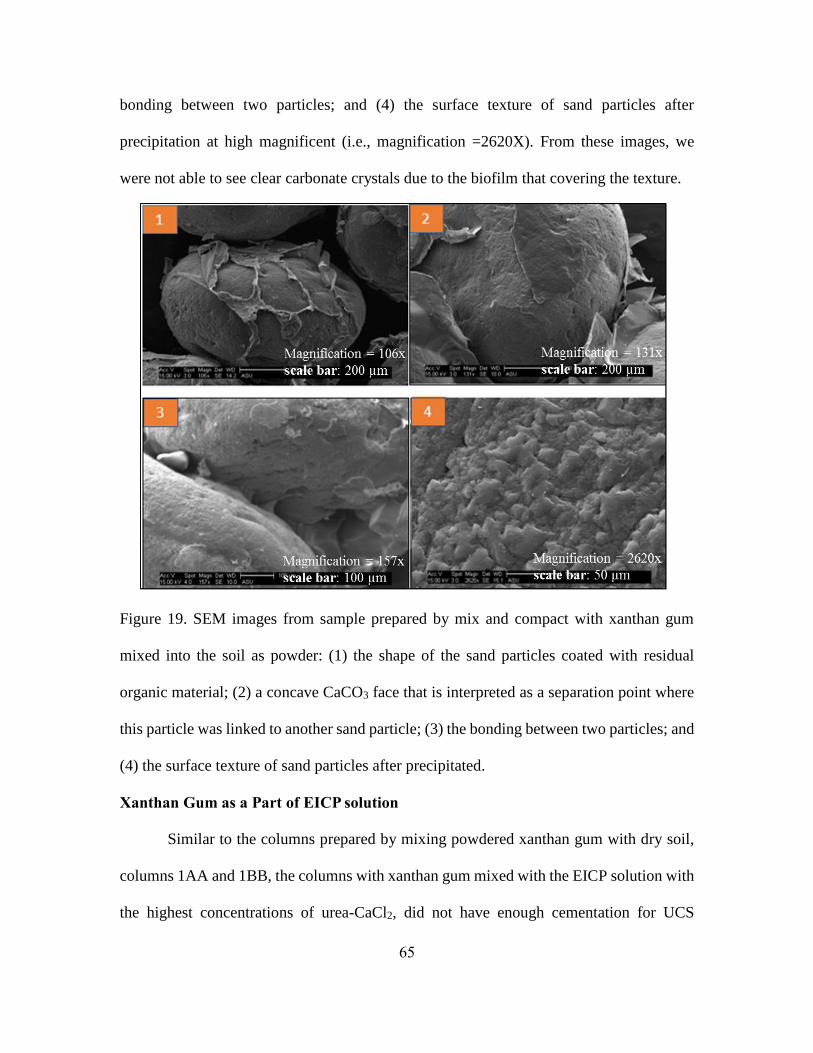
65
bonding between two particles; and (4) the surface texture of sand particles after
precipitation at high magnificent (i.e., magnification =2620X). From these images, we
were not able to see clear carbonate crystals due to the biofilm that covering the texture.
Figure 19. SEM images from sample prepared by mix and compact with xanthan gum
mixed into the soil as powder: (1) the shape of the sand particles coated with residual
organic material; (2) a concave CaCO3 face that is interpreted as a separation point where
this particle was linked to another sand particle; (3) the bonding between two particles; and
(4) the surface texture of sand particles after precipitated.
Xanthan Gum as a Part of EICP solution
Similar to the columns prepared by mixing powdered xanthan gum with dry soil,
columns 1AA and 1BB, the columns with xanthan gum mixed with the EICP solution with
the highest concentrations of urea-CaCl2, did not have enough cementation for UCS
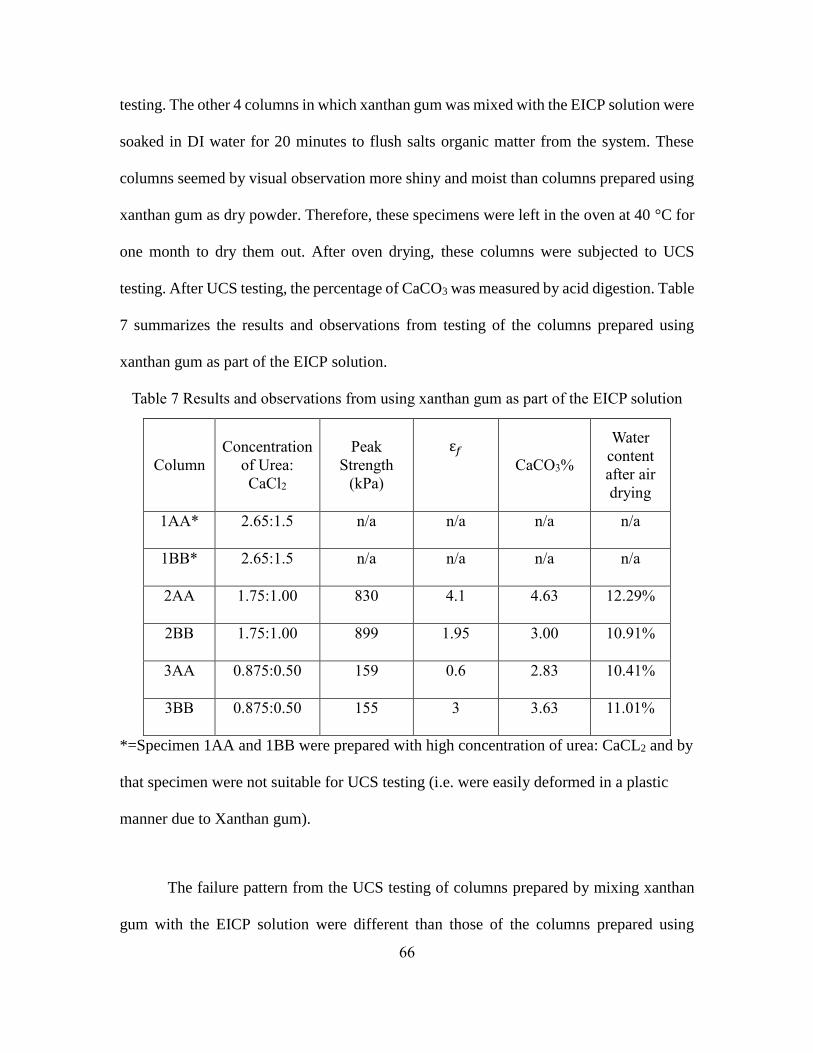
66
testing. The other 4 columns in which xanthan gum was mixed with the EICP solution were
soaked in DI water for 20 minutes to flush salts organic matter from the system. These
columns seemed by visual observation more shiny and moist than columns prepared using
xanthan gum as dry powder. Therefore, these specimens were left in the oven at 40 °C for
one month to dry them out. After oven drying, these columns were subjected to UCS
testing. After UCS testing, the percentage of CaCO3 was measured by acid digestion. Table
7 summarizes the results and observations from testing of the columns prepared using
xanthan gum as part of the EICP solution.
Table 7 Results and observations from using xanthan gum as part of the EICP solution
*=Specimen 1AA and 1BB were prepared with high concentration of urea: CaCL2 and by
that specimen were not suitable for UCS testing (i.e. were easily deformed in a plastic
manner due to Xanthan gum).
The failure pattern from the UCS testing of columns prepared by mixing xanthan
gum with the EICP solution were different than those of the columns prepared using
Column
Concentration
of Urea:
CaCl2
Peak
Strength
(kPa)
ε𝑓
CaCO3%
Water
content
after air
drying
1AA* 2.65:1.5 n/a n/a n/a n/a
1BB* 2.65:1.5 n/a n/a n/a n/a
2AA 1.75:1.00 830 4.1 4.63 12.29%
2BB 1.75:1.00 899 1.95 3.00 10.91%
3AA 0.875:0.50 159 0.6 2.83 10.41%
3BB 0.875:0.50 155 3 3.63 11.01%

67
xanthan gum as powder. The failure pattern for the samples prepared by mixing xanthan
gum with the EICP solution was bulging at the bottom of the column. Figure 20 illustrates
the pattern failure in UCS testing when xanthan gum was mixed with EICP solution.
Figures 21 and 22 shows the stress-strain curves from UCS testing for the specimens
treated by dissolving xanthan gum in the EICP solution
Figure 20. Bulging failure when xanthan gum used as part of EICP solution
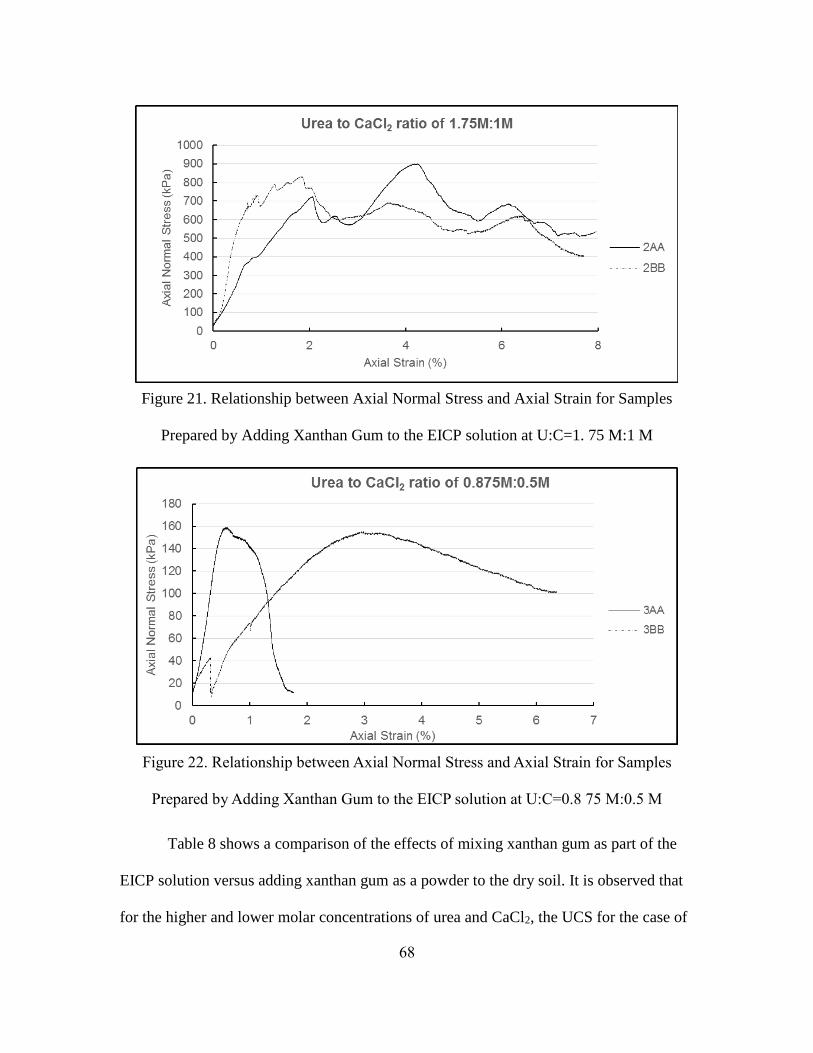
68
Figure 21. Relationship between Axial Normal Stress and Axial Strain for Samples
Prepared by Adding Xanthan Gum to the EICP solution at U:C=1. 75 M:1 M
Figure 22. Relationship between Axial Normal Stress and Axial Strain for Samples
Prepared by Adding Xanthan Gum to the EICP solution at U:C=0.8 75 M:0.5 M
Table 8 shows a comparison of the effects of mixing xanthan gum as part of the
EICP solution versus adding xanthan gum as a powder to the dry soil. It is observed that
for the higher and lower molar concentrations of urea and CaCl2, the UCS for the case of
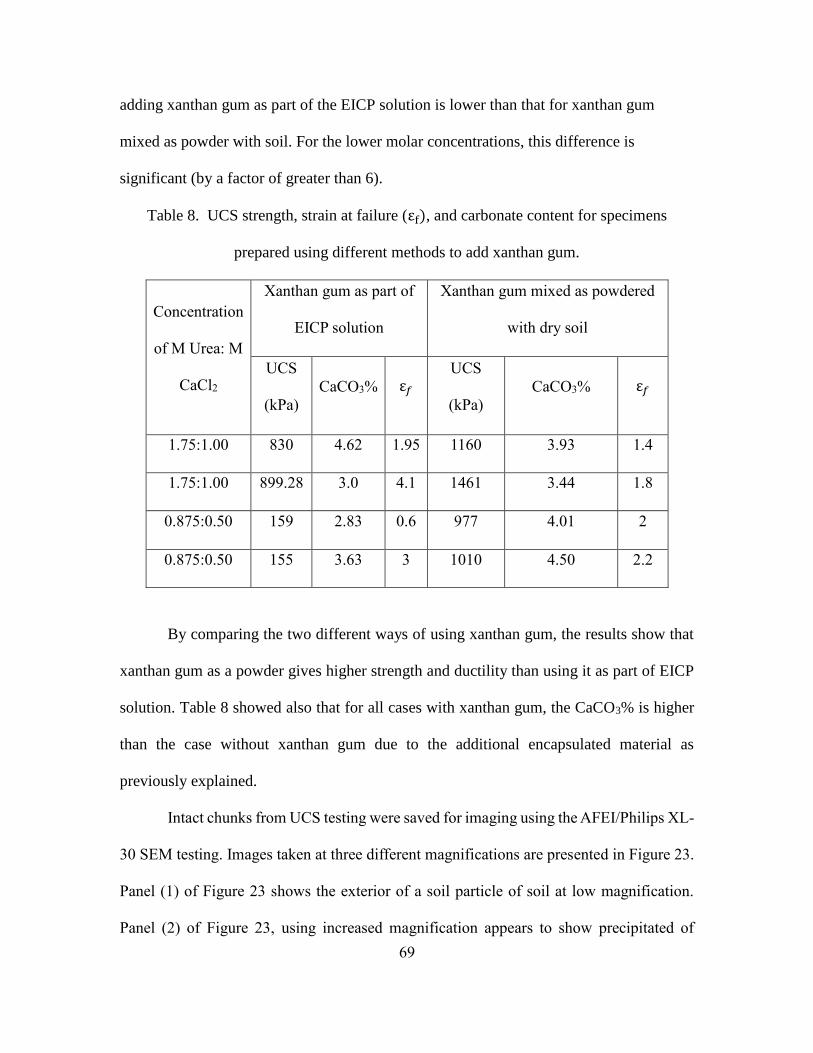
69
adding xanthan gum as part of the EICP solution is lower than that for xanthan gum
mixed as powder with soil. For the lower molar concentrations, this difference is
significant (by a factor of greater than 6).
Table 8. UCS strength, strain at failure (εf), and carbonate content for specimens
prepared using different methods to add xanthan gum.
Concentration
of M Urea: M
CaCl2
Xanthan gum as part of
EICP solution
Xanthan gum mixed as powdered
with dry soil
UCS
(kPa)
CaCO3% ε𝑓 UCS
(kPa)
CaCO3% ε𝑓
1.75:1.00 830 4.62 1.95 1160 3.93 1.4
1.75:1.00 899.28 3.0 4.1 1461 3.44 1.8
0.875:0.50 159 2.83 0.6 977 4.01 2
0.875:0.50 155 3.63 3 1010 4.50 2.2
By comparing the two different ways of using xanthan gum, the results show that
xanthan gum as a powder gives higher strength and ductility than using it as part of EICP
solution. Table 8 showed also that for all cases with xanthan gum, the CaCO3% is higher
than the case without xanthan gum due to the additional encapsulated material as
previously explained.
Intact chunks from UCS testing were saved for imaging using the AFEI/Philips XL-
30 SEM testing. Images taken at three different magnifications are presented in Figure 23.
Panel (1) of Figure 23 shows the exterior of a soil particle of soil at low magnification.
Panel (2) of Figure 23, using increased magnification appears to show precipitated of
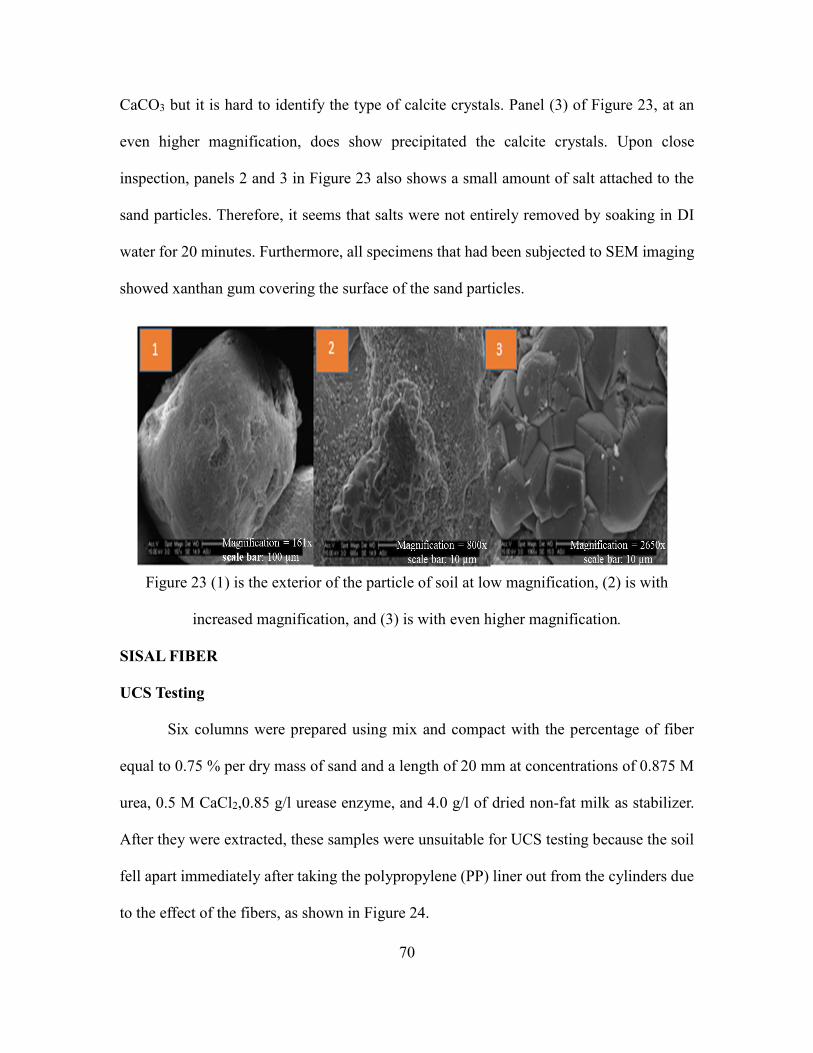
70
CaCO3 but it is hard to identify the type of calcite crystals. Panel (3) of Figure 23, at an
even higher magnification, does show precipitated the calcite crystals. Upon close
inspection, panels 2 and 3 in Figure 23 also shows a small amount of salt attached to the
sand particles. Therefore, it seems that salts were not entirely removed by soaking in DI
water for 20 minutes. Furthermore, all specimens that had been subjected to SEM imaging
showed xanthan gum covering the surface of the sand particles.
Figure 23 (1) is the exterior of the particle of soil at low magnification, (2) is with
increased magnification, and (3) is with even higher magnification.
SISAL FIBER
UCS Testing
Six columns were prepared using mix and compact with the percentage of fiber
equal to 0.75 % per dry mass of sand and a length of 20 mm at concentrations of 0.875 M
urea, 0.5 M CaCl2,0.85 g/l urease enzyme, and 4.0 g/l of dried non-fat milk as stabilizer.
After they were extracted, these samples were unsuitable for UCS testing because the soil
fell apart immediately after taking the polypropylene (PP) liner out from the cylinders due
to the effect of the fibers, as shown in Figure 24.
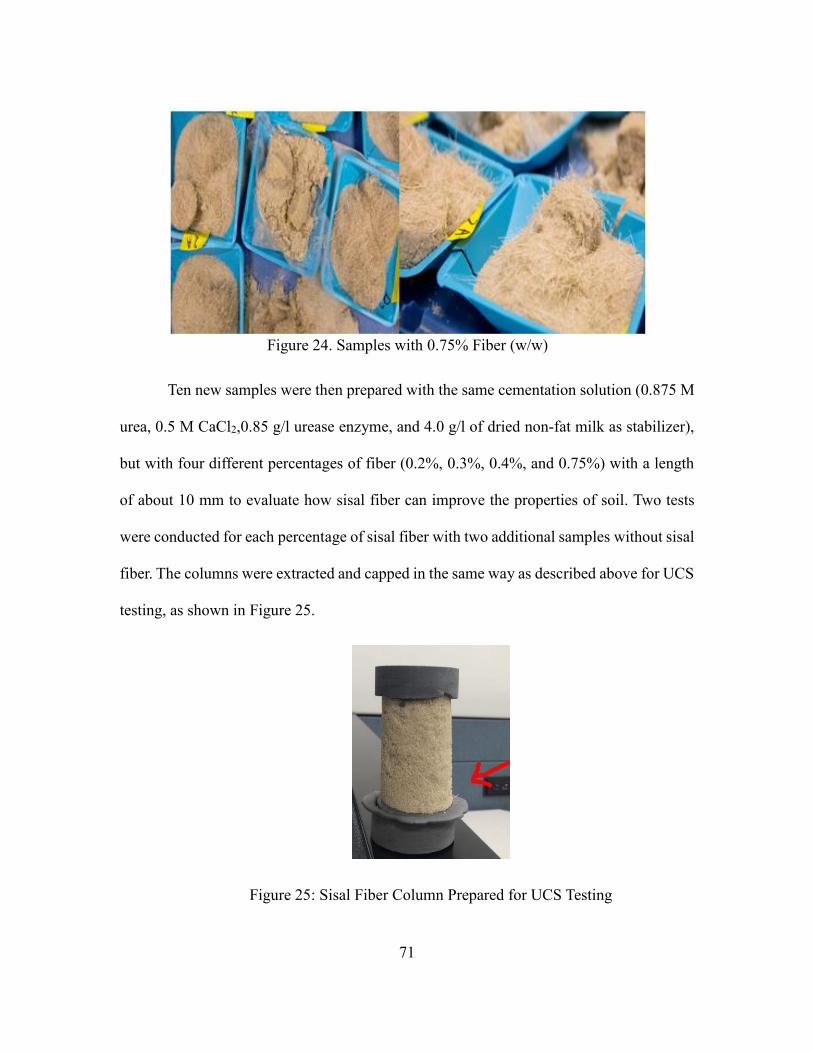
71
Figure 24. Samples with 0.75% Fiber (w/w)
Ten new samples were then prepared with the same cementation solution (0.875 M
urea, 0.5 M CaCl2,0.85 g/l urease enzyme, and 4.0 g/l of dried non-fat milk as stabilizer),
but with four different percentages of fiber (0.2%, 0.3%, 0.4%, and 0.75%) with a length
of about 10 mm to evaluate how sisal fiber can improve the properties of soil. Two tests
were conducted for each percentage of sisal fiber with two additional samples without sisal
fiber. The columns were extracted and capped in the same way as described above for UCS
testing, as shown in Figure 25.
Figure 25: Sisal Fiber Column Prepared for UCS Testing
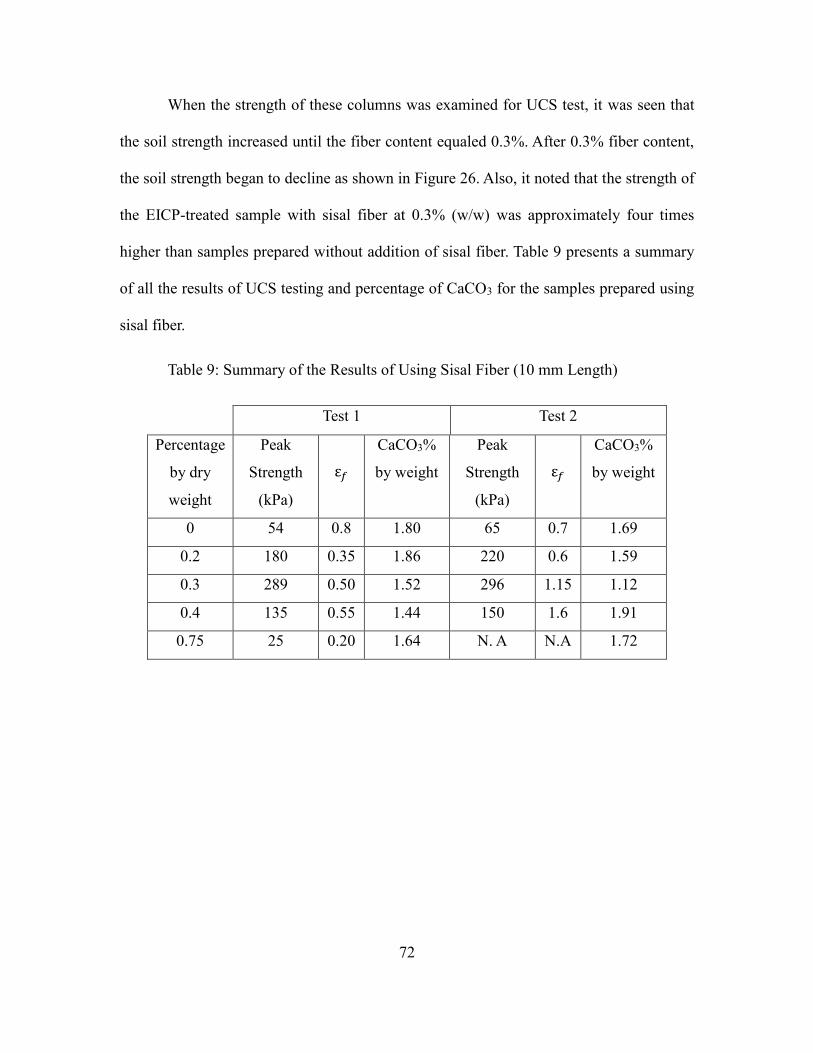
72
When the strength of these columns was examined for UCS test, it was seen that
the soil strength increased until the fiber content equaled 0.3%. After 0.3% fiber content,
the soil strength began to decline as shown in Figure 26. Also, it noted that the strength of
the EICP-treated sample with sisal fiber at 0.3% (w/w) was approximately four times
higher than samples prepared without addition of sisal fiber. Table 9 presents a summary
of all the results of UCS testing and percentage of CaCO3 for the samples prepared using
sisal fiber.
Table 9: Summary of the Results of Using Sisal Fiber (10 mm Length)
Test 1 Test 2
Percentage
by dry
weight
Peak
Strength
(kPa)
ε𝑓
CaCO3%
by weight
Peak
Strength
(kPa)
ε𝑓
CaCO3%
by weight
0 54 0.8 1.80 65 0.7 1.69
0.2 180 0.35 1.86 220 0.6 1.59
0.3 289 0.50 1.52 296 1.15 1.12
0.4 135 0.55 1.44 150 1.6 1.91
0.75 25 0.20 1.64 N. A N.A 1.72

73
Figure 26 Relationship between the Percentage of 10 mm Sisal Fibers and Peak Strength
As shown above in Figure 26 and Table 9, higher amounts of fibers and longer
lengths can have a negative impact on the strength. Li et al (2015) came to a similar
conclusion regarding the influence of fiber on the mechanical properties of MICP-treated
sand. Li et al. (2015) used a synthetic fiber instead of sisal fibers and found, as illustrated
in Figure 27a, the maximum strength was achieved at 0.2 % per mass of dry soil (versus
0.3% for the tests reported herein).
0
50
100
150
200
250
300
350
0 0.1 0.2 0.3 0.4 0.5 0.6 0.7 0.8
Peak S
trength
(kP
a)
% Sisal Fiber
Test 1 Test 2
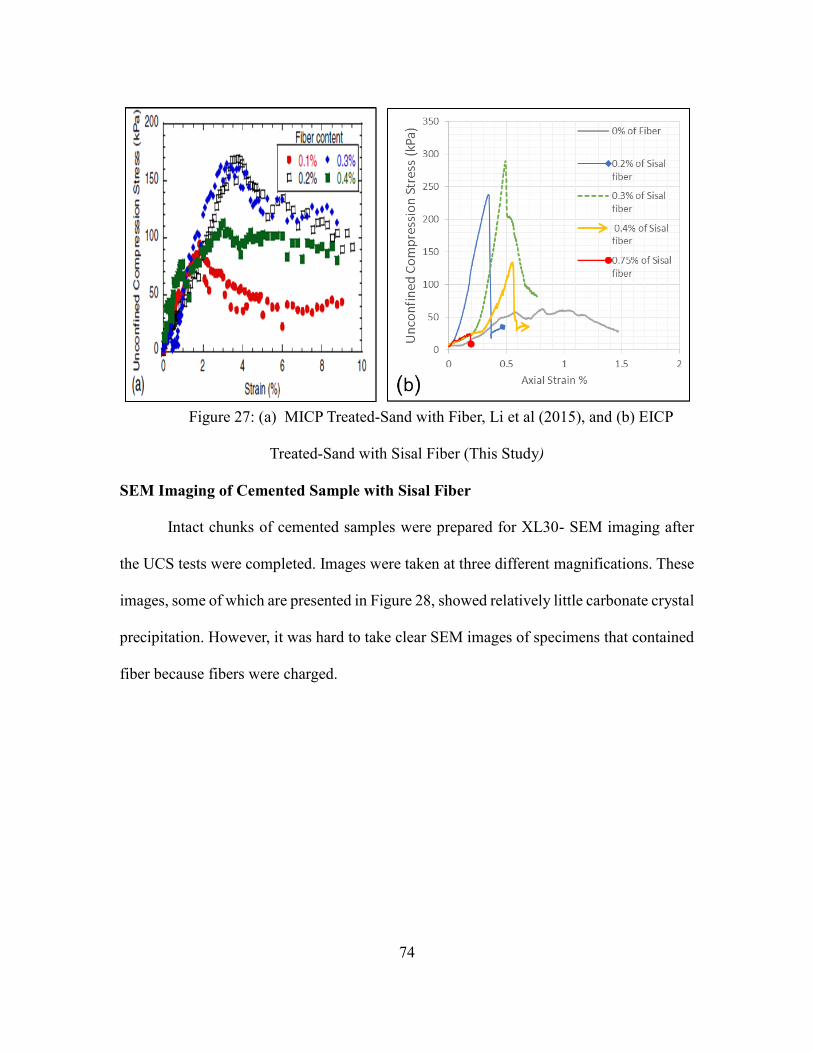
74
Figure 27: (a) MICP Treated-Sand with Fiber, Li et al (2015), and (b) EICP
Treated-Sand with Sisal Fiber (This Study)
SEM Imaging of Cemented Sample with Sisal Fiber
Intact chunks of cemented samples were prepared for XL30- SEM imaging after
the UCS tests were completed. Images were taken at three different magnifications. These
images, some of which are presented in Figure 28, showed relatively little carbonate crystal
precipitation. However, it was hard to take clear SEM images of specimens that contained
fiber because fibers were charged.

75
Figure 28 Illustrative SEM images of calcite crystals with fiber at different
magnifications and locations
CONCLUSION
The potential for enhancing the strength of EICP improved Ottawa 20-30 by adding
two different natural materials, xanthan gum and sisal fiber, was evaluated. The optimum
amount of xanthan gum for enhancing unconfined compressive strength was 1.1% (w/w)
of the dry weight of the soil. Xanthan gum was applied in two ways: mixed as powder with
dry soil and mixed with EICP solution. Mixing the xanthan gum as powder into dry soil
showed higher strength and ductility than mixing the xanthan gum into the EICP solution.
For both method of application of xanthan gum, it was very hard to dry the samples,
even in an oven at 105 °C. Acid digestion of samples prepared using both methods yielded
a higher percentage of CaCO3 than the theoretical amount based upon the amount of
calcium in the EICP solution. This discrepancy is attributed to salts (including ammonium
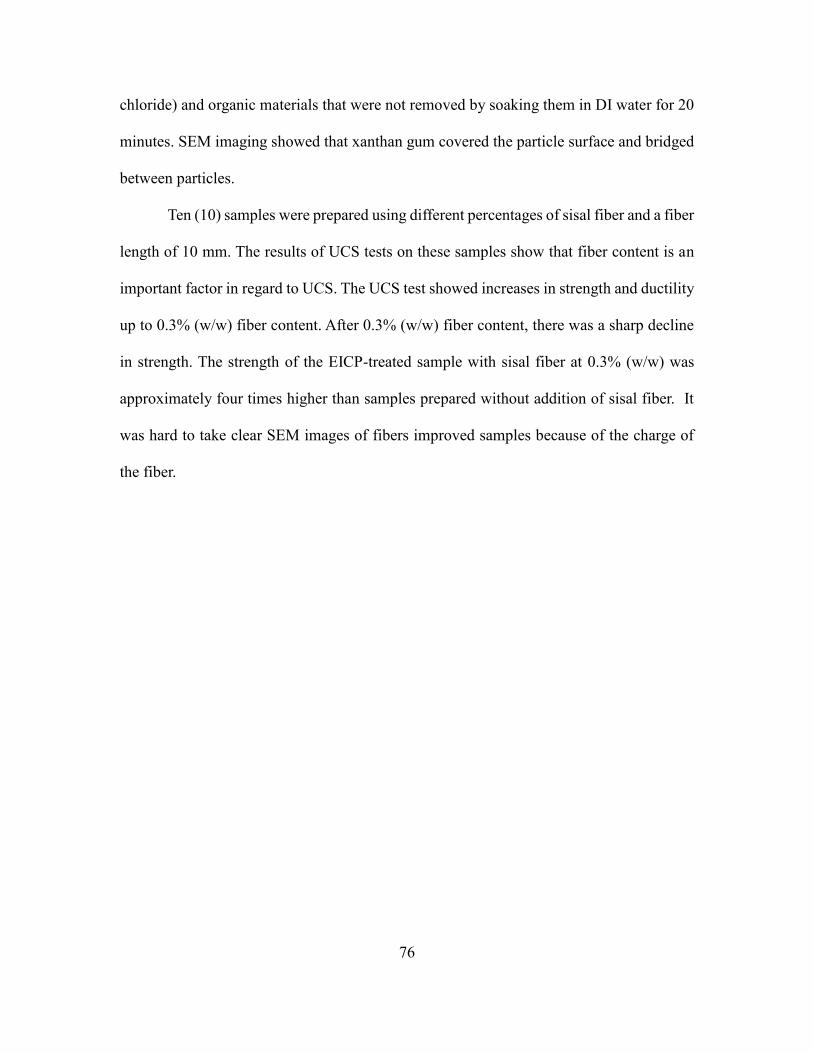
76
chloride) and organic materials that were not removed by soaking them in DI water for 20
minutes. SEM imaging showed that xanthan gum covered the particle surface and bridged
between particles.
Ten (10) samples were prepared using different percentages of sisal fiber and a fiber
length of 10 mm. The results of UCS tests on these samples show that fiber content is an
important factor in regard to UCS. The UCS test showed increases in strength and ductility
up to 0.3% (w/w) fiber content. After 0.3% (w/w) fiber content, there was a sharp decline
in strength. The strength of the EICP-treated sample with sisal fiber at 0.3% (w/w) was
approximately four times higher than samples prepared without addition of sisal fiber. It
was hard to take clear SEM images of fibers improved samples because of the charge of
the fiber.

77
CHAPTER 5
MODIFYING EICP SOLUTION BY ADDING AN ORGANIC ADDITIVES
INTRODUCTION
This chapter presents results of unconfined compression strength tests on
columns of Ottawa 20-30 sand enhanced by adding a “fresh” organic additive (dried
non-fat milk) to the EICP solution. The tests described in Chapters 4 and 6 were
conducted using old (expired) powdered dried non-fat milk as a stabilizer. In this
chapter, fresh (unexpired) powdered dried non-fat milk was used. Unexpectedly, the
tests described in this chapter, achieved significantly higher strengths at significantly
lower carbonate content than the earlier tests. Tests were also conducting using a
different organic additive, green cabbage juice. But the effect of this additive was
negligible.
The tests reported in the chapter that used the fresh additive achieved an
unconfined compression strength (UCS) as high as 2 MPa at 1% CaCO3 content with
only one cycle of treatment. All the experiments were conducted using soil-filled
acrylic columns lined with polypropylene sleeves to facilitate extraction of the samples
for UCS testing. Initial experiments were repeated several times to confirm the
unexpected results. These experiments also showed a better morphology than earlier
tests based on scanning electron microscope (SEM) imaging. Furthermore, tensile
splitting was observed as the failure mode in the UCS tests, indicating a shear strength
in excess of the UCS strength. Therefore, a series of triaxial compression tests at three
confining pressures (50 kPa, 100 kPa, and 150 kPa) were conducted to assess the shear
strength of specimens prepared using the fresh dried non-fat milk.
78
METHODS AND MATERIALS
EICP Treatment Solutions
EICP solutions were prepared by dissolving the EICP constituents in deionized
water. Solutions were prepared using: (a) green cabbage juice, and (b) dried non-fat milk.
Tests employed two different concentrations of the substrate and enzyme: one a relatively
low concentration (0.37 M urea, 0.25 M CaCl2, 0.8 g/l urease) and one a relatively high
concentration (1 M urea, 0.67 M CaCl2, 3.0 g/l urease). Concentrations of constituents
used in the tests described in this chapter were:
Solution 1: 1 M of urea: 0.67 M of CaCl2, and 3 g/l of urease enzyme (no powdered
dried non-fat milk or cabbage juice added).
Solution 2: 1 M of urea: 0.67 M of CaCl2, 3 g/l of urease enzyme, and 4 g/l dried
non-fat milk.
Solution 3: 1 M of urea: 0.67 M of CaCl2, different amount of green cabbage juice,
and 3 g/l of urease enzyme.
Solution 4: 1 M of urea: 0.67 M of CaCl2, different amounts of green cabbage juice,
3 g/l of urease enzyme, and 4 g/l of dried non-fat milk.
Solution 5: 0.37 M of urea: 0.25 M of CaCl2, 0.8 g/l of urease enzyme, and 4 g/l of
dried non-fat milk.
EICP Solution 1 listed is the same solution as employed in the baseline tests
described in Chapter 3. EICP Solution 2 is the same as used in Chapter 3 except that fresh
dried non-fat milk was added. In EICP Solution 3, cabbage juice was used instead of dried
non-fat milk. In EICP Solution 4, both cabbage juice and dried non-fat milk were used. In
EICP Solution 5, reduced concentrations of urea, calcium chloride, and urease enzyme

79
were used with dried non-fat milk in an attempt to increase the utilization of the calcium
in the substrate. CaCl2 in the form of (CaCl2-2H2O) and urea were used in all of these
solutions. Both of these reagents were Sigma-Aldrich reagents’ grade and had a purity of
greater than ≥ 99%. The urease was low grade activity (jack bean urease) from Fisher
Scientific.
Dried non-fat milk was added to the ECIP solution because it has been reported to
act as a stabilizer for the enzyme (Nemati, M., and Voordouw, G. (2003); Iyer, P.V, and
Ananthanarayan, L. (2008)). Cabbage juice was used in the EICP solution in an attempt to
slow down the reaction. It was reported in Olech et al (2014) that cabbage juice was able
to inhibit the ureolysis reaction for a short time. Juice from garlic and Brussel sprouts were
reportedly able to inhibit the reaction completely. As the objective of this organic additive
was to slow down, not stop the reaction, cabbage juice was used in these experiments. The
objective in slowing down the precipitation rate was to allow the injected solution to
penetrate deeper into the pores of the soil before the decrease in permeability
accompanying precipitation hinders penetration. A slower precipitation rate may also result
in precipitation of greater amounts of calcite compared to other polymorphs of calcium
carbonate such aragonite and vaterite and may lead to larger calcite crystals, resulting in a
stronger and more durable precipitate.
The cabbage juice was extracted from green cabbages purchased from an organic
grocery store. The active ingredient in the cabbage juice that inhibits the ureolysis reaction
is reported to be thiosulfinate (Olech et al.2014).
80
Sample Preparation
Soil columns were prepared in acrylic cylinders were filled with Ottawa 20-30
sand (US Silica Company), a uniform quartz sand with a mean grain size of 0.6 mm, to
investigate enzymatic ureolytic CaCO3 precipitation. The acrylic cylinders measured
101.6 mm high and 50.8 mm in inner diameter (4” × 2”). A polypropylene (PP) liner was
placed inside of the acrylic columns to ease sample extraction for UCS testing. The bottoms
of the columns were closed with rubber caps and sealed with silicone glue to minimize
leakage. The PP liner extended above the acrylic cylinder and its top was loosely closed to
minimize evaporation of the EICP solution. Each soil column was prepared by first
pouring 75 ml of the EICP solution (corresponding to slightly more than one pore
volume of the final specimen) into a bowl containing 350 g of 20-30 Ottawa sand and
then thoroughly mixing the sand and solution. The sand-ECIP solution mixture was then
quickly placed into the acrylic column in three layers. Each layer was compacted using the
same compaction procedure described in Chapter 4, i.e., by tamping 25 times with a small
hammer to reach a relative density of 90% (based upon the dry weight of soil). The hammer
weighed 11.56 N (2.6 lb.). After compaction, the solution was always a few millimeters
above the soil, indicating that the soil is almost under a saturated condition.
Sample Curing
The compacted soil and cementation fluid was allowed to stand in the acrylic
cylinders for at least 72 hours at room temperature. The residual fluid was then drained
out from the bottom of the cylinder. Drainage was accomplished by puncturing the
rubber base of the cylinder with a syringe needle. When drainage was completed, 80
ml of DI water (slightly more than one-pore volume) was added slowly to the top of each
81
column to flush EICP solution and soluble salts from the column. After draining and
flushing were complete, each treated specimen was extracted from the acrylic cylinder.
Then, selected samples were soaked in DI water for at least one half hour (as described
subsequently). All samples were placed into an oven at (40 °C) until a constant mass was
achieved. Once oven drying was complete, specimens were prepared for the UCS Test.
UCS Testing
UCS testing was conducted in according with ASTM D4918. Prior to performing
the UCS test, the top and bottom surface of each sample was leveled using plastic steel
putty from ITW Devcon, as described previously ( in Chapter 4).
Triaxial Testing
Undrained triaxial tests were conducted on samples prepared using Solution 2 in
order to measure the shear strength of the treated soil. In these tests, the Ottawa 20-30 sand
was prepared at a relative density of 40%, instead of 90% for comparison to results of
specimens compacted to 40% relative density and treated using microbially induced
carbonate preparation (MICP). The samples were prepared by pouring the dry soil through
a funnel (air pluviation of dry soil). Before applying the confining pressure, each sample
was back pressure saturated until Skempton’s B parameter was above 0.95. Samples were
tested at confining pressures of 50 kPa, 100 kPa, and 150 kPa. Each test was performed at
a constant axial strain rate of 0.5% per minute to a final strain of 20%.
Acid Digestion
Following UCS and triaxial testing, intact pieces of samples were dried in an oven
at 105 °C for 24 hours, weighed, and then washed with a strong (4 M) hydrochloric acid
(HCl) solution to determine the mass of calcium carbonate precipitates. Following
82
treatment with HCl, the samples were rinsed with deionized (DI) water and dried in the
oven at 105 °C. The mass difference before and after the acid-wash was considered as the
mass of the carbonates precipitated in the specimen.
Micro Scale Identification Analysis
X-Ray Diffraction (XRD) analysis was performed on intact pieces of selected
specimens to identify mineral crystal phases existing in each sample. The samples were
ground using an agate mortar and pestle and powdered onto a standard glass slide for XRD
analysis. Scanning electron microscopy (SEM) imaging was also performed on intact
cemented chunks of material using an Agilent 8500 Low-Voltage SEM (LV-SEM). Energy
dispersive X-ray (EDX) analysis was also carried out in conjunction with SEM imaging to
determine the elemental composition of each sample. The samples were coated with carbon
prior to SEM/EDX analysis.
RESULTS
Tests Using EICP Solution 1
Two columns were prepared using EICP Solution 1, i.e., composed of 1 M urea,
0.67 M CaCl2, and 3 g/L of urease enzyme (Solution 1, which does not have powdered
dried non-fat milk or cabbage juice into the EICP solution, is the baseline solution tested
in Chapter 3). The results of UCS testing and acid digestion on these two specimens are
shown in Table 10. These results are similar to the results shown in Table 4 in Chapter 3
for specimens prepared using the same formulation as Solution 1.
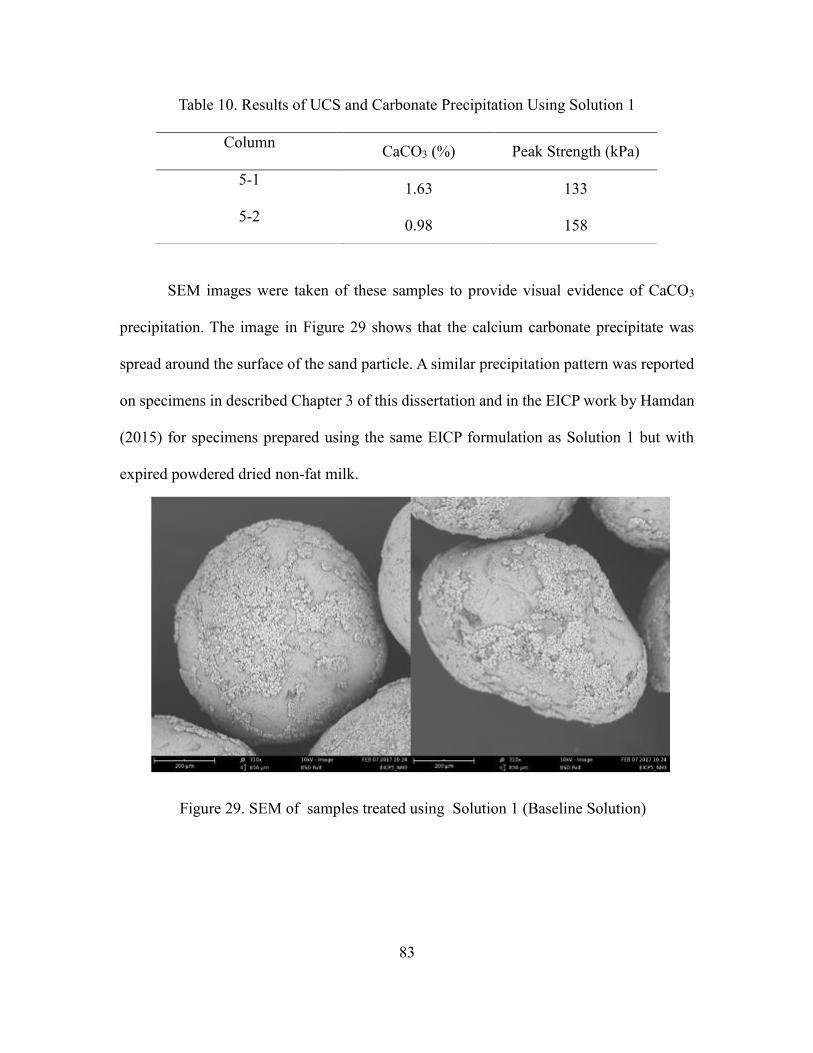
83
Table 10. Results of UCS and Carbonate Precipitation Using Solution 1
SEM images were taken of these samples to provide visual evidence of CaCO3
precipitation. The image in Figure 29 shows that the calcium carbonate precipitate was
spread around the surface of the sand particle. A similar precipitation pattern was reported
on specimens in described Chapter 3 of this dissertation and in the EICP work by Hamdan
(2015) for specimens prepared using the same EICP formulation as Solution 1 but with
expired powdered dried non-fat milk.
Figure 29. SEM of samples treated using Solution 1 (Baseline Solution)
Column CaCO3 (%) Peak Strength (kPa)
5-1 1.63 133
5-2 0.98 158
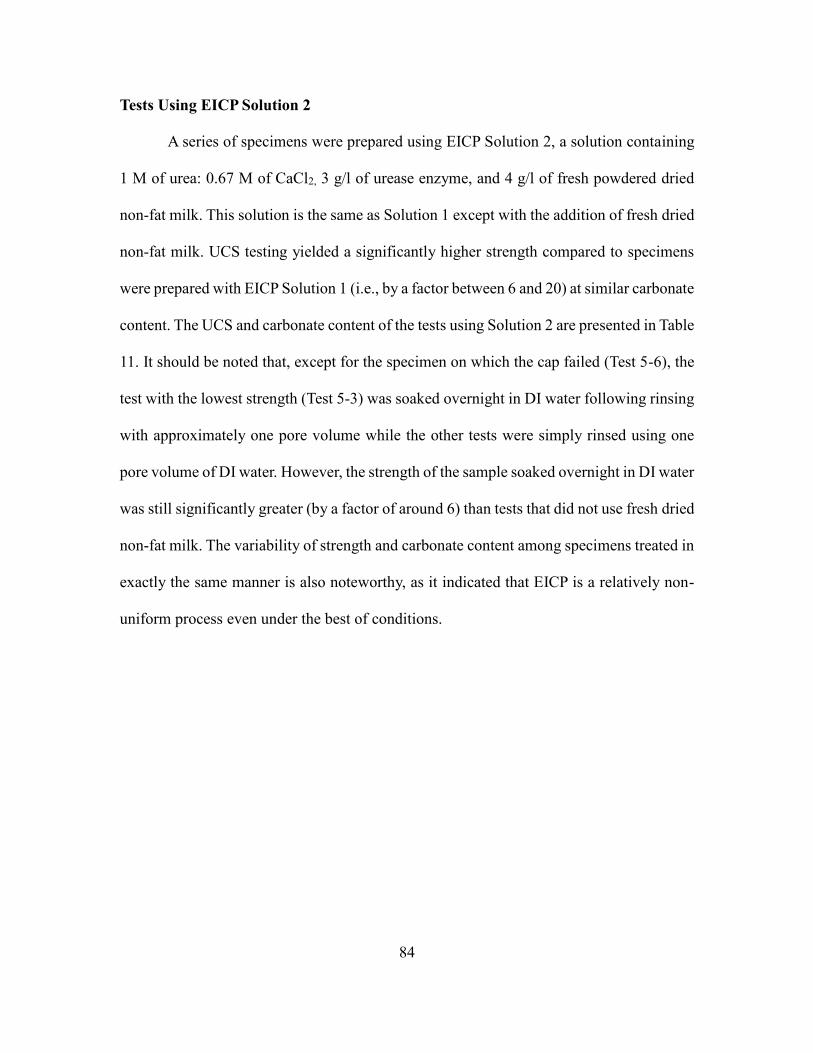
84
Tests Using EICP Solution 2
A series of specimens were prepared using EICP Solution 2, a solution containing
1 M of urea: 0.67 M of CaCl2, 3 g/l of urease enzyme, and 4 g/l of fresh powdered dried
non-fat milk. This solution is the same as Solution 1 except with the addition of fresh dried
non-fat milk. UCS testing yielded a significantly higher strength compared to specimens
were prepared with EICP Solution 1 (i.e., by a factor between 6 and 20) at similar carbonate
content. The UCS and carbonate content of the tests using Solution 2 are presented in Table
11. It should be noted that, except for the specimen on which the cap failed (Test 5-6), the
test with the lowest strength (Test 5-3) was soaked overnight in DI water following rinsing
with approximately one pore volume while the other tests were simply rinsed using one
pore volume of DI water. However, the strength of the sample soaked overnight in DI water
was still significantly greater (by a factor of around 6) than tests that did not use fresh dried
non-fat milk. The variability of strength and carbonate content among specimens treated in
exactly the same manner is also noteworthy, as it indicated that EICP is a relatively non-
uniform process even under the best of conditions.
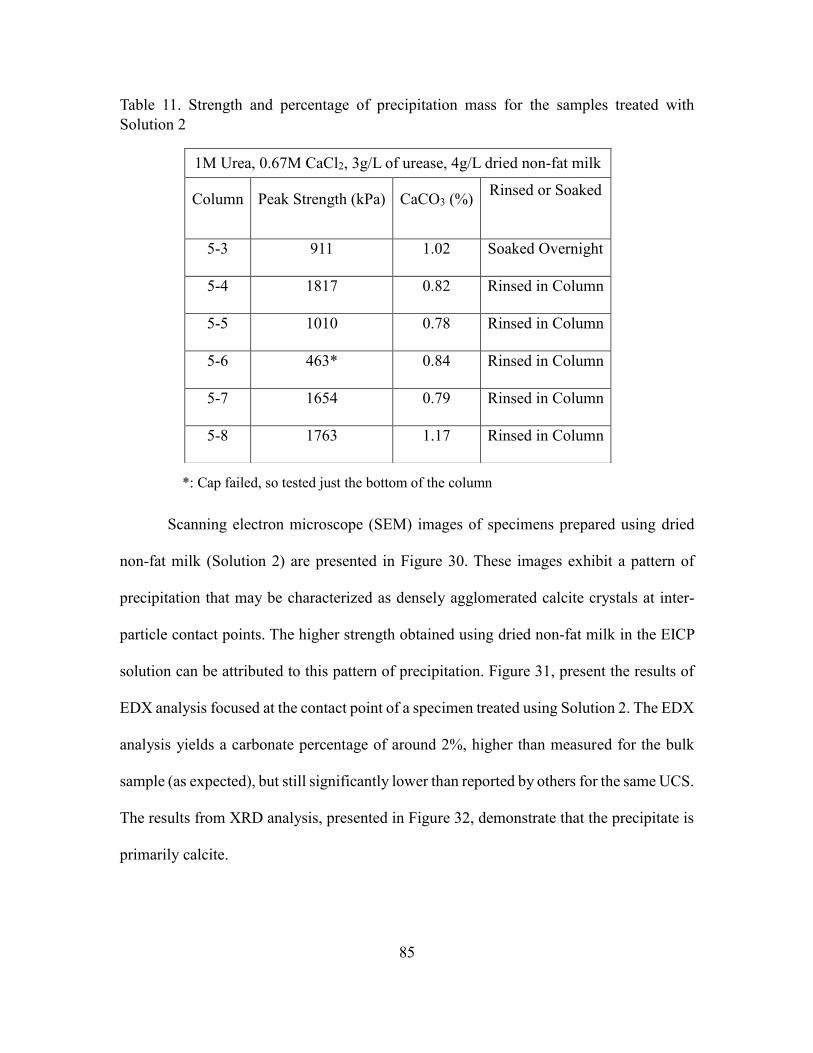
85
Table 11. Strength and percentage of precipitation mass for the samples treated with
Solution 2
*: Cap failed, so tested just the bottom of the column
Scanning electron microscope (SEM) images of specimens prepared using dried
non-fat milk (Solution 2) are presented in Figure 30. These images exhibit a pattern of
precipitation that may be characterized as densely agglomerated calcite crystals at inter-
particle contact points. The higher strength obtained using dried non-fat milk in the EICP
solution can be attributed to this pattern of precipitation. Figure 31, present the results of
EDX analysis focused at the contact point of a specimen treated using Solution 2. The EDX
analysis yields a carbonate percentage of around 2%, higher than measured for the bulk
sample (as expected), but still significantly lower than reported by others for the same UCS.
The results from XRD analysis, presented in Figure 32, demonstrate that the precipitate is
primarily calcite.
1M Urea, 0.67M CaCl2, 3g/L of urease, 4g/L dried non-fat milk
Column Peak Strength (kPa) CaCO3 (%) Rinsed or Soaked
5-3 911 1.02 Soaked Overnight
5-4 1817 0.82 Rinsed in Column
5-5 1010 0.78 Rinsed in Column
5-6 463* 0.84 Rinsed in Column
5-7 1654 0.79 Rinsed in Column
5-8 1763 1.17 Rinsed in Column
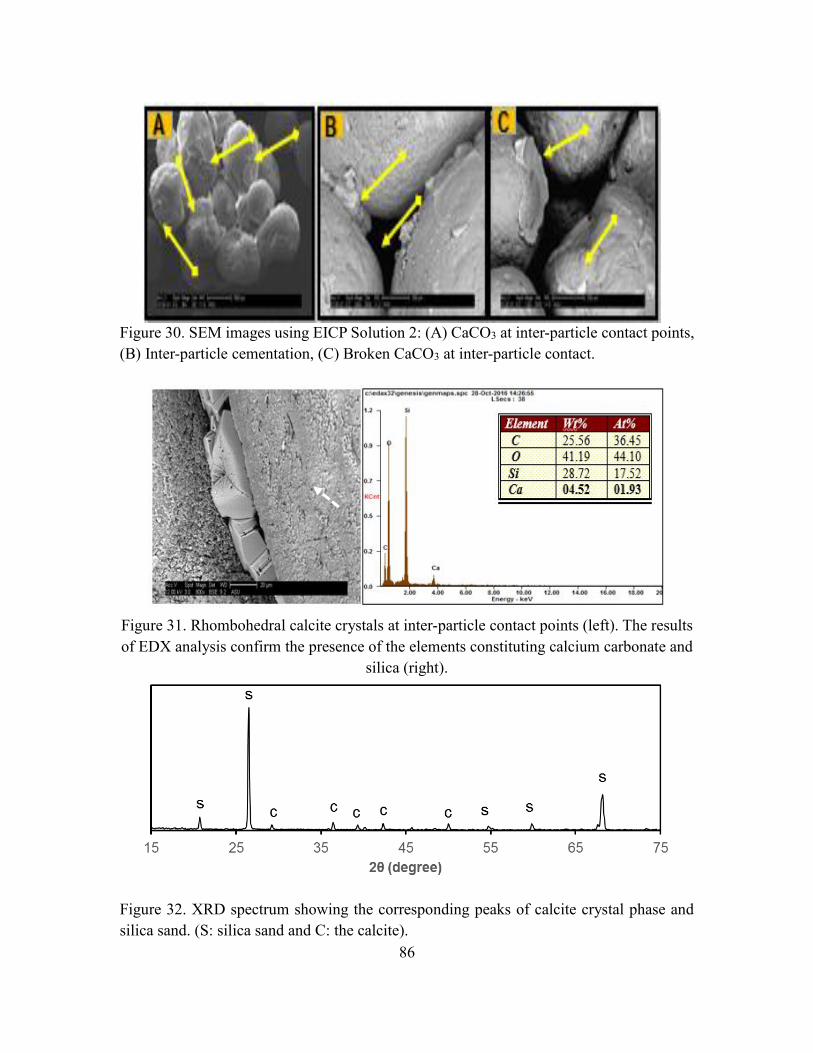
86
Figure 30. SEM images using EICP Solution 2: (A) CaCO3 at inter-particle contact points,
(B) Inter-particle cementation, (C) Broken CaCO3 at inter-particle contact.
Figure 31. Rhombohedral calcite crystals at inter-particle contact points (left). The results
of EDX analysis confirm the presence of the elements constituting calcium carbonate and
silica (right).
Figure 32. XRD spectrum showing the corresponding peaks of calcite crystal phase and
silica sand. (S: silica sand and C: the calcite).
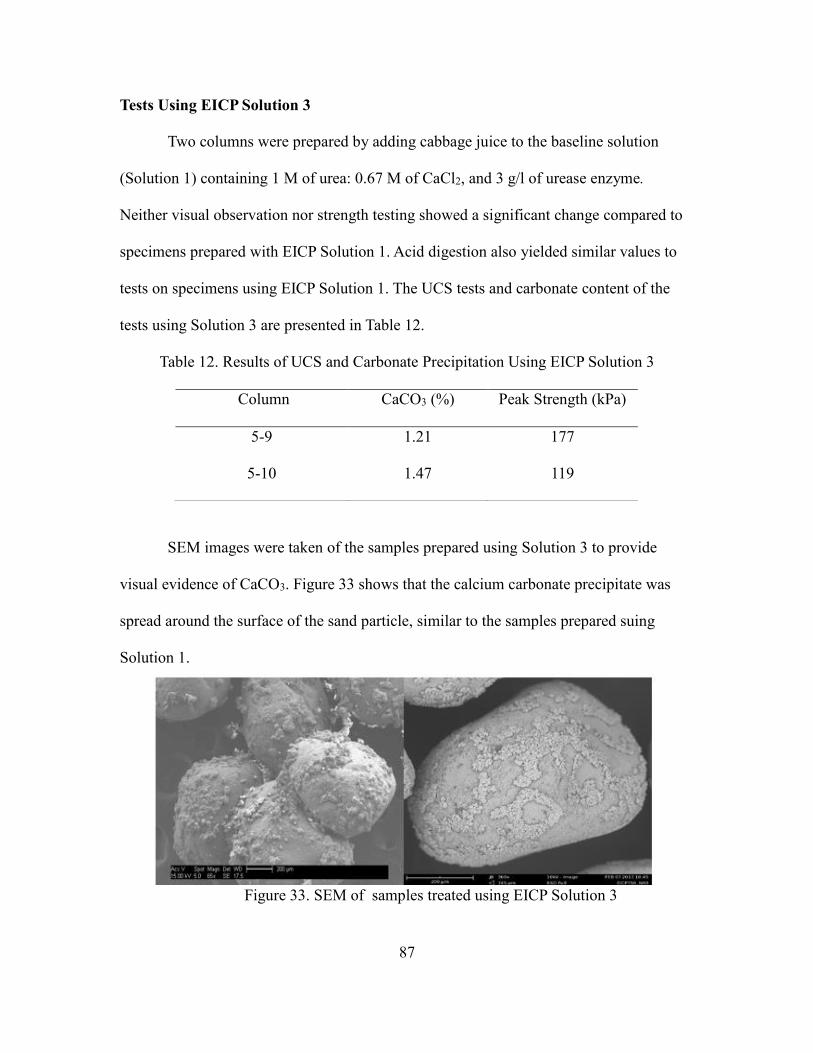
87
Tests Using EICP Solution 3
Two columns were prepared by adding cabbage juice to the baseline solution
(Solution 1) containing 1 M of urea: 0.67 M of CaCl2, and 3 g/l of urease enzyme.
Neither visual observation nor strength testing showed a significant change compared to
specimens prepared with EICP Solution 1. Acid digestion also yielded similar values to
tests on specimens using EICP Solution 1. The UCS tests and carbonate content of the
tests using Solution 3 are presented in Table 12.
Table 12. Results of UCS and Carbonate Precipitation Using EICP Solution 3
SEM images were taken of the samples prepared using Solution 3 to provide
visual evidence of CaCO3. Figure 33 shows that the calcium carbonate precipitate was
spread around the surface of the sand particle, similar to the samples prepared suing
Solution 1.
Figure 33. SEM of samples treated using EICP Solution 3
Column CaCO3 (%) Peak Strength (kPa)
5-9 1.21 177
5-10 1.47 119
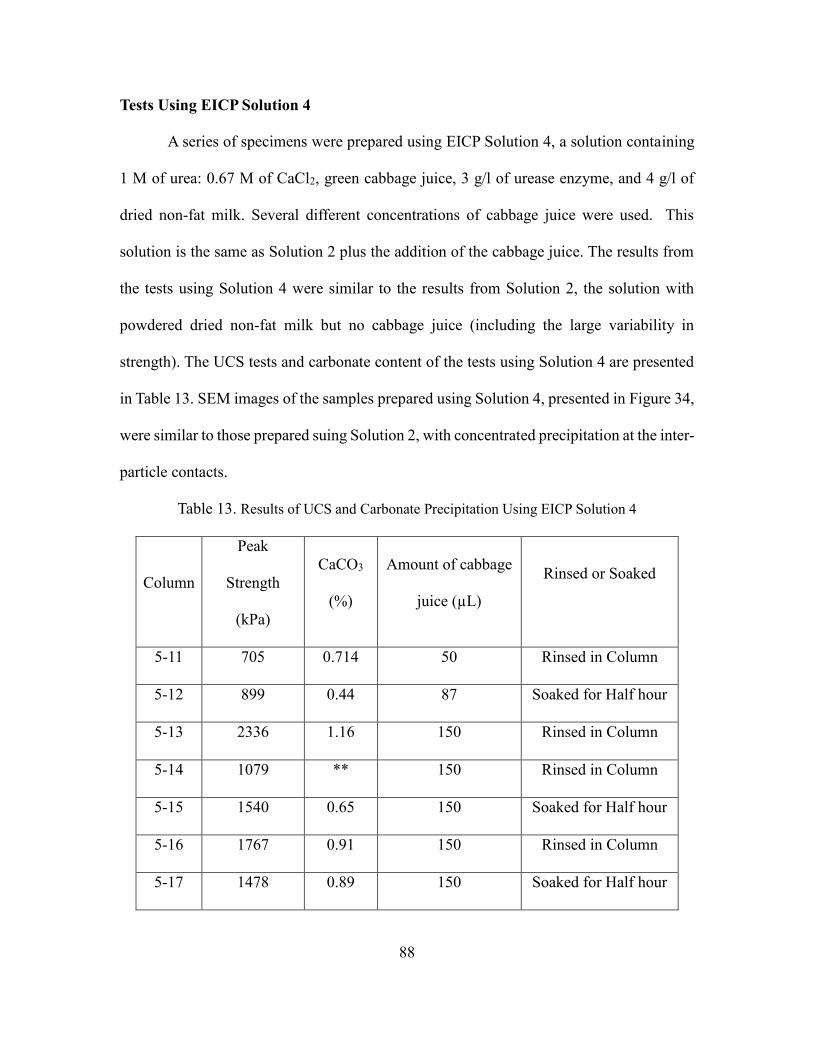
88
Tests Using EICP Solution 4
A series of specimens were prepared using EICP Solution 4, a solution containing
1 M of urea: 0.67 M of CaCl2, green cabbage juice, 3 g/l of urease enzyme, and 4 g/l of
dried non-fat milk. Several different concentrations of cabbage juice were used. This
solution is the same as Solution 2 plus the addition of the cabbage juice. The results from
the tests using Solution 4 were similar to the results from Solution 2, the solution with
powdered dried non-fat milk but no cabbage juice (including the large variability in
strength). The UCS tests and carbonate content of the tests using Solution 4 are presented
in Table 13. SEM images of the samples prepared using Solution 4, presented in Figure 34,
were similar to those prepared suing Solution 2, with concentrated precipitation at the inter-
particle contacts.
Table 13. Results of UCS and Carbonate Precipitation Using EICP Solution 4
Column
Peak
Strength
(kPa)
CaCO3
(%)
Amount of cabbage
juice (µL)
Rinsed or Soaked
5-11 705 0.714 50 Rinsed in Column
5-12 899 0.44 87 Soaked for Half hour
5-13 2336 1.16 150 Rinsed in Column
5-14 1079 ** 150 Rinsed in Column
5-15 1540 0.65 150 Soaked for Half hour
5-16 1767 0.91 150 Rinsed in Column
5-17 1478 0.89 150 Soaked for Half hour
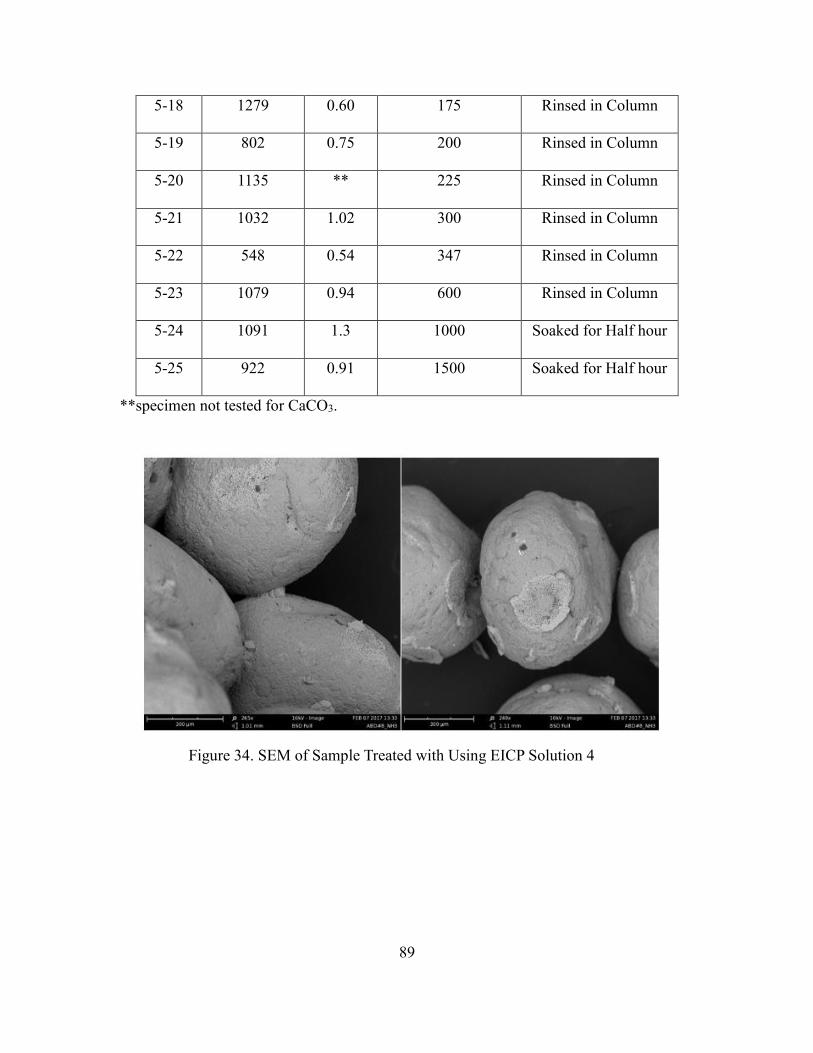
89
5-18 1279 0.60 175 Rinsed in Column
5-19 802 0.75 200 Rinsed in Column
5-20 1135 ** 225 Rinsed in Column
5-21 1032 1.02 300 Rinsed in Column
5-22 548 0.54 347 Rinsed in Column
5-23 1079 0.94 600 Rinsed in Column
5-24 1091 1.3 1000 Soaked for Half hour
5-25 922 0.91 1500 Soaked for Half hour
**specimen not tested for CaCO3.
Figure 34. SEM of Sample Treated with Using EICP Solution 4
90
Tests Using EICP Solution 5
Less CaCO3 than the theoretical maximum (the theoretical maximum is the
stoichiometric maximum based on the initial concentrations of CaCl2) was obtained from
the treatment solution containing 1 M urea and 0.67 M CaCl2. The Falcon test tube tests
reported in Chapter 3 suggest that a treatment solution with a lower concentration of urea
and CaCl2 may have a higher precipitation efficiency and still attain significant strength.
Therefore, two samples were treated using Solution 5, a solution with a lower concentration
of constituents than Solution 2. Solution 5 contained 0.375 M urea, 0.25 M CaCl2, 0.8 g/L
enzyme, and 4 g/L of powdered dried non-fat milk (37.5% of the urea and calcium in the
other solutions). The results of the tests on these specimens, shown in Table 14, still yield
a strength of over 1 MPa at very low CaCO3 content. Furthermore, the amount of CaCO3
precipitated was around the theoretical maximum.
Table 14. Results of UCS and Carbonate Precipitation Using Solution 5
SEM images of the specimens prepared using Solution 5, the lower concentration
of urea, CaCl2, and urease enzyme, are shown in Figure 35. These images shows the same
pattern of concentrated precipitation at inter-particle contacts than seen when the higher
concentration of urea, CaCl2, and urease enzyme was used with dried non-fat milk.
0.375 M Urea, 0.25 M CaCl2, 0.85 g/L of urease, 4 g/L dried non-fat milk
Column
Peak Strength
(kPa)
CaCO3 % Rinsed or Soaked
5-26 1000 0.57 Soaked overnight
5-27 1396 0.71 Rinsed in Column
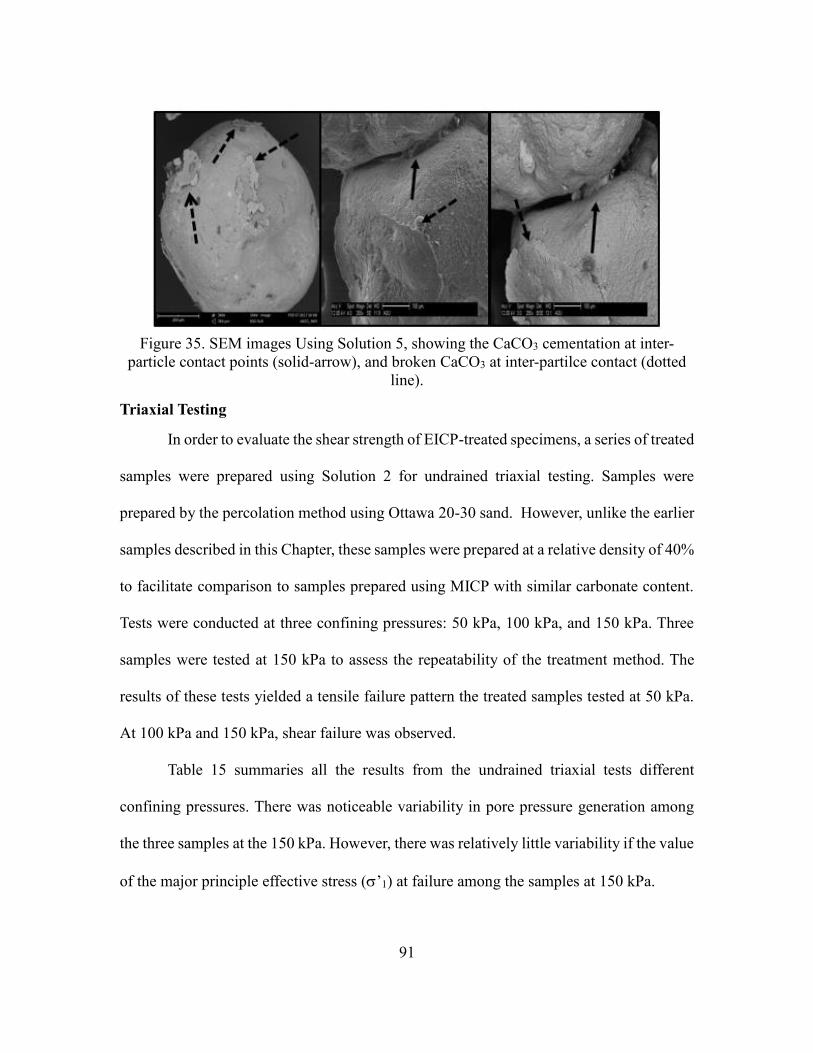
91
Figure 35. SEM images Using Solution 5, showing the CaCO3 cementation at inter-
particle contact points (solid-arrow), and broken CaCO3 at inter-partilce contact (dotted
line).
Triaxial Testing
In order to evaluate the shear strength of EICP-treated specimens, a series of treated
samples were prepared using Solution 2 for undrained triaxial testing. Samples were
prepared by the percolation method using Ottawa 20-30 sand. However, unlike the earlier
samples described in this Chapter, these samples were prepared at a relative density of 40%
to facilitate comparison to samples prepared using MICP with similar carbonate content.
Tests were conducted at three confining pressures: 50 kPa, 100 kPa, and 150 kPa. Three
samples were tested at 150 kPa to assess the repeatability of the treatment method. The
results of these tests yielded a tensile failure pattern the treated samples tested at 50 kPa.
At 100 kPa and 150 kPa, shear failure was observed.
Table 15 summaries all the results from the undrained triaxial tests different
confining pressures. There was noticeable variability in pore pressure generation among
the three samples at the 150 kPa. However, there was relatively little variability if the value
of the major principle effective stress (’1) at failure among the samples at 150 kPa.
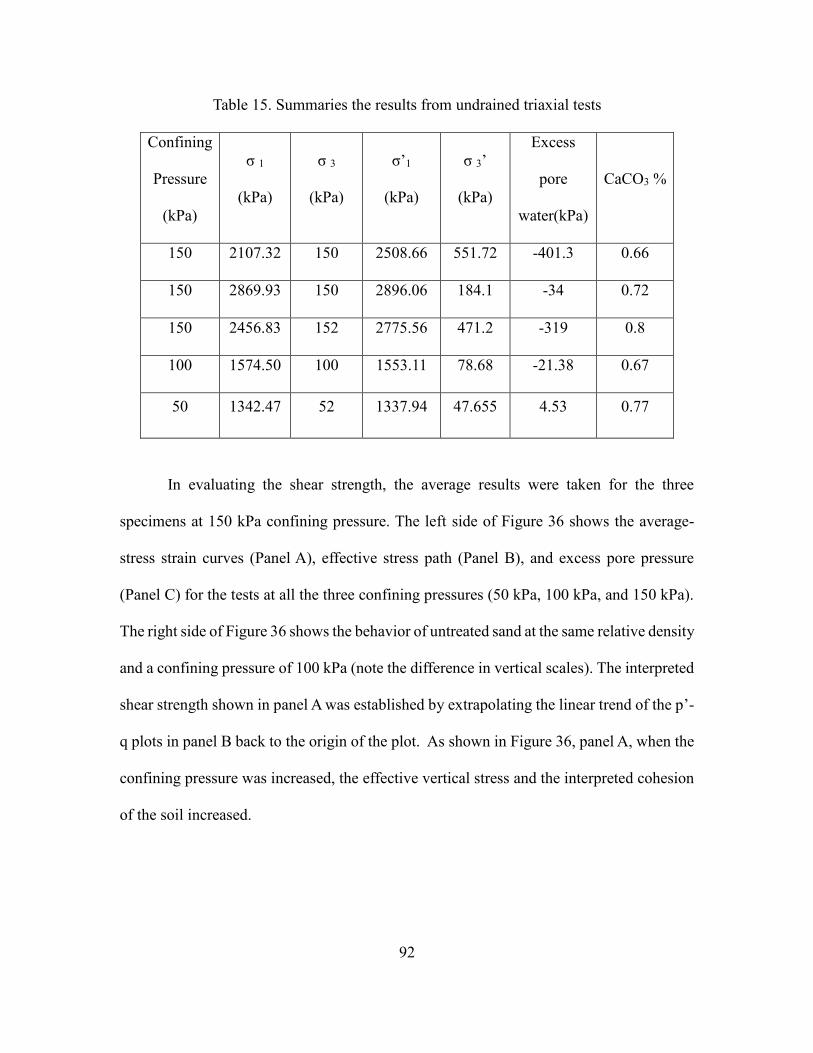
92
Table 15. Summaries the results from undrained triaxial tests
Confining
Pressure
(kPa)
σ 1
(kPa)
σ 3
(kPa)
σ’1
(kPa)
σ 3’
(kPa)
Excess
pore
water(kPa)
CaCO3 %
150 2107.32 150 2508.66 551.72 -401.3 0.66
150 2869.93 150 2896.06 184.1 -34 0.72
150 2456.83 152 2775.56 471.2 -319 0.8
100 1574.50 100 1553.11 78.68 -21.38 0.67
50 1342.47 52 1337.94 47.655 4.53 0.77
In evaluating the shear strength, the average results were taken for the three
specimens at 150 kPa confining pressure. The left side of Figure 36 shows the average-
stress strain curves (Panel A), effective stress path (Panel B), and excess pore pressure
(Panel C) for the tests at all the three confining pressures (50 kPa, 100 kPa, and 150 kPa).
The right side of Figure 36 shows the behavior of untreated sand at the same relative density
and a confining pressure of 100 kPa (note the difference in vertical scales). The interpreted
shear strength shown in panel A was established by extrapolating the linear trend of the p’-
q plots in panel B back to the origin of the plot. As shown in Figure 36, panel A, when the
confining pressure was increased, the effective vertical stress and the interpreted cohesion
of the soil increased.
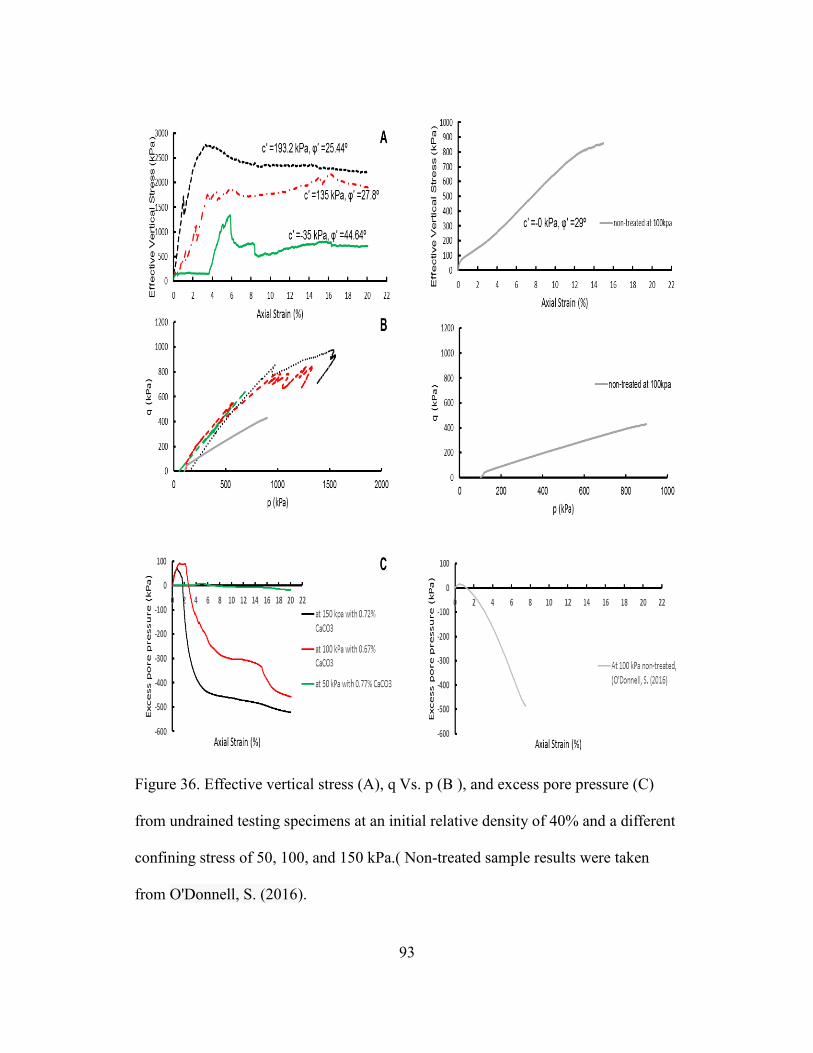
93
Figure 36. Effective vertical stress (A), q Vs. p (B ), and excess pore pressure (C)
from undrained testing specimens at an initial relative density of 40% and a different
confining stress of 50, 100, and 150 kPa.( Non-treated sample results were taken
from O'Donnell, S. (2016).
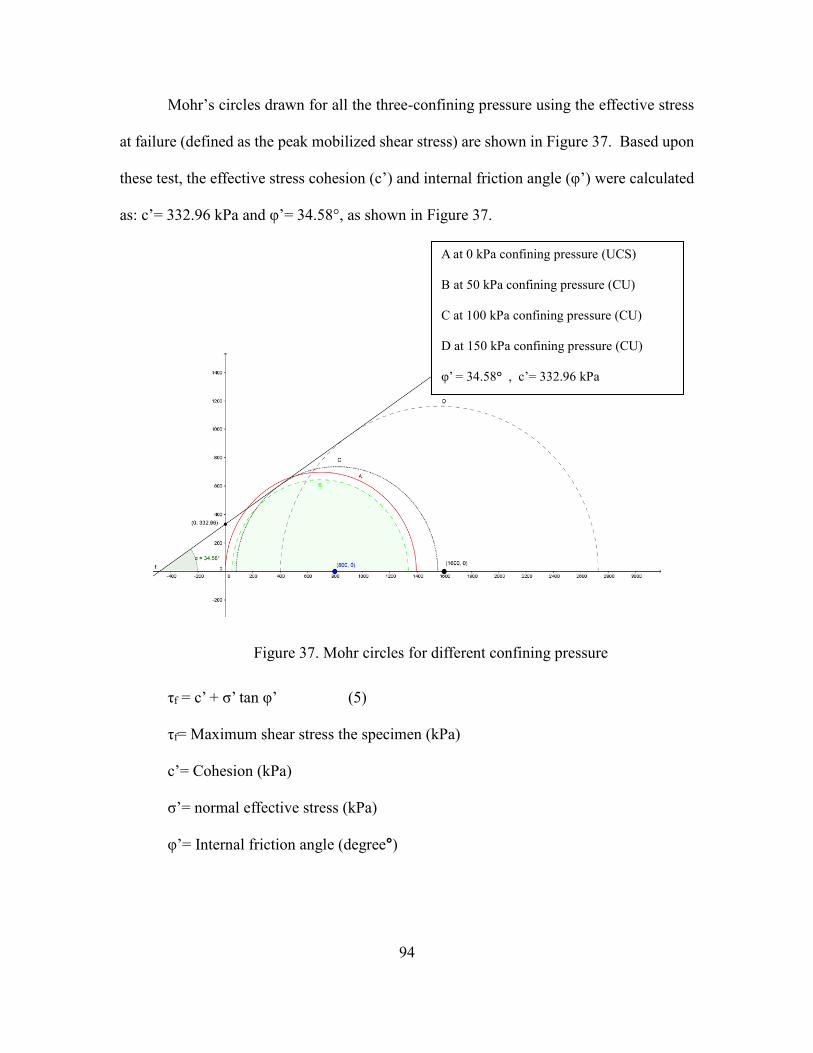
94
Mohr’s circles drawn for all the three-confining pressure using the effective stress
at failure (defined as the peak mobilized shear stress) are shown in Figure 37. Based upon
these test, the effective stress cohesion (c’) and internal friction angle (φ’) were calculated
as: c’= 332.96 kPa and φ’= 34.58°, as shown in Figure 37.
Figure 37. Mohr circles for different confining pressure
τf = c’ + σ’ tan φ’ (5)
τf= Maximum shear stress the specimen (kPa)
c’= Cohesion (kPa)
σ’= normal effective stress (kPa)
φ’= Internal friction angle (degree°)
A at 0 kPa confining pressure (UCS)
B at 50 kPa confining pressure (CU)
C at 100 kPa confining pressure (CU)
D at 150 kPa confining pressure (CU)
φ’ = 34.58° , c’= 332.96 kPa
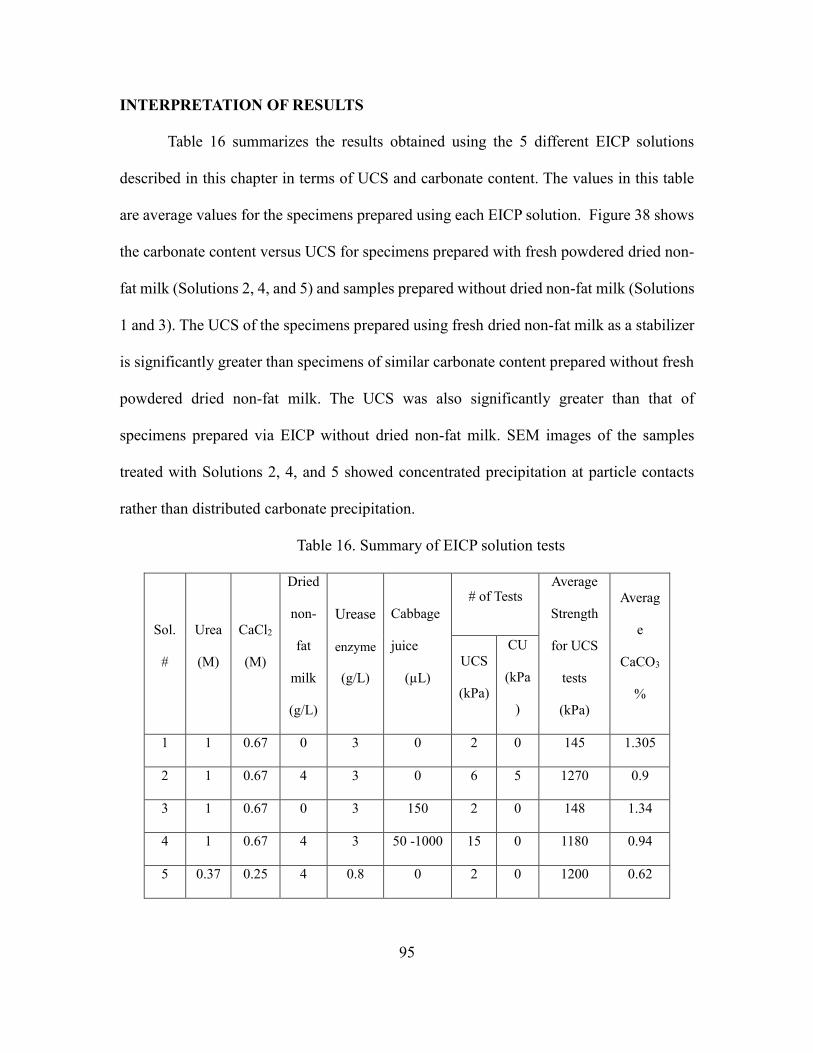
95
INTERPRETATION OF RESULTS
Table 16 summarizes the results obtained using the 5 different EICP solutions
described in this chapter in terms of UCS and carbonate content. The values in this table
are average values for the specimens prepared using each EICP solution. Figure 38 shows
the carbonate content versus UCS for specimens prepared with fresh powdered dried non-
fat milk (Solutions 2, 4, and 5) and samples prepared without dried non-fat milk (Solutions
1 and 3). The UCS of the specimens prepared using fresh dried non-fat milk as a stabilizer
is significantly greater than specimens of similar carbonate content prepared without fresh
powdered dried non-fat milk. The UCS was also significantly greater than that of
specimens prepared via EICP without dried non-fat milk. SEM images of the samples
treated with Solutions 2, 4, and 5 showed concentrated precipitation at particle contacts
rather than distributed carbonate precipitation.
Table 16. Summary of EICP solution tests
Sol.
#
Urea
(M)
CaCl2
(M)
Dried
non-
fat
milk
(g/L)
Urease
enzyme
(g/L)
Cabbage
juice
(µL)
# of Tests Average
Strength
for UCS
tests
(kPa)
Averag
e
CaCO3
%
UCS
(kPa)
CU
(kPa
)
1 1 0.67 0 3 0 2 0 145 1.305
2 1 0.67 4 3 0 6 5 1270 0.9
3 1 0.67 0 3 150 2 0 148 1.34
4 1 0.67 4 3 50 -1000 15 0 1180 0.94
5 0.37 0.25 4 0.8 0 2 0 1200 0.62

96
Figure 38. UCS versus CaCO3 content for Solutions 1-5
Figure 39 is a plot of carbonate content versus USC for samples tested in this testing
program to those reported in the literature prepared by either EICP or MICP. The UCS
reported here for samples prepared using Solutions 2, 4, and 5 is also significantly greater
than specimens prepared by either EICP or MICP with the same carbonate content as
reported in the literature. The strengths reported here are also unprecedented for a CaCO3
content less than 1% and for samples that were subject to only one cycle treatment. Thus,
adding fresh dried non-fat milkto the EICP solution leads not only to a significant
improvement in the strength of the soil but also to the morphology of the precipitates.
Figure 39 shows carbonate content vs UCS for both EICP as reported by Yasuhara et al.
(2012) and as reported herein along with MICP results from Gomez and DeJong (2017)
and van Paassen (2010). For the EICP technique, Yasuhara et al. (2012) reported four cycles
of treatment were required to achieve a UCS of 1.62 MPa at 5.1% of CaCO3. In this study,
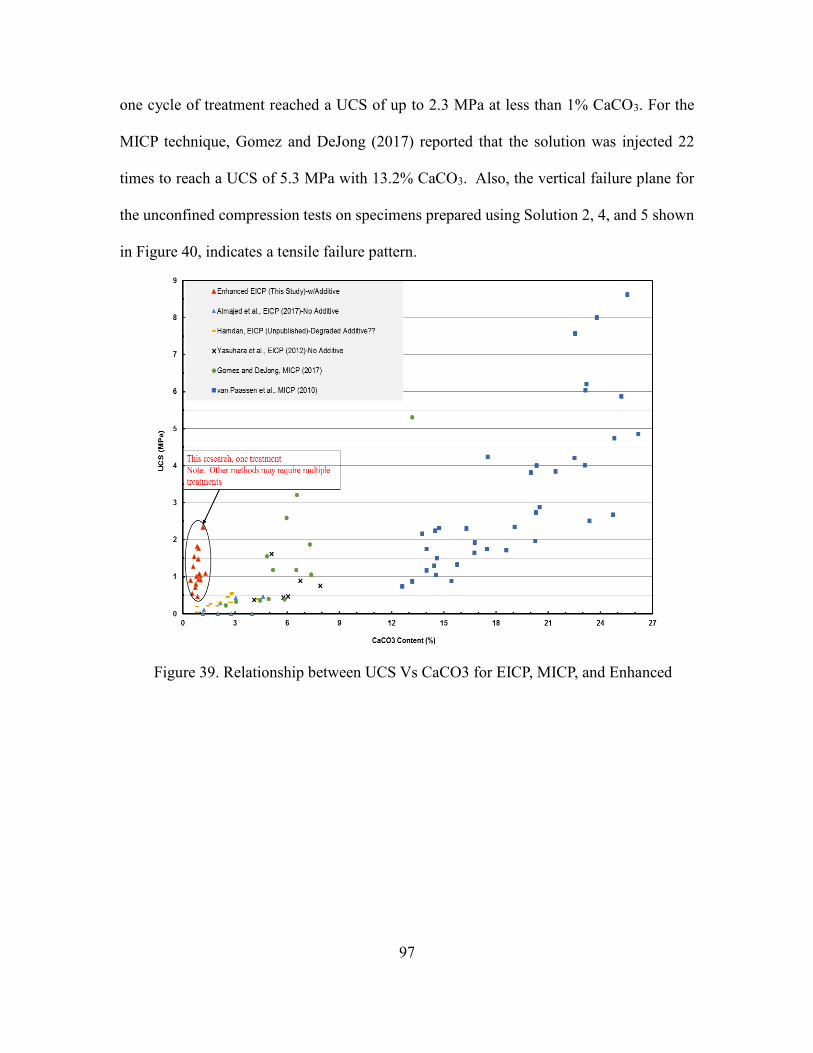
97
one cycle of treatment reached a UCS of up to 2.3 MPa at less than 1% CaCO3. For the
MICP technique, Gomez and DeJong (2017) reported that the solution was injected 22
times to reach a UCS of 5.3 MPa with 13.2% CaCO3. Also, the vertical failure plane for
the unconfined compression tests on specimens prepared using Solution 2, 4, and 5 shown
in Figure 40, indicates a tensile failure pattern.
Figure 39. Relationship between UCS Vs CaCO3 for EICP, MICP, and Enhanced
EICP
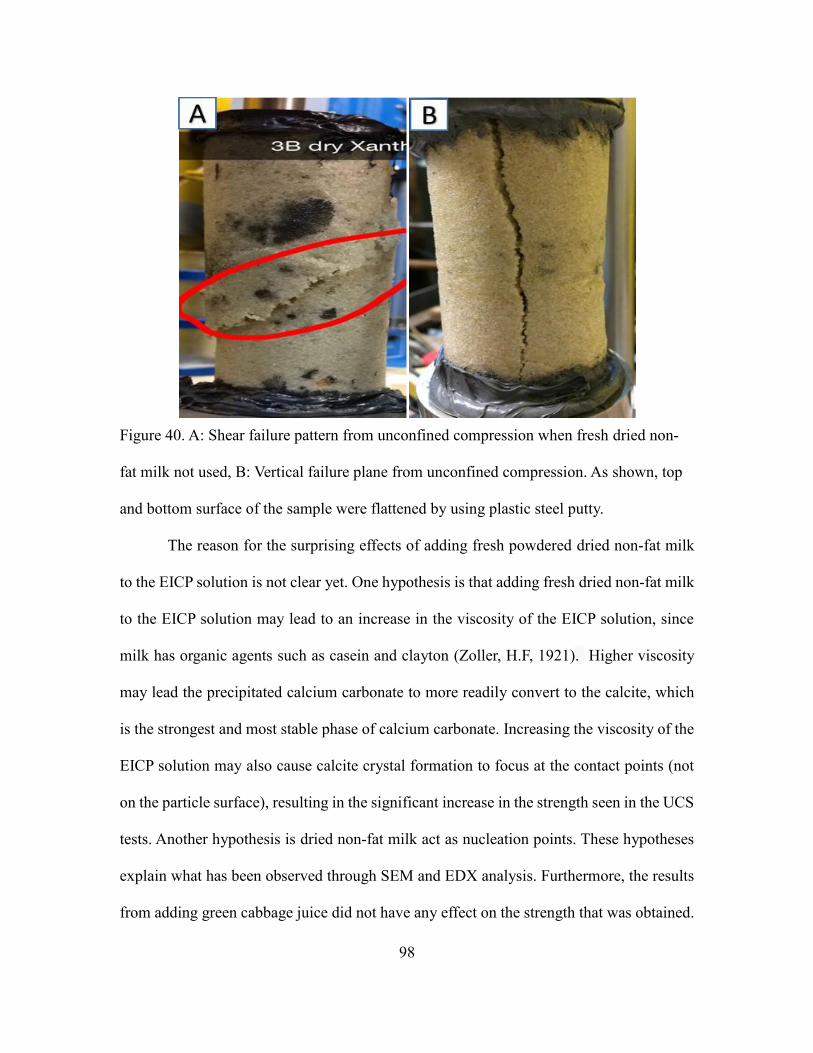
98
Figure 40. A: Shear failure pattern from unconfined compression when fresh dried non-
fat milk not used, B: Vertical failure plane from unconfined compression. As shown, top
and bottom surface of the sample were flattened by using plastic steel putty.
The reason for the surprising effects of adding fresh powdered dried non-fat milk
to the EICP solution is not clear yet. One hypothesis is that adding fresh dried non-fat milk
to the EICP solution may lead to an increase in the viscosity of the EICP solution, since
milk has organic agents such as casein and clayton (Zoller, H.F, 1921). Higher viscosity
may lead the precipitated calcium carbonate to more readily convert to the calcite, which
is the strongest and most stable phase of calcium carbonate. Increasing the viscosity of the
EICP solution may also cause calcite crystal formation to focus at the contact points (not
on the particle surface), resulting in the significant increase in the strength seen in the UCS
tests. Another hypothesis is dried non-fat milk act as nucleation points. These hypotheses
explain what has been observed through SEM and EDX analysis. Furthermore, the results
from adding green cabbage juice did not have any effect on the strength that was obtained.

99
These results clarify that fresh dried non-fat milk is the governing element that changes the
mechanism of precipitation.
Overall, the key advantage of the enhanced EICP method using powdered dried
non-fat milk presented here include is a higher strength with only a single cycle of
treatment and much less precipitated carbonate then reported previously. The benefits of
this formulation include lower concentrations of substrate and enzyme and production of a
lower amount of the undesirable ammonium by product. This makes the process cheaper,
more technically feasible, and more environmentally friendly than other EICP formulations
and MICP methods. Moreover, the results obtained using the enhanced EICP treatment
described herein demonstrates that the quality of precipitation is more important than the
quantity of precipitation in strengthening soil via cementation.
CONCLUSION
The results in this chapter represent an important advance for the biogeotechnical
improvement technique of induced carbonate precipitation. The addition of dried non-fat
milk to the EICP solution resulted in significant benefits with respect to the strength that
was achieved and the quantities of substrate and enzyme required to achieve that strength.
The results observed were unprecedented for all biogeotechnical carbonate precipitation
techniques. The results from the UCS and the undrained triaxial tests for treated samples
showed significant improvement in the soil properties with a tiny amount of calcium
carbonate (2 MPa UCS with less than 1% CaCO3). Through SEM and EDX, it was
demonstrated that adding dried non-fat milk caused the calcite to focus at the contact point.
This is believed to be a major contributor to the increased strength. The advantages of the
enhanced EICP are that it reduces the number of cycles of treatment and the concentration

100
of substrate and enzyme, resulting in reduced cost. Furthermore, this study proved that the
quality of the precipitation is more important than the quantity.
101
CHAPTER 6
COLUMNAR IMPROVEMENT OF SOIL AND INVESTIGATE DIFFERENT
PREPARTION METHODS FOR CREATING COLUMN
INTRODUCTION
This chapter demonstrates at the bench scale the use of Enzyme Induce Carbonate
Precipitation (EICP) to create sub-horizontal columns for soil nails and vertical columns
of cemented soil similar to vertical columns created using deep soil mixing. The EICP
solution was injected through flexible perforated tubes pushed into the soil by a metal pilot
tube (which was subsequently removed) to create the sub-horizontal columns. For the
vertical columns, the EICP solution was injected through a small diameter vertical tube
inserted down the axis of PVC for 101.6 mm x 254 mm (4” x 10”) and acrylic columns for
50.8 mm x 101.6 mm (2” x 4”) prior to placement of the soil around it.
The sub-horizontal column experiment was performed using F-60 Ottawa silica
sand. The vertical columns experiments were performed by using both Ottawa 20-30 and
F-60 silica sand. The EICP solution for the sub-horizontal consisted of 0.87 M urea, 0.5 M
CaCl2-2H2O, 0.85 g/L low-grade urease enzyme (Fisher Scientific, Low Grade Jack Bean
Urease), and 4.0 g/L of fresh dried non-fat milk as stabilizer. The vertical column
experiments were performed using an EICP solution composed of 1 M urea, 0.67 M CaCl2,
4.0 g/l of old (expired) dried non-fat milk as stabilizer, and 3 g/l of low activity urease
enzyme. Two different methods were used to introduce the EICP solution in the vertical
columns to investigate the effect of these methods on the strength of the EICP-treated soil.
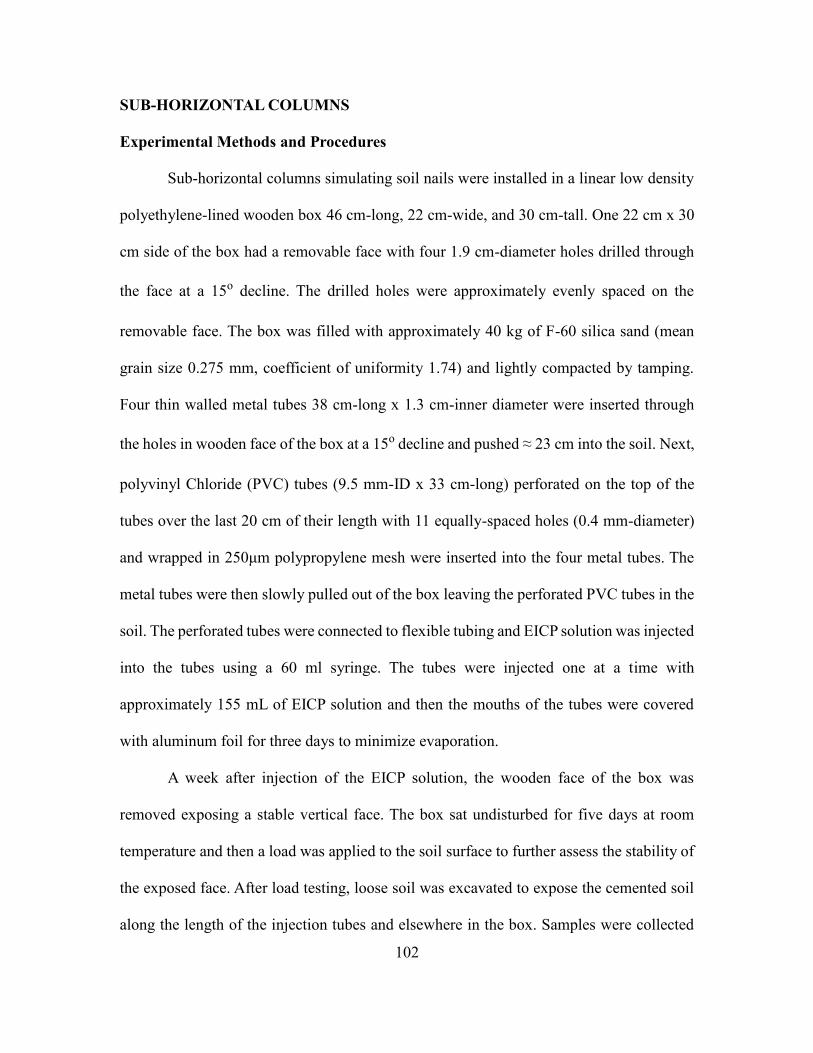
102
SUB-HORIZONTAL COLUMNS
Experimental Methods and Procedures
Sub-horizontal columns simulating soil nails were installed in a linear low density
polyethylene-lined wooden box 46 cm-long, 22 cm-wide, and 30 cm-tall. One 22 cm x 30
cm side of the box had a removable face with four 1.9 cm-diameter holes drilled through
the face at a 15o decline. The drilled holes were approximately evenly spaced on the
removable face. The box was filled with approximately 40 kg of F-60 silica sand (mean
grain size 0.275 mm, coefficient of uniformity 1.74) and lightly compacted by tamping.
Four thin walled metal tubes 38 cm-long x 1.3 cm-inner diameter were inserted through
the holes in wooden face of the box at a 15o decline and pushed ≈ 23 cm into the soil. Next,
polyvinyl Chloride (PVC) tubes (9.5 mm-ID x 33 cm-long) perforated on the top of the
tubes over the last 20 cm of their length with 11 equally-spaced holes (0.4 mm-diameter)
and wrapped in 250μm polypropylene mesh were inserted into the four metal tubes. The
metal tubes were then slowly pulled out of the box leaving the perforated PVC tubes in the
soil. The perforated tubes were connected to flexible tubing and EICP solution was injected
into the tubes using a 60 ml syringe. The tubes were injected one at a time with
approximately 155 mL of EICP solution and then the mouths of the tubes were covered
with aluminum foil for three days to minimize evaporation.
A week after injection of the EICP solution, the wooden face of the box was
removed exposing a stable vertical face. The box sat undisturbed for five days at room
temperature and then a load was applied to the soil surface to further assess the stability of
the exposed face. After load testing, loose soil was excavated to expose the cemented soil
along the length of the injection tubes and elsewhere in the box. Samples were collected
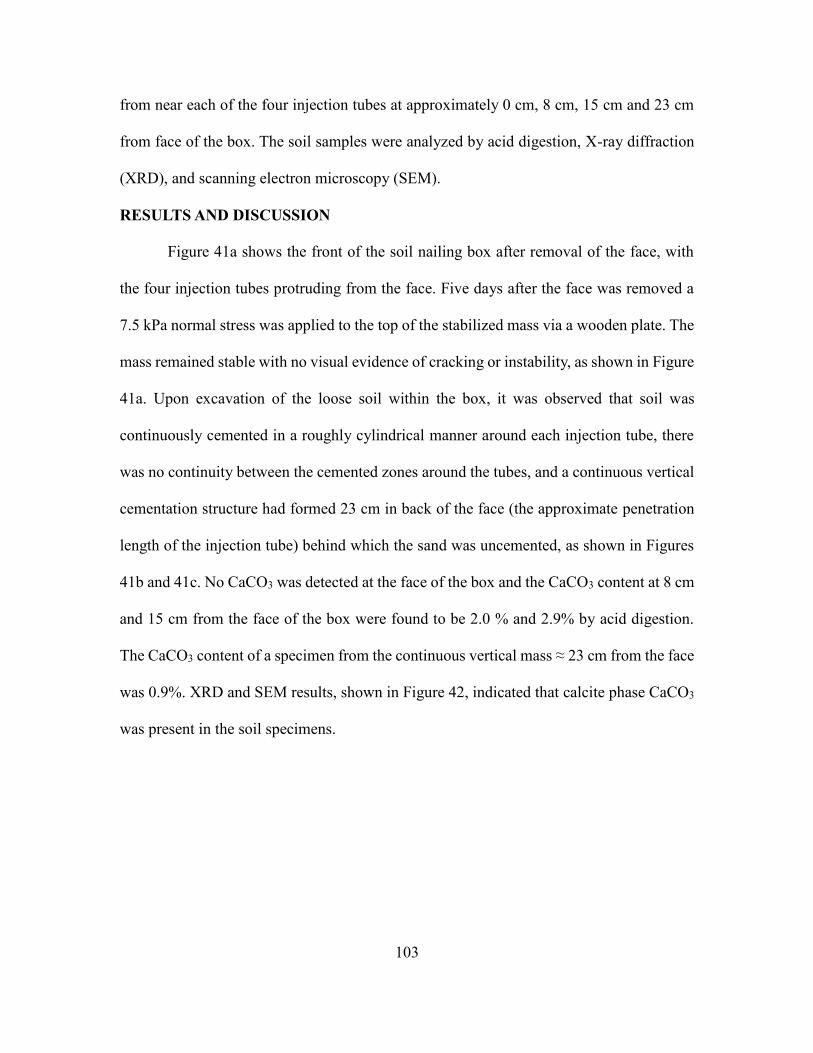
103
from near each of the four injection tubes at approximately 0 cm, 8 cm, 15 cm and 23 cm
from face of the box. The soil samples were analyzed by acid digestion, X-ray diffraction
(XRD), and scanning electron microscopy (SEM).
RESULTS AND DISCUSSION
Figure 41a shows the front of the soil nailing box after removal of the face, with
the four injection tubes protruding from the face. Five days after the face was removed a
7.5 kPa normal stress was applied to the top of the stabilized mass via a wooden plate. The
mass remained stable with no visual evidence of cracking or instability, as shown in Figure
41a. Upon excavation of the loose soil within the box, it was observed that soil was
continuously cemented in a roughly cylindrical manner around each injection tube, there
was no continuity between the cemented zones around the tubes, and a continuous vertical
cementation structure had formed 23 cm in back of the face (the approximate penetration
length of the injection tube) behind which the sand was uncemented, as shown in Figures
41b and 41c. No CaCO3 was detected at the face of the box and the CaCO3 content at 8 cm
and 15 cm from the face of the box were found to be 2.0 % and 2.9% by acid digestion.
The CaCO3 content of a specimen from the continuous vertical mass ≈ 23 cm from the face
was 0.9%. XRD and SEM results, shown in Figure 42, indicated that calcite phase CaCO3
was present in the soil specimens.
104
Figure 41. Soil nail experiment: (A) Application of normal load; (B) Top view of
cemented tubes and vertical cemented zone near 23 cm; (C) Cylindrically cemented
soil mass around (clear) injection tube.
Figure 42: Soil nail experiment results: (A) SEM image showing the calcite phase
(small arrow) and silica sand (large arrows) (B) XRD results showing evidence of
calcite.
(S: silica sand and C: the calcite).
105
VERTICAL COLUMNS
Experimental Methods and Procedures
Two types of soil were used in the vertical column experiments to investigate the
effect of soil gradation on the cementation using EICP. Moreover, two preparation methods,
percolation and injection, were used to create the vertical columns. Samples were also
prepared using mix and compact and the same EICP solution used to create the vertical
columns as a control on the properties of the cemented sand in the vertical columns.
Soil A: Ottawa 20-30 Silica Sand
Vertical cylindrical soil columns were created using Ottawa 20-30 silica sand and
then stabilized by using the EICP solution. Table 17 presents the physical characteristics of
the Ottawa 20-30 sand. An initial batch of three 101.6 mm x 254 mm (4” x 10”) columns
was made in PVC cylinders. Afterward, three 50.8 mm x 101.6 mm (2” x 4”) columns were
made in acrylic cylinders. Two different preparation methods, percolation and injection,
were employed for both sizes of columns to mimic how columns might be created in situ.
A third set of samples using columns of both sizes was prepared by the mix and compact
method as a control on the EICP solution and for comparison to columns created in earlier
work (i.e., in Chapters 3 and 5).
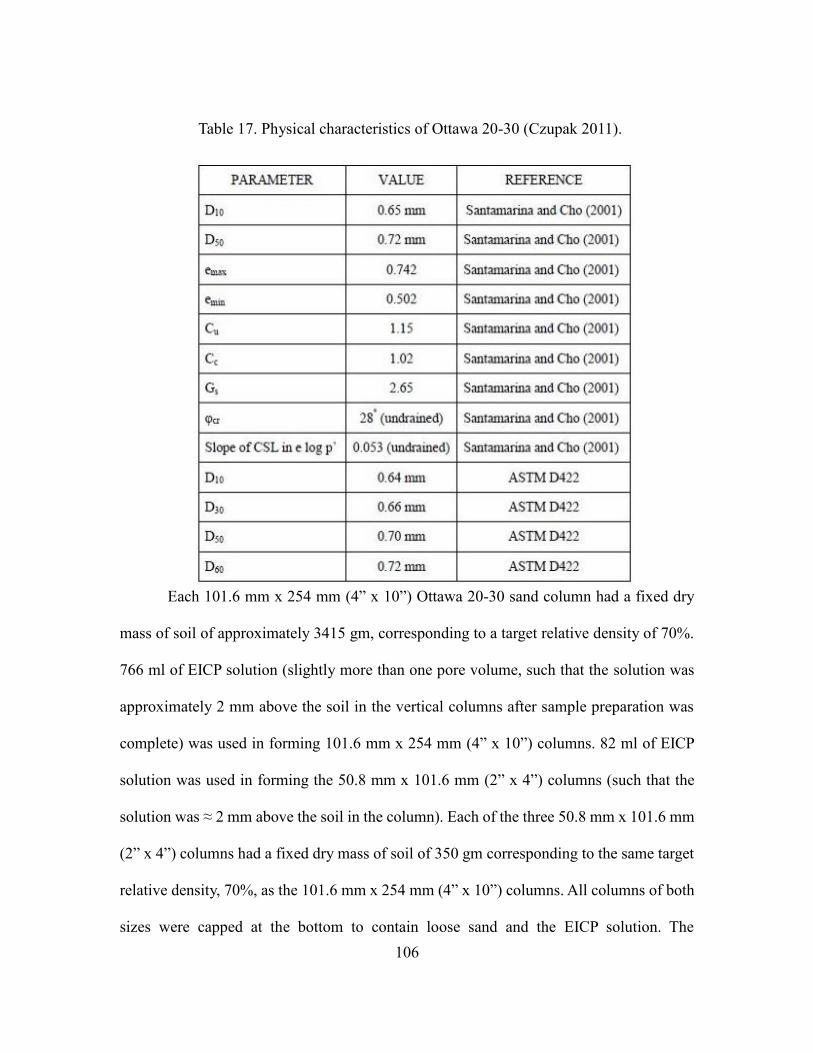
106
Each 101.6 mm x 254 mm (4” x 10”) Ottawa 20-30 sand column had a fixed dry
mass of soil of approximately 3415 gm, corresponding to a target relative density of 70%.
766 ml of EICP solution (slightly more than one pore volume, such that the solution was
approximately 2 mm above the soil in the vertical columns after sample preparation was
complete) was used in forming 101.6 mm x 254 mm (4” x 10”) columns. 82 ml of EICP
solution was used in forming the 50.8 mm x 101.6 mm (2” x 4”) columns (such that the
solution was ≈ 2 mm above the soil in the column). Each of the three 50.8 mm x 101.6 mm
(2” x 4”) columns had a fixed dry mass of soil of 350 gm corresponding to the same target
relative density, 70%, as the 101.6 mm x 254 mm (4” x 10”) columns. All columns of both
sizes were capped at the bottom to contain loose sand and the EICP solution. The
Table 17. Physical characteristics of Ottawa 20-30 (Czupak 2011).
107
concentration of the EICP solution reagents used in these experiments were those
determined to be optimal in Chapter 3 except that old (expired) of dried non-fat milk was
used.
Soil B: F-60 Silica Sand
Six samples were created using EICP solution and F-60 silica sand (emax=0.823,
emin=0.529, D10=0.15, D30=0.19, D50=0.23, D60=0.26, Cu= 1.73, Cc= 0.926, Gs=2.65,
SiO2>99%). Like the Ottawa 20-30 sand, an initial batch of three 101.6 mm x 254 mm (4”
x 10”) columns was made in PVC cylinders and three 50.8 mm x 101.6 mm (2” x 4”)
samples were made in acrylic cylinders. Each of the three 101.6 mm x 254 mm (4” by 10”)
columns had a fixed dry mass of soil of 3415 gm, corresponding to a target relative density,
90%. A relative density of 90% was chosen for the F-60 silica sand to obtain the same void
ratio (0.56) as the Ottawa 20-30 silica sand at relative density of 70%, allowing for the
same amount of EICP solution to be used. Two different EICP solution treatment methods,
injection and percolation, were employed for both sizes of the columns to mimic how
vertical columns might be created in situ. Samples were also prepared for both sizes of
columns using the mix and compact method for comparison to earlier work in Chapters 3
and 5.
766 ml of EICP solution (slightly more than one pore volume such that the solution
was ≈ 2 mm above the soil in the column) was put into the 101.6 mm x 254 mm (4” x 10”)
columns. 82 ml of EICP solution (slightly more than one pore volume, such that the
solution was ≈ 2 mm above the soil in the column) was put into the 50.8 mm x 101.6 mm
(2” x 4”) columns. Each of the three 50.8 mm x 101.6 mm (2” x 4”) columns had a fixed
dry mass of soil of 350 gm at the target relative density, 90%, the same relative density as
108
the 101.6 mm x 254 mm (4” by 10”) columns. All columns of both sizes were capped at
the bottom to contain loose sand and the EICP solution. The concentration of the EICP
solution reagents used in these experiments were those determined to be optimal in Chapter
3 except that old (expired) of dried non-fat milk was used.
One 101.6 mm x 254 mm (4” x 10”) column and one 50.8 mm x 101.6 mm (2” x
4”) column of each soil type (Ottawa 20-30 sand and F-60 sand) were prepared by the
percolation method. For the 101.6 mm x 254 mm (4” x 10”) columns, dry sand was poured
into the columns to a height of approximately 10” (254 mm) using funnel and a height of
fall selected to yield the target relative density of 70% for the Ottawa 20-30 column and
90% for the F-60 column. Then, the EICP solution was gradually dripped into the top of
the column using a 60-ml syringe to gently disperse the solution into the sand, as opposed
to poring it in quickly, which could erode depressions in the soil. 766 ml of EICP solution
(slightly more than one pore volume, such that the solution was ≈ 2 mm above the soil)
was injected into the Ottawa 20-30 and F-60 sand column in this manner. These processes
were repeated with for the 50.8 mm x 101.6 mm (2” x 4”) columns except that 82 ml of
EICP solution was put into both the Ottawa 20-30 sand and the F-60 sand.
One 101.6 mm x 254 mm (4” x 10”) column and one 50.8 mm x 101.6 mm (2” x
4”) column for each type of soil (Ottawa 20-30 and F-60 sand) were prepared with the
injection method. To inject the EICP solution into the 101.6 mm x 254 mm (4” x 10”)
column, a 330 mm (13”)-long Tygon laboratory tube (R-3603 PVC; 3/8” ID) was
perforated with two lines of holes 11/64” in diameter, diametrically opposed and spaced at
12.5 mm (0.5”) center-to-center. The tube was wrapped with 250 µm polypropylene mesh
(29% open area) to mitigate the potential for clogging of the holes with sand. Silicon glue
109
was used to seal the bottom of the tube. In each column, 175 gm of the silica sand was
gently poured into the column to a height approximately 1” (25.4 mm) and then densified
gently by tapping the PVC cylinder with a small hammer. The tube was then placed along
the central axis of the PVC column with the bottom of the tube on the densified sand. Then,
3240 gm of sand was added to the column to a height of approximately 10” (254 mm). The
EICP solution was injected into the open top end of the Tygon tube using a 60 ml syringe.
766 ml of EICP solution was injected into the 101.6 mm x 254 mm (4” x 10”) columns.
To inject the EICP solution into the 50.8 mm x 101.6 mm (2” x 4”) column, a 153
mm (6”) long Tygon laboratory tube (R-3603 PVC; 3/8” ID) was perforated with two lines
of holes 11/64” in diameter, diametrically opposed and spaced at 12.5 mm (0.5”) center-
to-center. Just as described above for the larger columns, the tube was wrapped with 250
µm polypropylene mesh (29% open area) to mitigate the potential for clogging of the holes
with sand. Silicon glue was used to seal the bottom of the tube. In each column, 88 gm of
the silica sand was gently poured into the column to a height of approximately 1” (25.4
mm) and then densified gently by tapping the cylinder with a small hammer. The tube was
then placed along the central axis of the acrylic column with the bottom of the tube on the
densified sand. Then, 262 gm of sand was added to the column to a height of approximately
4” (101.6 mm). The EICP solution was injected into the open top end of the tube using a
60 ml syringe. 82 ml of EICP solution (approximately one pore volume, the solution was
above the soil by ≈ 2 mm) was injected into the 50.8 mm x 101.6 mm (2” x 4”) columns
of both the Ottawa 20-30 and F-60 sand columns.
One 101.6 mm x 254 mm (4” x 10”) column and one 50.8 mm x 101.6 mm (2” x
4”) column of both types of soil (Ottawa 20-30 and F-60 sand) were prepared with the mix
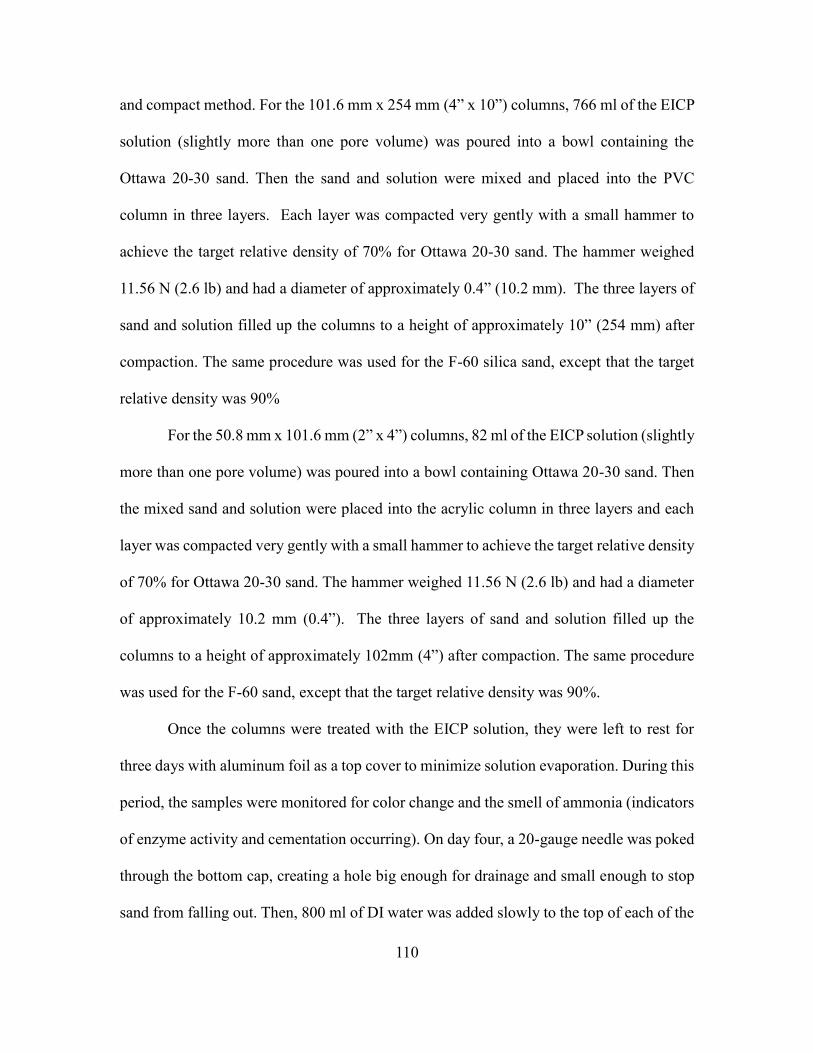
110
and compact method. For the 101.6 mm x 254 mm (4” x 10”) columns, 766 ml of the EICP
solution (slightly more than one pore volume) was poured into a bowl containing the
Ottawa 20-30 sand. Then the sand and solution were mixed and placed into the PVC
column in three layers. Each layer was compacted very gently with a small hammer to
achieve the target relative density of 70% for Ottawa 20-30 sand. The hammer weighed
11.56 N (2.6 lb) and had a diameter of approximately 0.4” (10.2 mm). The three layers of
sand and solution filled up the columns to a height of approximately 10” (254 mm) after
compaction. The same procedure was used for the F-60 silica sand, except that the target
relative density was 90%
For the 50.8 mm x 101.6 mm (2” x 4”) columns, 82 ml of the EICP solution (slightly
more than one pore volume) was poured into a bowl containing Ottawa 20-30 sand. Then
the mixed sand and solution were placed into the acrylic column in three layers and each
layer was compacted very gently with a small hammer to achieve the target relative density
of 70% for Ottawa 20-30 sand. The hammer weighed 11.56 N (2.6 lb) and had a diameter
of approximately 10.2 mm (0.4”). The three layers of sand and solution filled up the
columns to a height of approximately 102mm (4”) after compaction. The same procedure
was used for the F-60 sand, except that the target relative density was 90%.
Once the columns were treated with the EICP solution, they were left to rest for
three days with aluminum foil as a top cover to minimize solution evaporation. During this
period, the samples were monitored for color change and the smell of ammonia (indicators
of enzyme activity and cementation occurring). On day four, a 20-gauge needle was poked
through the bottom cap, creating a hole big enough for drainage and small enough to stop
sand from falling out. Then, 800 ml of DI water was added slowly to the top of each of the

111
101.6 mm x 254 mm (4” x 10”) columns to flush residual EICP solution and soluble salts
from the column. The same procedure was repeated for the 50.8 mm x 101.6 mm (2” x 4”)
columns except that only 100 ml of DI water was used. The columns were then left to rest
for three more days at room temperature with the 20-gauge needle in place and a container
underneath to collect the drained liquid. On day seven, the column was placed in an oven
at 40 degrees Celsius for five days. After oven drying, the columns were prepared for the
test procedures described below
Unconfined compressive strength (UCS) tests were performed only the 50.8 mm x
101.6 mm (2” x 4”) columns, which were fitted with polypropylene lines to facilitate
extraction. UCS tests could not be performed on the 101.6 mm x 254 mm (4” x10”)
columns because polypropylene liners were not placed in the acrylic cylinders and the silica
sand adhered to the inner surface of the PVC cylinder. This adhesion made the cemented
sand extremely difficult to extract from the PVC column. A hammer had to be used to
extract the cemented sand columns, breaking the columns into many pieces of varying size,
as illustrated in Figure 43, which were unsuitable for mechanical testing.
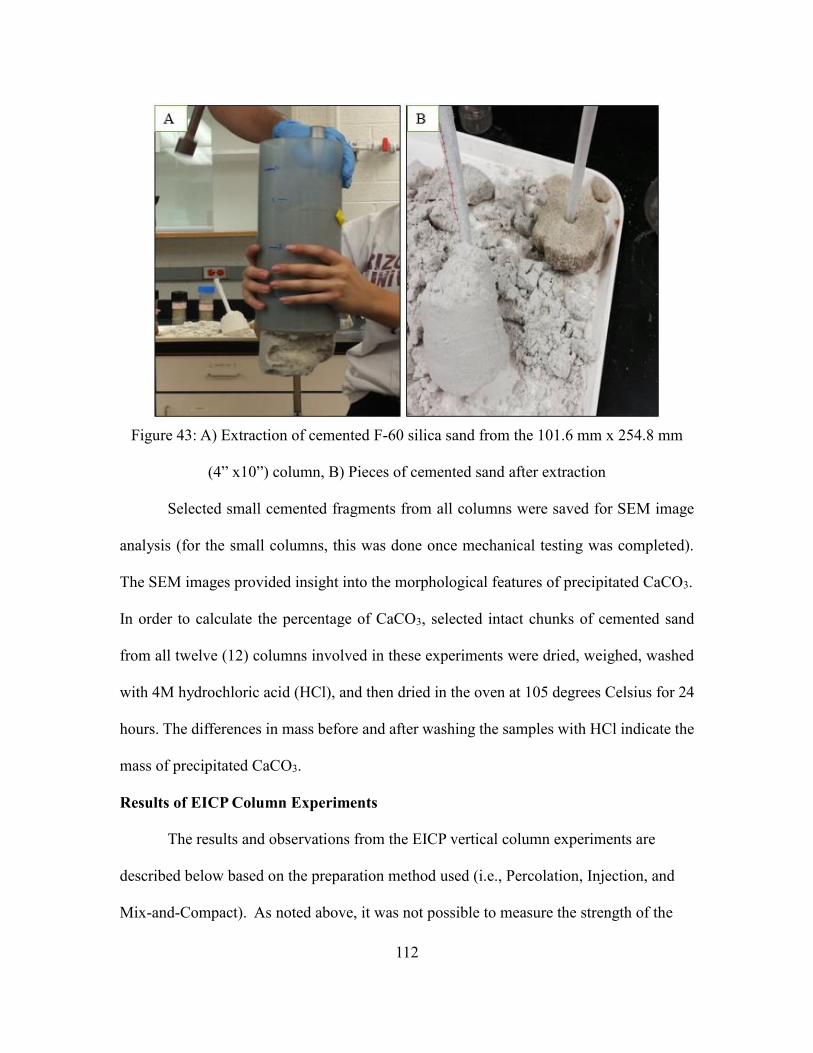
112
Figure 43: A) Extraction of cemented F-60 silica sand from the 101.6 mm x 254.8 mm
(4” x10”) column, B) Pieces of cemented sand after extraction
Selected small cemented fragments from all columns were saved for SEM image
analysis (for the small columns, this was done once mechanical testing was completed).
The SEM images provided insight into the morphological features of precipitated CaCO3.
In order to calculate the percentage of CaCO3, selected intact chunks of cemented sand
from all twelve (12) columns involved in these experiments were dried, weighed, washed
with 4M hydrochloric acid (HCl), and then dried in the oven at 105 degrees Celsius for 24
hours. The differences in mass before and after washing the samples with HCl indicate the
mass of precipitated CaCO3.
Results of EICP Column Experiments
The results and observations from the EICP vertical column experiments are
described below based on the preparation method used (i.e., Percolation, Injection, and
Mix-and-Compact). As noted above, it was not possible to measure the strength of the
113
101.6 mm x 254 mm (4” x 10”) columns due to breakage of the cemented columns
during extraction. However, the UCS was measured on the 50.8 mm x 101.6 mm (2” x
4”) columns.
Weaker cementation was observed for the F-60 silica sand compared to Ottawa 20-
30 sand based upon visual observations from percolation method. The F-60 sample was
easily disintegrated into loose sand by hand. The measured UCS for the 50.8 mm x 101.6
mm (2” x 4”) columns supported the visual observation that the F-60 sample had less
strength than the Ottawa 20-30 sand samples. Percolation columns of 101.6 mm x 254.8
mm (4” x 10”) were extremely weakly cemented for the first ≈1” from the top of the
column. Also, the 50.8 mm x 101.6 mm (2” x 4”) columns easily disintegrated at the top.
Additionally, there was not much visual evidence of mineral precipitation (i.e., visual
evidence of a white precipitate) in these columns except at the very bottom of the Ottawa
20-30 columns. The weak strength at the top of the columns and the white color at the
bottom may be indicative of a non-uniform improvement process, with more cementation
at the bottom than at the top of the columns. Acid digestion test results, presented in Table
18, indicated higher carbonate content in the F-60 sand sample than in the Ottawa 20-30
sand sample, despite the lower strength. Table 18 presents the results of tests conducted on
samples prepared using the percolation method.
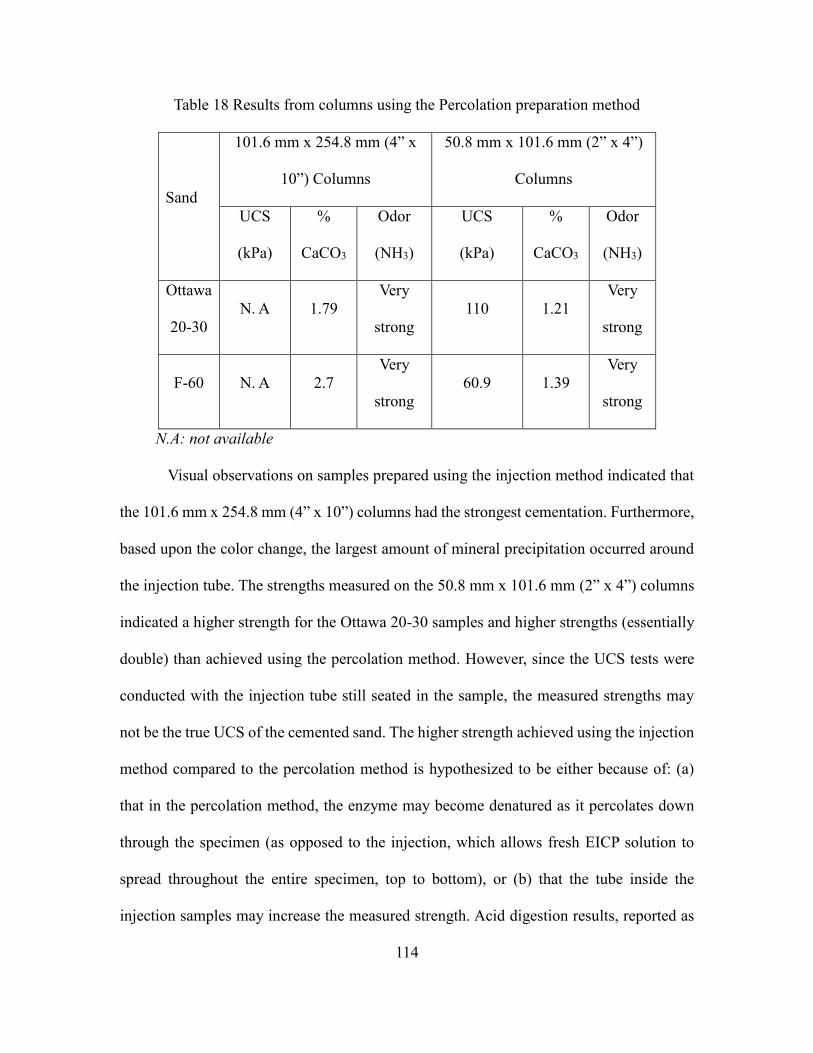
114
Table 18 Results from columns using the Percolation preparation method
Sand
101.6 mm x 254.8 mm (4” x
10”) Columns
50.8 mm x 101.6 mm (2” x 4”)
Columns
UCS
(kPa)
%
CaCO3
Odor
(NH3)
UCS
(kPa)
%
CaCO3
Odor
(NH3)
Ottawa
20-30
N. A 1.79
Very
strong
110 1.21
Very
strong
F-60 N. A 2.7
Very
strong
60.9 1.39
Very
strong
N.A: not available
Visual observations on samples prepared using the injection method indicated that
the 101.6 mm x 254.8 mm (4” x 10”) columns had the strongest cementation. Furthermore,
based upon the color change, the largest amount of mineral precipitation occurred around
the injection tube. The strengths measured on the 50.8 mm x 101.6 mm (2” x 4”) columns
indicated a higher strength for the Ottawa 20-30 samples and higher strengths (essentially
double) than achieved using the percolation method. However, since the UCS tests were
conducted with the injection tube still seated in the sample, the measured strengths may
not be the true UCS of the cemented sand. The higher strength achieved using the injection
method compared to the percolation method is hypothesized to be either because of: (a)
that in the percolation method, the enzyme may become denatured as it percolates down
through the specimen (as opposed to the injection, which allows fresh EICP solution to
spread throughout the entire specimen, top to bottom), or (b) that the tube inside the
injection samples may increase the measured strength. Acid digestion results, reported as
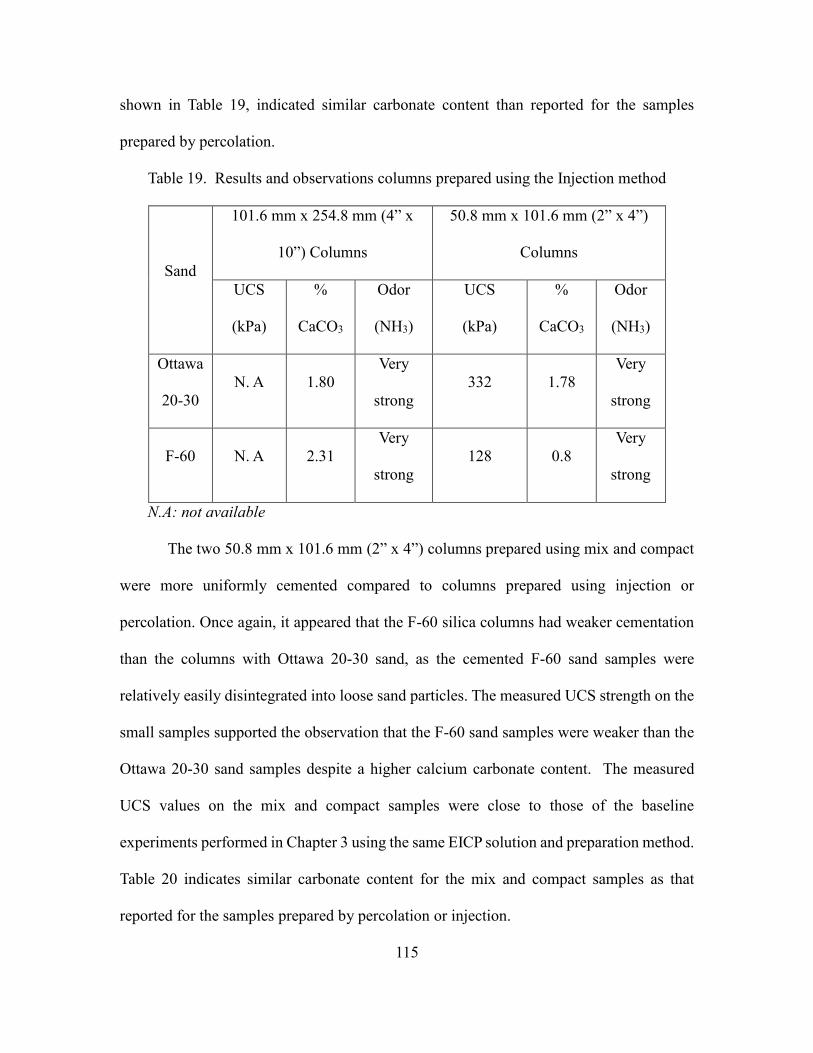
115
shown in Table 19, indicated similar carbonate content than reported for the samples
prepared by percolation.
Table 19. Results and observations columns prepared using the Injection method
Sand
101.6 mm x 254.8 mm (4” x
10”) Columns
50.8 mm x 101.6 mm (2” x 4”)
Columns
UCS
(kPa)
%
CaCO3
Odor
(NH3)
UCS
(kPa)
%
CaCO3
Odor
(NH3)
Ottawa
20-30
N. A 1.80
Very
strong
332 1.78
Very
strong
F-60 N. A 2.31
Very
strong
128 0.8
Very
strong
N.A: not available
The two 50.8 mm x 101.6 mm (2” x 4”) columns prepared using mix and compact
were more uniformly cemented compared to columns prepared using injection or
percolation. Once again, it appeared that the F-60 silica columns had weaker cementation
than the columns with Ottawa 20-30 sand, as the cemented F-60 sand samples were
relatively easily disintegrated into loose sand particles. The measured UCS strength on the
small samples supported the observation that the F-60 sand samples were weaker than the
Ottawa 20-30 sand samples despite a higher calcium carbonate content. The measured
UCS values on the mix and compact samples were close to those of the baseline
experiments performed in Chapter 3 using the same EICP solution and preparation method.
Table 20 indicates similar carbonate content for the mix and compact samples as that
reported for the samples prepared by percolation or injection.
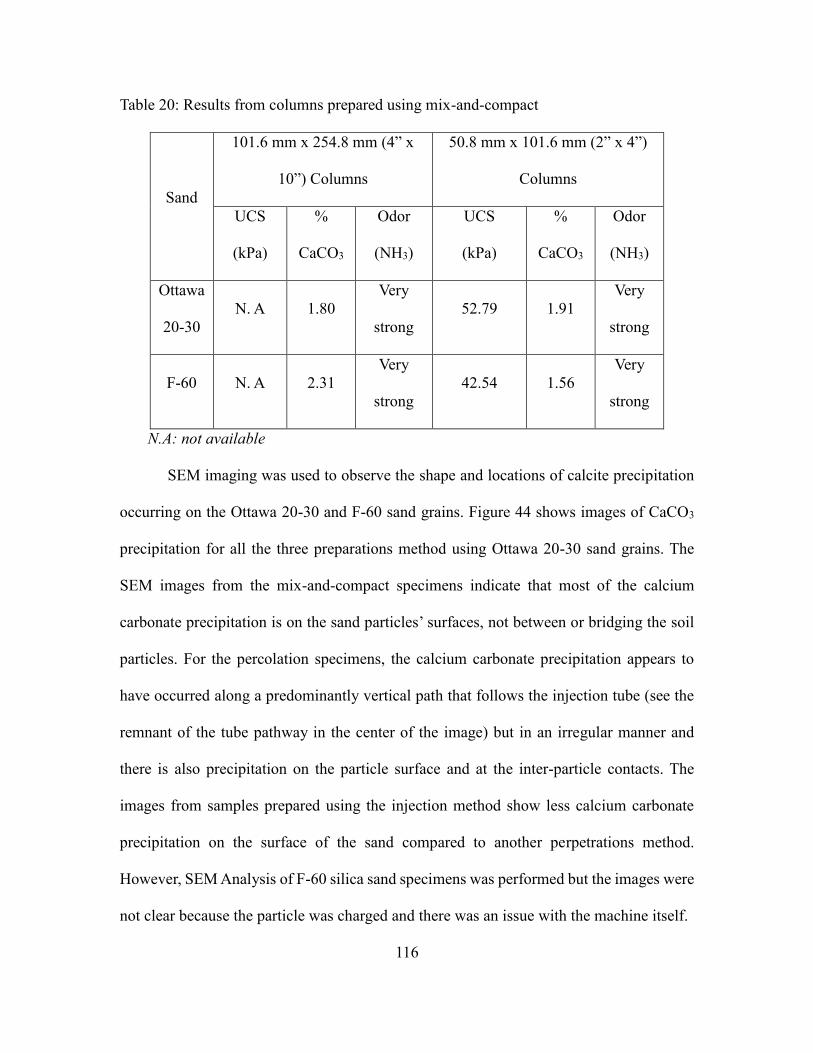
116
Table 20: Results from columns prepared using mix-and-compact
Sand
101.6 mm x 254.8 mm (4” x
10”) Columns
50.8 mm x 101.6 mm (2” x 4”)
Columns
UCS
(kPa)
%
CaCO3
Odor
(NH3)
UCS
(kPa)
%
CaCO3
Odor
(NH3)
Ottawa
20-30
N. A 1.80
Very
strong
52.79 1.91
Very
strong
F-60 N. A 2.31
Very
strong
42.54 1.56
Very
strong
N.A: not available
SEM imaging was used to observe the shape and locations of calcite precipitation
occurring on the Ottawa 20-30 and F-60 sand grains. Figure 44 shows images of CaCO3
precipitation for all the three preparations method using Ottawa 20-30 sand grains. The
SEM images from the mix-and-compact specimens indicate that most of the calcium
carbonate precipitation is on the sand particles’ surfaces, not between or bridging the soil
particles. For the percolation specimens, the calcium carbonate precipitation appears to
have occurred along a predominantly vertical path that follows the injection tube (see the
remnant of the tube pathway in the center of the image) but in an irregular manner and
there is also precipitation on the particle surface and at the inter-particle contacts. The
images from samples prepared using the injection method show less calcium carbonate
precipitation on the surface of the sand compared to another perpetrations method.
However, SEM Analysis of F-60 silica sand specimens was performed but the images were
not clear because the particle was charged and there was an issue with the machine itself.
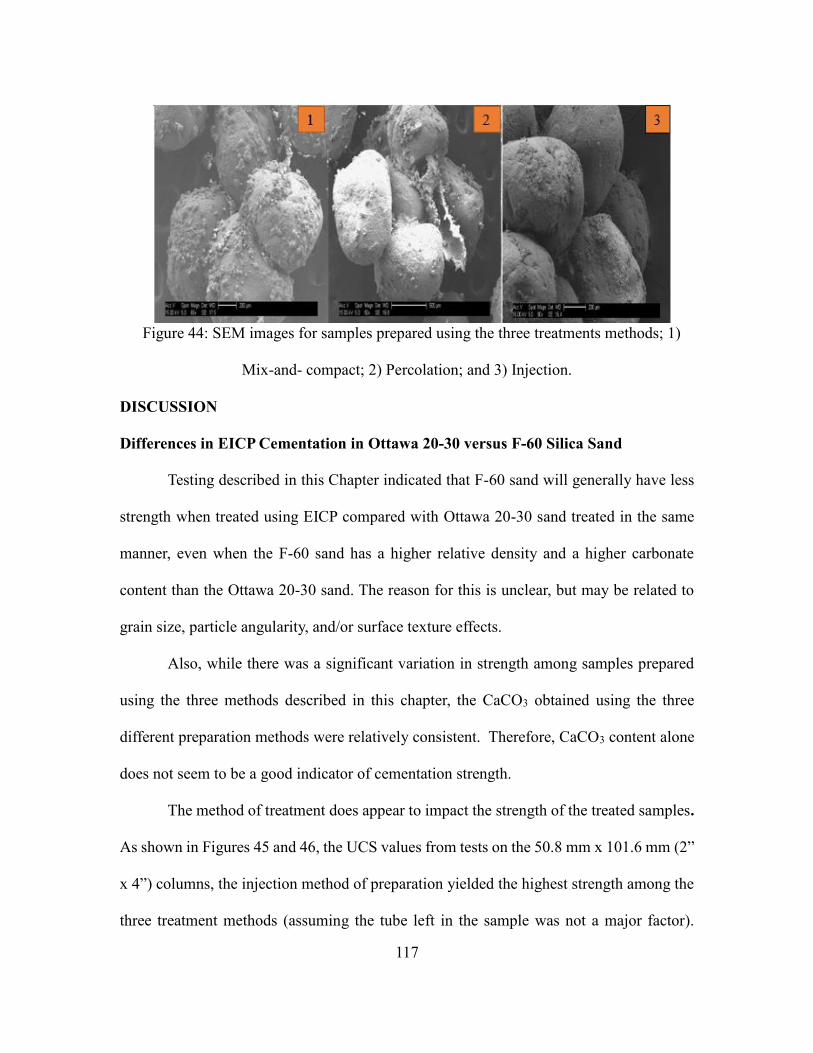
117
Figure 44: SEM images for samples prepared using the three treatments methods; 1)
Mix-and- compact; 2) Percolation; and 3) Injection.
DISCUSSION
Differences in EICP Cementation in Ottawa 20-30 versus F-60 Silica Sand
Testing described in this Chapter indicated that F-60 sand will generally have less
strength when treated using EICP compared with Ottawa 20-30 sand treated in the same
manner, even when the F-60 sand has a higher relative density and a higher carbonate
content than the Ottawa 20-30 sand. The reason for this is unclear, but may be related to
grain size, particle angularity, and/or surface texture effects.
Also, while there was a significant variation in strength among samples prepared
using the three methods described in this chapter, the CaCO3 obtained using the three
different preparation methods were relatively consistent. Therefore, CaCO3 content alone
does not seem to be a good indicator of cementation strength.
The method of treatment does appear to impact the strength of the treated samples.
As shown in Figures 45 and 46, the UCS values from tests on the 50.8 mm x 101.6 mm (2”
x 4”) columns, the injection method of preparation yielded the highest strength among the
three treatment methods (assuming the tube left in the sample was not a major factor).
118
Based upon both UCS values and visual observations, the mix-and-compact method
produced the lowest strength. The UCS was 52.79 kPa for Ottawa 20-30 sand and 42.54
kPa for F-60 silica sand for samples prepared by mix and compact. The relative similarity
in strength between samples of different grain size prepared using the mix and compact
method may be because most of the calcium carbonate precipitation in samples prepared
in this manner was on the sand particle surfaces and was not at contacts or bridging between
soil particles (based upon the SEM imaging). The difference in strength between Ottawa
20-30 and F-60 sand samples prepared using the percolation method was more significant
compared to mix-and-compact method in strength values. The strength values differed
from 110 kPa for Ottawa 20-30 sand to 60.9 kPa for the F-60 silica sand. The difference in
the strength value between the two types of preparation may be due to the grain size effect
or it may be due to the surface texture of the particles. The injection method produced the
largest value of strength for both the types of sand (Ottawa 20-30, and F-60 silica sand)
compared to the other preparation methods. The strength was 332 kPa for the sample of
Ottawa 20-30 prepared by injection and 128 kPa for the sample of F-60 silica sand prepared
by injection. Two reasons are hypothesized for the greater strength of sample prepared by
injection: (1) leaving the injection tube in the sample increased the strength of the sample,
and/or (2) the cementation solution was diffused through the entire specimen at about the
same time as it was introduced to the soil, minimizing loss of efficiency due to denaturation
of the urease enzyme. Note that all of the tests described in this chapter were conducted
without the addition of fresh dried non-fat milk as a stabilizer for the enzyme.
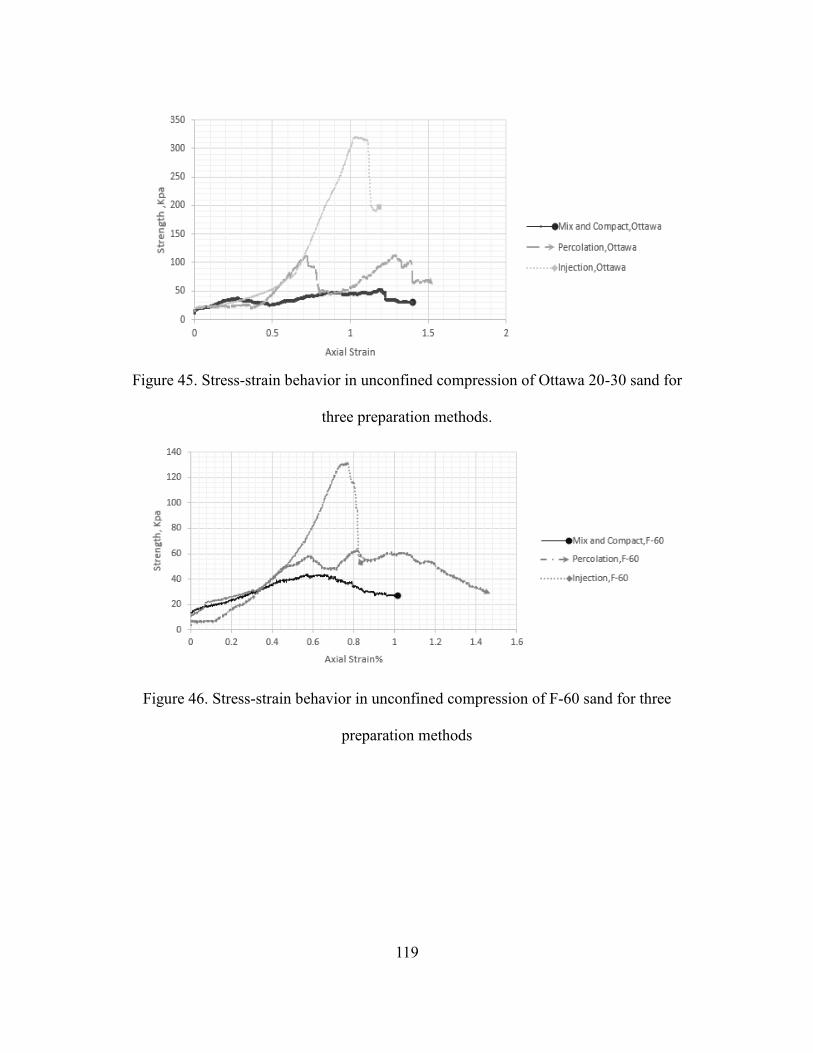
119
Figure 45. Stress-strain behavior in unconfined compression of Ottawa 20-30 sand for
three preparation methods.
Figure 46. Stress-strain behavior in unconfined compression of F-60 sand for three
preparation methods
120
CONCLUSION
Experiments performed in this chapter describe sub-horizontal and vertical
columns prepared by treating soil with EICP solutions. For the sub-horizontal column
experiment, inclined columns were installed in a box filled with dry Ottawa F-60 silica
sand. The columns were installed by injecting the EICP solution through perforated tubes.
After allowing the EICP solution to cure, removing the face of the box, and applying a load
to the soil surface, there was no visual evidence of cracking or instability. SEM imaging
and XRD analysis were performed to elucidate the pattern of CaCO3 precipitation and the
morphology of the carbonate phase. The results indicated that EICP holds promise as a
ground improvement technique for creating sub-horizontal columns for soil reinforcement
(e.g., soil nailing).
Two types of sand (Ottawa 20-30, and F-60) and two different preparation methods
(percolation and injection) were used with two different dimension columns to investigate
the effect gradation and the method of preparation on vertical column formation. The
results showed that the injection method had the highest UCS compared to the percolation
method and that both methods produced higher strength than was achieved using the mix-
and-compact method. Analysis of SEM images showed a difference in the pattern of
CaCO3 precipitation for the different methods of preparation.
121
CHAPTER 7
CONCLUSIONS AND RECOMMENDATIONS FOR FUTURE WORK
SUMMARY
This dissertation examines the feasibility of enzyme induced carbonate
precipitation (EICP) as a soil improvement technique. The mechanical properties of EICP-
treated soil were studied with various admixtures and subject to various treatment
conditions. Chapter 2 of this dissertation describes relevant work performed by other
researchers using both microbial induced carbonate precipitation (MICP) and EICP.
Chapter 3 presents the results of Falcon tube tests to study the influence of the
concentration of constituents on carbonate precipitation. Over 60 tests using different
concentrations of urea, calcium chloride, and urease enzyme were conducted. The
reusability of effluent from these tests was investigated in order to reduce the cost of EICP
treatment of soil. The addition of calcite seeds to the EICP solution was also investigated
to see the effect of calcite seeds on the strength of the treated soil and the mineralogy of
the precipitates. The optimum EICP recipe deduced from the Falcon tubes was used to treat
Ottawa 20-30 sand in in acrylic columns using two different preparation methods: mix-
and-compact and percolation. The effect of water rinsing on EICP-treated soil was also
examined in this chapter.
Chapter 4 investigated the potential for enhancing the strength of EICP-improved
Ottawa 20-30 silica sand by adding supplemental materials. Two different natural
materials, xanthan gum and sisal fiber, were evaluated as supplements. Xanthan gum was
applied in two ways: mixed as a powder with dry soil and mixed with EICP solution. The
fibers were simply mixed with the dry soil. Three different concentrations of urea to
122
calcium chloride were also investigated. The mix-and-compact method was used for all
samples. Testing included unconfined compressive strength (UCS) strength tests, scanning
electron microscope (SEM) imaging to look at evidence of the phase of calcium carbonate
precipitate and the pattern of precipitation, and acid digestion to measure the amount of
calcium carbonate precipitate.
In Chapter 5, acrylic columns filled with Ottawa 20-30 sand were prepared using
the mix-and-compact method with two organic additives, dried non-fat milk and cabbage
juice, in order to enhance the mechanical behavior of the EICP-treated soil. Five different
EICP solutions were used in the experiments described in this chapter to evaluate the effect
of these additives, including one with a very low concentration of constituents (0.37 M
urea, 0.25 M CaCl2, 0.8 g/l of urease enzyme, and 4 g/l of dried non-fat dry milk) to
evaluate the potential for minimizing the cost of EICP treatment and its environmental
impact. UCS, Energy Dispersive X-ray (EDX), SEM, X-ray Powder Diffraction (XRD),
and acid digestions tests were used to characterize the results on the specimens discussed
in this chapter.
Tests described in Chapter 6 investigated the potential of using EICP to create sub-
horizontal and vertical columns for soil improvement. For the sub-horizontal columns
experiment, F-60 silica sand was used. The EICP solution for the sub-horizontal column
consisted of 0.87 M urea, 0.5 M CaCl2-2H2O, 0.85 g/L low-grade urease enzyme. For
vertical columns, two types of sand (Ottawa 20-30, and F-60) and two different preparation
methods (percolation and injection) were used with two different dimension columns to
investigate the effect gradation and the method of preparation on vertical EICP column
formation. The vertical column experiments were performed using an EICP solution
123
composed of 1 M urea, 0.67 M CaCl2, 4.0 g/l of dried non-fat milk as a stabilizer, and 3 g/l
of low activity urease enzyme.
CONCLUSIONS
In Chapter 3, the optimal recipe for EICP based on a high mass of precipitation,
high efficiency (with respect to the percent of calcium in the substrate precipitate as
carbonate), and a low concentration of enzyme was investigated using Falcon tube tests.
This optimal recipe for EICP treatment established on this basis was found to be a solution
consisting of 1.00 M urea, 0.67 M CaCl2 and 3.00 g/l urease enzyme. The tests described
in this chapter also showed that the effluent from EICP treatment without the use of an
organic stabilizer (i.e., dried non-fat milk) cannot be used as a source of enzyme for
additional treatment. However, the unconsumed calcium chloride and urea in the effluent
from an incomplete treatment process still can be precipitated by adding fresh urease
enzyme. The Falcon tube tests suggested that when using the optimal recipe approximately
93% of the calcium in the substrate was converted to calcium carbonate. However, less
than 30% of calcium in the substrate was converted to calcium carbonate when the optimal
recipe was applied to acrylic columns filled with Ottawa 20-30 silica sand. This reduction
in precipitation ratio may be ascribed to insufficient interaction between urease molecules
and substrate. In the Falcon tube tests, the solution containing substrate and enzyme was
shaken for 72 hours at 200 rpm. However, the acrylic columns filled with sand could not
be shaken. Rinsing the treated soil with deionized (DI) water caused a loss of precipitate.
The lost precipitate is assumed to be residual salts and organic material and soluble non-
calcite phases of calcium carbonate such as vaterite and amorphous. Thus, to properly
124
evaluate the effect of carbonate precipitation on strength, the treated soil should always be
thoroughly rinsed to remove residual non-carbonate material.
In Chapter 4, the potential for enhancing the strength of EICP-improved Ottawa
20-30 silica sand by adding supplemental materials was evaluated. Tests were conducted
in which xanthan gum was used as a supplemental material. The optimum amount of
xanthan gum for enhancing unconfined compressive strength was 1.1% of the dry weight
of the soil, i.e., 1.1% (w/w). Mixing the xanthan gum, as powder, into dried soil yielded a
higher strength and greater ductility than mixing the xanthan gum into the EICP solution.
For both methods of application of xanthan gum, it was very hard to dry rinsed samples,
even in an oven at 105 °C. Acid digestion of oven-dried samples prepared using both
methods yielded a higher percentage of mass loss than the amount (weight) of CaCO3 that
could be precipitated based upon the amount of calcium in the EICP solution. The extra
mass loss is assumed to represent both residual salts and organic material in the column
and as well as xanthan gum that was not removed by rinsing. SEM imaging of rinsed
samples showed that xanthan gum still covered the particle surfaces and bridged between
particles after rinsing. The SEM images also indicated improvement in the morphology of
the precipitated carbonate, a change attributed could be to the change of the kinetic reaction
rate and/or delay of the precipitation reaction. Experiments were also performed in acrylic
columns that were prepared in which sisal fibers 10 mm and 20 mm in length were added
to Ottawa 20-30 sand at fiber contents up to 0.85% (w/w) prior to preparing samples using
mix-and-compact method. The longer (20 mm) fibers were not effective. UCS tests showed
increases in strength on the order of 380% for the sisal fiber-enhanced samples at up to
0.3% (w/w) fiber content with fibers that were 10 mm length. At fiber contents greater than

125
0.3% (w/w), there was a sharp decline in strength. The failure strain of the EICP-treated
sample with sisal fiber at 0.3% (w/w) was almost three times higher than samples prepared
without addition of sisal fiber.
In Chapter 5, enhancement of EICP treatment by adding two organic additives,
dried non-fat milk and green cabbage juice, to the EICP solution was evaluated. The results
from adding green cabbage juice, reported by others to inhibit ureolysis, did not show any
response, i.e., it did not inhibit or slow down the reaction (thereby enhancing the EICP
process by facilitating precipitation of calcite phase calcium carbonate) either with or
without dried non-fat milk in the solution. On the other hand, adding fresh dried non-fat
dry milk to the EICP solution showed a significant improvement for the properties of soil.
The results observed after adding fresh dried non-fat dry milk from UCS and undrained
triaxial tests for treated samples showed significant improvement in the soil strength with
a relatively small amount of calcium carbonate (2 MPa UCS with less than 1% CaCO3).
These results were unprecedented for all biogeotechnical carbonate precipitation
techniques. Through SEM testing, calcite crystals were found to be focused at the inter-
particle contact points. This is believed to be the source of the increased strength. In an
attempt to reduce the cost of treatment, urea and CaCl2 concentrations were reduced from
relatively high concentrations (1 M urea, 0.67 M CaCl2, and 3 g/l of urease enzyme) to a
much lower concentrations (0.37 M urea, 0.25 M CaCl2, and 0.8 g/l of urease enzyme).
This corresponded to a reduction in mass of 63% for urea and CaCl2 and 74% for the mass
of urease enzyme in the EICP solution. The findings from these tests were: (1) the reduced
concentrations resulted in a reduced but still significant strength (above 1 MPa), (2) there
was no difference in morphology observed in SEM images of specimens treated using the
126
high concentration solution and specimens treated using the reduced concentration
solution, (3) the carbonate content was close to the theoretical maximum for the reduced
concentration solution, and (4) the amount of unwanted (harmful) NH4Cl by-product was
reduced using the reduced concentration solution. The results of these tests suggest that the
strength of an EICP-treated soil sample is less dependent on how much CaCO3 is
precipitated than by the location of precipitation, i.e., whether the precipitation is
concentrated at the particle contacts or spread over the surface of particles. In general, using
dried non-fat milk was observed to eliminate or establish control over the drawbacks of
EICP and enhancing its effectiveness.
In Chapter 6, the results from vertical and sub-horizontal column experiments
showed that EICP holds promise as a ground improvement technique for creating stabilized
vertical columns and for soil nailing in cohesionless soils. The simulated soil nails were
installed by injecting the EICP solution through four equally-spaced sub-horizontal
perforated tubes. Moreover, the results from vertical columns showed there was a
significant difference in the pattern of precipitation between the methods of column
formation. The reason for these differences is not clear. However, the results from these
experiments demonstrated that the way a vertical column is made, i.e., via injection or via
percolation, is important as it affects the pattern of precipitation and the resulting strength
of the column.
RECOMMENDATIONS FOR FURTHER STUDY
The work conveyed in this dissertation presents systematic studies of the factors
affecting enzyme induced carbonate precipitation (EICP) as a potential technique for soil
improvement. While the work presented herein provides substantial insight into EICP,
127
additional investigations focusing on significant parameters of interest would be helpful in
gaining further understanding of the EICP technique, ultimately leading to application of
this technology on a field scale. These parameters include the mechanism by which the
addition of powdered milk enhances the precipitation process, grain size effects, and the
effects of soil mineralogy, soil and pore water chemistry, and soil surface texture.
Furthermore, there may be a benefit to slowing down the rate of precipitation by finding
an agent that inhibits the EICP reaction in order to get more uniform cementation and a
high percentage of calcite precipitate. In addition to understanding these effects on EICP,
substantial work will be needed on the best method(s) with which to employ EICP in the
field. Therefore, more testing under many different conditions is highly desired to
determine the feasibility of EICP soil improvement technology for field applications.
128
REFERENCES
Al Qabany, A., Soga, K., and Santamarina, C. (2011). Factors affecting efficiency of
microbially induced calcite precipitation. Journal of Geotechnical and
Geoenvironmental Engineering, 138(8), 992-1001.
Andrus, R. D., & Chung, R. M. (1995). Ground improvement techniques for liquefaction
remediation near existing lifelines. US National Institute of Standards and
Technology.
Bang, S. S., Bang, S., Frutiger, S., Nehl, L. M., & Comes, B. L. (2009). Application of
novel biological technique in dust suppression. In Transportation Research Board
88th Annual Meeting (No. 09-0831).
Blakely, R.L. and Zerner, B. (1984). “Jack Bean Urease: The First Nickel Enzyme.”
Journal of Molecular Catalysis, Vol. 23, pp. 263 – 292.
Burbank, M. B., Weaver, T. J., Williams, B. C., & Crawford, R. L. (2012). Urease activity
of ureolytic bacteria isolated from six soils in which calcite was precipitated by
indigenous bacteria. Geomicrobiology Journal, 29(4), 389-395.
Chang, I., Im, J., Prasidhi, A. K., & Cho, G. C. (2015). Effects of Xanthan gum
biopolymer on soil strengthening. Construction and Building Materials,74, 65-72
Cheng, L., Cord-Ruwisch, R., and Shahin, M. (2013). "Cementation of sand soil by
microbially induced calcite precipitation at various degrees of saturation".
Canadian Geotechnical Journal, 50(1), 81-90.
Cuthbert, M. O., McMillan, L. A., Handley-Sidhu, S., Riley, M. S., Tobler, D. J., &
Phoenix, V. R. (2013). A field and modeling study of fractured rock permeability
reduction using microbially induced calcite precipitation. Environmental science
& technology, 47(23), 13637-13643.
Czupak, Z. D. (2011). "Stabilization and Imaging of Cohesionless Soil Samples". MS
Thesis, Arizona State University, Tempe, Arizona.
Das, N., Kayastha, A. M., & Srivastava, P. K. (2002). Purification and characterization of
urease from dehuskedpigeonpea (Cajanuscajan L.) seeds. Phytochemistry, 61(5),
513-521.
de Andrade Silva, F., Zhu, D., Mobasher, B., & Toledo Filho, R. D. (2011). Impact
behavior of sisal fiber cement composites under flexural load. ACI Materials
Journal, 108(2).
129
De Muynck, Willem, Dieter Debrouwer, Nele De Belie, and Willy Verstraete. "Bacterial
carbonate precipitation improves the durability of cementitious materials."
Cement and concrete Research 38, no. 7 (2008): 1005-1014.
DeJong, J. T., Fritzges, M. B., &Nüsslein, K. (2006). Microbially induced cementation to
control sand response to undrained shear. Journal of Geotechnical and
Geoenvironmental Engineering, 132(11), 1381-1392.
DeJong, J. T., Soga, K., Kavazanjian, E., Burns, S., Van Paassen, L. A., Al Qabany, A., ...
& Chen, C. Y. (2013). Biogeochemical processes and geotechnical applications:
progress, opportunities and challenges. Geotechnique, 63(4), 287.
DeJong, J., Mortensen, B., Martinez, B., and Nelson, D. (2010). "Bio-mediated Soil
Improvement".Ecological Engineering, 36(2), 197-210.
Dilrukshi, R. A. N., & Kawasaki, S. (2016). Effective Use of Plant-Derived Urease in the
Field of Geoenvironmental. Geotechnical Engineering. J Civil Environ
Eng, 6(207), 2.
Dos Santos, A. P., Consoli, N. C., and Baudet, B. A. (2010). “The mechanics of fiber-
reinforced sand.” Geotechnique, 60(10), 791–799.
Ferris FG, Phoenix V, Fujita Y, Smith RW. 2003. Kinetics of calcite precipitation induced
by ureolytic bacteria at 10°C to 20°C in artificial groundwater. Geochemica et
Cosmochimica Acta 67:1701-1722.
Ferris FG, Setehmeir LG. 1992. Bacteriogenic mineral plugging. United States patent
664769.
Fujita Y, Ferris FG, Lawson RD, Colwell FS, Smith RW. 2000. Calcium carbonate
precipitation by ureolytic subsurface bacteria. Geomicrobiology Journal 17:305-
318.
Gomez, M. G., Anderson, C. M., DeJong, J. T., Nelson, D. C., & Lau, X. H. (2014).
Stimulating in situ soil bacteria for bio-cementation of sands. In Geo-Congress
2014: Geo-characterization and Modeling for Sustainability (pp. 1674-1682).
Gomez, M. G., Anderson, C. M., Graddy, C. M., DeJong, J. T., Nelson, D. C., & Ginn, T.
R. (2016). Large-Scale Comparison of Bioaugmentation and Biostimulation
Approaches for Biocementation of Sands. Journal of Geotechnical and
Geoenvironmental Engineering, 04016124.
Gross, D. R., & Underwood, B. A. (1971). Technological change and caloric costs: Sisal
agriculture in northeastern Brazil. American Anthropologist, 73(3), 725-740
130
Hamdan, N. (2013). "Carbonate Mineral Precipitation for Soil Improvement through
Microbial Denitrification". Master's Thesis, Arizona State University.
Hamdan, N. (2015). "Applications of Enzyme Induced Carbonate Precipitation (EICP) for
Soil Improvement". Doctoral Dissertation, Arizona State University.
Hamdan, N. and Kavazanjian, E. (2016). "Enzyme-induced Carbonate Mineral
Precipitation for Fugitive Dust control". Géotechnique, 66(7), 546-555.
Hamdan, N., Kavazanjian, E., and O’Donnell, S. (2013). "Carbonate Cementation via Plant
Derived Urease". 18th Int. Conf. on Soil Mechanics and Geotechnical
Engineering, Paris, France.
Hamdan, N., Kavazanjian, E., Rittmann, B., and Karatas, I. (2016). "Carbonate Mineral
Precipitation for Soil Improvement through Microbial
Denitrification". Geomicrobiology Journal, 1-8.
Hammes F, Seka A, De Knijf S, Verstraete W. 2003. A novel approach to calcium removal
from calcium-rich industrial wastewater. Water Research 37:699-704
Harkes, M., van Paassen, L., Booster, J., Whiffin, V., and van Loosdrecht, M. (2010).
"Fixation and Distribution of Bacterial Activity in Sand to Induce Carbonate
Precipitation for Ground Reinforcement". Ecological Engineering, 36(2), 112-
117.
Hejazi, S. M., Sheikhzadeh, M., Abtahi, S. M., &Zadhoush, A. (2012). A simple review
of soil reinforcement by using natural and synthetic fibers.Construction and
building materials, 30, 100-116.
Hitzman, D. O. (1984). U.S. Patent No. 4,450,908. Washington, DC: U.S. Patent and
Trademark Office.
Ivanov, V. and Chu, J. (2008). "Applications of Microorganisms to Geotechnical
Engineering for Bioclogging and Biocementation of Soil In situ". Reviews in
Environmental Science and Bio/Technology, 7(2), 139-153.
Iyer, P. V., &Ananthanarayan, L. (2008). Enzyme stability and stabilization—aqueous
and non-aqueous environment. Process Biochemistry, 43(10), 1019-1032.
Jabri, Evelyn, Mann H. Lee, Robert P. Hausinger, and P. Andrew Karplus. "Preliminary
crystallographic studies of urease from jack bean and from Klebsiella aerogenes."
Journal of molecular biology 227, no. 3 (1992): 934-937.
Jacob, D. (1999). Geochemical Cycles. Introduction to Atmospheric Chemistry. Princeton
University Press
131
Jones, Bradley D., and H. L. Mobley. "Proteus mirabilis urease: nucleotide sequence
determination and comparison with jack bean urease." Journal of bacteriology
171, no. 12 (1989): 6414-6422.
Karatas, Ismail, Kavazanjian, Edward Jr., Rittmann, Bruce E. (2008) “Microbially Induced
Precipitation of Calcite using Pseudomonas denitrificans.” Proceedings 1st
International Conference on BioGeoCivil Engineering, Delft, the Netherlands.
Karol, R.H. 2003. Chemical grouting and soil stabilization. New York, Dekker. Lioliou,
M.G., Paraskeva, C.A., Koutsoukos, P.G. &Payatakes, A.C. 2007.
"Heterogeneous nucleation and growth of calcium carbonate on calcite and
quartz." Journal of Colloid and Interface Science 308(2): 421-428.
Kavazanjian Jr, E., and Karatas, I. (2008). “Microbiological improvement of the Physical
Properties of Soil,” in Proc. 6th Int. Conf. on Case Histories in Geotech.
Engineering, Rolla, MO (CD-ROM).
Kayastha, A. M., & Das, N. (1999). A simple laboratory experiment for teaching enzyme
immobilization with urease and its application in blood urea
estimation. Biochemical Education, 27(2), 114-117.
Knorr, B. (2014). Enzyme-induced carbonate precipitation for the mitigation of fugitive
dust. Arizona State University.
Martin, G. R., Yen, T. F., & Karimi, S. (1996). Application of biopolymer technology in
silty soil matrices to form impervious barriers. In 7th Australia New Zealand
Conference on Geomechanics: Geomechanics in a Changing World:
Conference Proceedings (p. 814). Institution of Engineers, Australia
Marzadori, C., Miletti, S., Gessa, C., &Ciurli, S. (1998). Immobilization of jack bean
urease on hydroxyapatite: urease immobilization in alkaline soils. Soil Biology
and Biochemistry, 30(12), 1485-1490.
McInerney, M. J., Jenneman, G. E., Knapp, R. M., &Menzie, D. E. (1985). Biosurfactant
and enhanced oil recovery (No. US 4522261).
Meyer, F. D., Bang, S., Min, S., Stetler, L. D., & Bang, S. S. (2011). Microbiologically-
induced soil stabilization: application of Sporosarcinapasteurii for fugitive dust
control. In Geo-frontiers 2011: advances in geotechnical engineering (pp. 4002-
4011).
Mukherjee, P. S., & Satyanarayana, K. G. (1984). Structure and properties of some
vegetable fibres. Journal of Materials Science, 19(12), 3925-3934.
132
Nemati M, Voordouw G. 2005. Permeability profile modification using bacterially formed
calcium carbonate: comparison with enzymic option. Process Biochemistry
40:925-933.
Nemati, M., &Voordouw, G. (2003). Modification of porous media permeability, using
calcium carbonate produced enzymatically in situ. Enzyme and Microbial
Technology, 33(5), 635-642.
Neupane, D., Yasuhara, H., Kinoshita, N., & Ando, Y. (2015). Distribution of mineralized
carbonate and its quantification method in enzyme mediated calcite precipitation
technique. Soils and Foundations, 55(2), 447-457.
Neupane, D., Yasuhara, H., Kinoshita, N., and Putra, H. (2015). "Distribution of Grout
Material within 1-m Sand Column in Insitu Calcite Precipitation
Technique". Soils and Foundations, 55(6), 1512-1518.
Nutman, F. J. (1937). Agave Fibres. I. Morphology, Histology, Length and Fineness,
Grading problems. Mechanical qualities. Researches on Agave fibres. Empire J.
Exp. Agric, 5, 75-92.
Oksman, K., Wallström, L., & Berglund, L. (2002). Morphology and mechanical
properties of unidirectional sisal–epoxy composites. Journal of Applied
Polymer Science, 84(13), 2358-2365.
Olech, Z., Zaborska, W., &Kot, M. (2014). Jack bean urease inhibition by crude juices of
Allium and Brassica plants. Determination of thiosulfinates. Food
chemistry, 145, 154-160.
Pettit, N. M., Smith, A. R. J., Freedman, R. B., & Burns, R. G. (1976). Soil urease: activity,
stability and kinetic properties. Soil Biology and Biochemistry, 8(6), 479-484.
Putra, H., Yasuhara, H., Kinoshita, N., Neupane, D., and Lu, C. (2016). "Effect of
Magnesium as Substitute Material in Enzyme-Mediated Calcite Precipitation for
Soil-Improvement Technique".Front. Bioeng. Biotechnol., 4.
O'Donnell, S. (2016). Mitigation of earthquake-induced soil liquefaction via microbial
denitrification: A two-stage process. Doctoral Dissertation, Arizona State
University.
Schnell, K. (1999). Impact of chemical grout injection on urban groundwater. In Impacts
of Urban Growth on Surface Water and Groundwater Quality: Proceedings of an
International Symposium Held During IUGG 99, the XXII General Assembly of
the International Union of Geodesy and Geophysics, at Birmingham, UK 18-30
July 1999 (No. 259, p. 187). IAHS Press.
133
Stocks-Fischer, S., Galinat, J.K. & Bang, S.S. 1999. "Microbiological precipitation of
CaCO3." Soil Biology and Biochemistry 31(11): 1563-1571.
Tiano P. 1995. Stone reinforcement by calcite crystal precipitation induced by organic
matrix acromolecules. Studies in Conservation 40:171-176.
Van Paassen, L. A. (2009). Biogrout, ground improvement by microbial induced carbonate
precipitation (Doctoral dissertation, TU Delft, Delft University of Technology).
van Paassen, L., Daza, C., Staal, M., Sorokin, D., van der Zon, W., and van Loosdrecht,
M. (2010b). "Potential Soil Reinforcement by Biological
Denitrification". Ecological Engineering, 36(2), 168-175.
van Paassen, L., Ghose, R., van der Linden, T., van der Star, W., and van Loosdrecht, M.
(2010a). "Quantifying Biomediated Ground Improvement by Ureolysis: Large-
Scale BiogroutExperiment".J. Geotech. Geoenviron. Eng., 136(12), 1721-1728.
Whiffin, V. S. (2004). “Microbial CaCO3 precipitation for the production
ofbiocement”. Doctoral dissertation, Murdoch University.
Whiffin, V., van Paassen, L., and Harkes, M. (2007). "Microbial Carbonate Precipitation
as a Soil Improvement Technique". Geomicrobiology Journal, 24(5), 417-423.
Yang, P., O’Donnell, S., Hamdan, N., Kavazanjian, E., &Neithalath, N. (2016). 3D DEM
Simulations of Drained Triaxial Compression of Sand Strengthened Using
Microbially Induced Carbonate Precipitation. International Journal of
Geomechanics, 17(6), 04016143.
Yasuhara, H., Hayashi, K., and Okamura, M. (2011). "Evolution in Mechanical and
Hydraulic Properties of Calcite-cemented Sand Mediated by Biocatalyst". Geo-
Frontiers 2011: Advances in Geotechnical Engineering, ASCE, 3984-3992.
Yasuhara, H., Neupane, D., Hayashi, K., and Okamura, M. (2012). "Experiments and
Predictions of Physical Properties of Sand Cemented by Enzymatically-induced
Carbonate Precipitation". Soils and Foundations, 52(3), 539-549.
Zoller, H. F. (1921). Casein viscosity studies. The Journal of general physiology, 3(5), 635-
651.