Embed Size (px)
Citation preview
Project Number DDB-2012
Enzymatic Hydrolysis of Cellulosic Biomass for the
Production of Second Generation Biofuels
A Major Qualifying Project Report
Submitted to the faculty of
Worcester Polytechnic Institute
In partial fulfillment of the requirements for the
Degree of Bachelor of Science
By
____________________
Alexander Demers
___________________
Richard Doane
__________________
Scott Guzman
__________________
Ryan Pagano
Date: May 1, 2009
Approved:
________________________ ________________________
William M. Clark, PhD David DiBiasio, PhD Project Advisor Project Advisor
Project Number DDB-2012
Page 2 of 29
Enzymatic Hydrolysis of Cellulosic Biomass for the
Production of Second Generation Biofuels
Table of Contents Abstract: ................................................................................................................................................. 3
Introduction ............................................................................................................................................ 4
Background ............................................................................................................................................. 6
What are Biofuels? .............................................................................................................................. 6
Cellulosic vs. Fossil Fuels .................................................................................................................. 6
What is Cellulose?............................................................................................................................ 8
Sources of Cellulose ......................................................................................................................... 8
Why is Enzymatic Hydrolysis Important?.............................................................................................. 9
Alternative to petroleum products ................................................................................................. 10
Highly renewable resource ............................................................................................................ 10
Significant breakthroughs/developments....................................................................................... 10
Reaction Pathway .......................................................................................................................... 12
Methodology ......................................................................................................................................... 13
Materials used ................................................................................................................................... 13
Equipment ......................................................................................................................................... 15
Experimental Analysis ........................................................................................................................ 17
Apple pomace pretreatment ............................................................................................................. 18
Hydrolysis Step .................................................................................................................................. 18
Results: ................................................................................................................................................. 20
Discussion ............................................................................................................................................. 26
Conclusion:............................................................................................................................................ 27
Recommendations ................................................................................................................................ 28
Works Cited ........................................................................................................................................... 29
Page 3 of 29
Abstract: The Apple pomace left over from the apple pressing process has shown to be a good
substrate in the conversion process from cellulosic biomass into fermentable sugars for the
production of second generation biofuels such as cellulosic ethanol. This fuel can then be used
to replace fossil fuels in the transportation sector. This reaction is analyzed in a bench scale
bioreactor, using commercial cellulase enzymes to break down the available cellulose in the
apple pomace, wood shavings and swithchgrass feedstocks.
Page 4 of 29
Introduction Energy availability has been an issue since the Vietnam War. With the potential of fossil
fuels, the most common energy source in use today, becoming depleted, new sources of energy
are being developed. These new forms of energy include solar, wind, geothermal, nuclear, and
other forms of renewable energy. Included within the renewable energy field lies that of using
ethanol as either a fuel additive or as a fuel itself. There are several ways to produce this
ethanol. Cellulose based materials can be broken down into individual sugars. These sugars can
be futher broken down and fermented into ethanol. Breaking down the cellulose into sugars,
predominantly glucose, can pose a challenge. One way to do so is by enzymatic hydrolysis. This
uses enzymes, biological catalysts, to break down the cellulose polymers into monomeric
sugars.
Enzymatic hydrolysis of cellulosic biomass is a key obstacle that must be overcome in
the advancement of second generation biofuels technology. There are several steps involved in
obtaining that usable fuel. First, the cellulose is obtained from plants and separated from the
lignin present in the mixture. The cellulose is then broken down into 5 or 6-carbon sugars for
conversion into the fuel source. Hydrolysis, or saccharification are processes utilized to break
down long chain cellulose, starch, protein and fat molecules into smaller, fermentable
molecules such as amino acids, fatty acids and simple sugars. This MQP will focus on the
hydrolysis and pretreatment steps, and from there, design a process capable of saccharifying
the cellulose into the fermentable sugars.
Page 5 of 29
The hydrolysis step is the part of the process the project will focus most specifically on.
The enzymatic hydrolysis reaction is carried out by means of enzymes that act as catalysts to
break the glycosidic bonds. There are advantages to both types of reaction. The chemical
catalytic hydrolysis is a faster acting reaction that requires much less residence time in the
reactor. Enzymatic hydrolysis can be run at much lower temperatures which bring utility costs
of a process down.
A notable biofuels production process which employs enzymatic hydrolysis has been
optimized by the National Renewable Energy Laboratory (NREL). In their process, pre-treatment
is necessary to break down the crystalline structure of the lignocellulosic material, isolating the
cellulose away from the lignin in the cell walls for hydrolysis. The cellulose is then hydrolyzed
with three types of cellulase enzymes: exoglucanase, endogluconase and betaglucosidase.
These three enzymes have been utilized to streamline the process, reduce expenses and
increase yields. (Zacchi, 2002)
The next step in each these biochemical conversion options, microbial fermentation,
also known as Acetogenesis, is the process by which microorganisms most commonly
Saccharomyces cerevisiae, also known as Baker or Brewer’s yeast, use 6-carbon carbohydrates
such as glucose for food. The sugars to feed the yeast can be derived from a variety of sources
such as cellulose in the cell walls of plants obtained either from agricultural waste or dedicated
energy crops such as switchgrass. Ethanol is produced in the metabolic process along with
other by-products. The chemical reaction for the fermentation of glucose by yeast to form
ethanol is given by:
Page 6 of 29
C6H12O6 → 2CH3CH2OH + 2CO2
(Thomson, 2006). Considering fermentation is already a highly researched and tested
technology, existing infrastructure will ease the transportation sector’s transition into
biochemical conversion of cellulosic biomass.
Bioethanol burns cleaner than unleaded gasoline, producing lower emissions of
particulate matter and toxics. Production of cellulosic ethanol from agricultural or forestry
residue can and conserve agricultural lands and reduce the pressure on landfills.
Background
What are Biofuels?
Biofuels are a source of energy derived from biomasses, such as corn, grains, and other
plant life. There is currently a large push in research and development of these energy sources,
as they are renewable as opposed to the currently used fossil fuels.
Cellulosic vs. Fossil Fuels
Currently, the majority of energy in the United States is produced by the fossil fuels coal,
oil, and natural gas. Unfortunately, there have been problems with the fact that these
resources are not renewable. There has been a recent push to develop a renewable energy
souce with which to fuel energy needs, such as for vehicles and other personal use. Ethanol
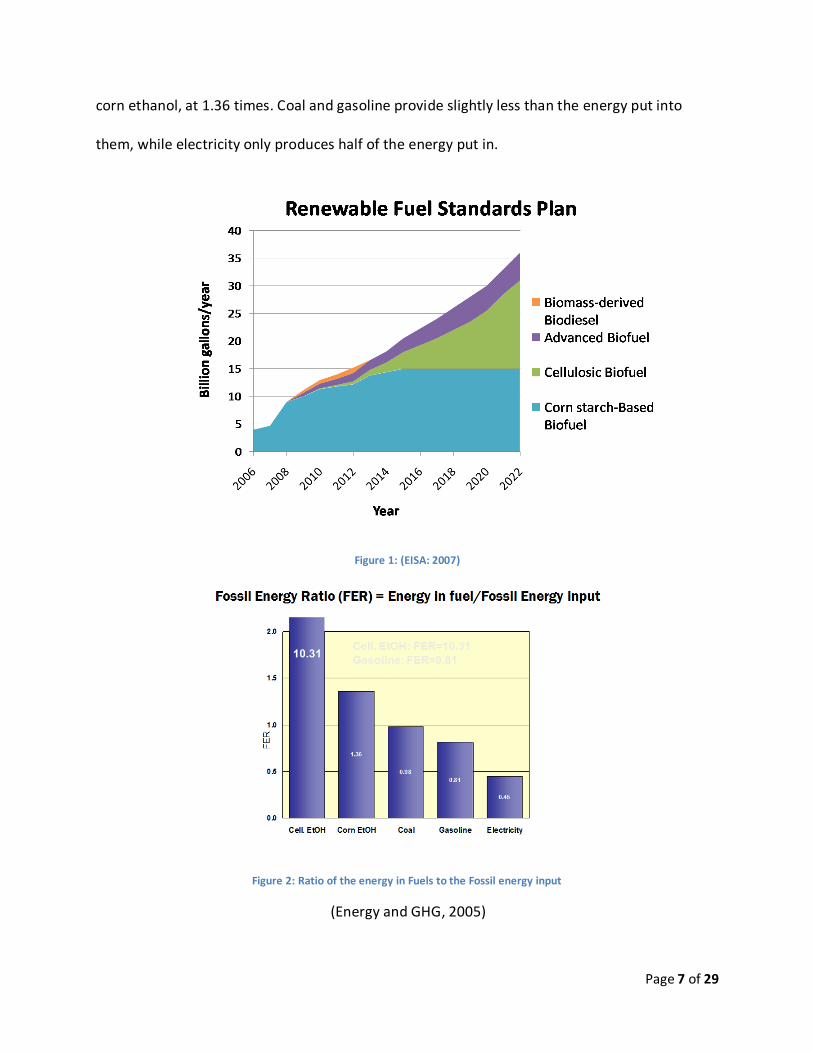
produced from corn is one such step. However, other forms of plants are able to produce much
more energy from ethanol they produce. Figure 1 shows the ratios of energy input by fossil
fuels against how much energy they are able to produce. Cellulosic ethanol sources produce
more than ten times as much energy as is required to make them. This compares favorably to
Page 7 of 29
corn ethanol, at 1.36 times. Coal and gasoline provide slightly less than the energy put into
them, while electricity only produces half of the energy put in.
Figure 1: (EISA: 2007)
Figure 2: Ratio of the energy in Fuels to the Fossil energy input
(Energy and GHG, 2005)
Page 8 of 29
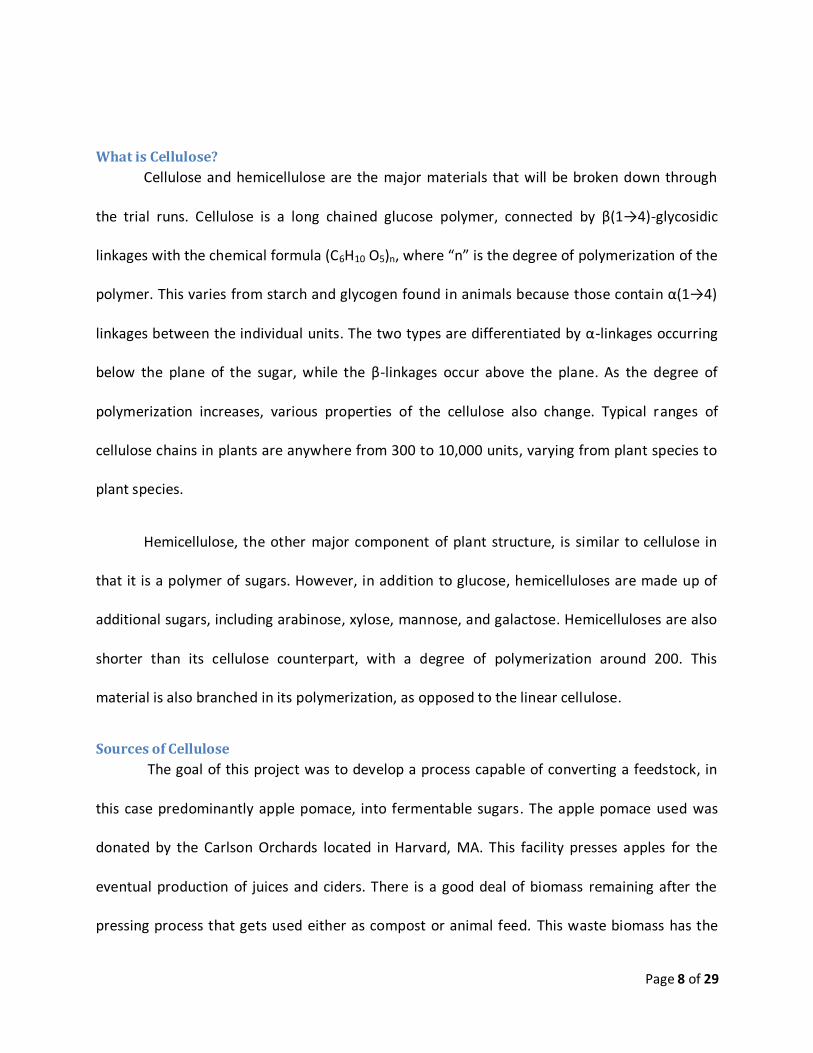
What is Cellulose?
Cellulose and hemicellulose are the major materials that will be broken down through
the trial runs. Cellulose is a long chained glucose polymer, connected by β(1→4)-glycosidic
linkages with the chemical formula (C6H10 O5)n, where “n” is the degree of polymerization of the
polymer. This varies from starch and glycogen found in animals because those contain α(1→4)
linkages between the individual units. The two types are differentiated by α-linkages occurring
below the plane of the sugar, while the β-linkages occur above the plane. As the degree of
polymerization increases, various properties of the cellulose also change. Typical ranges of
cellulose chains in plants are anywhere from 300 to 10,000 units, varying from plant species to
plant species.
Hemicellulose, the other major component of plant structure, is similar to cellulose in
that it is a polymer of sugars. However, in addition to glucose, hemicelluloses are made up of
additional sugars, including arabinose, xylose, mannose, and galactose. Hemicelluloses are also
shorter than its cellulose counterpart, with a degree of polymerization around 200. This
material is also branched in its polymerization, as opposed to the linear cellulose.
Sources of Cellulose
The goal of this project was to develop a process capable of converting a feedstock, in
this case predominantly apple pomace, into fermentable sugars. The apple pomace used was
donated by the Carlson Orchards located in Harvard, MA. This facility presses apples for the
eventual production of juices and ciders. There is a good deal of biomass remaining after the
pressing process that gets used either as compost or animal feed. This waste biomass has the
Page 9 of 29
potential to be used as a sustainable energy source if converted to ethanol or another biofuel.
The company, in looking for new ways to use this material, is looking into the potential for using
this material as an energy source.
With other biomasses there must be a pretreatment step to separate the cellulose from
lignin however apple pomace is shown to have a low concentration of lignin (Gullon, et al.
2007), therefore no separation pretreatment step will be used. The enzymatic hydrolysis step is
the part of the process this project specifically focuses on. The enzymatic hydrolysis reaction is
carried out by means of enzymes that act as catalysts to break the glycosidic bonds. There are
advantages to both types of reaction. The chemical catalytic hydrolysis is a faster acting
reaction that requires much less residence time in the reactor. Enzymatic hydrolysis can be run
at much lower temperatures which bring utility costs of a process down. Enzymatic hydrolysis
also allows for a very high rate of conversion. Acid hydrolysis, the other major method for
saccharification of cellulose, is more equilibrium driven which allows for less conversion.
Because of the combination of higher conversion and cheaper utility costs, enzymatic hydrolysis
is the method of choice for this project. The eventual goal of this project would result in a
bioreactor unit usable by local farms, operated by workers with limited knowledge of chemical
and reactor engineering principles.
Why is Enzymatic Hydrolysis Important?
This process is very important because it reduces the strain put on the food industry
from other forms of ethanol production. Instead of utilizing food crops to produce fuels, other
forms of organic matter containing cellulose can be used. There are a variety of uses for the
Page 10 of 29
sugars produces from this reaction; ethanol, acetic acid, amino acids, antibiotics, and other
chemicals are all potential products of these sugars.
Alternative to petroleum products
The Energy Policy Act of 2005 requires that 250 million gallons of the renewable fuel
consumed from 2013 and beyond be cellulosic ethanol. The act considers any fuel that “is
derived from any lingocellulosic or hemicellulosic matter that is available on a renewable or
recurring basis including dedicated energy crops and trees, wood and wood residues, plants,
grasses, agricultural residues, fibers, animal wastes, and other waste materials and municipal
solid waste.” (Regulatory Impact, 2007) This act as well as other follow up legislation, provides a
platform for cellulosic ethanol to incrementally replace fossil fuels in the transportation sector
in the coming years.
Highly renewable resource
Cellulosic ethanol is also a better choice than corn ethanol because of the comparative
accessibility and abundance of forest, agricultural, and other cellulosic resources which do not
compete with existing food reserves. The traditional method of producing ethanol from grains
such as corn and wheat sorghum is known as fermentation. This fermentation process uses
some type of fossil fuel to heat the boilers in the distillation columns and power the process.
New lignocellulosic biomass conversion processes can be mostly run on the otherwise wasted
lignin byproduct, saving money, energy and the environment. (Bergman, 2008)
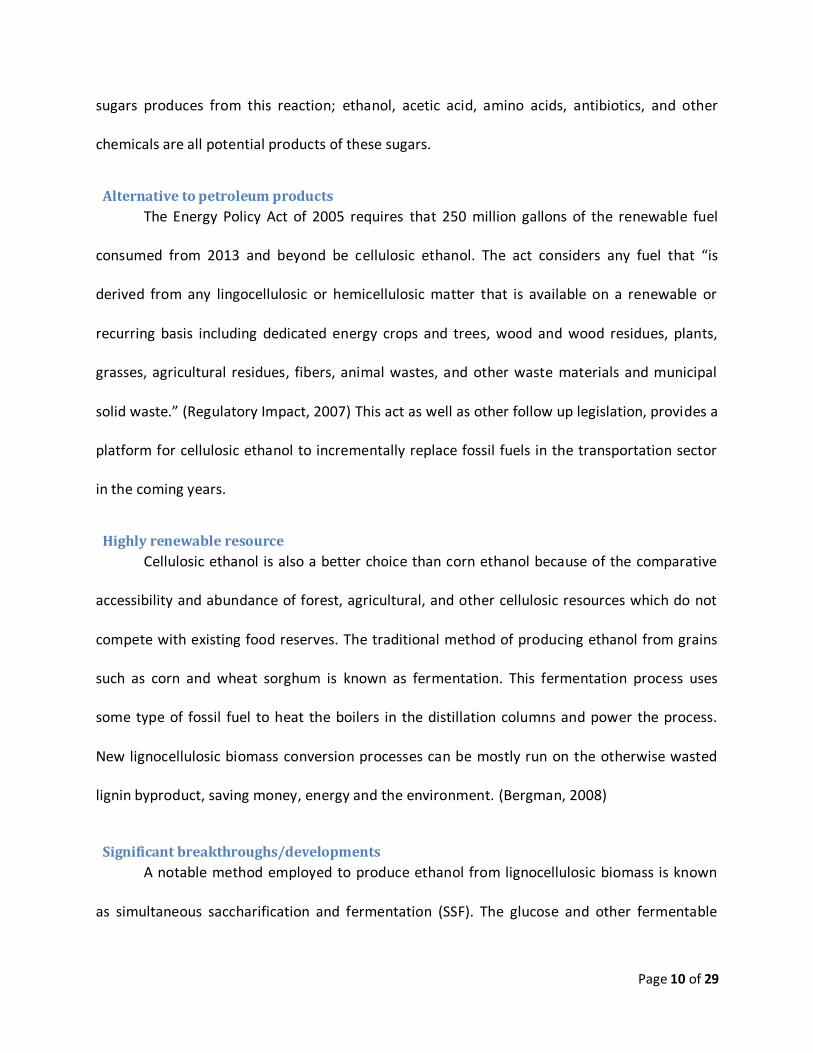
Significant breakthroughs/developments
A notable method employed to produce ethanol from lignocellulosic biomass is known
as simultaneous saccharification and fermentation (SSF). The glucose and other fermentable
Page 11 of 29
sugars are first produced in the saccharification step and then fermented in the next step. This
is very promising for producing ethanol from lignocellulose due to its ability to improve
hydrolysis rates, yields, and product concentrations compared to separate hydrolysis and
fermentation (SHF) systems. Experiments using Genencor 150L cellulase and mixed yeast
cultures have produced yields and concentrations of ethanol from cellulose of 80% and 4.5%
respectively.
Figure 3: Cellulosic Ethanol Production Process
(Zacchi, 2002)
Page 12 of 29
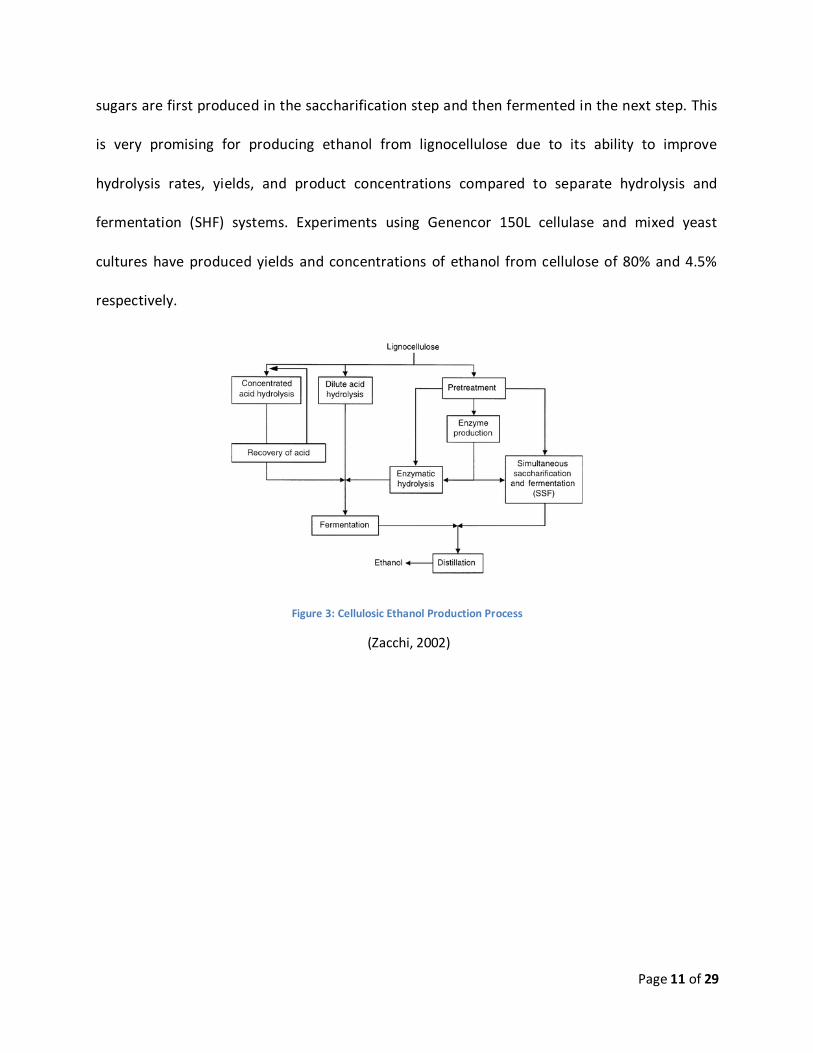
Reaction Pathway
Figure 4: Reation pathway from cellulose to glucose (Enzymeindia, 2008)
The above reaction pathway shows the progression from the cellulose substrate to the glucose
product through the activity of three enzymes: endocellulase, exocellulase and β-glucosidase.
The endocellulase and exocellulase enzymes incrementally cleave cellobiose molecules off of
the long chain polysaccharide molecules. This cellobiose intermediate then becomes the
substrate in the hydrolysis reaction with β-glucosidase, producing the final glucose product.
Page 13 of 29
Methodology Experimentation consisted of the hydrolysis of substrates via several different enzymes.
Glucose concentration was measured over time, while conditions such as temperature and pH
were kept constant.
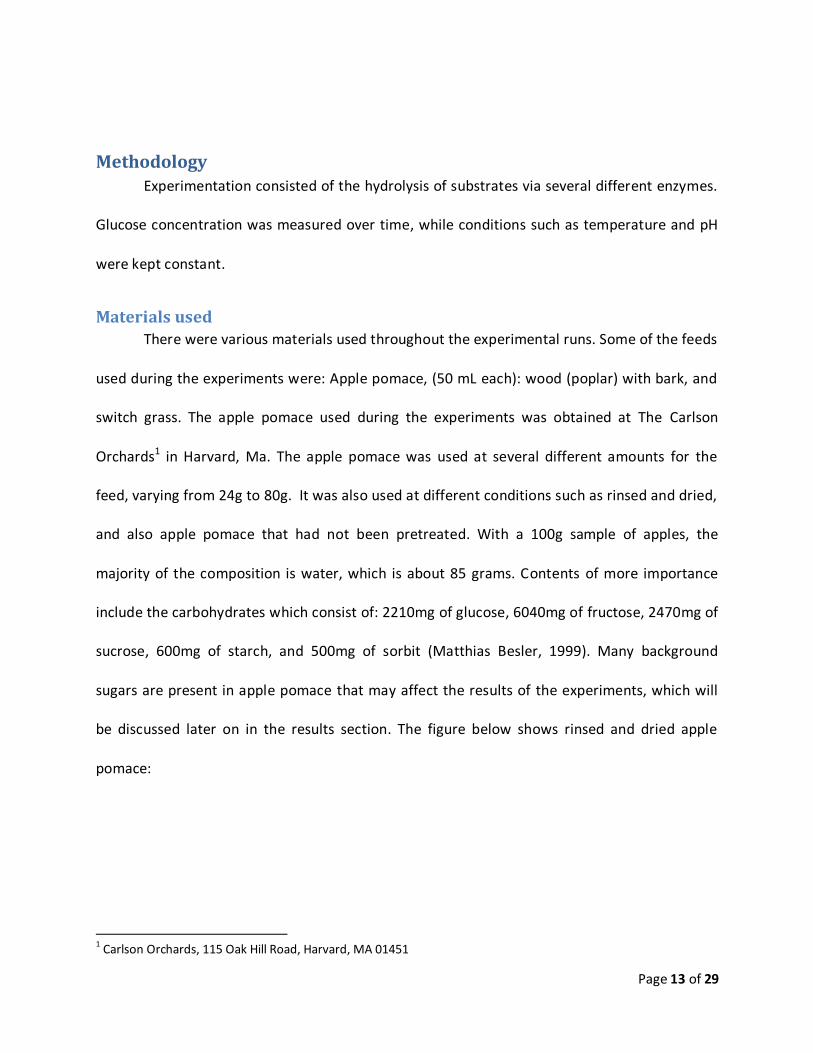
Materials used
There were various materials used throughout the experimental runs. Some of the feeds
used during the experiments were: Apple pomace, (50 mL each): wood (poplar) with bark, and
switch grass. The apple pomace used during the experiments was obtained at The Carlson
Orchards1 in Harvard, Ma. The apple pomace was used at several different amounts for the
feed, varying from 24g to 80g. It was also used at different conditions such as rinsed and dried,
and also apple pomace that had not been pretreated. With a 100g sample of apples, the
majority of the composition is water, which is about 85 grams. Contents of more importance
include the carbohydrates which consist of: 2210mg of glucose, 6040mg of fructose, 2470mg of
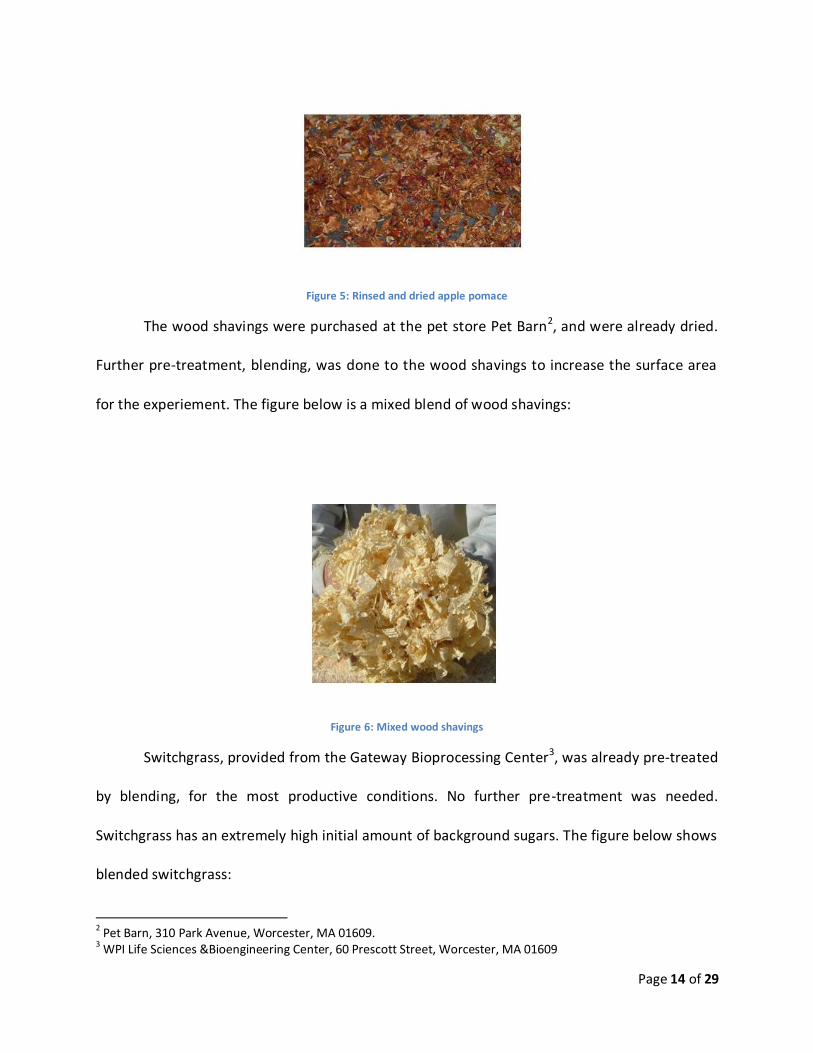
sucrose, 600mg of starch, and 500mg of sorbit (Matthias Besler, 1999). Many background
sugars are present in apple pomace that may affect the results of the experiments, which will
be discussed later on in the results section. The figure below shows rinsed and dried apple
pomace:
1 Carlson Orchards, 115 Oak Hill Road, Harvard, MA 01451
Page 14 of 29
Figure 5: Rinsed and dried apple pomace
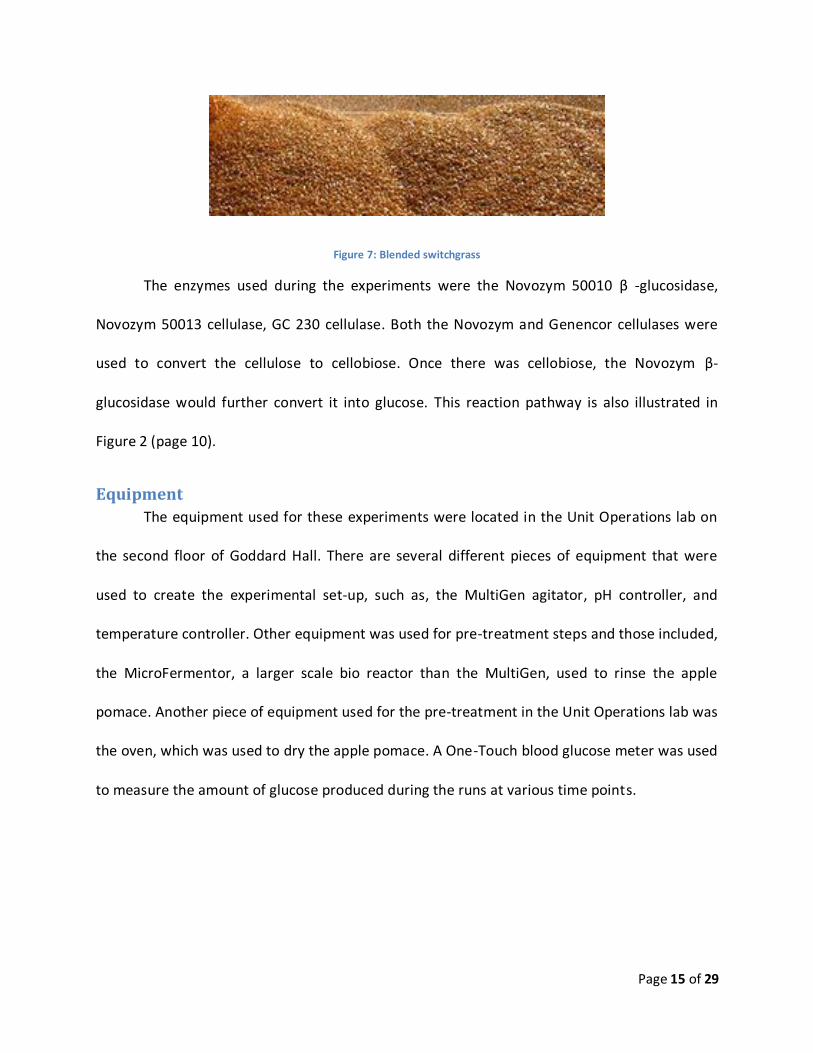
The wood shavings were purchased at the pet store Pet Barn2, and were already dried.
Further pre-treatment, blending, was done to the wood shavings to increase the surface area
for the experiement. The figure below is a mixed blend of wood shavings:
Figure 6: Mixed wood shavings
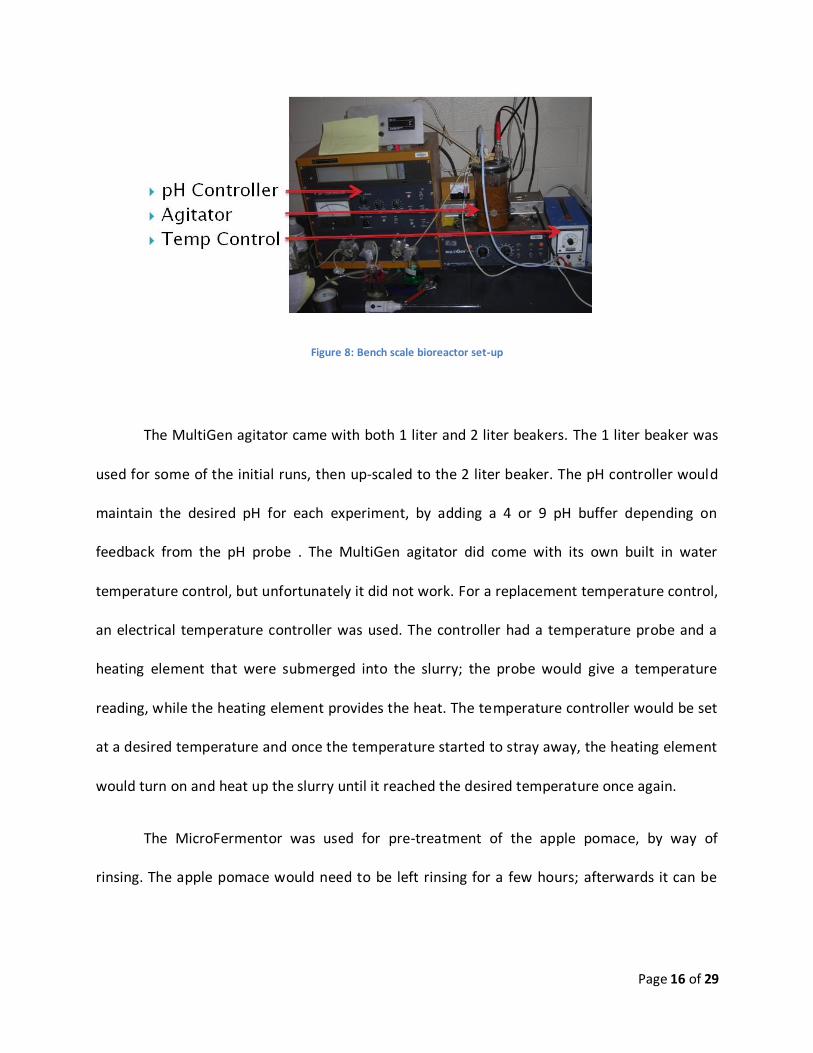
Switchgrass, provided from the Gateway Bioprocessing Center3, was already pre-treated
by blending, for the most productive conditions. No further pre-treatment was needed.
Switchgrass has an extremely high initial amount of background sugars. The figure below shows
blended switchgrass:
2 Pet Barn, 310 Park Avenue, Worcester, MA 01609.
3 WPI Life Sciences &Bioengineering Center, 60 Prescott Street, Worcester, MA 01609
Page 15 of 29
Figure 7: Blended switchgrass
The enzymes used during the experiments were the Novozym 50010 β -glucosidase,
Novozym 50013 cellulase, GC 230 cellulase. Both the Novozym and Genencor cellulases were
used to convert the cellulose to cellobiose. Once there was cellobiose, the Novozym β-
glucosidase would further convert it into glucose. This reaction pathway is also illustrated in
Figure 2 (page 10).
Equipment
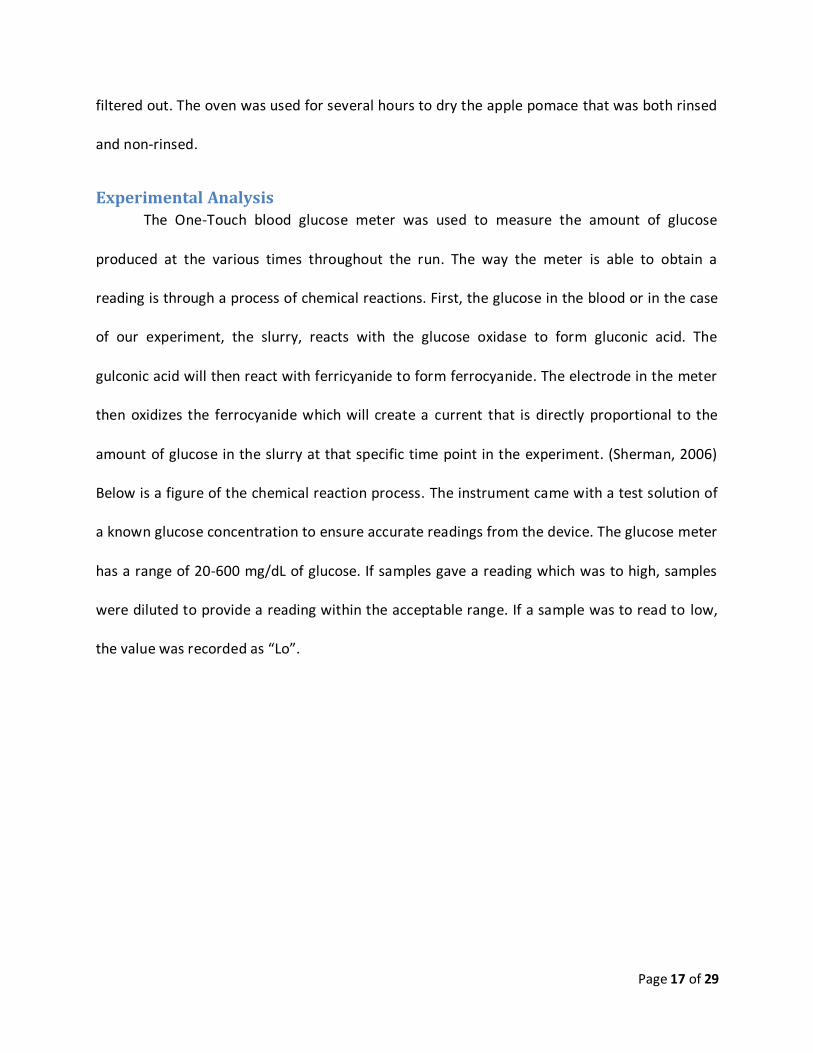
The equipment used for these experiments were located in the Unit Operations lab on
the second floor of Goddard Hall. There are several different pieces of equipment that were
used to create the experimental set-up, such as, the MultiGen agitator, pH controller, and
temperature controller. Other equipment was used for pre-treatment steps and those included,
the MicroFermentor, a larger scale bio reactor than the MultiGen, used to rinse the apple
pomace. Another piece of equipment used for the pre-treatment in the Unit Operations lab was
the oven, which was used to dry the apple pomace. A One-Touch blood glucose meter was used
to measure the amount of glucose produced during the runs at various time points.
Page 16 of 29
Figure 8: Bench scale bioreactor set-up
The MultiGen agitator came with both 1 liter and 2 liter beakers. The 1 liter beaker was
used for some of the initial runs, then up-scaled to the 2 liter beaker. The pH controller would
maintain the desired pH for each experiment, by adding a 4 or 9 pH buffer depending on
feedback from the pH probe . The MultiGen agitator did come with its own built in water
temperature control, but unfortunately it did not work. For a replacement temperature control,
an electrical temperature controller was used. The controller had a temperature probe and a
heating element that were submerged into the slurry; the probe would give a temperature
reading, while the heating element provides the heat. The temperature controller would be set
at a desired temperature and once the temperature started to stray away, the heating element
would turn on and heat up the slurry until it reached the desired temperature once again.
The MicroFermentor was used for pre-treatment of the apple pomace, by way of
rinsing. The apple pomace would need to be left rinsing for a few hours; afterwards it can be
Page 17 of 29
filtered out. The oven was used for several hours to dry the apple pomace that was both rinsed
and non-rinsed.
Experimental Analysis
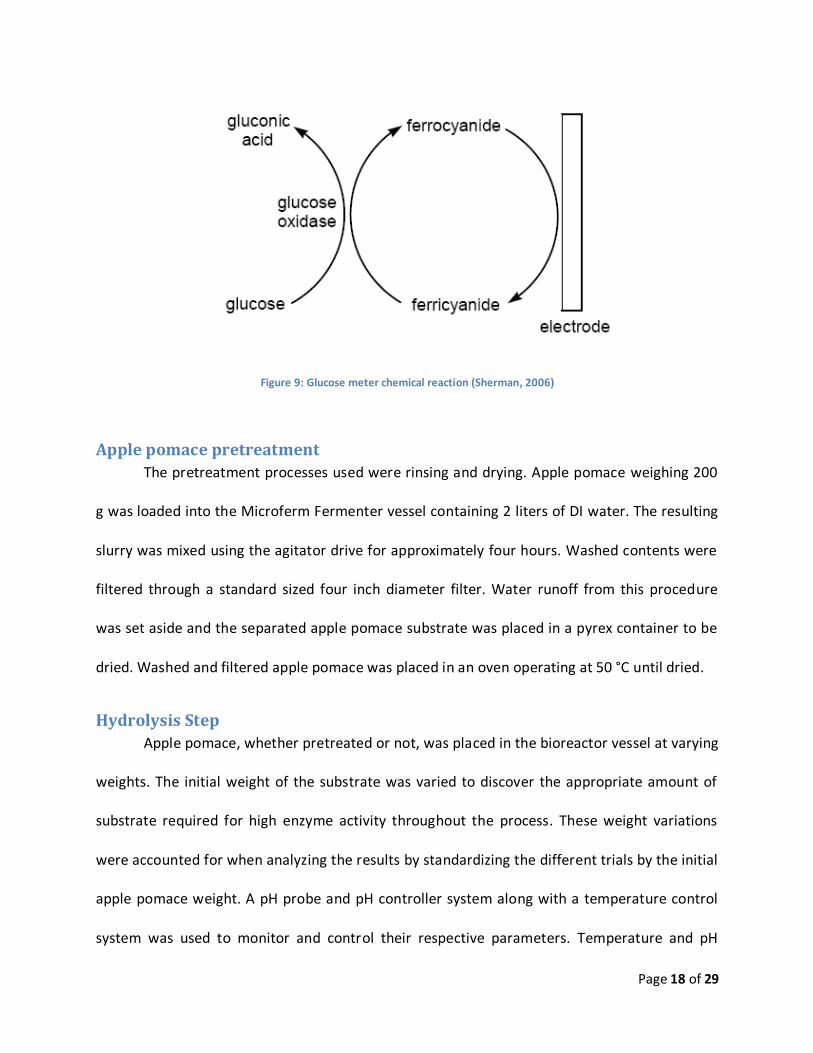
The One-Touch blood glucose meter was used to measure the amount of glucose
produced at the various times throughout the run. The way the meter is able to obtain a
reading is through a process of chemical reactions. First, the glucose in the blood or in the case
of our experiment, the slurry, reacts with the glucose oxidase to form gluconic acid. The
gulconic acid will then react with ferricyanide to form ferrocyanide. The electrode in the meter
then oxidizes the ferrocyanide which will create a current that is directly proportional to the
amount of glucose in the slurry at that specific time point in the experiment. (Sherman, 2006)
Below is a figure of the chemical reaction process. The instrument came with a test solution of
a known glucose concentration to ensure accurate readings from the device. The glucose meter
has a range of 20-600 mg/dL of glucose. If samples gave a reading which was to high, samples
were diluted to provide a reading within the acceptable range. If a sample was to read to low,
the value was recorded as “Lo”.
Page 18 of 29
Figure 9: Glucose meter chemical reaction (Sherman, 2006)
Apple pomace pretreatment
The pretreatment processes used were rinsing and drying. Apple pomace weighing 200
g was loaded into the Microferm Fermenter vessel containing 2 liters of DI water. The resulting
slurry was mixed using the agitator drive for approximately four hours. Washed contents were
filtered through a standard sized four inch diameter filter. Water runoff from this procedure
was set aside and the separated apple pomace substrate was placed in a pyrex container to be
dried. Washed and filtered apple pomace was placed in an oven operating at 50 °C until dried.
Hydrolysis Step
Apple pomace, whether pretreated or not, was placed in the bioreactor vessel at varying
weights. The initial weight of the substrate was varied to discover the appropriate amount of
substrate required for high enzyme activity throughout the process. These weight variations
were accounted for when analyzing the results by standardizing the different trials by the initial
apple pomace weight. A pH probe and pH controller system along with a temperature control
system was used to monitor and control their respective parameters. Temperature and pH
Page 19 of 29
were kept constant at 40 °C and 5, respectively, as recommended by Professor Alex DiIorio.
These parameters were maintained throughout all experiments unless otherwise noted.
Bioreactor contents were allowed to reach the desired operating conditions before the initial
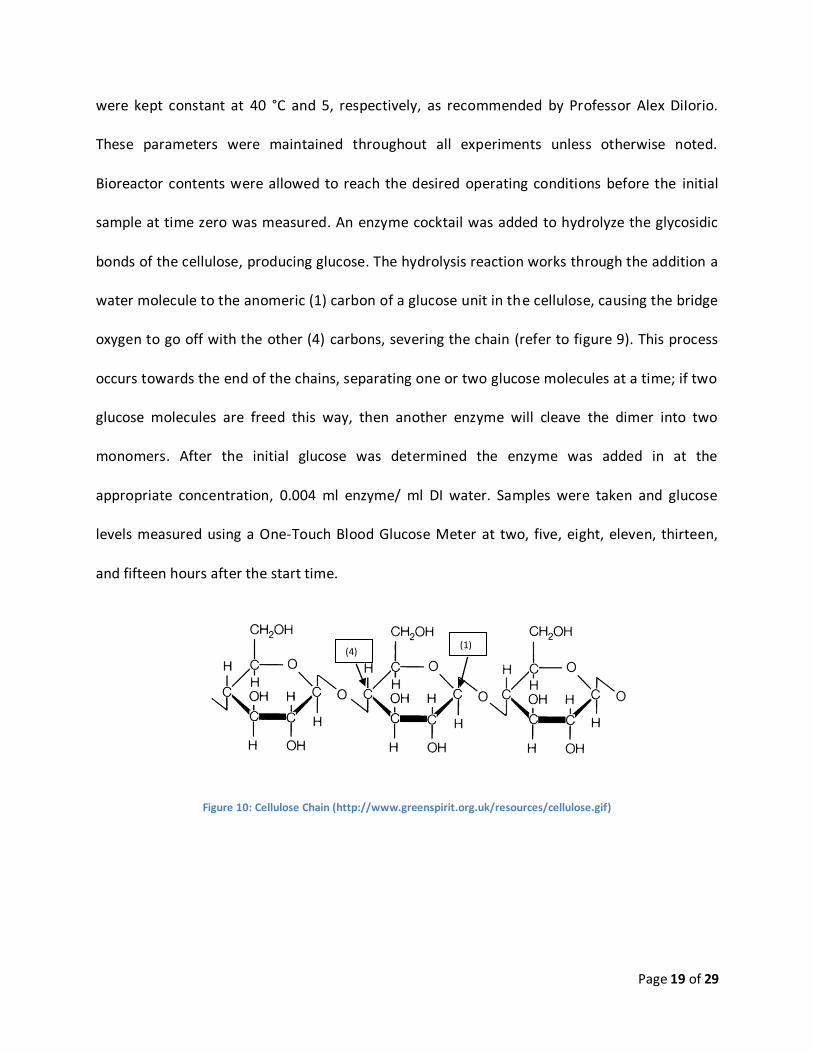
sample at time zero was measured. An enzyme cocktail was added to hydrolyze the glycosidic
bonds of the cellulose, producing glucose. The hydrolysis reaction works through the addition a
water molecule to the anomeric (1) carbon of a glucose unit in the cellulose, causing the bridge
oxygen to go off with the other (4) carbons, severing the chain (refer to figure 9). This process
occurs towards the end of the chains, separating one or two glucose molecules at a time; if two
glucose molecules are freed this way, then another enzyme will cleave the dimer into two
monomers. After the initial glucose was determined the enzyme was added in at the
appropriate concentration, 0.004 ml enzyme/ ml DI water. Samples were taken and glucose
levels measured using a One-Touch Blood Glucose Meter at two, five, eight, eleven, thirteen,
and fifteen hours after the start time.
Figure 10: Cellulose Chain (http://www.greenspirit.org.uk/resources/cellulose.gif)
(1) (4)
Page 20 of 29
Results: In order to standardize the readings for all the different experiments, the results are
shown in the units of:
referred to as mg/g. The glucose obtained from rinsing the apple pomace during pretreatment
is not included in the calculations here of glucose production. The enzyme was added in same
volumetric ratio to the solvent, so the volume of the containers was not taken into account for
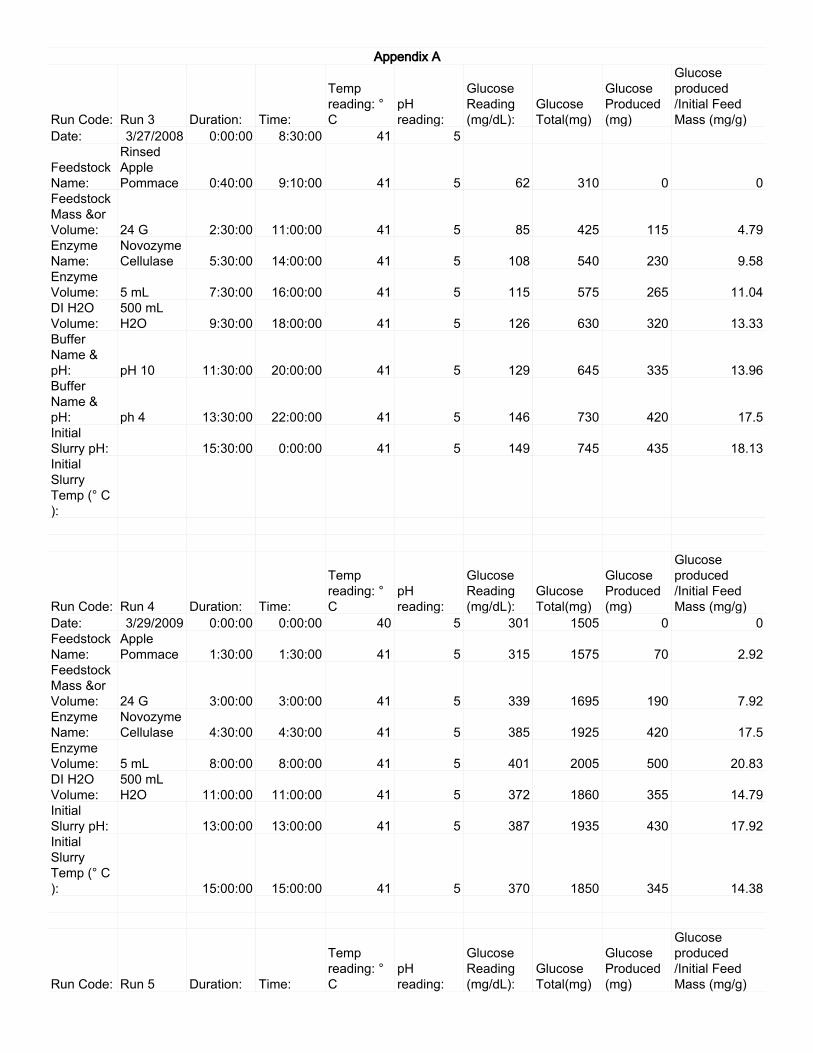
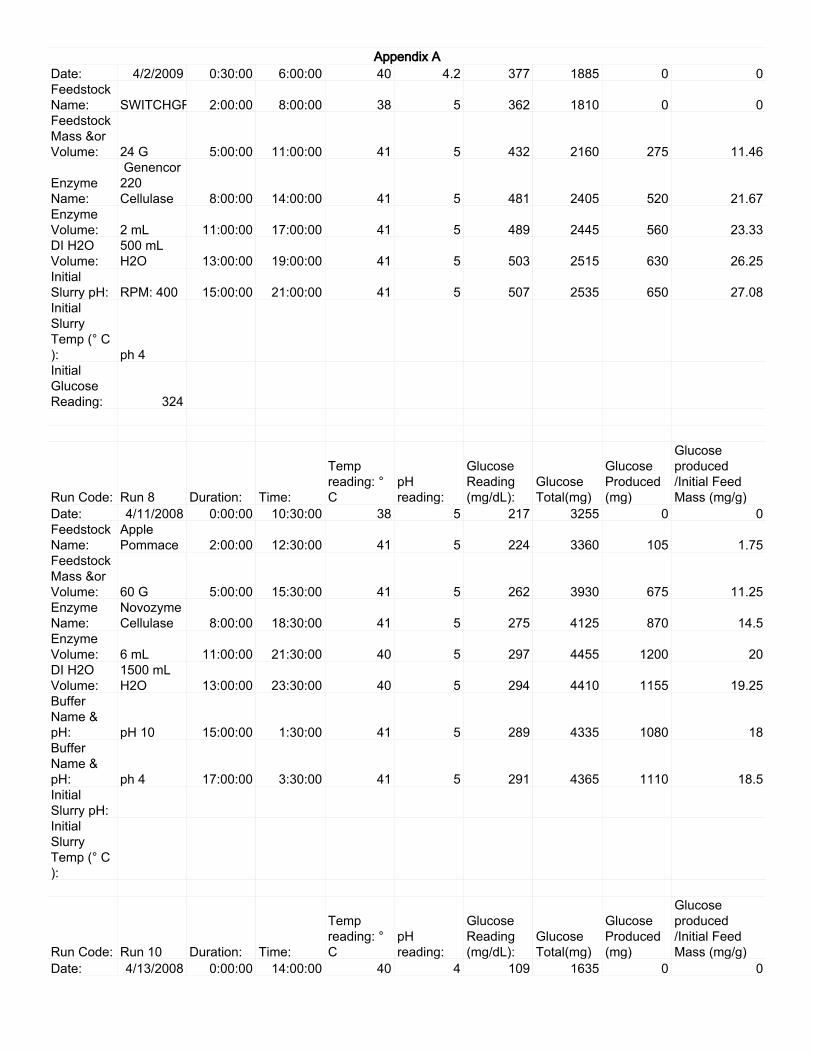
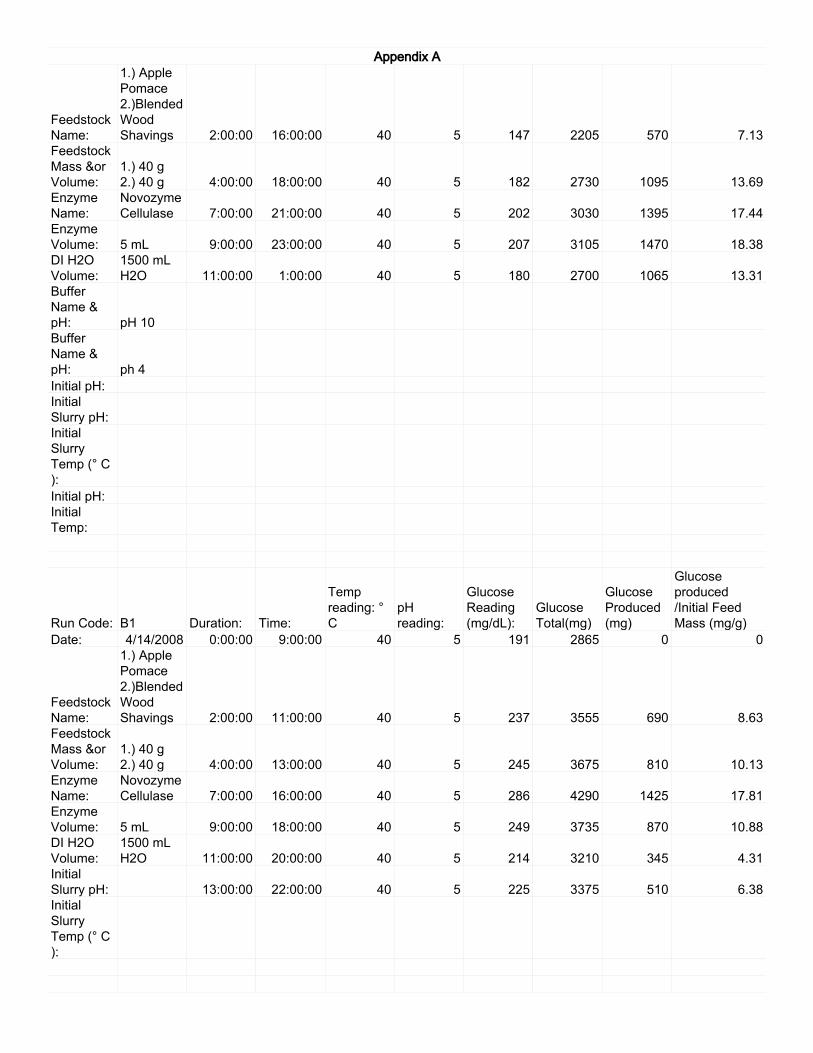
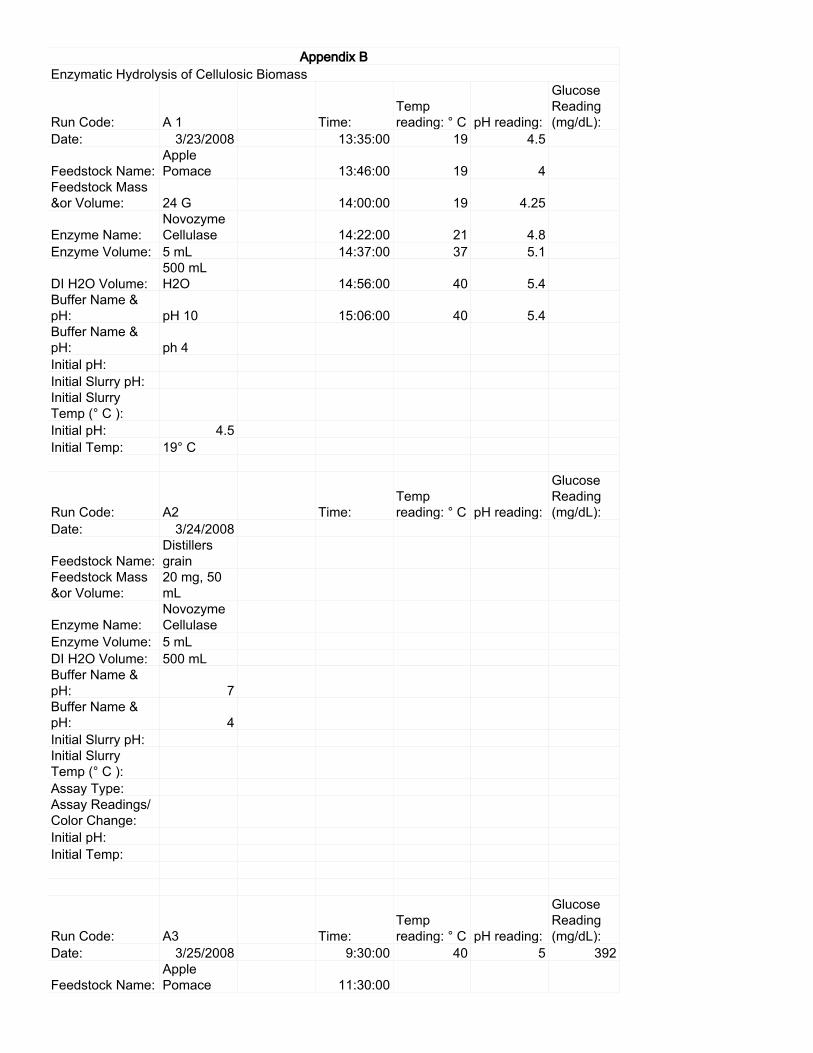
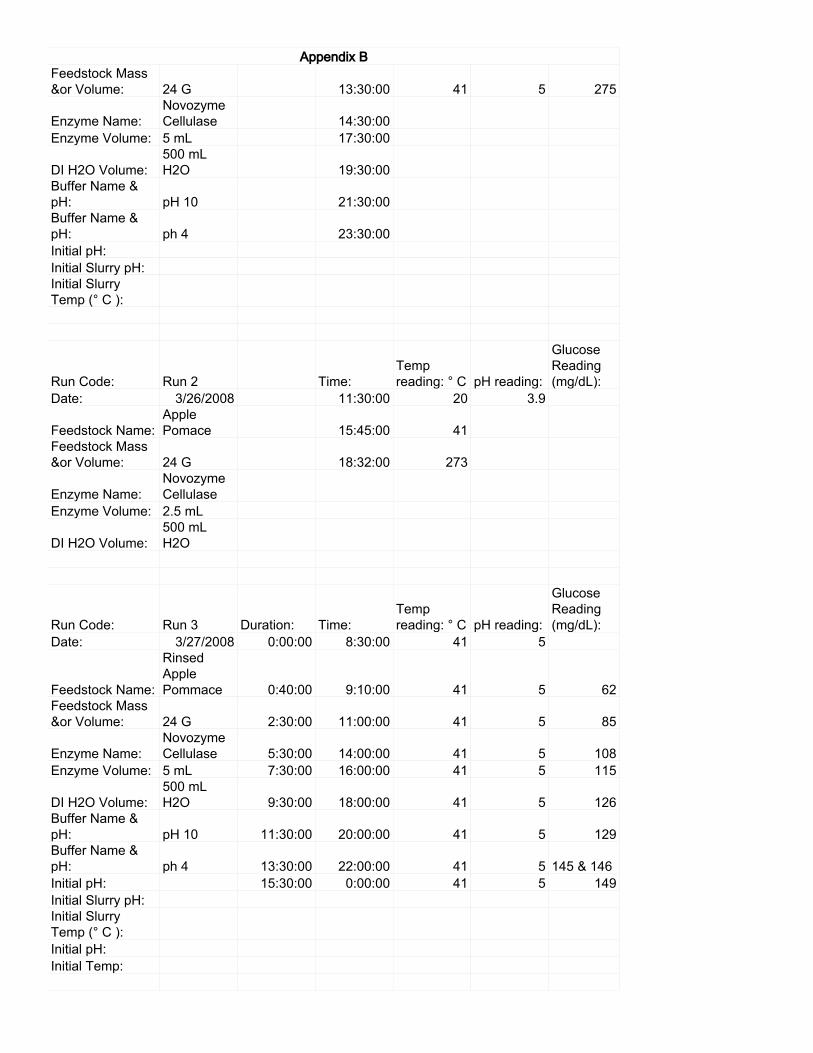
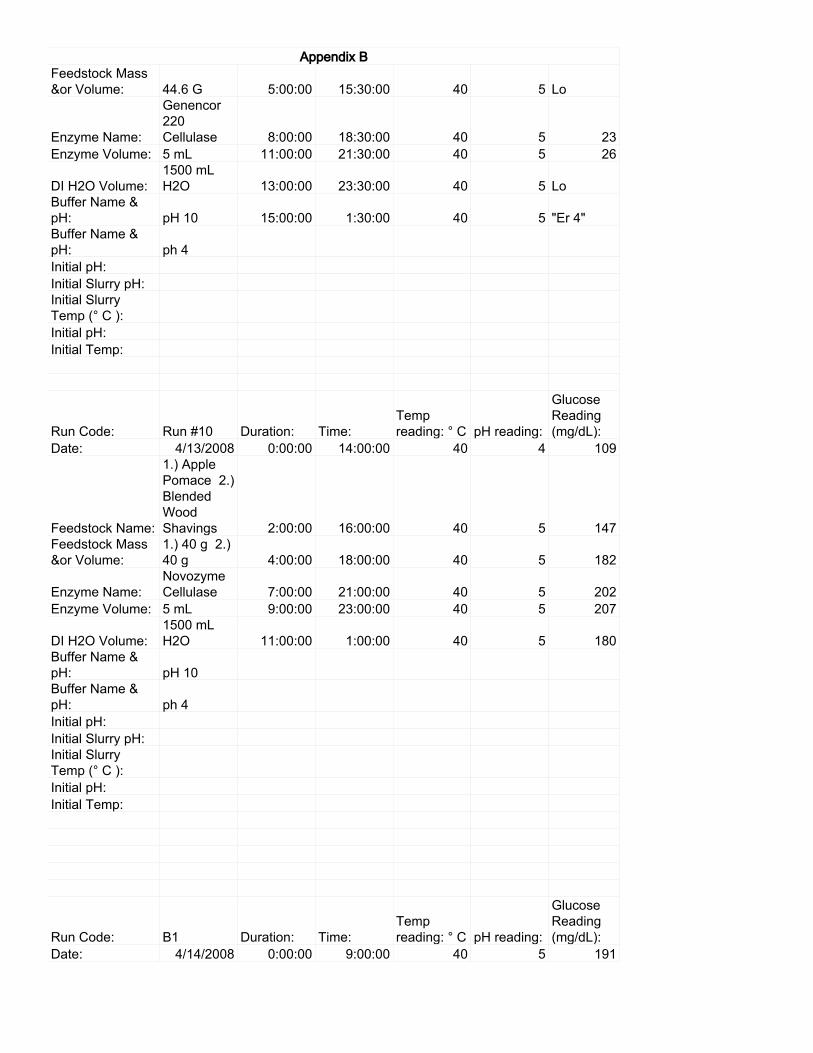
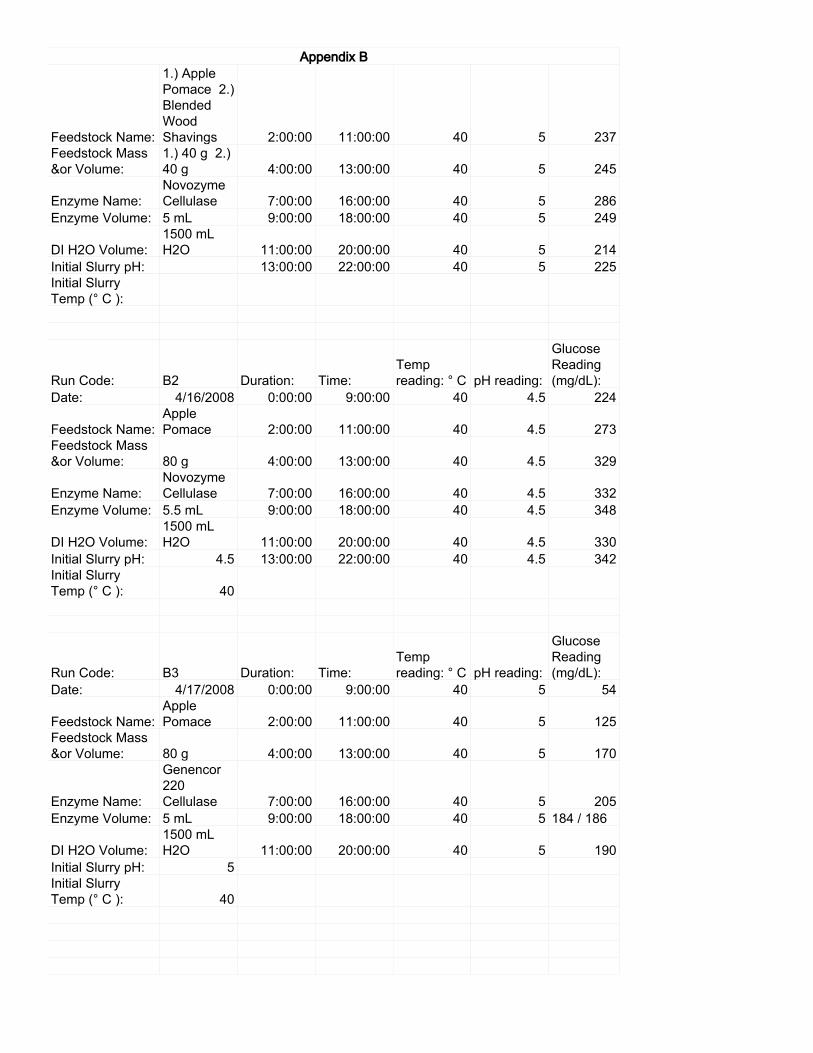
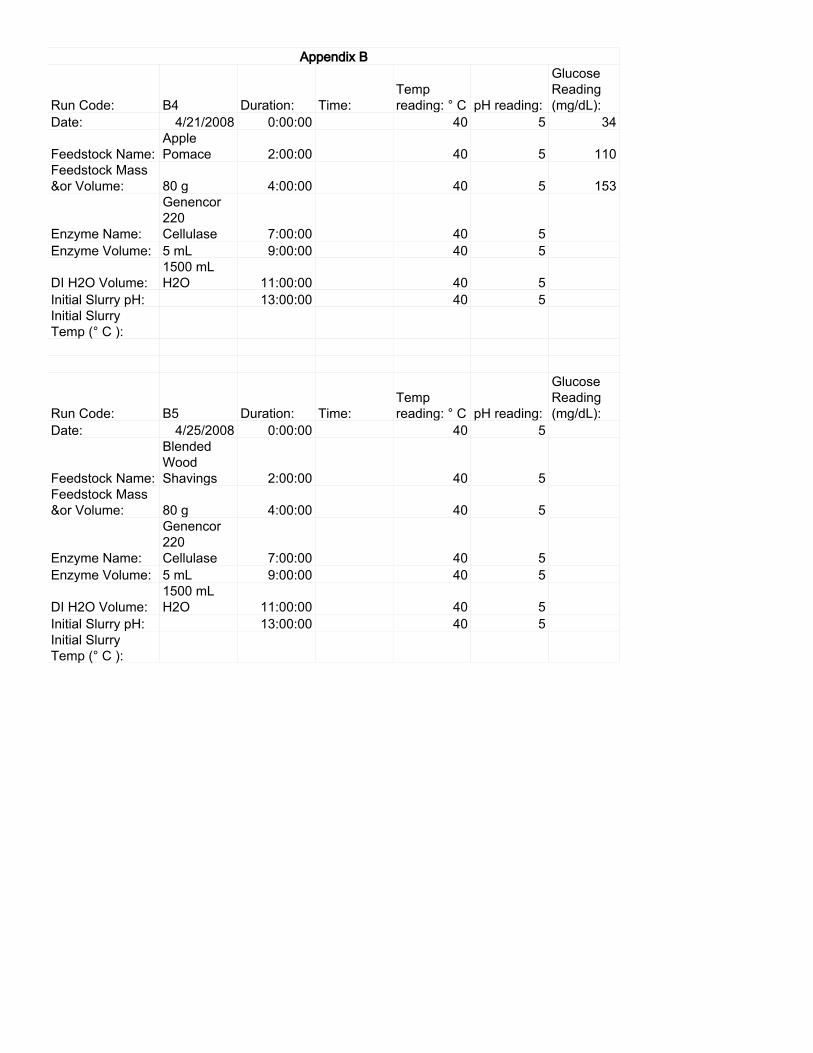
this analysis. All of the runs referred to in this section have all raw data, including operating
conditions and enzymes used, available in Appendix A. The various runs showed a multitude of
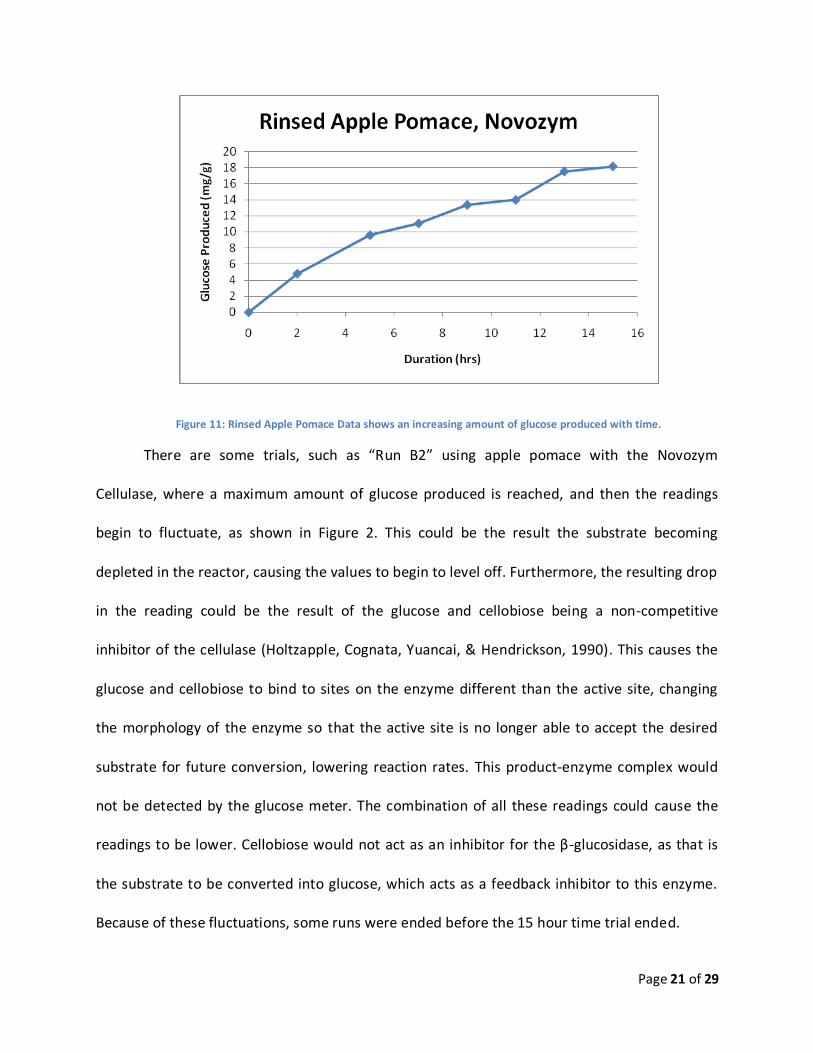
trends. In Figure 1, taken from the data collected from “Run 3” found in Appendix A, it can be
seen that the amount of glucose produced increased with time. This is the expected, normal
result of the data, as the enzymes are able to produce more glucose from the cellulose with a
larger amount of time passing. This is a characteristic seen within all of the data collecting trials.
Page 21 of 29
Figure 11: Rinsed Apple Pomace Data shows an increasing amount of glucose produced with time.
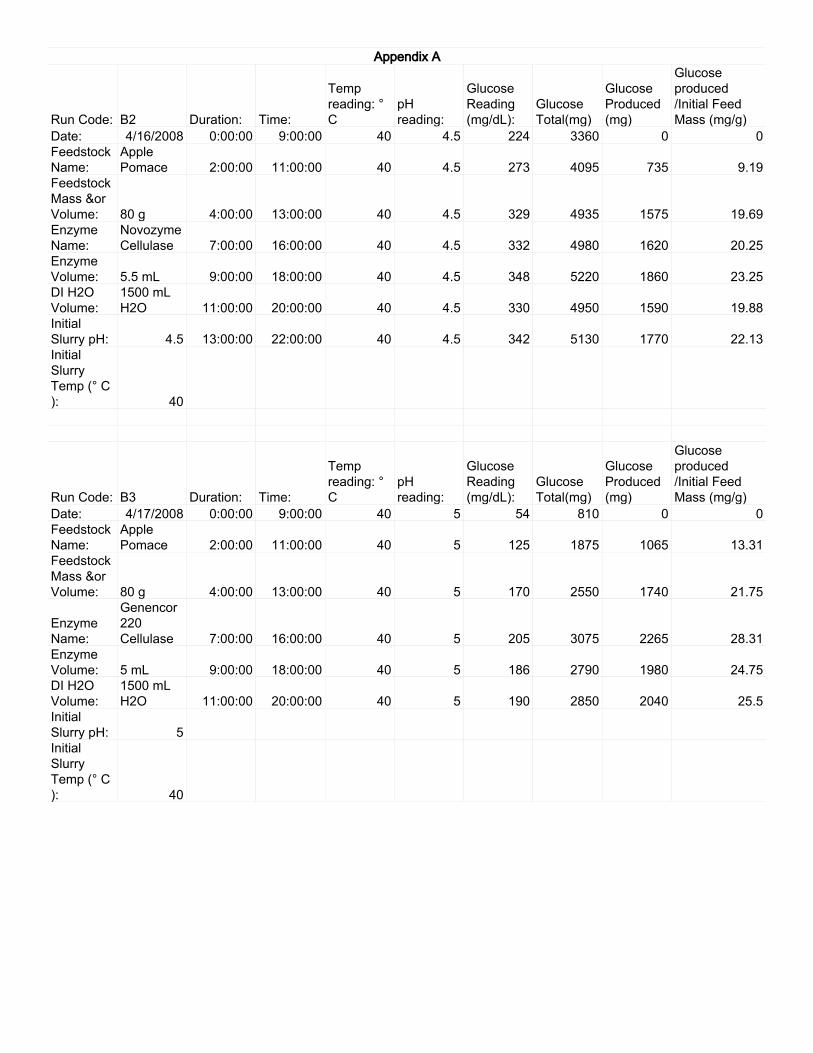
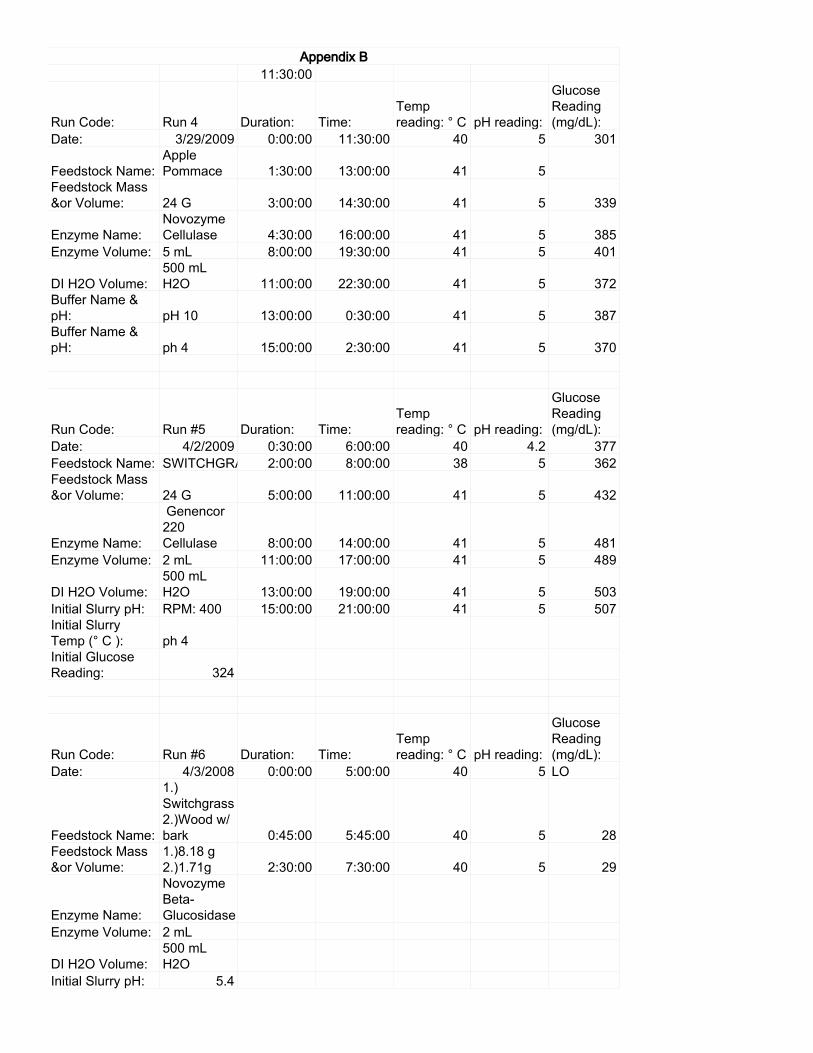
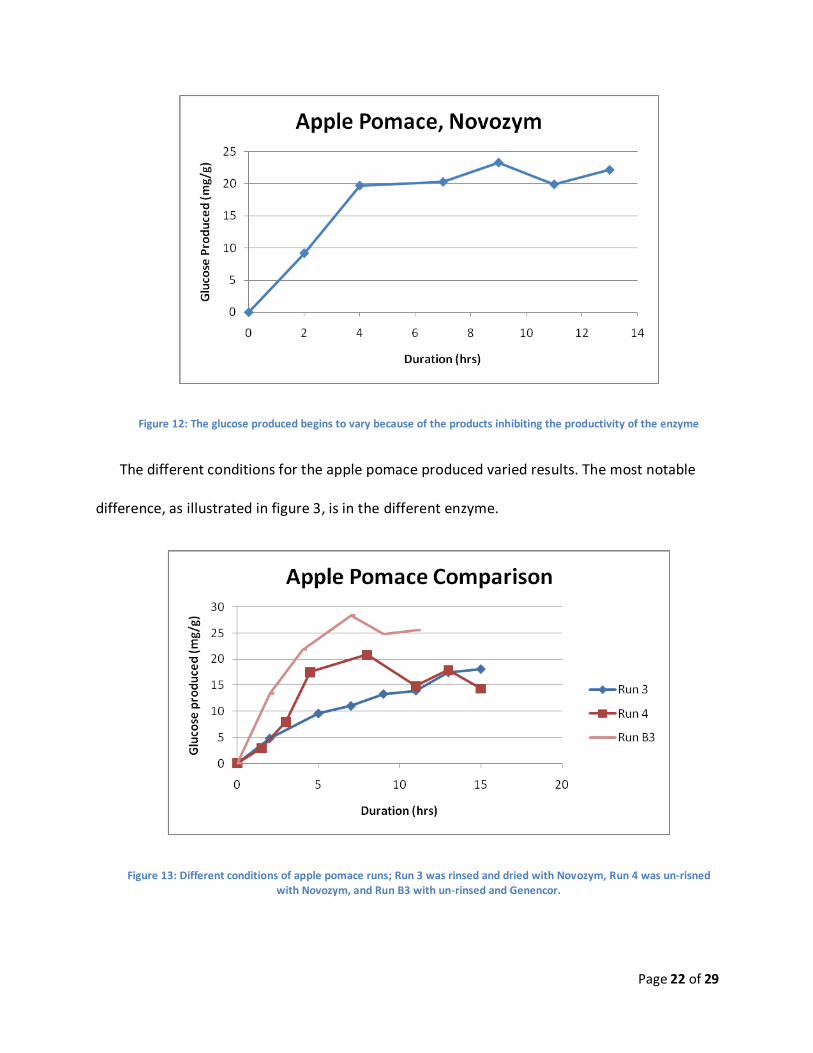
There are some trials, such as “Run B2” using apple pomace with the Novozym
Cellulase, where a maximum amount of glucose produced is reached, and then the readings
begin to fluctuate, as shown in Figure 2. This could be the result the substrate becoming
depleted in the reactor, causing the values to begin to level off. Furthermore, the resulting drop
in the reading could be the result of the glucose and cellobiose being a non-competitive
inhibitor of the cellulase (Holtzapple, Cognata, Yuancai, & Hendrickson, 1990). This causes the
glucose and cellobiose to bind to sites on the enzyme different than the active site, changing
the morphology of the enzyme so that the active site is no longer able to accept the desired
substrate for future conversion, lowering reaction rates. This product-enzyme complex would
not be detected by the glucose meter. The combination of all these readings could cause the
readings to be lower. Cellobiose would not act as an inhibitor for the β-glucosidase, as that is
the substrate to be converted into glucose, which acts as a feedback inhibitor to this enzyme.
Because of these fluctuations, some runs were ended before the 15 hour time trial ended.
Page 22 of 29
Figure 12: The glucose produced begins to vary because of the products inhibiting the productivity of the enzyme
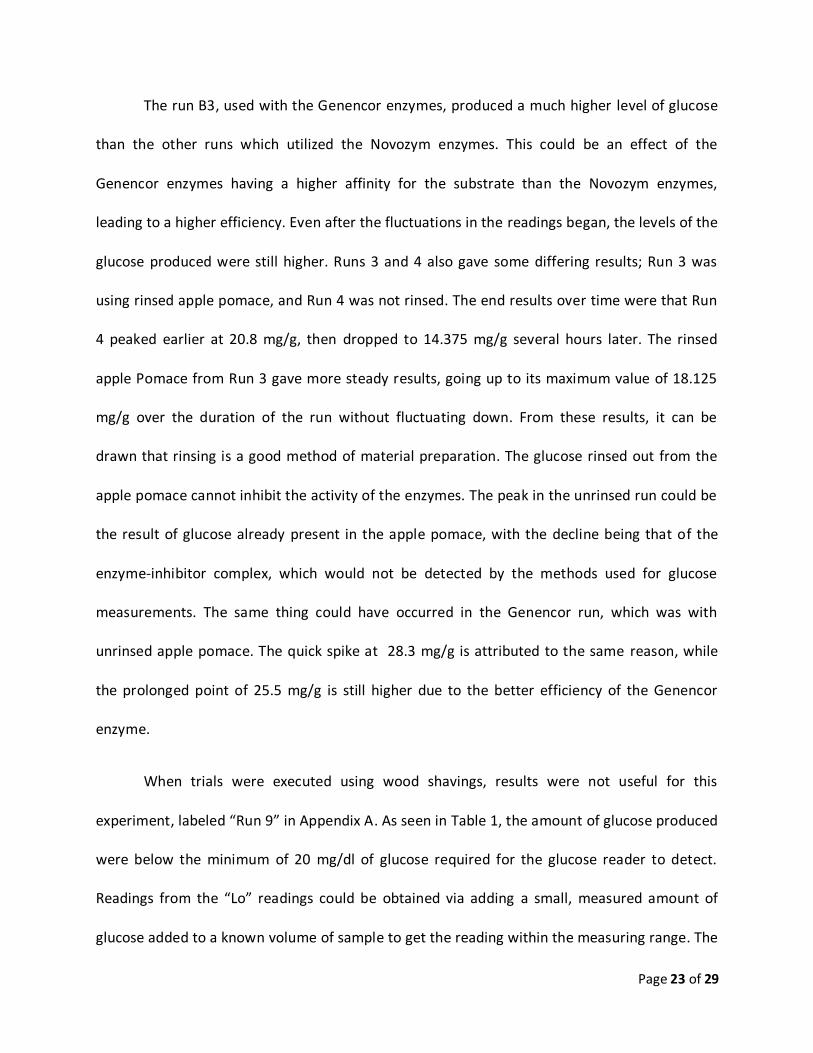
The different conditions for the apple pomace produced varied results. The most notable
difference, as illustrated in figure 3, is in the different enzyme.
Figure 13: Different conditions of apple pomace runs; Run 3 was rinsed and dried with Novozym, Run 4 was un-risned with Novozym, and Run B3 with un-rinsed and Genencor.
Page 23 of 29
The run B3, used with the Genencor enzymes, produced a much higher level of glucose
than the other runs which utilized the Novozym enzymes. This could be an effect of the
Genencor enzymes having a higher affinity for the substrate than the Novozym enzymes,
leading to a higher efficiency. Even after the fluctuations in the readings began, the levels of the
glucose produced were still higher. Runs 3 and 4 also gave some differing results; Run 3 was
using rinsed apple pomace, and Run 4 was not rinsed. The end results over time were that Run
4 peaked earlier at 20.8 mg/g, then dropped to 14.375 mg/g several hours later. The rinsed
apple Pomace from Run 3 gave more steady results, going up to its maximum value of 18.125
mg/g over the duration of the run without fluctuating down. From these results, it can be
drawn that rinsing is a good method of material preparation. The glucose rinsed out from the
apple pomace cannot inhibit the activity of the enzymes. The peak in the unrinsed run could be
the result of glucose already present in the apple pomace, with the decline being that of the
enzyme-inhibitor complex, which would not be detected by the methods used for glucose
measurements. The same thing could have occurred in the Genencor run, which was with
unrinsed apple pomace. The quick spike at 28.3 mg/g is attributed to the same reason, while
the prolonged point of 25.5 mg/g is still higher due to the better efficiency of the Genencor
enzyme.
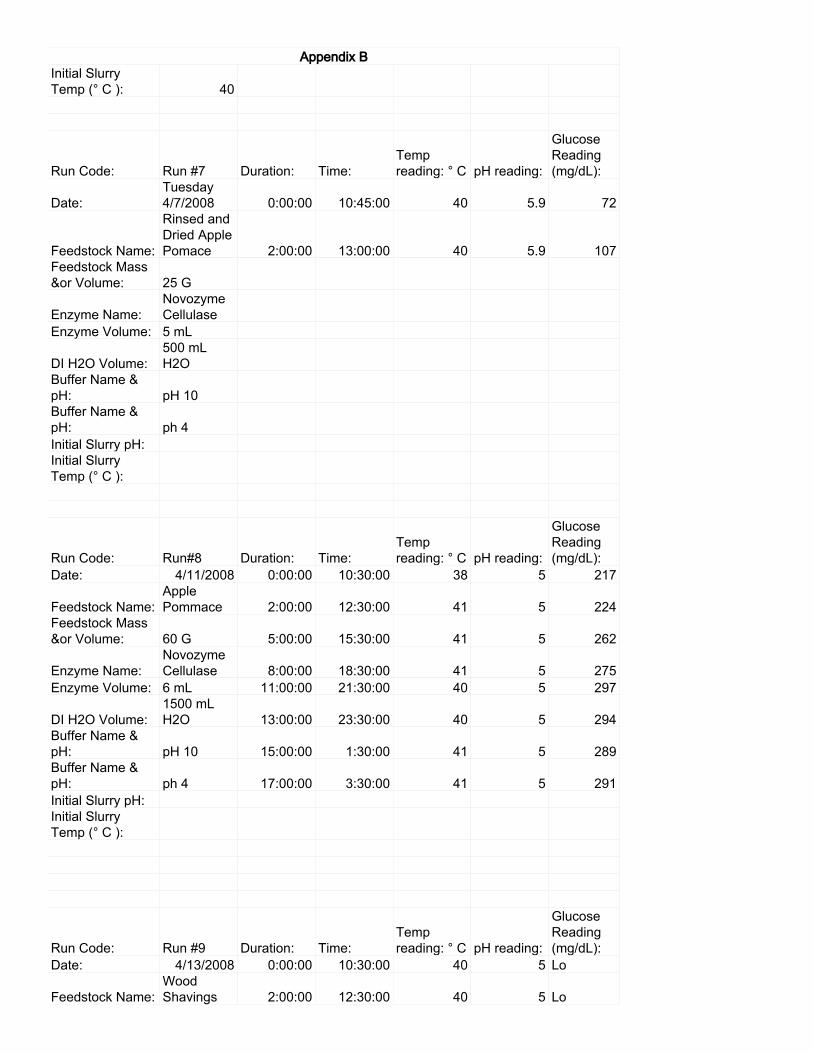
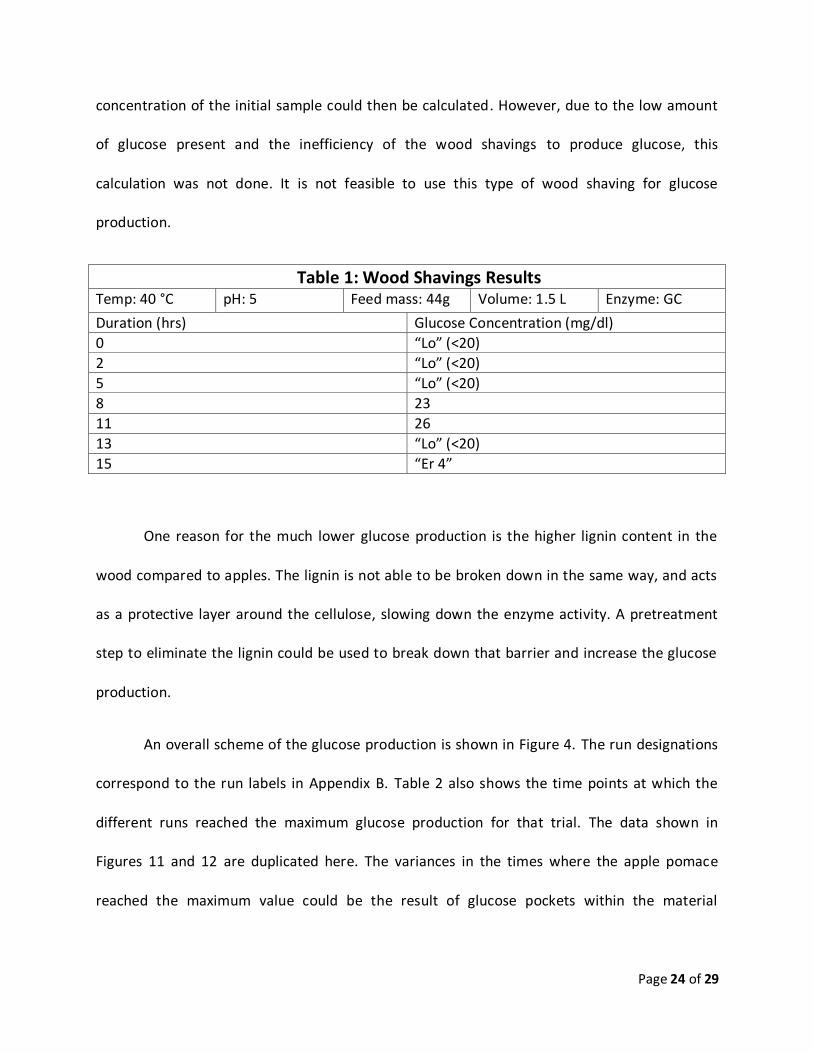
When trials were executed using wood shavings, results were not useful for this
experiment, labeled “Run 9” in Appendix A. As seen in Table 1, the amount of glucose produced
were below the minimum of 20 mg/dl of glucose required for the glucose reader to detect.
Readings from the “Lo” readings could be obtained via adding a small, measured amount of
glucose added to a known volume of sample to get the reading within the measuring range. The
Page 24 of 29
concentration of the initial sample could then be calculated. However, due to the low amount
of glucose present and the inefficiency of the wood shavings to produce glucose, this
calculation was not done. It is not feasible to use this type of wood shaving for glucose
production.
Table 1: Wood Shavings Results Temp: 40 °C pH: 5 Feed mass: 44g Volume: 1.5 L Enzyme: GC
Duration (hrs) Glucose Concentration (mg/dl)
0 “Lo” (<20)
2 “Lo” (<20)
5 “Lo” (<20)
8 23
11 26
13 “Lo” (<20)
15 “Er 4”
One reason for the much lower glucose production is the higher lignin content in the
wood compared to apples. The lignin is not able to be broken down in the same way, and acts
as a protective layer around the cellulose, slowing down the enzyme activity. A pretreatment
step to eliminate the lignin could be used to break down that barrier and increase the glucose
production.
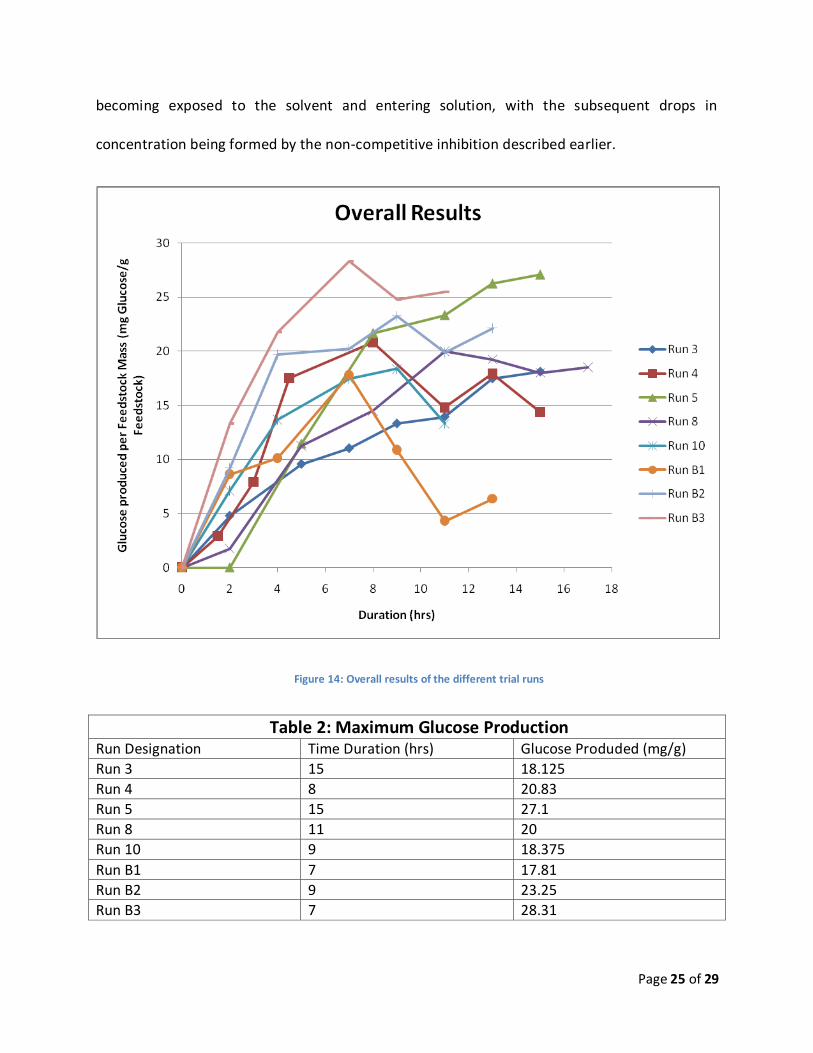
An overall scheme of the glucose production is shown in Figure 4. The run designations
correspond to the run labels in Appendix B. Table 2 also shows the time points at which the
different runs reached the maximum glucose production for that trial. The data shown in
Figures 11 and 12 are duplicated here. The variances in the times where the apple pomace
reached the maximum value could be the result of glucose pockets within the material
Page 25 of 29
becoming exposed to the solvent and entering solution, with the subsequent drops in
concentration being formed by the non-competitive inhibition described earlier.
Figure 14: Overall results of the different trial runs
Table 2: Maximum Glucose Production Run Designation Time Duration (hrs) Glucose Produded (mg/g)
Run 3 15 18.125
Run 4 8 20.83
Run 5 15 27.1
Run 8 11 20
Run 10 9 18.375
Run B1 7 17.81
Run B2 9 23.25
Run B3 7 28.31
Page 26 of 29
Discussion Apple pomace has the capability to produce a usable amount of glucose for future
fermentation into ethanol. For every gram of apple pomace put into the bioreactor,
approximately 0.105 g of glucose can be produced at optimum levels. This output appears
promising, especially since the pomace is regarded as waste by apple companies. At their
maximum, during the fall, Carlson Orchards produces 72 tons of apple pomace per week. If they
were to allot half of that amount to biofuel production, assuming a 60% conversion of glucose
to ethanol, there is the potential of more than 300 gallons of ethanol being produced per week.
Further economic analysis may help to show exactly how beneficial these results can be.
Further analysis of the rinsing process for the apple pomace has some surprising results.
Samples of which to measure the runoff were not available for analysis, so this data must be
inferred from other collected data. By looking at different runs, those with rinsed apple pomace
(3 and B3) had initial glucose concentrations in the range of 50-65 mg/dL, while the initial
glucose concentration of unrinsed apple pomace was much higher, in the range of 250-300
mg/dL. This difference of approximately 200 mg/dL is comparable to the amount of glucose
actually produced by the enzymatic hydrolysis. In an industrial or commercial setting, a
vigorous rinsing process would be desired to have before the actual reactor, so that glucose
recovery and production can be optimized.
The DNS assay could be very useful in producing more accurate results. However, due to
the inability to have it work, this method of glucose detection could not be used. The resulting
mixtures of the reagent and the samples were too dark to be able to generate accurate
Page 27 of 29
readings from the spectrometer. If these readings could be obtained, the overall results of the
experiments could be better.
Conclusion: Based on experimental results, apple pomace has shown to be the best feedstock
among our results for a second generation biofuels production process. This is based on its high
initial level of background sugars which can be removed before hydrolysis and used as
additional feedstock for the fermentation process. This is then added to the other sugar
products of the enzymatic hydrolysis reaction and fermented into cellulosic ethanol.
Experimentation with cellulase enzymes has resulted in an increase in glucose
concentration over time, but readings begin to fluctuate after several hours of operation.
Fluctuations and decreases in glucose concentration are thought to be the results of non-
competitive inhibition of glucose and cellobiose on the cellulase enzymes. The enzymes
produced by Genencor have shown a higher conversion for our substrate than that of the
Novozym cellulases. Further experimentation could help develop an understanding as to why
this occurs. The addition of the enzyme β-glucosidase also drastically increases the production
of glucose, as it hydrolyzes the cellobiose into the two respective monosaccharides desired by
this process.
The rinsing of apple pomace is a crucial step in the production of glucose. It eliminates
the background sugars which can be recovered, allowing for more efficient enzyme activity.
This rinsing has a dual purpose; it removes the enzymatic inhibitors for better production and
reaction rates, and the excess sugars rinsed off can be utilized for fermentation.
Page 28 of 29
Recommendations
The yield of the glucose product from the enzyme catalyzed hydrolysis reaction could be
improved by altering the process in several ways. Conversion improvements could be made
through the addition of further pre-treatment of the feed stocks, experimentation with various
enzyme cocktails, and also using more up-to-date and efficient equipment.
It was found that the implementation of a feed stock pretreatment step would provide
better experimental data than it would if the feed were not pre-treated. Also, when running the
experiments, it was found that certain enzymes would provide better results with specific feed
stocks. So, finding the most productive enzyme cocktails for specific feed stocks would be best.
The equipment used in the lab provided some problems during the experiments. It was
extremely hard to obtain replacement parts for some equipment, such as the MultiGen
agitator. Even though the equipment set-up was complete, MultiGen’s temperature controls
did not work, and a lot of time and effort was put into the equipment setup instead of
experimentation. Also, if there was a more efficient filtering process to use when removing the
rinse-off water after pre-treating the apple pomace feed, the process would have been much
improved. This would allow for higher retention of substrate; it seemed some of the substrate
had still passed through the filter and may have affected readings. Following through with
these recommendations would make these experiments more effective for future students and
much more efficient of a conversion process.
Page 29 of 29
Works Cited Bergman, Richard, and John Zerbe. "Primer on Wood Biomass for Energy." USDA Forest Service. Jan.
2008. USDA.
<http://www.fpl.fs.fed.us/tmu/resources/documents/primer_on_wood_biomass_for_energy.p
df>.
Besler, Matthias Composition of Apple, 1999
<http://www.food-allergens.de/symposium-vol1(3)/data/apple/apple-composition.htm>
“Cellulase.” Worthington Enzyme Manual. Worthington Biochemical Corporation, 1993
"Energy and Greenhouse Gas Emissions Impacts of Fuel Ethanol." Chart. Argonne National Laboratory.
Center for Transportation Research: Michael Wang. August 23, 2005
Holtzapple, Mark, Cognata, Mona, Shu, Yuancai, and Hendrickson, Christie. “Inhibition of Trichoderma
ressei cellulase by sugars and solvents.” Biotechnology and Bioengineering, Volume 36, Issue 3
pg. 275-287. John Wiley & Sons, 1990
Regulatory Impact Analysis: Renewable Fuel Standard Program." EPA. 20 Apr. 2007. EPA. 8 Mar.-Apr.
2008 <http://www.epa.gov/otaq/renewablefuels/420r07004.pdf>.
Sherman, Marie “How do blood glucose meters work?” Chem 13 News, Issue 343 p. 5-6, Dec. 2006
Thomson, Alexander. "An Investigation Into the Implications of Using Very Wet Biomass as a Fuel" Sept.
2006. University of Strathclyde Mech. Eng. Dept.
<http://www.esru.strath.ac.uk/Documents/MSc_2006/thomson.pdf>.
Zacchi, G., and M. Galbe. "A Review of the Production of Ethanol From Softwood." Springer- Verlag. 17
July 2002. Dept. of CHE Lund University, Sweden. 04 Mar.-Apr. 2008
<http://www.springerlink.com/content/94bkt3ntvflxgyyq/fulltext.html>.