Embed Size (px)
Citation preview
Enzymatic assay of opioid analgesic, tramadol, using horseradish peroxidase
N. Sridevi1, Ch. Srilakshmi2, G. Alekya3, C. Bala Sekaran4,* 1Department of Science and Humanities, Siva Rama Krishna Institute of Technology,
Enikepadu - 521 108, Andhra Pradesh, India
2Department of Environmental Sciences, Dhanekula Institute of Engineering and Technology, Vijayawada - 521 139, Andhra Pradesh, India
3Department of Science and Humanities, NRI Institute of Technology, Pothavarappadu - 521211, Andhra Pradesh, India
4Department of Biotechnology, Jagarlamudi Kuppuswamy Choudary College, Guntur - 522 006, Andhra Pradesh, India
*E-mail address: [email protected] ABSTRACT
Three novel and sensitive enzymatic methods have been developed for the quantification of tramadol in pharmaceutical dosage forms. The proposed methods are based on the reaction of tramadol with 3-methylbenzothiazoline-2-one hydrazone (method A), aniline (method B) and aminoantipyrine in the presence of hydrogen peroxide and horseradish peroxidase to give colored complexes. The colored complexes obtained with 3-methylbenzothiazoline-2-one hydrazone, aniline and aminoantipyrine exhibit absorption maxima at 480 nm, 550 nm and 530 nm, respectively. Regression analysis of Beer’s plots showed good correlation for tramadol in the concentration range (μg/mL) 2-12 for the methods A & B and 4-24 for the method C. The experimental parameters were studied and optimized. The precision and accuracy of the methods were satisfactory. The proposed methods were successfully applied for the quantification of tramadol in 3 brands of commercially available tablet dosage forms. The results were compared satisfactorily with the official method.
Keywords: Tramadol; Horseradish peroxidase; Coupling agents; Analysis
1. INTRODUCTION
Tramadol (TDL) [1,2] is a centrally acting opioid analgesic used in the management of moderate to moderately severe pain. When treatment is needed around the clock, TDL extended-release is used to treat moderate to severe chronic pain. Tramadol is a synthetic analog of codeine and has a significantly lower affinity for opioid receptors than codeine. Tramadol is used to treat postoperative [3], chronic noncancer [4] and acute musculoskeletal pain [5] and as an adjuvant to NSAID therapy in patients with osteoarthritis [6,7]. The mode of action of TDL is not completely understood. Tramadol and its O-desmethyl metabolite are selective, weak μ-opioid receptor agonists [8-10]. The analgesic [11-14] properties of TDL
International Letters of Natural Sciences Online: 2014-05-30ISSN: 2300-9675, Vol. 16, pp 69-84doi:10.18052/www.scipress.com/ILNS.16.69© 2014 SciPress Ltd., Switzerland
SciPress applies the CC-BY 4.0 license to works we publish: https://creativecommons.org/licenses/by/4.0/
can be attributed to norepinephrine and serotonin reuptake blockade in the central nervous system, which inhibits pain transmission in the spinal cord.
The TDL is official in European pharmacopoeia [15] which describes potentiometric method for its assay. The literature survey reveals spectrofluorimetry [16], HPLC with DAD detection [17], HPLC with UV detection [18-20], HPLC with fluorescence detection [21-24], LC/PDA-ESI-MS/MS [24], potentiometry [25,26], square-wave voltammetric method with amperometric detection [27], gas chromatography with mass spectrophotometer [28,29], gas chromatography with nitrogen–phosphorus detection [30], HPTLC [31-33] have been employed for the quantification of TDL in pharmaceutical preparations and biological fluids.
In literature, only a few visible spectrophotometric methods have been reported for the determination of TDL in commercial dosage forms. Abdellatef [34] described two kinetic spectrophotometric methods for the determination of TDL in commercial capsule and ampoule dosage form. The first method is based upon a kinetic investigation of the oxidation reaction of the drug with alkaline potassium permanganate at room temperature for a fixed time at 20 min. The second method is based on the reaction of TDL with 4-chloro-7-nitrobenzofurazan in presence of 0.1 M sodium bicarbonate. Tramadol after dissolving in distilled water exhibits an absorbance maximum at 270 nm and this property has been exploited by Aysel Küçük and Yücel Kadıoğlu [17] to develop a UV spectrophotometric method for its quantitation in pharmaceutical ampoule forms. The quantitation of TDL was done in the visible region based on ion-pair formation between drug and reagents like bromophenol blue [35], thymol blue [35], bromocresol green [36] and bromothymol blue [36] in acidic medium. It is better to avoid developing the assay procedure using extractive methods to minimize the use of organic solvents such as chloroform, which cause harmful effects on human life. There is also a possibility of the loss of analyte and other handling problems in developing extractive spectrophotometric methods.
The spectrofluorimetry [16], HPLC with DAD detection [17], HPLC with UV detection [18-20], HPLC with fluorescence detection [21-24], LC/PDA-ESI-MS/MS [24], potentiometry [25,26], square-wave voltammetric method with amperometric detection [27], gas chromatography with mass spectrophotometer [28,29], gas chromatography with nitrogen–phosphorus detection [30], HPTLC [31-33] methods reported for the determination of TDL are sensitive enough but require expensive or sophisticated instruments, involve procedures with rigorous control of the experimental conditions, require long and tedious pretreatment of the samples and laborious clean up procedures prior to analysis and are not simple for routine analysis. However, spectrophotometric methods are particularly attractive because of ease in accessibility and their quick applicability to routine analysis. Spectrophotometry is the technique of choice even today due to its inherent simplicity. It is frequently used in the laboratories of the developing countries for the routine analytical work.
The literature on enzymatic assay of TDL in bulk and pharmaceutical dosage form is very poor. The present investigation, for the first time, describes three novel, sensitive, simple, accurate and precise enzymatic methods (A, B and C) for the determination of TDL in bulk and pharmaceutical dosage forms. The proposed methods are based on the oxidative coupling of TDL with coupling agents, 3-Methylbenzothiazoline-2-one hydrazone (method A), Aniline (method B) and 4-Aminoantipyrine (method C) in the presence of horseradish peroxidase and hydrogen peroxide. The results of the analysis were validated by statistical analysis and recovery studies according to International Conference on Harmonization [37] guidelines for validation of analytical procedures.
70 Volume 16
2. EXPERIMENTAL 2. 1. Apparatus An ELICO Model SL-159 double beam, UV-VIS spectrophotometer with 1.0 cm
matched quartz cells was used for all absorbance measurements. Hydrogen ion concentration (pH) of the solutions was determined by Systronics
digital pH meter. Extraction of peroxidase from horseradish was done by using Remi desktop
centrifuge with 24,000 rpm. Homogenizer with a high speed blender 3-4 x 15 sec. was used for homogenization of
horseradish root.
2. 2. Materials and Reagents All chemicals were of analytical reagent grade. Double distilled water was used to
prepare all solutions. 2. 2. 1. For the assay of TDL 0.2 % (w/v) 3-Methylbenzothiazoline-2-one hydrazone (MBTH): Prepared by
dissolving 200 mg of MBTH (Himedia lab pvt Ltd, Mumbai, India) in 100 mL of distilled water.
1 % (v/v) Aniline (ANL): Dilute 1 mL of ANL (Merck, Mumbai, India) to 100 mL with distilled water.
2 % (w/v) 4-Aminoantipyrine (AP): Prepared by dissolving 2 gm of AP (sd Fine-Chem Ltd, Mumbai, India) in 100 mL of distilled water.
0.01M Hydrogen peroxide: Prepared by dissolving 0.1 mL of 30 % H2O2 (Merck, Germany) in 200 mL of distilled water just prior to experiments.
0.1 M Phosphate buffer (pH 7.0): Buffer was prepared by diluting 39 mL of 0.5 M KH2PO4 [prepared by dissolving 6.81 g of KH2PO4 (sd Fine-Chem Ltd, Mumbai, India) in 100 mL of distilled water] and 53.6 mL of 0.5 M NaH2PO4 [prepared by dissolving 7.1 g of Na2HPO4 (sd Fine-Chem Ltd, Mumbai, India) in 100 mL of distilled water] to 1000 mL with distilled water at 25 °C.
2. 2. 2. For the assay of horseradish peroxidase 0.018 M Guaiacol: Aqueous solution of Guaiacol (Merck, Germany) was prepared by
dissolving 223 mg of guaiacol in 100 mL of distilled water. Store on ice and prepare fresh daily.
Substrate solution: Dilute 0.1 mL 30 % H2O2 (Merck, Germany) with distilled water to 120 mL and adjust absorbance at 240 nm in 1 cm light path to 0.4 to 0.41 versus distilled H2O. Store the solution on ice and prepare fresh daily.
Potassium Phosphate Buffer (pH 7.0): Dissolve 0.53 gm KH2PO4 (sd Fine-Chem Ltd, Mumbai, India) and 1.06 gm K2HPO4 (sd Fine-Chem Ltd,Mumbai, India) in distilled H2O, check pH to 7.0 and dilute to 100 mL. Store buffer on ice and equilibrate buffer at 25 °C.
2. 3. Market samples of TDL Zotadol-DT tablets, Manufactured by Zota pharma, Surat, India, labeled to contain 50
mg TDL
International Letters of Natural Sciences Vol. 16 71
Urgendol tablets, Manufactured by Win medicare, New Delhi, India, labeled to contain 50 mg TDL.
Cemedol tablets, Manufactured by Life Medicare, New Delhi, India, labeled to contain 100 mg TDL.
2. 4. Preparation of stock and working standard solutions
A stock standard solution of TDL (1 mg/1 mL) was prepared by dissolving pure TDL in double distilled water. Working standard solutions were prepared by suitable dilution of the stock standard solution with double distilled water to get a concentration of 100 μg/mL (for method A) and 200 μg/mL (for methods B and C).
2. 5. Isolation of Horseradish peroxidase (HRP)
A turnip (Horseradish root) weighing 40 gm was peeled, washed, and cut into 1" cubes. The sliced pieces were homogenized in 200 mL of buffer in a blender at high speed for 15 min. The extract is clarified by centrifugation (10-15,000 rpm/10 min.) and filtered through Whatman No. 1 filter paper. The extract for stability was stored in toluene for at least a week at 4 °C. The extract was suitably diluted with potassium phosphate buffer for further enzyme assay and with 0.1 M phosphate buffer for experimental analysis.
2. 6. Assay of HRP
The assay of HRP is based on that of Bergmeyer [38], in which the rate of decomposition of hydrogen peroxide by peroxidase is determined by measuring the rate of color development spectrophotometrically at 436 nm and at 25 °C in the presence of guaiacol as hydrogen donor. The enzyme activity is expressed in terms of Guaiacol units (1 Guaiacol unit = Amount of enzyme which catalyses the conversion of one micromole of H2O2 per minute at 25 °C).
2. 7. Recommended procedures
After systematic and detailed study of the various parameters involved as described under results and discussions the following procedures were recommended for the determination of TDL in bulk and tablet dosage forms.
2. 7. 1. General assay procedure for TDL (methods A, B and C)
Into a series of 10 mL calibrated flasks, 3 mL of buffer (pH 7.0) solution, 1.5 mL coupling agent [0.2 % MBTH (method A), 1 % ANL (method B), 2 % 4 –AP (method C)], 1.5 mL of H2O2 (0.01 M) and 1 mL enzyme extract (1.6 Guaiacol units) and aliquots of working TDL [0.2-1.2 mL (methods A, B and C)] solution were added and brought up to the volume with buffer.
The tubes were incubated at room temperature for 30 min (methods A and B) or 15 min (method C). The absorbance of the colored chromogens (TDL-MBTH complex-method A; TDL-ANL complex-method B; TDL-AP complex-method C) was measured at 480 nm, 550 nm and 530 nm against reagent blank, prepared similarly omitting the drug, for methods A, B and C respectively. The amount of the TDL in the sample solution was computed from the corresponding calibration graph or using the corresponding regression equation.
72 Volume 16
2. 7. 2. Assay procedure for pharmaceutical dosage forms For the analysis of TDL in pharmaceutical dosage forms, three brands of commercially
available tablets were weighed and ground into a fine powder. An accurately weighed portion of the powder equivalent to 100 mg of TDL was transferred into a 100 mL beaker containing small volume of water and the solution was shaken thoroughly for 10-15 minutes and filtered through a Whatman filter paper no.1 to remove the insoluble matter. The filter paper was washed with water and the washings were added to the filtrate, the final volume (100 mL) was made with water. It was further diluted according to the need and then analyzed following the respective proposed methods (methods A, B and C). The nominal content of TDL in the tablets was calculated either from a previously plotted calibration graph or using the regression equation. 3. RESULTS AND DISCUSSION 3. 1. Chemistry of the colored species
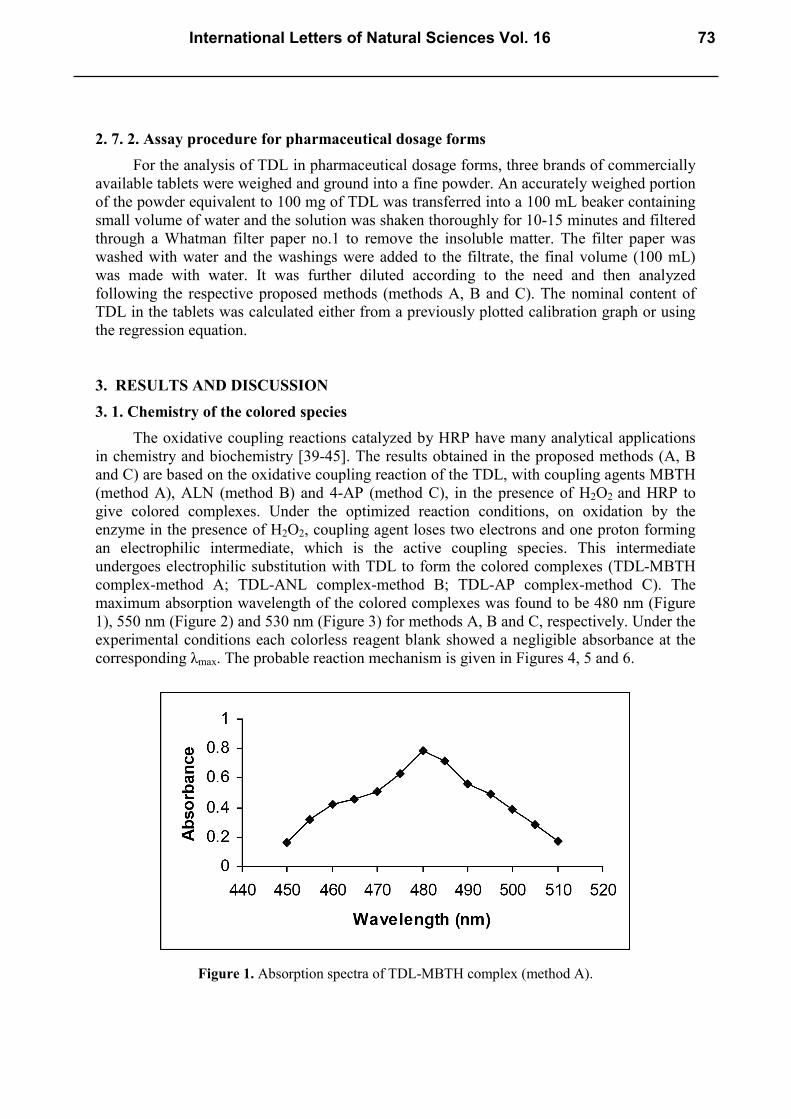
The oxidative coupling reactions catalyzed by HRP have many analytical applications in chemistry and biochemistry [39-45]. The results obtained in the proposed methods (A, B and C) are based on the oxidative coupling reaction of the TDL, with coupling agents MBTH (method A), ALN (method B) and 4-AP (method C), in the presence of H2O2 and HRP to give colored complexes. Under the optimized reaction conditions, on oxidation by the enzyme in the presence of H2O2, coupling agent loses two electrons and one proton forming an electrophilic intermediate, which is the active coupling species. This intermediate undergoes electrophilic substitution with TDL to form the colored complexes (TDL-MBTH complex-method A; TDL-ANL complex-method B; TDL-AP complex-method C). The maximum absorption wavelength of the colored complexes was found to be 480 nm (Figure 1), 550 nm (Figure 2) and 530 nm (Figure 3) for methods A, B and C, respectively. Under the experimental conditions each colorless reagent blank showed a negligible absorbance at the corresponding λmax. The probable reaction mechanism is given in Figures 4, 5 and 6.
Figure 1. Absorption spectra of TDL-MBTH complex (method A).
International Letters of Natural Sciences Vol. 16 73
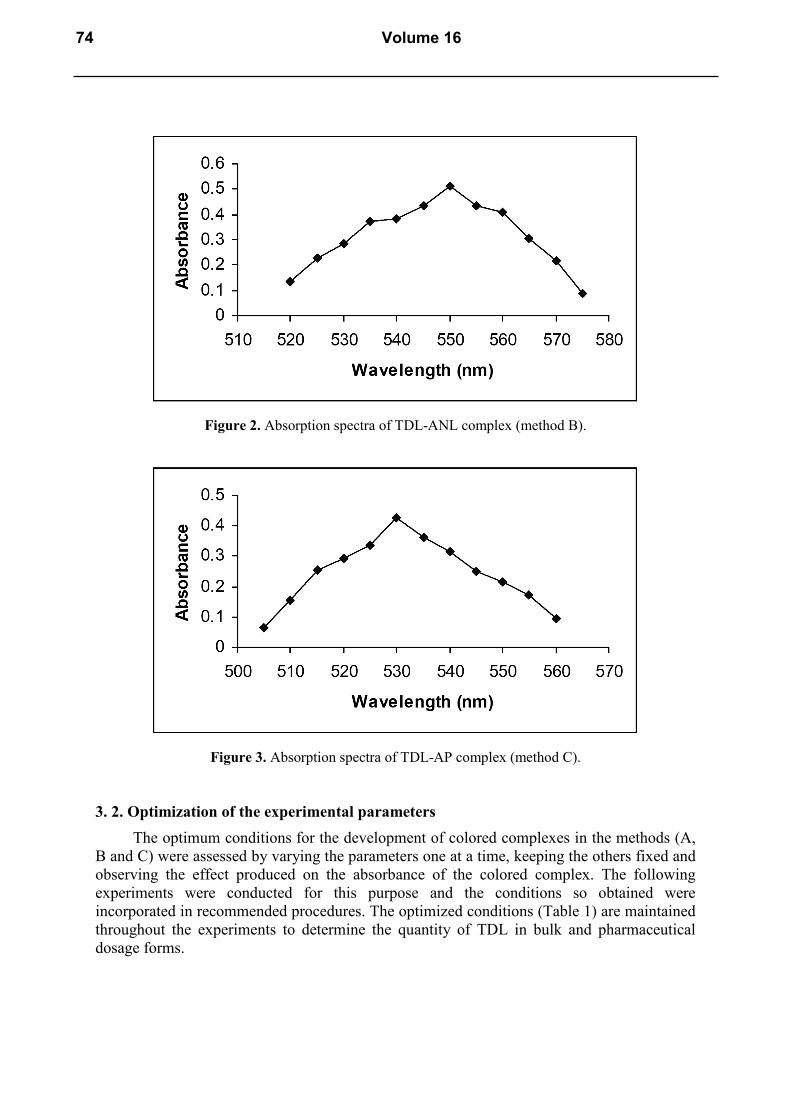
Figure 2. Absorption spectra of TDL-ANL complex (method B).
Figure 3. Absorption spectra of TDL-AP complex (method C).
3. 2. Optimization of the experimental parameters The optimum conditions for the development of colored complexes in the methods (A,
B and C) were assessed by varying the parameters one at a time, keeping the others fixed and observing the effect produced on the absorbance of the colored complex. The following experiments were conducted for this purpose and the conditions so obtained were incorporated in recommended procedures. The optimized conditions (Table 1) are maintained throughout the experiments to determine the quantity of TDL in bulk and pharmaceutical dosage forms.
74 Volume 16
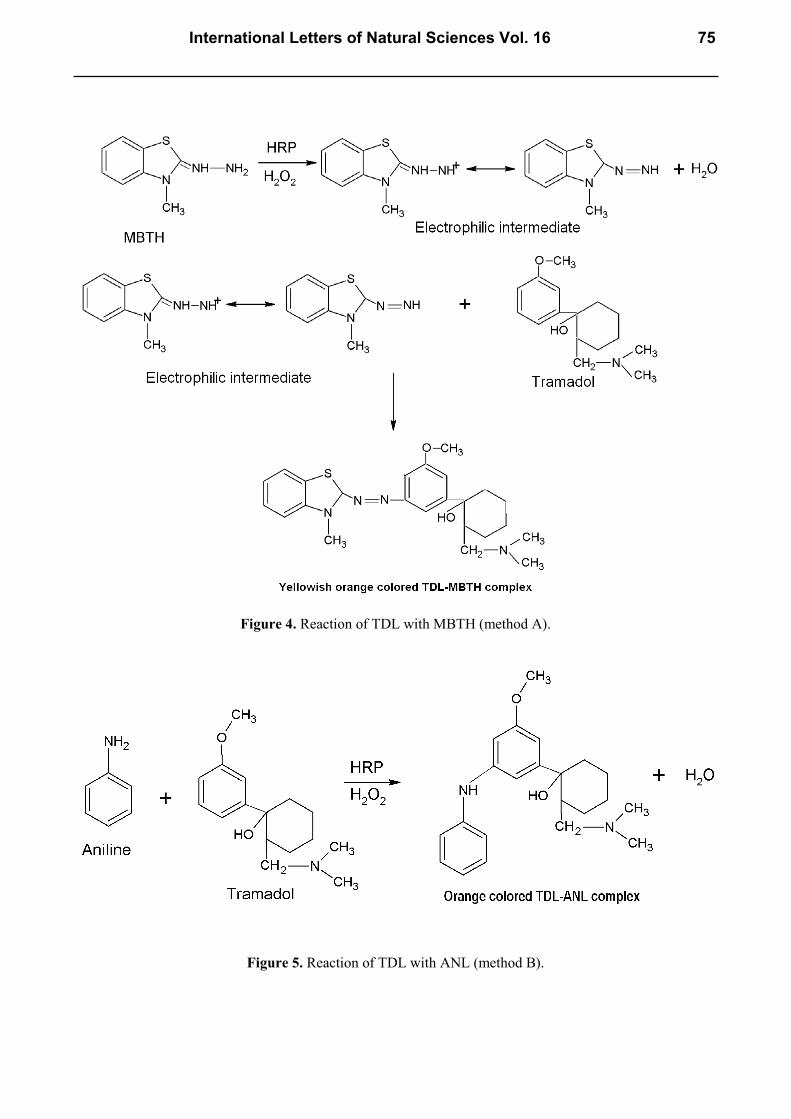
Figure 4. Reaction of TDL with MBTH (method A).
Figure 5. Reaction of TDL with ANL (method B).
International Letters of Natural Sciences Vol. 16 75
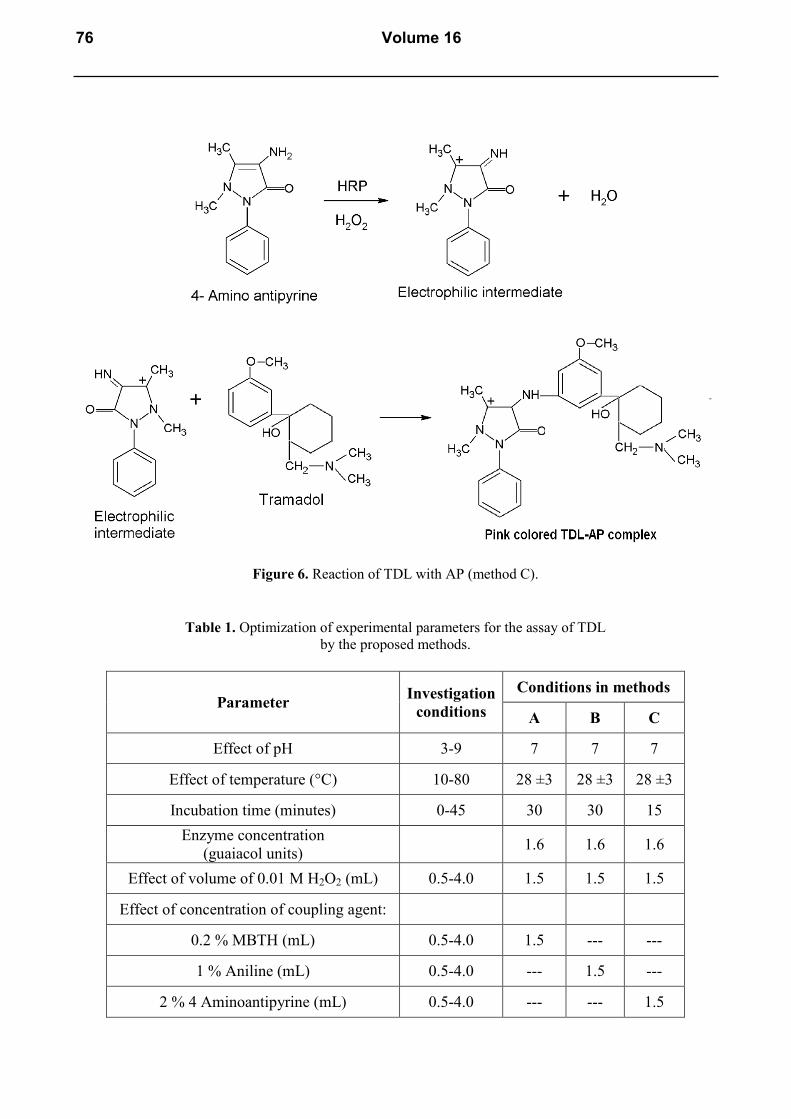
Figure 6. Reaction of TDL with AP (method C).
Table 1. Optimization of experimental parameters for the assay of TDL by the proposed methods.
Parameter Investigation conditions
Conditions in methods
A B C
Effect of pH 3-9 7 7 7
Effect of temperature (°C) 10-80 28 ±3 28 ±3 28 ±3
Incubation time (minutes) 0-45 30 30 15 Enzyme concentration
(guaiacol units) 1.6 1.6 1.6
Effect of volume of 0.01 M H2O2 (mL) 0.5-4.0 1.5 1.5 1.5
Effect of concentration of coupling agent:
0.2 % MBTH (mL) 0.5-4.0 1.5 --- ---
1 % Aniline (mL) 0.5-4.0 --- 1.5 ---
2 % 4 Aminoantipyrine (mL) 0.5-4.0 --- --- 1.5
76 Volume 16
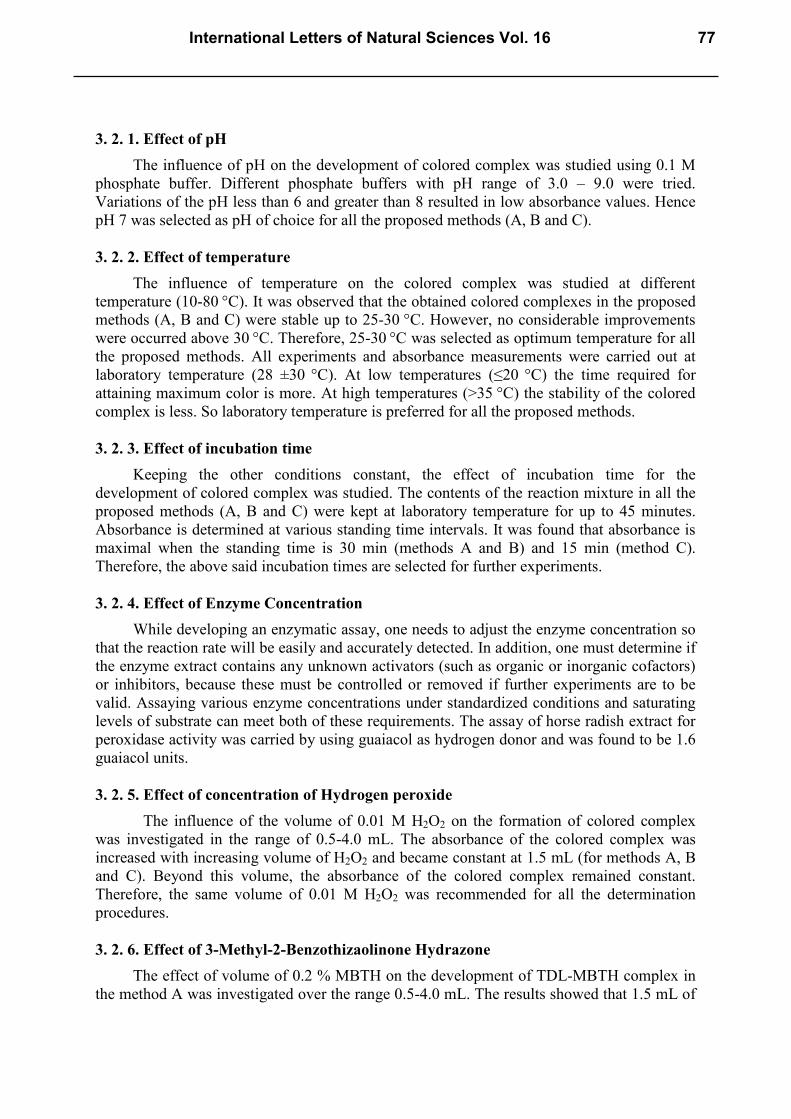
3. 2. 1. Effect of pH The influence of pH on the development of colored complex was studied using 0.1 M
phosphate buffer. Different phosphate buffers with pH range of 3.0 – 9.0 were tried. Variations of the pH less than 6 and greater than 8 resulted in low absorbance values. Hence pH 7 was selected as pH of choice for all the proposed methods (A, B and C).
3. 2. 2. Effect of temperature
The influence of temperature on the colored complex was studied at different temperature (10-80 °C). It was observed that the obtained colored complexes in the proposed methods (A, B and C) were stable up to 25-30 °C. However, no considerable improvements were occurred above 30 °C. Therefore, 25-30 °C was selected as optimum temperature for all the proposed methods. All experiments and absorbance measurements were carried out at laboratory temperature (28 ±30 °C). At low temperatures (≤20 °C) the time required for attaining maximum color is more. At high temperatures (>35 °C) the stability of the colored complex is less. So laboratory temperature is preferred for all the proposed methods.
3. 2. 3. Effect of incubation time
Keeping the other conditions constant, the effect of incubation time for the development of colored complex was studied. The contents of the reaction mixture in all the proposed methods (A, B and C) were kept at laboratory temperature for up to 45 minutes. Absorbance is determined at various standing time intervals. It was found that absorbance is maximal when the standing time is 30 min (methods A and B) and 15 min (method C). Therefore, the above said incubation times are selected for further experiments.
3. 2. 4. Effect of Enzyme Concentration
While developing an enzymatic assay, one needs to adjust the enzyme concentration so that the reaction rate will be easily and accurately detected. In addition, one must determine if the enzyme extract contains any unknown activators (such as organic or inorganic cofactors) or inhibitors, because these must be controlled or removed if further experiments are to be valid. Assaying various enzyme concentrations under standardized conditions and saturating levels of substrate can meet both of these requirements. The assay of horse radish extract for peroxidase activity was carried by using guaiacol as hydrogen donor and was found to be 1.6 guaiacol units.
3. 2. 5. Effect of concentration of Hydrogen peroxide
The influence of the volume of 0.01 M H2O2 on the formation of colored complex was investigated in the range of 0.5-4.0 mL. The absorbance of the colored complex was increased with increasing volume of H2O2 and became constant at 1.5 mL (for methods A, B and C). Beyond this volume, the absorbance of the colored complex remained constant. Therefore, the same volume of 0.01 M H2O2 was recommended for all the determination procedures.
3. 2. 6. Effect of 3-Methyl-2-Benzothizaolinone Hydrazone
The effect of volume of 0.2 % MBTH on the development of TDL-MBTH complex in the method A was investigated over the range 0.5-4.0 mL. The results showed that 1.5 mL of
International Letters of Natural Sciences Vol. 16 77
MBTH was sufficient to give maximum intensity of the color. Therefore, 1.5 mL of 0.2 % MBTH was chosen for the quantification of TDL by the method A.
3. 2. 7. Effect of Aniline
The effect of volume of 1 % ANL on the development TDL-ANL complex in method B was investigated with varying volumes (0.5-4.0 mL) of 1 % ANL. The highest absorbance was obtained with 1.5 mL of 1 % ANL. Above this volume, there is no change in absorbance. As a result, 1.5 mL of 1 % ANL was used in the determination of TDL by method B.
3. 2. 8. Effect of 4-Amino antipyrine
The effect of volume of 2 % 4-AP on the development of TDL-AP complex in method C was investigated with varying volumes (0.5-4.0 mL) of 2 % 4-AP. The highest absorbance was obtained with 1.5 mL of 2 % 4-AP. Above this volume, there is no change in absorbance. So, 1.5 mL of 2 % 4-AP was used in the determination of TDL by method C. 3. 2. 9. Stability of colored complex
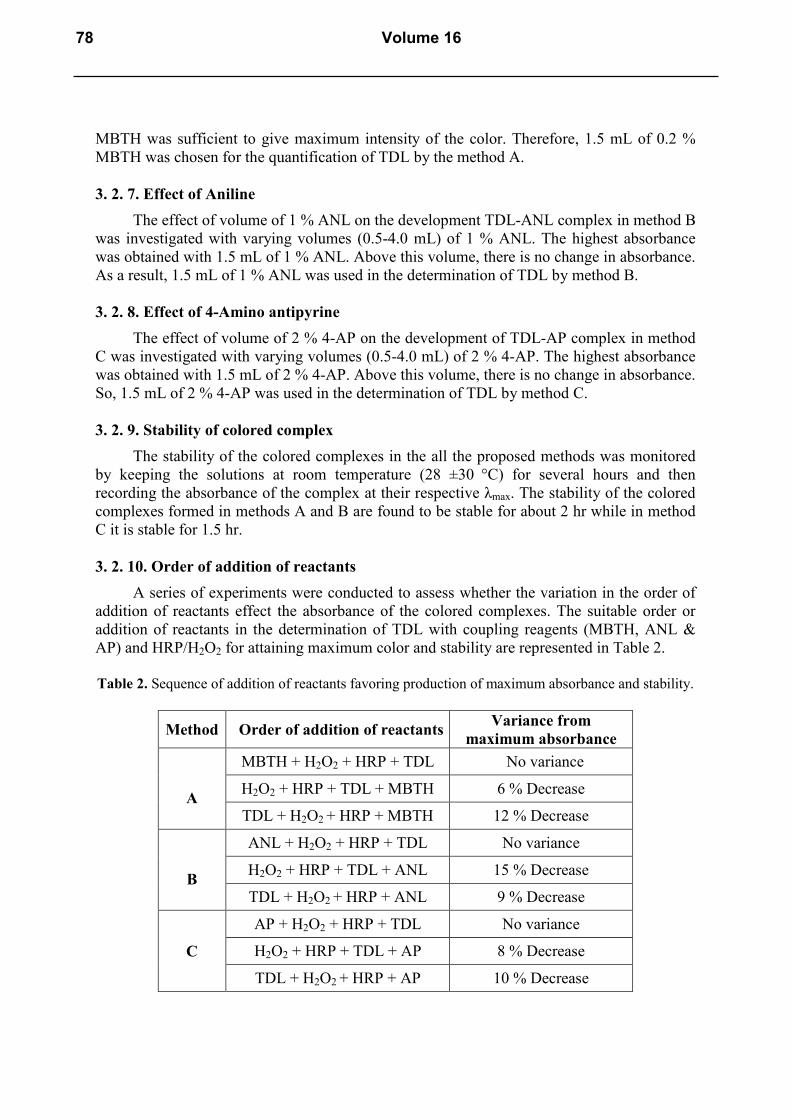
The stability of the colored complexes in the all the proposed methods was monitored by keeping the solutions at room temperature (28 ±30 °C) for several hours and then recording the absorbance of the complex at their respective λmax. The stability of the colored complexes formed in methods A and B are found to be stable for about 2 hr while in method C it is stable for 1.5 hr. 3. 2. 10. Order of addition of reactants
A series of experiments were conducted to assess whether the variation in the order of addition of reactants effect the absorbance of the colored complexes. The suitable order or addition of reactants in the determination of TDL with coupling reagents (MBTH, ANL & AP) and HRP/H2O2 for attaining maximum color and stability are represented in Table 2.
Table 2. Sequence of addition of reactants favoring production of maximum absorbance and stability.
Method Order of addition of reactants Variance from maximum absorbance
A
MBTH + H2O2 + HRP + TDL No variance
H2O2 + HRP + TDL + MBTH 6 % Decrease
TDL + H2O2 + HRP + MBTH 12 % Decrease
B
ANL + H2O2 + HRP + TDL No variance
H2O2 + HRP + TDL + ANL 15 % Decrease
TDL + H2O2 + HRP + ANL 9 % Decrease
C
AP + H2O2 + HRP + TDL No variance
H2O2 + HRP + TDL + AP 8 % Decrease
TDL + H2O2 + HRP + AP 10 % Decrease
78 Volume 16
3. 3. Method validation The developed methods were validated in terms of linearity, sensitivity, accuracy,
precision and recovery. 3. 3. 1. Linearity and sensitivity
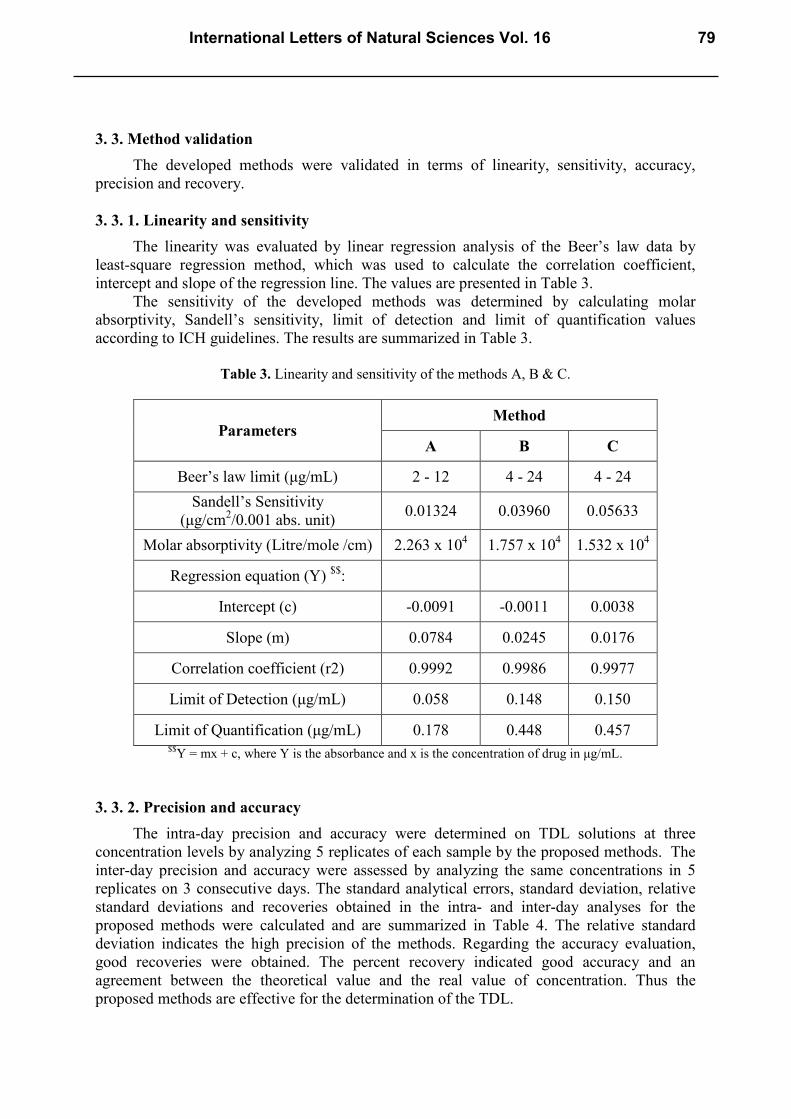
The linearity was evaluated by linear regression analysis of the Beer’s law data by least-square regression method, which was used to calculate the correlation coefficient, intercept and slope of the regression line. The values are presented in Table 3.
The sensitivity of the developed methods was determined by calculating molar absorptivity, Sandell’s sensitivity, limit of detection and limit of quantification values according to ICH guidelines. The results are summarized in Table 3.
Table 3. Linearity and sensitivity of the methods A, B & C.
Parameters Method
A B C
Beer’s law limit (μg/mL) 2 - 12 4 - 24 4 - 24 Sandell’s Sensitivity
(μg/cm2/0.001 abs. unit) 0.01324 0.03960 0.05633
Molar absorptivity (Litre/mole /cm) 2.263 x 10⁴ 1.757 x 10⁴ 1.532 x 10⁴
Regression equation (Y) $$:
Intercept (c) -0.0091 -0.0011 0.0038
Slope (m) 0.0784 0.0245 0.0176
Correlation coefficient (r2) 0.9992 0.9986 0.9977
Limit of Detection (μg/mL) 0.058 0.148 0.150
Limit of Quantification (μg/mL) 0.178 0.448 0.457 $$Y = mx + c, where Y is the absorbance and x is the concentration of drug in μg/mL.
3. 3. 2. Precision and accuracy
The intra-day precision and accuracy were determined on TDL solutions at three concentration levels by analyzing 5 replicates of each sample by the proposed methods. The inter-day precision and accuracy were assessed by analyzing the same concentrations in 5 replicates on 3 consecutive days. The standard analytical errors, standard deviation, relative standard deviations and recoveries obtained in the intra- and inter-day analyses for the proposed methods were calculated and are summarized in Table 4. The relative standard deviation indicates the high precision of the methods. Regarding the accuracy evaluation, good recoveries were obtained. The percent recovery indicated good accuracy and an agreement between the theoretical value and the real value of concentration. Thus the proposed methods are effective for the determination of the TDL.
International Letters of Natural Sciences Vol. 16 79
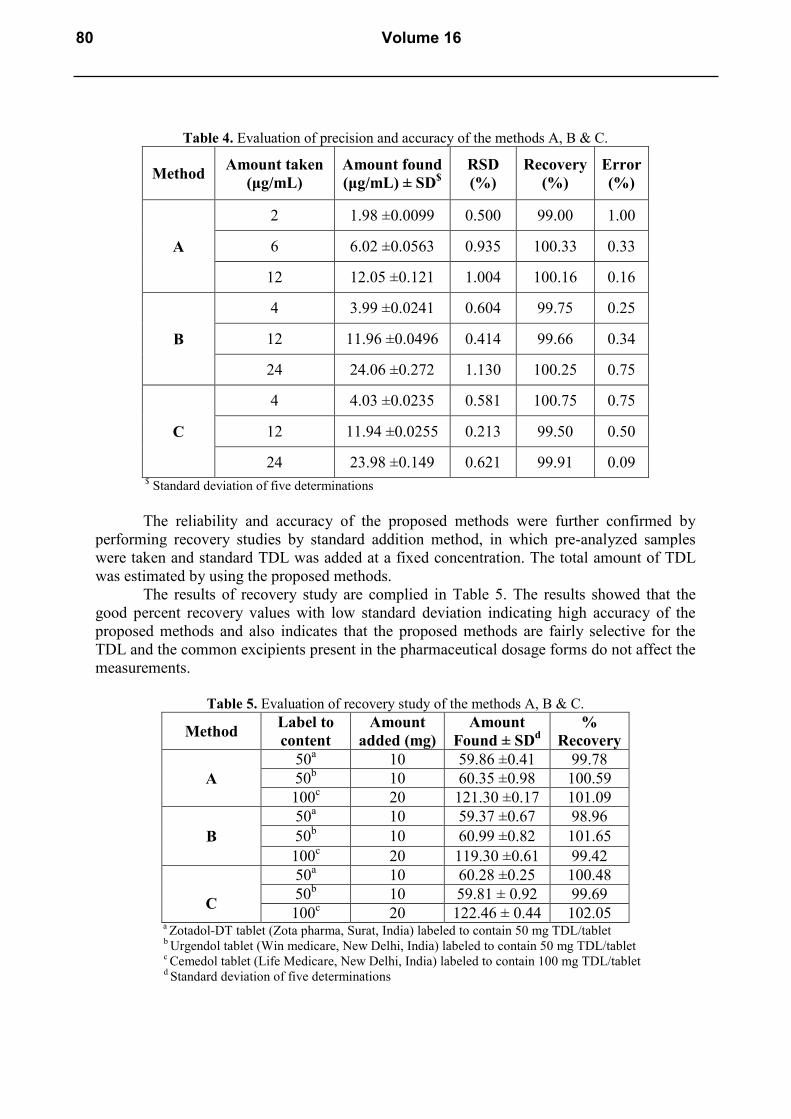
Table 4. Evaluation of precision and accuracy of the methods A, B & C.
Method Amount taken (μg/mL)
Amount found (μg/mL) ± SD$
RSD (%)
Recovery (%)
Error (%)
A
2 1.98 ±0.0099 0.500 99.00 1.00
6 6.02 ±0.0563 0.935 100.33 0.33
12 12.05 ±0.121 1.004 100.16 0.16
B
4 3.99 ±0.0241 0.604 99.75 0.25
12 11.96 ±0.0496 0.414 99.66 0.34
24 24.06 ±0.272 1.130 100.25 0.75
C
4 4.03 ±0.0235 0.581 100.75 0.75
12 11.94 ±0.0255 0.213 99.50 0.50
24 23.98 ±0.149 0.621 99.91 0.09 $ Standard deviation of five determinations
The reliability and accuracy of the proposed methods were further confirmed by
performing recovery studies by standard addition method, in which pre-analyzed samples were taken and standard TDL was added at a fixed concentration. The total amount of TDL was estimated by using the proposed methods.
The results of recovery study are complied in Table 5. The results showed that the good percent recovery values with low standard deviation indicating high accuracy of the proposed methods and also indicates that the proposed methods are fairly selective for the TDL and the common excipients present in the pharmaceutical dosage forms do not affect the measurements.
Table 5. Evaluation of recovery study of the methods A, B & C.
Method Label to content
Amount added (mg)
Amount Found ± SDd
% Recovery
A
50a 10 59.86 ±0.41 99.78 50b 10 60.35 ±0.98 100.59 100c 20 121.30 ±0.17 101.09
B
50a 10 59.37 ±0.67 98.96 50b 10 60.99 ±0.82 101.65 100c 20 119.30 ±0.61 99.42
C
50a 10 60.28 ±0.25 100.48 50b 10 59.81 ± 0.92 99.69 100c 20 122.46 ± 0.44 102.05
a Zotadol-DT tablet (Zota pharma, Surat, India) labeled to contain 50 mg TDL/tablet b Urgendol tablet (Win medicare, New Delhi, India) labeled to contain 50 mg TDL/tablet c Cemedol tablet (Life Medicare, New Delhi, India) labeled to contain 100 mg TDL/tablet d Standard deviation of five determinations
80 Volume 16
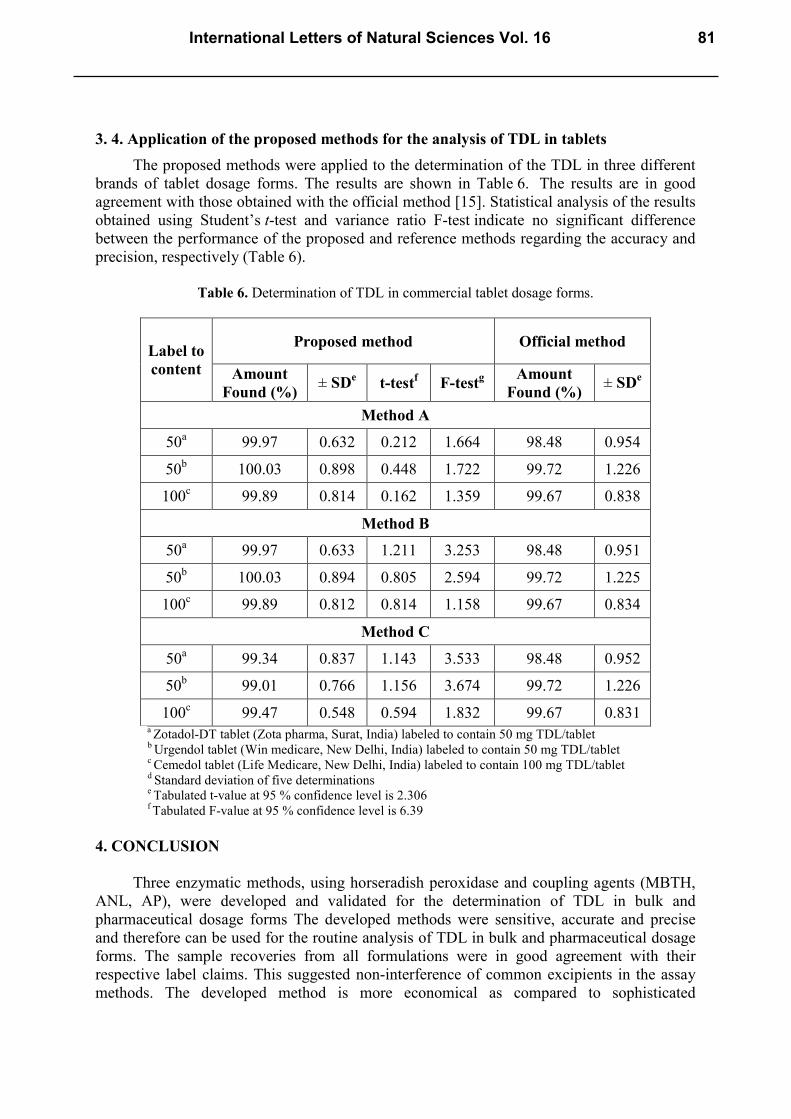
3. 4. Application of the proposed methods for the analysis of TDL in tablets The proposed methods were applied to the determination of the TDL in three different
brands of tablet dosage forms. The results are shown in Table 6. The results are in good agreement with those obtained with the official method [15]. Statistical analysis of the results obtained using Student’s t-test and variance ratio F-test indicate no significant difference between the performance of the proposed and reference methods regarding the accuracy and precision, respectively (Table 6).
Table 6. Determination of TDL in commercial tablet dosage forms.
Label to content
Proposed method Official method
Amount Found (%) ± SDe t-testf F-testg Amount
Found (%) ± SDe
Method A
50a 99.97 0.632 0.212 1.664 98.48 0.954
50b 100.03 0.898 0.448 1.722 99.72 1.226
100c 99.89 0.814 0.162 1.359 99.67 0.838
Method B
50a 99.97 0.633 1.211 3.253 98.48 0.951
50b 100.03 0.894 0.805 2.594 99.72 1.225
100c 99.89 0.812 0.814 1.158 99.67 0.834
Method C
50a 99.34 0.837 1.143 3.533 98.48 0.952
50b 99.01 0.766 1.156 3.674 99.72 1.226
100c 99.47 0.548 0.594 1.832 99.67 0.831 a Zotadol-DT tablet (Zota pharma, Surat, India) labeled to contain 50 mg TDL/tablet
b Urgendol tablet (Win medicare, New Delhi, India) labeled to contain 50 mg TDL/tablet c Cemedol tablet (Life Medicare, New Delhi, India) labeled to contain 100 mg TDL/tablet d Standard deviation of five determinations e Tabulated t-value at 95 % confidence level is 2.306 f Tabulated F-value at 95 % confidence level is 6.39
4. CONCLUSION
Three enzymatic methods, using horseradish peroxidase and coupling agents (MBTH, ANL, AP), were developed and validated for the determination of TDL in bulk and pharmaceutical dosage forms The developed methods were sensitive, accurate and precise and therefore can be used for the routine analysis of TDL in bulk and pharmaceutical dosage forms. The sample recoveries from all formulations were in good agreement with their respective label claims. This suggested non-interference of common excipients in the assay methods. The developed method is more economical as compared to sophisticated
International Letters of Natural Sciences Vol. 16 81
chromatographic techniques which make it suitable for routine quality control analysis of TDL.
Acknowledgements
The authors express their gratitude to the management Jagarlamudi Kuppuswamy Choudary College, Guntur, Andhra Pradesh for providing research facilities. References [1] P. Dayer, J. Desmeules, L. Collart, Drugs 53 (1997) 18-24. [2] K. S. Lewis, N. H. Han, American Journal of Health - System Pharmacy 54 (1997) 643-352. [3] L. Costa, F. Barros, F. Pedro, C. Dias, European Journal of Anaesthesiology 13 (1996 199-200. [4] F. Coluzzi, C. Mattia, Therapeutics and Clinical Risk Management 3 (2007) 819-829. [5] AS. Stephan, Therapeutics and Clinical Risk Management 3 (2007) 717-723. [6] L. Adler, C. McDonald, C. O’Brien, M. Wilson, The Journal of Rheumatology 29 (2002) 2196-2199. [7] G. Mongin, Expert Review of Neurotherapeutics 7 (2007) 1775-1784. [8] H. H. Hennies, E. Friderichs, J. Schneider, Arzneimittel-Forschung 38 (1988) 877-880. [9] M. C. Frink, H. H. Hennies, W. Englberger, M. Haurand, B. Wilffert, Arzneimittel- Forschung 46 (1996) 1029-1036. [10] P. Dayer, J. Desmeules, L. Collart, Drugs 53 (1997) 18-24. [11] B. Driessen, W. Reimann, British Journal of Pharmacology 105 (1992) 147-151. [12] T. A. Bamigbade, C. Davidson, R. M. Langford, J. A. Stamford, British Journal of Anaesthesia 79 (1997) 352.356. [13] W. Reimann, F. Schneider, European Journal of Pharmacology 349 (1998) 199-203. [14] M. Gobbi, M. Moia, L. Pirona, I. Ceglia, M. Reyes-Parada, C. Scorza, T. Mennini, Journal of Neurochemistry 82 (2002) 1435-1443. [15] European Pharmacopoeia, 5th Edi., European Department for the Quality of Medicines within the Council of Europe, Strasbourg, 2005, p. 2607. [16] H. E. Abdellatef, M. M. El-Henawee, H. M. El-Sayed, M.M. Ayad, Spectrochimica
Acta Part A: Molecular and Biomolecular Spectroscopy 65 (2006) 1087-1092. [17] A. Küçüka, Y. Kadıoğlub, II Farmaco 60 (2005) 163-169. [18] A. Curticapean, D. Munteana, M. Curticapeana, M. Dogarua, C. Vari, Journal of
Biochemical and Biophysical Methods 70 (2008) 1304-1312.
82 Volume 16
[19] Y. Geng-Chang, S. Ming-Thau, Y. Chia-Lin, W. Ya-Wen, L. Cheng-Hsiung, H. Hsiu-O., Journal of Chromatography B: Biomedical Sciences and Applications 723 (1999) 247-253. [20] S. H. Gan, R. Ismail, W. A. Wan Adnan, Z. Wan, Journal of Chromatography B: Analytical Technologies in the Biomedical and Life Sciences 772 (2008) 123-129. [21] Y. H. Ardakani, Md. Reza Rouini, Journal of Pharmaceutical and Biomedical Analysis 44 (2007) 1168-1173. [22] M. Nobilis, J. Kopecký, J. Kv tina, J. Chládek, Z. Svoboda, V. Vo í ek, F. Perlík, M. Pour, J. Kune, Journal of Chromatography A 949 (2002) 11-22. [23] M. A. Campanero, E. García-Quetglas, B. Sádaba, J. R. Azanza, Journal of Chromatography 1031 (2004) 219-228.. [24] M. De Leo, M. Giorgi, G. Saccomanni, C. Manera, A. Braca, C:\pmid:19072864Rapid Communications in Mass Spectrometry 23 (2009) 228-236. [25] H. M. Abu-Shawish, N. A. Ghalwa, F. R. Zaggout, S.M. Saadeh, A.R. Al-Dalou, A.A. Abou Assi, Biochemical Engineering Journal 48 (2010) 237-245. [26] M. R. Ganjali, T. Razavi, F. Faridbod, S. Riahi, P. Norouzi, Current Pharmaceutical Analysis 5 (2009) 28-33. [27] EMPJ. Garrido, JMPJ. Garrido, F. Borges, C. Delerue-Matos, Journal of
Pharmaceutical and Biomedical Analysis 32 (2003) 975-981. [28] M. Merslavič, L. Zupančič-Kralj, Journal of Chromatography B: Biomedical Sciences
and Applications 693 (1997) 222-227. [29] Y. F. Sha, S. Shen, G. L. Duan, Journal of Pharmaceutical and Biomedical Analysis 37 (2005) 143-147. [30] Q. Tao, D. J. Stone, M. R. Borenstein, V. Jean-Bart, E. E. Codd, T.P. Coogan, D. Desai-Krieger, S. Liao, RB. Raffa, Journal of Chromatography B: Biomedical Science Applications 763 (2001) 165-171. [31] S. N. Meyyanathan, P. Kumar, B. Suresh, Journal of Separation Science 26 (2003) 1359-1362. [32] K. Venkateshwarlu, Y. N. Reddy, K. Srisailam, V. Rajkumar, M. G. Pai, Current Trends in Biotechnology and Pharmacy 2 (2008) 421-425. [33] J. Krzek, M. Starek, Biomedical Chromatography 18 (2004) 589-599. [34] H. E. Abdellatef, Journal of Pharmaceutical and Biomedical Analysis 29 (2002) 835-842. [35] A. Kumar, S. Nanda, R. Chomwal, The Indian Pharmacist 8 (2010) 85-87. [36] R. Kalaichelvi, E. Jayachandran, Research Journal of Pharmacy and Technology 3 (2010) 1096-1099 [37] Validation of Analytical Procedures, Methodology, International Conference on Harmonization (ICH): Text and Methodology Q2 (R 1): Complementary Guideline on Methodology dated 06 November 1996: incorporated in November 2005, London.
International Letters of Natural Sciences Vol. 16 83
[38] H. U. Bergmeyer, Methods of Enzymic Analysis, Academic Press, 1965, p. 895. [39] P. Nagaraja, A. Shivakumar, A. K. Shrestha, Analytical Biochemistry 395 (2009) 231-236. [40] S. Leonardo, S. Sara, D. A. Igor, G. P. Pier, Enzyme and Microbial Technology 22 (1998) 656-661. [41] Z. Huixian, K. E. Taylor, Chemosphere 28 (1994) 1807-1817. [42] C. B. Sekaran, C. R., Babu, B. P. Kumar, D. R. Shankar, Journal of Pure and Applied Microbiology 2 (2008) 257-259. [43] C. B. Sekaran, S. V. Saradhi, Biotechnology Biosciences Research Asia 5 (2008) 258-261. [44] C. B. Sekaran, S. V. Saradhi, B. P. Kumar, Ch. Srilakshmi, Asian Journal of Chemistry 21 (2009) 6647-6650. [45] A. P. Rani, C. B. Sekaran, Ch. Srilakshmi, Biomedical and Pharmacology Journal 2 (2009) 91-94.
( Received 13 May 2014; accepted 21 May 2014 )
84 Volume 16