Embed Size (px)
Citation preview
Aaron KeenlanceSamantha ZobottJacob SnyderBennett Laxton
Monitoring of Natural Ecological Site for Health and Sustainability through
Observation and Data Collection
Introduction:
Health and sustainability are two important components of an ecosystem. The health of
an ecosystem can be measured by its biodiversity of different plant and animal species and
habitat in which they live. While the sustainability of an ecosystem is determined by its ability to
adapt to change and survive changing conditions. In order to look at the health and sustainability
of an ecosystem, we monitored a specific ecological site on three different visits. During the
visits we looked at basic environmental data, including weather and soil analysis, as well as
animal and plant diversity.
The objective of the lab was to monitor the ecosystem of a selected plot area. We were to
collect data over a designated period of time while observing any trends or changes in our
ecological site. Then we were to see if there were any correlations observed within these changes
and trends to look for relationships between different sets of data. The purpose of the lab is to
understand the value of research and observation in assessing the health of an ecosystem and
locate potential problem to find solutions to. Therefore, we must perform research ensure the
health of our ecosystems to prevent extinction of valuable organisms and their habitats.
Materials and Methods:

Viterbo University Athletic Sports Complex was the location of our research site. We visited our
site a total of three times. These dates included September 9th, September 23rd, and October
7th. Our plot was a complete square that measured 10 meters on each side. We placed our plot
at 43 degrees 50 feet 14 inches North and 91 degrees 12 feet 18 inches West. The 10 by 10
meter plot, as you can see in figure 1.2, was located in the wooded part of the complex. If you
were to walk down the trail through the woods our site was located on the east side of the trail.
As you can see from figure 1.1 our plot is located northwest of the soccer fields, west of highway
16, and east of the La crosse river.
Figure 1.1 Figure 1.2
Figure 1.1: Satellite view of the Viterbo University Athletic Complex.
Figure 1.2: Sketch of our 10 by 10 meter plot where we performed our research.

During these three research days we collected different information regarding our plot.
We specifically measured air temp (degrees celcius), percent RH (relative humidity), wind speed
(m/s), soil temp (degrees celcius), and light intensity (lux). These readings were taken at three
different times during each site visit. We took the air temp, relative humidity, wind speed, and
light intensity using the Sper Scientific 850070. In addition, we took the soil temp with a little
thermometer that we stuck into the ground. This allowed us to compile an average of all the
readings throughout the experiment. In addition to these readings, we specifically did separate
readings each time that we went to the site.
The first time we visited the site was on September 9th, 2014, and during this visit we
recorded the features of our site. This included drawings of our site and the geological location
of our site using the GPS. In addition, we listed all of the abiotic and biotic aspects of our plot.
The abiotic things included a barbed wire fence and dead branches, but the biotic things were
threes, mosquitos, shrubs, and bushes. Finally, we recorded the cloud cover, and it included an
abundance of clouds. There was no direct sunlight to our site because it was being clouded by
either clouds or tall trees.
The second time we visited the site was on September 23rd, 2014, and we marked any
changes that we saw from the last time we visited our site. The changes were minimal to
nothing. In addition, we marked the animal life in our site. We observed a black-capped
chickadee in the tree, and we heard bird calls. Also, we found that there was a burrow of some
type of animal on the northwest side of the plot. We also spotted a nest in the upper part of the
tree that was located on the south west part of our plot. Overall, it was hard to find any other sort
of animal habitation because the ground was completely covered with vegetation.

The third, and final time we visited our site was on October 7th, 2014, and we were
mainly focused on the vegetation that was found in our site. As a group we found 6 different
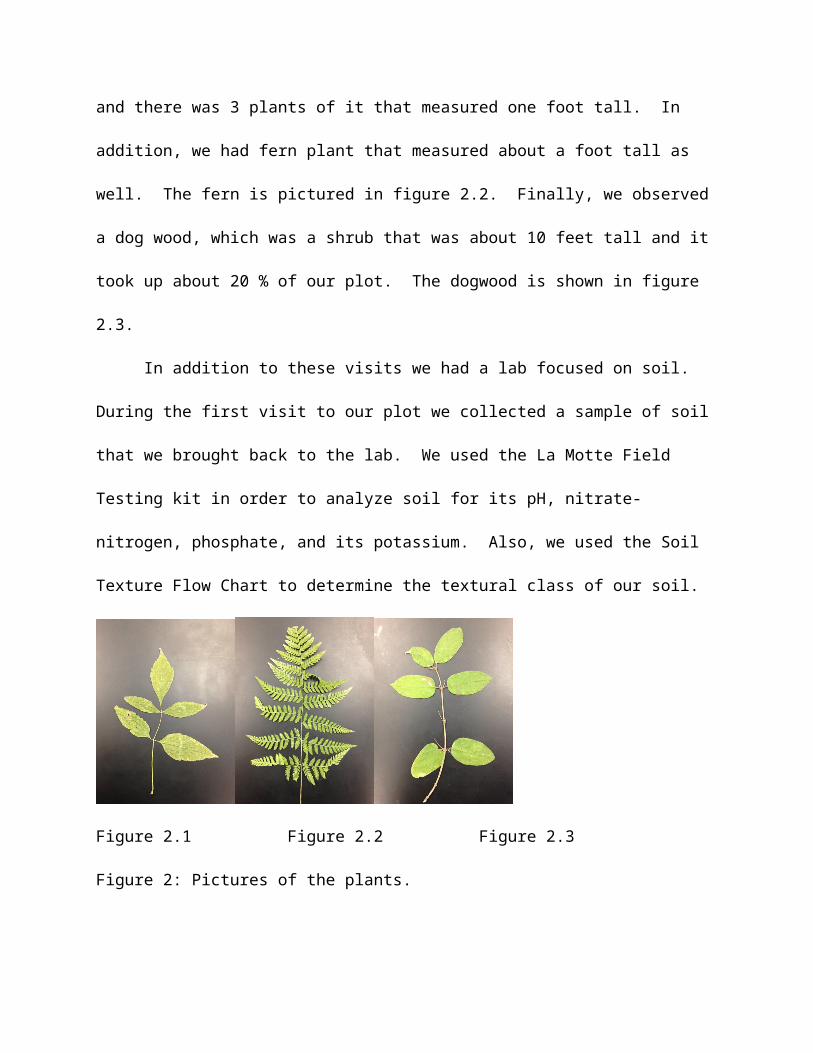
types of plants in our plot. Our plot had a boxelder tree in it, and it was about 30 feet tall and the
leaves are shown in Figure 2.1. Next, we found burning needles in our plot, and they were about
2 feet tall and scattered about 30% of our plot. A cocel bur also took up about 15% of our plot,
and this was a shrub that was about 6 feet tall. Wild rhubarb was also a plant in our plot, and
there was 3 plants of it that measured one foot tall. In addition, we had fern plant that measured
about a foot tall as well. The fern is pictured in figure 2.2. Finally, we observed a dog wood,
which was a shrub that was about 10 feet tall and it took up about 20 % of our plot. The
dogwood is shown in figure 2.3.
In addition to these visits we had a lab focused on soil. During the first visit to our plot
we collected a sample of soil that we brought back to the lab. We used the La Motte Field
Testing kit in order to analyze soil for its pH, nitrate-nitrogen, phosphate, and its potassium.
Also, we used the Soil Texture Flow Chart to determine the textural class of our soil.
Figure 2.1 Figure 2.2 Figure 2.3
Figure 2: Pictures of the plants.
Results:

Graph 1: Air and soil temperatures
Table 1: Site visit data collection
9/9/14 9/23/14 10/7/14 Overall Average
Air Temperature (*C) 27.26667 20.03333 19.1 22.13333
RH (%) 58.43333 59.73333 55.06667 57.74444
Wind Speed (m/s) 0.166667 0 0.066667 0.077778
Soil Temperature (*C) 21.33333 14.33333 10 15.22222
Light Intensity (LUX) 1220 324.6667 381.3333 642
We collected data from our site on three different occasions over a period of one month. From
Table 1 above we see that wind speed on all three occasions was very minimal or nonexistent.
We measured the light intensity (LUX) for each visit also. These results did not show a trend or
pattern as each result was dependent on the cloud cover that day. However, we did notice a
change in the air and soil temperatures of our site as seen in Graph 1 and Table 1. Over the one
month time frame the soil temperature decreased from 21.3 to 10 degrees Celsius, a drop of 11.3
degrees. Our recorded air temperatures also decreased from 27.3 to 19.1 degrees Celsius, a drop
of 8.2 degrees.
Table 2: Soil analysis
TestOur Sample Soccer Field
pH 7 6
NO3-N Medium Trace
P2O5 High Medium
K10 drops=high
14 drops=Medium
Texture Silty Clay Silty Clay
The soil sample collected from our site proved to be healthy for plant growth. From table 2
above we can observe that our sample tested higher amounts of nitrogen, phosphorus, and
potassium than equivalent tests performed on the soccer field’s soil. The soil collected at our site
had a pH of 7.0 which is very close to the desired range of 6.3-6.8. In addition, our soil tested a
“medium” level of nitrogen, which implies a desired condition for plant growth. While
observing the two points of soil collection it was obvious to see the human interference between
the two. The soccer field is deliberately affected by humans to prevent plant growth while our
10m2 plot was not affected by human activity.
Discussion:

In this experiment, our group was tasked with observing a plot of land near the Viterbo Soccer
fields. Throughout our visits, we were tasked with making note of the changes in the
environment and life over the changing months from early September to late October. As a
group we came to the conclusion that there is a correlation with the shift in weather (late summer
to early fall) and a decrease in the population of biological life.
Throughout this observation, we had to document items such as air and soil temperature, wind
speed, humidity and light intensity. We felt that these measurements were not as accurate as
they could have been. The LUX reading specifically was tough to measure and identify. We
did, however, feel that the rest of the measurements that we did take were effective and helpful
in determining the health and sustainability of our ecological site. We were able to compare our
results to what is considered healthy and if our site is healthy then it is better able to support
diverse life and continue to grow even with continual changes in the environment.
We had a few ways that we thought we could improve the monitoring of our ecological site to
determine its health and sustainability. We felt that we were lacking in tools to help us identify
plant and species in our ecological site such as different insects. We felt that it was necessary for
us to ask our professor for confirmation of our findings, stressing the fact that we were not
comfortable with the books we were given or the types of species that are native to the ecological
site that we were studying. We also felt that it would have been beneficial to observe this site
over a long period of time, such as a full year, rather than a month and a half. We thought that
our data collected was from a small window of what is truly a much larger picture. Thus, it
would be interesting to see what the site looks like throughout the year and how the site is
sustained through the different environmental changes that occur in this region.

In summary, the soil that was found in our ecological site is preferred for plant growth over the
soil on the soccer field. This was seen through a soil analysis as well as observations on our site
such as dense vegetation. The healthier soil allows us to conclude that our site is relatively
healthy and can sustain abundant plant growth which then allows for various life to flourish. This
then showed that our ecological is healthy and can support a diverse environment.