Embed Size (px)
Citation preview

ENVR E-115Sustainable Development
Introduction to the Economics of Sustainability
November 13, 2007

How much does gasoline cost?
Introduction to Shadow Pricing?

National Geographic, June, 2004, p. 97

Economics of Sustainability
Natural, man-made, and human capital Definitions of sustainability Problem of defining objectives Practical sustainability criteria
Place economic values on environmental costs and benefits (User Pays and Polluter Pays Principles)
Avoid damage to critical natural capital as far as possible (the Precautionary Principle)
Avoid irreversible processes Limit the use of natural assets to their sustainable yield,
otherwise include the costs of replacing these assets (Cost of Remediation)
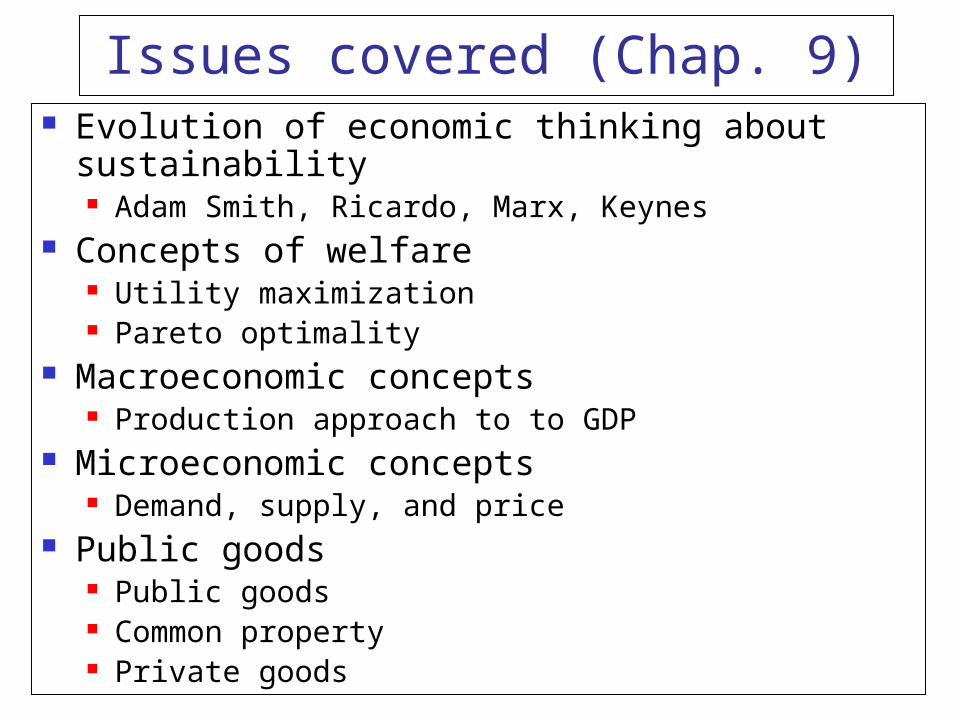
Issues covered (Chap. 9) Evolution of economic thinking about
sustainability Adam Smith, Ricardo, Marx, Keynes
Concepts of welfare Utility maximization Pareto optimality
Macroeconomic concepts Production approach to to GDP
Microeconomic concepts Demand, supply, and price
Public goods Public goods Common property Private goods

Issues covered (Chap. 10)
Externalities Externalities and market failure Valuation Total economic value Economic assessment of
sustainable projects Assessment of climate change
mitigation

Evolution of Economic Thinking
- and the role of different factors -Land, Labor, Capital (Adam Smith, Ricardo)
Labor,Capital
(19th century Industrial Revolution, Marx)
Capital
(Marxism in 20th century USSR)
Capital,
Labor (Keynes)
Capital,
Labor, Land(Modern environmental economics)
CONCEPTS OF WELFARE

Utility Maximization

GNP as a Proxy for Utility
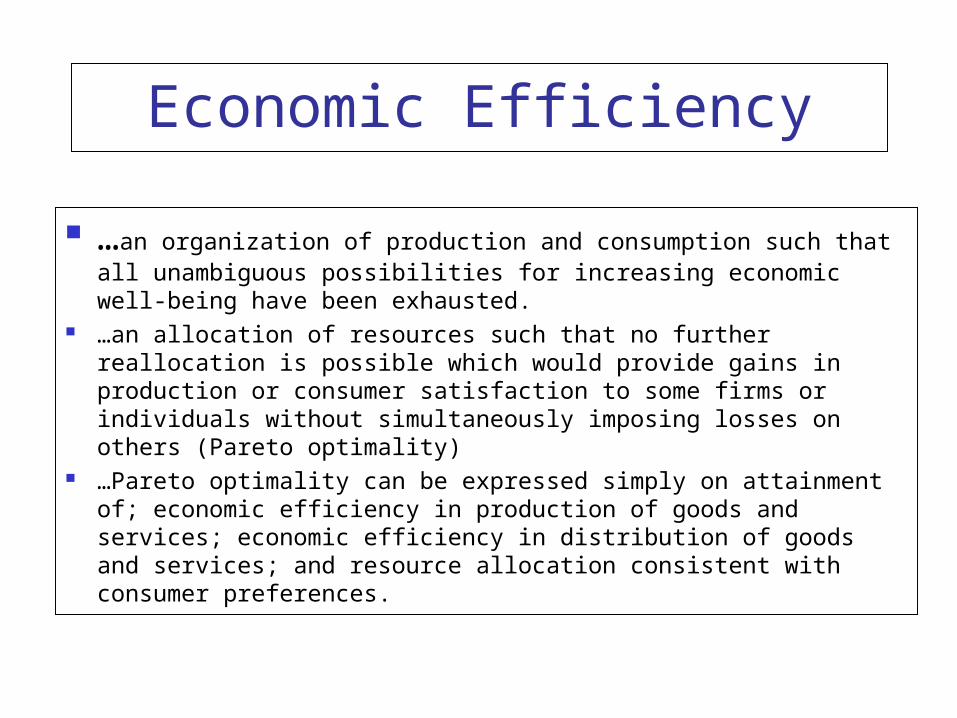
Economic Efficiency
…an organization of production and consumption such that all unambiguous possibilities for increasing economic well-being have been exhausted.
…an allocation of resources such that no further reallocation is possible which would provide gains in production or consumer satisfaction to some firms or individuals without simultaneously imposing losses on others (Pareto optimality)
…Pareto optimality can be expressed simply on attainment of; economic efficiency in production of goods and services; economic efficiency in distribution of goods and services; and resource allocation consistent with consumer preferences.

Pareto Rests on Several Value Judgments
1. Individual preferences count, the economic welfare of a society is based upon the welfare of individual citizens
2. The individual is the best judge of his/her own well-being
3. A change that makes everybody better off with no one being worse off constitutes a positive change in welfare.
To get to modern Benefit/Cost practice from Pareto need the “compensation test.” In other words, if the gainers could compensate the losers and still be better off, the change is judged an improvement. This leads to “potential Pareto” improvement.

Some Macro Economic Concepts

Sustainable Social Net Product
Sustainable Social Net Product based on Hick’s definition of income (i.e. maximum value that a person can consume in a period of time and still expect to be as well off at the end of the period as he was at the beginning = Net National Product minus Defensive Expenditures minus the Depression of Natural Capital
SSNNP = NNP – DE – DNC
“Cost-of-Repair” approach emphasizes measuring the “Defensive Expenditures” part of this index.
SOURCE: Daly, 1990


WEAKCombined value of all assets remain constant, or increasing, means that substitution of one form of capital (natural) by another (manufactured) is possible.
STRONGNatural capital is a complement to manufactured capital rather than a substitute. This means that natural capital (eg, fisheries or forests) can only be exploited at their natural rate of growth.
Sustainability can be Weak or Strong


Gross Domestic Product or Expenditure, 1930–2000 (in billions of current dollars)(GDP=GNP-net factor earnings from ROW, NNP=GNP-consumption of fixed capital)
Item 1930 1940 1950 1960 1970 1980 1990 1995 1999 20001
Gross domestic product $91.3 $101.3 $294.3 $527.4 $1,039.7 $2,795.6 $5,803.2 $7,400.5 $9,268.6 $ 9,872.9
Personal consumption expenditures
70.2 71.2 192.7 332.2 648.9 1,762.9 3,831.5 4,969.0 6,250.2 6,728.4
Gross private domestic investment
10.8 13.6 54.1 75.7 150.4 484.2 847.2 1,110.7 1,636.7 1,767.5
Exports of goods and services
4.4 4.8 12.3 25.3 57.0 278.9 557.2 818.6 989.8 1,102.9
Imports of goods and services
4.1 3.4 11.6 22.8 55.8 293.8 628.6 902.8 1,240.6 1,466.9
Government10.0 15.1 46.9 113.8 237.1 569.7 1,181.4 1,372.0 1,632.5 1,741.0

Some Micro Economic Concepts


Public, Common Property, and Private Goods
Public Good: non-excludable, non-rival consumption. (Lighthouse, flood control)
Common Property: non-excludable, rival consumption. (Fisheries, polluting streams)
Private Goods: excludable, and rival consumption. (Irrigation, domestic water supply.
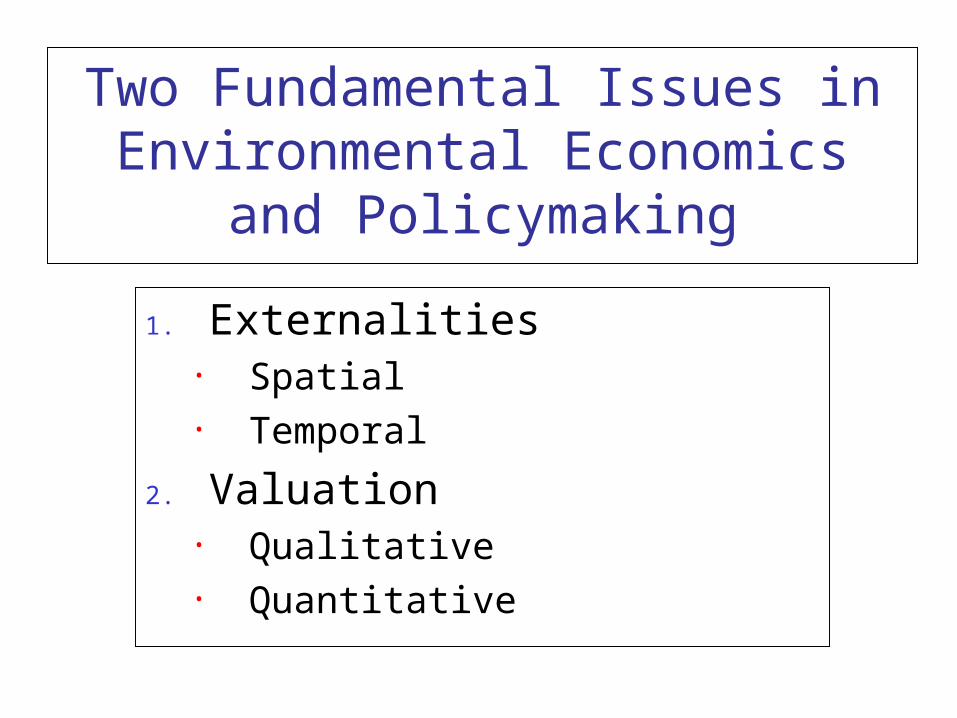
Two Fundamental Issues in Environmental Economics and
Policymaking
1. Externalities• Spatial• Temporal
2. Valuation• Qualitative• Quantitative
Externalities and Market Failure

When is an external effect an Externality?
You are driving a car when the person next to you lights up a cigarette. Is this an externality or not? It is, because you were never asked.
If the person asks permission to smoke, and you give permission? It is not, because you indicate that you are willing to accept the damages.
If he asks and you tell him it will cost him $1? It is not, because if he does not smoke you are not affected, and if he does you have set the price for compensation.
In both of the latter two cases you are part of the decision-makingprocess and the externalities have been internalized.

How Externalities and Valuation Affect Decision Making
(an example from a Mangrove forest)
Location of Goods and Services
On-Site Off-site
Valu
atio
n o
f Good
s a
nd
S
erv
ices
Marketed
1Usually included in an economic analysis (e.g., poles, charcoal, woodchips, mangrove crabs)
2May be included (e.g., fish or shellfish caught in adjacent waters)
Non-marketed
3Seldom included (e.g., medicinal uses of mangrove, domestic fuelwood, food in times of famine, nursery area for juvenile fish, feeding ground for estuarine fish and shrimp, viewing and studying wildlife)
4Usually ignored (e.g., nutrient flows to estuaries, buffer to storm damage)

SOURCES OF MARKET FAILURE
Public goods (non-excludable; non-rival consumption)
Common property resources (non-excludable; rival consumption)
Externalities Un-priced assets and missing markets Lack of property rights Transaction costs Irreversibility Ignorance and uncertainty

SOURCES OF GOVERNMENT (POLICY) FAILURE
Failure to correct market distortions Subsidies to resource users and polluters Inappropriate tax incentives and credits Over-regulation and under-regulation Conflicting regulatory regimes Bureaucratic obstacles and inertia

The Concept of Total Economic Value (TEV)
u su a lly m e asu reso u tp u t
D ire c t u se va lu es(s tru c tu ra l va lu e s)
u su a lly m e asu resb e n e fits /serv ices
In d irec t use va lu es(fu n ctio n a l va lu e s)
O p tion va lu es
U se va lu es
E x iste n ce va lu es B e qu e st va lu es
N o n-u se valu es
Total Econom ic Value

Approaches to Valuation
Changes in Production Crops, fisheries,
water Health Opportunity cost
Hedonic Approaches Property value Land values Wage differential
Survey Techniques CVM (Contingent
Valuation Method) Surrogate
Markets Travel Cost

The Hedonic Pricing Method is most often used to estimate economic values for ecosystem or environmental services that directly affect market prices. It is most commonly applied to variations in housing prices that reflect the value of local environmental attributes. For example, it can be used to estimate economic benefits or costs associated with:
• environmental quality, including air
pollution, water pollution, or noise• environmental amenities, such as aesthetic
views or proximity to recreational sites

The basic premise of the hedonic pricing method is that the price of a marketed good is related to its characteristics, or the services it provides. In general, the price of a house is related to the characteristics of the house and property itself, the characteristics of the neighborhood and community, and environmental characteristics. Thus, if non-environmental factors are controlled for, then any remaining differences in price can be attributed to differences in environmental quality.
For example, if all characteristics of houses and neighborhoods throughout an area were the same, except for the level of air pollution, then houses with better air quality would cost more. This higher price reflects the value of cleaner air to people who purchase houses in the area.

The Contingent Valuation Method (CVM) is used to estimate economic values for all kinds of ecosystem and environmental services. It can be used to estimate both use and non-use values, and it is the most widely used method for estimating non-use values. It is also the most controversial of the non-market valuation methods.
The contingent valuation method involves directly asking people, in a survey, how much they would be willing to pay for specific environmental services. In some cases, people are asked for the amount of compensation they would be willing to accept to give up specific environmental services. It is called “contingent” valuation, because people are asked to state their willingness to pay, contingent on a specific hypothetical scenario and description of the environmental service.

Contingent valuation is one of the only ways to assign dollar values to non-use values of the environment—values that do not involve market purchases and may not involve direct participation.
These values are sometimes referred to as “passive use” values. They include everything from the basic life support functions associated with ecosystem health or biodiversity, to the enjoyment of a scenic vista or a wilderness experience, to appreciating the option to fish or bird watch in the future, or the right to bequest those options to your grandchildren.
It also includes the value people place on simply knowing that giant pandas or whales exist.

One of the first contingent valuation studies (1987) to measure the use and non-use values that citizens have for public trust resources was a survey of California households regarding willingness to pay for increased water flows into Mono Lake. The State of California Water Resources Control Board (WRCB) was faced with a decision about how much water to allocate to Los Angeles from sources flowing into Mono Lake. The reduced water flows to the lake were affecting food supplies for nesting and migratory birds. The cost of providing alternate sources to replace the water going into Mono Lake was $26 million per year.
The average willingness to pay per household was estimated from the survey to be $13 per month, or $156 per year. Is the decision to invest in alternate resources justified to save Mono Lake?

Valuing Human Health Risk
Private costs (born by individual) Pain & suffering, private medical expenses,
lost income External costs (born by others)
Publicly provided or insured medical expenses, sick pay
Methods Cost of illness, human capital Willingness to pay for benefit (WTP),
willingness to accept compensation for harm (WTA)

The Value of a Life Saved
Body – for chemicals ≈ $5
– for fluids, DNA & tissues ≈ $45 × 106
– 1,000 gm of bone marrow at $23,000/gm ≈ $23 × 106
Doctors & – $250,000 for non-economic damages, i.e., pain andInsurance Co. suffering
Median plaintiff in wrongful death cases – $900,000
Sept. 11, 2001 – $250,000 to $7 × 10⁶
Feb. 2004 – injured 9-year old awarded $47 × 106 against Ford
US Air Force – ski gondola causes 20 deaths, awarded $2 × 10⁶ each

The Value of a Life Saved (cont.)
US Government – shot down Iranian airliner in 1988, 290 victims,
$300,000 for wage earners; $150,000 for non- wage earners
Deaths in Iraq – US GI killed, family receives $250,000
DOT – values road improvements at $3 × 10⁶
EPA – $3 × 10⁶ in 1984 for benzene emissions
OSHA – $5.3 × 10⁶ for life saved due to grain dust rules
SuperFund – $3.2 × 10⁶ per life saved
EPA under Bush – reduced from $6.1 to $3.7 × 10⁶

Value per Statistical Life
Is NOT a measure of the intrinsic worth of an individual
Does NOT measure what an individual would pay to avoid certain death (or accept as compensation for certain death)
Depends on (total) baseline risk income and wealth
May depend on other characteristics of risk e.g., acute trauma or chronic disease “voluntary” or “involuntary”
May depend on social, cultural, economic factors

Choice of Valuation Technique Environmental Impact
Measurable change in production
Change in environmental quality
Yes
Nondistorted market prices available?
Use change-in-productivity approach
Use surrogate market approaches, apply shadow prices to changes in production
Yes No
Habitat
Opportunity-cost approach
Replacement cost approach
Land value approaches
Contingent Valuation
Air and water quality
No
Cost-effectiveness of prevention
Preventive expenditure
Replacement/ relocation costs
Health effects
Sickness Death
Medical costs
Loss of earnings
Human capital
CEA of prevention
Recreation
Contingent valuation
Travel cost
Aesthetic, Biodiversity, Cultural, Historical assets
Contingen Valuation
Contingent Valuation
Hedonic wage approach
Contingent Valuation

Costs and the time value of money
CATEGORIES OF COSTS
Capital cost
Operation and maintenance costs
Variable costs and fixed costs
Salvage value

ENGINEERING NEWS RECORD COST INDEX

Construction Cost Index History (1908-2003)HOW ENR BUILDS THE INDEX:
200 hours of common labor at the 20-city average of common labor rates, plus 25 cwt of standard structural steel shapes at the mill price prior to 1996 and the fabricated 20-city price from 1996, plus 1.128 tons of portland cement at the 20-city price, plus 1,088 board-ft of 2 x 4 lumber at the 20-city price
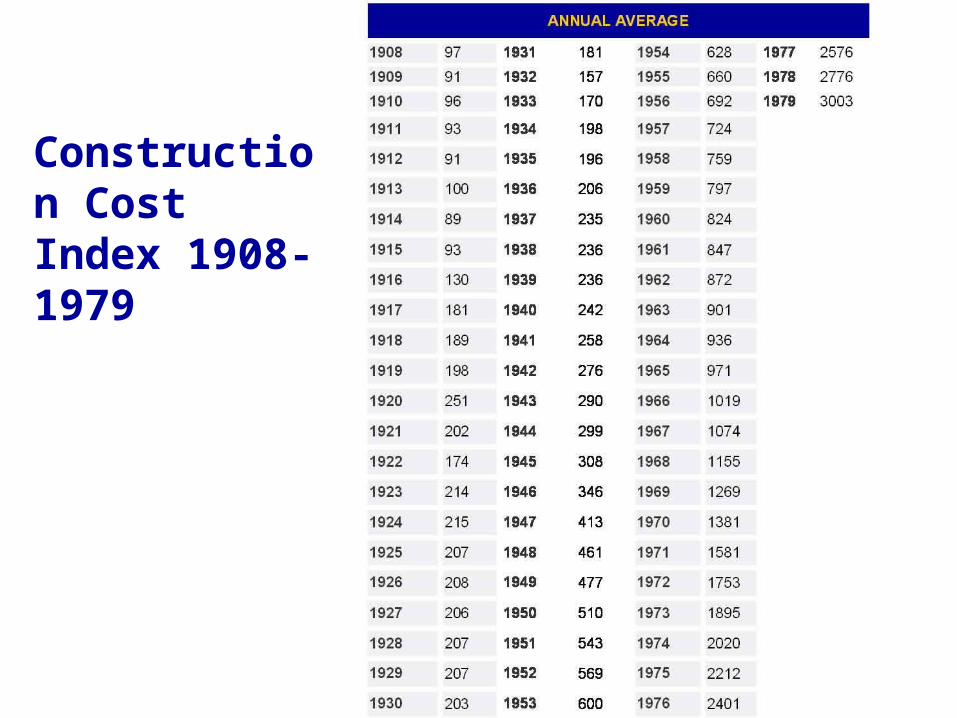
Construction Cost Index 1908-1979

TIME VALUE OF MONEY

CASH FLOW DIAGRAMS
The cash flow diagram is a simple tool to depict the cash flows over time
You must have an interest rate on the diagram
Capital costs
O&M costs
Salvage value

FUNDAMENTAL DISCOUNT FACTORS
P (present value)
F U(uniform series amount)(future amount)


Some Case Studies

Market Interest Rates US Long-term Government Bonds 1789-1999 (adjusted for inflation)
CLIMATE CHANGE EXAMPLE

Mean reverting based upon averaging between 1% and 7%
Random walk based upon thousands of random walks between 1% and 7%

Expected Discounted Value of Climate Mitigation Benefits (Due to a 1 ton
reduction in 2000)
(per ton Carbon)Gov. bond rate
Benefits from 1 ton of carbon mitigation
Relative to constant rate
4% Constant $5.74
Random walk $10.44 82%
Mean reverting $6.52 14%
2% Constant $21.73
Random walk $33.84 56%
Mean reverting $23.32 7%
7% Constant $1.48
Random walk $2.88 95%
Mean reverting $1.79 21%
The European spot market for carbon-trading on Nov. 12, 2007 was 21.9 Euros (approx. US$ 30).

Case Study 2: Hedonic Valuation
Hedonic Valuation Approaches: Use information on observed behavior
to estimate WTP (willingness to pay) for an environmental amenity (an economic ‘good’) or disamenity (an economic ‘bad’)
Requires information on transactions and differences in environmental quality
Often applied to housing, hotel rooms or other locational decisions (e.g. wages and a ‘sunshine tax’)

Case Study 2: Hedonic Valuation – Two Examples
1. Flats and hotel room pricing in resorts (e.g. on the beach in Hawaii)
Price varies with floor (higher floors are more expensive)
Price varies with view ocean view ‘garden view’… usually the parking lot, maybe the
mountains! Price vary with season:
High season/Low season Or, as in Costa Rica, high season and the ‘green’
season (e.g. rain!)

Case Study 2: Hedonic Valuation – Two Examples
2. Pricing of faculty flats at a university in China
1. 6 storey building, no lift, one flat per floor, roof leaks.
2. What is the monthly rental per flat? If ground floor rents for $100 per month, what are the monthly rents for the following floors?
Floor 2 ___ Floor 3 ___ Floor 4 ___ Floor 5 ___ Floor 6 (top) ___

Case Study 3: Valuing Health Impacts and Air Pollution –
SANTIAGO DE CHILE Major capital city with air and water
pollution problems Decision needed on levels of
investment in pollution control, and what to invest in
Desire to set investment between sectors and needs, e.g. control of air versus water pollution

Case Study 3: Valuing Health Impacts and Air Pollution –
SANTIAGO DE CHILECalculation of benefits of each control strategy1. Use a dispersion model to determine change in population-
weighted ambient exposures resulting from each control strategy.
2. Translate change in ambient exposures into health changes using dose-response functions:
Life-years gained (reductions in premature mortality) Reduced hospital admissions Fewer restricted-activity days Fewer cases of chronic bronchitis
3. Translate health benefits into health time gained plus reduced medical costs.
4. Value healthy time at the wage rate to compute a lower bound to the dollar value of health benefits.

Case Study 3: Valuing Health Impacts and Air Pollution –
SANTIAGO DE CHILEHow Can We Value a Life Saved?Several Major Approaches are commonly
used:1. Human Capital Approach/Loss of earnings
Uses the present value of future earnings lost due to premature death.
Theoretically flawed Ethically questionable Often used to give a lower bound estimate

Case Study 3: Valuing Health Impacts and Air Pollution –
SANTIAGO DE CHILE2. Wage differential approach to estimate VOSL – Value
Of a Statistical Life (revealed preferences)Uses information on different wages for jobs with different
levels of risk to estimate peoples WTAC (willingness to accept compensation) for increased risks.
Example:Wage differential approach (U.S. data):
Common Values from $3x10⁶ to $5x10⁶
Range $1.9 - $10.7x10⁶ (1990)WTP/CVM:
Range $1.2 - $9.7x10⁶
VOSL studies in U.S. are typically 5-10 times higher than foregone earnings.

Case Study 3: Valuing Health Impacts and Air Pollution –
SANTIAGO DE CHILE3. WTP studies for reduced risk of
premature deathAsks a WTP question for reduced risk (stated
preferences)Examples: Canada: to value a 5 in 10,000 risk change
C$657/.0005 =~ C$1,314,000 (about US$ 830,000) U.S. studies:
Range from $1 to $5 x 10⁶
Average: $3,000,000

Case Study 3: Valuing Health Impacts and Air Pollution –
SANTIAGO DE CHILEAnnualized benefits and costs of air pollution
control strategy in Santiago, Chile (US$ millions)
Program Component
Benefits Costs Net Benefits
Fixed sources 27 11 16
Gasoline vehicles 33 14 19
Buses 37 30 7
Trucks 8 4 4
Control Strategy 108 60 48
Source: World Bank, 1994

Recapitulation of Themes

Define GDP?Gross Domestic Product is the total final value of goods and services produced in the country by locally-owned firms or workers. This includes the value of products that are produced in that country for local consumption or for export, but does not include the imports from other countries. GDP is calculated by adding private and public spending, investments and exports, minus imports, and minus value generated by foreign-owned companies.
How are supply and demand curves estimated?The supply curve is the marginal cost of the producers, so it may be calculated from the production costs. The demand curve for a given product represents the total quantity of that product that people will want to buy at a given price. It is the sum of the total demand of all individuals in that society. So, demand is a behavioral aspect of consumers and supply is the technical response of producers.

Price elasticity reflects the effect of changes in price on the quantity that the consumers demand. The formula is: (DQ/Q)/( DP/P), where P is price and Q quantity. A price elasticity of 1 means that a price increase will lead to a quantity change of the same proportion. Demand may be elastic (elasticity > 1), meaning that a small change in price will cause a large change in demand. Demand may be inelastic (elasticity < 1) meaning that a large change in price will cause a small change in quantity.
Income elasticity reflects the sensitivity of demand to changes in income – that is, the change in quantity demanded at different income level. The formula is: (DQ/Q)/(DI/I), where I is income and Q quantity. Basic needs, such as basic food products, have low income elasticity (<1). Luxury goods have a high income elasticity (>1).
INCOME AND PRICE ELASTICITY

Public Goods, Common Property Resources, and Private Goods
Public Goods: non-excludable, non-rival consumption. (Lighthouse, flood control)
Common Property resources: non-excludable, rival consumption. (Fisheries, polluting streams)
Private Goods: excludable, and rival consumption. (Irrigation, domestic water supply.
Externalities
Externalities are caused when the actions of one person affect the welfare of other people who are not involved in that person’s decision-making process. The externalities may be positive or negative.

Shadow Pricing Refers to the assigning of prices to non-traded goods, or adjusting the value of traded goods to account for market failures
Evaluating Health BenefitsHuman capital approachWage differential approachWillingness to pay using contingent valuation
Discounting the futureMarket rates of discountSocial rates of discountPure time preferenceNon-exponential discounting for
intergenerationalProblems

Sources of Market Failure
Public goods (non-excludable; non-rival consumption)
Common property resources (non-excludable; rival consumption)
Externalities
Un-priced assets and missing markets
Lack of property rights
Transaction costs
Irreversibility
Ignorance and uncertainty