Embed Size (px)
Citation preview

Enviva Partners, LP
John Keppler – Chairman and CEO
2018 MLP & Energy Infrastructure ConferenceMay 23, 2018
(NYSE: EVA)

2
FORWARD-LOOKING AND CAUTIONARY STATEMENTS
Forward-looking statementsThis presentation contains “forward-looking statements” within the meaning of the securities laws. All statements, other than statements of historical fact, included in this
presentation that address activities, events or developments that Enviva Partners, LP (NYSE: EVA) (“Enviva,” the “Partnership,” “we,” or “us”) expects, believes or
anticipates will or may occur in the future are forward-looking statements. The words “believe,” “expect,” “may,” “estimates,” “will,” “anticipate,” “plan,” “intend,” “foresee,”
“should,” “would,” “could,” or other similar expressions are intended to identify forward-looking statements, which are generally not historical in nature. However, the
absence of these words does not mean that the statements are not forward-looking.
These statements are based on certain assumptions made by Enviva based on management’s expectations and perception of historical trends, current conditions,
anticipated future developments and other factors believed to be appropriate. Although Enviva believes that these assumptions were reasonable when made, because
assumptions are inherently subject to significant uncertainties and contingencies that are difficult or impossible to predict and are beyond its control, Enviva cannot give
assurance that it will achieve or accomplish these expectations, beliefs or intentions. A number of the assumptions on which these forward-looking statements are based
are subject to risks and uncertainties, many of which are beyond the control of Enviva, and may cause actual results to differ materially from those implied or expressed
by the forward-looking statements. These risks and uncertainties include the factors discussed or referenced in our filings with the Securities and Exchange Commission
(the “SEC”), including the Annual Report on Form 10-K and the Quarterly Reports on Form 10-Q most recently filed with the SEC, including those risks relating to financial
performance and results, economic conditions and resulting capital restraints, availability of sufficient capital to execute Enviva’s business plan, the ability of Enviva to
complete acquisitions and realize the anticipated benefits of such acquisitions, impact of compliance with legislation and regulations and other important factors that could
cause actual results to differ materially from those projected. When considering the forward-looking statements, you should keep in mind the risk factors and other
cautionary statements in such filings.
You are cautioned not to place undue reliance on forward-looking statements, which speak only as of the date on which such statement is made, and Enviva undertakes
no obligation to correct or update any forward-looking statement, whether as a result of new information, future events or otherwise, except as required by applicable law.
All forward-looking statements attributable to Enviva are qualified in their entirety by this cautionary statement.
Industry and market dataThis presentation has been prepared by Enviva and includes market data and other statistical information from third-party sources, including independent industry
publications, government publications or other published independent sources. Although Enviva believes these third-party sources are reliable as of their respective
dates, Enviva has not independently verified the accuracy or completeness of this information. Some data is also based on Enviva’s good faith estimates, which are
derived from its review of internal sources as well as the third-party sources described above.

3
Market driven by compelling industry fundamentals
~18% Market Growth
AdvantagedPortfolio of plants and ports
2018 Distribution of $2.53 per UnitEleven consecutive distribution increases since IPO
$6.0 Billion Revenue backlog with 9.0 year weighted average remaining term
~3 Million MTPYWorld’s largest utility-grade wood pellet producer
ENVIVA: HIGH-GROWTH, DROP-DOWN MLP WOOD PELLET PRODUCER
2 -3 million MTPY Sponsor development pipeline
Visible Drop-Down Inventory
1) MTPY: Metric Tons Per Year
2) Estimated ~18% market growth rate through 2021 is per Hawkins Wright: The Outlook for Wood Pellets – Demand, Supply, Costs and Prices; First Quarter 2018
3) Revenue backlog and weighted average remaining term of off-take contracts are as of April 15, 2018, excluding the 630,000 MTPY Japanese contracts that are subject to conditions precedent
4) On May 3, 2018, reaffirmed full-year 2018 distribution guidance of at least $2.53 per common and subordinated unit

4
FAMILIAR MIDSTREAM ACTIVITIES
CO
NV
EN
TIO
NA
L
Coal, Gas, Oil
Wood Fiber
Qualifying income generated by aggregating a natural resource (timber), processing it into fuel,
transporting pellets to deep-water marine storage terminals, and delivering ratably to utility customers
Upstream Midstream Downstream
Power GeneratorEnviva performs
activities similar to
midstream MLPs
without direct
exposure to crude oil
or natural gas prices
RE
NE
WA
BL
E
GA
TH
ER
ING
ST
OR
AG
E
Processing
Drying
Densifying
Truck
Rail
Vessel
Truck
Pipeline
Rail
Vessel
Processing
Washing
Fractionating
GA
TH
ER
ING
ST
OR
AG
ERefinery
BP
Valero
Drax
Ørsted (DONG)
ENGIE
MarubeniG
AT
HE
RIN
G

5
ENVIVA SOLVES A GROWING, UNMET CHALLENGE FOR GENERATORS
1) Japan is targeting 6.0 to 7.5 gigawatts (“GWs”) of biomass-fired capacity, which represents demand for 15 to 20 million metric tons per year (“MTPY”) of biomass, as part of its expected power source mix for 2030.
Source for biomass-fired capacity: Bloomberg New Energy Finance: Japan Biomass Market Update, June 30, 2016. Estimated demand for biomass of 15 to 20 million metric tons per year is based on Enviva’s
conservative estimates assuming power plant efficiencies similar to existing European customers. Actual biomass consumption at Japanese power plants may vary
2) Eurostat News Release – January 25, 2018; Publication: Share of renewables in energy consumption in the EU reached 17% in 2016
3) Hawkins Wright: The Outlook for Wood Pellets – Demand, Supply, Costs and Prices; First Quarter 2018. North America industrial pellet demand forecasted to be 100k tons in 2021
18.7
10.0 4.7
Europe
Asia
Supply
Gap
2021 Industrial Pellet Volume (Millions MTPY) 3Progress To Binding 2020 Renewables Targets 2
Demand Supply
Identified
Supply
24.9
Supply
Gap
3.9
Market demand growth (18% CAGR3) creates significant supply gap
Enviva is only enterprise supplier of scale
UK and EU are far short of 2020 and 2030 renewable targets
Japanese expected demand of 15 – 20 million MTPY by 20301
NL UK BEL FR GER DK
% of Target % Short
57%
38% 33% 30%
18%

6
OUR PRODUCT IS THE LOW-COST, DROP-IN SOLUTION FOR COAL
1) Aurora Energy Research – Biomass conversions & the system cost of renewables (November 2016). Total System Cost of Electricity (TSCE) is the per-megawatthour cost of building and operating a generating plant over an assumed financial
life including intermittency, security of supply, balancing, grid expansion, and heat adjustment (applicable for CHP only). Data is for Germany and may not be representative of all the markets in which we or our customers operate. CHP is
Combined Heat & Power. Expansion costs are related to the electricity grid only. New build CCGT could require gas grid expansions, the cost of which is not included here
2) IHS Markit: Levelized Cost of Power Generation in Japan, May 8, 2017. Costs are presented in real terms, as of 2020. In contrast to TSCE, Levelized Cost of Electricity (LCOE) does not include the intermittency costs associated with wind and
solar power. LCOE for Dedicated Biomass assumes biomass wood-burning power plants with 112 MW of capacity and 40% efficiency
Firm
dispatchable
capacity
Biomass is the lowest-
cost solution and
essential complement to
intermittent sources
of renewables
Total System Cost of Electricity
in Germany (€ / MWh)1
Levelized Cost of Electricity
in Japan in 2020 (US$ / MWh)2
Biomass Conversion with
CHP
CCGT
Biomass Conversion
Onshore Wind
Solar
0 € 50 € 100 € 150 €
Biomass Co-Firing
CCGT
Dedicated Biomass
Wind
Solar
$0 $50 $100 $150 $200 $250
7
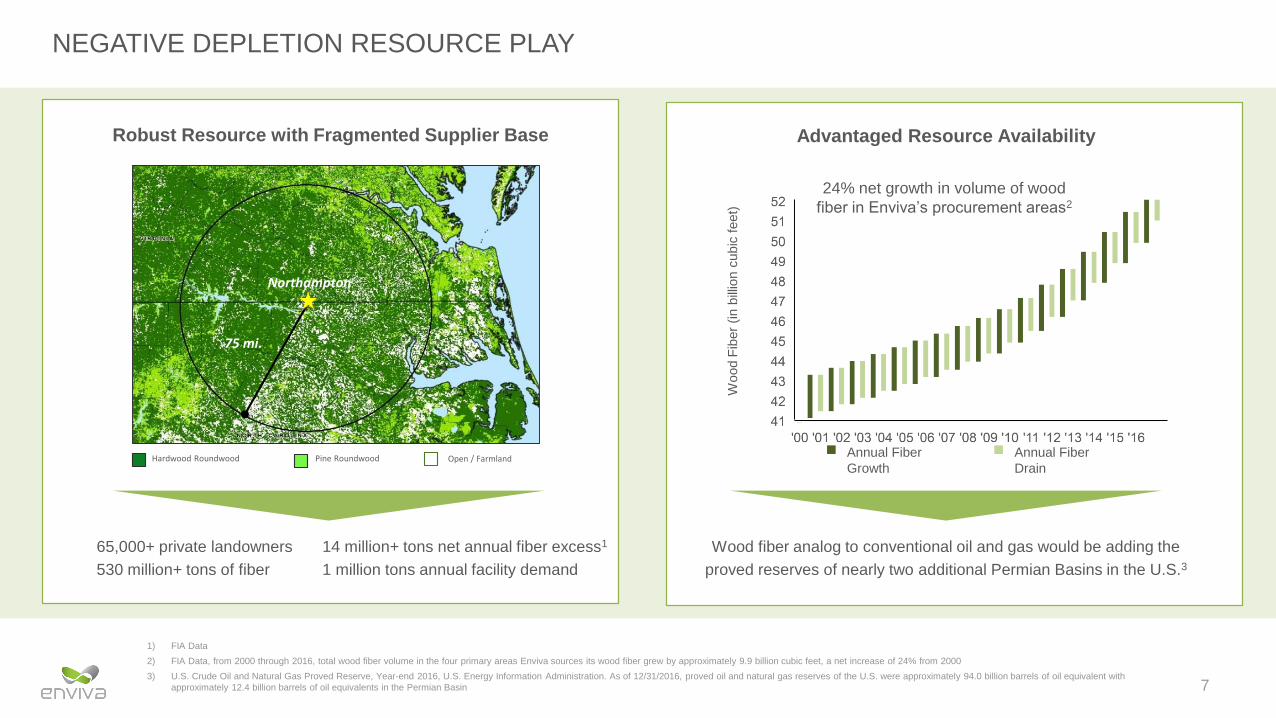
NEGATIVE DEPLETION RESOURCE PLAY
1) FIA Data
2) FIA Data, from 2000 through 2016, total wood fiber volume in the four primary areas Enviva sources its wood fiber grew by approximately 9.9 billion cubic feet, a net increase of 24% from 2000
3) U.S. Crude Oil and Natural Gas Proved Reserve, Year-end 2016, U.S. Energy Information Administration. As of 12/31/2016, proved oil and natural gas reserves of the U.S. were approximately 94.0 billion barrels of oil equivalent with
approximately 12.4 billion barrels of oil equivalents in the Permian Basin
65,000+ private landowners
530 million+ tons of fiber
Robust Resource with Fragmented Supplier Base
14 million+ tons net annual fiber excess1
1 million tons annual facility demand
75 mi.
Northampton
Hardwood Roundwood Pine Roundwood Open / Farmland
Wood fiber analog to conventional oil and gas would be adding the
proved reserves of nearly two additional Permian Basins in the U.S.3
Advantaged Resource Availability
Wood F
iber
(in b
illio
n c
ubic
feet)
Annual Fiber
Growth
Annual Fiber
Drain
24% net growth in volume of wood
fiber in Enviva’s procurement areas2

8
ROBUST RESOURCE CREATES STABLE PRICING & GLOBAL ADVANTAGE
1) Source: All data except data for Brazil are from RISI World Timber Price Quarterly – December 2017 for the third quarter of 2017. The wood chip price for Latvia is based on CIF Sweden. Data for Brazil is from Forest2Market - the
cost of delivered wood chips in Brazil is approximately US$41-$43 per green metric ton. The primary in-country market for these chips is the food production and crop industries, which use chips for heat and drying purposes.
However, the average minimum FOB price in Brazil is around US$148 per dry metric ton due to the logistical and administrative costs related to exporting these chips
2) Timber Mart-South-North Carolina 1991 – Q3 2017
Breaking the Fiber Logistics Barrier
Unlocks North American Basis Differential
Wood Chip Price US$ / Dry Ton1
Southern US
Germany
Latvia
Japan
$13
8
$124
$161
$136
$61
Pelletizing Fiber Breaks Logistics Barrier and Enables Worldwide Delivery
$148
Brazil
1.7% CAGR 1991 – 2017 North Carolina Pine Pulpwood
2.1% CAGR 1991 – 2017 North Carolina Hardwood Pulpwood
Delivered Cost of Fiber US$ / Green Ton
$-
$10
$20
$30
$40
'00 '01 '02 '03 '04 '05 '06 '07 '08 '09 '10 '11 '12 '13 '14 '15 '16 '17
Stable Southeast U.S. Fiber Cost2

9
▪ A “build and copy” approach allows for highly efficient, large-scale production facilities
and creates operating leverage
▪ Multi-plant profile and global scale translate into superior reliability and opportunities for
optimization
▪ Access to robust fiber baskets allows for reliable raw material supply and a flat marginal
cost curve for incremental production
DURABLE COMPETITIVE ADVANTAGE
1) Total production capacity and number of plants for Enviva are based on nameplate capacities of existing plants and the estimated capacity of the Hamlet and Greenwood plants, which are held by the Hancock JVs. Production capacity and
number of plants for other pellet producers are based on Hawkins Wright: The Outlook for Wood Pellets – Demand, Supply, Costs and Prices; First Quarter 2018
2) Although the Greenwood plant is included in the category of “under development/construction,” it is currently operational
Enviva is the world’s largest publicly
traded global enterprise supplier in a
highly fragmented industry with numerous
small, single-plant operators
0 500 1000 1500 2000 2500 3000 3500 4000
Enviva
Graanul Invest
Pinnacle Pellets
Drax Biomass
Georgia Biomass (RWE)
FRAM Renewable Fuels
Highland Pellets
Pacific Bioenergy
Tanac SA
Westervelt
Zilkha Biomass
Current Capacity Under development/construction or financed for completion by 20192
GLOBAL ENTERPRISE
SUPPLIERS
VERTICALLY-INTEGRATED
SUPPLIERS
SMALL & REGIONAL
SUPPLIERS
8
12
8
3
1
3
1
3
1
1
Enviva U.S.
Baltics
Canada
U.S.
U.S.
U.S.
U.S.
Canada
Brazil
U.S.
Production Capacity (Thousand MTPY) Location# of
Plants1
Enviva’s existing production represents
approximately 14% of current global utility-
grade wood pellet production capacity11 U.S.

10
FULLY CONTRACTED PRODUCTION PROFILE
Contracted volumes in the graph above include only contracts of Enviva Partners, LP or its subsidiaries and do not include volumes under the Hancock JVs’ contracts
1) As of April 15, 2018, excluding the 630,000 MTPY Japanese contracts that are subject to conditions precedent
2) Does not take into account opportunities the Partnership expects to have to increase production capacity
3) Represents the estimated volumes the Partnership is expected to purchase from the Second Hancock JV under the off-take contract for the Greenwood plant’s production and does not include volumes sourced from third parties
Thousand MTPY
$6.0 Billion Contracted revenue backlog1
9.0 Years Partnership’s weighted-average remaining
term of off-take contracts1
Sales strategy is to fully contract our
production capacity under
long-term agreements
0
500
1,000
1,500
2,000
2,500
3,000
3,500
2018 2019 2020 2021
EVA Production 2 Firm Off-Take ContractsEVA Purchases 3

11
Port of Panama City, FLPort of Mobile, AL
ENVIVA PARTNERS: PRODUCTION PLANTS AND TERMINAL ASSETS
Amory, MS
120k MTPY
Cottondale, FL
730k MTPY Annual Production Capacity
Port of Wilmington, NC
3 million MTPY Throughput
Southampton, VA
550k MTPY
Northampton, NC
550k MTPY Ahoskie, NC
400k MTPY
Port of Chesapeake, VA
2 million MTPY Throughput
Plants PortsSampson, NC
600k MTPY Annual Production Capacity

12
THREE PILLARS OF GROWTH
▪ Pricing increases and escalators under
existing contracted position
▪ 7 - 10% annual organic growth driven by
contract price escalations, cost reduction,
and productivity improvements
▪ 5% increase in nameplate production
capacity achieved in 2017 over 20161
▪ Nameplate capacity at the Cottondale
plant improved from 650,000 MTPY upon
acquisition to 730,000 MTPY today
▪ Reduced delivered fiber costs by
approximately 5% in 2017 from 20162
1) Based on increases in nameplate capacity at the Amory, Ahoskie, Southampton, Northampton, Cottondale, and Sampson plants from 2016 to 2017
2) Based on decreases in delivered fiber costs for Amory, Ahoskie, Southampton, Northampton, and Cottondale plants from 2016 to 2017; the Sampson plant is not included as it was not owned by the Partnership for the full year of 2016
▪ Three drop-downs since IPO including 1.1
million MTPY of production capacity and 3
million MTPY of terminaling capacity
▪ Visible 2019/2020 drop-down pipeline
includes incremental Wilmington terminal
adjusted EBITDA, the Hamlet plant, and the
Greenwood plant:
▪ Incremental Wilmington terminal adjusted
EBITDA with Hamlet volume
▪ One production plant drop-down expected
in each of 2019 and 2020
▪ 2 – 3 million MTPY development pipeline at
Sponsor
▪ The Second Hancock JV expects to make
the final investment decision on a deep-
water marine terminal in Pascagoula, MS
and a wood pellet production plant in
Lucedale, MS in late 2018 or early 2019
▪ Proven, successful, and selective acquirer
▪ Acquisitions must compare favorably to
Sponsor development pipeline and drop-
down economics
▪ Target opportunities must be core to the
business and bring new customer set,
strategic capability, and/or geographic
diversification
Organic Growth within the Partnership
Accretive Drop-Downs
from Sponsor
Third-Party Acquisition
Opportunities

13
VISIBLE GROWTH
1) On February 22, 2018, provided full-year 2018 guidance for adjusted EBITDA in a range of $118 million to $122 million. Although we believe that the Partnership’s full-year 2018 guidance for adjusted EBITDA and distributable cash flow remains
achievable despite the February 27, 2018 fire (the “Chesapeake Incident”) at the Partnership’s marine export terminal at the Port of Chesapeake, Virginia (the “Chesapeake terminal”), the actual amounts we report for any specific quarter and for full-
year 2018 will be partially dependent on the amount of recoveries from insurers and other responsible parties, the timing and performance of which are not entirely within the Partnership’s control
2) Based on estimated run-rate adjusted EBITDA for Wilmington once the Hamlet plant reaches its expected full production rate of 600,000 MTPY. Additional details are available as part of our Earnings Release as of May 10, 2017. Although we expect the
Hamlet plant to be successfully completed, we cannot assure you that our Sponsor or the Hancock JVs will be successful in completing this development project
3) The estimated incremental adjusted EBITDA that can be expected from a plant drop-down is based on similar plants in our portfolio. Although we expect to have the opportunity to acquire assets or completed development projects, including the Hamlet
and Greenwood plants, from our Sponsor or the Hancock JVs in the future, we cannot assure you that our Sponsor or the Hancock JVs will be successful in completing their development/improvement projects or that we will successfully negotiate an
agreement with our Sponsor or the Hancock JVs to acquire such assets or projects
4) The Second Hancock JV is currently developing a deep-water marine terminal in Pascagoula, Mississippi and a wood pellet production plant in Lucedale, Mississippi, and expects to make a final investment decision on these facilities in late 2018 or
early 2019. Although we expect to have the opportunity to acquire assets or completed development projects from our Sponsor or the Second Hancock JV in the future, we cannot assure you that our Sponsor or the Second Hancock JV will be
successful in completing their development/improvement projects or that we will successfully negotiate an agreement with our Sponsor or the Second Hancock JV to acquire such assets or projects
See slides 21 and 22 for reconciliation of estimated adjusted EBITDA to estimated net (loss) income. For an explanation of why we are unable to reconcile the estimated adjusted EBITDA for Wilmington once the Hamlet plant reaches its expected full
production rate to the most directly comparable GAAP financial measures, please see slide 23
$60
$80
$100
$120
$140
$160
$180
$200
$220
$240
2018 Guidance1
Port of Wilmington
Throughput from Hamlet2
2019 Plant
Drop-Down3
$118
–
$122
$6 - $8
$20+
7 – 10% Underlying Annual Organic Growth in Base Business without Drop-Downs
Visible Adjusted
EBITDA Growth
Adju
ste
d E
BIT
DA
($ m
illio
ns)
2020 Plant
Drop-Down3
$20+
7 – 10% annual organic growth expected in underlying base business without drop-down acquisitions
Potential Terminal
in Pascagoula4
Potential Plant
in Lucedale4

14
Continued growth in European markets,
incremental demand from existing customers
Asian demand driven by new feed-in tariffs,
capacity needs, and renewable standards
Nearly Halfof renewable energy
production in EU is from
solid biomass1
15 - 20 Million MTPY of Japanese
biomass demand by
20302
1) Eurostat – Renewable Energy Statistics – February 02, 2018. Solid biomass, which includes wood, other biofuel and renewable wastes, represented approximately 49.4% of primary renewable production in the EU-28 in 2016;
2) Japan is targeting 6.0 to 7.5 gigawatts (“GWs”) of biomass-fired capacity, which represents demand for 15 to 20 million metric tons per year (“MTPY”) of biomass, as part of its expected power source mix for 2030. Source for biomass-fired
capacity: Bloomberg New Energy Finance: Japan Biomass Market Update, June 30, 2016. Estimated demand for biomass of 15 to 20 million metric tons per year is based on Enviva’s conservative estimates assuming power plant efficiencies
similar to existing European customers. Actual biomass consumption at Japanese power plants may vary
RAPIDLY GROWING CUSTOMER BASE AND DEMAND

15
FAST GROWING INDUSTRIAL MARKET DEMAND AND ADDITIONAL GROWTH OPPORTUNITIES
Enviva primarily serves the
industrial market…
1) Hawkins Wright: The Outlook for Wood Pellets – Demand, Supply, Costs and Prices; First Quarter 2018. North America industrial pellet demand forecasted to be 100k tons in each of 2017-2021
WOOD PELLETS ARE LARGELY FUNGIBLE ACROSS INDUSTRIAL AND HEATING MARKETS
….and servicing European
thermal market via a hub
… but increasingly shipping to another
large, growing market…
-
5,000
10,000
15,000
20,000
25,000
30,000
2017 2018 2019 2020 2021
Metr
ic T
ons (
000’s
)
Industrial Pellet Forecasted Demand1
Europe Asia North America
-
5,000
10,000
15,000
20,000
25,000
30,000
2017 2018 2019 2020 2021
Metr
ic T
ons (
000’s
)
Heating Pellet Forecasted Demand1
Europe Asia North America Other

161) Assets under control / assessment are shown at approximate locations
2 – 3 MillionMTPY additional capacity to
serve growing European and
Asian markets
ROBUST SPONSOR DEVELOPMENT PIPELINE
“Build and copy”approach to create strategic
clusters of assetsPort of Pascagoula, MS
Port of Jacksonville, FL
Plants in the Partnership
Plants under construction / expansion
Plant sites under control / assessment1
Ports in or leased by the Partnership
Port sites under control / assessment1
Sponsor’s Development Pipeline
Greenwood, SC
Hamlet, NC
Lucedale, MS

17
STRATEGIC CLUSTERS
1) Currently owned by the First Hancock JV
2) Currently owned by the Second Hancock JV
3) Additional details are available as part of our Earnings Release as of November 3, 2016
4) For a reconciliation of estimated adjusted EBITDA to estimated net (loss) income, please see slide 22. Additional details are available as part of our Earnings Release as of May 10, 2017
5) For an explanation of why we are unable to reconcile the estimated adjusted EBITDA of $16.0 million per year for Enviva’s Port of Wilmington terminal once the Hamlet plant reaches its expected full production rate to the most directly
comparable GAAP financial measures, please see slide 23
6) The Greenwood plant is expected to increase production capacity to 600,000 MTPY in 2019, after production ramp and incremental capital investments have been completed, subject to receipt of necessary permits
Sampson Plant Port of Wilmington Hamlet Plant1
Hamlet Plant
Sampson Plant
Greenwood Plant
Port of Wilmington
Plants
Port
▪ 600,000 MTPY capacity
▪ Expected to be
operational early 2019
▪ Production expected to
support our Sponsor’s
off-take contract to
supply the Macquarie
MGT Teesside project
in the UK
Wilmington, NC Asset Cluster
▪ 600,000 MTPY upon
achieving full production
capacity3
▪ Drop-down acquisition
completed in December
2016 and included a
long-term contract with
Ørsted (formerly known
as DONG)
▪ 3 million MTPY capacity
▪ Drop-down acquisition
completed in October
2017
▪ $8 million adjusted
EBITDA growing to $16
million once the Hamlet
plant reaches its
expected full production
rate of 600,000 MTPY4,5
Greenwood Plant2
▪ Expected to increase
production capacity to
600,000 MTPY in 20196
▪ Production will be
initially sold to the
Partnership under a 4-
year off-take contract

18
MARKET GROWTH DRIVEN BY APPLICATION DIVERSITY
Price P
er
Ton
Market Application and Potential Size1
1) Graph illustrative only.
Chemicals
Polymers
Bio-Crude
Future
Coal
Displacement
Cellulosic (C5 / C6 sugar)
Lignin bi-products
CHP
Industrial Steam
District Heating Loops
Retail Heating
Combined Heat & Power
Ma
rket
Dri
ve
nP
oli
cy D
rive
n
Long-term contracted
demand for wood pellet
displacement of coal has
enabled substantial
infrastructure investment
in processing and
logistics assets
Resulting global
distribution capability for
low cost fiber creates
emerging demand from
other applications for
wood pellets

19
Appendix: Financial Information

20
This presentation contains certain financial measures that are not presented in accordance with GAAP. Although they should not be considered alternatives to the GAAP presentation of
the financial results of the Partnership, management views such non-GAAP measures as important to reflect the Partnership’s actual performance during the periods presented, including
as measured against our published guidance, which did not include the impact of certain acquisitions made by the Partnership.
Non-GAAP Financial MeasuresWe use adjusted gross margin per metric ton, adjusted EBITDA, and distributable cash flow to measure our financial performance..
Adjusted Gross Margin per Metric TonWe define adjusted gross margin as gross margin excluding asset disposals and depreciation and amortization included in cost of goods sold. We believe adjusted gross margin per
metric ton is a meaningful measure because it compares our revenue-generating activities to our operating costs for a view of profitability and performance on a per metric ton basis.
Adjusted gross margin per metric ton will primarily be affected by our ability to meet targeted production volumes and to control direct and indirect costs associated with procurement and
delivery of wood fiber to our production plants and the production and distribution of wood pellets.
Adjusted EBITDAWe define adjusted EBITDA as net income or loss excluding depreciation and amortization, interest expense, income tax expense, early retirement of debt obligations, non-cash unit
compensation expense, asset impairments and disposals, changes in the fair value of derivative instruments, and certain items of income or loss that we characterize as unrepresentative
of our ongoing operations, including certain expenses incurred related to the Chesapeake Incident (consisting of emergency response expenses, expenses related to the disposal of
inventory, and asset disposal and repair costs, offset by insurance recoveries). Adjusted EBITDA is a supplemental measure used by our management and other users of our financial
statements, such as investors, commercial banks, and research analysts, to assess the financial performance of our assets without regard to financing methods or capital structure.
Distributable Cash FlowWe define distributable cash flow as adjusted EBITDA less maintenance capital expenditures and interest expense net of amortization of debt issuance costs, debt premium and original
issue discounts. We use distributable cash flow as a performance metric to compare the cash-generating performance of the Partnership from period to period and to compare the cash-
generating performance for specific periods to the cash distributions (if any) that are expected to be paid to our unitholders. We do not rely on distributable cash flow as a liquidity
measure.
Adjusted gross margin per metric ton, adjusted EBITDA, and distributable cash flow are not financial measures presented in accordance with GAAP. We believe that the presentation of
these non-GAAP financial measures provides useful information to investors in assessing our financial condition and results of operations. Our non-GAAP financial measures should not
be considered as alternatives to the most directly comparable GAAP financial measures. Each of these non-GAAP financial measures has important limitations as an analytical tool
because they exclude some, but not all, items that affect the most directly comparable GAAP financial measures. You should not consider adjusted gross margin per metric ton, adjusted
EBITDA, or distributable cash flow in isolation or as substitutes for analysis of our results as reported under GAAP. Our definitions of these non-GAAP financial measures may not be
comparable to similarly titled measures of other companies, thereby diminishing their utility.
NON-GAAP FINANCIAL MEASURES
21
NON-GAAP FINANCIAL MEASURES RECONCILIATION (CONT.)
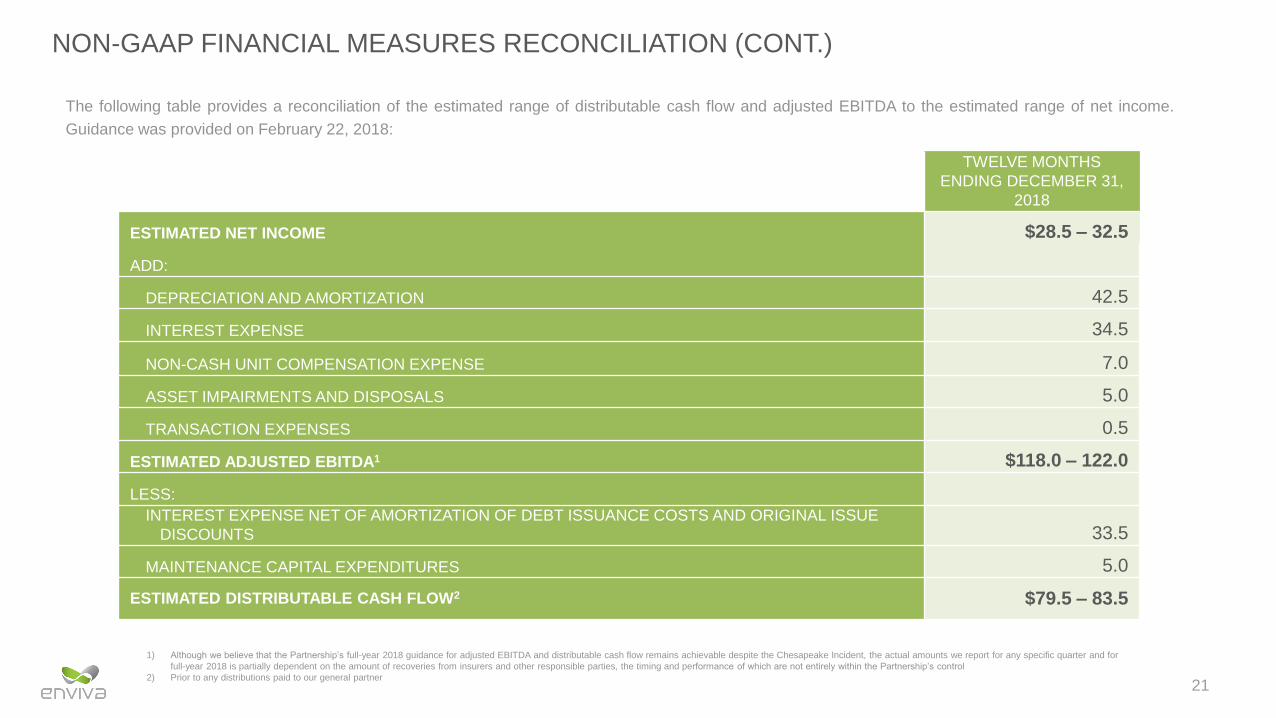
The following table provides a reconciliation of the estimated range of distributable cash flow and adjusted EBITDA to the estimated range of net income.
Guidance was provided on February 22, 2018:
TWELVE MONTHS
ENDING DECEMBER 31,
2018
ESTIMATED NET INCOME $28.5 – 32.5
ADD:
DEPRECIATION AND AMORTIZATION 42.5
INTEREST EXPENSE 34.5
NON-CASH UNIT COMPENSATION EXPENSE 7.0
ASSET IMPAIRMENTS AND DISPOSALS 5.0
TRANSACTION EXPENSES 0.5
ESTIMATED ADJUSTED EBITDA1 $118.0 – 122.0
LESS:
INTEREST EXPENSE NET OF AMORTIZATION OF DEBT ISSUANCE COSTS AND ORIGINAL ISSUE
DISCOUNTS 33.5
MAINTENANCE CAPITAL EXPENDITURES 5.0
ESTIMATED DISTRIBUTABLE CASH FLOW2 $79.5 – 83.5
1) Although we believe that the Partnership’s full-year 2018 guidance for adjusted EBITDA and distributable cash flow remains achievable despite the Chesapeake Incident, the actual amounts we report for any specific quarter and for
full-year 2018 is partially dependent on the amount of recoveries from insurers and other responsible parties, the timing and performance of which are not entirely within the Partnership’s control
2) Prior to any distributions paid to our general partner
22
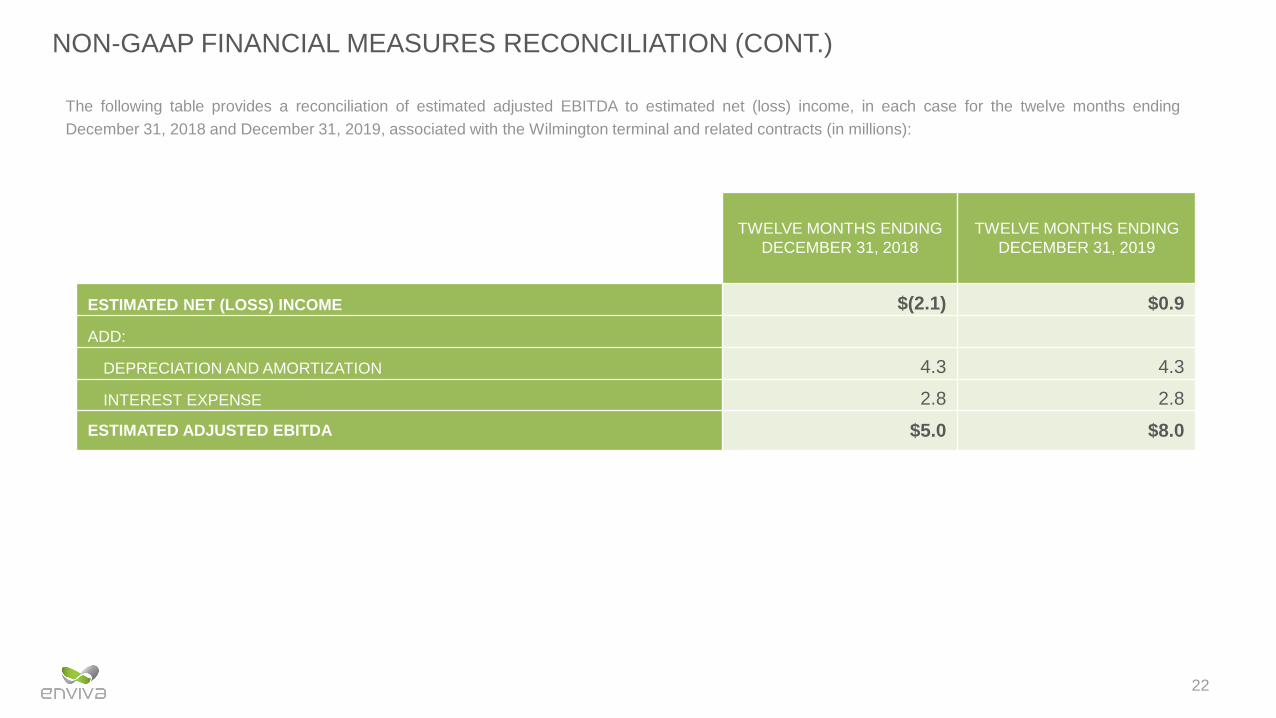
NON-GAAP FINANCIAL MEASURES RECONCILIATION (CONT.)
The following table provides a reconciliation of estimated adjusted EBITDA to estimated net (loss) income, in each case for the twelve months ending
December 31, 2018 and December 31, 2019, associated with the Wilmington terminal and related contracts (in millions):
TWELVE MONTHS ENDING
DECEMBER 31, 2018
TWELVE MONTHS ENDING
DECEMBER 31, 2019
ESTIMATED NET (LOSS) INCOME $(2.1) $0.9
ADD:
DEPRECIATION AND AMORTIZATION 4.3 4.3
INTEREST EXPENSE 2.8 2.8
ESTIMATED ADJUSTED EBITDA $5.0 $8.0

23
NON-GAAP FINANCIAL MEASURES RECONCILIATION (CONT.)
Our Sponsor’s estimates of incremental adjusted EBITDA for the Wilmington terminal, the Hamlet plant, and the Greenwood plant are based on numerous
assumptions that are subject to significant risks and uncertainties. The assumptions underlying our Sponsor’s estimates of incremental adjusted EBITDA
generated by certain of its assets are inherently uncertain and subject to significant business, economic, financial, regulatory, and competitive risks and
uncertainties that could cause actual results and amounts to differ materially from those estimates. For more information about such significant risks and
uncertainties, please see the risk factors discussed or referenced in our filings with the Securities and Exchange Commission (the “SEC”), including the
Annual Report on Form 10-K and the Quarterly Reports on Form 10-Q most recently filed with the SEC.
A reconciliation of Wilmington’s estimated incremental adjusted EBITDA to account for anticipated throughput from the Hamlet plant to the closest GAAP
financial measure, and an estimate of incremental adjusted EBITDA for the Hamlet plant, the Greenwood plant, or other potential drop-downs of deep-water
marine terminal(s) or wood pellet production plant(s), are not provided because the GAAP net income to be generated by the Wilmington terminal, the
Hamlet plant, the Greenwood plant, or other potential drop-downs of deep-water marine terminal(s) or wood pellet production plant(s) is not available without
unreasonable effort, in part because the amount of estimated incremental interest expense related to the financing of the additional payment for the
Wilmington terminal due upon first deliveries from the Hamlet plant, the Hamlet drop-down, the Greenwood drop-down, or other potential drop-downs of
deep-water marine terminal(s) or wood pellet production plant(s) is not available at this time.