Embed Size (px)
Citation preview
NUREG/CR-4667, Vol. 27 ANL-99/11
Environmentally Assisted Cracking in Light Water Reactors
Semiannual Report July 1998 - December 1998
Argonne National Laboratory
U.S. Nuclear Regulatory Commission Office of Nuclear Regulatory Research Washington, DC 20555-0001
AVAILABILITY NOTICE
Availability of Reference Materials Cited in NRC Publications
NRC publications in the NUREG series, NRC regulations, and Title 10, Energy, of the Code of Federal Regulations, may be purchased from one of the following sources:
1. The Superintendent of Documents U.S. Government Printing Office PO. Box 37082 Washington, DC 20402-9328 <http://www.access.gpo.gov/sudocs> 202-512-1800
2. The National Technical Information Service Springfield, VA 22161-0002 < http://www. ntis.gov/ordernow> 703-487-4650
The NUREG series comprises (1) brochures (NUREG/BR-XXXX), (2) proceedings of conferences (NUREG/CP-XXXX), (3) reports resulting from international agreements (NUREG/IA-XXXX), (4) technical and administrative reports and books [(NUREG-)XXX) or (NUREG/CR-XXXX)], and (5) compilations of legal decisions and orders of the Commission and Atomic and Safety Licensing Boards and of Office Directors' decisions under Section 2.206 of NRC's regulations (NUREGxxOON.
A single copy of each NRC draft report is available free, to the extent of supply, upon written request as follows:
Address: Office of the Chief Information Officer Reproduction and Distribution
Services Section U.S. Nuclear Regulatory Commission Washington, DC 20555-0001
E-mail: <[email protected]> Facsimile: 301-415-2289
A portion of NRC regulatory and technical information is available at NRC's World Wide Web site:
<http://www.nrc.gov>
All NRC documents released to the public are available for inspection or copying for a fee, in paper, microfiche, or, in some cases, diskette, from the Public Document Room (PDR):
NRC Public Document Room 2120 L Street, N.W., Lower Level Washington, DC 20555-0001 <http://www.nrc.gov/NRC/PDR/pdrl.htm> 1-800-397-4209 or locally 202-634-3273
Microfiche of most NRC documents made publicly available since January 1981 may be found in the Local Public Document Rooms (LPDRs) located in the vicinity of nuclear power plants. The locations of the LPDRs may be obtained from the PDR (see previous paragraph) or through:
<http://www.nrc.gov/NRC/NUREGS/ SR1350N9/lpdr/html>
Publicly released documents include, to name a few, NUREG-series reports; Federal Register notices; applicant, licensee, and vendor documents and correspondence; NRC correspondence and internal memoranda; bulletins and information notices; inspection and investigation reports; licensee event reports; and Commission papers and their attachments.
Documents available from public and special technical libraries include all open literature items, such as books, journal articles, and transactions, Federal Register notices, Federal and State legislation, and congressional reports. Such documents as theses, dissertations, foreign reports and translations, and non-NRC conference proceedings may be purchased from their sponsoring organization.
Copies of industry codes and standards used in a substantive manner in the NRC regulatory process are maintained at the NRC Library, Two White Flint North, 11545 Rockville Pike, Rockville, MD 20852-2738. These standards are available in the library for reference use by the public. Codes and standards are usually copyrighted and may be purchased from the originating organization or, if they are American National Standards, from
American National Standards Institute 11 West 42nd Street New York, NY 10036-8002 <http://www.ansi.org> 212-642-4900
DISCLAIMERThis report was prepared as an account of work sponsored by an agency of the United States Government. Neither the United States Government nor any agency thereof, nor any of their employees, makes any warranty, expressed or implied, or assumes
any legal liability or responsibility for any third party's use, or the results of such use, of any information, apparatus, product, or process disclosed in this report, or represents that its use by such third party would not infringe privately owned rights.
NUREG/CR-4667, Vol. 27 ANL-99/11
Environmentally Assisted Cracking in Light Water Reactors
Semiannual Report July 1998 - December 1998
Manuscript Completed: October 1999 Date Published: October 1999
Prepared by O.K. Chopra, H.M. Chung, E.E. Gruber, T.F. Kassner, W.E. Ruther, W.J. Shack, J.L. Smith, WX. Soppet, R.V. Strain
Argonne National Laboratory 9700 South Cass Avenue Argonne, IL 60439
M.B. McNeil, NRC Project Manager
Prepared for Division of Engineering Technology Office of Nuclear Regulatory Research U.S. Nuclear Regulatory Commission Washington, DC 20555-0001 NRC Job Code W6610
Previous Documents in Series
Environmentally Assisted Cracking in Light Water Reactors Semiannual Report
April-September 1985, NUREG/CR-4667 Vol. I, ANL-86-31 (June 1986).
October 1985-March 1986, NUREG/CR-4667 Vol. II, ANL-86-37 (September 1987).
April-September 1986, NUREG/CR-4667 Vol. III, ANL-87-37 (September 1987).
October 1986-March 1987, NUREG/CR-4667 Vol. IV, ANL-87-41 (December 1987).
April-September 1987, NUREG/CR-4667 Vol. V, ANL-88-32 (June 1988).
October 1987-March 1988, NUREG/CR-4667 Vol. 6, ANL-89/ 10 (August 1989).
April-September 1988, NUREG/CR-4667 Vol. 7, ANL-89/40 (March 1990).
October 1988-March 1989, NUREG/CR-4667 Vol. 8, ANL-90/4 (June 1990).
April-September 1989, NUREG/CR-4667 Vol. 9, ANL-90/48 (March 1991).
October 1989-March 1990, NUREG/CR-4667 Vol. 10, ANL-91/5 (March 1991).
April-September 1990, NUREG/CR-4667 Vol. 11, ANL-91/9 (May 1991).
October 1990-March 1991, NUREG/CR-4667 Vol. 12, ANL-91/24 (August 1991).
April-September 1991, NUREG/CR-4667 Vol. 13, ANL-92/6 (March 1992).
October 1991-March 1992, NUREG/CR-4667 Vol. 14, ANL-92/30 (August 1992).
April-September 1992, NUREG/CR-4667 Vol. 15, ANL-93/2 (June 1993).
October 1992-March 1993, NUREG/CR-4667 Vol. 16, ANL-93/27 (September 1993).
April-September 1993, NUREG/CR-4667 Vol. 17, ANL-94/26 (June 1994).
October 1993-March 1994, NUREG/CR-4667 Vol. 18, ANL-95/2 (March 1995).
April-September 1994, NUREG/CR-4667 Vol. 19, ANL-95/25 (September 1995).
October 1994-March 1995, NUREG/CR-4667 Vol. 20, ANL-95/41 (January 1996).
April-December 1995, NUREG/CR-4667 Vol. 21, ANL-96/1 (July 1996).
January 1996--June 1996, NUREG/CR-4667 Vol. 22, ANL-97/9 (June 1997).
July 1996-December 1996, NUREG/CR-4667 Vol. 23, ANL-97/ 10 (October 1997).
January 1997-June 1997, NUREG/CR-4667 Vol. 24, ANL-98/6 (April 1998).
July 1997-December 1997, NUREG/CR-4667 Vol. 25, ANL-98/18 (September 1998).
January 1998-June 1998, NUREG/CR-4667 Vol. 26, ANL-98/30 (December 1998).
NUREG/CR-4667, Vol. 27 ii
Environmentally Assisted Cracking in Light Water Reactors Semiannual Report July 1998-December 1998
by
0. K. Chopra, H. M. Chung, E. E. Gruber, T. F. Kassner, W. E. Ruther, W. J. Shack, J. L. Smith, W. K. Soppet, and R. V. Strain
Abstract
This report summarizes work performed by Argonne National Laboratory on fatigue and environmentally assisted cracking (EAC) in light water reactors from July 1998 to December 1998. Topics that have been investigated include (a) environmental effects on fatigue S-N behavior of primary pressure boundary materials, (b) irradiation-assisted stress corrosion cracking of austenitic stainless steels (SSs), and (c) EAC of Alloys 600 and 690. Fatigue tests have been conducted to determine the crack initiation and crack growth characteristics of austenitic SSs in LWR environments. Procedures are presented for incorporating the effects of reactor coolant environments on the fatigue life of pressure vessel and piping steels. Slowstrain-rate tensile tests and posttest fractographic analyses were conducted on several model SS alloys irradiated to =0.3 and 0.9 x 10²¹ n-cm-2 (E > 1 MeV) in helium at 2890 C in the Halden reactor. The results have been used to determine the influence of alloying and impurity elements on the susceptibility of these steels to irradiation-assisted stress corrosion cracking. Fracture toughness J-R curve tests were also conducted on two heats of Type 304 SS that were irradiated to -0.3 x 10²¹ n-cm-2 in the Halden reactor. Crack-growth-rate tests have been conducted on compact-tension specimens of Alloys 600 and 690 under constant load to evaluate the resistance of these alloys to stress corrosion cracking in LWR environments.
NUREG/CR-4667, Vol. 27°.°
Contents
Abstract ....................................................................................................................... Il
Executive Summary ....................................................................................................... xi
Acknowledgments ........................................................................................................ Xiv
1 Introduction ........................................................................................................... 1
2 Environmental Effects on Fatigue Strain-versus-Life (S-N) Behavior of Primary
Pressure Boundary Materials ................................................................................... 2
2.1 Methods for Incorporating Effects of LWR Coolant Environment into ASME
Code Fatigue Evaluations ............................................................................. 2
2.1.1 Fatigue S-N Data in LWR Environments ............................................. 5
2.1.2 Mechanism of Fatigue Crack Initiation ................................................ 6
2.1.3 Incorporating Environmental Effects into ASME Fatigue Evaluations .... 8
2.1.4 Conservatism in Design Fatigue Curves .............................................. 14
2.1.5 Fatigue Evaluations in LWR Environments .......................................... 15
2.1.6 Conclusions ....................................................................................... 17
2.2 Crack Initiation in Smooth Fatigue Specimens of Austenitic Stainless Steel
in LWR Environments ................................................................................... 18
2.2.1 Experimental ..................................................................................... 18
2.2.2 Results ............................................................................................. 20
2.2.3 Discussion ....................................................................................... 24
2.2.4 Conclusions ....................................................................................... 24
3 Irradiation-Assisted Stress Corrosion Cracking of Austenitic SS ............................... 25
3.1 Introduction .................................................................................................. 25
3.2 Slow-Strain-Rate Tensile Testing of Model Austenitic SSs Irradiated in the
Halden Reactor ............................................................................................. 28
3.2.1 SSRT Testing and Fractographic Analysis of Low-Fluence Specimens ..... 28
3.2.2 SSRT Testing and Fractographic Analysis of Medium-Fluence
Specimens .......................................................................................... 33
3.3 Fracture Toughness J-R Test of Austenitic Stainless Steels Irradiated in the
Halden Reactor ............................................................................................. 39
3.3.1 Experimental ..................................................................................... .40
3.3.2 Results .............................................................................................. 43
v NUREG/CR-4667, Vol. 27
4 Environmentally Assisted Cracking of Alloys 600 and 690 in Simulated LWR W ater .................................................................................................................... 45
4.1 Crack Growth Rates of Alloys 600 and 690 in Air and Water ............................. 46
4.1.1 Crack Growth Rates in Air ................................................................. 49
4.1.2 Crack Growth Rates under Constant Load in High-DO Water ............... 52
5 Sum m ary of Results ................................................................................................ 54
5.1 Environmental Effects on Fatigue S-N Behavior of Primary Pressure Boundary M aterials ....................................................................................... 54
5.2 Irradiation-Assisted Stress Corrosion Cracking of Austenitic Stainless S teels ............................................................................................................ 55
5.3 Environmentally Assisted Cracking of Low-Carbon Alloys 600 and 690 in Simulated LWR Water ................................................................................... 56
References ................................................................................. 59
NUREG/CR-4667, Vol. 27 vi
Figures
1. Fatigue S-N data for carbon steels and austenitic stainless steels in water .............. 4
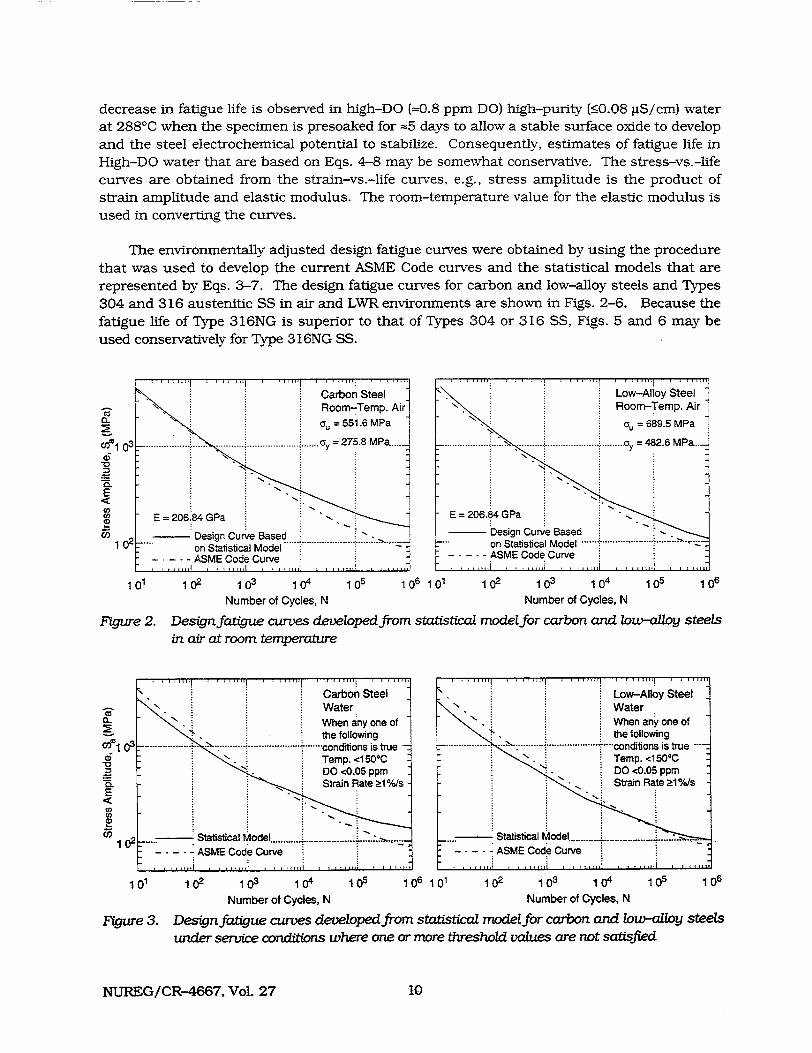
2. Design fatigue curves developed from statistical model for carbon and low-alloy steels in air at room temperature .......................................................................... 10
3. Design fatigue curves developed from statistical model for carbon and low-alloy steels under service conditions where one or more threshold values are not satisfied ............................................................................................................... 10
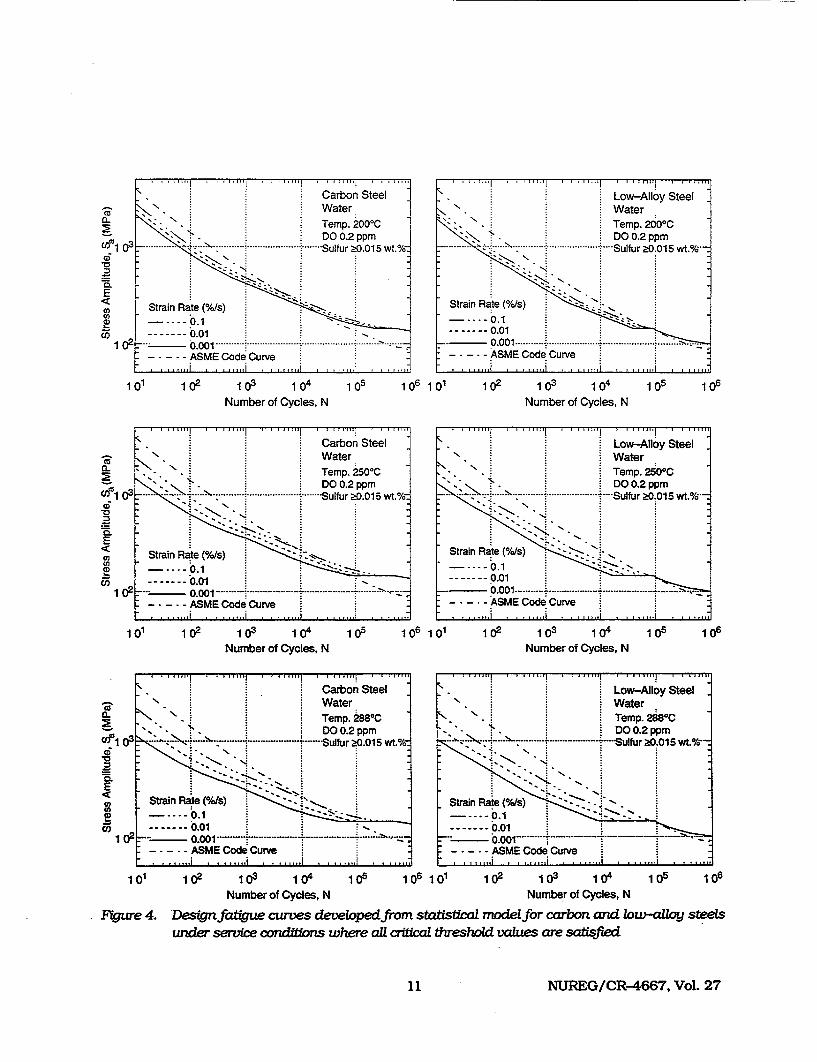
4. Design fatigue curves developed from statistical model for carbon and low-alloy steels under service conditions where all critical threshold values are satisfied ......... 11
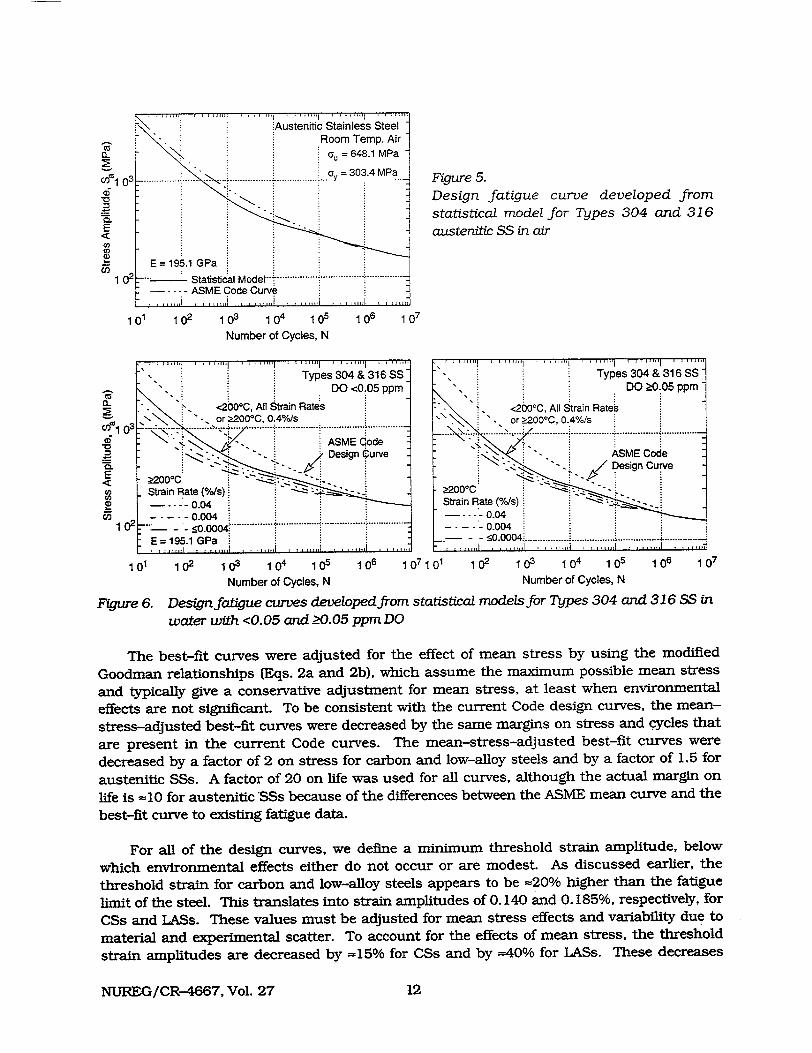
5. Design fatigue curve developed from statistical model for Types 304 and 316 austenitic SS in air ............................................................................................. 12
6. Design fatigue curves developed from statistical models for Types 304 and 316 SS in water with <0.05 and _>0.05 ppm DO ................................................................. 12
7. Photomicrograph showing difference in striation spacing formed by fast/fast and slow /fast blocks of cycles ...................................................................................... 19
8. Fracture surface and probable crack front after various fast/fast loading cycles for PWR and high-DO water environments ............................................................. 19
9. Fatigue strain-vs.-life data for Type 304 SS in air and water environments at 2880C ................................................................................................................. 21
10. Photomicrographs of fractured specimens tested with slow/fast and fast/fast block loading in PWR water and high-DO water at 2880C ........................................ 21
11. Depth of largest crack plotted as a function of fatigue cycles for austenitic SSs in air and water environments ................................................................................... 21
12. Depth of largest crack plotted as a function of fraction of life for austenitic SSs in air and water environments .............................................................................. 22
13. Crack growth rates, determined from data in Fig. 6, plotted as a function of crack depth for austenitic stainless steels in air and water environments ........................ 22
14. Crack growth rates, determined from smooth cylindrical fatigue test specimens, and ASME Section XI reference curves for austenitic SSs in air and water environm ents ...................................................................................................... 23
15. Photomicrographs of surface cracks along longitudinal sections of Type 316NG SS specimens tested at 2880C in PWR and high-DO water environments ................. 24
16. Effects of Si on maximum strength and total elongation of model stainless steel alloys that contain low C and low N and were irradiated to -0.3 x 10²¹ n-cm-2 .. . . . . . 32
17. Percent TGSCC of model stainless steel alloys irradiated in He in Halden reactor to fluence of =0.3 x 10²¹ n-cm- 2 and tested at 288*C in simulated BWR water ......... 32
NUREG/CR-4667, Vol. 27vii
18. Percent IGSCC of model stainless steel alloys irradiated in He in Halden reactor to fluence of =0.3 x 10²¹ n.cm-2 and tested at 2880C in simulated BWR water
containing D O =8 ppm ......................................................................................... 32
19. Susceptibility to TGSCC of model stainless steel alloys, irradiated in He in
Halden reactor to fluence of =0.3 x 10²¹ n-cm- 2 and tested at 2880C in simulated BWR water containing =8 ppm DO, classified as a function of N and Si contents
of the alloys ........................................................................................................ 33
20. Effects of fluence on yield strength, maximum strength, uniform elongation,
total elongation, percent TGSCC, percent IGSCC, and percent TGSCC + IGSCC
measured in 2890C water containing =8 ppm DO .................................................... 35
21. Fracture toughness J1 C as a function of neutron exposure for austenitic
Types 304 and 316 stainless steel .......................................................................... 39
22. Configuration of compact-tension specimen for this study ..................................... 40
23. Load-vs.-loadline displacement for nonirradiated Type 304 SS specimen of Heat
L2 tested at 2880C ............................................................................................... 43
24. Fracture toughness J-R curve for nonirradiated Type 304 SS specimen of Heat L2
at 2880C determined by DC potential drop and unloading compliance methods ........ 43
25. Fracture toughness J-R curves for Type 304 stainless steels at 2880C ...................... 44
26. Load-vs.-loadline displacement curve for Heat C19 of Type 304 SS irradiated to
0.3 x 10²¹ n-cm-2 in the Halden reactor at 2880C .................................................. 44
27. Fracture toughness J-R curves determined by DC potential drop and unloading
compliance methods for Heat C19 of Type 304 SS irradiated to 0.3 x 10²¹ n-cm-2 ..... 44
28. Load-vs.-loadline displacement curve for Heat L20 of Type 304 SS irradiated to
0.3 x 10²¹ n-cm-2 in the Halden reactor at 2880C .................................................. 45
29. Fracture toughness J-R curves determined by DC potential drop and unloading
compliance methods for Heat L20 of Type 304 SS irradiated to 0.3 x 10²¹ n-cm-2 ..... 45
30. Predicted vs. experimental values of crack growth rate of Alloys 600 and 690 in air at temperatures between 35 and 3800C ............................................................. 51
31. Effect of stress intensity factor K on crack growth rates of Alloys 600 and 690 in
high-purity water at 2890C .................................................................................... 53
32. Effect of temperature on crack growth rates of Alloy 600 in high-purity water .......... 53
Tables
1. Subfactors that may be used to account for effects of various variables on fatigue life ....................................................................................................................... . 14
2. Composition of Type 304 austenitic stainless steel used for fatigue tests .................. 18
NUREG/CR-4667, Vol. 27 Viil
3. Fatigue results for Type 304 SS in air and water environments ............................... 20
4. Elemental composition of 27 commercial and laboratory model austenitic stainless steel alloys irradiated in Halden reactor .................................................. 27
5. Summary of specimens per alloy, irradiation fluence, and postirradiation test type ......................................................... ........ 28
6. Results of SSRT tests and SEM fractography of nonirradiated control specimens of model austenitic stainless steel alloys ................................................................ 29
7. Composition of nonirradiated control specimens of model austenitic stainless steel alloys, with results of SSRT tests and SEM fractography ................................. 29
8. Results of SSRT test and SEM fractography for model austenitic stainless steels irradiated in helium at 289°C to fluence of -0.3 x 10²¹ n-cm-2 ........... . . . . . . . . . . . . . . . . . . . 30
9. Composition of model austenitic stainless steels irradiated to fluence of =0.3 x 10²¹ n-cm-2 with results of SSRT test and SEM fractography ................................. 30
10. Composition and relative susceptibility to IASCC of Type 316 stainless steels irradiated and tested under BWR-like conditions ................................................... 31
11. Results of SSRT test and SEM fractography for model austenitic stainless steels irradiated in He at 289'C to fluence of =0.9 x 10²¹ n-cm- 2 ............. . . . . . . . . . . . . . . . . . . . . . . . 34
12. Composition of model austenitic stainless steels irradiated to fluence of -0.9 x 10²¹ n-cm-2 and results of SSRT test and SEM fractography ................................... 34
13. Composition of Type 304 SS alloys irradiated in the Halden Reactor ....................... 40
14. Constants in CGR equations in air ..................................................................... 47
15. "Best fit" values for parameters A and m in Eq. 21 for Alloys 600 and 690 ............... 47
16. Product form and source of Alloys 600 and 690 ...................................................... 48
17. Composition of Alloys 600 and 690 for corrosion fatigue tests ................................. 48
18. Tensile properties of Alloys 600 and 690 in various heat-treated conditions ............. 48
19. Crack growth rate data for Alloys 600 and 690 in air .............................................. 49
20. Crack growth rate data for Alloys 600 and 690 specimens under constant load in high-purity water between 200 and 320°C ............................................................. 52
NUREG/CR-4667, Vol. 27ix
Executive Summary
Environmental Effects on Fatigue Strain-versus-Life (S-N) Behavior of Primary Pressure Boundary Materials
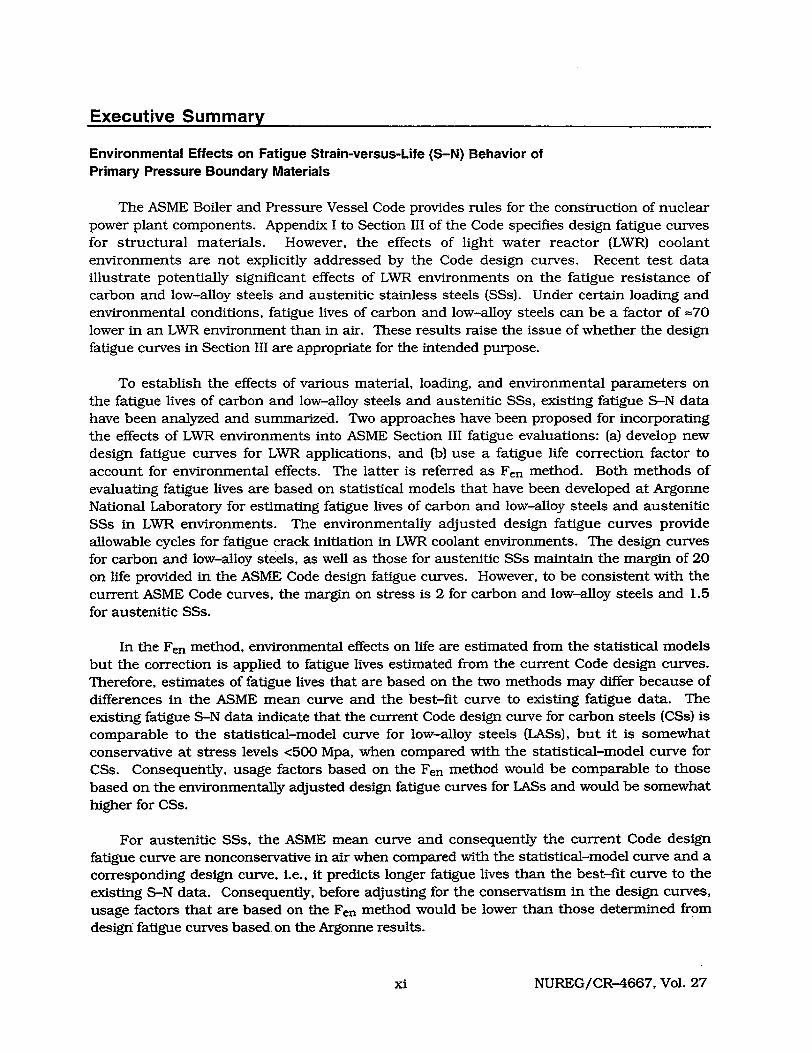
The ASME Boiler and Pressure Vessel Code provides rules for the construction of nuclear power plant components. Appendix I to Section III of the Code specifies design fatigue curves for structural materials. However, the effects of light water reactor (LWR) coolant environments are not explicitly addressed by the Code design curves. Recent test data illustrate potentially significant effects of LWR environments on the fatigue resistance of carbon and low-alloy steels and austenitic stainless steels (SSs). Under certain loading and environmental conditions, fatigue lives of carbon and low-alloy steels can be a factor of =70 lower in an LWR environment than in air. These results raise the issue of whether the design fatigue curves in Section III are appropriate for the intended purpose.
To establish the effects of various material, loading, and environmental parameters on the fatigue lives of carbon and low-alloy steels and austenitic SSs, existing fatigue S-N data have been analyzed and summarized. Two approaches have been proposed for incorporating the effects of LWR environments into ASME Section III fatigue evaluations: (a) develop new design fatigue curves for LWR applications, and (b) use a fatigue life correction factor to account for environmental effects. The latter is referred as Fen method. Both methods of evaluating fatigue lives are based on statistical models that have been developed at Argonne National Laboratory for estimating fatigue lives of carbon and low-alloy steels and austenitic SSs in LWR environments. The environmentally adjusted design fatigue curves provide allowable cycles for fatigue crack initiation in LWR coolant environments. The design curves
for carbon and low-alloy steels, as well as those for austenitic SSs maintain the margin of 20 on life provided in the ASME Code design fatigue curves. However, to be consistent with the current ASME Code curves, the margin on stress is 2 for carbon and low-alloy steels and 1.5 for austenitic SSs.
In the Fen method, environmental effects on life are estimated from the statistical models but the correction is applied to fatigue lives estimated from the current Code design curves. Therefore, estimates of fatigue lives that are based on the two methods may differ because of differences in the ASME mean curve and the best-fit curve to existing fatigue data. The existing fatigue S-N data indicate that the current Code design curve for carbon steels (CSs) is comparable to the statistical-model curve for low-alloy steels (LASs), but it is somewhat
conservative at stress levels <500 Mpa, when compared with the statistical-model curve for CSs. Consequently, usage factors based on the Fen method would be comparable to those based on the environmentally adjusted design fatigue curves for LASs and would be somewhat higher for CSs.
For austenitic SSs, the ASME mean curve and consequently the current Code design
fatigue curve are nonconservative in air when compared with the statistical-model curve and a corresponding design curve, i.e., it predicts longer fatigue lives than the best-fit curve to the existing S-N data. Consequently, before adjusting for the conservatism in the design curves, usage factors that are based on the Fen method would be lower than those determined from design fatigue curves based on the Argonne results.
NUREG/CR-4667, Vol. 27xi
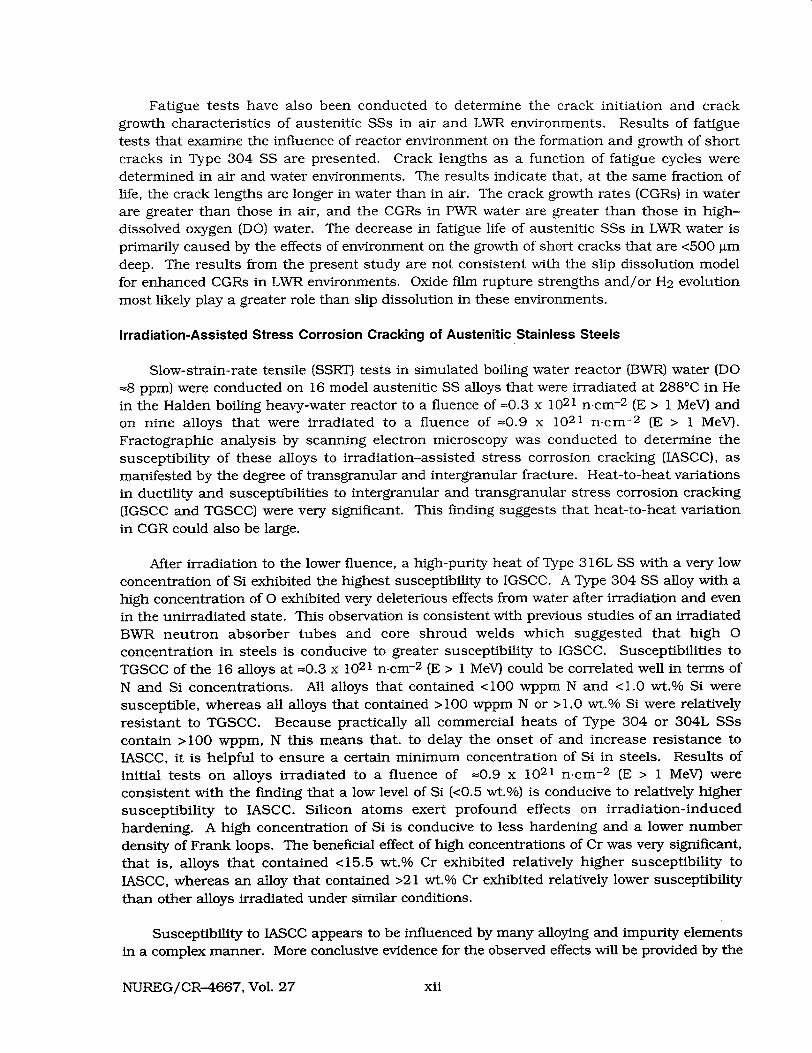
Fatigue tests have also been conducted to determine the crack initiation and crack
growth characteristics of austenitic SSs in air and LWR environments. Results of fatigue
tests that examine the influence of reactor environment on the formation and growth of short
cracks in Type 304 SS are presented. Crack lengths as a function of fatigue cycles were
determined in air and water environments. The results indicate that, at the same fraction of life, the crack lengths are longer in water than in air. The crack growth rates (CGRs) in water
are greater than those in air, and the CGRs in PWR water are greater than those in high
dissolved oxygen (DO) water. The decrease in fatigue life of austenitic SSs in LWR water is
primarily caused by the effects of environment on the growth of short cracks that are <500 gmn
deep. The results from the present study are not consistent with the slip dissolution model for enhanced CGRs in LWR environments. Oxide film rupture strengths and/or H2 evolution
most likely play a greater role than slip dissolution in these environments.
Irradiation-Assisted Stress Corrosion Cracking of Austenitic Stainless Steels
Slow-strain-rate tensile (SSRT) tests in simulated boiling water reactor (BWR) water (DO
-8 ppm) were conducted on 16 model austenitic SS alloys that were irradiated at 2880C in He in the Halden boiling heavy-water reactor to a fluence of =0.3 x 10²¹ n-cm- 2 (E > 1 MeV) and on nine alloys that were irradiated to a fluence of =0.9 x 10²¹ n-cm- 2 (E > 1 MeV).
Fractographic analysis by scanning electron microscopy was conducted to determine the
susceptibility of these alloys to irradiation-assisted stress corrosion cracking (IASCC), as
manifested by the degree of transgranular and intergranular fracture. Heat-to-heat variations in ductility and susceptibilities to intergranular and transgranular stress corrosion cracking
(IGSCC and TGSCC) were very significant. This finding suggests that heat-to-heat variation
in CGR could also be large.
After irradiation to the lower fluence, a high-purity heat of Type 316L SS with a very low
concentration of Si exhibited the highest susceptibility to IGSCC. A Type 304 SS alloy with a
high concentration of 0 exhibited very deleterious effects from water after irradiation and even in the unirradiated state. This observation is consistent with previous studies of an irradiated
BWR neutron absorber tubes and core shroud welds which suggested that high 0 concentration in steels is conducive to greater susceptibility to IGSCC. Susceptibilities to
TGSCC of the 16 alloys at =0.3 x 10²¹ n-cm-2 (E > 1 MeV) could be correlated well in terms of N and Si concentrations. All alloys that contained <100 wppm N and <1.0 wt.% Si were
susceptible, whereas all alloys that contained >100 wppm N or >1.0 wt.% Si were relatively resistant to TGSCC. Because practically all commercial heats of Type 304 or 304L SSs
contain >100 wppm, N this means that, to delay the onset of and increase resistance to IASCC, it is helpful to ensure a certain minimum concentration of Si in steels. Results of
initial tests on alloys irradiated to a fluence of =0.9 x 10²¹ n-cm- 2 (E > 1 MeV) were
consistent with the finding that a low level of Si (<0.5 wt.%) is conducive to relatively higher
susceptibility to IASCC. Silicon atoms exert profound effects on irradiation-induced hardening. A high concentration of Si is conducive to less hardening and a lower number
density of Frank loops. The beneficial effect of high concentrations of Cr was very significant, that is, alloys that contained <15.5 wt.% Cr exhibited relatively higher susceptibility to
IASCC, whereas an alloy that contained >21 wt.% Cr exhibited relatively lower susceptibility than other alloys irradiated under similar conditions.
Susceptibility to IASCC appears to be influenced by many alloying and impurity elements in a complex manner. More conclusive evidence for the observed effects will be provided by the
NUREG/CR-4667, Vol. 27 xii
more complete data that will be obtained from the whole test matrix including the materials irradiated to higher fluences.
Fracture toughness J-R curve tests have been conducted on two heats of Type 304 SS that were irradiated to a fluence of =0.3 x 10²¹ n cm- 2 (E > 1 MeV) at =-2881C in a He environment in the Halden boiling heavy-water reactor. The tests were performed on 1/4-T compact tension (CT) specimens in air at 2880 C, crack extensions were determined by both DC potential and elastic unloading compliance techniques. Neutron irradiation at 2880 C to 0.3 x 10²¹ n cm- 2 decreased the fracture toughness of both heats. The commercial heat C19 exhibited fracture toughness that is superior to the fracture toughness of the laboratory heat L20. The values of fracture toughness Jic are _Ž500 kJ/m 2 for C19 and -60 kJ/m 2 for L20.
Environmentally Assisted Cracking of Alloys 600 and 690 in Simulated LWR Water
To evaluate the resistance of Alloys 600 and 690 to environmentally assisted cracking (EAC) in LWR coolant environment, fracture-mechanics CGR tests were conducted in air and water environments on CT specimens of several heats of these alloys in annealed and in annealed and thermally treated conditions. A statistical analysis of the results was used to develop correlations for predicting CGRs of the materials as a function of stress intensity, load ratio, and DO levels. However, because the experimental data were obtained for only a single rise time, i.e., frequency, alternate forms for the correlations have also been developed which can be used to extrapolate the results to other rise times. Experiments are planned to verify the predictions of the correlation for the effect of rise time.
The CGRs in the low-C heat of Alloy 600 do not appear to be sensitive to either heat treatment or DO level, whereas the CGRs in the high-C heats show a strong environmental enhancement in high-DO environments. The results are inconclusive for the high-C Alloy 600 in low-DO environments. Alloy 690 shows only a modest environmental enhancement in the low-DO environments; environmental effects appear to be independent of the loading conditions as long as CGRair > 10-11 s- 1 . The CGRs in Alloy 690 in high-DO show some environmental enhancement for loading conditions that correspond to low CGRs in air.
Constant load crack growth rate tests have also been conducted on CT specimens of Alloys 600 and 690 in high-DO water at temperatures between 200 and 320'C. The growth rates for the hot-worked Alloy 600 are a factor of =5 higher than those for the hot-worked + thermally treated Alloy 600. The addition of sulfate increased the CGRs of both alloys by a factor of 3-7. The Alloy 690 specimens show little dependence of K on growth rates; the CGRs range between =2 x 10-12 and 6 x 10-12 m/s, values that may be below the sensitivity of the crack-monitoring system. The results indicate that for Alloy 600, the CGRs increase slightly with increasing K.
NUREG/CR-4667, Vol. 27o°.i
Acknowledgments
The authors thank W. F. Burke, T. M. Galvin, J. Tezak, R. W. Clark, and D. R. Perkins
for their contributions to the experimental effort. This work is sponsored by the Office of
Nuclear Regulatory Research, U.S. Nuclear Regulatory Commission, under Job Code W6610; Program Manager: Dr. M. B. McNeil.
NUREG/CR-4667, Vol. 27 xiv
1 Introduction
The U.S. Nuclear Regulatory Commission (NRC) and its predecessor, the U.S. Atomic Energy Commission, have conducted research programs that address the aging of reactor components. The results of the research have been used to evaluate and establish regulatory guidelines to ensure acceptable levels of reliability for light water reactor (LWR) components. The products of this program have been technical reports, methodologies for evaluating
licensee submittals, and other inputs to the regulatory process. The results have led to the resolution of regulatory issues, as well as to the development, validation, and improvement of regulations and regulatory guides. The present research on the effects of simulated reactor
coolant environments on cracking of reactor components was initiated to resolve the remaining critical technical issues related to cracking phenomena in LWR components. Initially, this project addressed cracking of boiling water reactor (BWR) pipes. Subsequently, in response to requests from the NRC Division of Nuclear Reactor Regulation (NRR) for
assistance in dealing with developing cracking problems in aging reactors, the focus shifted to other problems in environmentally assisted cracking (EAC) of LWR components.
The overall objective of this program is to provide data and physical models to be used by the NRC staff in assessing environmentally assisted degradation of primary pressure boundary components in LWRs. The research is divided into five tasks:
(a) Environmental effects onffatigue, crack growth, and stress corrosion cracking Fatigue and EAC of piping, pressure vessels, and core components in LWRs are important concerns during plant operation and for extended reactor lifetimes. The degradation processes in U.S. reactors include fatigue, intergranular stress corrosion cracking (IGSCC), and propagation of fatigue or stress corrosion cracks that initiate in the weld-sensitized heat-affected zones of stainless steel (SS) components. Occurrences of mechanical-vibration- and thermal-fluctuation-induced fatigue failures in LWR plants have also been documented. The objective of this task is to improve fatigue design curves and assess the additivity of fatigue damage in piping and vessel steels under load histories that are typical of LWR components. The results of this work will be used to assess industry fatigue evaluations that are related to license renewal.
(b) Component vulnerability to irradiation-assisted stress corrosion cracking
Irradiation-assisted stress corrosion cracking (IASCC) of in-core components in both BWRs and pressurized water reactors (PWRs) is becoming a more common problem as reactors age. The general pattern of the observed failures indicates that, as nuclear plants age and neutron fluence increases, many apparently nonsensitized austenitic materials become susceptible to intergranular failure by IASCC. Some of these failures have been reported for components that are subjected to relatively low or negligible stress levels, e.g., control-blade sheaths and handles and instrument
dry tubes of BWRs. Although most failed components can be replaced, it would be very difficult or impractical to replace some safety-significant structural components, such as the BWR top guide, core plate, and shroud. The objective of this task is to provide data and models that are needed to assess industry analyses of the likelihood
of degradation and failure of core internal components that are due to IASCC, and to evaluate licensee submissions that are related to inspection and remediation.
NUREG/CR-4667, Vol. 271
(c) Cracking of nickel alloy components of LWR primary systems Internal components of reactor vessels are made of Ni-based alloys, e.g., Alloys 600,
X750, and 182, which are susceptible to IGSCC. The causes and mechanisms of this
cracking are not adequately understood, and the uncertainty is increased when
licensee submissions are evaluated for factors such as damage accumulation and
inspection intervals. The objective of this task is to provide technical data on the
effects of cracks in Ni-alloy components on the residual life, inspection, and repair of
the component. The results will be used to support NRR staff assessments of
industry crack-growth models, and potential detection and mitigation measures.
(d) Analysis of postweld heat treatment processes and validation of flaw acceptance criteria
The objective of this task is to evaluate the effect of postweld heat treatment on long
term resistance to environmental cracking by assessing sensitization and other
microstructural changes. This evaluation will provide the NRC with insights for use in reviewing licensee submittals.
(e) Assessment of industry crack-growth models
This task has two objectives. The first is to perform an independent evaluation of
industry models that are used to establish inspection intervals and repair criteria.
The second objective is to perform more detailed analyses of flaw acceptance criteria.
Research during this six-month reporting period has focused on fatigue of austenitic SSs,
fracture toughness J-R curve tests in air, and IASCC during slow-strain-rate tensile (SSRT)
tests (in simulated BWR water) of SS specimens that were irradiated to fluence levels of -0.3
and 0.9 x 10²¹ n-cm-2 (E > 1 MeV) at 288°C in the Halden reactor, and EAC of Alloys 600 and
690 in high-purity (HP) oxygenated water.
2 Environmental Effects on Fatigue Strain-versus-Life (S-N) Behavior of Primary Pressure Boundary Materials
Experience with operating nuclear power plants worldwide reveals that many failures can
be attributed to fatigue; examples include piping components, nozzles, valves, and pumps. 1-3
In most cases, these failures have been associated with thermal loading that is due to thermal
stratification or thermal striping, or with mechanical loading that is due to vibratory loading.
Significant thermal loadings due to flow stratification were not included in the original design
basis analysis. The effects of these loadings may also have been aggravated by corrosion
effects that are due to exposure to high-temperature aqueous environments. Fatigue cracks
have been observed in pressurizer surge lines in PWRs (NRC Bulletin No. 88-11), and in
feedwater lines connected to nozzles of pressure vessels in BWRs and steam generators in
PWRs (NRC IE Bulletin, 79-13; NRC Information Notice 93-20). These cracks have been
attributed to corrosion fatigue (NRC IE Bulletin, 79-13) or strain-induced corrosion cracking4
caused by cyclic loading that is due to thermal stratification during start-up (hot standby)
and shut-down periods.
2.1 Methods for Incorporating Effects of LWR Coolant Environment into ASME Code Fatigue Evaluations (0. K. Chopra and W. J. Shack)
Cyclic loadings on a structural component occur because of changes in the mechanical
and thermal loadings as the system goes from one set of pressure, temperature, moment, and
NUREG/CR-4667, Vol. 27 2
force loading to any other load set. For each pair of load sets, an individual fatigue usage factor is determined by the ratio of the number of cycles anticipated during the lifetime of the component to the allowable cycles. Figures 1-9.1 through 1-9.6 of Appendix I to Section III of the ASME Boiler and Pressure Vessel Code 5 specify fatigue design curves that define the allowable number of cycles as a function of applied stress amplitude. The cumulative usage factor (CUF) is the sum of the individual usage factors, and Section III of the ASME Code requires that the CUF at each location not exceed 1.
The Code design fatigue curves were based on strain-controlled tests of small polished specimens at room temperature in air. In most studies, the fatigue life of a test specimen is defined as the number of cycles for the tensile stress to drop 25% from its peak value, which corresponds to an --3-mm-deep crack. Consequently, fatigue life N represents the number of cycles required to initiate a crack =3 mm deep. The best-fit curves to the experimental data were expressed in terms of the Langer equation 6 of the form
ea = B(N)-b + A, (1)
where Za is strain amplitude and A, B, and b are parameters of the model. (Eq. I may be written in terms of stress amplitude Sa instead of strain amplitude ca, where stress amplitude is the product of strain amplitude and elastic modulus, i.e., Sa = E Ea.) The design fatigue curves were obtained by decreasing the best-fit curves by a factor of 2 on stress or 20 on cycles, whichever was more conservative, at each point on the best-fit curve. As described in the Section III criteria document, 7 these factors were intended to account for the differences and uncertainties in relating the fatigue lives of laboratory test specimens to those of actual reactor components. The factor of 20 on cycles is the product of three subfactors: 2 for scatter of data (minimum to mean), 2.5 for size effects, and 4 for surface finish, atmosphere, etc. "Atmosphere" was intended to reflect the effects of an industrial environment rather than the controlled environment of a laboratory. The factors of 2 and 20 are not safety margins but rather conversion factors that must be applied to the experimental data to obtain reasonable estimates of the lives of actual reactor components; in a benign environment, some fraction of the factor actually represents a safety margin.
Subsection NB-3121 of Section III of the Code states that the data on which the fatigue design curves (Figs. 1-9.1 through 1-9.6) are based did not include tests in the presence of corrosive environments that might accelerate fatigue failure. Article B-2131 in Appendix B to Section III states that the owner's design specifications should provide information about any reductions to fatigue design curves that are required because of environmental conditions. Recent fatigue strain-vs.-life (S-N) data illustrate the potentially significant effects of LWR coolant environments on the fatigue resistance of carbon steels (CSs), low-alloy steels (LASs),8-2 0 and austenitic SSs, 2 1- 3 1 (Fig. 1).
A program is being conducted at Argonne National Laboratory to develop data and models for predicting the effects of environment on fatigue design curves of pressure vessel and piping steels. Fatigue tests are being conducted to obtain data under conditions that are not included in the existing fatigue data base and to establish the effects of various loading and environmental variables on the fatigue S-N behavior of pressure-boundary steels. The existing fatigue S-N data have been analyzed to establish the effects of various material, loading, and environmental parameters on the fatigue life of carbon and low-alloy steels and austenitic SSs; the results for carbon and low-alloy steels 1 8 and austenitic SSs have been
NUREG/CR-4667, Vol. 273
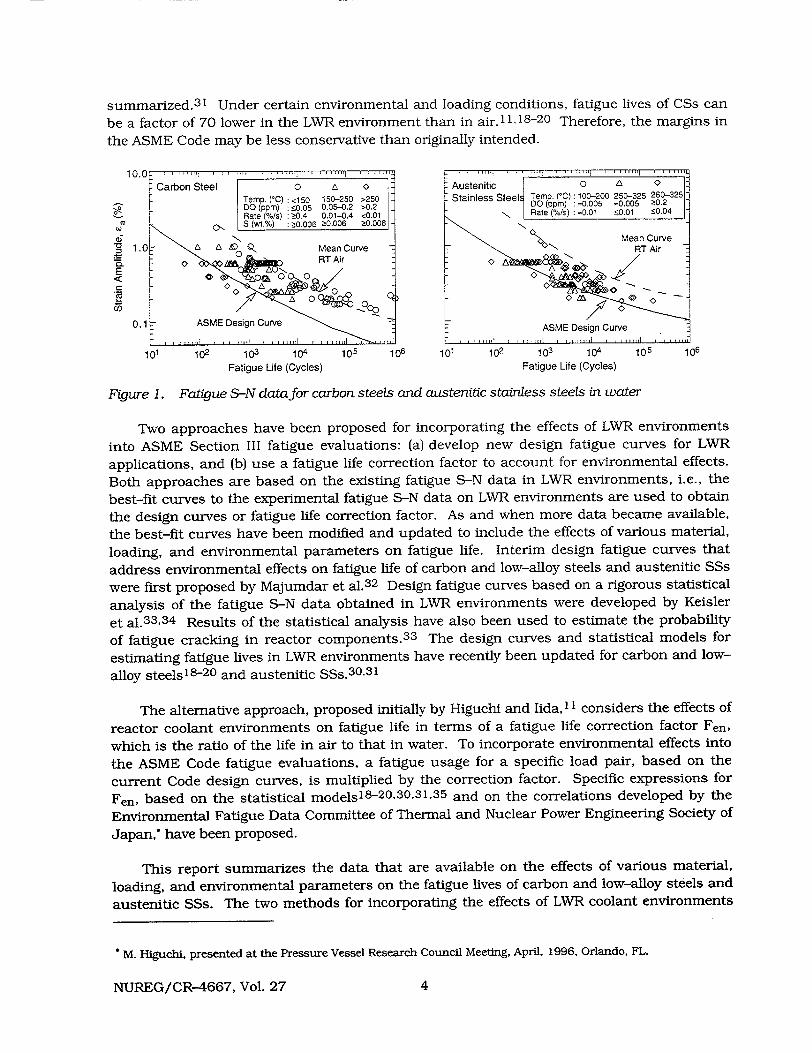
summarized. 3 1 Under certain environmental and loading conditions, fatigue lives of CSs can
be a factor of 70 lower in the LWR environment than in air. 1 1 ,18 - 2 0 Therefore, the margins in
the ASME Code may be less conservative than originally intended.
Carbon Steel o 6 0 Austenitic . .. - Teprnp (°C) :<150 150-250 >250 Stainless Steels Ternpp(C) 100-200 250-325 260-3252
0- DO (ppm) :!50.05 0.05-0.2 >0.2 -le ( pms) 0 -0.0 0 Ž0.2
Rate (-/Is) : 0.4 0.01-0.4 <0.01 Rate (%/s):-0.01 <0o.01 50.04
0 I S(w1.%) :_o.006 _>0.006 Ž0.006 "W 1Mean Curve
.0:t- Mean Cesn CC RT Air
a ~000 00
00
0L ESM Dein u
101 102 103 104 105 106 101 102 103 104 105 106
Fatigue Life (Cycles) Fatigue Life (Cycles)
Figure .1. Fatigue S-N data for carbon steels and austenitic stainless steels in water
Two approaches have been proposed for incorporating the effects of LWR environments
into ASME Section III fatigue evaluations: (a) develop new design fatigue curves for LWR
applications, and (b) use a fatigue life correction factor to account for environmental effects.
Both approaches are based on the existing fatigue S-N data in LWR environments, i.e., the
best-fit curves to the experimental fatigue S--N data on LWR environments are used to obtain
the design curves or fatigue life correction factor. As and when more data became available,
the best-fit curves have been modified and updated to include the effects of various material,
loading, and environmental parameters on fatigue life. Interim design fatigue curves that
address environmental effects on fatigue life of carbon and low-alloy steels and austenitic SSs
were first proposed by Majumdar et al.3 2 Design fatigue curves based on a rigorous statistical
analysis of the fatigue S-N data obtained in LWR environments were developed by Keisler
et al.3 3 ,3 4 Results of the statistical analysis have also been used to estimate the probability
of fatigue cracking in reactor components. 3 3 The design curves and statistical models for
estimating fatigue lives in LWR environments have recently been updated for carbon and lowalloy steels1< 2 0 and austenitic SSs.3 0 ,3 1
The alternative approach, proposed initially by Higuchi and Iida, 1 1 considers the effects of
reactor coolant environments on fatigue life in terms of a fatigue life correction factor Fen,
which is the ratio of the life in air to that in water. To incorporate environmental effects into
the ASME Code fatigue evaluations, a fatigue usage for a specific load pair, based on the
current Code design curves, is multiplied by the correction factor. Specific expressions for
Fen, based on the statistical models 1 8 - 2 0 ,3 0 ,3 1 ,3 5 and on the correlations developed by the
Environmental Fatigue Data Committee of Thermal and Nuclear Power Engineering Society of
Japan, have been proposed.
This report summarizes the data that are available on the effects of various material,
loading, and environmental parameters on the fatigue lives of carbon and low-alloy steels and
austenitic SSs. The two methods for incorporating the effects of LWR coolant environments
BoM. Higuchi, present ed t thssure Vessel Research Council Meeting, April. 1996. Orlando, FL.
NUREG/CR-4667, Vol. 27 4
into the ASME Code fatigue evaluations are presented. Differences between the methods and their significance on the design fatigue curves are discussed.
2.1.1 Fatigue S-N Data in LWR Environments
Carbon and Low-Allov Steels
The fatigue life of both carbon and low-alloy steels is decreased significantly when five conditions are satisfied simultaneously, viz., strain amplitude, temperature, dissolved oxygen (DO) level in water, and S content of the steel are above a minimum level, and strain rate is below a threshold value. Although the microsturctures and cyclic-hardening behavior of CSs
and LASs differ significantly, environmental degradation of fatigue life of these steels is very similar. For both steels, only moderate decrease in life (by a factor of <2) is observed when
any one of the threshold conditions is not satisfied. The effects of the critical parameters on fatigue life and their threshold values are summarized below.
(a) StrairL A minimum threshold strain is required for environmentally assisted decrease in
fatigue life of carbon and low-alloy steels. 18-20 The threshold value most likely corresponds to the rupture strain of the surface oxide film. Limited data suggest that the threshold value is =20% higher than the fatigue limit for the steel.
(b) Strain Rate. Environmental effects on fatigue life occur primarily during the tensileloading cycle, and at strain levels greater than the threshold value required to rupture the surface oxide film. When any one of the threshold conditions is not satisfied, e.g., DO <0.05 ppm or temperature <1500 C, the effects of strain rate are consistent with those in
air, i.e., heats that are sensitive to strain rate in air, also show a decrease in life in water. When all other threshold conditions are satisfied, fatigue life decreases logarithmically with decreasing strain rate below 1%/s;11. 14 the effect of environment on life saturates at =0.00 1%/s. 18-20
(c) Temperature. When other threshold conditions are satisfied, fatigue life decreases linearly with temperature above 1500 C and up to 3200C.10.11,1 4 Fatigue life is insensitive to temperatures below 150°C or when any other threshold condition is not satisfied.
(d) Dissolved Oxygen in Water. When other threshold conditions are satisfied, life decreases logarithmically with DO above 0.05 ppm; the effect saturates at --0.5 ppm DO.10,14
(e) Sulfur Content of Steel Although S content and morphology are the most important parameters that determine susceptibility of CSs and LASs to fatigue crack growth in LWR
environments, existing fatigue S-N data are inadequate to unequivocally establish the effect of S content on the fatigue life of these steels. When any one of the threshold
conditions is not satisfied, environmental effects on life are minimal and relatively insensitive to changes in S content. When the threshold conditions are satisfied, i.e., high-temperature/high-DO water, the fatigue life of LASs decreases with increasing S content. Limited data suggest that the effects of environment on life saturate at a S content above 0.0 12 wt%. 18 However, the fatigue life of CSs in high-temperature/ high
DO water seems to be insensitive to S content in the range of 0.002-0.015 wL%."
M. Higuchi, presented at the Pressure Vessel Research Council Meeting, June. 1995, Milwaukee, WI.
NUREG/CR-4667, Vol. 275
Austenitic Stainless Steels
The fatigue life of austenitic SSs is decreased in LWR environments; the reduction in life depends on strain rate, level of DO in water, and temperature. 2 3 -2 5.2 8- 3 1 The effects of LWR
environments on fatigue life of wrought materials are comparable for Types 304, 316, and
316NG SS. Although the fatigue lives of cast SSs are relatively insensitive to changes in
ferrite content in the range of 12-28%,23 the effects of loading and environmental parameters
on the fatigue life of cast SSs differ somewhat. The significant results and threshold values of
critical parameters are summarized below.
(a) Strain. A minimum threshold strain is required for environmentally assisted decrease in
fatigue life of austenitic SSs. The threshold value most likely corresponds to the rupture
strain of the surface oxide film. Limited data suggest that the threshold strain range is
between 0.32 and 0.36%.24.30
(b) Dissolved Oxygen in Water. Environmental effects on fatigue life are more pronounced in
low-DO, (<0.01 ppm DO) than in high-DO, (>0.1 ppm DO) water.2 3 ,3 0 The reduction in
life is greater by a factor of =2 in a simulated PWR environment than in high-DO water.
The fatigue lives of cast SSs are approximately the same in both high- or low-DO water
and are comparable to those observed for wrought SSs in low-DO water.3 0 Recent results
indicate that, in high-DO water, the conductivity of water and the nature of the oxide
film strongly affect the fatigue life of austenitic SSs.
(c) Strain Rate. Fatigue lives decrease with decreasing strain rate; the effect is greater in a
low-DO PWR environment than in high-DO water. The results indicate that the strain
rate below which effects of strain rate on fatigue life saturate may depend on both steel
type and DO level. In low-DO environments, saturation strain rate appears to be at
-0.0004%/s for Type 304 SS and somewhat higher for Type 316 SS.24,30 Existing data are
inadequate to define the saturation strain rate in high-DO water or that for cast SSs.
(d) Temperature. Existing data are inadequate to establish the functional form for the
dependence of life on temperature. Limited data indicate that environmental effects on
fatigue life are significant at temperatures above 250'C and minimal below 2001C. 2 4 At
250-3300 C, fatigue life appears to be relatively insensitive to changes in temperature.
2.1.2 Mechanism of Fatigue Crack Initiation
The formation of surface cracks and their growth to an "engineering" size (3 mm deep)
constitute the fatigue life of a material, which is represented by the fatigue S-N curves.
Fatigue life has conventionally been divided into two stages: (a) initiation, expressed as the
cycles needed to form microcracks on the surface; and (b1) propagation, expressed as cycles
needed to propagate the surface cracks to engineering size. The reduction in fatigue life in
high-temperature water has often been attributed to easier crack initiation, because surface
micropits that are present in high-temperature water act as stress raisers and provide
preferred sites for the formation of fatigue cracks.1 0 However, experimental data do not
support this argument; the fatigue lives of carbon and low-alloy steel specimens that have
been preoxidized at 288°C in high-DO water and then tested in air are identical to those of
unoxidized specimens. 1 8 ,20 If the presence of micropits was responsible for the reduction in
life, specimens that have been preexposed to high-DO water and tested in air should show a
decrease in life. Also, the fatigue limit of these steels should be lower in water than in air.
NUREG/CR-4667, Vol. 27 6
Data obtained from specimens in high-DO water indicate that the fatigue limit is either the same as or =20% higher in water than in air. 18
An alternative way to describe fatigue life considers fatigue life to be entirely composed of crack propagation. 3 6 In polycrystalline metals and alloys, the period during which surface
cracks form is negligible; surface cracks, 10 Am or longer, form quite early in life. 3 7 - 4 1 The growth of these short fatigue cracks may be divided into three regimes: (a) an initial period, which is very sensitive to microstructure, involves growth of microstructurally small cracks
(MSCs) and is characterized by a decelerating growth rate; (b) a final period of growth that can
be predicted from fracture mechanics methodology and is characterized by an accelerating crack growth rate (CGR); and (c) a transition period that is controlled by a combination of the
two regimes. Fatigue cracks that have grown so long that they show little or no influence of microstructure (i.e., greater than the critical length of MSCs) are called mechanically small
cracks. The transition from an MSC to a mechanically small crack has been estimated to occur at a crack size =8 times the unit size of the microstructure, i.e., 100-150 Am. The
reduction in life in LWR environments may arise from an increase in growth rates of cracks
during the initial stage of MSC foprmation and shear crack growth and/or during the
transition and final stage of tensile-crack growth.
The enhanced growth rates of long cracks in pressure vessel and piping steels in LWR
environments have been attributed to either slip oxidation/dissolution 4 2 or hydrogen-induced cracking4 3 mechanisms. Both mechanisms depend on the rates of oxide rupture, passivation, and liquid diffusion. Therefore, it is often difficult to differentiate between the two processes or to establish their relative contributions to crack growth in LWR environments.
Studies on crack initiation in smooth fatigue specimens indicate that the decrease in the
fatigue life of carbon and low-alloy steels in LWR environments is caused primarily by the
effects of environment on the growth of cracks that are <100 Am deep. 18.39 When compared
with crack growth rates in air, growth rates in high-DO water are nearly two orders of magnitude greater for cracks that are <100 Am and one order of magnitude greater for cracks that are >100 Aim. Metallographic examinations of test specimens indicate that, in high-DO water, surface cracks grow entirely as tensile cracks normal to the stress, whereas, in air or
simulated PWR environments, they are at an angle of 450 to the stress axis.3 9 Also, in CSs,
cracks propagate across both ferrite and pearlite regions. These results indicate that growth of MSCs occurs by slip oxidation/dissolution.
In high-DO water, crack initiation in carbon and low-alloy steels may be explained as
follows: (a) surface microcracks form quite early in fatigue life; (b) during cyclic loading, the
protective oxide film is ruptured at strains greater than the fracture strain of surface oxides,
and the microcracks grow by anodic dissolution of the freshly exposed surface to crack depths
greater than the critical length of MSCs; and (c) these mechanically small cracks grow to engineering size, and their growth, which is characterized by accelerating rates, can be predicted by fracture mechanics methodology.
As discussed later in Section 2.2, studies on crack initiation in austenitic SSs yield
similar results, i.e., that the decrease in fatigue life in LWR environments is caused primarily by the effects of environment on the growth of cracks that are <500 Am deep. However, fatigue lives that are lower in low-DO water than in high-DO water are difficult to reconcile in terms
of the slip oxidation/dissolution mechanism. Also, austenitic SS specimens tested in LWR
NUREG/CR-4667, Vol. 277
environments show well-defined fatigue striations, indicating that mechanical factors and not
the slip oxidation/dissolution process, are important.3 0 The results indicate that
environmentally assisted reduction in fatigue life of austenitic SSs is most likely caused by H
induced cracking.
2.1.3 Incorporating Environmental Effects into ASME Fatigue Evaluations
Two procedures are currently being proposed for incorporating effects of LWR coolant
environments into the ASME Section III fatigue evaluations; (a) develop a new set of
environmentally adjusted design fatigue curves 1 8 ,2 0 ,3 0 .3 1 or (b) use fatigue life correction
factor Fen to adjust the current ASME Code fatigue usage values for environmental
effects.2 0 ,3 1 .3 5 For both approaches, the range and bounding values must be defined for key
service parameters that influence fatigue life. It has been demonstrated that both approaches
give similar results for carbon and low-alloy steels18 but the results for austenitic SSs differ 3 1
because the existing ASME mean curve for SS in air is not consistent with the exiting fatigue
S-N data.
Design Fatigue Curves
A set of environmentally adjusted design fatigue curves can be developed from the best-fit
curves to the experimental data that were obtained in LWR environments by using the same
procedure that has been used to develop the current ASME Code design fatigue curves. The
best-fit experimental curves are first adjusted for the effect of mean stress by using the
modified Goodman relationship
Sa1Sa (U DT for Sa< yT (2a) Sa=- S
and
Sa Sa for Sa > ay, (2b)
where S' = is the adjusted value of stress amplitude, and ay and (T are yield and ultimate
strengths of the material, respectively. The design fatigue curves are then obtained by
lowering the adjusted best-fit curve by a factor of 2 on stress or 20 on cycles, whichever is
more conservative, to account for differences and uncertainties in fatigue life that are
associated with material and loading conditions.
Statistical models that are based on the existing fatigue S-N data have been developed for
estimating the fatigue lives of pressure vessel and piping steels in air and LWR
environments. 18,20,30,31 In air at room temperature, the fatigue data for CSs are best
represented by
In(NK = 6.564 - 1.975 ln(ea - 0.113) (3a)
and for LASs, by
ln(N) = 6.627 - 1.808 ln(Fa - 0. 151), (3b)
NUREG/CR-4667, Vol. 27 8
where N is fatigue life of a smooth test specimen and aa is applied strain amplitude (%). In LWR environments, the fatigue data for CSs are best represented by
ln(N) = 6.010 - 1.975 ln(ea - 0.113) + 0.101 S* T 0* t *
and for LASs, by
ln(N) = 5.729 - 1.8 08 ln(-a- 0.151) + 0.101 S 5 T* VO* *,
(4a)
(4b)
where S*, T1, O, and t* are transformed S content, temperature, DO, and strain rate, respectively, defined as follows:
S*= S S* = 0.015 TV=0
T=T- 150 0* =0 0* = ln(DO/0.04)
*= ln(12.5)
t*=0
t5 ln(0.00 1)
(0 < S5 <0.015 wt.%) (S > 0.015 wt.%)
(T < 1500C) (T = 150-350°C)
(DO < 0.05 ppm) (0.05 ppm < DO <0.5 ppm) (DO > 0.5 ppm)
(t > 1%Is) (0.001:5 t < 1%/s) (t < 0.001%/s).
The discontinuity in the value of 0* at 0.05 ppm DO is due to an approximation and does not represent a physical phenomenon. In air at room temperature, the fatigue data for Types 304 and 316 SS are best represented by
ln(N) = 6.703 - 2.030 In(ea - 0.126),
and for Type 316NG, by
ln(N) = 7.422- 1.671 ln(ea- 0.1 2 6 ).
In LWR environments, the fatigue data for Types 304 and 316 SS are best represented by
ln(N) = 5.768 - 2.030 Jn( 2a - 0.126) +T C 0'
and for Type 316NG, by
ln(N) = 6.913 - 1.671 In(ea - 0.126) +T i' 0',
(6a)
(6b)
(7a)
(7b)
where T, i', and 0' are transformed temperature, strain rate, and DO, respectively, defined as:
T'=0 r = 1 g'=0
' = ln(i/0.4) i'= ln(0.0004/0.4)
O' = 0.260 0' = 0.172
(T < 200C) IT >_ 2000C)
(i > 0.4%/s) (0.0004 • t 5 0.4% /s) (t < 0.0004%/s)
(DO < 0.05 ppm) (DO > 0.05 ppm).
The models are recommended for predicted fatigue lives of •106 cycles. As discussed in Section 2.1. 1, recent data indicate that in high-DO water the conductivity of water and the nature of the oxide film have a strong effect on fatigue life of austenitic SSs. Only a moderate
NUREG/CR-4667, Vol. 27
(5a)
(5b)
(5c)
(5d)
(8a)
(8b)
(8c)
9
decrease in fatigue life is observed in high-DO (=0.8 ppm DO) high-purity (•0.08 pS/cm) water at 288°C when the specimen is presoaked for =5 days to allow a stable surface oxide to develop and the steel electrochemical potential to stabilize. Consequently, estimates of fatigue life in High-DO water that are based on Eqs. 4-8 may be somewhat conservative. The stress-vs.-life
curves are obtained from the strain-vs.-life curves, e.g., stress amplitude is the product of strain amplitude and elastic modulus. The room-temperature value for the elastic modulus is used in converting the curves.
The environmentally adjusted design fatigue curves were obtained by using the procedure
that was used to develop the current ASME Code curves and the statistical models that are represented by Eqs. 3-7. The design fatigue curves for carbon and low-alloy steels and Types
304 and 316 austenitic SS in air and LWR environments are shown in Figs. 2-6. Because the fatigue life of Type 316NG is superior to that of Types 304 or 316 SS, Figs. 5 and 6 may be used conservatively for Type 316NG SS.
102
101 102 10 3 104 Number of Cycles, N
105 1 006 101 1 0 2 103 104
Number of Cycles, N1o 5 106
Figure 2. Design fatigue curves developed from statistical model for carbon and low-alloy steels in air at room temperature
IL.
010
E
r0
CD 102
101 102 105 106 101103 104 Number of Cycles, N
102 103 104
Number of Cycles, N105 106
Figure 3. Design fatigue curves developed from statistical model for carbon and low-alloy steels under service conditions where one or more threshold values are not satisfied
NUREG/CR-4667, Vol. 27
0
•j•10,3 0,
C,)
E
UJ)
Carbon Steel
N .Room-Temp. Air
Ua =551. 6MPa , ........................ . .. . ....... ay = 275.8 M Pa ....
E 206.84 GPa
Design Curve Based.....I .................... .... ......... "on Statistical Model ASME Code Curve J
E=206.84GPa
"Design Curve Based I on Statistical Model ......
... - -ASME Code Curve . .. . .i . . . . . . . . .
Carbon Steel " - Water
"When any one of S. the following
....... ...... ' ............ .................... ....... conditions is true "Temp. <150°C Si DO <0.05 ppm
Strain Rate >1 %/s
Statistical Mode .............................. :....... -.... ASME Code Curve
10
N
x�.
Carbon Steel Water Temp. 200'C DO 0.2 ppm
. ....... ........ !.............'.......
Strain Rate (0/6s)
000 -.
ASE.0 ........... .................... ..................C....... e...... S. ... ASME Code Curve
101 102 1N03 1 04 Number of Cycles, N
1 05 106 101 102 103 104 Number of Cycles, N
105 106
'K'.. 'N.�� �N.
" "-:-'- N. " .
Strain Rat (/Ois)
--- -0.01 0001....
. ASME Code Curve . .. . .i . . . ...
* N.
Carbon Steel Water Temp. 250°C DO 0.2 ppm
-.-
101 102 103 104 Number of Cycles, N
Carbon Steel Water Temp. 2880C
-.. DO 0.2 ppm 0'"- . .......... ....... ." "Sulfur >-0.015 wt.%
Straiin Rae(Is
0 -2-- --S. .. .0.001 :
S... SME Code Curve
105 10610 5 106 101 102 103 104
Number of Cycles, N
101 102 103 104
Number of Cycles, N105 106 101 102 103 104
Number of Cycles, N
105 106
Figure 4. Design fatigue curves developed from statistical model for carbon and low-alloy steels under servie conditioxs where all criical threshold values are satisfied
NUREG/CR-4667, Vol. 27
Qi.
E
CDo 102
S C
CP
"o 0=
10,
Low-Alloy Steel •. Water
Temp.2500C DO 0.2 ppm
- .-.i- .--.-".--5......... t ................... . "',--/-.-
Strain Rat (lo/S)
--- - 0.01
ASME Code Curve . . .. .i . . . . . . ..... . .. .
a
"Co
Co
1
Low-Alloy Steel N Water
"\ i Temp. 2/8o*c
DO 0.2 ppm •Sulfur ,0.015 wt.%
Str-, RaSe ( e/Crs) v ------ .0.1 "•-. "-
b.00.. ..0.01 .
S...ASME Code Curve
L ! I I . I . I .
------. ---.... ......... .-- ..... . "" .....
11
0 0 ......... ..... .. ....... .... .. ............ F ig u re... Si a -64,81MPa
102........>.- a.3 a Design fatigue curve developed from
statistical model for Types 304 and 316
< austeriitic SS in air
E =195.1 GPa
102 -- Statistical Moder-t......................... ..------ASME Code Curve
Number of Cycles, N
Types304 & 316 SS Types 304 & 316 SS DO <0.05 ppm ". DO Ž0.05 ppm
" . <200 0C, Al Strain Rates <2000C, All Strain Rate
ci 0'.- orŽ>00C 04%/s AM Cd e or .200'C, 0.4%/s --, -..*. .. .... .......... ............................. ............... ................. ................................ -- •''• "• i ,~~~SME Code• v.........i.........i........ .......
/ Design Curve ASME Code Des/ esign Curve
<E0C -.. >--Strain Rate (oS)ý200
2 ---- 004Strain Rate (lOWS) 00 . . 004 ----. 0.04
1 02 "--. - 0 0 0 •' .............. I ................. I................................... - . . .0
i02 -•o-o:50.0004 E=195.1 GPa ................................................................
101 102 103 i0 4 i0 5 106 io71o0 102 102 104 10 106 1o 7
Number of Cycles, N Number of Cycles, N
Figure 6. Design fatigue curves developed from statistical models for Types 304 and 316 SS in
water with <0.05 and Ž0.05 ppm DO
The best-fit curves were adjusted for the effect of mean stress by using the modified
Goodman relationships (Eqs. 2a and 2b), which assume the maximum possible mean stress
and typically give a conservative adjustment for mean stress, at least when environmental
effects are not significant. To be consistent with the current Code design curves, the mean
stress-adjusted best-fit curves were decreased by the same margins on stress and cycles that
are present in the current Code curves. The mean-stress-adjusted best-fit curves were
decreased by a factor of 2 on stress for carbon and low-alloy steels and by a factor of 1.5 for
austenitic SSs. A factor of 20 on life was used for all curves, although the actual margin on
life is =10 for austenitic SSs because of the differences between the ASME mean curve and the
best-fit curve to existing fatigue data.
For all of the design curves, we define a minimum threshold strain amplitude, below
which environmental effects either do not occur or are modest. As discussed earlier, the
threshold strain for carbon and low-alloy steels appears to be =20% higher than the fatigue
limit of the steel. This translates into strain amplitudes of 0.140 and 0.185%, respectively, for
CSs and LASs. These values must be adjusted for mean stress effects and variability due to
material and experimental scatter. To account for the effects of mean stress, the threshold
strain amplitudes are decreased by =15% for CSs and by --40% for LASs. These decreases
NUREG/CR-4667, Vol. 27 12
produce a threshold strain amplitude of =0. 12% for both steels. A factor of 1.7 on strain provides 90% confidence for the variations in fatigue life that are associated with material variability and experimental scatter.3 3 Thus, a threshold strain amplitude of 0.07% (or a stress amplitude of 145 MPa) was selected for both carbon and low-alloy steels. The existing fatigue data indicate a threshold strain range of =0.32% for austenitic SSs. This value is decreased by =10% to account for mean stress effects, and by a factor of 1.5 to account for uncertainties in fatigue life that are associated with material and loading variability. Thus, a threshold strain amplitude of 0.0977% (stress amplitude of 189 MPa) was selected for austenitic SSs.
Fatigue Life Correction Factor
The effects of reactor coolant environments on fatigue life have also been expressed in terms of a fatigue life correction factor Fen, which is the ratio of the life in air at room temperature to that in water at the service temperature.11 A similar approach has been proposed by the Electric Power Research Institute,3 5 however, they defined Fen as the ratio of the life in air to that in water, both at service temperature. A nonmandatory appendix, based on this procedure, is being proposed for inclusion in Section III of the ASME Code. To incorporate environmental effects into the Section III fatigue evaluation, a fatigue usage factor for a specific stress cycle, based on the current Code design fatigue curve is multiplied by the correction factor. A fatigue life correction factor Fen can be obtained from the statistical model (Eqs. 3-8), where
In(Fen) = In(NRTair) - In(Nwater). (9)
The fatigue life correction factor for CSs is given by
Fen = exp(0.554 - 0.001515T' V* 01, (10a)
for LASs, by
Fen= exp(0.898 - 0.0015157T '* *01, (10b)
and for austenitic SSs, by
Fen = exp(0.935 - T i' 0'), (10c)
where the constants T', * and 0* are defined in Eqs. 5a-5c, and T, i' and 0' are defined in Eqs. 8a-8c. Because the fatigue life of CSs in high-temperature high-DO water seems to be insensitive to the S content of the steel,* a value of 0.015 wt.% S was assumed in Eq. 5a to obtain the fatigue life correction factors for carbon and low-alloy steels given by Eqs. 10a and 10b.
* M. Higuchi, presented at the Pressure Vessel Research Council Meeting, June, 1995, Milwaukee, WI.
NUREG/CR-4667, Vol. 2713
2.1.4 Conservatism in Design Fatigue Curves
The overall conservatism in ASME Code fatigue evaluations has also been demonstrated
in fatigue tests on piping welds and components. 4 4 In air, the margins on the number of
cycles to failure for elbows and tees were 118-2500 and 123-1700, respectively, for CSs, and
40-310 and 104-510, respectively, for austenitic SSs. The margins for girth butt welds were
significantly lower at 14-128 and 6-77, respectively, for CSs and SSs. In these tests, fatigue
life was expressed as the number of cycles for the crack to penetrate through the wall, which
ranged in thickness from 6 to 18 mm (0.237 to 0.719 in.). The ASME design fatigue curves
represent the number of cycles that are necessary to form a 3-mm-deep crack. Consequently,
depending on wall thickness, the actual ASME margins to failure may be lower by a factor of >2.
Deardorff and Smith 4 5 have also discussed the types and extent of conservatisms that are
present in the ASME Section III fatigue evaluations and the effects of LWR environments on
fatigue margins. The sources of conservatism include design transients that are considerably
more severe than those experienced in service, grouping of transients, and simplified elastic
plastic analysis. Environmental effects on two components, the BWR feedwater nozzle/safe
end and the PWR steam generator feedwater nozzle/safe end, both constructed from LAS and
known to be affected by severe thermal transients, were also investigated during the study.
When environmental effects on fatigue life were not considered, Deardorff and Smith 4 5
estimated that, for the PWR and BWR nozzles, the ratios of the CUFs computed with the
Code design fatigue curve to CUFs computed with the mean experimental curve for test
specimen data were =60 and 90, respectively. To maintain the factor of 20 on life that was
used in the present Code design fatigue curves to account for the uncertainties due to
material and loading variability, the margins for the PWR and BWR nozzles are reduced to 3
and 4.5, respectively. The studies by Mayfield et al.4 4 and Deardorff and Smith4 5 demonstrate
the overall conservatism in the current ASME Section III Code fatigue evaluation procedures.
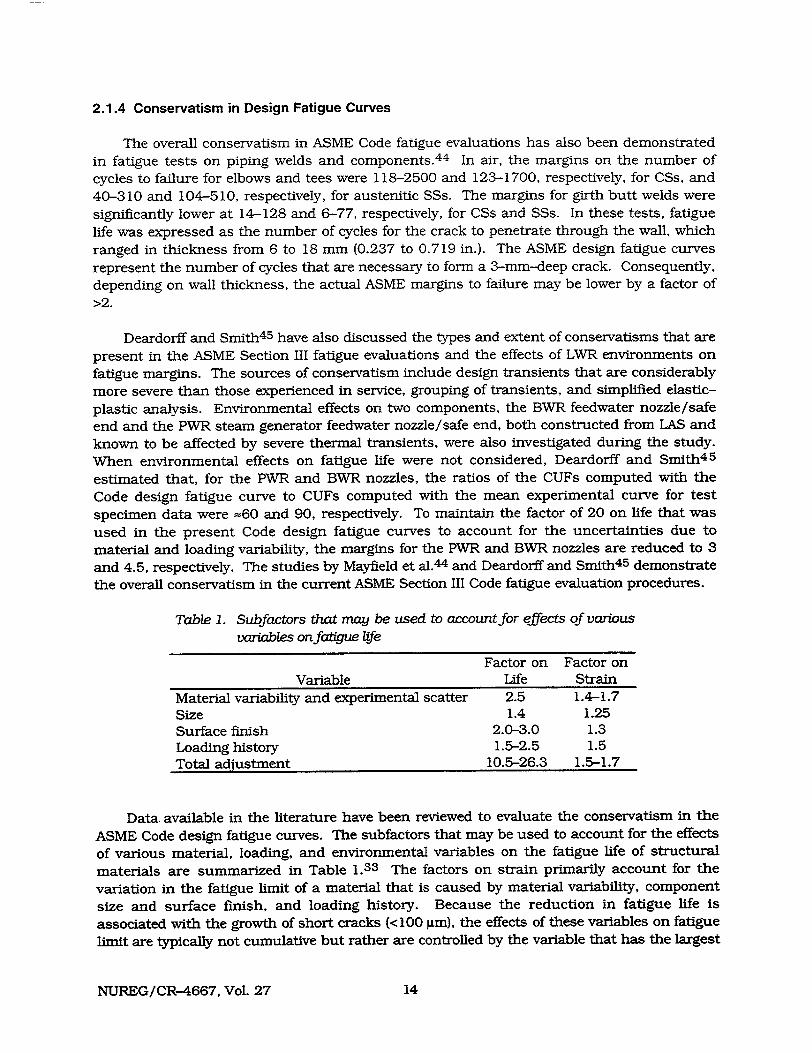
Table 1. Subfactors that may be used to account for effects of various
variables on fatigue life
Factor on Factor on Variable Life Strain
Material variability and experimental scatter 2.5 1.4-1.7 Size 1.4 1.25 Surface finish 2.0-3.0 1.3 Loading history 1.5-2.5 1.5 Total adjustment 10.5-26.3 1.5-1.7
Data. available in the literature have been reviewed to evaluate the conservatism in the
ASME Code design fatigue curves. The subfactors that may be used to account for the effects
of various material, loading, and environmental variables on the fatigue life of structural
materials are summarized in Table 1.33 The factors on strain primarily account for the
variation in the fatigue limit of a material that is caused by material variability, component
size and surface finish, and loading history. Because the reduction in fatigue life is
associated with the growth of short cracks (<100 gim), the effects of these variables on fatigue
limit are typically not cumulative but rather are controlled by the variable that has the largest
NUREG/CR-4667, Vol. 27 14
effect. The values in Table 1 suggest that a factor of at least 1.5 on strain and 10 on cycles is needed to account for the differences and uncertainties of relating fatigue lives of laboratory test specimens to those of large components. Because carbon and low-alloy steels and austenitic SSs develop a corrosion scale in LWR environments, the effect of surface finish may not be significant, i.e., the effects of surface roughness are included in environmentally assisted decrease in fatigue life in LWR coolant environments. In water, the subfactor on life to account for surface finish effects may be as low as 1.5 or may be eliminated completely; a factor of 1.5 on strain and 7 on cycles is adequate to account for the uncertainties that arise from material and loading variability. Therefore, the factor of 20 on life that is used in developing the design fatigue curves includes, as a safety margin, a factor of 3 or 4 on life that may be used to account for the effects of environment on the fatigue lives of these steels.
These results are consistent with the conclusions of the Pressure Vessel Research Council (PVRC) working group on fatigue S-N data analysis.4 6 One of the tasks in the PVRC activity was to define a set of values for material, loading, and environmental variables that lead to "moderate" or "acceptable" effects of environment on fatigue life. A factor of 4 on the ASME mean life was chosen as a working definition of acceptable effects of environment, i.e., up to a factor of 4 decrease in fatigue life due to environment is considered acceptable and does not require further fatigue evaluation. The basis for this criterion is that a factor of 4 on life constitutes normal data scatter and/or at least that much conservatism is included in the design fatigue curves.
2.1.5 Fatigue Evaluations in LWR Environments
Section III, NB-3200- or NB-3600-type analyses of components for service in LWR environments can be performed with either the design fatigue curves or the fatigue life correction factors. Both of these approaches require information about the service conditions, e.g., temperature, strain rate, and DO level.
Fatigue Evaluations Based on Environmentally Corrected Design Fatigue Curves
Fatigue evaluations that are based on the design fatigue curves may be performed as follows:
(a) For each stress cycle or load pair, determine the alternating stress amplitude according to the guidelines of NB 3222.4 (design by analysis) or NB 3650 (analysis of piping products), and the total number of cycles anticipated during the lifetime of the component.
(b) For each stress cycle or load pair, obtain information about the service conditions, e.g., temperature, strain rate, and DO level. The procedure for obtaining these parameters depends on the details of the available information, i.e., whether the elapsed time-vs.temperature information for the transient is available. Fatigue tests in oxygenated water under combined mechanical and thermal cycling13 ,2 4 indicate that an average temperature may be used if the time-vs.-temperature information is available; the highest temperature may be used for a conservative estimate of life. Because environmental effects on fatigue life are modest at temperatures <1500C and at strains below the threshold value, average temperature may be determined by taking the average of the maximum temperature and either 1500C or the temperature at threshold strain, whichever is higher. An average strain rate is generally used for each load state; it is
NUREG/CR-4667, Vol. 2715
obtained from the peak strain and elapsed time for the transient. However, fatigue
monitoring data indicate that actual strain rates may vary significantly during a
transient. The slowest strain rate can be used for a conservative estimate of life.
(c) For each alternating stress amplitude and corresponding service condition, obtain a
partial usage factor from the appropriate design fatigue curve (Figs. 3, 4, and 6). The
design fatigue curves in Fig. 3 are used for carbon and low-alloy steels when any one of
the threshold condition is not satisfied, i.e., when any one of the following conditions is
true:
Temperature: < 1500C DO: < 0.05 ppm Strain Rate: > 1%/s.
The design curves in Fig. 4 are used for carbon and low-alloy steels when all of the
threshold conditions are satisfied, i.e., temperature >150°C, DO >0.05 ppm, and strain
rate <l%/s; the curves shown in Fig. 4 are for 200, 250, and 2880 C; 0.2 ppm DO level;
and 0.1, 0.01, and •0.001%/s strain rate.
Similarly, the design curves in Fig. 6 are used for austenitic SSs under various service
conditions. The two sets of curves are for <0.05 and Ž0.05 ppm DO in water. In both
sets, the solid curve represents the service condition when any one of the two threshold
conditions is not satisfied, i.e., when any one of the following conditions is true:
Temperature: < 200°C Strain Rate: Ž 0.4%/s.
The design curves shown by the chain dash lines in Fig. 6 are used for austenitic SSs
when both of the threshold conditions are satisfied, i.e., temperature >_200°C and strain
rate <0.4%/s; the three curves shown in Fig. 6 are for 0.04, 0.004, and •0.0004%/s strain
rate, and temperatures between 200 and 3200C.
(d) Calculate the CUF for the component; it is the sum of the partial usage factors. As
discussed in the previous section, the design fatigue curves include a factor of 3 or 4 on
life that may be used to account for the effects of environment on the fatigue lives of
these steels. To avoid additional conservatism, the environmentally adjusted CUF for the
component may be decreased by a factor of 3.
Fatigue Evaluations Based on Fatigue Life Correction Factor
Fatigue evaluations that are based on the fatigue life correction factor may be performed
as follows:
(a) and (b) are as described above.
(c) For each alternating stress amplitude, obtain a partial usage factor from the current Code
design curves in Figs. 1-9.1 through 1-9.6 of Appendix I to Section III of the Code.
(d) Adjust the partial usage factors for environmental effects by multiplying by Fen, which is
calculated from Eqs. 10a-10c and the service condition for the stress cycle. The value of
NUREG/CR-4667, Vol. 27 16
Fen is calculated for only those stress cycles that satisfy all of the threshold conditions. For carbon and low-alloy steels, Fen is calculated when all of the following conditions are true:
Temperature: > 1500 C DO: > 0.05 ppm Strain Rate: < 1%/s.
For austenitic SSs, Fen is calculated when the following two conditions are true:
Temperature: > 200'C Strain Rate: < 0.4%/s.
Because the design fatigue curves include a margin that may be used to account for the effects of environment, to avoid additional conservatism, Fen valves calculated from Eqs. 10a-10c are decreased by this amount. For carbon and low-alloy steels, Fen is decreased by a factor of 3 but not less than 1. For austenitic SSs, Fen is decreased by a factor of 1.5 because, as discussed earlier, the actual margin on life is =10 for austenitic SSs inasmuch as the ASME mean curve and the best-fit curve to existing fatigue data differ.
(e) Finally, calculate the CUF for the component; it is the sum of the partial usage factors.
2.1.6 Conclusions
The design fatigue curve method and the fatigue life correction factor method of evaluating fatigue lives are based on statistical models for estimating fatigue lives of carbon and low-alloy steels and austenitic SSs in LWR environments. The environmentally adjusted design fatigue curves provide allowable cycles for fatigue crack initiation in LWR coolant environments. All of the design curves maintain the margin of 20 on life. However, to be consistent with the current ASME Code curves, the margin on stress is 2 for carbon and lowalloy steels and 1.5 for austenitic SSs.
In the Fen method, environmental effects on life are estimated from the statistical models but the correction is applied to fatigue lives estimated from the current Code design curves. Therefore, estimates of fatigue lives that are based on the two methods may differ because of differences in the ASME mean curve and the best-fit curve to existing fatigue data. The current Code design curve for carbon steels (Fig. 2) is comparable to the statistical-model curve for LASs; however, it is somewhat conservative at stress levels <500 MPa when compared with the statistical-model curve for CSs. Consequently, usage factors based on the Fen method would be comparable to those based on the environmentally adjusted design fatigue curves for LASs and would be somewhat higher for CSs.
Figure 5 indicates that, for austenitic SSs, the current Code design fatigue curve is nonconservative when compared with the statistical-model curve, i.e., it predicts longer fatigue lives than the best-fit curve to the existing S-N data. Consequently, usage factors that are based on the Fen method would be lower than those determined from the environmentally corrected design fatigue curves. However, because the usage factors are decreased by a factor of 1.5 in the Fen method and 3 in the design curve method, the values that are obtained from the two methods would be comparable after they are adjusted.
NUREG/CR-4667, Vol. 2717
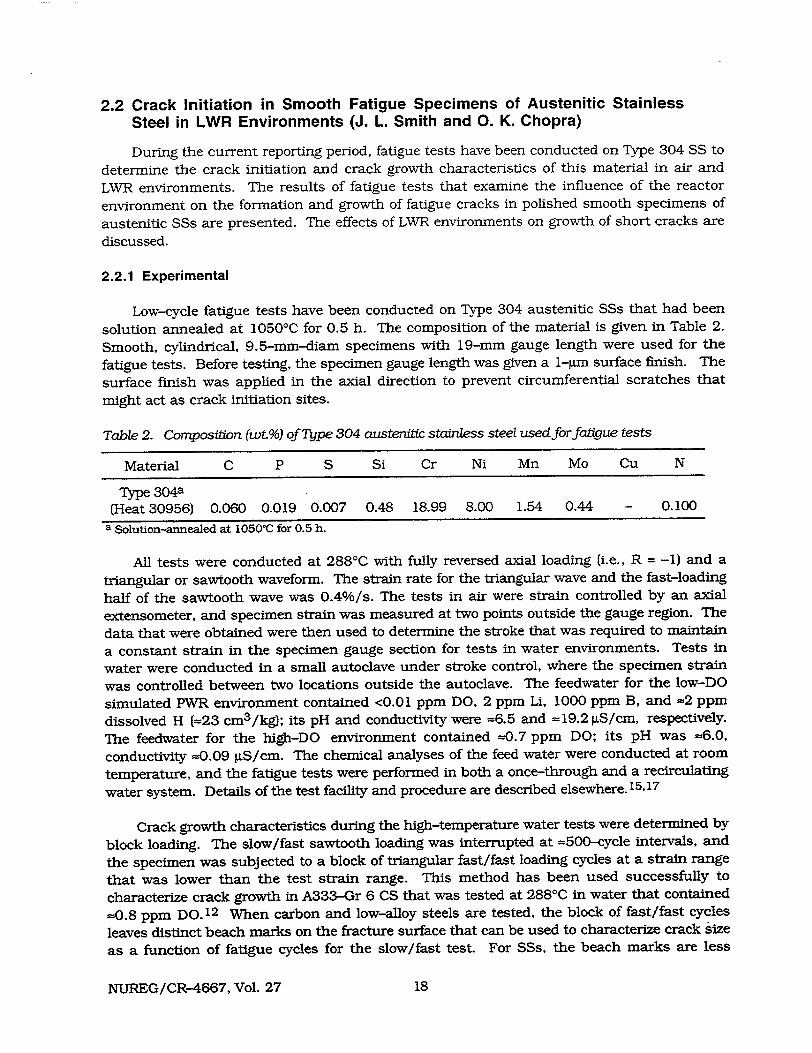
2.2 Crack Initiation in Smooth Fatigue Specimens of Austenitic Stainless Steel in LWR Environments (J. L. Smith and 0. K. Chopra)
During the current reporting period, fatigue tests have been conducted on Type 304 SS to
determine the crack initiation and crack growth characteristics of this material in air and
LWR environments. The results of fatigue tests that examine the influence of the reactor
environment on the formation and growth of fatigue cracks in polished smooth specimens of
austenitic SSs are presented. The effects of LWR environments on growth of short cracks are
discussed.
2.2.1 Experimental
Low-cycle fatigue tests have been conducted on Type 304 austenitic SSs that had been
solution annealed at 10501C for 0.5 h. The composition of the material is given in Table 2.
Smooth, cylindrical, 9.5-mm-diam specimens with 19-mm gauge length were used for the
fatigue tests. Before testing, the specimen gauge length was given a 1-jin surface finish. The
surface finish was applied in the axial direction to prevent circumferential scratches that
might act as crack initiation sites.
Table 2. Composition (wt.%) of Tygpe 304 austenitic stainless steel used for fatigue tests
Material C P S Si Cr Ni Mn Mo Cu N
Type 304a (Heat 30956) 0.060 0.019 0.007 0.48 18.99 8.00 1.54 0.44 - 0.100
a Solution-annealed at 1050°C for 0.5 h.
All tests were conducted at 288°C with fully reversed axial loading (i.e., R = -1) and a
triangular or sawtooth waveform. The strain rate for the triangular wave and the fast-loading
half of the sawtooth wave was 0.4%/s. The tests in air were strain controlled by an axial
extensometer, and specimen strain was measured at two points outside the gauge region. The
data that were obtained were then used to determine the stroke that was required to maintain
a constant strain in the specimen gauge section for tests in water environments. Tests in
water were conducted in a small autoclave under stroke control, where the specimen strain
was controlled between two locations outside the autoclave. The feedwater for the low-DO
simulated PWR environment contained <0.01 ppm DO, 2 ppm Li, 1000 ppm B, and =2 ppm
dissolved H (=23 cm 3 /kg); its pH and conductivity were =6.5 and =19.2 gS/cm, respectively.
The feedwater for the high-DO environment contained --0.7 ppm DO; its pH was --6.0,
conductivity --0.09 pS/cm. The chemical analyses of the feed water were conducted at room
temperature, and the fatigue tests were performed in both a once-through and a recirculating
water system. Details of the test facility and procedure are described elsewhere. 15 ,1 7
Crack growth characteristics during the high-temperature water tests were determined by
block loading. The slow/fast sawtooth loading was interrupted at =500-cycle intervals, and
the specimen was subjected to a block of triangular fast/fast loading cycles at a strain range
that was lower than the test strain range. This method has been used successfully to
characterize crack growth in A333-Gr 6 CS that was tested at 2880C in water that contained
=0.8 ppm DO. 12 When carbon and low-alloy steels are tested, the block of fast/fast cycles
leaves distinct beach marks on the fracture surface that can be used to characterize crack size
as a function of fatigue cycles for the slow/fast test. For SSs, the beach marks are less
NUREG/CR-4667, Vol. 27 is
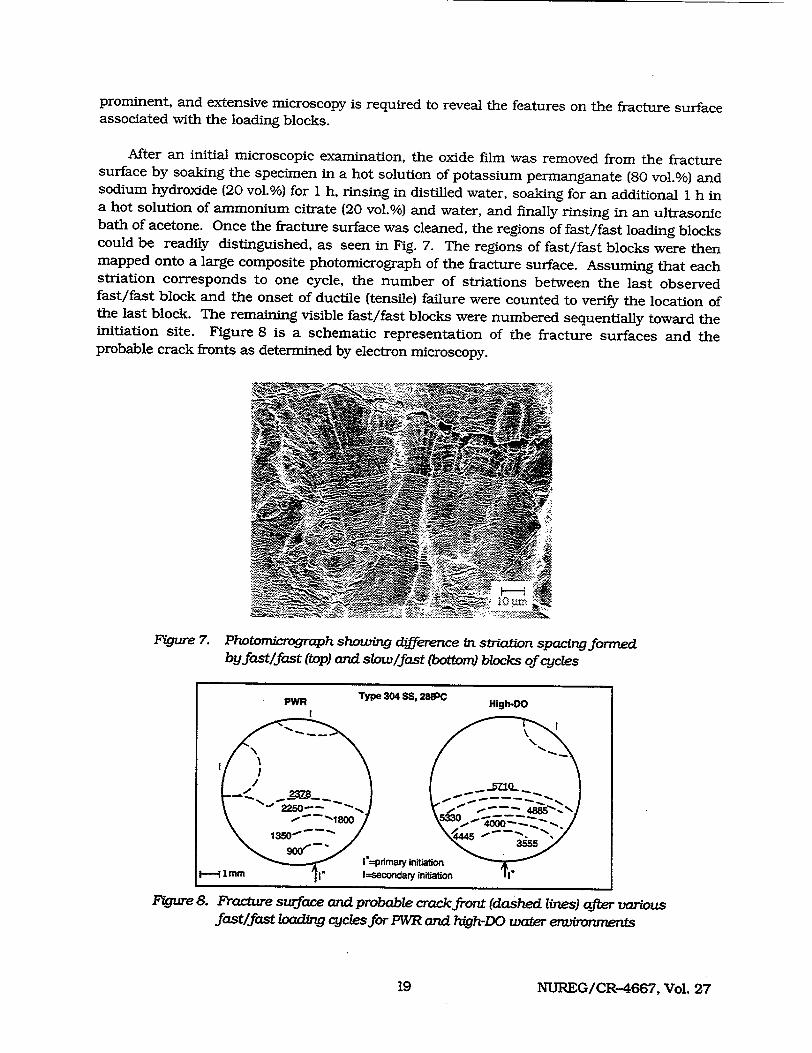
prominent, and extensive microscopy is required to reveal the features on the fracture surface associated with the loading blocks.
After an initial microscopic examination, the oxide film was removed from the fracture surface by soaking the specimen in a hot solution of potassium permanganate (80 vol.%) and sodium hydroxide (20 vol.%) for I h, rinsing in distilled water, soaking for an additional 1 h in a hot solution of ammonium citrate (20 vol.%) and water, and finally rinsing in an ultrasonic bath of acetone. Once the fracture surface was cleaned, the regions of fast/fast loading blocks could be readily distinguished, as seen in Fig. 7. The regions of fast/fast blocks were then mapped onto a large composite photomicrograph of the fracture surface. Assuming that each striation corresponds to one cycle, the number of striations between the last observed fast/fast block and the onset of ductile (tensile) failure were counted to verify the location of the last block. The remaining visible fast/fast blocks were numbered sequentially toward the initiation site. Figure 8 is a schematic representation of the fracture surfaces and the probable crack fronts as determined by electron microscopy.
Figure 7. Photomicrograph showing difference in striation spacing formed by fast/fast (top) and slow/fast (bottom) blocks of cycles
PWR Typ
220
- •N1800
1350,-m900.1-,
11MM I .
e 304 SS, 203C
primary initiation econdary initiation
Figure 8. Fracture surface and probable crack front (dashed lines) after various fast/fast loading cycles for PWR and high-DO water environments
NUREG/CR-4667, Vol. 27
High-DO
I---
19
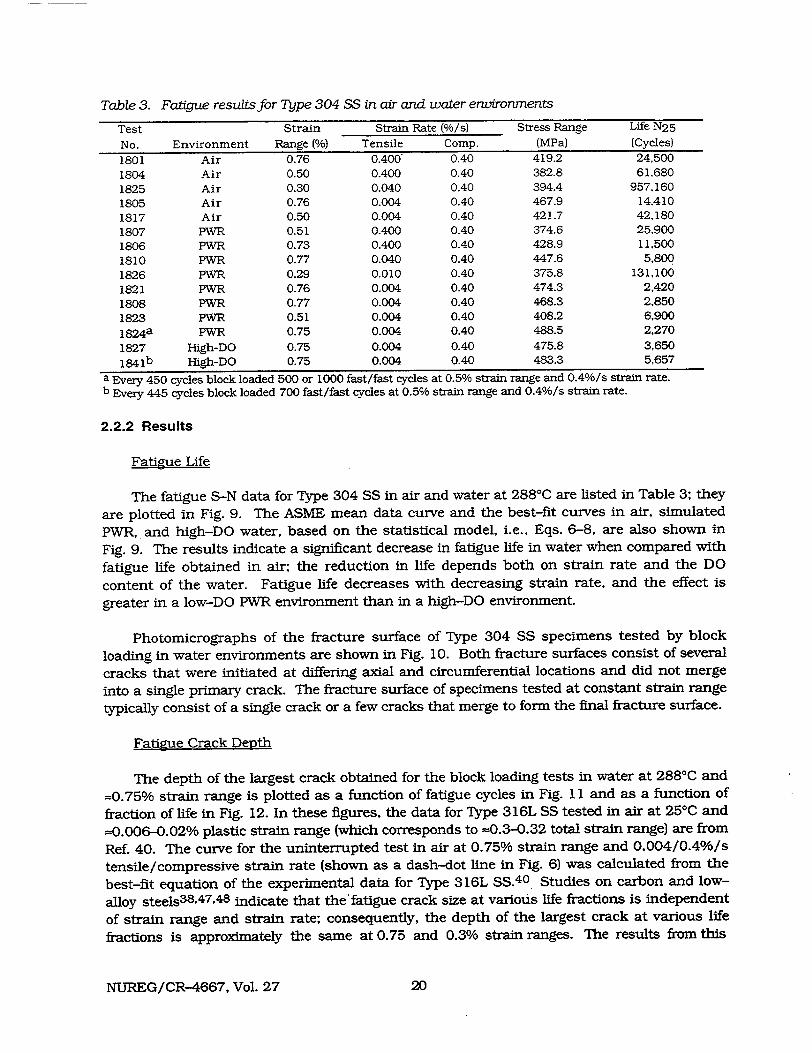
Table 3. Fatigue results for Type 304 SS in air and water environments
Test Strain Strain Rate (%/s) Stress Range Life N25
No. Environment Range (%) Tensile Comp. (MPa) (Cycles)
1801 Air 0.76 0.400 0.40 419.2 24,500
1804 Air 0.50 0.400 0.40 382.8 61,680
1825 Air 0.30 0.040 0.40 394.4 957,160
1805 Air 0.76 0.004 0.40 467.9 14,410
1817 Air 0.50 0.004 0.40 421.7 42,180
1807 PWR 0.51 0.400 0.40 374.6 25,900
1806 PWR 0.73 0.400 0.40 428.9 11,500
1810 PWR 0.77 0.040 0.40 447.6 5,800
1826 PWR 0.29 0.010 0.40 375.8 131,100
1821 PWR 0.76 0.004 0.40 474.3 2,420
1808 PWR 0.77 0.004 0.40 468.3 2,850
1823 PWR 0.51 0.004 0.40 408.2 6,900
1824a PWR 0.75 0.004 0.40 488.5 2,270
1827 High-DO 0.75 0.004 0.40 475.8 3,650
1841b High-DO 0.75 0.004 0.40 483.3 5,657
a Every 450 cycles block loaded 500 or 1000 fast/fast cycles at 0.5% strain range and 0.4%/s strain rate.
b Every 445 cycles block loaded 700 fast/fast cycles at 0.5% strain range and 0.4%/s strain rate.
2.2.2 Results
Fatigue Life
The fatigue S-N data for Type 304 SS in air and water at 2880C are listed in Table 3; they
are plotted in Fig. 9. The ASME mean data curve and the best-fit curves in air, simulated
PWP, and high-DO water, based on the statistical model, i.e., Eqs. 6-8, are also shown in
Fig. 9. The results indicate a significant decrease in fatigue life in water when compared with
fatigue life obtained in air; the reduction in life depends both on strain rate and the DO
content of the water. Fatigue life decreases with decreasing strain rate, and the effect is
greater in a low-DO PWR environment than in a high-DO environment.
Photomicrographs of the fracture surface of Type 304 SS specimens tested by block
loading in water environments are shown in Fig. 10. Both fracture surfaces consist of several
cracks that were initiated at differing axial and circumferential locations and did not merge
into a single primary crack. The fracture surface of specimens tested at constant strain range
typically consist of a single crack or a few cracks that merge to form the final fracture surface.
Fatigue Crack Depth
The depth of the largest crack obtained for the block loading tests in water at 2880C and
=0.75% strain range is plotted as a function of fatigue cycles in Fig. 11 and as a function of
fraction of life in Fig. 12. In these figures, the data for Type 316L SS tested in air at 250C and
=0.006-0.02% plastic strain range (which corresponds to --0.3-0.32 total strain range) are from
Ref. 40. The curve for the uninterrupted test in air at 0.75% strain range and 0.004/0.4%/s
tensile/compressive strain rate (shown as a dash-dot line in Fig. 6) was calculated from the
best-fit equation of the experimental data for Type 316L SS.40 Studies on carbon and low
alloy steels3 8 ,4 7 ,4 8 indicate that the'fatigue crack size at various life fractions is independent
of strain range and strain rate; consequently, the depth of the largest crack at various life
fractions is approximately the same at 0.75 and 0.3% strain ranges. The results from this
NUREG/CR-4667, Vol. 27 20
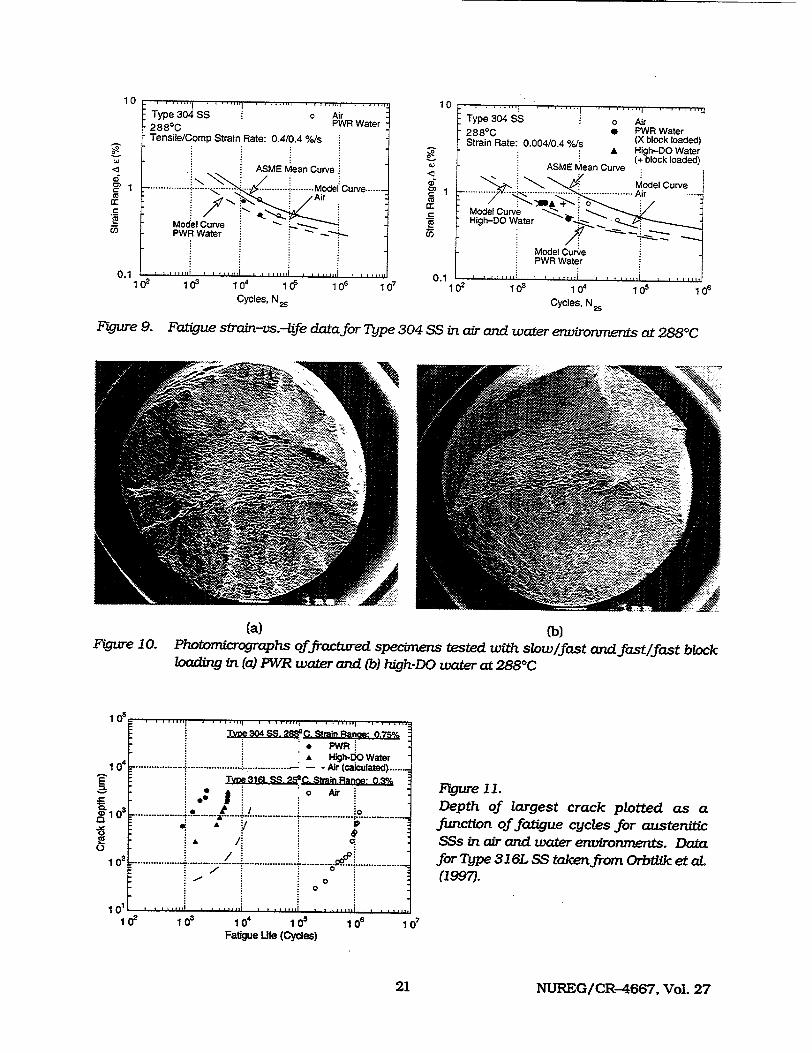
10
`3
c
oC
Type 304 SS o Air 288oC PWR Water Tensile/Comp Strain Rate: 0.4/0.4 %/s
ASME Mean Curve
. .......... ......... Model Curve ------. S\ i/Air i/
Model Curve PWR Water
I !
102 103 io4 io i5 io7 Cycles, N S
S. .. .. . . ... I . . ...i ... .
Type 304 SS o Air 2880C * PWR Water Strain Rate: 0.004/0.4 %/s (X block loaded)
A High-DO Water : (+ block loaded) r ASME Mean Curve
Model Curve "- ......... .. .. ..... " . ............ i .. ...........Air
Model Curve " ': High-DO Water -.
Model Curve PWR Water
102 103 104 105 106 Cycles, N 25
Figure 9. Fatigue strain-vs.-life data for Type 304 SS in air and water environments at 2880 C
(a) (b) Figure 10. Photomicrographs offractured specimens tested with slow/fast and fast/fast block
loaduig in (a) PVR water and (b) high-DO water at 2880C
1 ^5
TV*e 304 SS- C.Strain Rano= 0,75% S"e PWR:
A High-DO Water 04 .................... .................... ................. - -Air (calculated .......
T= 316L SS- 251C. Strain RanoA: 0.3% 0 Air
.. ......... . • :0 /• 3 ~ t
/ 0 A / a
/
3 4 0
10 10 101 Fatigue Life (Cycles)
I op
Fgure 11. Depth of largest crack plotted as a function of fatigue cycles for austenitic SSs in air and water environments. Data for Type 316L SS taken from Orbtlik et aL (19971.
Io7
NUREG/CR-4667, Vol. 27
10
GF
0. 1 0.1
14
0
0
oe
I
0.1
¢
!£
IC
21
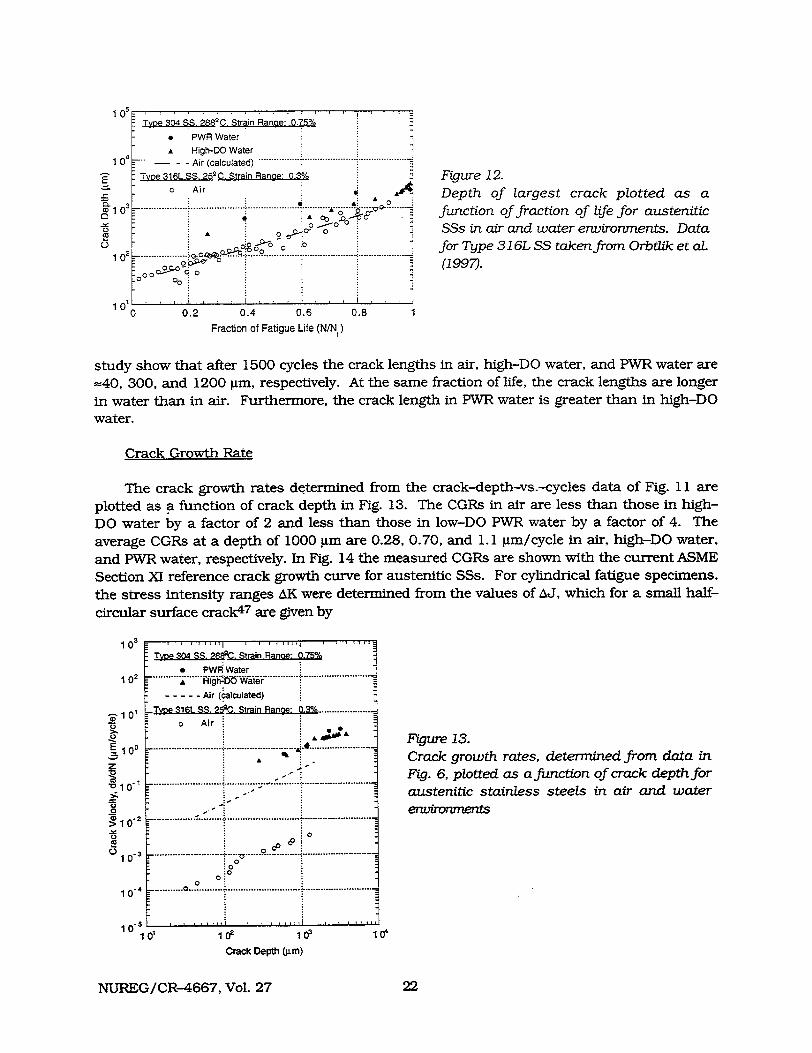
Tve 304 SS. 2882C, Strain Ranae: 0.75%
* PWR Water
* High-DO Water -' -- - ir(c lc la ec) ......... .................... .. .......... - - Air (calculated) ----*...
Tyre 316L SS. 25 Q. Strain Range: 0.3%
0 Air A * AA
O -. ................ i?................... .. ................... -- ......... o7 0•"= ' '• • ° ........ . : 0A
A 00 0 1. 2 ...... 0
0 ......... ..................... ..................
Figure 12. Depth of largest crack plotted as a function of fraction of life for austenitic SSs in air and water environments. Data for Type 316L SS taken from Orbtlik et al. (1997).:o 002•o
10 0 0.2 0.4 0.6
Fraction of Fatigue Life (N/N 1)
10.8 1
study show that after 1500 cycles the crack lengths in air, high-DO water, and PWR water are =40, 300, and 1200 pm, respectively. At the same fraction of life, the crack lengths are longer
in water than in air. Furthermore, the crack length in PWR water is greater than in high-DO water.
Crack Growth Rate
The crack growth rates determined from the crack-depth-vs.-cycles data of Fig. 11 are
plotted as a function of crack depth in Fig. 13. The CGRs in air are less than those in high
DO water by a factor of 2 and less than those in low-DO PWR water by a factor of 4. The
average CGRs at a depth of 1000 pgm are 0.28, 0.70, and 1.1 pm/cycle in air, high-DO water,
and PWR water, respectively. In Fig. 14 the measured CGRs are shown with the current ASME
Section XM reference crack growth curve for austenitic SSs. For cylindrical fatigue specimens,
the stress intensity ranges AK were determined from the values of AJ, which for a small half
circular surface crack4 7 are given by
1 02
1 01
E 0 0
z 10'
0
Q 2 >,10'
0 0 "10"
1 0.
1 0
Figure 13. Crack growth rates, determined from data in Fig. 6, plotted as a function of crack depth for austenitic stainless steels in air and water
environments
102 Dh 3
Crack Deph (±~m)
NUREG/CR-4667, Vol. 27
1
.1
1
T ve 304 SS 288&. Strain Rang: 0.75%
. PWF .Water
A HigheDO Water - - - Air (calculated)
_Twe 316L SS. 25C. Strain Ranoe 03%....................
0 Air)
A0
S...... ..................................... .. .. ........................
7 .......................... 1 ................ .. . .... ;........... . ...... I ....................... ...... ..... .. . ..... .................... ........
:0 *0 :0
0 : -. 0 ...... ....... ............ . . .............
.. I
22
I I I t I '11 1 I I I 1 I l i ll I . . . . . .
0'
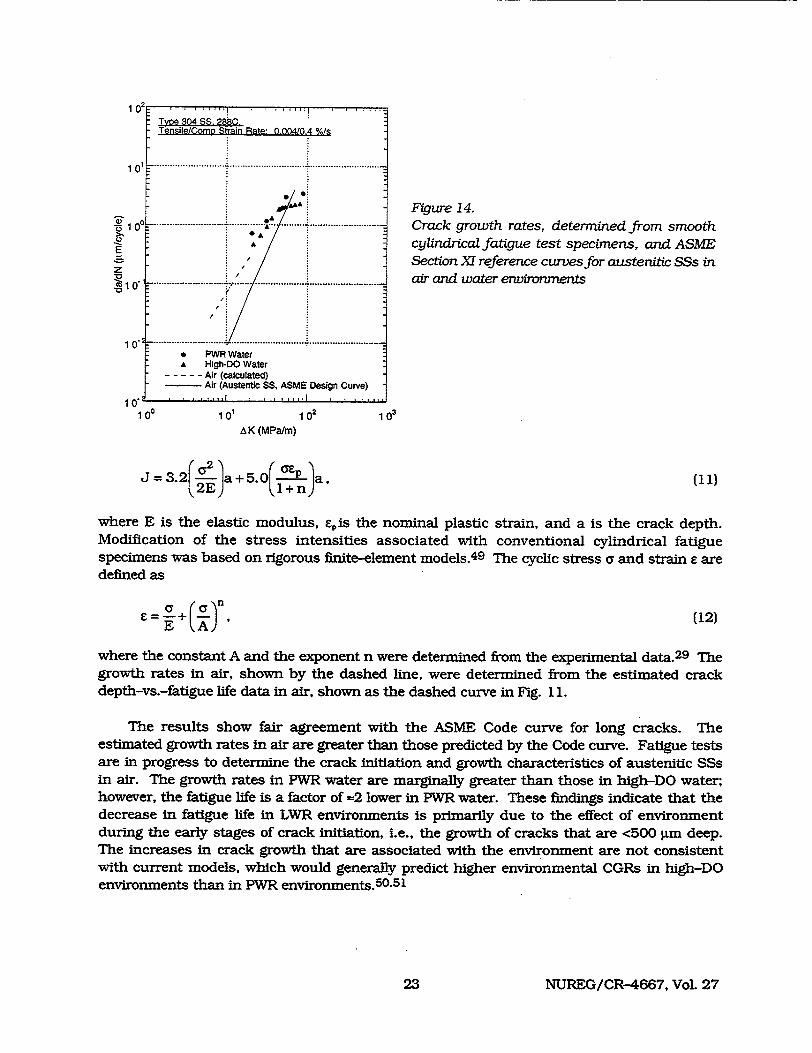
"Figure 14. • ~ ........................... -. .............. 91" ........... .i............................ ra k g o t r te , e er ne from sm ooth i 10†††††††††††††††††††††††††††Crack growth rates, determined frmsot AA
E 2cylindrical fatigue test specimens, and ASME
Section XM reference curves for austenitic SSs in z S0-o" ............................ 1 ........................................ air and w ater ernviroronm ents
1 ....................... ... ...... . ........................... 0 PWR Water A High-DO Water
- - - - Air (calculated) - Air (Austentic SS, ASME Design Curve)
10*4 . . .. i . . .. i "1
100 101 102 101
A K (MPa/m)
J = 3.2 a+5.0 ~E.a.11
where E is the elastic modulus, eis the nominal plastic strain, and a is the crack depth. Modification of the stress intensities associated with conventional cylindrical fatigue specimens was based on rigorous finite-element models. 4 9 The cyclic stress a and strain s are defined as
_ = + (,n' (12) E ~A
where the constant A and the exponent n were determined from the experimental data.2 9 The growth rates in air, shown by the dashed line, were determined from the estimated crack depth-vs.-fatigue life data in air, shown as the dashed curve in Fig. 11.
The results show fair agreement with the ASME Code curve for long cracks. The estimated growth rates in air are greater than those predicted by the Code curve. Fatigue tests are in progress to determine the crack initiation and growth characteristics of austenitic SSs in air. The growth rates in PWR water are marginally greater than those in high-DO water; however, the fatigue life is a factor of -2 lower in PWR water. These findings indicate that the decrease in fatigue life in LWR environments is primarily due to the effect of environment during the early stages of crack initiation, i.e., the growth of cracks that are <500 gm deep. The increases in crack growth that are associated with the environment are not consistent with current models, which would generally predict higher environmental CGRs in high-DO environments than in PWR environments.50-51
NUREG/CR-4667, Vol. 2723
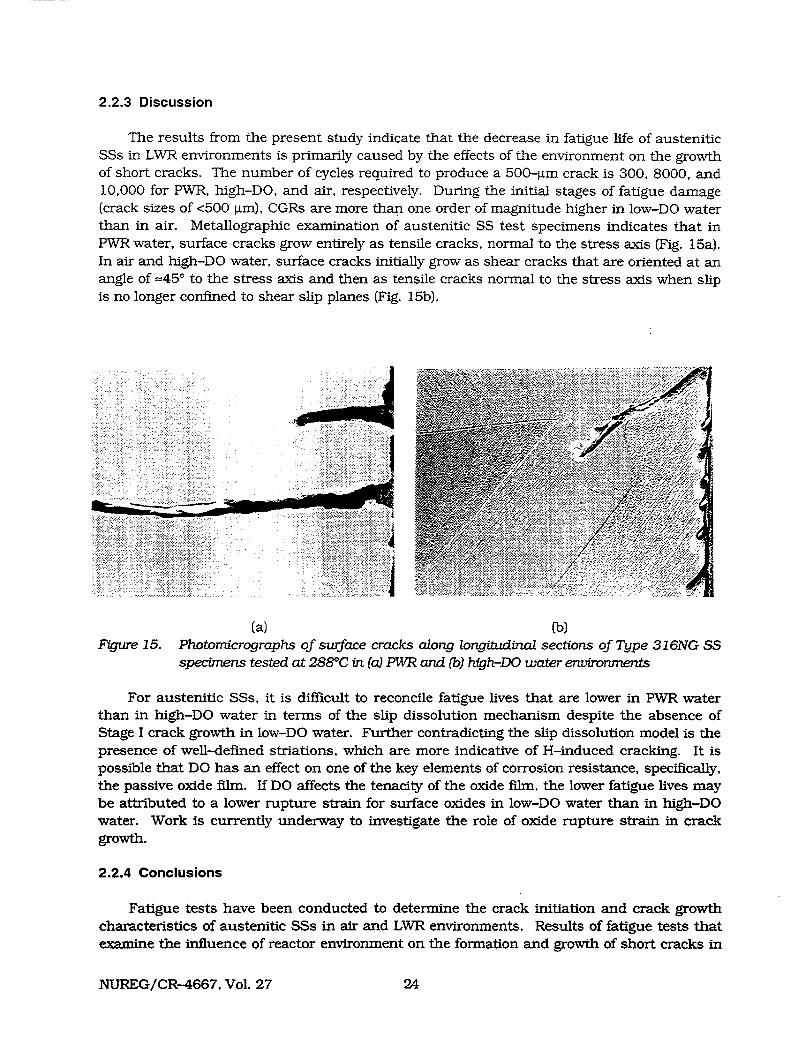
2.2.3 Discussion
The results from the present study indicate that the decrease in fatigue life of austenitic SSs in LWR environments is primarily caused by the effects of the environment on the growth of short cracks. The number of cycles required to produce a 500-jm crack is 300, 8000, and 10,000 for PWR, high-DO, and air, respectively. During the initial stages of fatigue damage (crack sizes of <500 im), CGRs are more than one order of magnitude higher in low-DO water than in air. Metallographic examination of austenitic SS test specimens indicates that in PWR water, surface cracks grow entirely as tensile cracks, normal to the stress axis (Fig. 15a). In air and high-DO water, surface cracks initially grow as shear cracks that are oriented at an angle of =45' to the stress axis and then as tensile cracks normal to the stress axis when slip is no longer confined to shear slip planes (Fig. 15b).
4:..:-
Figure 15.(a) (b)
Photomicrographs of surface cracks along longitudinal sections of Type 316NG SS specimens tested at 288*C in (a) PWR and (b) high-DO water environments
For austenitic SSs, it is difficult to reconcile fatigue lives that are lower in PWR water than in high-DO water in terms of the slip dissolution mechanism despite the absence of Stage I crack growth in low-DO water. Further contradicting the slip dissolution model is the presence of well-defined striations, which are more indicative of H-induced cracking. It is possible that DO has an effect on one of the key elements of corrosion resistance, specifically, the passive oxide film. If DO affects the tenacity of the oxide film, the lower fatigue lives may be attributed to a lower rupture strain for surface oxides in low-DO water than in high-DO water. Work is currently underway to investigate the role of oxide rupture strain in crack growth.
2.2.4 Conclusions
Fatigue tests have been conducted to determine the crack initiation and crack growth characteristics of austenitic SSs in air and LWR environments. Results of fatigue tests that examine the influence of reactor environment on the formation and growth of short cracks in
NUREG/CR-4667, Vol. 27 24
Type 304 SS are presented. Crack length as a function of fatigue cycles was determined in air and water environments. The significant conclusions are summarized below.
" At the same fraction of life, cracks are longer in water than in air. The CGRs in water are greater than those in air, and the CGRs in PWR water are greater than those in high-DO water.
" The decrease in fatigue life of Type 304 austenitic SS in LWR water is primarily caused by the effects of environment on the growth of short cracks that are <500 gm deep.
" The results from the present study are not consistent with the slip dissolution model for enhanced CGRs in LWR environments. Oxide film rupture strengths and/or H evolution may play a greater role in these environments.
3 Irradiation-Assisted Stress Corrosion Cracking of Austenitic SS
3.1 Introduction
In recent years, failures of reactor-core internal components have increased after accumulating a fluence of >0.5 x 10²¹ n-cm-2 (E >1 MeV), or -0.7 dpa, in BWRs and at approximately one order of magnitude higher fluences in some PWR components. The general pattern of the observed failures indicates that as nuclear plants age and neutron fluence increases, various nonsensitized austenitic SSs become susceptible to intergranular (IG) failure. Some components are known to have cracked under minimal applied stress. Although most failed components can be replaced (e.g., PWR baffle former bolts), it would be very difficult or impractical to replace some safety-significant structural components (e.g., the BWR top guide, shroud, and core plate). Therefore, the structural integrity of these components at high fluence has been a subject of concern, and extensive research has been conducted to provide an understanding of this type of degradation, which is commonly known as irradiation-assisted stress corrosion cracking (IASCC).52- 72
Irradiation profoundly affects local coolant water chemistry and component microstructure. Primary material effects of irradiation include alteration of local microchemistry, microstructure, and mechanical properties of the core internal components, which are usually fabricated from ASTM Type 304, 316, or 348 SS. Irradiation produces defects, defect clusters, and defect-impurity complexes in grain matrices and alters the dislocation and dislocation loop structures, leading to radiation-induced hardening, and in many cases, flow localization via dislocation channeling. Irradiation also leads to changes in the stability of second-phase precipitates and the local alloy chemistry near grain boundaries, precipitates, and defect clusters. A grain-boundary microchemistry that significantly differs from the bulk composition can be produced in association with not only radiation-induced segregation but also thermally driven equilibrium and nonequilibrium segregation of alloying and impurity elements.
For many years, irradiation-induced grain-boundary depletion of Cr has been considered to be the primary metallurgical process that causes IASCC. One of the most important factors that has been considered by many investigators to support the Cr-depletion mechanism is the observation that the dependence on water chemistry (i.e., oxidizing potential) of IGSCC of nonirradiated thermally sensitized material and of IASCC of BWR-irradiated solution-
NUREG/CR-4667, Vol. 2725
annealed material is similar. 5 2 - 5 4 However, contrary to expectations based on the strong
effect of water chemistry implicated in the Cr-depletion mechanism, cracking of control rod cladding and baffle plate bolts has been reported at numerous PWRs (i.e., under nonoxidizing potential). Also, the susceptibility of PWR-irradiated components to IASCC has been shown
clearly from expanding-pellet 5 5 and SSRT56 tests in PVW-R water 5 5 or PWR-simulated water,5 6
although PWR water chemistry falls well within the range of the protective electrochemical
potential (ECP). 5 2 - 5 4 A direct correlation with grain-boundary Cr concentration and
susceptibility of steels to IASCC under BWR conditions does not, however, provide conclusive evidence for the grain-boundary Cr-depletion mechanism. 6 5
Other investigators have implicated radiation-induced segregation of ASTM-specified impurities such as Si, P, and S as the primary process that causes LASCC.5 5 ,5 7 ,5 8 The superior resistance of one heat of Type 348 SS that is substantially low in C, Si, P, and S seemed to
provide evidence for this implication,5 5 and the same rationale was extended to Type 304 SS.
However, in direct contradiction, many investigators later reported results that indicated that
resistance of high-purity (HP) heats (low in C, Si, S, and P) of Type 304 SS is no better than
that of commercial-purity (CP) Type 304 SSs. 5 9 -6 5 Therefore, it appears that the role of grainboundary segregation of Si, P, and S is not well established.
Although C significantly increases the yield strength of irradiated SSs, higher C content
seems to be either benign or conducive to lower susceptibility to intergranular cracking of
irradiated materials. 6 5 Deleterious effects of 0 in steels have been reported by Chung et al.6 5
and Cookson et al.66 Indications of the deleterious effect of grain-boundary segregation of N
have been reported for BWR neutron absorber tubes. 6 5 Similar reports suggest that a higher
concentration of N is deleterious, at least under BWR conditions. 5 7. 6 3 ,6 7 ,6 8 Indications of the
deleterious role of N have also been reported for Types 304L and 316L SS that contain C
<240 wppm and have been irradiated in BWRs or test reactors at 240-3000C.62 Kasahara
et al.6 7 also reported that higher N in Type 316L increased the susceptibility to IASCC,
indicating that Type 316LN is a susceptible material. This observation is consistent with the
behavior of 316NG reported by Jacobs et al.5 7 and Jenssen and Ljungberg. 6 9 In contrast to
this, 316NG irradiated at =50'C has been reported to be resistant to intergranular failure at =2880 C in water that contained 32 ppm DO. 6 2 Therefore, the role of N appears to be
unconvincing, and the optimal range of N concentration is not well defined.
In general, IASCC is characterized by strong heat-to-heat variation in susceptibility, in
addition to strong effects of irradiation condition, material type, and grade, even among
materials of virtually identical chemical compositions. This indicates that the traditional interpretation based on the role of grain-boundary Cr depletion cannot completely explain the
mechanism of IASCC. Thus, although significant grain-boundary Cr depletion is believed by
most investigators to play an important role, it has been suspected that other important processes may have been overlooked which could be associated with other minor impurity
elements. 6 5 Therefore, we have initiated a new irradiation testing program to investigate
systematically the effects of alloying and impurity elements (Cr, Ni, Si, P, S, Mn, C, and N) on the susceptibility of austenitic SSs to IASCC at several fluence levels.
A test matrix was constructed according to the optimized method of Taguchi.7 3 ,7 4 Based
on the optimized test matrix, eight commercial and 19 laboratory heats of model austenitic SS alloys were, respectively, purchased commercially or fabricated in laboratory. 7 1 Compositions of the 27 model alloys are given in Table 4. Slow-strain-rate-tensile and 1/4T compact-
NUREG/CR-4667, Vol. 27 26
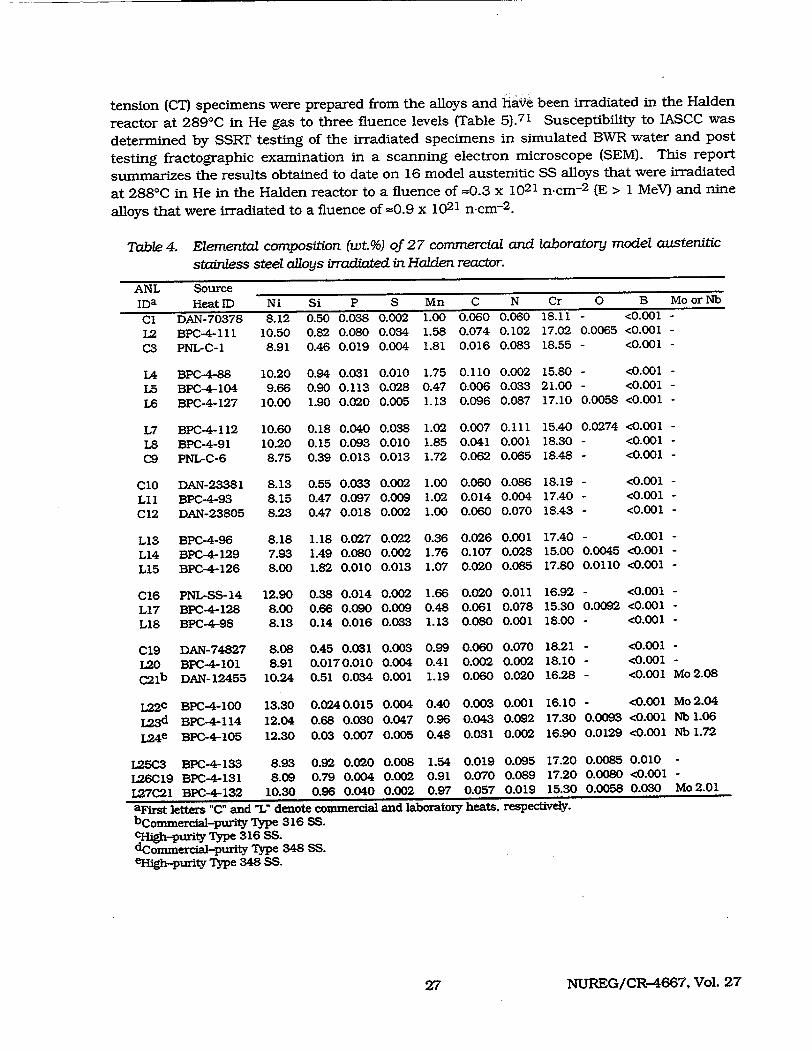
tension (CT) specimens were prepared from the alloys and have been irradiated in the Halden
reactor at 2890C in He gas to three fluence levels (Table 5).71 Susceptibility to IASCC was
determined by SSRT testing of the irradiated specimens in simulated BWR water and post
testing fractographic examination in a scanning electron microscope (SEM). This report
summarizes the results obtained to date on 16 model austenitic SS alloys that were irradiated
at 2880C in He in the Halden reactor to a fluence of =0.3 x 10²¹ n-cm- 2 (E > 1 MeV) and nine
alloys that were irradiated to a fluence of =0.9 x 10²¹ n-cm-2 .
Table 4. Elemental composition (wt.%) of 27 commercial and laboratory model austentic
stainless steel alloys irradiated in Haoden reactor.
ANL Source IDa Heat ID Ni Si P S Mn C N Cr 0 B Mo or Nb
DAN-70378 BPC-4- 111 PNL-C-1
BPC-4-88 BPC-4-104 BPC-4-127
BPC-4-112 BPC-4-91 PNL-C-6
C10 DAN-23381 L11 BPC-4-93 C12 DAN-23805
L13 BPC-4-96 L14 BPC-4-129 L15 BPC-4-126
C16 PNL-SS-14 L17 BPC-4-128 L18 BPC-4-98
8.12 10.50 8.91
0.50 0.82 0.46
0.038 0.080 0.019
10.20 0.94 0.031 9.66 0.90 0.113
10.00 1.90 0.020
10.60 0.18 0.040 10.20 0.15 0.093 8.75 0.39 0.013
8.13 0.55 0.033 8.15 0.47 0.097 8.23 0.47 0.018
8.18 1.18 0.027 7.93 1.49 0.080 8.00 1.82 0.010
12.90 8.00 8.13
8.08 8.91
10.24
13.30 12.04 12.30
8.93 8.09
10.30
0.38 0.014 0.66 0.090 0.14 0.016
0.45 0.031 0.0170.010 0.51 0.034
0.0240.015 0.68 0.030 0.03 0.007
0.92 0.020 0.79 0.004 0.96 0.040
0.0020.034 0.004
0.010 0.028 0.005
0.038 0.010 0.013
0.002 0.009 0.002
0.022 0.002 0.013
0.002 0.009 0.033
0.003 0.004 0.001
0.004 0.047 0.005
0.008 0.002 0.002
1.00 1.58 1.81
0.060 0.074 0.016
1.75 0.110 0.47 0.006 1.13 0.096
1.02 0.007 1.85 0.041 1.72 0.062
1.00 0.060 1.02 0.014 1.00 0.060
0.36 0.026 1.76 0.107 1.07 0.020
1.66 0.020 0.48 0.061 1.13 0.080
0.99 0.060 0.41 0.002 1.19 0.060
0.40 0.003 0.96 0.043 0.48 0.031
1.54 0.019 0.91 0.070 0.97 0.057
U.UOU 0.102 0.083
0.002 0.033 0.087
0.111 0.001 0.065
0.086 0.004 0.070
0.001 0.028 0.085
0.011 0.078 0.001
0.070 0.002 0.020
0.001 0.092 0.002
0.095 0.089 0.019
10.1i 17.02 18.55
15.80 21.00 17.10
15.40 18.30 18.48
18.19 17.40 18.43
17.40 15.00 17.80
16.92 15.30 18.00
0.0065
0.0058
0.0274
0.0045 0.0110
<0.001
<0.001 <0.001
<0.001 <0.001 <0.001
<0.001 <0.001 <0.001
<0.001 <0.001 <0.001
<0.001 <0.001 <0.001
- <0.001 0.0092 <0.001 - <0.00 1 -
18.21 18.10 16.28
16.10 17.30 16.90
17.20 17.20 15.30
0.0093 0.0129
0.0085 0.0080 0.0058
<0.001 <0.001 <0.001
<0.001 <0.001 <0.001
0.010 <0.001 0.030
Mo 2.08
Mo 2.04 Nb 1.06 Nb 1.72
Mo 2.01
NUREG/CR-4667, Vol. 27
C1 L2 C3
L4 L5 L6
L7 L8 C9
019 120 C21b
L22C L23d L24e
125C3 L26C19 I27I21
DAN-74827 BPC-4-101 DAN- 12455
BPC-4-100 BPC-4-114 BPC-4-105
BPC-4-133 BPC-4-131 BPC-4-132
aFirst letters "C" and "L" denote commercial and laboratory heats, respectively. bcommercial-purity Type 316 SS. cHigh-purity Type 316 SS. dCommercial-purity Type 348 SS. eHigh-purity Type 348 SS.
27
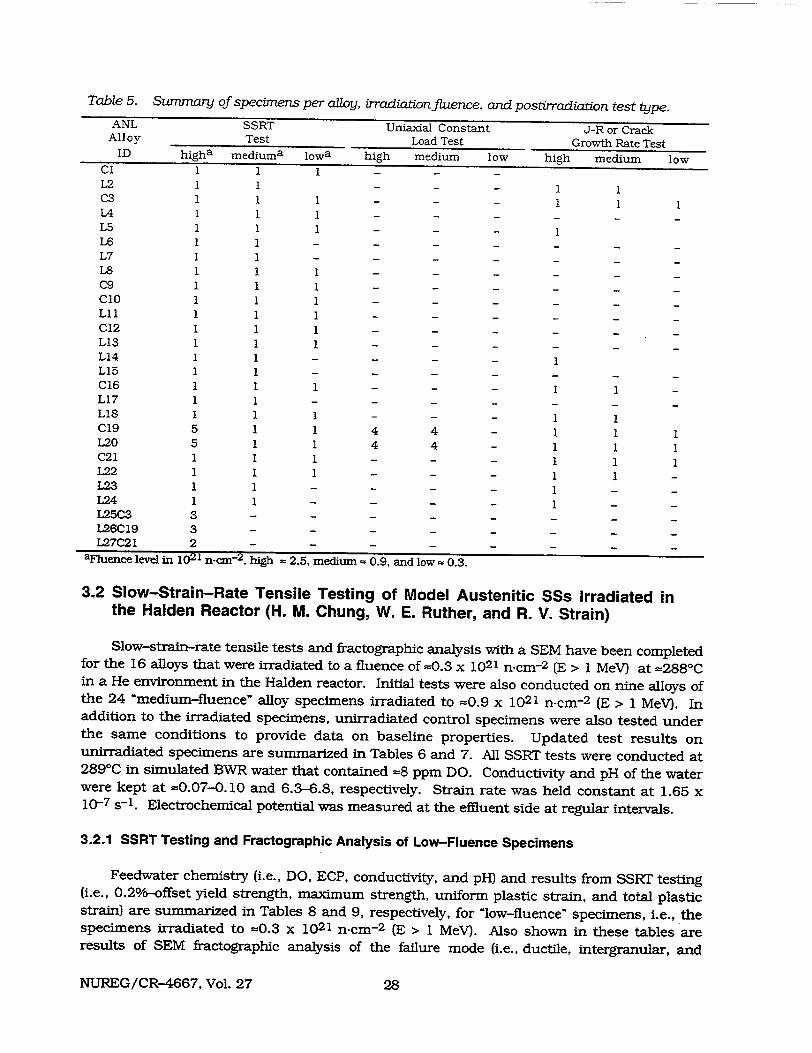
Table 5. Summary of specimens per alloy, irradiation ftuence, and postirradiation test type. ANL SSRT Uniaxial Constant J-R or Crack Alloy Test Load Test Growth Rate Test
ID higha mediuma lowa high medium low high medium low C1 1 1 1 - -
L2 I 1 - - - 1 1 C3 1 1 1 - - -1 1 1 L4 1 1 1 ...... L5 1 1 1 - - -1 L 6 1 1 ....... L 7 1 1 ....... L8 1 1 1 ...... C9 1 1 1 ...... C IO 1 1 1 ...... L ii 1 1 1 ...... C12 I 1 1 ...... L13 1 1 1 ...... L14 1 1 -... 1 L 15 1 1 -......
C16 1 1 1 - - - 1 1 L 17 1 1 -...... L18 1 1 1 - - - 1 1 C19 5 1 1 4 4 - 1 1 1 L20 5 1 1 4 4 - 1 1 1 C21 1 1 1 - - - 1 1 1 L22 1 1 1 - - - 1 1 L23 1 -.. 1 -
L24 1 -.. 1 -L25C3 3 -.......
L26C19 3 ........
L27C21 2 ........ aFluence level in 1021 ncm 2 , high 2.5, medium= 0.9, and low- 0.3.
3.2 Slow-Strain-Rate Tensile Testing of Model Austenitic SSs Irradiated in the Halden Reactor (H. M. Chung, W. E. Ruther, and R. V. Strain)
Slow-strain-rate tensile tests and fractographic analysis with a SEM have been completed for the 16 alloys that were irradiated to a fluence of --0.3 x 10²¹ n-cm-2 (E > 1 MeV) at =288'C in a He environment in the Halden reactor. Initial tests were also conducted on nine alloys of the 24 "medium-fluence" alloy specimens irradiated to =0.9 x 10²¹ n-cm- 2 (E > 1 MeV). In addition to the irradiated specimens, unirradiated control specimens were also tested under the same conditions to provide data on baseline properties. Updated test results on unirradiated specimens are summarized in Tables 6 and 7. All SSRT tests were conducted at 289*C in simulated BWR water that contained =8 ppm DO. Conductivity and pH of the water were kept at =0.07-0. 10 and 6.3-6.8, respectively. Strain rate was held constant at 1.65 x 10⁻⁷ s-1. Electrochemical potential was measured at the effluent side at regular intervals.
3.2.1 SSRT Testing and Fractographic Analysis of Low-Fluence Specimens
Feedwater chemistry (i.e., DO, ECP, conductivity, and pH) and results from SSRT testing (i.e., 0.20/o-offset yield strength, maximum strength, uniform plastic strain, and total plastic strain) are summarized in Tables 8 and 9, respectively, for "low-fluence" specimens, i.e., the specimens irradiated to =0.3 x 10²¹ n-cm- 2 (E > 1 MeV). Also shown in these tables are results of SEM fractographic analysis of the failure mode (i.e., ductile, intergranular, and
NUREG/CR-4667, Vol. 27 28
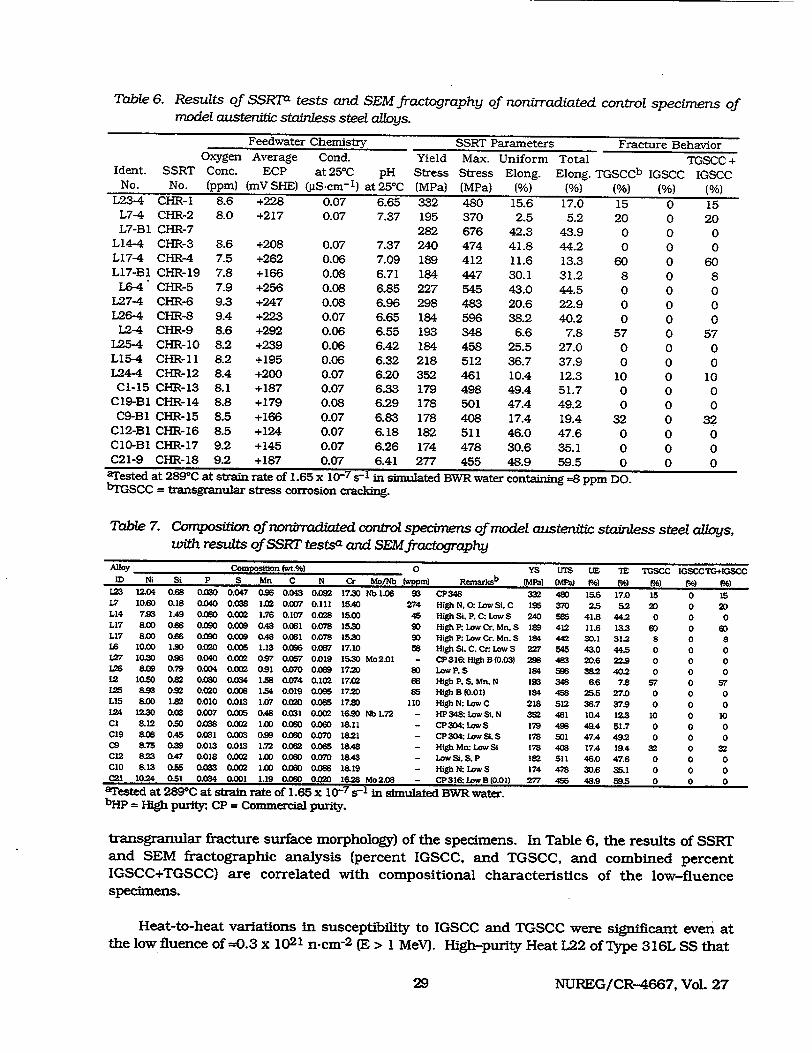
Table 6. Results of SSRTa tests and SEMfractography of nonirradiated control specimens of model austenitic stainless steel alloys.
Feedwater Chemistry SSRT Parameters Fracture Behavior Oxygen Average Cond. Yield Max. Uniform Total TGSCC +
Ident. SSRT Conc. ECP at 250C pH Stress Stress Elong. Elong. TGSCCb IGSCC IGSCC No. No. (ppm) (mVSHE) (jiS.cm- 1 ) at250C (MPa) (MPa) (%) (%) (%) (%) (%)
L23-4 CHR-1 8.6 +228 0.07 6.65 332 480 15.6 17.0 15 0 15 L7-4 CHR-2 8.0 +217 0.07 7.37 195 370 2.5 5.2 20 0 20 L7-B1 CHR-7 282 676 42.3 43.9 0 0 0
L14-4 CHR-3 8.6 +208 0.07 7.37 240 474 41.8 44.2 0 0 0 L17-4 CHR-4 7.5 +262 0.06 7.09 189 412 11.6 13.3 60 0 60 L17-Bl CHR-19 7.8 +166 0.08 6.71 184 447 30.1 31.2 8 0 8
L6-4 CHR-5 7.9 +256 0.08 6.85 227 545 43.0 44.5 0 0 0 127-4 CHR-6 9.3 +247 0.08 6.96 298 483 20.6 22.9 0 0 0 L26-4 CHR-8 9.4 +223 0.07 6.65 184 596 38.2 40.2 0 0 0 L24 CHR-9 8.6 +292 0.06 6.55 193 348 6.6 7.8 57 0 57
L25-4 CHR-10 8.2 +239 0.06 6.42 184 458 25.5 27.0 0 0 0 L15-4 CHR- 11 8.2 +195 0.06 6.32 218 512 36.7 37.9 0 0 0 L24-4 CHR-12 8.4 +200 0.07 6.20 352 461 10.4 12.3 10 0 10 CI-15 CHR-13 8.1 +187 0.07 6.33 179 498 49.4 51.7 0 0 0
C19-Bl CHR-14 8.8 +179 0.08 6.29 178 501 47.4 49.2 0 0 0 C9-BI CHR-15 8.5 +166 0.07 6.83 178 408 17.4 19.4 32 0 32
C12-Bl CHR-16 8.5 +124 0.07 6.18 182 511 46.0 47.6 0 0 0 CIO-B1 CHR-17 9.2 +145 0.07 6.26 174 478 30.6 35.1 0 0 0 C21-9 CHR-18 9.2 +187 0.07 6.41 277 455 48.9 59.5 0 0 0 aTested at 289CC at strain rate of 1.65 x 10⁻⁷ s-1 in simulated BWR water containing 8 ppm DO. bTGSCC = transgranular stress corrosion cracking.
Table 7. Composition of nonrradiated control specimens of model austenitic stainless steel alloys, with results of SSRT testsa and SEMfractography
Alloy Composition twt.%) 0 YS UTS UE -TE TOSCC 1GSCC1G+1GSCC ID Ni Si P S Mn C N Cr Mo/Nb wppm) Remarksb Mp (Mpa) (%) (%) % F M
123 12.04 0.68 0.030 0.047 0.96 0.043 0092 17.30 Nb 106 93 CP348 332 480 15.6 17.0 15 0 15 L7 10.60 0.18 0.040 0.038 1.02 007 0.111 15.40 274 High N. • Low Si. C 195 370 2.5 52 2D 0 20 L14 7.93 1.49 0.080 0.032 1.76 0.107 0.028 15.00 45 High Si. P. C: Low S 240 585 41.8 442 0 0 0 L17 8.00 0.66 0.090 0.009 0A48 0.061 0.078 1530 9D High P: Low Cr. Mn. S 189 412 11.6 13.3 60 0 60 L17 8.00 0.66 0.090 0.009 0.48 0.061 0.078 1530 90 High P. Low Cr. Mn. S 184 442 30.1 31.2 8 0 8 L. 10.00 1.90 0.020 0.005 1.13 0.096 0.087 17.10 5S High St. C. Cr. Low S 227 545 43.0 445 0 0 0 L27 10.30 0-6 0.040 O.0 0.97 0.057 0.019 1530 Mo2.01 - CP316: High 5(0.03) 298 483 20.6 22.9 0 0 0 L26 8.09 0.79 0.004 0.002 0.91 0.070 0.089 17.20 80 Low P. S 184 596 38.2 40.2 0 0 0 L2 10.50 0.8 00 0.084 1.58 0.074 0.10M 17.02 66 High P. S. Mn. N 193 348 6.6 7.8 57 0 57 L25 823 092 0.020 0.008 1.54 0.019 0.095 1720 55 High B (0.01) 184 458 25.5 27.0 0 0 0 LI5 8.00 1. 0.010 0.013 1.0 0.7 0 0.08 17.80 110 HighN:LowC 218 512 36.7 37.9 0 0 0 1.24 12.30 0.03 0.007 0.005 0.48 0.031 0.002 16.90 Nb 1.72 - HP348: Low Si. N 352 461 10.4 12.3 10 0 10 CI 8.12 0.50 0238 0.002 1.00 0.060 0.080 18.11 - CP304; LowS 179 498 49.4 51.7 0 0 0 C19 8.08 0.45 0.031 0.003 0.99 0.30 0.7 1821 - CP304:LowSi. S 178 501 47A 49.2 0 0 0 C9 8.75 0.39 0.013 0.013 1.72 0.0 0.065 18.48 - High Mn: LowSi 178 408 17.4 19.4 62 0 32 C12 823 0.47 0.018 0.00M 1.00 0206 0.070 18.43 - Low Si. S. P 18 511 46.0 47.6 0 0 0 C10 6&13 0.5 0233 0.00 1.0 0.0L 0 0.05 18.19 - High N: Low S 174 478 30.6 35.1 0 0 0 C21 10.24 0.51 0.034 0.001 1.19 0060 0.020 16.28 Mo 2.08 - CP316:LowB(0.01) 277 455 48.9 59.5 0 0 0
aTested at 289WC at strain rate of 1.65 x 10⁻⁷ s71 in simulated BWR water.
biHP = High purity; CP = Commercial purity.
transgranular fracture surface morphology) of the specimens. In Table 6, the results of SSRT and SEM fractographic analysis (percent IGSCC, and TGSCC, and combined percent IGSCC+TGSCC) are correlated with compositional characteristics of the low-fluence specimens.
Heat-to-heat variations in susceptibility to IGSCC and TGSCC were significant even at the low fluence of =0.3 x 10²¹ n-cm-2 (E > 1 MeV). High-purity Heat L22 of Type 316L SS that
NUREG/CR-4667, Vol. 2729
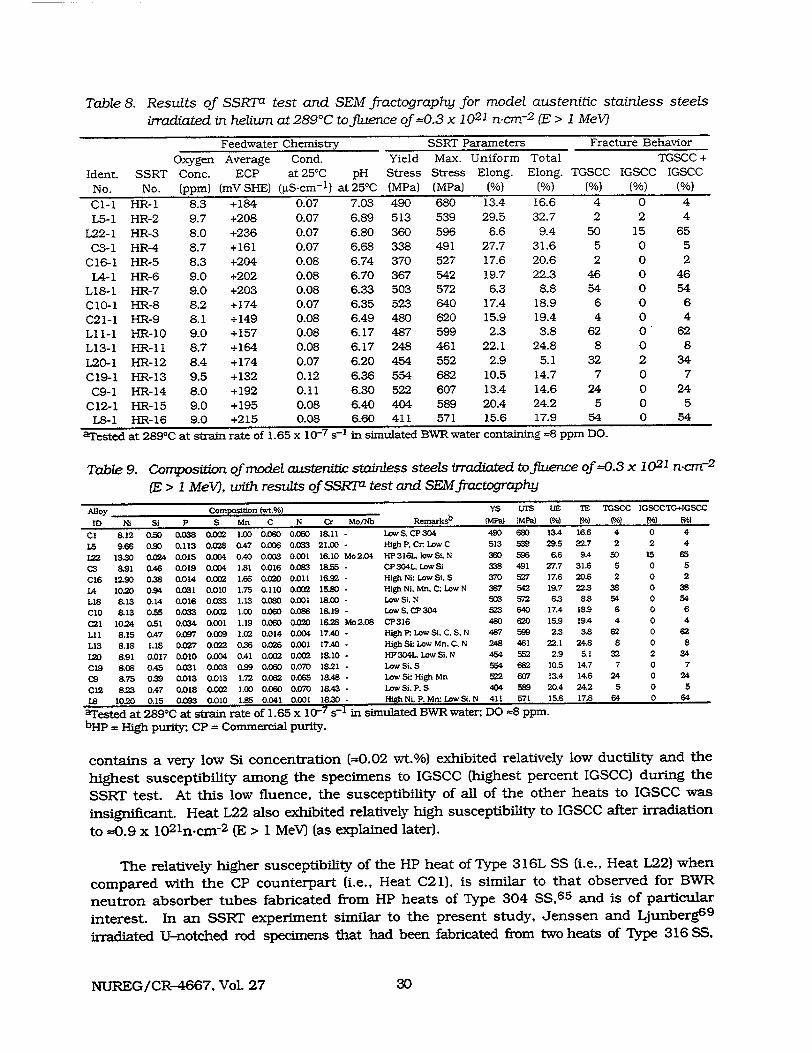
Table 8. Results of SSRTa test and SEM fractography for model austenitic stainless steels
irradiated in helium at 2890 C tofluence of =0.3 x 10²¹ n-cm-2 (E > 1 Mel)
Feedwater Chemistry SSRT Parameters Fracture Behavior
Oxygen Average Cond. Yield Max. Uniform Total TGSCC +
Ident. SSRT Conc. ECP at 25"C pH Stress Stress Elong. Elong. TGSCC IGSCC IGSCC
No. No. (ppm) (mV SHE) (pS.cm-l) at 25°C (MPa) (MPa) (%) (%) (%) (%) (%)
+184 +208 +236 +161 +204 +202 +203 +174 +149 +157 +164 +174 +132 +192 +195 +215
0.07 0.07 0.07 0.07 0.08 0.08 0.08 0.07 0.08 0.08 0.08 0.07 0.12 0.11 0.08 0.08
7.03 6.89 6.80 6.68 6.74 6.70 6.33 6.35 6.49 6.17 6.17 6.20 6.36 6.30 6.40 6.60
513 360 338 370 367 503 523 480 487 248 454 554 522 404 411
539 596 491 527 542 572 640 620 599 461 552 682 607 589 571
13.4 29.5
6.6 27.7 17.6 19.7 6.3
17.4 15.9 2.3
22.1 2.9
10.5 13.4 20.4 15.6
32.7 9.4
31.6 20.6 22.3
8.8 18.9 19.4 3.8
24.8 5.1
14.7 14.6 24.2 17.9
2 2 4 50 15 65
5 0 5 2 0 2
46 0 46 54 0 54
6 0 6 4 0 4
62 0 62 8 0 8
32 2 34 7 0 7
24 0 24 5 0 5
54 0 54
aTested at 2890C at strain rate of 1.65 x 10⁻⁷ s71 in simulated BWR water containing =8 ppm DO.
Table 9. Composition of model austenitic stainless steels irradiated tofluence of =0.3 x 10²¹ n-cm-2
(E > 1 MeV), with results of SSRTa test and SEM fractography
Alloy Composition (wt.%) Ys UTS uE Ti rGscc IGSCCTr-+IGSCC
ID Ni Si P S Mn C N Cr Mo/Nb Remarksb (MPa) M ) ) (%) 64) W 4)
C1 8&12 0.50 0.038 0.002 1.00 0.060 0.060 18.11- Low S. CP304 490 680 13.4 16.6 4 0 4
1.5 9.66 0.90 0.113 0.028 0.47 0.006 0.033 21.00 - High P. Cr. Low C 513 539 29.5 32.7 2 2 4
=2 13.30 0.024 0.015 0.004 0.40 0.003 0.001 16.10 Mo 2.04 HP316L IowSi. N 360 596 6.6 9.4 50 15 65
C3 8.91 0.46 0.19 0.004 1.81 0.016 0.063 18.55 CP304L LowSi 338 491 27.7 31.6 5 0 5
C16 12.90 0.8 0.014 0.002 1.66 0.020 0.011 16. - High Ni: Low Si. S 370 527 17.6 20.6 2 0 2
IA 10.20 0.94 0.031 0.010 1.75 0.110 0.002 15.80 - High Ni. Mn. C: Low N 367 542 19.7 22.3 38 0 38
L18 8.13 0.14 0.016 0.033 1.13 0.080 0.001 18.00 - Low Si. N 503 572 6.3 86 54 0 54
CIO 8.13 0.55 0.033 0.002 1.00 0.060 0.086 18.19 - Low S. CP 304 523 640 17.4 18.9 6 0 6
C21 10.24 0.51 0.034 0.001 1.19 0.060 0.020 16.28 Mo2.08 CP 316 480 620 15.9 19.4 4 0 4
LII 8.15 0.47 0.097 0.009 1.03 0.014 0.004 17.40 - High P. Low Si. C. S.N 487 599 2.3 36 62 0 62
L13 8.18 1.18 0.027 0.02 0.36 0.026 0.001 17.40 - High Si: Low Mn, C, N 248 461 22.1 24. 8 0 8
120 8.91 0.017 0,010 0.004 0.41 0.002 0.002 18.10 - HI1304L Low Si. N 454 552 2.9 5.1 32 2 34
C19 808 0.45 0.031 0.003 0.99 0.060 0.070 18.21 - Low Si. S 564 682 10.5 14.7 7 0 7
C9 8.75 039 0.013 0.013 1.72 0.062 0.65 18.48 - Low Si: High Mn 5=2 607 13.4 14.6 24 0 24
C12 8.23 0.47 0.018 0.002 1.00 0.060 0.070 18.43 - Low Si. P. S 404 589 20.4 24.2 5 0 5
LB 10.20 0.15 0.093 0.010 1.85 0.041 0.001 18.30- HighNi.P. Mn;LowSi.N 411 571 15.6 176 64 0 64
aTested at 2890C at strain rate of 1.65 x 1 0-7 S71 in simulated BWR water; DO =8 ppm. blP = High purity: CP = Commercial purity.
contains a very low Si concentration (=0.02 wt.%) exhibited relatively low ductility and the
highest susceptibility among the specimens to IGSCC (highest percent IGSCC) during the
SSRT test. At this low fluence, the susceptibility of all of the other heats to IGSCC was
insignificant. Heat L22 also exhibited relatively high susceptibility to IGSCC after irradiation
to --0.9 x 10² 1 n-cm-2 (E > 1 MeV) (as explained later).
The relatively higher susceptibility of the HP heat of Type 316L SS (i.e., Heat L22) when
compared with the CP counterpart (i.e., Heat C21), is similar to that observed for BWR
neutron absorber tubes fabricated from HP heats of Type 304 SS,65 and is of particular
interest. In an SSRT experiment similar to the present study, Jenssen and Ljunberg6 9
irradiated U-notched rod specimens that had been fabricated from two heats of Type 316 SS,
NUREG/CR-4667, Vol. 27
CI-1 L5-1
L22-1 C3-1
C16-1 1A-1
L18-1 C10-1 C21-1 L11-1 L13-1 L20-1 C19-1 C9-1
C12-1 Ls-1
HR-1 HR-2 HR-3 HR-4 HR-5 HR-6 HR-7 HR-8 HR-9 HR-10 HR-11 HR-12 HR-13 HR-14 HR-15 HR-16
8.3 9.7 8.0 8.7 8.3 9.0 9.0 8.2 8.1 9.0 8.7 8.4 9.5 8.0 9.0 9.0
30
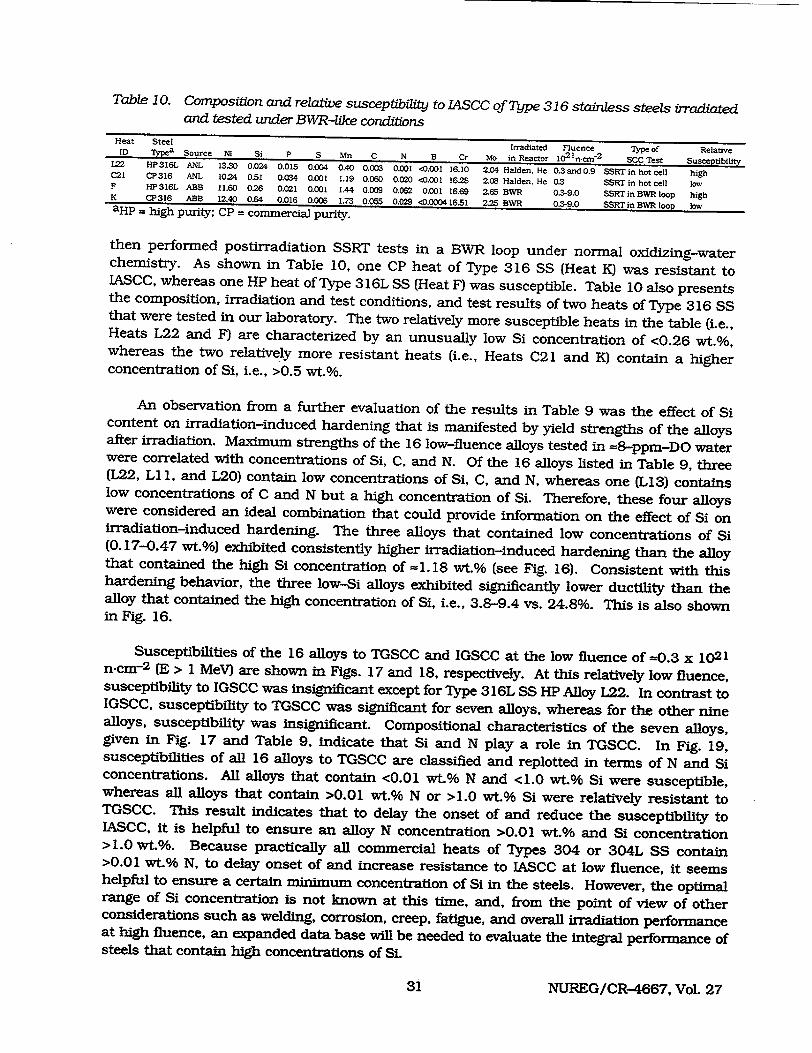
Table 10. Composition and relative susceptibility to IASCC of Type 316 stainless steels irradiated and tested under BWR--like conditions
Heat Steel Irradiated Fluence Type of Relative ID IYpea Source Ni Si P S Mn C N B Cr Mo in Reactor 1021n-cm-
2 SCC Test Susceptibility 122 HP316L ANL 13.30 0.024 0.015 0.004 0.40 0.003 0.001 <0.001 16.10 2.04 Halden. He 0.3 and 0.9 SSRT in hot cell high C21 CP316 ANL 10.24 0.51 0.034 0.001 1.19 0.060 0.020 <0.001 16.28 2.08 Halden. He 0.3 SSRT in hot cell low F HP316L ABB 11.60 0.26 0.021 0.001 1.44 0.009 0.062 0.001 16.69 2.65 BWR 0.3-9.0 SSRTinBWR loop high K CP316 ABB 12.40 0.64 0.016 0.006 1.73 0.055 0.029 <0.000416.51 2.25 BWR 03-9.0 SSRT in BWR loop low aHP = high purity; CP = commercial purity.
then performed postirradiation SSRT tests in a BVWR loop under normal oxidizing-water chemistry. As shown in Table 10, one CP heat of Type 316 SS (Heat K) was resistant to IASCC, whereas one HP heat of Type 316L SS (Heat F) was susceptible. Table 10 also presents the composition, irradiation and test conditions, and test results of two heats of Type 316 SS that were tested in our laboratory. The two relatively more susceptible heats in the table (i.e., Heats L22 and F) are characterized by an unusually low Si concentration of <0.26 wt.%, whereas the two relatively more resistant heats (i.e., Heats C21 and K) contain a higher concentration of Si, i.e., >0.5 wt.%.
An observation from a further evaluation of the results in Table 9 was the effect of Si content on irradiation-induced hardening that is manifested by yield strengths of the alloys after irradiation. Maximum strengths of the 16 low-fluence alloys tested in =8-ppm-DO water were correlated with concentrations of Si, C, and N. Of the 16 alloys listed in Table 9, three (L22, L1i, and L20) contain low concentrations of Si, C, and N, whereas one (L13) contains low concentrations of C and N but a high concentration of Si. Therefore, these four alloys were considered an ideal combination that could provide information on the effect of Si on irradiation-induced hardening. The three alloys that contained low concentrations of Si (0.17-0.47 wt.%) exhibited consistently higher irradiation-induced hardening than the alloy that contained the high Si concentration of =1.18 wt.% (see Fig. 16). Consistent with this hardening behavior, the three low-Si alloys exhibited significantly lower ductility than the alloy that contained the high concentration of Si, i.e., 3.8-9.4 vs. 24.8%. This is also shown in Fig. 16.
Susceptibilities of the 16 alloys to TGSCC and IGSCC at the low fluence of --0.3 x 10²¹ n-cm- 2 (E > 1 MeV) are shown in Figs. 17 and 18, respectively. At this relatively low fluence, susceptibility to IGSCC was insignificant except for Type 316L SS HP Alloy L22. In contrast to IGSCC, susceptibility to TGSCC was significant for seven alloys, whereas for the other nine alloys, susceptibility was insignificant. Compositional characteristics of the seven alloys, given in Fig. 17 and Table 9, indicate that Si and N play a role in TGSCC. In Fig. 19, susceptibilities of all 16 alloys to TGSCC are classified and replotted in terms of N and Si concentrations. All alloys that contain <0.01 wt.% N and <1.0 wt.% Si were susceptible, whereas all alloys that contain >0.01 wt.% N or >1.0 wt.% Si were relatively resistant to TGSCC. This result indicates that to delay the onset of and reduce the susceptibility to IASCC, it is helpful to ensure an alloy N concentration >0.01 wt.% and Si concentration >1.0 wt.%. Because practically all commercial heats of Types 304 or 304L SS contain >0.01 wt.% N, to delay onset of and increase resistance to IASCC at low fluence, it seems helpful to ensure a certain minimum concentration of Si in the steels. However, the optimal range of Si concentration is not known at this time, and, from the point of view of other considerations such as welding, corrosion, creep, fatigue, and overall irradiation performance at high fluence, an expanded data base will be needed to evaluate the integral performance of steels that contain high concentrations of Si.
NUREG/CR-4667, Vol. 2731
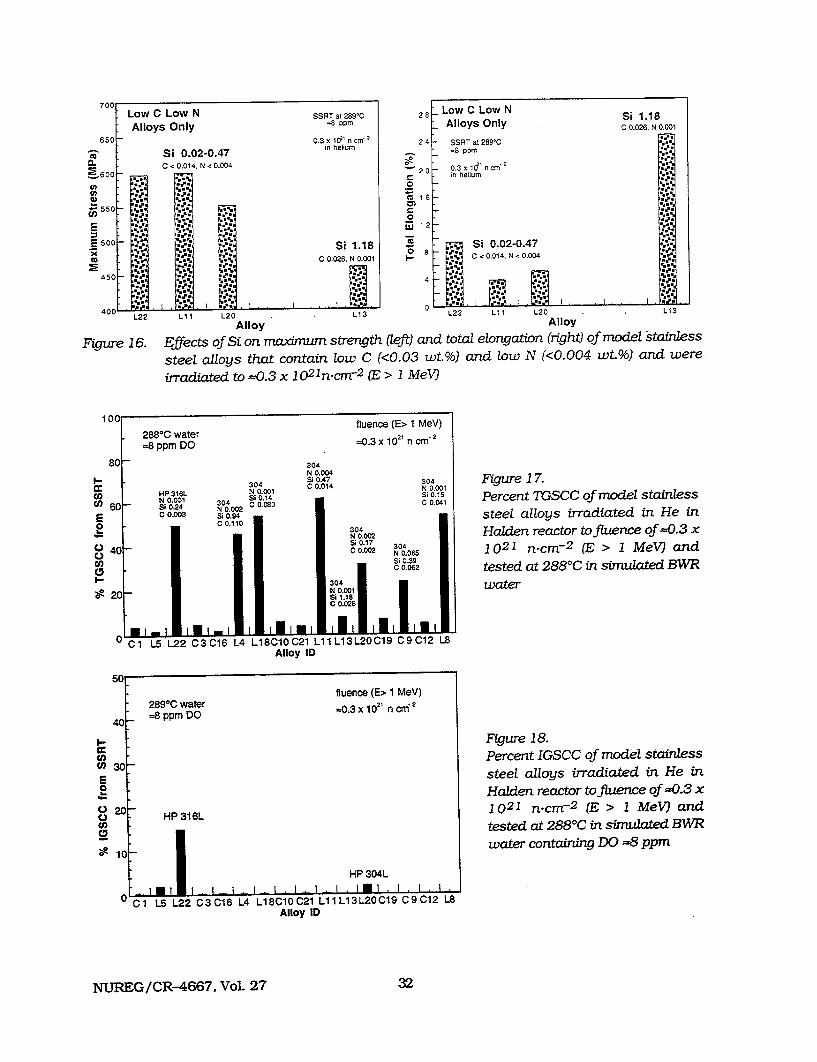
28
24
20
0
,' 12
I-
L13L22 L1 L20 L13 .... -. Alloy Alloy
Figure 16. Effects of Si on maximum strength (left) and total elongation (right) of model stainless
steel alloys that contain low C (<0.03 wt.%) and low N (<0.004 wt.%) and were
irradiated to =0.3 x 10² 1 n-cm-r2 (E > 1 MeV)
N 0.004 I.Si 0.47 304 Figure 17.
304 C 0.014 N 0.001 HPn1- N 0.001 0.001 Si 0.14 s, .'s Percent TGSCC of model stainless
0-00 1 30 C 0.080 C 0.041
6] i0.001 30N S 0. 14-in He2
E C 0.03 Si0. .9 steel alloys irradiated in He in
O ' C 0.110 304 Halden reactor tofluence of=0.3 x SN 0.002
Si 0.17 304 Si 0 c 3o.oo 1021 n-cm- 2 (E > I MeV) and 40-0000 N 0.065
Ci) Si 0.39 C, 00.082 tested at 2880 C in simulated BWR
304L ae -*20 N 0.001wae Si 1.18 C 0.026
0 L5 L22 C3C16 L4 L18C10C21 Ll1L13L20C19 C9C12 L8 Alloy ID
50 fluence (E> 1 MeV)
2890C water =0.3x 10²¹ crn"2
4 =8 ppm DO 40
I. Figure 18.
30 Percent IGSCC of model stainless
S 3steel alloys irradiated in He in 0 Halden reactor tojluence of =0.3 x
o 20: 1021 n'cm- 2 (E > 1 MeV) and O HP 316L
C5 tested at 2880C in simulate BWVR - 10water containing DO --8 ppm 1lO
HP 304L
V IC ll 2C3 1 L4 • _l8COC l .11L1 L .O7 I , t I.I
u C1 L.5 L22 C3C16 L4 L18C10C21 1-11-131-20C19 ID; Alloy iD)
NUREG/CR-4667, Vol. 27 32
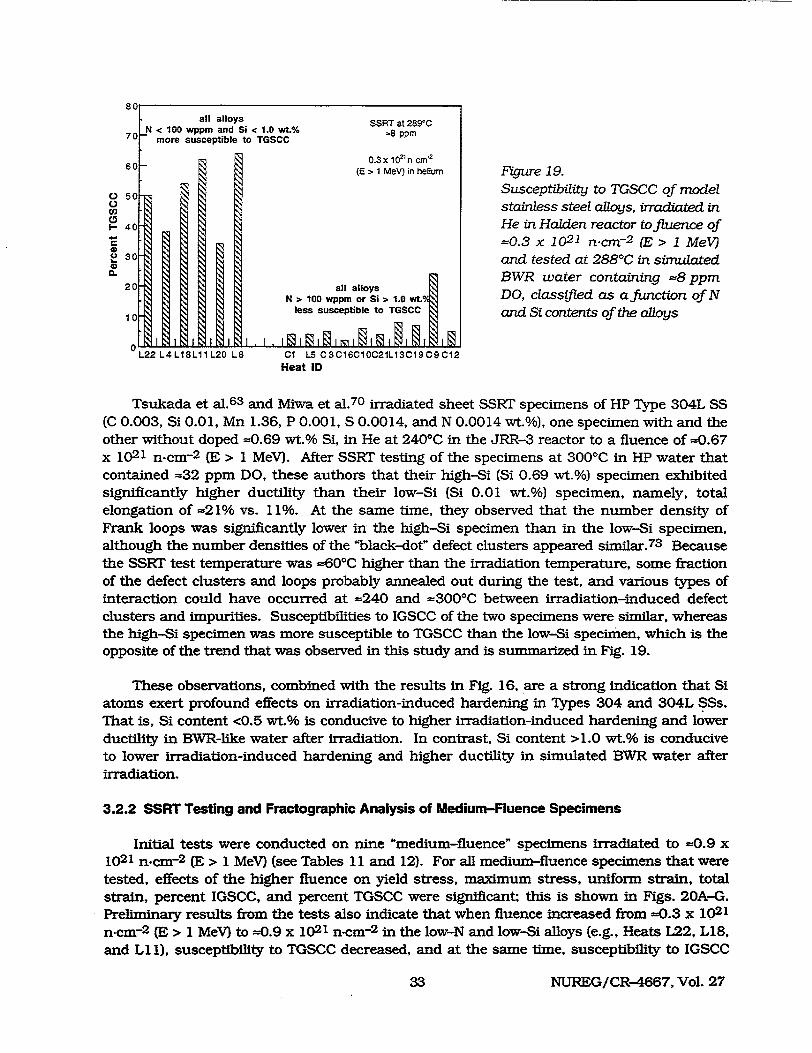
t> - (E > 1 MeV) in helium FIgure 19.
so Susceptibility to TGSCC of model Ca stainless steel alloys, irradiated in
-40 He in Halden reactor tofluence of
"- =0.3 x 10²¹ n-cm-2 (E > 1 MeV) a 30 and tested at 2880 C in simulated
2a. a BWR water containing =8 ppm 2 0 all alloys
N > 100 wppm or Si > 1.0 w. DO, classified as a function of N 10 less susceptible to TGSCC and Si contents of the alloys
0 1 1 L22L4L18L11L20 L8 C1 L5 C3C16C10C21L13C19C9C12
Heat ID
Tsukada et al. 6 3 and Miwa et al.7 0 irradiated sheet SSRT specimens of HP Type 304L SS (C 0.003, Si 0.01, Mn 1.36, P 0.001, S 0.0014, and N 0.0014 wt.%), one specimen with and the other without doped =0.69 wt.% Si, in He at 2400C in the JRR-3 reactor to a fluence of =0.67 x 10²¹ n-cm- 2 (E > 1 MeV). After SSRT testing of the specimens at 300'C in HP water that contained =32 ppm DO, these authors that their high-Si (Si 0.69 wt.%) specimen exhibited significantly higher ductility than their low-Si (Si 0.01 wt.%) specimen, namely, total elongation of =21% vs. 11%. At the same time, they observed that the number density of Frank loops was significantly lower in the high-Si specimen than in the low-Si specimen, although the number densities of the "black-dot" defect clusters appeared similar.7 3 Because the SSRT test temperature was =601C higher than the irradiation temperature, some fraction of the defect clusters and loops probably annealed out during the test, and various types of interaction could have occurred at =240 and =3000C between irradiation-induced defect clusters and impurities. Susceptibilities to IGSCC of the two specimens were similar, whereas the high-Si specimen was more susceptible to TGSCC than the low-Si specimen, which is the opposite of the trend that was observed in this study and is summarized in Fig. 19.
These observations, combined with the results in Fig. 16, are a strong indication that Si atoms exert profound effects on irradiation-induced hardening in Types 304 and 304L SSs. That is, Si content <0.5 wt.% is conducive to higher irradiation-induced hardening and lower ductility in BWR-like water after irradiation. In contrast, Si content >1.0 wt.% is conducive to lower irradiation-induced hardening and higher ductility in simulated BWR water after irradiation.
3.2.2 SSRT Testing and Fractographic Analysis of Medium-Fluence Specimens
Initial tests were conducted on nine "medium-fluence" specimens irradiated to =0.9 x 10²¹ n-cm-2 (E > 1 MeV) (see Tables 11 and 12). For all medium-fluence specimens that were tested, effects of the higher fluence on yield stress, maximum stress, uniform strain, total strain, percent IGSCC, and percent TGSCC were significant; this is shown in Figs. 20A-G. Preliminary results from the tests also indicate that when fluence increased from =0.3 x 10²¹ n-cm- 2 (E > 1 MeV) to --0.9 x 10²¹ n-cm-2 in the low-N and low-Si alloys (e.g., Heats L22, L18, and Li 1), susceptibility to TGSCC decreased, and at the same time, susceptibility to IGSCC
NUREG/CR-4667, Vol. 2733
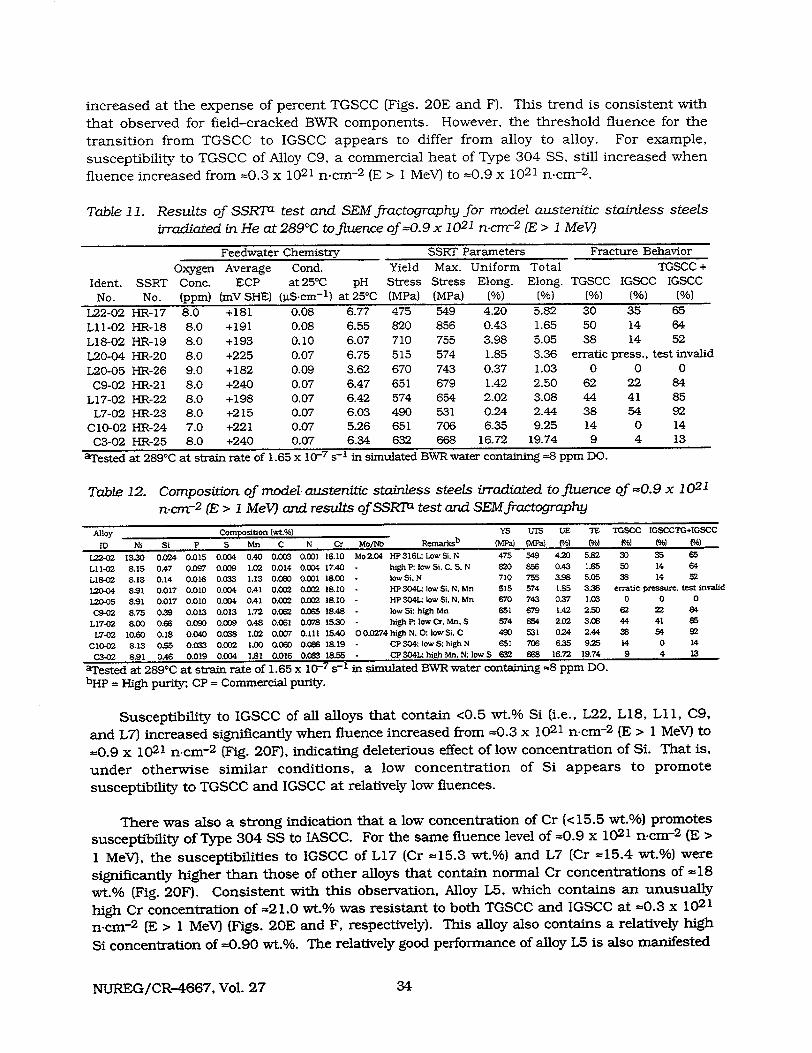
increased at the expense of percent TGSCC (Figs. 20E and F). This trend is consistent with
that observed for field-cracked BWR components. However, the threshold fluence for the
transition from TGSCC to IGSCC appears to differ from alloy to alloy. For example,
susceptibility to TGSCC of Alloy C9, a commercial heat of Type 304 SS, still increased when
fluence increased from =0.3 x 10²¹ n-cm- 2 (E > 1 MeV) to =0.9 x 10²¹ n-cm- 2 .
Table 11. Results of SSRTa test and SEM fractography for model austenitic stainless steels
irradiated in He at 289°C tofluence of =0.9 x 10²¹ ncmr- 2 (E > 1 MeV)
Feedwater Chemistry SSRT Parameters Fracture Behavior
Oxygen Average Cond. Yield Max. Uniform Total TGSCC +
Ident. SSRT Conc. ECP at 250C pH Stress Stress Elong. Elong. TGSCC IGSCC IGSCC
No. No. (ppm) (mV SHE) (j±S.cm- 1 ) at 250C (MPa) (MPa) (%) (%) (%) (%) (%)
L22-02 HR-17
LI 1-02 HR-18 L18-02 HR-19
L20-04 HR-20 L20-05 HR-26
C9-02 HR-21 L17-02 HR-22
L7-02 HR-23 C10-02 HR-24 C3-02 HR-25
8.0 8.0 8.0 8.0 9.0 8.0 8.0 8.0 7.0 8.0
+181 +191 +193 +225 +182 +240 +198 +215 +221 +240
0.08 0.08 0.10 0.07 0.09 0.07 0.07 0.07 0.07 0.07
6.77 6.55 6.07 6.75 3.62 6.47 6.42 6.03 5.26 6.34
475 820 710 515 670 651 574 490 651 632
549 856 755 574 743 679 654 531 706 668
4.20 0.43 3.98 1.85 0.37 1.42 2.02 0.24 6.35
16.72
5.82 1.65 5.05 3.36 1.03 2.50 3.08 2.44 9.25
19.74
30 35 65 50 14 64 38 14 52
erratic press., test invalid 0 0 0
62 22 84 44 41 85 38 54 92 14 0 14 9 4 13
aTested at 289°C at strain rate of 1.65 x 10⁻⁷ s-1 in simulated BWR water containing =8 ppm DO.
Table 12. Composition of model- austenitic stainless steels irradiated tofluence of =0.9 x 10²¹ n cm-2 (E > I MeV) and results of SSRTa test and SEMfractography
Alloy Composition (wt.%) YS UTS UE rE TGSCC IGSCCTG+IGSCC
ID Ni Si P S Mn c N Cr Mo/Nb Rernarksb Ma) MN N N4 (/ ) N /)
L22-02 13,30 0.024 0.015 0.004 0.40 0.00 0.001 16.10 Mo2.04 HP316L: Low SI. N 475 549 4.20 5.62 3D 35 65
Lli-02 8.15 0.47 0.097 0.009 1.02 0.014 0.004 17.40 high Rh low Si, C. S. N =0 856 0.43 1.65 so 14 64
L18-02 8.13 0.14 0.016 0.033 1.13 0.080 0.001 1800 low Si. N 710 755 3468 5.05 38 14 62
L-20-04 821 0.017 0.010 0.004 0A1 0.002 0.002 18.10 lHP 304L low Si. N. Mn 515 574 1.85 3.36 erratic pressure. test invalid
L20.05 8.91 0.017 0.010 0.094 0.41 0.002 0.002 18.10 HP 304L, low SI. N, Mn 670 743 0.37 1.05 0 0 0
C9-02 8.75 0.39 0.013 0.013 1.72 0.062 0.065 18.48 low Si: high Mn 651 679 1.42 2.50 62 22 84
L17-02 8.00 0.66 0.09D 0.009 0.48 0.061 0.078 15-0 - high P low Cr. Mn. S 574 E54 2.02 3.08 44 41 85
L7-02 10.60 0.18 0.040 0.038 1.02 0.007 0.111 15.40 00.0274high N. 0: lowSi, C 490 531 0.24 2.44 38 54 92
CI0-02 8.13 0.55 0.033 0.002 1.00 0.060 0.086 18.19 - CP 304: low S: high N 651 706 6.35 9.25 14 0 14
C3-02 8-91 0.46 0.019 0.004 1.81 0.016 0.083 18M5 - CP 304L: high Mn. N: low S 632 838 16.72 19.74 9 4 13
aTested at 2890C at strain rate of 1.65 x 10⁻⁷ s-I in simulated BWR water containing =8 ppm DO. bHp = High purity; CP = Commercial purity.
Susceptibility to IGSCC of all alloys that contain <0.5 wt.% Si (i.e., L22, L18, LI i, C9,
and L7) increased significantly when fluence increased from --0.3 x 10²¹ n-cm-2 (E > 1 MeV) to
=0.9 x 10²¹ n-cm-2 (Fig. 20F), indicating deleterious effect of low concentration of Si. That is,
under otherwise similar conditions, a low concentration of Si appears to promote
susceptibility to TGSCC and IGSCC at relatively low fluences.
There was also a strong indication that a low concentration of Cr (<15.5 wt.%) promotes
susceptibility of Type 304 SS to IASCC. For the same fluence level of =0.9 x 10²¹ n-cm- 2 (E >
1 MeV), the susceptibilities to IGSCC of L17 (Cr =15.3 wt.%) and L7 (Cr =15.4 wt.%) were
significantly higher than those of other alloys that contain normal Cr concentrations of =18
wt.% (Fig. 20F). Consistent with this observation, Alloy L5, which contains an unusually
high Cr concentration of =21.0 wt.% was resistant to both TGSCC and IGSCC at =0.3 x 10²¹
n-cm- 2 (E > 1 MeV) (Figs. 20E and F, respectively). This alloy also contains a relatively high
Si concentration of =0.90 wt.%. The relatively good performance of alloy L5 is also manifested
NUREG/CR-4667, Vol. 27 34
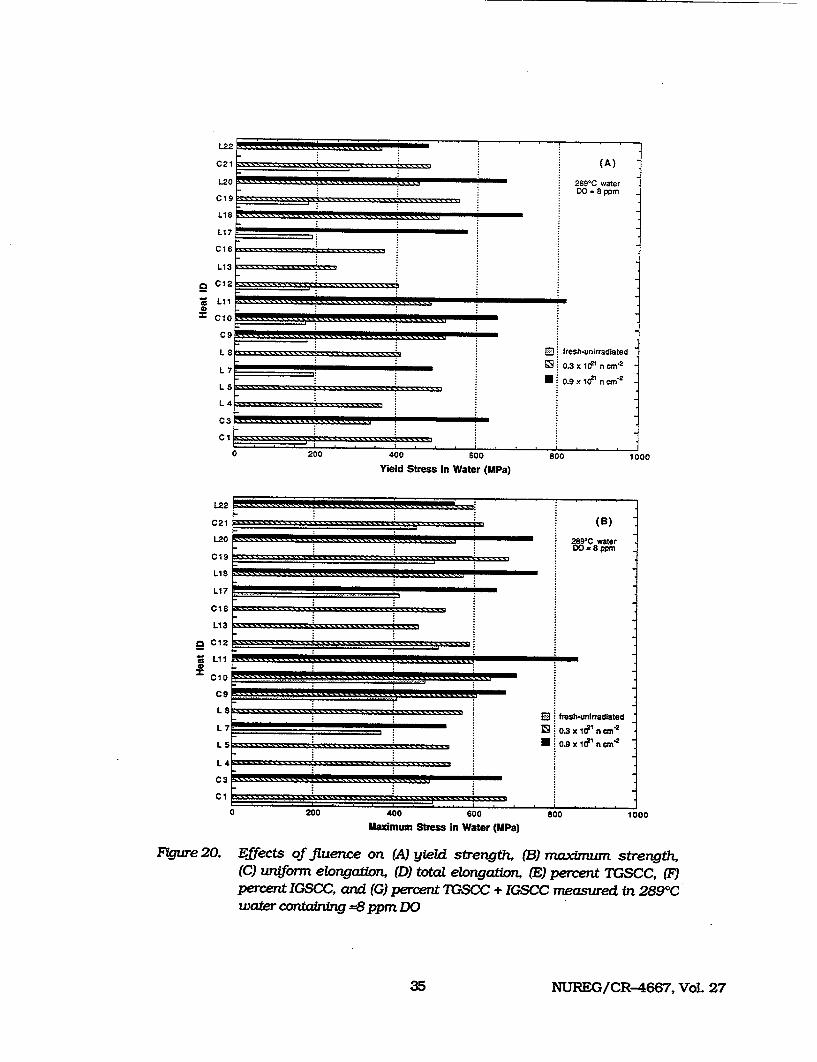
C21 --- (A)
L20. 289C water DO 8 ppm
L19 ------.. .. .. .. . ....... . . . .
LIB L17 ,
C 16 .. . . . . . . ." . . . . . . .
L13 .. . . . . . . .'. . LI?
8 ... fresh-unirradiated
93: 0.3 x1&U n cm2
L 5 ............ _"_............ 0. ........
L 4
C I _ _ _ _ _ _ _ _ _ _ _ -------
200 400 Soo Soo 10 Yield Stress in Water (MPa)
L22
C21
L20
C1 9 s--- . .-- .. -- . .
no PIL1i ... .. .. .. . . . .. . . .. .. . . ... .. .. .. . -
L13
C12!
(B) 289 C water DO 8 ppm
G I fesh-unirfadiated
I 0.3 x Id" ncm"n
* o. x id" n cm,"7
4- ....... .. ....... . .......
________ Em
.7
0 1 0 ....... ... . . .... .. . . . ........
L
L
L
L
C3 Cl
zoo 400 600
Maximum Stress in Water (MPa)
C9m
800
FIgure 20. Effects of fluence on (A) yield strength. (B) maximum strength, (C) uniform elongation, (D) total elongation, (E) percent TGSCC, M percent IGSCC, and (G) percent TGSCC + IGSCC measured in 2890C water containing =8 ppm DO
35 NUREG/CR-4667, Vol. 27
0
U 0
'C'0
SL1
"M
1000
;IG ' U> e... .. ...... ........ ........ 1.. . . .. . .
I I I I
3
1
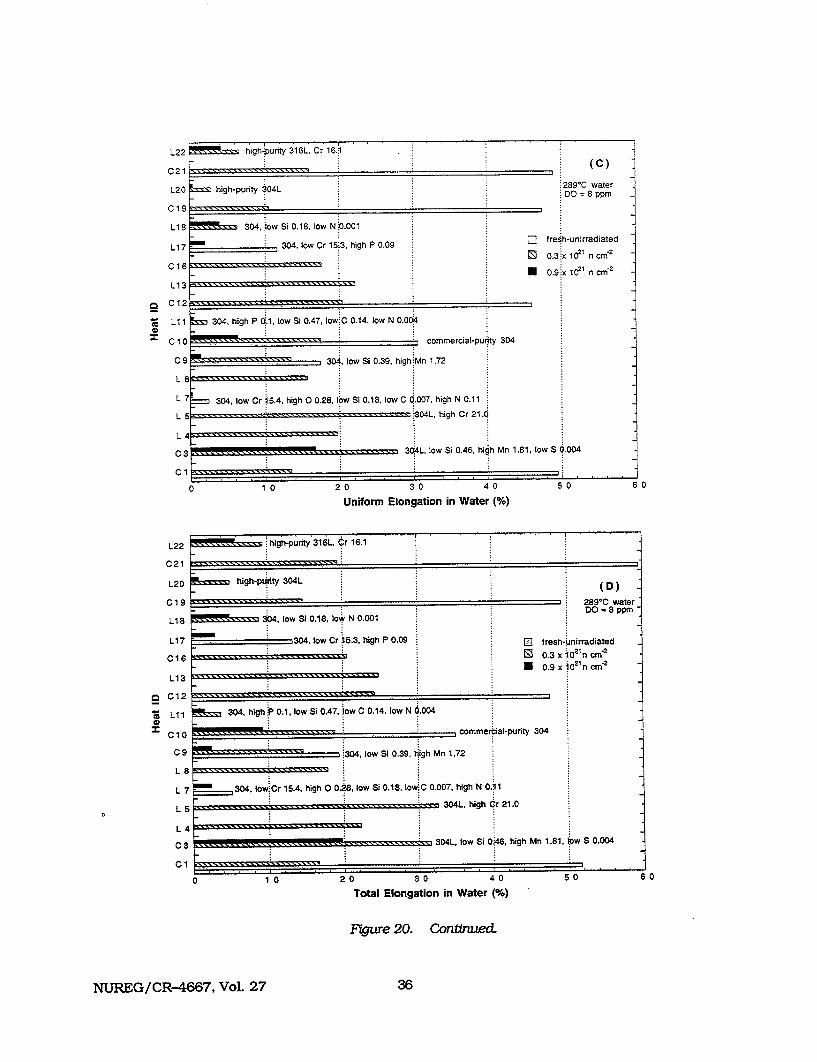
L22 high-punty 316L, Cr 16.1 I ^.. : .
L20 high-purity 3'04L
C19 - ...........
304, ,iow Si 0.18, low N ý.00l
_ _ _ 304, low Cr 15'3, high P 0.0971 fmre,
0.3
0.9
(C)
:289°C water DO = 8 pprn
h-unirradiated
"x Ie' n crm"2
"x 1021 n crn"2
LI1 304, high P 0ý1, low Si 0.47, lowEC 0.14, low N 0,034
C0 , .commercial-punty 304
C 9 ",- :-'-•-z- • '-- -- -s s S, 3 0 4 . lo w S i 0 .3 9 , h ig h M n 1 ,7 2
L 7 304, low Cr j5.4, high 0 0.28, lbw Si 0.18, low C 0.007 high N 0.11
L 5 . 304L, high Cr 21.0
L 4
CSI.. 30.4L, low Si 0.46, high Mn 1.81, low S 0.004
0
4)
z
0
'I 4)
0 10 2 0 30 40 Total Elongation in Water (%)
Figu-e 20. ConfinuecL
NUREG/CR-4667, Vol. 27
L18
L17
C16
L13
0 10 20 30 40 50 60
Uniform Elongation in Water (%)
high-purity 316L, 6r 16.1
high-p ity 304 , L (D)
I 289*C water 0 IDO 8 pprn
.34. low Si 0.18, to, N 0.001
.304, low Cr 15.3, high P 0.09 E fresh-Unirradiated
0 0 Xi021
n m2
1 304, high 0.1, low Si 0.47, low C 0.14. low N 0.004
0 commercial-purity 304
9 ---------.. . . . . -.3 0 4 , lo w S i 0 .3 9 I .ig h M n 1 ,7 2
7 304, lowCr l5.4, high O 08. low Si 0.18, lowiC 0.007, high N 0.11
5----s 304L, high Cr 21.0
4
3 304L, low Si 046, high Mn 1.81, Ipw S 0.004 1
50
C
L22
C21
L20
C19
L18
L17
C16
L13
C12
Lii
Ci0
c9
L
L
L
L
C:
c
36
so 6 0
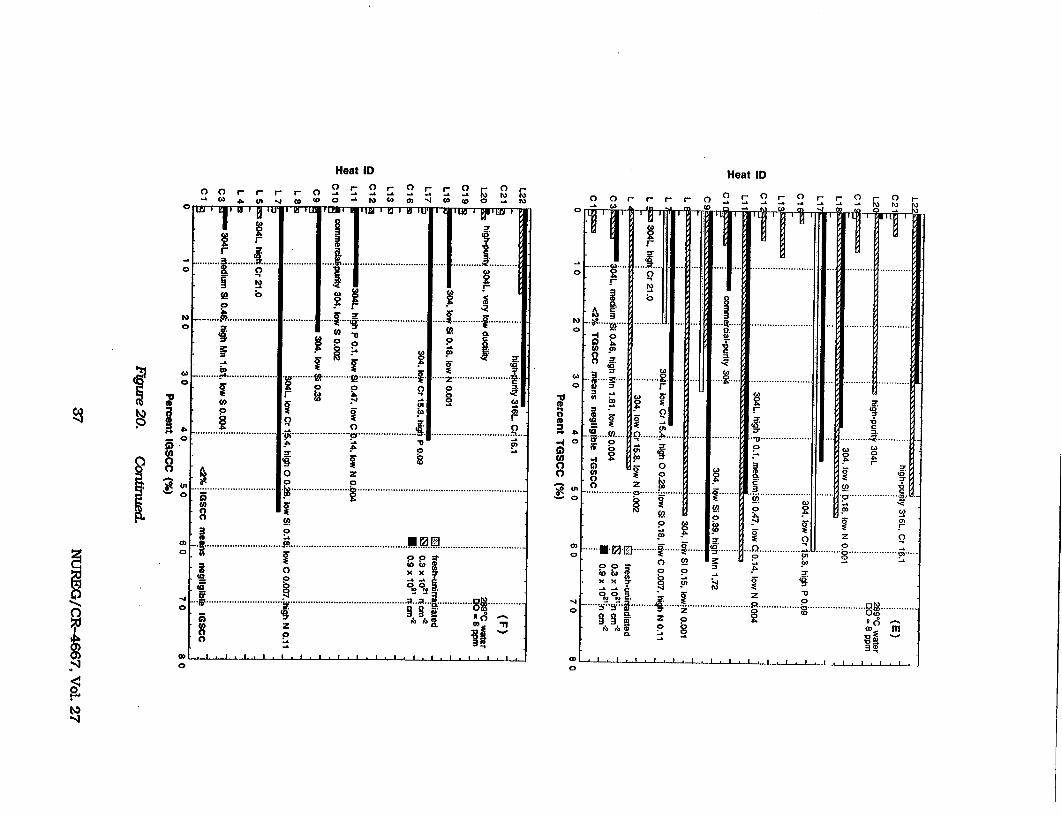
Heat ID
0 r -r r Cr 0 0 r 0 r " 0 F 0
tal owIll o l ILE It" 3 Iu I -r191 D
9~ .... ......... ........
00C
p 5.
.............-...... * .. I....... ............
oS 0, 0
F E!
00
.. p
-10
o
0 . ................................. m r u . .................................
0 x x QD 0
o Z ....... .......................1. .I .C . . ....... . 1.......
(p N 0 (p
-4 0 0 0 C,
0
Heat ID
0
9 *5 (b 0
00 - 0 0� 0 C) 0 �.Cn I - 0
5.
(A
a
p
0"0
N)
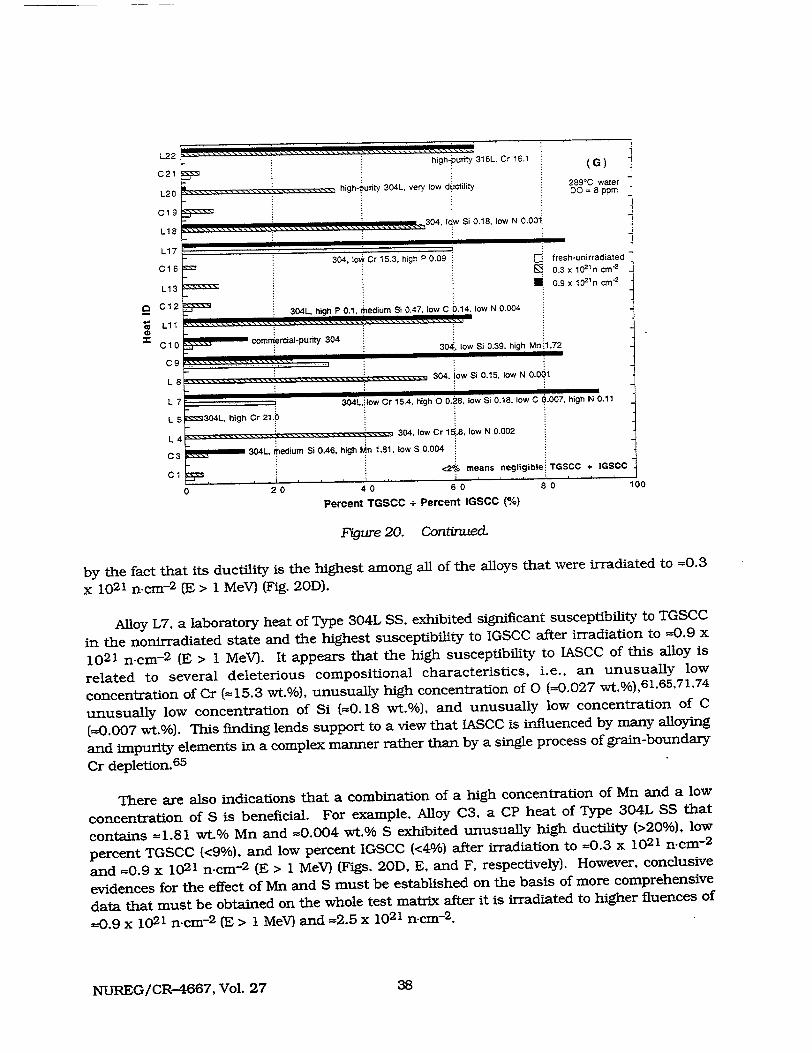
L22 .... ---C21 -high-purity 316L. Cr 16.1 (G)
C21 29Cwtr
L20 high- urity 304L, very low du~ctility 289C water L2 DO =8 ppm
L19 304,1•w Si 0.18, low N 0.001 L17 . . . ....
"..
-1304 o Cr 15.3. high P 0.09 • fresh-urirradiated 4 C 16 . . 0.3 x 10² n cm "
2 _
L13 . 0.9x10
2 ncc
2 -2
o C 2 304L, high P 0.1, Medium Si 0.47. low C 0.14. low N 0.004
C Llln-e-ca-p rt 304.. . . .. .•. . . .. . . . .. . C)
:: commercial-purity 304 304., low Si 0.39, high Mn 1,72
Cs L 8 . 304. low Si 0.15, low N 0.001
L 7 , 304L.ilow Cr 15.4. high 0 0.28, low Si 0.18, low C 0.007, high N 0.11
L 5 =304L, high Cr 21.0
- : 304, low Cr 19.8, low N 0.002
C3 304L, Medium Si 0.46, high Mn 1.81, low S 0.004
C1 . <2% means negligible TGSCC + IGSCC
20 40 60 80 100
Percent TGSCC + Percent IGSCC (%)
Figure 20. ContinueCL
by the fact that its ductility is the highest among all of the alloys that were irradiated to =0.3
x 1021 n-cm- 2 (E > 1 MeV) (Fig. 20D).
Alloy L7, a laboratory heat of Type 304L SS, exhibited significant susceptibility to TGSCC
in the nonirradiated state and the highest susceptibility to IGSCC after irradiation to --0.9 x
1021 n-cm- 2 (E > 1 MeV). It appears that the high susceptibility to IASCC of this alloy is
related to several deleterious compositional characteristics, i.e., an unusually low
concentration of Cr (=15.3 wt.%), unusually high concentration of 0 (=0.027 wt%),6 1 ' 6 5 "7 1 "7 4
unusually low concentration of Si (=0.18 wt.%), and unusually low concentration of C
(--0.007 wt.%). This finding lends support to a view that IASCC is influenced by many alloying
and impurity elements in a complex manner rather than by a single process of grain-boundary
Cr depletion.6 5
There are also indications that a combination of a high concentration of Mn and a low
concentration of S is beneficial. For example, Alloy C3, a CP heat of Type 304L SS that
contains =1.81 wt% Mn and =0.004 wt.% S exhibited unusually high ductility (>20%), low
percent TGSCC (<9%), and low percent 1GSCC (<4%) after irradiation to =0.3 x 10²¹ n-cM- 2
and =0.9 x 10²¹ n-cm-2 (E > 1 MeV) (Figs. 20D, E, and F, respectively). However, conclusive
evidences for the effect of Mn and S must be established on the basis of more comprehensive
data that must be obtained on the whole test matrix after it is irradiated to higher fluences of
-0.9 x 10²¹ n'cm-2 (E > 1 MeV) and =2.5 x 10²¹ n-cm- 2 .
38NUREG/CR-4667, Vol. 27
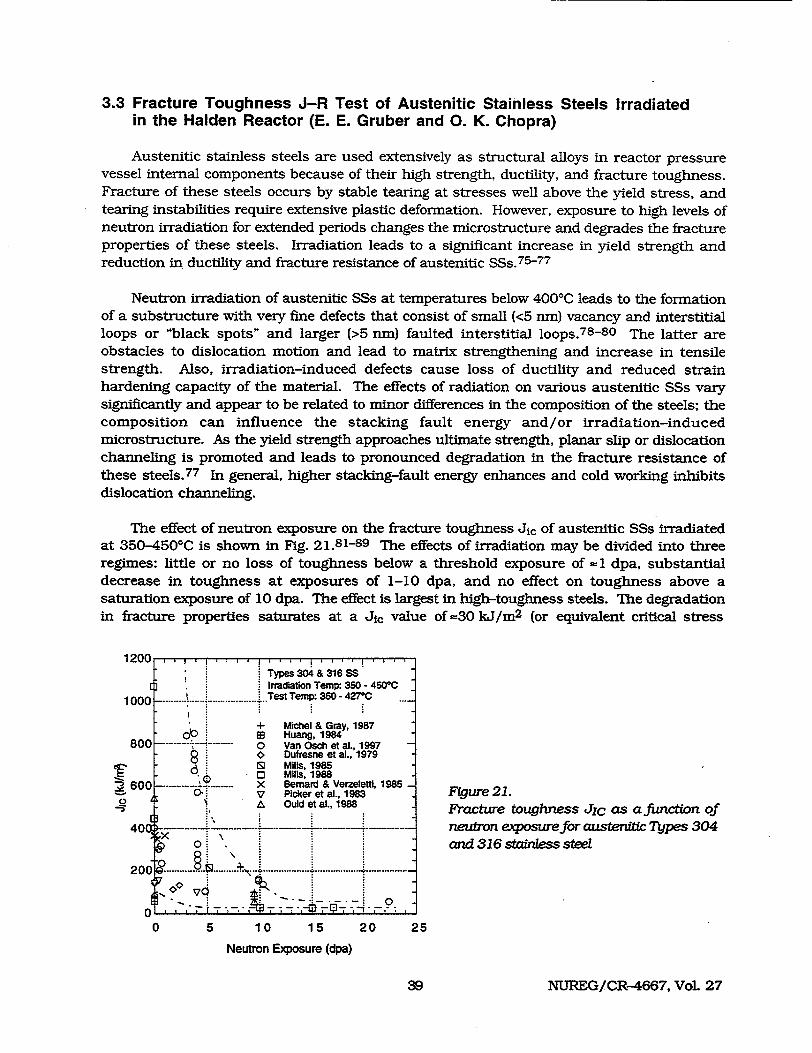
3.3 Fracture Toughness J-R Test of Austenitic Stainless Steels Irradiated in the Halden Reactor (E. E. Gruber and 0. K. Chopra)
Austenitic stainless steels are used extensively as structural alloys in reactor pressure vessel internal components because of their high strength, ductility, and fracture toughness. Fracture of these steels occurs by stable tearing at stresses well above the yield stress, and tearing instabilities require extensive plastic deformation. However, exposure to high levels of neutron irradiation for extended periods changes the microstructure and degrades the fracture properties of these steels. Irradiation leads to a significant increase in yield strength and reduction in ductility and fracture resistance of austenitic SSs. 7 5- 7 7
Neutron irradiation of austenitic SSs at temperatures below 4000C leads to the formation of a substructure with very fine defects that consist of small (<5 nm) vacancy and interstitial loops or "black spots" and larger (>5 nm) faulted interstitial loops. 7 8 - 8 0 The latter are obstacles to dislocation motion and lead to matrix strengthening and increase in tensile strength. Also, irradiation-induced defects cause loss of ductility and reduced strain hardening capacity of the material. The effects of radiation on various austenitic SSs vary significantly and appear to be related to minor differences in the composition of the steels; the composition can influence the stacking fault energy and/or irradiation-induced microstructure. As the yield strength approaches ultimate strength, planar slip or dislocation channeling is promoted and leads to pronounced degradation in the fracture resistance of these steels. 7 7 In general, higher stacking-fault energy enhances and cold working inhibits dislocation channeling.
The effect of neutron exposure on the fracture toughness dic of austenitic SSs irradiated at 350-4500C is shown in Fig. 21.81-89 The effects of irradiation may be divided into three regimes: little or no loss of toughness below a threshold exposure of =1 dpa, substantial decrease in toughness at exposures of 1-10 dpa, and no effect on toughness above a saturation exposure of 10 dpa. The effect is largest in high-toughness steels. The degradation in fracture properties saturates at a Jic value of =30 kJ/m 2 (or equivalent critical stress
1200 , , . . . . . . ! . .
, Types 304 & 316 SS O Irradiation Temp: 350 - 450(C
1000............... Test Temp: 350 - 427C .
+ Michel & Gray, 1987 O.p ES Huang, 1984
800 ........... 0. Van Osch et al., 1997 $ O Dufresne et al., 1979 SMIls, 1985 6 Mills, 1988
600 X--- . Bernard & Verzeletti, 1985 Fure21. V Picker et al., 1983 o C ., Ouldetal.,1988
et 1, racture toughness Jc as a function of
40 ---- ***-- ....... ....... neutron exposure for austenitic Types 304 0 " and 316 stainless steel
20 .---- - ......
00
0 5 10 15 20 25
Neutron Exposure (dpa)
NUREG/CR-4667, Vol. 2739
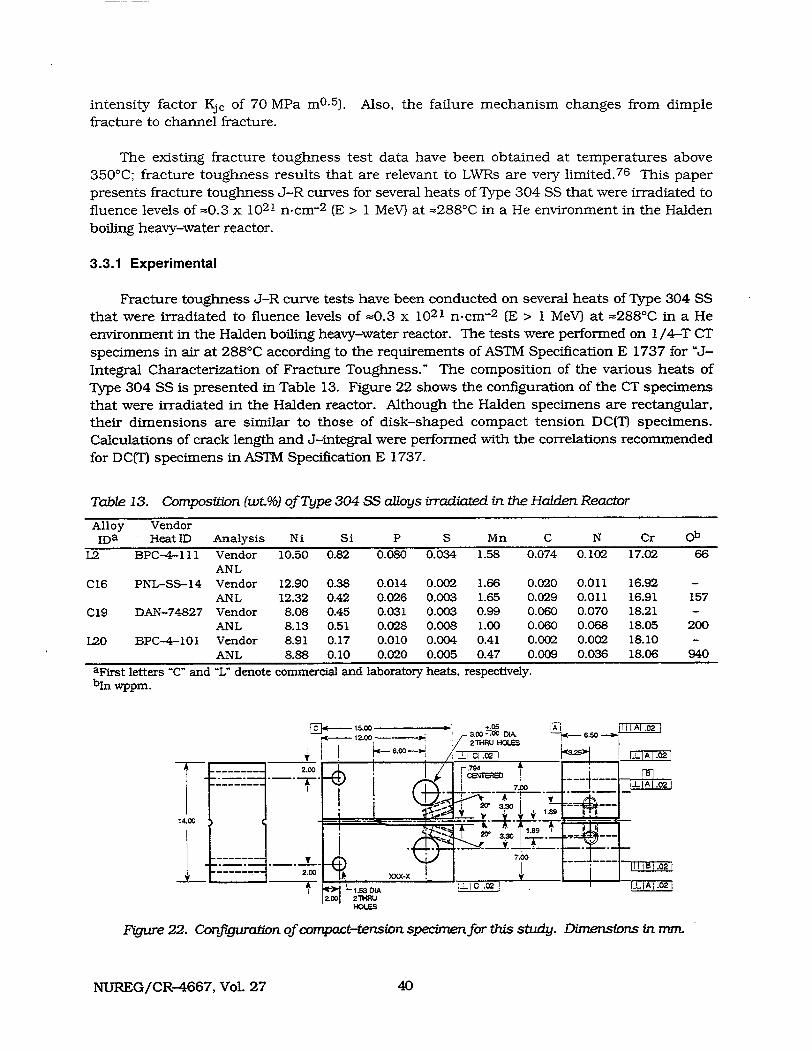
intensity factor Kjc of 70 MPa mo- 5 ). Also, the failure mechanism changes from dimple
fracture to channel fracture.
The existing fracture toughness test data have been obtained at temperatures above
350'C; fracture toughness results that are relevant to LWRs are very limited.7 6 This paper
presents fracture toughness J-R curves for several heats of Type 304 SS that were irradiated to
fluence levels of =0.3 x 10²¹ n-cm- 2 (E > 1 MeVJ at =2881C in a He environment in the Halden boiling heavy-water reactor.
3.3.1 Experimental
Fracture toughness J-R curve tests have been conducted on several heats of Type 304 SS that were irradiated to fluence levels of =0.3 x 10²¹ n-cm-2 (E > 1 MeV) at =288°C in a He
environment in the Halden boiling heavy-water reactor. The tests were performed on 1/4-T CT specimens in air at 2880 C according to the requirements of ASTM Specification E 1737 for "J
Integral Characterization of Fracture Toughness." The composition of the various heats of Type 304 SS is presented in Table 13. Figure 22 shows the configuration of the CT specimens
that were irradiated in the Halden reactor. Although the Halden specimens are rectangular, their dimensions are similar to those of disk-shaped compact tension DC(T) specimens. Calculations of crack length and J-integral were performed with the correlations recommended for DC(T) specimens in ASTM Specification E 1737.
Table 13. Composition (wt.%) of Type 304 SS alloys irradiated in the Halden Reactor
Alloy Vendor IDa Heat ID Analysis N i Si P S Mn C N Cr Ob
L2 BPC-4-111 Vendor 10.50 0.82 0.080 0.034 1.58 0.074 0.102 17.02 66 ANL
C16 PNL-SS-14 Vendor 12.90 0.38 0.014 0.002 1.66 0.020 0.011 16.92 ANL 12.32 0.42 0.026 0.003 1.65 0.029 0.011 16.91 157
C19 DAN-74827 Vendor 8.08 0.45 0.031 0.003 0.99 0.060 0.070 18.21
ANL 8.13 0.51 0.028 0.008 1.00 0.060 0.068 18.05 200 L20 BPC-4-101 Vendor 8.91 0.17 0.010 0.004 0.41 0.002 0.002 18.10
ANL 8.88 0.10 0.020 0.005 0.47 0.009 0.036 18.06 940 aFirst letters "C" and "L" denote commercial and laboratory heats, respectively. bIn wppm.
Figure 22. Configuration of compact-tension specimen for this study. Dimensions in nrm
NUREG/CR-4667, Vol. 27 40
The fracture toughness test facility is designed for in-cell testing, with the hydraulic actuator, test train, furnace, and other required equipment mounted on top of a portable, wheeled cart that can be easily rolled into the cell. The detailed description of the test facility and procedures have been presented elsewhere. 90 Specimen extension is monitored and controlled outside of the high-temperature zone. The displacement of load points (center of the loading pins) is determined by subtracting the machine compliance from the measured extension.
The fatigue precracked specimens were loaded at a constant extension rate and the tests were interrupted periodically to determine the crack length. The specimen was held at constant extension to measure crack length by both the DC potential drop and elastic unloading compliance techniques. For most steels, load relaxation occurs during the hold period or unloading, which causes a time-dependent nonlinearity in the unloading curve. Consequently, before unloading, the specimen was held for -- min to allow load relaxation.
The final crack size was marked by heat tinting and/or by fatigue cycling at room temperature. The specimens were then fractured and the initial (i.e., fatigue precrack) and final (test) crack lengths of both halves of the fractured specimen were measured optically. The crack lengths were determined by the 9/8 averaging technique, i.e., the two near-surface measurements were averaged and the resultant value was averaged with the remaining seven measurements.
Several fracture toughness J-R curve tests were conducted at room temperature and 288°C on two heats of thermally aged CF-8M cast SS and on a 50% cold-worked Type 316NG SS to develop correlations for estimating crack lengths by the two techniques and to validate the test procedure. For the room-temperature tests, actual displacement of load points was measured optically and compared with the estimated loadline displacement. The measured and estimated values of loadline displacement were in very good agreement (Gruber and Chopra, 1998); for loadline displacements up to 2 mm, the error in the estimated values was <0.02 mm. The J-integral was calculated from the load-vs.-loadline displacement curves according to the correlations for DC(T) specimens in ASTM Specification E 1737.
The following correlation, obtained from the best-fit of the experimental data, was used to determine crack lengths by the unloading compliance method.
ai/W = 1.2011- 7.1572ux + 16.874u 2 - 13.527u3' (13)
where 1
U -/2 + 1 ] (14)
Bf =B-(B-BN) 2 /B, (15a)
Ee= E / (I - u2), (15b)
W is the specimen width, B is the specimen thickness, BN is the net specimen thickness, E is the elastic modulus, v is Poisson's ratio, and C0 is the specimen elastic compliance corrected
NUREG/CR-4667, Vol. 2741
for rotation of the crack centerline. The effective elastic modulus Eef was adjusted with the
measured initial crack length ai, i.e., Eef was determined from Eqs. 13 and 14 by using the
measured fatigue precrack length ai and the corresponding corrected specimen elastic
compliance Cci.
The following correlation, obtained from the best-fit of the experimental data for
normalized crack length and normalized DC potential, was used to determine crack lengths by
the DC potential method.
a--= 0.2 8 8 8 7 U--0.5//3 , (16) W IU~ (/
where W is the specimen width, and U and Uo are the current and initial potentials.
Equation 16 is comparable to the ASTM E 1737 correlation for a CT specimen with current
inputs at the W/4 position and DC potential lead connections at the W/3 position.
The DC potential data were corrected for the effects of plasticity on the measured
potential, i.e., large crack-tip plasticity can increase measured potentials due to resistivity
increases without crack extension. As per ASTM E 1737, the change in potential before crack
initiation was ignored and the remainder of the potential change was used to establish the J
R curve. A plot of normalized potential vs. loadline displacement generally remains linear
until the onset of crack extension. For all data within the linear portion of the curve, crack
extension was calculated from the blunting-line relationship Aa = J/(4of). For high-strain
hardening materials, e.g., austenitic SSs, a slope that is four times the flow stress (4af)
represents the blunting line better than a slope of 2af, as defined in ASTM E 1737.77
Unlike the elastic unloading compliance measurements, which were adjusted only with
the measured initial crack length, crack length measurements obtained by the DC potential
drop technique were adjusted with both the initial and final crack lengths. The two-point
pinning method was used to correct the measured potentials from the test data. The corrected
normalized potentials NP_ are expressed in terms of the measured normalized potentials NP
(or U/Uo in Eq. 16) by the relationship
NP = NP_- P (17) P2 - PI
The variables P1 and P 2 are solutions of the expressions
= NPi - P (18a)
P2 -P 1
and
NFf = NPf - P, (18b) P2-PI
where NPi and Nff are normalized potentials that correspond to initial and final crack
lengths determined from Eq. 16, and NPi and NPf are the measured values.
NUREG/CR-4667, Vol. 27 42
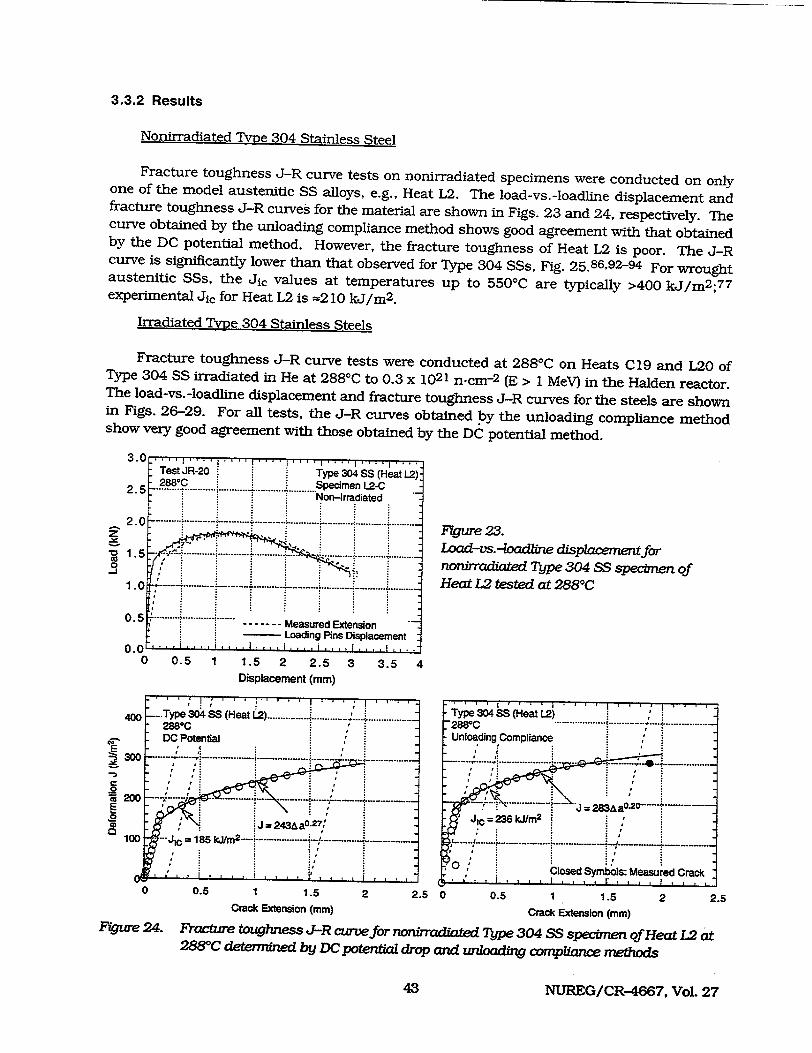
3.3.2 Results
Nonirradiated Type 304 Stainless Steel
Fracture toughness J-R curve tests on nonirradiated specimens were conducted on only one of the model austenitic SS alloys, e.g., Heat L2. The load-vs.-loadline displacement and fracture toughness J-R curves for the material are shown in Figs. 23 and 24, respectively. The curve obtained by the unloading compliance method shows good agreement with that obtained by the DC potential method. However, the fracture toughness of Heat L2 is poor. The J-R curve is significantly lower than that observed for Type 304 SSs, Fig. 25.86,92-94 For wrought austenitic SSs, the Jic values at temperatures up to 5500C are typically >400 kJ/m2 ;77 experimental Jic for Heat L2 is -210 kJ/m 2 .
Irradiated Type 304 Stainless Steels
Fracture toughness J-R curve tests were conducted at 2880C on Heats C19 and L20 of Type 304 SS irradiated in He at 2880C to 0.3 x 10²¹ n-cm-2 (E > 1 MeV) in the Halden reactor. The load-vs.-loadline displacement and fracture toughness J-R curves for the steels are shown in Figs. 26-29. For all tests, the J-R curves obtained by the unloading compliance method show very good agreement with those obtained by the DC potential method.
3 .0 . . .I . . .; .I ' * .' . . ..7 1.. . I . . Test JR-20 Type 304 SS (Heat L2): 288WC Specimen L2-C 2 .5I .......... -..=........... ............. ............ L........... N n Ir dae
Non-irradiated 2 .0 ........... i..... ...... ............. ............ ........... ... .. ................. ....... z 0 " 1 .0 ......... ........ . .......... -J
1 0.
0 .5 .. ........ ............. ........ Measured Extension Loading Pins Displacement
0 0.5 1 1.5 2 2.5 3 3.5 4 Displacement (mm)
Figure 23. Load-vs.-loadline displacement for nonfrradiated Type 304 SS specimen of Heat L2 tested at 288oc
-....Type 304SS. (H t L.2 ................ a .......... ... 2880C
FDC Potential
J 24S:aO.2 #
0 0.5 1 1.5
Crack Extension (mm)2 2.5 0 0.5 1 1.5 2 2.5
Crack Extension (ram)
FVue 24. Fracrtue toughness J-R curve for nonirradiated Type 304 SS specimen of Heat L2 at 288WC determined by DC potential drop and unloading compliance methods
43NUREG/CR-4667, Vol. 27
400
-)300
E200
100
I I .I ....
4 .................
............
43
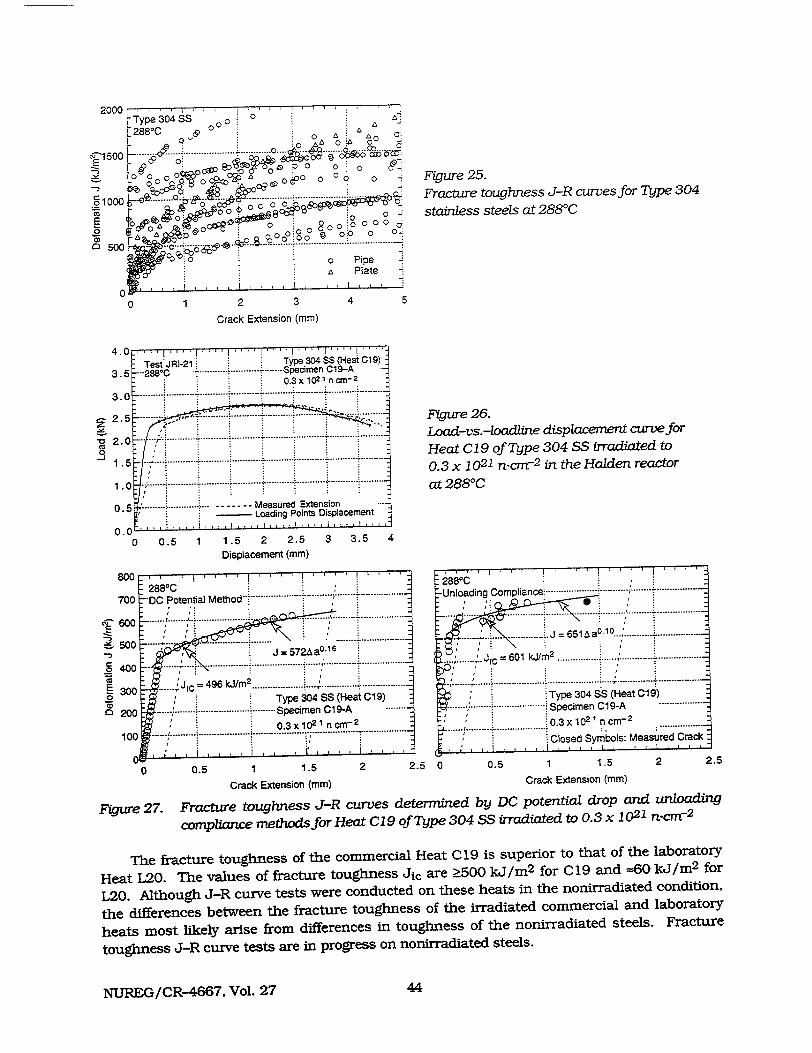
0 1 2 3 4 5
Crack Extension (mm)
4.0 :Tst" JRI-21 i i Ty•pe 304 SS (Heat C19)
. .......... ...........1 ........ Specimen C19-A 3.5 • i :: :: .3 x 1021 n =r-2
3.5 . 288*C2
" 3 .0 --..... ............... ........... ........... .......... ............. ........... ..".........
o 1 5 .L .."........ L ....... -;......... ................•-........... ?..... ...
2 0 .. .... i........... ........... ........... i ........... ........... ! ........... --......... S.......• ........i..... .. ...... .......... ...........
0.5 ...... ............. - -- -- Measured Extension Loading Points Displacement
0 .0 .. .. . . . .
0 0.5 1 1.5 2 2.5 3 3.5 4
Displacement (mm)
800 8288*C
300 ..... ~i 4 i6.'J'/-40o .~ ~................. .. . .... ........... i- .......... .................
Typ o0d HetC9 ,oo • ----/- ... .... !................... ..... ...... "• i " • ................. !
0 0O.5 1 1 n5 2 2
Crack Extension (mam)
Figure 25. Fracture toughness J-R curves for Type 304
stainless steels at 288'C
Figure 26.
Load-vs.-loadline displacement curve for
Heat C19 of Type 304 SS irradiated to
0.3 x 10²¹ n.cm-2 in the Halden reactor
at 2880 C
2880C Unloading Compliance! ................ .............. ........ .................
C 601 ....... ............ .................
Type 304 SýS (Heat C1 9)
----- ................. specimen C1 9-A ,0.3 x 10 , I n cm
IClosed Symbols: Measured Crack
5 0 0.5 1 1.5 2 2.5
Crack Extension (mm)
Figure 27. Fracture toughness J-R curves determined by DC potential drop and unloading
compliance methods for Heat C19 of Type 304 SS irradiated to 0.3 x 10²¹ n-cm-2
The fracture toughness of the commercial Heat C19 is superior to that of the laboratory
Heat L20. The values of fracture toughness Jic are 2500 kJ/m 2 for C19 and =60 kJ/m 2 for
L20. Although J-R curve tests were conducted on these heats in the nonirradiated condition,
the differences between the fracture toughness of the irradiated commercial and laboratory
heats most likely arise from differences in toughness of the nonirradiated steels. Fracture
toughness J-R curve tests are in progress on nonirradiated steels.
44NUREG/CR-4667, Vol. 27
.5
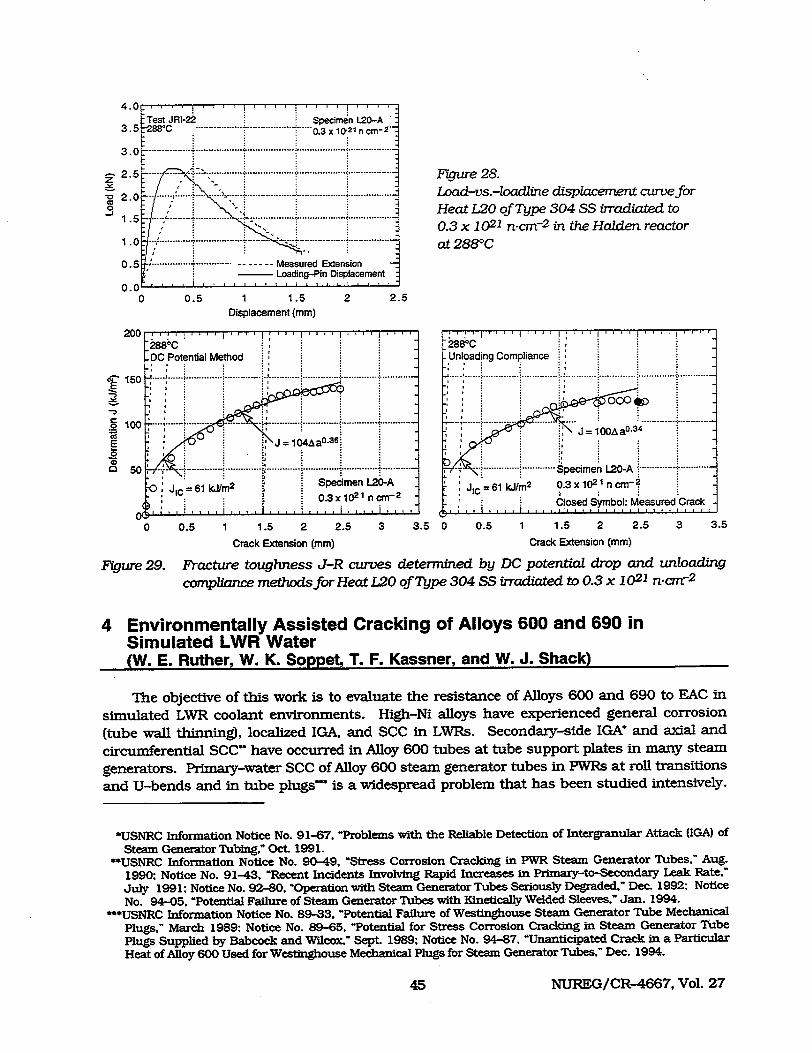
3 .0 ................. .................. ................... i. ............ ... i.... .. .. ........ -.
. .......... ................................... Load-vs.-loodline displacement curve for
W .0 ...... .. ................. ................... i.................. ~ d v .l a ln i p a e e tc r e o 0 Heat L20 of Type 304 SS irradiated to
0.3 x 10²¹ n-cr~r2 in the Halden reactor 1 . ............ ................. 1.0. .............. at 288°C
0.5 ...... . ............. - Measured Extension 0- Loading-Pin Displacement
0 0.5 1 1.5 2 2.5
Displacement (mm)
2 0 0 . . .1 . . . i . . .- : ' ' . . . . . . . .. .I . . i . . : , i . . . . i . .
288•C 2880C DC Potential Method Unloading Compliance
150~~~~~~~ ......... ........ .............................. .............. i.............. %.. ............ .............. ............... .............
00
..0. ..... .. ........................ ............. ......................
........ .. i"............ . ' .... :.... ........ . '............. ...........
S..... ..... .... ..... .... .......... .p e m e n ... . .. ........ .. ... ......... ............. S e m n 1 0 A :....... .....
0 Jic=61 kJm2 • Specimen L20-A2 j1C 61 kJ/m 2 0.3x10² 1 ncm-:
Closed Symbol: Measured Crack
0 0.5 1 1.5 2 2.5 3 3.5 0 0.5 1 1.5 2 2.5 3 3.5
Crack Extension (mm) Crack Extension (mm)
Figure 29. Fracture toughness J-R curves determined by DC potential drop and unloading compliance methods for Heat L20 of Type 304 SS irradiated to 0.3 x 10²¹ n-cm-'2
4 Environmentally Assisted Cracking of Alloys 600 and 690 in Simulated LWR Water (W. E. Ruther, W. K. Soppet, T. F. Kassner, and W. J. Shack)
The objective of this work is to evaluate the resistance of Alloys 600 and 690 to EAC in
simulated LWR coolant environments. High-Ni alloys have experienced general corrosion
(tube wall thinning), localized IGA, and SCC in LWRs. Secondary-side IGA! and axial and
circumferential SCC" have occurred in Alloy 600 tubes at tube support plates in many steam
generators. Primary-water SCC of Alloy 600 steam generator tubes in PWRs at roll transitions
and U-bends and in tube plugs' is a widespread problem that has been studied intensively.
•USNRC Information Notice No. 91-67. 'Problems with the Reliable Detection of Intergranular Attack (IGA) of
Steam Generator Tubing,. Oct 1991. =*USNRC Information Notice No. 90-49, 'Stress Corrosion Cracking in PWR Steam Generator Tubes," Aug.
1990; Notice No. 91-43, "Recent Incidents Involving Rapid Increases in Primary-to-Secondary Leak Rate."
July 1991; Notice No. 92-80, "Operation with Steam Generator Tubes Seriously Degraded," Dec. 1992; Notice
No. 94-05. "Potential Failure of Steam Generator Tubes with Kinetically Welded Sleeves," Jan. 1994.
***USNRC Information Notice No. 89-33, "Potential Failure of Westinghouse Steam Generator Tube Mechanical
Plugs," March 1989: Notice No. 89-65, "Potential for Stress Corrosion Cracking in Steam Generator Tube
Plugs Supplied by Babcock and Wirlcox" Sept. 1989; Notice No. 94-87, "Unanticipated Crack in a Particular
Heat of Alloy 600 Used for Westinghouse Mechanical Plugs for Steam Generator Tubes." Dec. 1994.
NUREG/CR-4667, Vol. 2745
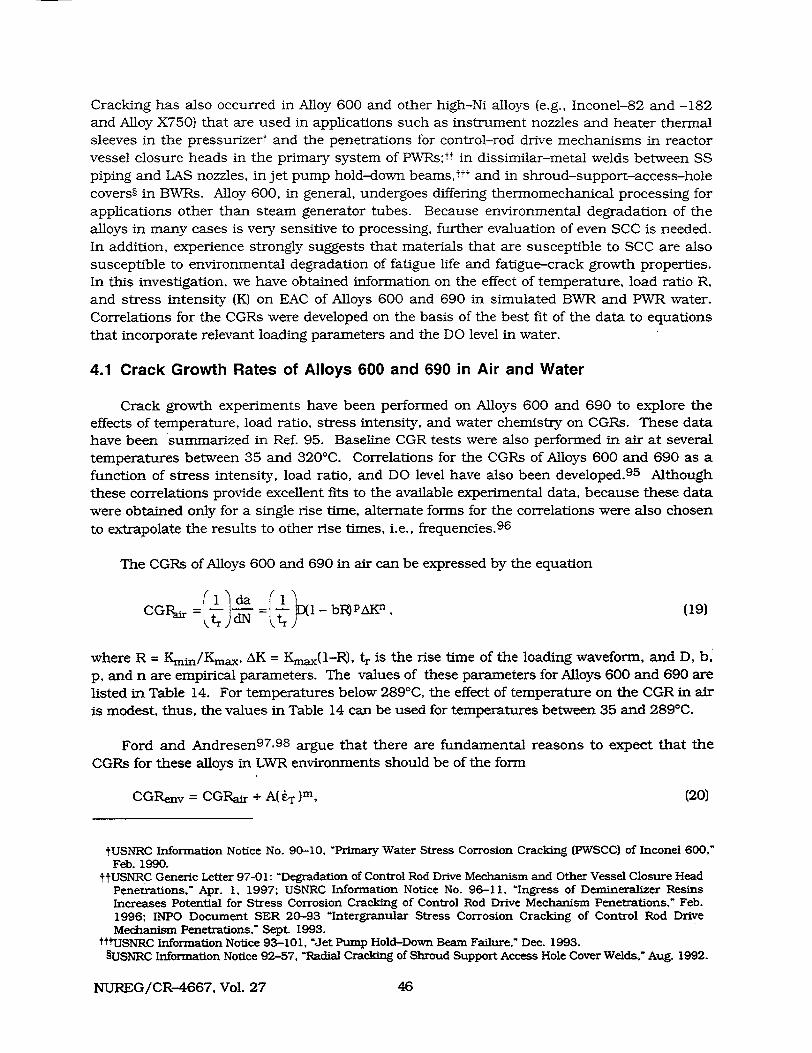
Cracking has also occurred in Alloy 600 and other high-Ni alloys (e.g., Inconel-82 and -182 and Alloy X750) that are used in applications such as instrument nozzles and heater thermal sleeves in the pressurizer, and the penetrations for control-rod drive mechanisms in reactor vessel closure heads in the primary system of PWRs;tt in dissimilar-metal welds between SS
piping and LAS nozzles, in jet pump hold-down beams,ttt and in shroud-support-access-hole covers§ in BWRs. Alloy 600, in general, undergoes differing thermomechanical processing for
applications other than steam generator tubes. Because environmental degradation of the alloys in many cases is very sensitive to processing, further evaluation of even SCC is needed.
In addition, experience strongly suggests that materials that are susceptible to SCC are also susceptible to environmental degradation of fatigue life and fatigue-crack growth properties. In this investigation, we have obtained information on the effect of temperature, load ratio R, and stress intensity (K) on EAC of Alloys 600 and 690 in simulated BWR and PWR water. Correlations for the CGRs were developed on the basis of the best fit of the data to equations that incorporate relevant loading parameters and the DO level in water.
4.1 Crack Growth Rates of Alloys 600 and 690 in Air and Water
Crack growth experiments have been performed on Alloys 600 and 690 to explore the effects of temperature, load ratio, stress intensity, and water chemistry on CGRs. These data have been summarized in Ref. 95. Baseline CGR tests were also performed in air at several
temperatures between 35 and 3201C. Correlations for the CGRs of Alloys 600 and 690 as a function of stress intensity, load ratio, and DO level have also been developed. 9 5 Although these correlations provide excellent fits to the available experimental data, because these data were obtained only for a single rise time, alternate forms for the correlations were also chosen
to extrapolate the results to other rise times, i.e., frequencies. 9 6
The CGRs of Alloys 600 and 690 in air can be expressed by the equation
CGRý =I-I- =-1 XlI- bl PAK- , (19) Ktr dN ~tr>
where R = Kmin/Kmax, AK = Kmax(1-R), tr is the rise time of the loading waveform, and D, b,
p, and n are empirical parameters. The values of these parameters for Alloys 600 and 690 are listed in Table 14. For temperatures below 289'C, the effect of temperature on the CGR in air is modest, thus, the values in Table 14 can be used for temperatures between 35 and 289'C.
Ford and Andresen 9 7 ,9 8 argue that there are fundamental reasons to expect that the
CGRs for these alloys in LWR environments should be of the form
CGRenv = CGRair + A(iT)m, (20)
tUSNRC Information Notice No. 90-10, "Primary Water Stress Corrosion Cracking (PWSCC) of Inconel 600," Feb. 1990.
ttUSNRC Generic Letter 97-01: "Degradation of Control Rod Drive Mechanism and Other Vessel Closure Head Penetrations," Apr. 1, 1997; USNRC Information Notice No. 96-11, "Ingress of Demineralizer Resins Increases Potential for Stress Corrosion Cracking of Control Rod Drive Mechanism Penetrations," Feb. 1996; INPO Document SER 20-93 "Intergranular Stress Corrosion Cracking of Control Rod Drive Mechanism Penetrations." Sept. 1993.
tttUSNRC Information Notice 93-101, "Jet Pump Hold-Down Beam Failure," Dec. 1993. §USNRC Information Notice 92-57, "Radial Cracking of Shroud Support Access Hole Cover Welds," Aug. 1992.
NUREG/CR-4667, Vol. 27 46
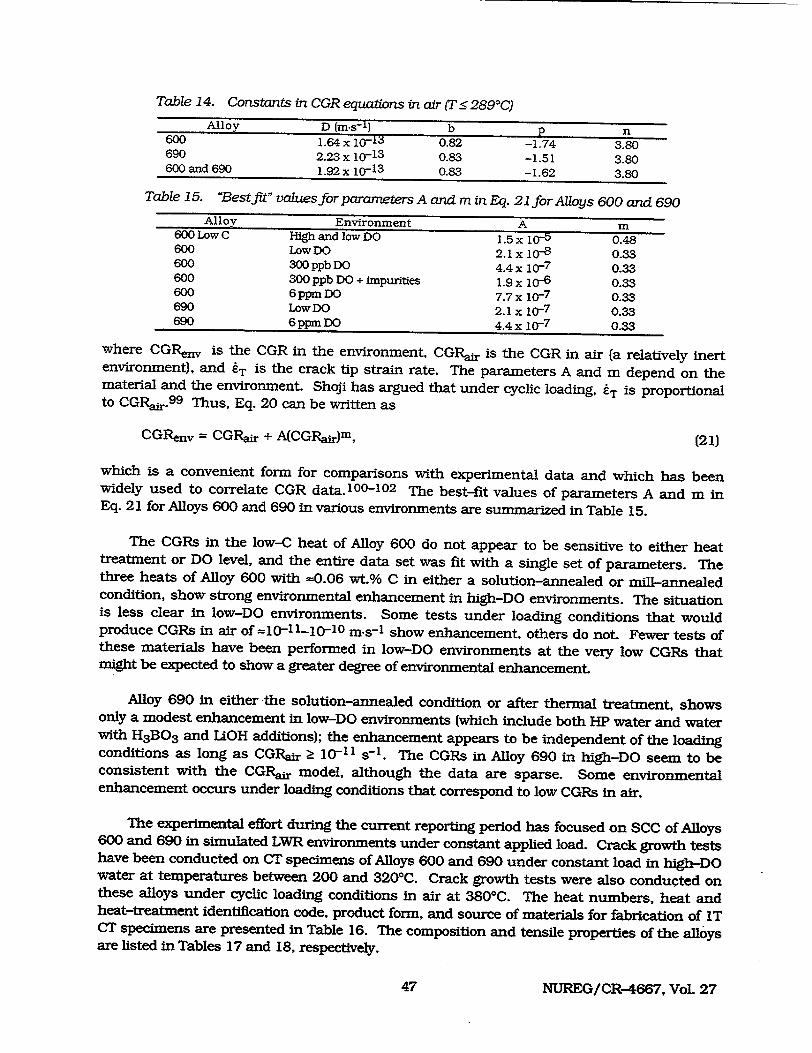
Table 14. Constants in CGR equations in air (T.: 289°C)
Alloy D (m.s'-) b P n 600 1.64 x 10⁻¹³ 0.82 -1.74 3.80 690 2.23 x 10- 1 3
0.83 -1.51 3.80 600 and 690 1.92 x 10⁻¹ 3
0.83 -1.62 3.80
Table 15. "Best fit" values for parameters A and m in Eq. 21 for Alloys 600 and 690 Alloy Environment A m
600 Low C High and low DO 1.5 x 10⁻⁵ 0.48 600 LowDO 2.1 x 10⁻⁸
0.33 600 300 ppb DO 4.4 x 10⁻⁷ 0.33 600 300 ppb DO + impurities 1.9 x 10- 6 0.33 600 6 ppm DO 7.7 x 10⁻⁷
0.33 690 LowDO 2.1 x 10⁻⁷
0.33 690 6 ppm DO 4.4x 10r7
0.33
where CGRenv is the CGR in the environment, CGRaIr is the CGR in air (a relatively inert environment), and tT is the crack tip strain rate. The parameters A and m depend on the material and the environment. Shoji has argued that under cyclic loading, tT is proportional to CGRar.9 9 Thus, Eq. 20 can be written as
CGRenv = CGRair + A(CGRajr)m, (21)
which is a convenient form for comparisons with experimental data and which has been widely used to correlate CGR data.1 0 0 -1 0 2 The best-fit values of parameters A and mi in Eq. 21 for Alloys 600 and 690 in various environments are summarized in Table 15.
The CGRs in the low-C heat of Alloy 600 do not appear to be sensitive to either heat treatment or DO level, and the entire data set was fit with a single set of parameters. The three heats of Alloy 600 with =0.06 wt.% C in either a solution-annealed or mill-annealed condition, show strong environmental enhancement in high-DO environments. The situation is less clear in low-DO environments. Some tests under loading conditions that would produce CGRs in air of =10-11-10-1O m.s-1 show enhancement, others do not. Fewer tests of these materials have been performed in low-DO environments at the very low CGRs that might be expected to show a greater degree of environmental enhancement
Alloy 690 in either the solution-annealed condition or after thermal treatment, shows only a modest enhancement in low-DO environments (which include both HP water and water with H 3 B0 3 and LiOH additions); the enhancement appears to be independent of the loading conditions as long as CGRair -> 10-11 s-I. The CGRs in Alloy 690 in high-DO seem to be consistent with the CGRar model, although the data are sparse. Some environmental enhancement occurs under loading conditions that correspond to low CGRs in air.
The experimental effort during the current reporting period has focused on SCC of Alloys 600 and 690 in simulated LWR environments under constant applied load. Crack growth tests have been conducted on CT specimens of Alloys 600 and 690 under constant load in high-DO water at temperatures between 200 and 3200C. Crack growth tests were also conducted on these alloys under cyclic loading conditions in air at 3800C. The heat numbers, heat and heat-treatment identification code, product form, and source of materials for fabrication of IT CT specimens are presented in Table 16. The composition and tensile properties of the alloys are listed in Tables 17 and 18, respectively.
NUREG/CR-4667, Vol. 2747
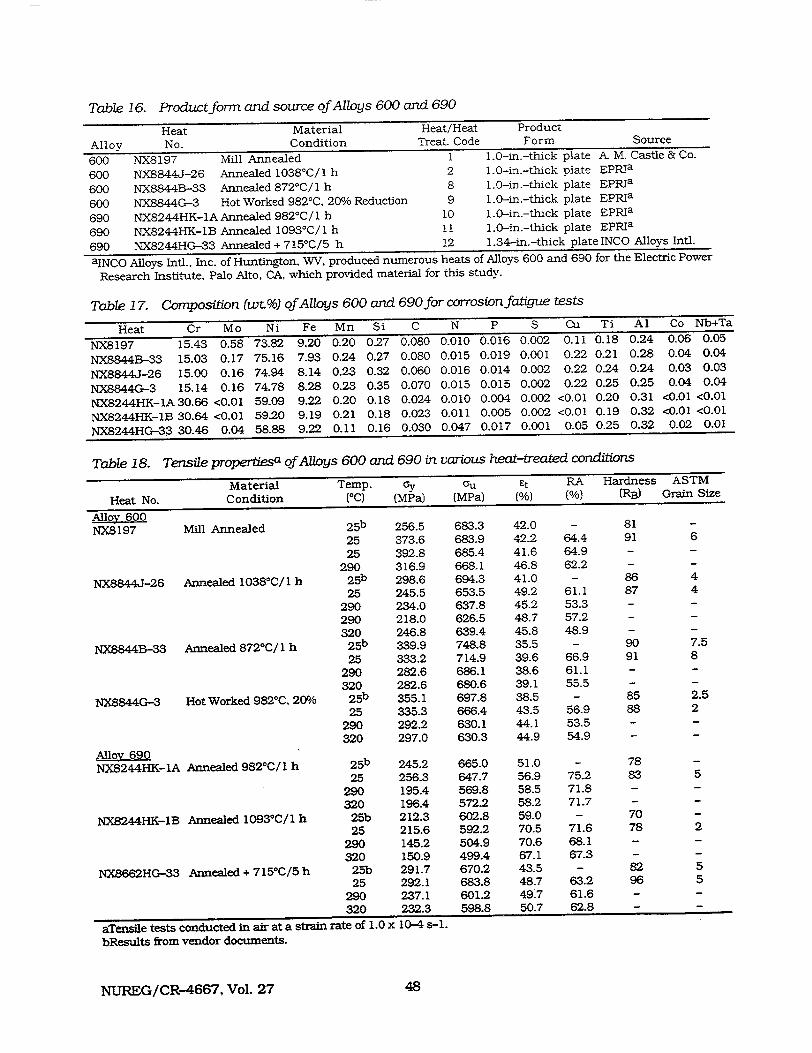
Table 16. Product form and source of Alloys 600 and 690
Heat Material Heat/Heat Product
Alloy No. Condition Treat. Code Form Source
600 NX8197 Mill Annealed 1 1.0-in.-thick plate A. M. Castle & Co.
600 NX8844J-26 Annealed 1038'C/1 h 2 1.0-in.-thick plate EPRIa
600 NX8844B-33 Annealed 8720C/1 h 8 1.0-in.--thick plate EPRIa
600 NX8844G-3 Hot Worked 982°C, 20% Reduction 9 1.0-in.-thick plate EPRIa
690 NX8244HK-1A Annealed 982°C/l h 10 1.0-in.-thick plate EPRIa
690 NX8244HK-1B Annealed 1093*C/1 h 11 1.0-in.-thick plate EPRIa
690 NX8244HG-33 Annealed + 715'C/5 h 12 1.34-in.-thick plateINCO Alloys Intl.
aINCO Alloys Intl., Inc. of Huntington, WV, produced numerous heats of Alloys 600 and 690 for the Electric Power
Research Institute, Palo Alto, CA, which provided material for this study.
Table 17. Composition (wt.%) of Alloys 600 and 690for corrosion fatigue tests
Heat Cr Mo Ni Fe Mn Si C N P S Cu Ti Al Co Nb+Ta
NX8197 15.43 0.58 73.82 9.20 0.20 0.27 0.080 0.010 0.016 0.002 0.11 0.18 0.24 0.06 0.05
NX8844B-33 15.03 0.17 75.16 7.93 0.24 0.27 0.080 0.015 0.019 0.001 0.22 0.21 0.28 0.04 0.04
NX8844J-26 15.00 0.16 74.94 8.14 0.23 0.32 0.060 0.016 0.014 0.002 0.22 0.24 0.24 0.03 0.03
NX8844G-3 15.14 0.16 74.78 8.28 0.23 0.35 0.070 0.015 0.015 0.002 0.22 0.25 0.25 0.04 0.04
NX8244HK-1A 30.66 <0.01 59.09 9.22 0.20 0.18 0.024 0.010 0.004 0.002 <0.01 0.20 0.31 <0.01 <0.01
NX8244HK-1B 30.64 <0.01 59.20 9.19 0.21 0.18 0.023 0.011 0.005 0.002 <0.01 0.19 0.32 <0.01 <0.01
NX8244HG-33 30.46 0.04 58.88 9.22 0.11 0.16 0.030 0.047 0.017 0.001 0.05 0.25 0.32 0.02 0.01
Table 18. Tensile propertesa of Alloys 600 and 690 in various heat-treated conditions
Material Temp. ly Ou Et RA Hardness ASTM
Heat No. Condition (OC) (MPa) (MPa) (%) (%) (RB) Grain Size
Alloy 600 NX8197 Mill Annealed 2 5 b 256.5 683.3 42.0 - 81
25 373.6 683.9 42.2 64.4 91 6
25 392.8 685.4 41.6 64.9 -
290 316.9 668.1 46.8 62.2 -
NX8844J-26 Annealed 1038 0C/1 h 2 5b 298.6 694.3 41.0 - 86 4
25 245.5 653.5 49.2 61.1 87 4
290 234.0 637.8 45.2 53.3 -
290 218.0 626.5 48.7 57.2 -
320 246.8 639.4 45.8 48.9 -
NX8844B-33 Annealed 8720C/ 1 h 2 5 b 339.9 748.8 35.5 - 90 7.5
25 333.2 714.9 39.6 66.9 91 8
290 282.6 686.1 38.6 61.1 -
320 282.6 680.6 39.1 55.5 -
NX8844G-3 Hot Worked 9820C, 20% 2 5b 355.1 697.8 38.5 - 85 2.5
25 335.3 666.4 43.5 56.9 88 2
290 292.2 630.1 44.1 53.5 -
320 297.0 630.3 44.9 54.9 -
Alloy 690 NX8244HK-IA Annealed 9820C/1 h 2 5b 245.2 665.0 51.0 - 78
25 256.3 647.7 56.9 75.2 83 5
290 195.4 569.8 58.5 71.8 -
320 196.4 572.2 58.2 71.7 -
NX8244HK-1B Annealed 1093OC/1 h 25b 212.3 602.8 59.0 - 70
25 215.6 592.2 70.5 71.6 78 2
290 145.2 504.9 70.6 68.1 -
320 150.9 499.4 67.1 67.3 -
NX8662HG-33 Annealed + 715*C/5 h 25b 291.7 670.2 43.5 - 82 5 25 292.1 683.8 48.7 63.2 96 5
290 237.1 601-2 49.7 61.6 -
320 232.3 598.8 50.7 62.8 -
aTensile tests conducted in air at a strain rate of 1.0 x 10⁻⁴ s-1.
bResults from vendor documents.
NUREG/CR-4667, Vol. 27 48
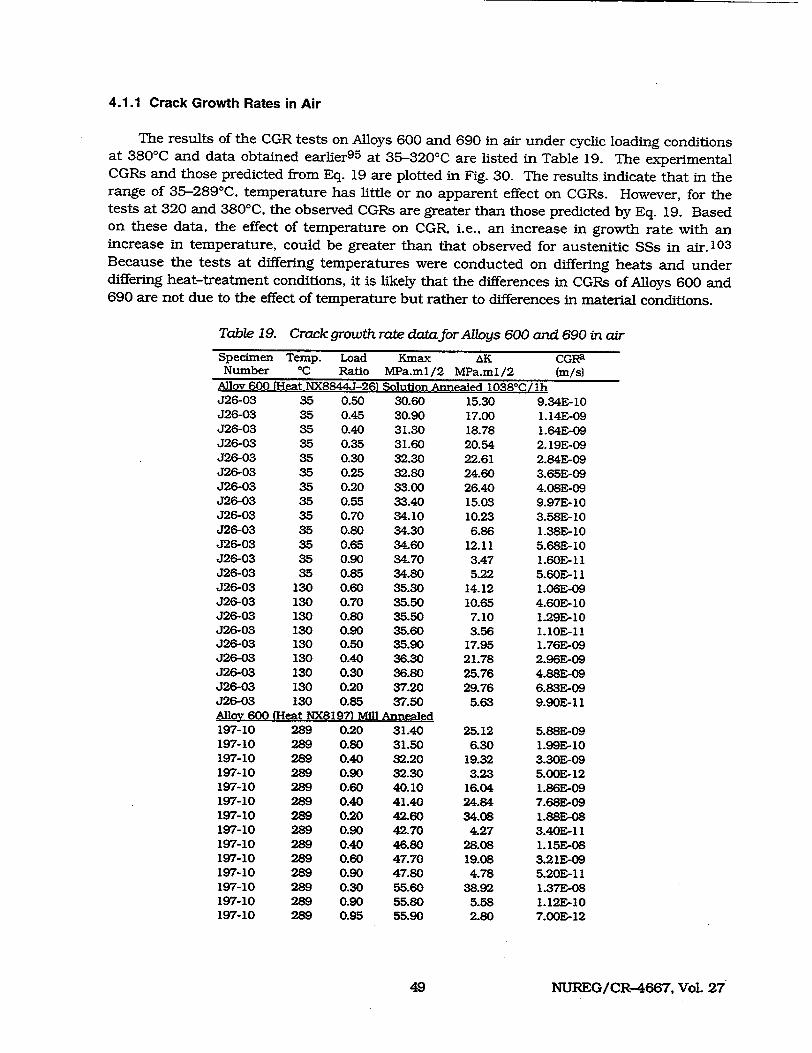
4.1.1 Crack Growth Rates in Air
The results of the CGR tests on Alloys 600 and 690 in air under cyclic loading conditions at 380'C and data obtained earlier 9 5 at 35-3200 C are listed in Table 19. The experimental CGRs and those predicted from Eq. 19 are plotted in Fig. 30. The results indicate that in the range of 35-289°C, temperature has little or no apparent effect on CGRs. However, for the tests at 320 and 3800 C, the observed CGRs are greater than those predicted by Eq. 19. Based on these data, the effect of temperature on CGR, i.e., an increase in growth rate with an increase in temperature, could be greater than that observed for austenitic SSs in air.1 0 3
Because the tests at differing temperatures were conducted on differing heats and under differing heat-treatment conditions, it is likely that the differences in CGRs of Alloys 600 and 690 are not due to the effect of temperature but rather to differences in material conditions.
Table 19. Crack growth rate data for Alloys 600 and 690 in air
Specimen Temp. Load Number °C Ratio
A]Iov 600 iHfat NXRP44.T-9R%
Kmax MPa.ml/ Solution
J26-03 35 0.50 30.60 J26-03 35 0.45 30.90 J26-03 35 0.40 31.30 J26-03 35 0.35 31.60 J26-03 35 0.30 32.30 J26-03 35 0.25 32.80 J26-03 35 0.20 33.00 J26-03 35 0.55 33.40 J26-03 35 0.70 34.10 J26-03 35 0.80 34.30 J26-03 35 0.65 34.60 J26-03 35 0.90 34.70 J26-03 35 0.85 34.80 J26-03 130 0.60 35.30 J26-03 130 0.70 35.50 J26-03 130 0.80 35.50 J26-03 130 0.90 35.60 J26-03 130 0.50 35.90 J26-03 130 0.40 36.30 J26-03 130 0.30 36.80 J26-03 130 0.20 37.20 J26-03 130 0.85 37.50 Alloy 600 (Heat NX81971 Mill Annealed 197-10 289 0.20 31.40 197-10 289 0.80 31.50 197-10 289 0.40 32.20 197-10 289 0.90 32.30 197-10 289 0.60 40.10 197-10 289 0.40 41.40 197-10 289 0.20 42.60 197-10 289 0.90 42.70 197-10 289 0.40 46.80 197-10 289 0.60 47.70 197-10 289 0.90 47.80 197-10 289 0.30 55.60 197-10 289 0.90 55.80 197-10 289 0.95 55.90
AK CGRa /2 MPa.ml/2 (m/s) knnealed 1038 0C/lh
15.30 9.34E-10 17.00 1.14E-09 18.78 1.64E-09 20.54 2.19E-09 22.61 2.84E-09 24.60 3.65E-09 26.40 4.08E-09 15.03 9.97E-10 10.23 3.58E-10 6.86 1.38E-10
12.11 5.68E-10 3.47 1.60E- 11 5.22 5.60E-1 1
14.12 1.06E-09 10.65 4.60E-10 7.10 1.29E-10 3.56 I.1OE-11
17.95 1.76E-09 21.78 2.96E-09 25.76 4.88E-09 29.76 6.83E-09
5.63 9.90E- 11
25.12 6.30
19.32 3.23
16.04 24.84 34.08 4.27
28.08 19.08
4.78 38.92
5.58 2.80
5.88E-09 1.99E-10 3.30E-09 5.OOE-12 1.86E-09 7.68E-09 1.88E-08 3.40E-1 1 1. 15E-08 3.21E-09 5.20E- 11 1.37E-08 1.12E-10 7.OOE-12
NUTREG/CR-4667, Vol. 2749
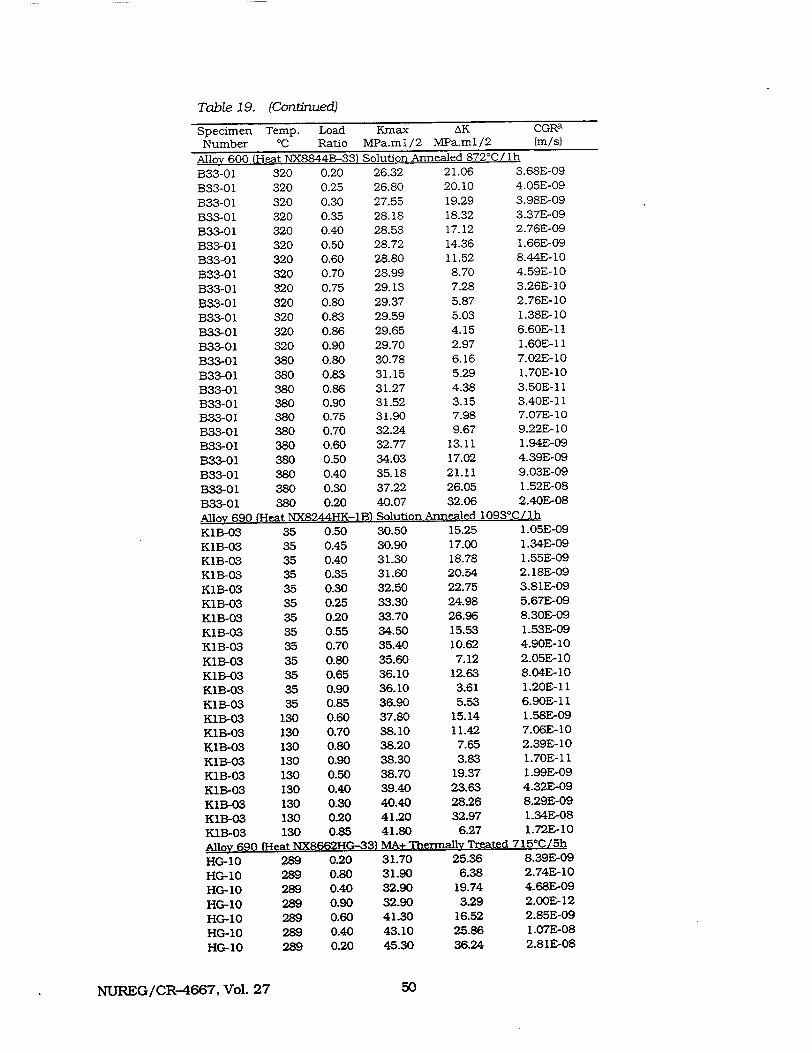
Table .19. (Contined)
Specimen Temp. Load Kmax AK
Number °C Ratio MPa.ml/2 MPa.ml/2CGRa (m/s)
A11ny 600 M-eat NX8844B-33) Solution Annealed 8720C /lhB33-01 320 0.20 26.32 21.06 3.68E-09
B33-01 320 0.25 26.80 20.10 4.05E-09
B33-01 320 0.30 27.55 19.29 3.98E-09
B33-01 320 0.35 28.18 18.32 3.37E-09
B33-01 320 0.40 28.53 17.12 2.76E-09
B33-01 320 0.50 28.72 14.36 1.66E-09
B33-01 320 0.60 28.80 11.52 8.44E-10
B33-01 320 0.70 28.99 8.70 4.59E-10
B33-01 320 0.75 29.13 7.28 3.26E-10
B33-01 320 0.80 29.37 5.87 2.76E-10
B33-01 320 0.83 29.59 5.03 1.38E-10
B33-01 320 0.86 29.65 4.15 6.60E- 1I
B33-01 320 0.90 29.70 2.97 1.60E- I 1
B33-01 380 0.80 30.78 6.16 7.02E-10
B33-01 380 0.83 31.15 5.29 1.70E-10
B33-01 380 0.86 31.27 4.38 3.50E-11
B33-01 380 0.90 31.52 3.15 3.40E- 11
B33-01 380 0.75 31.90 7.98 7.07E-10
B33-01 380 0.70 32.24 9.67 9.22E-10
B33-01 380 0.60 32.77 13.11 1.94E-09
B33-01 380 0.50 34.03 17.02 4.39E-09
B33-01 380 0.40 35.18 21.11 9.03E-09
B33-01 380 0.30 37.22 26.05 1.52E-08
B33-01 380 0.20 40.07 32.06 2.40E-08
Alloy 690 (Heat NX8244HK-1B) Solution Annealed 1093°C Ilh
K1B-03 35 0.50 30.50 15.25 1.05E-09
KIB-03 35 0.45 30.90 17.00 1.34E-09
K1B-03 35 0.40 31.30 18.78 1.55E-09
K1B-03 35 0.35 31.60 20.54 2.18E-09
K1B-03 35 0.30 32.50 22.75 3.81E-09
KIB-03 35 0.25 33.30 24.98 5.67E-09
KIB-03 35 0.20 33.70 26.96 8.30E-09
KIB-03 35 0.55 34.50 15.53 1.53E-09
K1B-03 35 0.70 35.40 10.62 4.90E-10
KIB-03 35 0.80 35.60 7.12 2.05E-10
KlB-03 35 0.65 36.10 12.63 8.04E-1C
K1B-03 35 0.90 36.10 3.61 1.20E-11
K1B-03 35 0.85 36.90 5.53 6.90E-11
K1B-03 130 0.60 37.80 15.14 1.58E-09
K1B-03 130 0.70 38.10 11.42 7.06E-1C
KIB-03 130 0.80 38.20 7.65 2.39E-1(
K1B-03 130 0.90 38.30 3.83 1.70E-1 1
KIB-03 130 0.50 38.70 19.37 1.99E-0.
KIB-03 130 0.40 39.40 23.63 4.32E-0
KIB-03 130 0.30 40.40 28.26 8.29E-0
K1B-03 130 0.20 41.20 32.97 1.34E-0f
K1B-03 130 0.85 41.80 6.27 1.72E-1(
Alloy 690 (Heat NX8662HG-331 MA+ Thermally Treated 715 0C/5h
HG-10 HG-10 HG-10 HG-10 HG-10 HG-10 HG-10
289 0.20 31.70 289 0.80 31.90 289 0.40 32.90 289 0.90 32.90 289 0.60 41.30 289 0.40 43.10 289 0.20 45.30
25.36 6.38
19.74 3.29
16.52 25.86 36.24
8.39E-09 2.74E-10 4.68E-09 2.00E-12 2.85E-09 1.07E-08 2.81E-08
NUREG/CR-4667, Vol. 27 50
Table 19. (Continued)
3 )
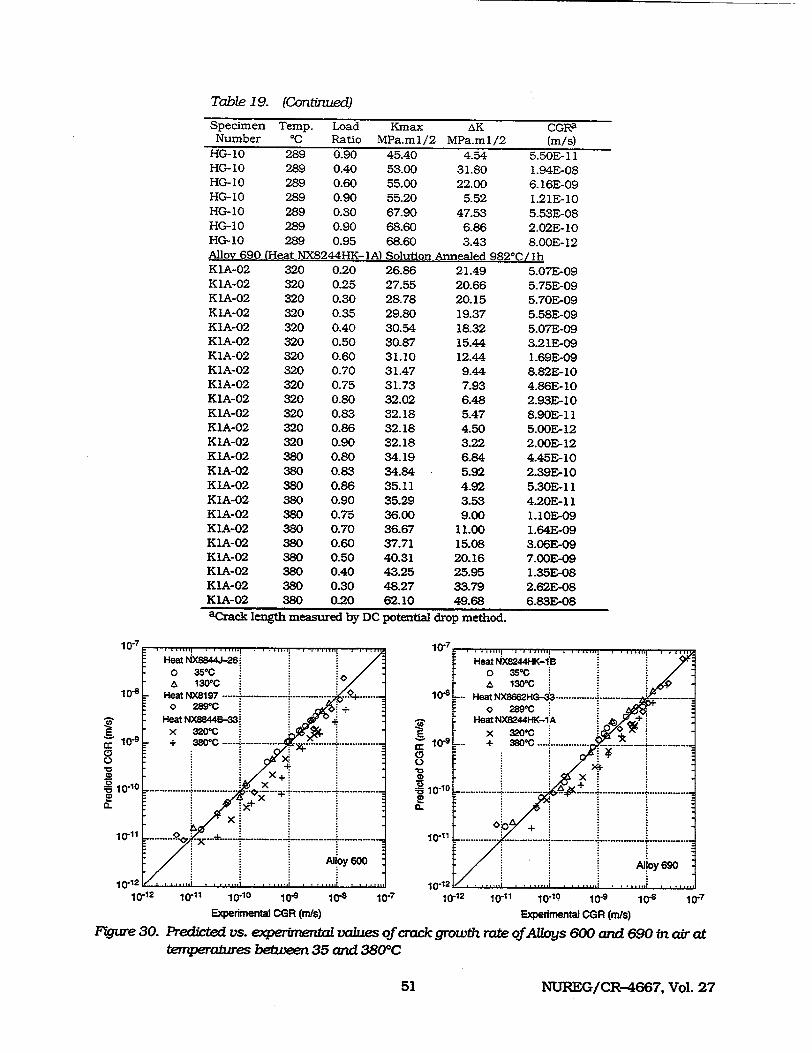
Table 19. (Continued)
Specimen Temp. Load Kmax AK CGRa Number °O Ratio MPa.ml/2 MPa.ml/2 (m/s)
HG-10 289 0.90 45.40 4.54 5.50E- 11 HG-10 289 0.40 53.00 31.80 1.94E-08 HG-10 289 0.60 55.00 22.00 6.16E-09 HG-10 289 0.90 55.20 5.52 1.21E-10 HG-10 289 0.30 67.90 47.53 5.53E-08 HG-10 289 0.90 68.60 6.86 2.02E-10 HG-10 289 0.95 68.60 3.43 8.00E-12 Alloy 690 (Heat NX8244HK-IA) Solution Annealed 982'C/ lh KIA-02 320 0.20 26.86 21.49 5.07E-09 KIA-02 320 0.25 27.55 20.66 5.75E-09 KIA-02 320 0.30 28.78 20.15 5.70E-09 KIA-02 320 0.35 29.80 19.37 5.58E-09 KIA-02 320 0.40 30.54 18.32 5.07E-09 KIA-02 320 0.50 30.87 15.44 3.21E-09 KlA-02 320 0.60 31.10 12.44 1.69E-09 KIA-02 320 0.70 31.47 9.44 8.82E-10 KIA-02 320 0.75 31.73 7.93 4.86E-10 KIA-02 320 0.80 32.02 6.48 2.93E-10 K1A-02 320 0.83 32.18 5.47 8.90E- 11 KIA-02 320 0.86 32.18 4.50 5.00E-12 KIA-02 320 0.90 32.18 3.22 2.00E- 12 KIA-02 380 0.80 34.19 6.84 4.45E-10 KIA-02 380 0.83 34.84 5.92 2.39E-10 K1A-02 380 0.86 35.11 4.92 5.30E- 11 KIA-02 380 0.90 35.29 3.53 4.20E- 11 K1A-02 380 0.75 36.00 9.00 1.10E-09 KIA-02 380 0.70 36.67 11.00 1.64E-09 KIA-02 380 0.60 37.71 15.08 3.06E-09 KIA-02 380 0.50 40.31 20.16 7.OOE-09 KIA-02 380 0.40 43.25 25.95 1.35E-08 KIA-02 380 0.30 48.27 33.79 2.62E-08 K1A-02 380 0.20 62.10 49.68 6.83E-08 aCrack length measured by DC potential drop method.
10-7 10-7
Heat X884J-2Heat NX8244HK-I.B .. '" o 35*C 03*
130*C 0 IWC 10,8 Heat NX8197 -- ---.. .... Heat... ...... .. , .. o28900 + 0 28900
Heat NX84B-W Heat NX8244HK-1A E x 32000 X 32 0-C E100 + ,10-. + 3W0 ..••....
S........... ...........-.-.-.-.---------- .............. . ... .. .... ÷ .. . . .• . . . . i xi i xx
Ob~. +
.. ........0, i*l .. Alloy 600 Alloy 690
10.121i. .... j.. 10.121~ 10.12 10.11 1010 10 10-8 10-7 10.12 1001 10.10 10-9 10-8 10-7
Expenmentar CGR (mis) Experimental CGR (m/s) Figure 30. Predicted vs. eqper~nental values of crack growth rate of Alloys 600 and 690 in aur at
te&reratzres between 35 and 3800C
NUREG/CR-4667, Vol. 2751
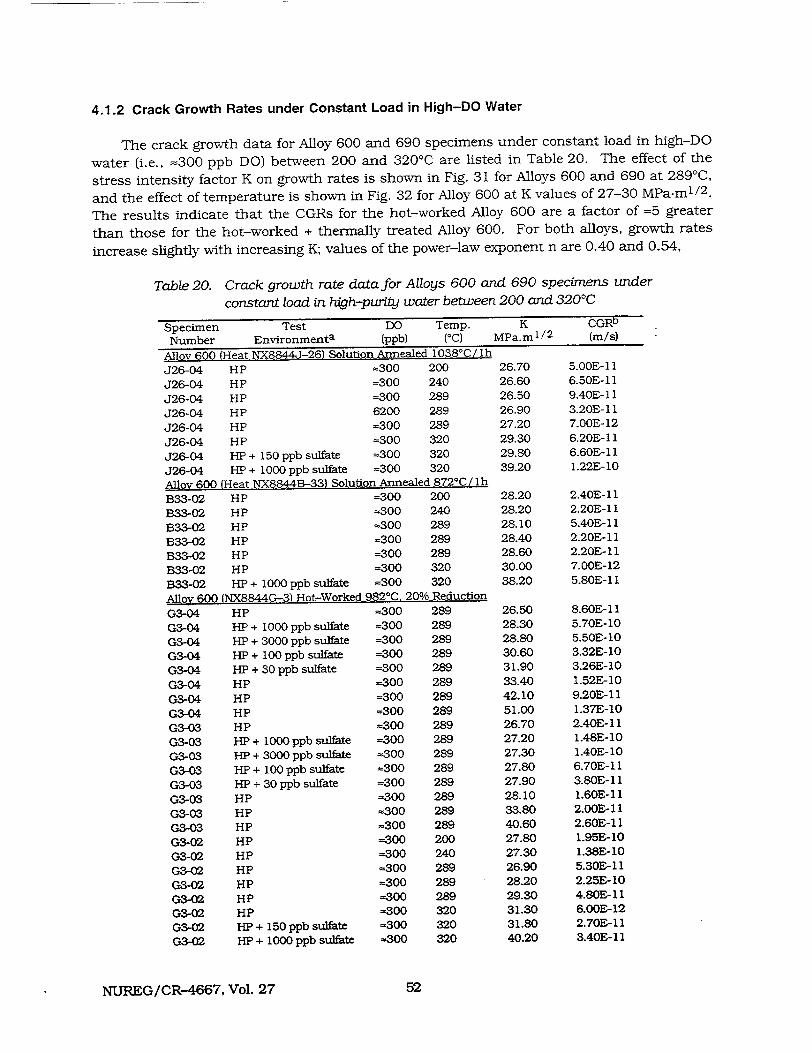
4.1.2 Crack Growth Rates under Constant Load in High-DO Water
The crack growth data for Alloy 600 and 690 specimens under constant load in high-DO
water (i.e., =300 ppb DO) between 200 and 3200 C are listed in Table 20. The effect of the
stress intensity factor K on growth rates is shown in Fig. 31 for Alloys 600 and 690 at 289°C,
and the effect of temperature is shown in Fig. 32 for Alloy 600 at K values of 27-30 MPa.m 1 / 2 .
The results indicate that the CGRs for the hot-worked Alloy 600 are a factor of =5 greater
than those for the hot-worked + thermally treated Alloy 600. For both alloys, growth rates
increase slightly with increasing K; values of the power-law exponent n are 0.40 and 0.54,
Table 20. Crack growth rate data for Alloys 600 and 690 specimens under
constant load in high-purity water between 200 and 3200 C
Specimen Test DO Temp. K CGRb
Number Environmenta (ppb) (0c) MPa.m 1 / 2 (m/s)
Alloy 600 (Heat NX8844J-26) Solution Annealed 1038°C / lh
J26-04 HP =300 200
J26-04 HP =300 240
J26-04 HP =300 289
J26-04 HP 6200 289
J26-04 HP =300 289
J26-04 HP =300 320
J26-04 HP + 150 ppb sulfate =300 320
J26-04 HP + 1000 ppb sulfate =300 320
Alloy 600 (Heat NX8844B-33) Solution Annealed 872°C/ lh
B33-02 HP =300 200
B33-02 HP =300 240
B33-02 HP =300 289
B33-02 HP =300 289
B33-02 HP =300 289
B33-02 HP =300 320
B33-02 HP + 1000 ppb sulfate =300 320
Alloy 600 (NX8844G-3) Hot-Worked 982°C, 20% Reduction
G3-04 HP --300 289
G3-04 HP + 1000 ppb sulfate =300 289
G3-04 HP + 3000 ppb sulfate =300 289
G3-04 HP + 100 ppb sulfate =300 289
G3-04 HP + 30 ppb sulfate =300 289
G3-04 HP =300 289
G3-04 HP =300 289
G3-04 H P =300 289
G3-03 HP =300 289
G3-03 HP + 1000 ppb sulfate =300 289
G3-03 HP + 3000 ppb sulfate =300 289
G3-03 HP + 100 ppb sulfate =300 289
G3-03 HP + 30 ppb sulfate =300 289
G3-03 HP =300 289
G3-03 HP =300 289
G3-03 HP =300 289
G3-02 HP =300 200
G3-02 HP =300 240
G3-02 HP -300 289
G3-02 HP =300 289
G3-02 HP -300 289
G3-02 HP =300 320
G3-02 HP + 150 ppb sulfate =300 320
G3-02 HP + 1000 ppb sulfate =300 320
26.70 �.0U±�-1 I26.70 26.60 26.50 26.90 27.20 29.30 29.80 39.20
28.20 28.20 28.10 28.40 28.60 30.00 38.20
26.50 28.30 28.80 30.60 31.90 33.40 42.10 51.00 26.70 27.20 27.30 27.80 27.90 28.10 33.80 40.60 27.80 27.30 26.90 28.20 29.30 31.30 31.80 40.20
5.OUE- 11 6.50E- 11 9.40E- 11 3.20E- 1I 7.OOE-12 6.20E- 11 6.60E- 11 1.22E-10
2.40E- 11 2.20E- 11 5.40E- 11 2.20E- 11 2.20E-11 7.00E-12 5.80E- 11
8.60E- 11 5.70E-10 5.50E-10 3.32E-10 3.26E- 10 1.52E- 10 9.20E- 11 1.37E-10 2.40E- 11 1.48E-10 1.40E-10 6.70E- 11 3.80E-1 1 1.60E-11 2.00E-11 2.60E-11 1.95E-10 1.38E-10 5.30E-11 2.25E-10 4.80E-11 6.OOE-12 2.70E-11 3.40E- 11
NUREG/CR-4667, Vol. 27 52
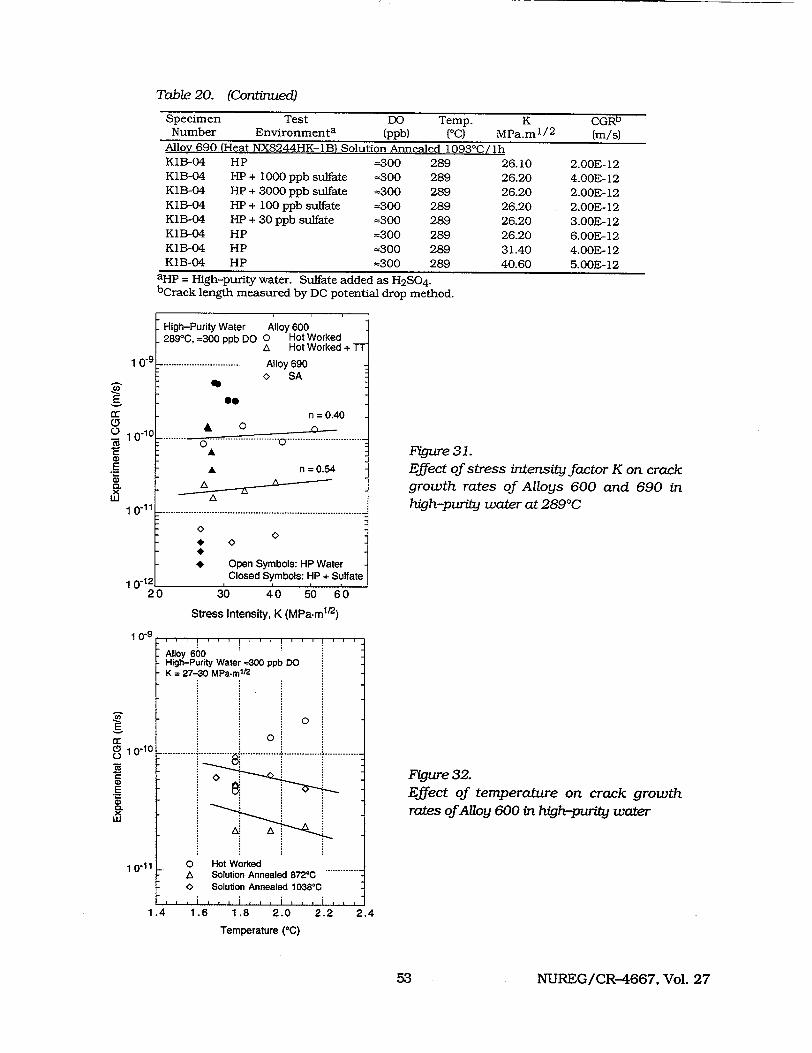
Table 20. (Continued)
Specimen Test DO Temp. K CGRb Number Environmenta (ppb) (0c) MPa.m 1/ 2 (m/s)
Alloy 690 fHeat NX8244HK-1B) Solution Annealed 10930C / h K1B-04 HP =300 289 26.10 2.OOE-12 K1B-04 HP + 1000 ppb sulfate =300 289 26.20 4.OOE-12 K1B-04 HP + 3000 ppb sulfate =300 289 26.20 2.OOE-12 K1B-04 HP + 100 ppb sulfate =300 289 26.20 2.OOE-12 K1B-04 HP + 30 ppb sulfate =300 289 26.20 3.OOE-12 K1B-04 HP =300 289 26.20 6.OOE-12 K1B-04 HP =300 289 31.40 4.OOE-12 K1B-04 HP =300 289 40.60 5.OOE-12
allp = High-purity water. Sulfate added as H2S0 4. bCrack length measured by DC potential drop method.
30 40 50 60
Stress Intensity, K (MPa.m1/2)
Figure 31. Effect of stress intensity factor K on crack growth rates of Alloys 600 and 690 in high-purity water at 289'C
Figure 32. Effect of temperature on crack growth rates of Alloy 600 in high-purity water
1.4 1.6 1.8 2.0 2.2 2.4
Temperature (0C)
NUREG/CR-4667, Vol. 27
10
E
CL E .-
1 0"1
1 0"1
High-Purity Water Alloy 600 289°C, =300 ppb DO 0 Hot Worked
& Hot Worked + TT -9: .............................. Alloy 690
0 SA
4b
n = 0.40
10 &
A
A n = 0.54
* 0 . ..
* Open Symbols: HP Water
2 Closed Symbols: HP + Sulfate
20
1 09
(D 10-10
E CL 0.
x w
10-11
Alloy 600 High-Purity Water =300 ppb DO K = 27-30 MPa-m1l 2
0
0 ........................... a .................. ............... I --------------0
A. A
0 Hot Worked * A Solution Annealed 872°C < Solution Annealed 1038*0
S.. .. lYfI111fltlll
53
respectively, for the hot-worked and hot-worked + thermally treated Alloy 600. The addition of
sulfate increased the CGRs of both alloys by a factor of 3-7. The Alloy 690 specimens show
little dependence of K on growth rates. The CGRs for Alloy 690 range between -2 x 10-12 and
6 x 10-12 m/s; however, these values may be below the sensitivity of the crack-length
monitoring system. Also, the addition of sulfates exerted no effect on the growth rates of
Alloy 690.
Between 200 and 320'C, the CGRs in solution-annealed Alloy 600 are weakly dependent
on temperature. Although there is considerable uncertainty because the data set is small and
the data are scattered, these CGRs appear to increase slightly with increasing temperature.
However, the growth rates in hot-worked Alloy 600 (20% reduction) decrease significantly with
temperature and become comparable to those in the solution-annealed materials. A decrease
in the CGRs of SCC in simulated BWR environments at temperatures above 288°C has been
observed in austenitic SSs. 1 0 4' 10 5 In that case, however, the decrease was much greater and
produced CGRs <10-11 m/s in the SS.
5 Summary of Results
5.1 Environmental Effects on Fatigue S-N Behavior of Primary Pressure
Boundary Materials
The existing fatigue S-N data on the effects of various material, loading, and
environmental parameters on the fatigue lives of carbon and low-alloy steels and austenitic
SSs have been summarized. Two approaches have been proposed for incorporating the effects
of LWR environments into ASME Section III fatigue evaluations: (a) develop new design fatigue
curves for LWR applications, and (b) use a fatigue life correction factor to account for
environmental effects. Both methods of evaluating fatigue lives are based on statistical
models for estimating fatigue lives of carbon and low-alloy steels and austenitic SSs in LWR
environments. The environmentally adjusted design fatigue curves provide allowable cycles for
fatigue crack initiation in LWR coolant environments. The design curves for carbon and low
alloy steels as well as for austenitic SSs maintain the margin of 20 on life. However, to be
consistent with the current ASME Code curves, the margin on stress is 2 for carbon and low
alloy steels and 1.5 for austenitic SSs.
In the Fen method, environmental effects on life are estimated from the statistical models
but the correction is applied to fatigue lives estimated from the current Code design curves.
Therefore, estimates of fatigue lives that are based on the two methods may differ because of
differences in the ASME mean curve and the best-fit curve to existing fatigue data. The
existing fatigue S-N data indicate that the current Code design curve for CSs is comparable to
the statistical-model curve for LASs, whereas, it is somewhat conservative at stress levels
<500 MPa when compared with the statistical-model curve for CSs. Consequently, usage
factors based on the Fen method would be comparable to those based on the environmentally
adjusted design fatigue curves for LASs and would be somewhat higher for CSs.
For austenitic SSs, the ASME mean curve and consequently the current Code design
fatigue curve are nonconservative in air when compared with the statistical-model curve and a
NUREG/CR-4667, Vol. 27 54
corresponding design curve, i.e., it predicts longer fatigue lives than the best-fit curve to the existing S-N data. Consequently, before adjusting for the conservatism in the design curves, usage factors that are based on the Fen method would be lower than those determined from design fatigue curves based on the Argonne results.
Fatigue tests have also been conducted to determine the crack initiation and growth characteristics of austenitic SSs in air and LWR environments. Results of fatigue tests that examine the influence of the reactor environment on the formation and growth of short cracks in Types 304 SS are presented. Crack lengths as a function of fatigue cycles were determined in air and water environments. The significant conclusions are summarized below.
" At the same fraction of life, the crack lengths are longer in water than in air. The crack growth rates in water are greater than those in air, and the CGRs in PWR water are greater than those in high-DO water.
" The decrease in fatigue life of Type 304 austenitic SS in LWR water is primarily caused by the effects of environment on the growth of short cracks that are <500 gm deep.
" The results from the present study are not consistent with the slip dissolution model for enhanced CGRs in LWR environments. Oxide film rupture strengths and/or H2 evolution may play a greater role in these environments.
5.2 Irradiation-Assisted Stress Corrosion Cracking of Austenitic Stainless Steels
Sixteen austenitic SS alloys that were irradiated at 2891C in He to a fluence of =0.3 x 10²¹ n-cm-2 (E > 1 MeV) and nine alloys that were irradiated to a fluence of =0.9 x 10²¹ n-cm- 2 (E > 1 MeV) were subjected to SSRT tests and posttest fractographic analyses by SEM. After irradiation to =0.3 x 10²¹ n-cm- 2 or =0.9 x 10²¹ n-cm- 2 (E > 1 MeV), strong heat-to-heat variation in irradiation-induced hardening was observed. Heat-to-heat variations in susceptibilities to IGSCC and TGSCC were very significant among steels of the same grade that contain nominally similar concentrations of alloying and impurity elements, as defined in the ASTM specifications. After irradiation to a fluence of -0.3 x 10²¹ n-cm- 2 (E > 1 MeV), an HP laboratory heat of Type 316L SS that contains a very low concentration of Si exhibited the highest susceptibility to IGSCC. All of the other 15 alloys exhibited negligible susceptibility to IGSCC at this low fluence.
Silicon atoms profoundly affect irradiation-induced hardening of and irradiation-induced microstructural evolution in Type 304 SSs. A high concentration of Si is conducive to less irradiation-induced hardening and a lower number density of Frank loops. Susceptibilities to TGSCC of 16 alloys at =0.3 x 10²¹ n-cm- 2 (E > 1 MeV) could be correlated in terms of N and Si concentrations. All alloys that contained <0.01 wt.% N and <1.0 wt.% Si were susceptible, whereas all alloys that contained >0.01 wt.% N or >1.0 wt.% Si were relatively resistant. Because practically all commercial heats of Type 304 or 304L SSs contain >100 wppm N, this means that, to delay onset of and increase resistance to IASCC, it is helpful to ensure a certain minimum concentration of Si. Results of initial tests on alloys irradiated to a fluence of --0.9 x 10²¹ n-cm-2 (E > 1 MeV) were consistent with the finding that a low level of Si (<0.5 wt.%) is conducive to relatively higher susceptibility to IASCC. Consistent with the effect in Type 304 SSs, a low concentration of Si (e.g., <0.26 wt.%) appears to promote higher
NUREG/CR-4667, Vol. 2755
susceptibility of HP heats of Type 316 SS to IASCC when compared with CP heats that contain
high concentration of Si.
At =0.3 x 10²¹ n-cm- 2 to =0.9 x 10² n-cm-2 (E > 1 MeV), the beneficial effect of a high
concentration of Cr was significant. Alloys that contain <15.8 wt.% Cr exhibited higher
susceptibilities to TGSCC and IGSCC, compared to an alloy that contains >21 wt.% Cr.
Fracture toughness J-R curve tests have been conducted on two heats of Type 304 SS
that were irradiated to a fluence of =0.3 x 10²¹ n-cm-2 (E > 1 MeV) at =288°C in a He
environment in the Halden boiling heavy-water reactor. The tests were performed on 1/4-T CT
specimens in air at 288°C; crack extensions were determined by both DC potential and elastic
unloading compliance techniques. Neutron irradiation at 2880C to 0.3 x 10²¹ n.cm- 2
decreased the fracture toughness of both heats. The commercial heat C 19 exhibited fracture
toughness that is superior to the fracture toughness of the laboratory heat L20. The values of
fracture toughness Jic are >500 kJ/m 2 for C19 and =60 kJ/m 2 for L20.
5.3 Environmentally Assisted Cracking of Low-Carbon Alloys 600 and 690 in
Simulated LWR Water
Fracture-mechanics CGR tests have been conducted on CT specimens of several heats of
Alloys 600 and 690 in annealed, and in annealed and thermally treated, conditions in HP
water with DO levels between 1 and 7500 ppb and in low-DO water that contained boric acid,
lithium hydroxide, and low concentrations of dissolved H at 200-320'C. Fracture-mechanics
CGR tests were also conducted on CT specimens of several of these alloys in air at
temperatures between 35 and 3200C. Correlations have been developed for estimating the
CGRs of Alloys 600 and 690 as a function of stress intensity, load ratio, and DO level.
However, because the experimental data were obtained for only a single rise time, alternate
forms for the correlations have also been developed to extrapolate the results to other rise
times, i.e., frequencies. Experiments are planned to verify the predictions of the correlation
for the effect of rise time/frequency.
The CGRs in the low-C heat of Alloy 600 do not appear to be sensitive to either heat
treatment or DO level, whereas the CGRs in the high-C heats show a strong environmental
enhancement in high-DO environments. The results are inconclusive for the high-C Alloy 600
in low-DO environments. Alloy 690 shows only a modest environmental enhancement in low
DO environments; environmental effects appear to be independent of the loading conditions
as long as CGRair Ž 10-11 s- 1 . The CGRs in Alloy 690 in high-DO water show some
environmental enhancement for loading conditions that correspond to low CGRs in air.
During the current reporting period crack growth tests have been performed on Alloys 600
and 690 under cyclic loading conditions in air at 3800C. The results indicate that in the range
of 35-289°C, temperature has little or no apparent effect on CGRs. The observed CGRs at 320
and 3800C are greater than those at 35-2891C. However, because the tests at differing
temperatures were conducted on differing heats and under differing heat-treatment
conditions, it is likely that the differences in CGRs are not due to the effect of temperature
but rather to the differences in material conditions.
Constant load crack growth tests have also been conducted on CT specimens of Alloys
600 and 690 in high-DO water at 200-3200C. The growth rates for the hot-worked Alloy 600
NUREG/CR-4667, Vol. 27 56
are a factor of =5 higher than those for the hot-worked + thermally treated Alloy 600. The addition of sulfate increased the CGRs of both alloys by a factor of 3-7. The Alloy 690 specimens show little dependence of K on growth rates; the CGRs range between -2 x 10-12 and 6 x 10-12 m/s, values that may be below the sensitivity of the crack-monitoring system. The results indicate that for Alloy 600, the CGRs increase slightly with increasing stress intensity factor K.
NUREG/CR-4667, Vol. 2757
References
1. K. lida, A Review of Fatigue Failures in LWR Plants in Japan, Nucl. Eng. Des. 138, 297312 (1992).
2. K. Kussmaul, R. Rintamaa, J. Jansky, M. Kemppainen, and K. T~rr6nen, On the Mechanism of Environmental Cracking Introduced by Cyclic Thermal Loading, in IAEA Specialists Meeting Corrosion and Stress Corrosion of Steel Pressure Boundary Components and Steam Turbines, VTP Symp. 43, Espoo, Finland, pp. 195-243 (1983).
3. K. Kussmaul, D. Blind, and J. Jansky, Formation and Growth of Cracking in Feed Water Pipes and RPV Nozzles, Nucl. Eng. Des. 81, 105-119 (1984).
4. E. Lenz, B. Stellwag, and N. Wieling, The Influence of Strain Induced Corrosion Cracking on the Crack Initiation in Low Alloy Steels in HT-Water - A Relation Between Monotonic and Cyclic Crack Initiation Behavior, in LAEA Specialists Meeting Corrosion and Stress Corrosion of Steel Pressure Boundary Components and Steam Turbines, VTT Symp. 43, Espoo, Finland, pp. 243-267 (1983).
5. ASME Boiler and Pressure Vessel Code Section HI - Rules for Construction of Nuclear Power Plant Components, The American Society of Mechanical Engineers, New York, 1992 Ed.
6. B. F. Langer, Design of Pressure Vessels for Low-Cycle Fatigue, ASME J. Basic Eng. 84, 389-402 (1962).
7. Tentative Structural Design Basis for Reactor Pressure Vessels and Directly Associated Components (Pressurized, Water Cooled Systems), PB 151987, U.S. Dept. of Commerce, Office of Technical Service, 1 Dec. 1958 Revision.
8. S. Ranganath, J. N. Kass, and J. D. Heald, Fatigue Behavior of Carbon steel Components in High-Temperature Water Environments, in BWR Environmental Cracking Margins for Carbon Steel Piping, EPRI NP-2406, Electric Power Research Institute, Palo Alto, CA, Appendix 3 (May 1982).
9. W. A. Van Der Sluys, Evaluation of the Available Data on the Effect of the Environment on the Low Cycle Fatigue Properties in Light Water Reactor Environments, in Proc. 6th Intl. Symp. on Environmental Degradation of Materials in Nuclear Power Systems - Water Reactors, R. E. Gold and E. P. Simonen, eds., The Metallurgical Society, Warrendale, PA, pp. 1-4 (1993).
10. N. Nagata, S. Sato, and Y. Katada, Low-Cycle Fatigue Behavior of Pressure Vessel Steels in High-Temperature Pressurized Water, ISIJ Intl. 31 (1), 106-114 (1991).
11. M. Higuchi and K. lida, Fatigue Strength Correction Factors for Carbon and Low-Alloy Steels in Oxygen-Containing High-Temperature Water, Nucl. Eng. Des. 129, 293-306 (1991).
NUREG/CR-4667, Vol. 2759
12. M. Higuchi, K. lida, and Y. Asada, Effects of Strain Rate Change on Fatigue Life of Carbon
Steel in High-Temperature Water, in Fatigue and Crack Growth: Environmental Effects,
Modeling Studies, and Design Considerations, PVP Vol. 306, S. Yukawa, ed., American
Society of Mechanical Engineers, New York, pp. 111-116 (1995); also in Proc. Symp. on
Effects of the Environment on the Initiation of Crack Growth, ASTM STP 1298,
American Society for Testing and Materials, Philadelphia (1997).
13. H. Kanasaki, M. Hayashi, K. lida, and Y. Asada, Effects of Temperature Change on
Fatigue Life of Carbon Steel in High Temperature Water, in Fatigue and Crack Growth:
Environmental Effects, Modeling Studies, and Design Considerations, PVP Vol. 306,
S. Yukawa, ed., American Society of Mechanical Engineers, New York, pp. 117-122
(1995).
14. G. Nakao, H. Kanasaki, M. Higuchi, K. lida, and Y. Asada, Effects of Temperature and
Dissolved Oxygen Content on Fatigue Life of Carbon and Low-Alloy Steels in LWR Water
Environment, in Fatigue and Crack Growth: Environmental Effects, Modeling Studies,
and Design Considerations, PVP Vol. 306, S. Yukawa, ed., American Society of
Mechanical Engineers, New York, pp. 123-128 (1995).
15. 0. K. Chopra and W. J. Shack, Effects of LWR Environments on Fatigue Life of Carbon and
Low-Alloy Steels, in Fatigue and Crack Growth: Environmental Effects, Modeling
Studies, and Design Considerations, PVP Vol. 306, S. Yukawa, ed., American Society of
Mechanical Engineers, New York, pp. 95-109 (1995).
16. 0. K. Chopra and W. J. Shack, Evaluation of Effects of LWR Coolant Environments on
Fatigue Life of Carbon and Low-Alloy Steels, in Effects of the Environment on the
Initiation of Crack Growth, ASTM STP 1298, W. A. Van Der Sluys, R. S. Piascik, and
R. Zawierucha, eds., American Society for Testing and Materials, Philadelphia, pp. 247
266 (1997).
17. 0. K. Chopra and W. J. Shack, Low-Cycle Fatigue of Piping and Pressure Vessel Steels in
LWR Environments, Nucl. Eng. Des. 184, 49-76 (1998).
18. 0. K. Chopra and W. J. Shack, Effects of LWR coolant environments on fatigue design
curves of carbon and low-alloy steels, NUREG/CR-6583, ANL-97/18 (March 1998).
19. 0. K. Chopra and W. J. Shack, Fatigue Crack Initiation in Carbon and Low-Alloy Steels in
Light Water Reactor Environments - Mechanism and Prediction, in Fatigue, Environmental
Factors, and New Materials, PVP Vol. 374, H. S. Mehta, R. W. Swindeman, J. A. Todd,
S. Yukawa, M. Zako, W. H. Bamford, M. Higuchi, E. Jones, H. Nickel, and S. Rahman,
eds., American Society of Mechanical Engineers, New York, pp. 155-168 (1998).
20. 0. K. Chopra and W. J. Shack, Overview of Fatigue Crack Initiation in Carbon and Low
Alloy Steels in Light Water Reactor Environments, J. Pressure Vessel Technol. 121, 49-60
(1999).
NUREG/CR-4667, Vol. 27 60
21. M. Fujiwara, T. Endo, and H. Kanasaki, Strain Rate Effects on the Low Cycle Fatigue Strength of 304 Stainless Steel in High-Temperature Water Environment, Fatigue Life: Analysis and Prediction, in Proc. Intl. Conf. and Exposition on Fatigue, Corrosion Cracking, Fracture Mechanics, and Failure Analysis, ASM, Metals Park, OH, pp. 309313 (1986).
22. H. Mimaki, H. Kanasaki, I. Suzuki, M. Koyama, M. Akiyama, T. Okubo, and Y. Mishima, Material Aging Research Program for PWR Plants, in Aging Management Through Maintenance Management, PVP Vol. 332, I. T. Kisisel, ed., American Society of Mechanical Engineers, New York, pp. 97-105 (1996).
23. H. Kanasaki, R. Umehara, H. Mizuta, and T. Suyama, Fatigue Lives of Stainless Steels in PWR Primary Water, Trans. 14th Intl. Conf. on Structural Mechanics in Reactor Technology (SMiRT 14), Lyon, France, pp. 473-483 (1997).
24. H. Kanasaki, R. Umehara, H. Mizuta, and T. Suyama, Effects of Strain Rate and Temperature Change on the Fatigue Life of Stainless Steel in PWR Primary Water, Trans. 14th Intl. Conf. on Structural Mechanics in Reactor Technology (SMiRT 14), Lyon, France, pp. 485-493 (1997).
25. M. Higuchi and K. Iida, Reduction in Low-Cycle Fatigue Life of Austenitic Stainless Steels in High-Temperature Water, in Pressure Vessel and Piping Codes and Standards, PVP Vol. 353, D. P. Jones, B. R. Newton, W. J. O'Donnell, R. Vecchio, G. A. Antaki, D. Bhavani, N. G. Cofie, and G. L. Hollinger, eds., American Society of Mechanical Engineers, New York, pp. 79-86 (1997).
26. M. Hayashi, Thermal Fatigue Strength of Type 304 Stainless Steel in Simulated BWR Environment, Nucl. Eng. Des. 184, 135-144 (1998).
27. M. Hayashi, K. Enomoto, T. Saito, and T. Miyagawa, Development of Thermal Fatigue Testing with BWR Water Environment and Thermal Fatigue Strength of Austenitic Stainless Steels, Nucl. Eng. Des. 184, 113-122 (1998).
28. 0. K. Chopra and D. J. Gavenda, Effects of LWR Coolant Environments on Fatigue Lives of Austenitic Stainless Steels, in Pressure Vessel and Piping Codes and Standards, PVP Vol. 353, D. P. Jones, B. R. Newton, W. J. O'Donnell, R. Vecchio, G. A. Antaki, D. Bhavani, N. G. Cofie, and G. L. Hollinger, eds., American Society of Mechanical Engineers, New York, pp. 87-97 (1997).
29. 0. K. Chopra and D. J. Gavenda, Effects of LWR Coolant Environments on Fatigue Lives of Austenitic Stainless Steels, J. Pressure Vessel Technol. 120, 116-121 (1998).
30. 0. K. Chopra and J. L. Smith, Estimation of Fatigue Strain-Life Curves for Austenitic Stainless Steels in Light Water Reactor Environments, in Fatigue, Environmental Factors, and New Materials, PVP Vol. 374, H. S. Mehta, R. W. Swindeman, J. A. Todd, S. Yukawa, M. Zako, W. H. Bamford, M. Higuchi, E. Jones, H. Nickel, and S. Rahman, eds., American Society of Mechanical Engineers, New York, pp. 249-259 (1998).
NUREG/CR-4667, Vol. 2761
31. 0. K. Chopra, Effects of LWR coolant environments on fatigue design curves of Austenitic
Stainless steels, NUREG/CR-5704, ANL-98/31 (April 1999).
32. S. Majumdar, 0. K. Chopra, and W. J. Shack, Interim Fatigue Design Curves for Carbon,
Low-Alloy, and Austenitic Stainless Steels in LWR Environments, NUREG/CR-5999,
ANL-93/3 (April 1993).
33. J. Keisler, 0. K. Chopra, and W. J. Shack, Fatigue Strain-Life Behavior of Carbon and
Low-Alloy Steels, Austenitic Stainless Steels, and Alloy 600 in LWR Environments,
NUREG/CR-6335, ANL-95/15 (Aug. 1995).
34. J. Keisler, 0. K. Chopra, and W. J. Shack, Statistical Models for Estimating Fatigue
Strain-Life Behavior of Pressure Boundary Materials in Light Water Reactor Environments,
Nucl. Eng. Des. 167, 129-154 (1996).
35. H. S. Mehta and S. R. Gosselin, An Environmental Factor Approach to Account for Reactor
Water Effects in Light Water Reactor Pressure Vessel and Piping Fatigue Evaluations, in
Fatigue and Fracture Volume 1, PVP Vol. 323, H. S. Mehta, ed., American Society of
Mechanical Engineers, New York, pp. 171-185 (1996).
36. K. J. Miller, Damage in Fatigue: A New Outlook, in International Pressure Vessels and
Piping Codes and Standards: Volume 1 - Current Applications, PVP Vol. 313-1, K. R.
Rao and Y. Asada, eds., American Society of Mechanical Engineers, New York, pp. 191
192 (1995).
37. K. J. Miller, Initiation and Growth Rates of Short Fatigue Cracks, in Fundamentals of
Deformation and Fracture, Eshelby Memorial Symposium, Cambridge University Press,
Cambridge, pp. 477-500 (1985).
38. K. Tokaji, T. Ogawa, and S. Osaka, The Growth of Microstructurally Small Fatigue Cracks
in a Ferrite-Pearlite Steel, in Fatigue Fracture Eng. Mater. Struct. 11, 311-342 (1988).
39. D. J. Gavenda, P. R. Luebbers, and 0. K. Chopra, Crack Initiation and Crack Growth
Behavior of Carbon and Low-Alloy Steels, in Fatigue and Fracture 1, Vol. 350,
S. Rahman, K. K. Yoon, S. Bhandari, R. Warke, and J. M. Bloom, eds., American
Society of Mechanical Engineers, New York, pp. 243-255 (1997).
40. K. Obrtlik, J. Poldk, M. Hdjek, and A. Vasek, Short Fatigue Crack Behaviour in 316L
Stainless Steel, Int. J. Fatigue 19, 471-475 (1997).
41. S. G. Sundara Raman, D. Argence, and A. Pineau, High Temperature Short Fatigue Crack
Behaviour in a Stainless Steel, Fatigue Fracture Eng. Mater. Struct. 20, 1015-1031
(1997).
42. F. P. Ford, Overview of Collaborative Research into the Mechanisms of Environmentally
Controlled Cracking in the Low Alloy Pressure Vessel Steel/Water System, in Proc. 2nd Int.
Atomic Energy Agency Specialists' Meeting on Subcritical Crack Growth, NUREG/CP
0067, MEA-2090, Vol. 2, pp. 3-71 (1986).
NUREG/CR-4667, Vol. 27 62
43. H. Hdnninen, K. T6rr~nen, and W. H. Cullen, Comparison of Proposed Cyclic Crack Growth Mechanisms of Low Alloy Steels in LWR Environments, in Proc. 2nd Int. Atomic Energy Agency Specialists' Meeting on Subcritical Crack Growth, NUREG/CP-0067, MEA-2090, Vol. 2, pp. 73-97 (1986).
44. M. E. Mayfield, E. C. Rodabaugh, and R. J. Eiber, A Comparison of Fatigue Test Data on Piping with the ASME Code Fatigue Evaluation Procedure, ASME paper 79-PVP-92, American Society of Mechanical Engineers, New York (1979).
45. A. F. Deardorff and J. K. Smith, Evaluation of Conservatisms and Environmental Effects in ASME Code, Section MI, Class 1 Fatigue Analysis, SAND94-0187, prepared by Structural Integrity Associates, San Jose, CA, under contract to Sandia National Laboratories, Albuquerque, NM (1994).
46. W. A. Van Der Sluys, and S. Yukawa, Status of PVRC Evaluation of LWR Coolant Environmental Effects on the S-N Fatigue Properties of Pressure Boundary Materials, in Fatigue and Crack Growth: Environmental Effects, Modeling Studies, and Design Considerations, PVP Vol. 306, S. Yukawa, ed., American Society of Mechanical Engineers, New York, pp. 47-58 (1995).
47. N. E. Dowling, Crack Growth During Low-Cycle Fatigue of Smooth Axial Specimens, in Cyclic Stress-Strain and Plastic Deformation Aspects of Fatigue Crack Growth, ASTM STP 637, American Society for Testing and Materials, Philadelphia, PA, pp. 97-121 (1977).
48. C. M. Suh, R. Yuuki, and H. Kitagawa, Fatigue Microcracks in a Low Carbon Steel, Fatigue Fracture Eng. Mater. Struct. 8, 193-203 (1985).
49. T. P. O'Donnell and W. J. O'Donnell, Stress Intensity Values in Conventional S-N Fatigue Specimens, in Fatigue and Crack Growth: International Pressure Vessels and Piping Codes and Standards: Volume 1 - Current Applications, PVP Vol. 313-1, K. R. Rao and Y. Asada, eds., American Society of Mechanical Engineers, New York, pp. 195-197 (1995).
50. W. J. Shack and T. F. Kassner, Review of Environmental Effects on Fatigue Crack Growth of Austenitic Stainless Steels, NUREG/CR-6176, ANL-94/1 (1994).
51. J. D. Gilman, R. Rungta, P. Hinds, and H. Mindlan, Corrosion-Fatigue Crack Growth Rates in Austenitic Stainless Steels in Light Water Reactor Environments, Int. J. Pressure Vessel Piping 31, 55-68 (1988).
52. M. E. Indig, J. L. Nelson, and G. P. Wozadlo, Investigation of the Protection Potential Against IASCC, in Proc. 5th Intl. Symp. on Environmental Degradation of Materials in Nuclear Power Systems - Water Reactors, D. Cubicciotti, E. P. Simonen, and R. Gold, eds., American Nuclear Society, La Grange Park, IL, pp. 941-947 (1992).
NUREG/CR-4667, Vol. 2763
53. M. Kodama, S. Nishimura, J. Morisawa, S. Shima, S. Suzuki, and M. Yamamoto, Effects
of Fluence and Dissolved Oxygen on IASCC in Austenitic Stainless Steels, in Proc. 5th Intl.
Symp. on Environmental Degradation of Materials in Nuclear Power Systems - Water
Reactors, D. Cubicciotti, E. P. Simonen, and R. Gold, eds., American Nuclear Society,
La Grange Park, IL, pp. 948-954 (1992).
54. H. M. Chung, W. E. Ruther, J. E. Sanecki, A. G. Hins, and T. F. Kassner, Effect of
Water Chemistry on Intergranular Cracking of Irradiated Austenitic Stainless Steels, in
Proc. 7th Intl. Symp. on Environmental Degradation of Materials in Nuclear Power
Systems - Water Reactors, NACE International, Houston, pp. 1133-1143 (1995),
55. F. Garzarolli, P. Dewes, R. Hahn, and J. L. Nelson, Deformability of High-Purity Stainless
Steels and Ni-Based Alloys in the Core of a PWR, in Proc. 6th Intl. Symp. on
Environmental Degradation of Materials in Nuclear Power Systems - Water Reactors,
R. E. Gold and E. P. Simonen, eds., The Minerals, Metals, and Materials Society,
Warrendale, PA, pp. 607-613 (1993).
56. 1. Suzuki, M. Koyama, H. Kanasaki, H. Mimaki, M. Akiyama, T. Okubo, Y. Mishima,
and T. R. Mager, Stress Corrosion Cracking of Irradiated Stainless Steels in Simulated PWR
Primary Water, in Proc. ASME-JSME 4th Intl. Conf. on Nuclear Engineering, March 10
14, 1996, New Orleans, American Society of Mechanical Engineers, Vol. 5, pp. 205-213
(1996).
57. A. J. Jacobs, G. P. Wozadlo, K. Nakata, T. Yoshida, and I. Masaoka, Radiation Effects on
the Stress Corrosion and Other Selected Properties of Type-304 and Type-316 Stainless
Steels, in Proc. 3rd Int. Symp. Environmental Degradation of Materials in Nuclear Power
Systems - Water Reactors, G. J. Theus and J. R. Weeks, eds., The Metallurgical Society,
Warrendale, PA, p. 673 (1988).
58. K. Fukuya, K. Nakata, and A. Horie, An IASCC Study Using High Energy Ion Irradiation,
in Proc. 5th Intl. Symp. on Environmental Degradation of Materials in Nuclear Power
Systems - Water Reactors, D. Cubicciotti, E. P. Simonen, and R. Gold, eds., American
Nuclear Society, La Grange Park, IL, pp. 814-820 (1992).
59. H. M. Chung, W. E. Ruther, J. E. Sanecki, A. G. Hins, and T. F. Kassner, Stress
Corrosion Cracking Susceptibility of Irradiated Type 304 Stainless Steels, in Effects of
Radiation on Materials: 16th Int. Symp., ASTM STP 1175, A. S. Kumar, D. S. Gelles,
R. K. Nanstad, and T. A. Little, eds., American Society for Testing and Materials,
Philadelphia, pp. 851-869 (1993).
60. H. M. Chung, W. E. Ruther, J. E. Sanecki, and T. F. Kassner, Grain Boundary
Microchemistry and Intergranular Cracking of Irradiated Austenitic Stainless Steels, in Proc.
6th Intl. Symp. on Environmental Degradation of Materials in Nuclear Power Systems
Water Reactors, R. E. Gold and E. P. Simonen, eds., The Minerals, Metals, and
Materials Society, Warrendale, PA, pp. 511-519 (1993).
NUREG/CR-4667, Vol. 27 64
61. J. M. Cookson, D. L. Damcott, G. S. Was, and P. L. Anderson, The Role of Microchemical and Microstructural Effects in the IASCC of High Purity Austenitic Stainless Steels, in Proc. 6th Intl. Symp. on Environmental Degradation of Materials in Nuclear Power Systems Water Reactors, R. E. Gold and E. P. Simonen, eds., The Minerals, Metals, and Materials Society, Warrendale, PA, pp. 573-580 (1993).
62. M. Kodama, J. Morisawa, S. Nishimura, K. Asano, S. Shima, and K. Nakata, Stress Corrosion Cracking and Intergranular Corrosion of Austenitic Stainless Steels Irradiated at 323K, J. Nucl. Mater. 212-215, 1509 (1994).
63. T. Tsukada, Y. Miwa, and H. Nakajima, Stress Corrosion Cracking of Neutron Irradiated Type 304 Stainless Steels, in Proc. 7th Intl. Syrnp. on Environmental Degradation of Materials in Nuclear Power Systems - Water Reactors, NACE International, Houston, pp. 1009-1018 (1995).
64. F. Garzarolli, P. Dewes, R. Hahn, and J. L. Nelson, In-Reactor Testing of IASCC Resistant Stainless Steels, in Proc. 7th Intl. Symp. on Environmental Degradation of Materials in Nuclear Power Systems - Water Reactors, NACE International, Houston, pp. 1055-1065 (1995).
65. H. M. Chung, W. E. Ruther, J. E. Sanecki, A. G. Hins, N. J. Zaluzec, and T. F. Kassner, Irradiation-Assisted Stress Corrosion Cracking of Austenitic Stainless Steels: Recent Progress and New Approaches, J. Nucl. Mater. 239, 61 (1996).
66. J. M. Cookson, G. S. Was, and P. L. Anderson, Oxide-Induced Initiation of Stress Corrosion Cracking in Irradiated Stainless Steel, Corrosion 54, 299 (1998).
67. S. Kasahara, K. Nakata, K. Fukuya, S. Shima, A. J. Jacobs, G. P. Wozadlo, and S. Suzuki, Effects of Minor Elements on IASCC Susceptibility in Austenitic Stainless Steels Irradiated with Neutrons, in Proc. 6th Intl. Symp. on Environmental Degradation of Materials in Nuclear Power Systems - Water Reactors, R. E. Gold and E. P. Simonen, eds., The Minerals, Metals, and Materials Society, Warrendale, PA, pp. 615-623 (1993).
68. A. J. Jacobs, G. P. Wozadlo, K. Nakata, S. Kasahara, T. Okada, S. Kawano, and S. Suzuki, The Correlation of Grain Boundary Composition in Irradiated Stainless Steel with IASCC Resistance, in Proc. 6th Intl. Symp. on Environmental Degradation of Materials in Nuclear Power Systems - Water Reactors, R. E. Gold and E. P. Simonen, eds., The Minerals, Metals, and Materials Society, Warrendale, PA, pp. 597-606 (1993).
69. A. Jenssen and L. G. Ljungberg, Irradiation Assisted Stress Corrosion Cracking Postirradiation CERT Tests of Stainless Steels in a BWR Loop, in Proc. 7th Intl. Symp. on Environmental Degradation of Materials in Nuclear Power Systems - Water Reactors, NACE International, Houston, pp. 1043-1052 (1995).
70. Y. Miwa, T. Tsukada, S. Jitsukawa, S. Kita, S. Hamada, Y. Matsui, and M. Shindo, Effect of Minor Elements on Irradiation Assisted Stress Corrosion Cracking of Model Stainless Steels, J. Nucl. Mater. 233-237, 1393 (1996).
NUREG/CR-4667, Vol. 2765
71. T. Tsukada, Y. Miwa, and H. Nakajima, Effects of Minor Elements on IASCC of Type 316
Model Stainless Steels, in Proc. 8th Intl. Symp. on Environmental Degradation of
Materials in Nuclear Power Systems - Water Reactors, S. M. Bruemmer, ed., American
Nuclear Society, La Grange Park, pp. 795-802 (1997).
72. H. M. Chung, J.-H. Park, W. E. Ruther, J. E. Sanecki, R. V. Strain, and N. J. Zaluzec,
Fabrication-Related Impurity Contamination and Stress Corrosion Cracking of Austenitic
Stainless Steel Core-Internal Components, in Proc. 8th Intl. Symp. on Environmental
Degradation of Materials in Nuclear Power Systems - Water Reactors, S. M. Bruemmer,
ed., American Nuclear Society, La Grange Park, pp. 846-856 (1997).
73. G. Taguchi, Quality Engineering Using Robust Design, M. S. Phadke, Ed., Prentice Hall,
Engelwood Cliffs, NJ (1989).
74. H. M. Chung, W. E. Ruther, R. V. Strain, and T. M. Karlsen, Slow Strain Rate Tensile
Testing of Model Austenitic Stainless Steels Irradiated in the Halden Reactor, in
Environmentally Assisted Cracking in Light Water Reactors, Semiannual Report,
January-June 1998, NUREG/CR-4667, Vol. 26, ANL-98/30, pp. 10-21 (March 1999).
75. S. M. Bruemmer et al., Critical Issue Reviews for the Understanding and Evaluation of
Irradiation-Assisted Stress Corrosion Cracking, EPRI TR-107159, Electric Power Research
Institute, Palo Alto, CA (1996).
76. M. L. Herrera, et al., Evaluation of the Effects of Irradiation on the Fracture Toughness of
BWR Internal Components, in Proc. ASME/JSME 4th Intl. Conf. on Nucl. Eng. (ICONE
4) Vol. 5, A. S. Rao, R. M. Duffey, and D. Elias, Eds., American Society of Mechanical
Engineers, New York, pp. 245-251 (1996)
77. W. J. Mills, Fracture Toughness of Type 304 and 316 Stainless Steels and their Welds, Intl.
Mater. Rev. 42, 45-82 (1997).
78. P. J. Maziasz and C. J. McHargue, Microstructural Evolution in Annealed Austenitic Steels
during Neutron Irradiation, Int. Met. Rev. 32, 190 (1987).
79. P. J. Maziasz, Overview of Microstructural Evolution in Neutron-Irradiated Austenitic
Stainless Steels, J. Nucl. Mater. 205, 118-145 (1993).
80. F. A. Garner, Evolution of Microstructures in Face-Centered Cubic Metals during Neutron
Irradiation, J. Nucl. Mater. 205, 98-111 (1993).
81. J. Dufresne, B. Henry, and H. Larsson, Fracture Toughness of Irradiated AISI 304 and
316L Stainless Steels, in Effects of Radiation on Structural Materials, ASTM STP 683,
J. A. Sprague and D. Kramer, Eds., American Society for Testing and Materials,
Philadelphia, pp. 511-528 (1979).
82. C. Picker, A. L. Stott, and H. Cocks, H., Effects of Low-Dose Fast Neutron Irradiation on
the Fracture Toughness of Type 316 Stainless Steel and Weld Metal, in Proc. Specialists
Meeting on Mechanical Properties of Fast Reactor Structural Materials, Chester, UK,
Paper IWGFR 49/440-4 (1983).
NUREG/CR-4667, Vol. 27 66
83. F. H. Huang, The Fracture Characterization of Highly Irradiated Type 316 Stainless Steel, Int. J. Fracture 25, 181-193 (1984).
84. J. Bernard and G. Verzeletti, Elasto-Plastic Fracture Mechanics Characterization of Type 316H Irradiated Stainless Steel up to 1 dpa, IN Effects of Radiation on Materials: Twelfth Intl. Symp., ASTM STP 870, F. A. Garner and J. S. Perrin, Eds., American Society for Testing and Materials, Philadelphia, pp. 619-641 (1985).
85. W. J. Mills, Irradiation Effects on the Fracture Toughness of Austenitic Fe-Cr-Ni Alloys, HEDL-TME-82-17, Hanford Engineering Development Laboratory (1985).
86. W. J. Mills, Fracture Toughness of Irradiated Stainless Steel Alloys, Nucl. Technol. 82, 290-303 (1988).
87. D. J. Michel and R. A. Gray, 1987, Effects of Irradiation on the Fracture Toughness of FBR
Structural Materials, J. Nucl. Mater. 148, 194-203 (1987).
88. P. Ould, P. Balladon, and Y. Meyzaud, Bull Cercle Etud. Metaux 15, 31.1-31.12 (1988).
89. E. V. Van Osch, M. G. Horsten, and M. I. De Vries, Fracture Toughness PWR Internals, ECN Contribution to CEC Contract on PWR Internals-Part 2 (ETNU/CT/94/0136-F), ECN-I-97-010 (71747/NUC/EvO/mh/006274), Netherland Energy Research Foundation ECN, Petten, the Netherlands (1997).
90. T. H. Hughes and E. E. Gruber, Development of Hot-Cell J-R Test Facility, in Environmentally Assisted Cracking in Light Water Reactors Semiannual Report July 1996-December 1996, NUREG/CR-4667, Vol. 23, ANL-97/10, pp. 42-52 (1997).
91. E. E. Gruber and 0. K. Chopra, Fracture Toughness J-R Test of Austenitic Stainless Steels Irradiated in Halden Reactor, in Environmentally Assisted Cracking in Light Water Reactors Semiannual Report January 1997-June 1997, NUREG/CR-4667, Vol. 24, ANL-98/6, pp. 54-65 (1998).
92. A. L. Hiser, Fracture Toughness Chracterization of Nuclear Piping Steels, NUREG/CR5118, MEA-2325, Materials Engineering Associates, Inc., Lanham, MD (1989).
93. G. M. Wilkowski, et al, Degraded Piping Program - Phase II, Semiannual Report, NUREG/CR-4082, Vol. 2, (1985).
94. M. G. Vassilaros, R. A. Hays, and J. P. Gudas, Investigation of the Ductile Fracture Properties of Type 304 Stainless Steel Plate, Welds, and 4-Inch Pipe, in Proc. 12th Water Reactor Safety Information Meeting, NUREG/CP-0058, Vol. 4, U.S. Nuclear Regulatory Commission, pp. 176-189 (1985).
95. W. E. Ruther, W. K. Soppet, and T. F. Kassner, Environmentally Assisted Cracking of Alloys 600 and 690 in Simulated LWR Water, in Environmentally Assisted Cracking in Light Water Reactors, Semiannual Report, July 1997-December 1997, NUREG/CR-4667 Vol. 25, ANL-98/18, pp. 42-75 (Sept. 1998).
NUREG/CR-4667, Vol. 2767
96. W. E. Ruther, W. K. Soppet, T. F. Kassner, and W. J. Shack, Environmentally Assisted
Cracking of Alloys 600 and 690 in Simulated LWR Water, in Environmentally Assisted
Cracking in Light Water Reactors, Semiannual Report, January 1998-June 1998,
NUREG/CR-4667 Vol. 26, ANL-98/18, pp. 25-32 (March 1999).
97. F. P. Ford, Quantitative Prediction of Environmentally Assisted Cracking, Corrosion, 52,
375-395 (1997).
98. F. P. Ford, D. F. Taylor, P. L. Andresen, and R. Ballinger, Corrosion-Assisted Cracking of
Stainless and Low-alloy Steels, EPRI NP-5064s, Electric Power Research Institute, Palo
Alto, CA (Feb. 1987).
99. T. Shoji, Quantitative Prediction of Environmentally Assisted Cracking Based on Crack Tip
Strain Rate, in Proc. Conf. on Predictive Capabilities in Environmentally-Assisted
Cracking, R. Rungta, ed., PVP Vol. 99, American Society of Mechanical Engineers, New
York, pp. 127-142 (1985).
100. W. J. Shack and T. F. Kassner, Review of Environmental Effects on Fatigue Crack Growth
of Austenitic Stainless Steels, NUREG/CR-6176, ANL-94/1 (May 1994).
101. J. D. Gilman, R. Rungta, P. Hinds, and H. Mindlin, Corrosion-fatigue Crack-growth
Rates in Austenitic Stainless Steels in Light Water Reactor Environments, Int. J. Pressures
Vessels and Piping, 31, 55-68 (1988).
102. E. D. Eason, E. E. Nelson, and J. D. Gilman, Technical Basis for a Revised Fatigue Crack
Growth Rate Reference Curve for Ferrttic Steels in Light Water Reactor Environments, in
Welding Research Council Bulletin 404, Report No. 3, pp 38-51 (1995).
103. L. A. James and D. P. Jones, Fatigue Crack Growth Correlation for Austenitic Stainless
Steels in Air, in Proc. Conf. on Predictive Capabilities in Environmentally-Assisted
Cracking, R. Rungta, ed., PVP Vol. 99, American Society of Mechanical Engineers, New
York, pp. 363-414 (1985).
104. W. E. Ruther, W. K. Soppet, and T. F. Kassner, Effect of Temperature and Ionic Impurities
at Very Low Concentrations on Stress Corrosion Cracking of AISI 304 Stainless Steel,
Corrosion 44, 791-799 (1988).
105. W. E. Ruther, W. K. Soppet, and T. F. Kassner, Influence of Environment and
Temperature on Crack Growth of Type 304 SS under Cyclic Loading in Simulated BWR
Quality Water, in Environmentally Assisted Cracking in Light Water Reactors, Annual
Report, October 1983-September 1984, NUREG/CR-4287 ANL-85-33, pp. 110-114
(1985).
NUREG/CR-4667, Vol. 27 68
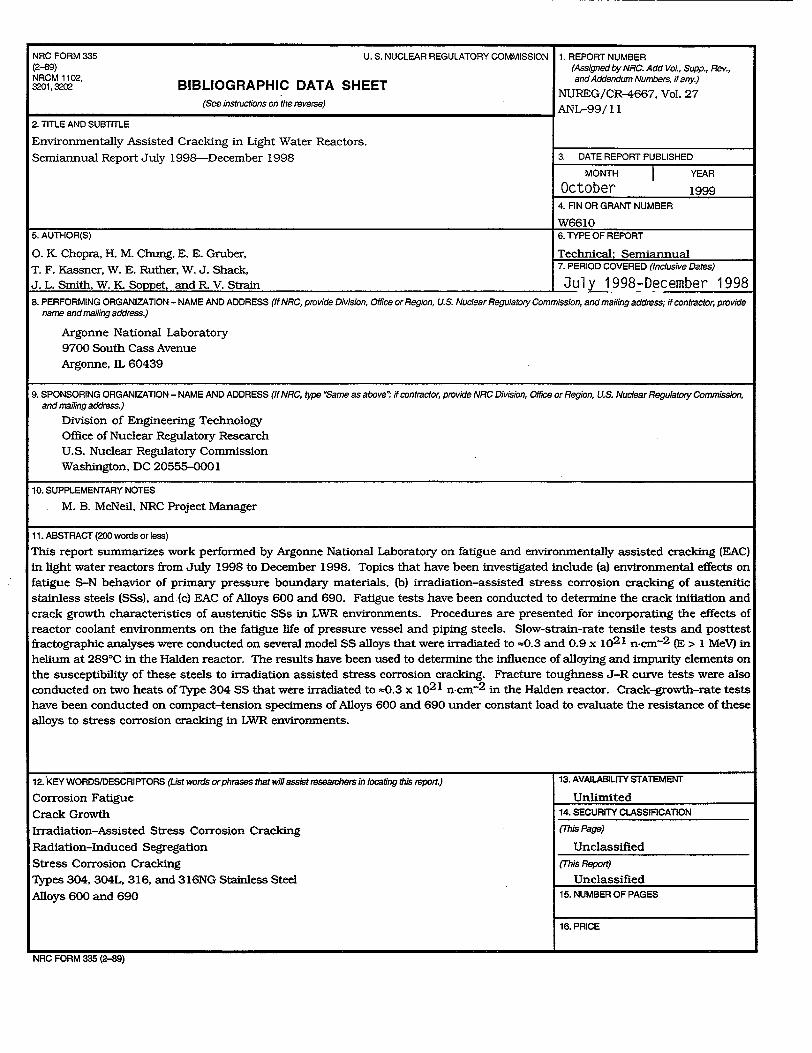
NRC FORM 335 U.S. NUCLEAR REGULATORY COMMISSION 1. REPORT NUMBER (2-89) (Assigned by NRC. Add Vol., Supp., Rev., NRCM 1102, and Addendum Numbers, if any.) 32O1,3202 BIBLIOGRAPHIC DATA SHEET NUREGICR-4667, Vol.27
(See instructions on the reverse) ANL-99/11
2. TITLE AND SUBTITLE
Environmentally Assisted Cracking in Light Water Reactors.
Semiannual Report July 1998-December 1998 3. DATE REPORT PUBLISHED
MONTH YEAR
October 1999 4. FIN OR GRANT NUMBER
W6610
5. AUTHOR(S)
0. K Chopra, H. M. Chung, E. E. Gruber,
6. TYPE OF REPORT
Technical: SemiannualT. F. Kassner, W. E. Ruther, W. J. Shack, 7. PERIOD COVERED (Inclusive Dates)
J. L. Smith, W. K. Soppet, and R V. Strain Jul y 1998-December 1998 8. PERFORMING ORGANIZATION - NAME AND ADDRESS (If NRC, provide Division, Office or Region, U.S. Nuclear Regulatory Commission, and mailing address; if contractor, provide
name and mailing address.)
Argonne National Laboratory 9700 South Cass Avenue Argonne, IL 60439
9. SPONSORING ORGANIZATION - NAME AND ADDRESS (If NRC, type "Same as above'" if contractor, provide NRC Division, Office or Region, U.S. Nuclear Regulatory Commission, and mailing address.)
Division of Engineering Technology Office of Nuclear Regulatory Research U.S. Nuclear Regulatory Commission Washington, DC 20555-0001
10. SUPPLEMENTARY NOTES
M. B. McNeil, NRC Project Manager
11. ABSTRACT (200 words or less)
This report summarizes work performed by Argonne National Laboratory on fatigue and environmentally assisted cracking (EAC)
in light water reactors from July 1998 to December 1998. Topics that have been investigated include (a) environmental effects on
fatigue S-N behavior of primary pressure boundary materials, (b) irradiation-assisted stress corrosion cracking of austenitic
stainless steels (SSs), and (c) EAC of Alloys 600 and 690. Fatigue tests have been conducted to determine the crack initiation and crack growth characteristics of austenitic SSs in LWR environments. Procedures are presented for incorporating the effects of
reactor coolant environments on the fatigue life of pressure vessel and piping steels. Slow-strain-rate tensile tests and posttest fractographic analyses were conducted on several model SS alloys that were irradiated to =0.3 and 0.9 x 10²¹ n-cm-2 (E > 1 MeV) in
helium at 289°C in the Halden reactor. The results have been used to determine the influence of alloying and impurity elements on the susceptibility of these steels to irradiation assisted stress corrosion cracking. Fracture toughness J-R curve tests were also conducted on two heats of Type 304 SS that were irradiated to =0.3 x 10²¹ n-cm- 2 in the Halden reactor. Crack-growth-rate tests
have been conducted on compact-tension specimens of Alloys 600 and 690 under constant load to evaluate the resistance of these alloys to stress corrosion cracking in LWR environments.
12. 'KEY WORDS/DESCRIPTORS (List words or phrases that will assist researchers in locating this report.) 13. AVAILABILITY STATEMENT
Corrosion Fatigue Unlimited
Crack Growth 14. SECURITY CLASSIFICATION
Irradiation-Assisted Stress Corrosion Cracking (This Page)
Radiation-Induced Segregation Unclassified
Stress Corrosion Cracking (This Report)
Types 304, 304L, 316, and 316NG Stainless Steel Unclassified
Alloys 600 and 690 15. NUMBER OF PAGES
16. PRICE
NRC FORM 335 (2-89)
Federal Recycling Program
.I--- . -- -- l -v• -•. J, mil v •XVU•MrIN IALLY ASIS IlED CRACKING IN LIGHT WATER REACTORS
UNITED STATES NUCLEAR REGULATORY COMMISSION
WASHINGTON, DC 20555-0001
SPECIAL STANDARD MAIL POSTAGE AND FEES PAID
USNRC PERMIT NO. G-67
OFFICIAL BUSINESS PENALTY FOR PRIVATE USE, $300
--4 o) C
-nfLn < C-)
-, I I Zvi
Za 02'3CDU
-41 -10 " 7JUU
orT'ý---4 -
0(X)
z
>2:1
0 p., o m TJ
rTJ
z
0
Ai
OCTOBER 1999
NRC FORM 33W (2-89)
U.S. N NRCM 1102, 3201,3W2 BIBLIOGRAPHIC DATA SHEET
(See instructions on the reverse)
2. TITLE AND SUBTITLE Environmentally Assisted Cracking in Light Water Reactors. Semiannual Report July 1 9 9 8 -December 1998
!UCLEAR REGULATORYCOMTISSION 1. REPORT NUMBER (Assigned by NRC. Add Vol., Supp., Rev., and Addendum Numbers, if any.)
NUREG/CR-4667, Vol. 27 SANL--99/1 1
3. DATE REPORT PUBLISHED
MONTH YEAR
October 1999 4. FIN OR GR•ANT NUMBER
5. AUI HRR(S) W6610 5.6 AUTH R(S OF REPORT 0. I, Chopra, H. M. Chung, E. E. Gruber,
TYPE Sm RE nnua T. F. Kassner, W. E. Ruther, W. j. Shack, Technical; Semiannual 7. PERIOD COVERED (Inclusive Dates) J. L. Smith, W. K_ Soppet, and R; V. Strain
JU y 1998-December 1998 B. PERFORMING ORGANIZATION - NAME AND ADDRESS (If NRC, provide Division, OfficeoriPRgion, U. Nudest Fisgaatrsy Commission and mailing address; if contractor, provide name and mailing address.)
Argonne National Laboratory 9700 South Cass Avenue Argonne, IL 60439
9. SPONSORING ORGANIZATION - NAME AND ADDRESS (If NRC, type 'Same as above'. if contractor, provide NRC Diiibn, Office or Region, U.S. Nuclear Regulatory Commission, and mailing address.) Division of Engineering Technology Office of Nuclear Regulatory Research U.S. Nuclear Regulatory Commission Washington, DC 20555-0001
10. SUPPLEMENTARY NOTES
M. B. McNeil, NRC Project Manager
11. ABSTRACT (200 words or less) This report summarizes work performed by Argonne National Laboratory on fatigue and environmentally assisted cracking (EAC) in light water reactors from July 1998 to December 1998. Topics that have been investigated include (a) environmental effects on fatigue S-N behavior of primary pressure boundary materials, (b) irradiation-assisted stress corrosion cracking of austenitic stainless steels (SSs), and (c) EAC of Alloys 600 and 690. Fatigue tests have been conducted to determine the crack initiation and crack growth characteristics of austenitic SSs in LWR environments. Procedures are presented for incorporating the effects of reactor coolant environments on the fatigue life of pressure vessel and piping steels. Slow-strain-rate tensile tests and posttest fractographic analyses were conducted on several model SS alloys that were irradiated to =0.3 and 0.9 x 10²¹ n-cm- 2 (E > I MeV) in helium at 2890 C in the Halden reactor. The results have been used to determine the influence of alloying and impurity elements on the susceptibility of these steels to irradiation assisted stress corrosion cracking. Fracture toughness J-R curve tests were also conducted on two heats of Type 304 SS that were irradiated to =0.3 x 10²¹ n-cm- 2 in the Halden reactor. Crack-growth-rate tests have been conducted on compact-tension specimens of Alloys 600 and 690 under constant load to evaluate the resistance of these alloys to stress corrosion cracking in LWR environments.
12. 1KEY WORDS/DESCRIPTORS (List words or phrases that will assist researchers in locating this report.) 13. AVAILABILITY STATEMENT Corrosion Fatigue C rack rowthUnlimited
Crack Growth 14. SECURITY CLASSIFICATION Irradiation-Assisted Stress Corrosion Cracking (This ae) Radiation-Induced Segregation
Unclassified Stress Corrosion Cracking (Uhis R ePon) Types 304, 304L, 316, and 316NG Stainless Steel
Unclassified Alloys 600 and 690 UnclAS
15. NUMBER OF PAGES
16. PRICE
NRC FORM 335 (2-89)