Embed Size (px)
Citation preview
September 2006 NSF 06/ARS1/EPADWCTR
EPA/600/R-06/099
Environmental Technology Verification Report
Removal of Arsenic in Drinking Water
ARS USA, LLC ARS CFU-50 APC Electroflocculation and Filtration Water Treatment System
Prepared by
NSF International
Under a Cooperative Agreement with U.S. Environmental Protection Agency
THE ENVIRONMENTAL TECHNOLOGY VERIFICATION PROGRAM
U.S. Environmental Protection Agency NSF International
ETV Joint Verification Statement TECHNOLOGY TYPE: ELECTROFLOCCULATION AND MEDIA FILTRATION
USED IN DRINKING WATER TREATMENT SYSTEMS
APPLICATION: REMOVAL OF ARSENIC IN DRINKING WATER
TECHNOLOGY NAME: ARS CFU-50 APC ELECTROFLOCCULATION AND FILTRATION WATER TREATMENT SYSTEM
COMPANY: ARS USA, LLC
ADDRESS: PO Box 1170 PHONE: (505) 771-4344 Bernalillo, NM 87004 FAX: (505) 771-4345
WEB SITE: www.arsusa.com EMAIL: [email protected]
The U.S. Environmental Protection Agency (EPA) supports the Environmental Technology Verification (ETV) Program to facilitate the deployment of innovative or improved environmental technologies through performance verification and dissemination of information. The goal of the ETV Program is to further environmental protection by accelerating the acceptance and use of improved and more cost-effective technologies. ETV seeks to achieve this goal by providing high-quality, peer-reviewed data on technology performance to those involved in the design, distribution, permitting, purchase, and use of environmental technologies.
ETV works in partnership with recognized standards and testing organizations, stakeholder groups (consisting of buyers, vendor organizations, and permitters), and with the full participation of individual technology developers. The program evaluates the performance of innovative technologies by developing test plans that are responsive to the needs of stakeholders, conducting field or laboratory tests (as appropriate), collecting and analyzing data, and preparing peer-reviewed reports. All evaluations are conducted in accordance with rigorous quality assurance protocols to ensure that data of known and adequate quality are generated and that the results are defensible.
NSF International (NSF), in cooperation with the EPA, operates the Drinking Water Systems (DWS) Center, one of six technology areas under the ETV Program. The DWS Center recently evaluated the performance of an electroflocculation and media filtration system for the removal of arsenic from drinking water. This verification statement provides a summary of the test results for the ARS CFU-50 APC Electroflocculation and Filtration Water Treatment System (ARS CFU-50 APC). The NSF Drinking Water Treatment Systems Laboratory (DWTS) was the field testing organization (FTO) that performed the verification testing. The verification report contains a comprehensive description of the complete verification test.
06/ARS1/EPADWCTR The accompanying notice is an integral part of this verification statement. September 2006
VS-i
ABSTRACT
Verification testing of the ARS CFU-50 APC Electroflocculation and Filtration Water Treatment System (ARS CFU-50 APC) for arsenic removal was conducted at the Town of Bernalillo Well #3 site from April 18 through May 2, 2006. The source water was chlorinated groundwater from two supply wells, and the feed water for the verification test was withdrawn from the pressure tank at the site. Verification testing was conducted at the operating conditions specified by the manufacturer. The feed water, with a pH in the range of 7.6 to 7.9, was pumped into a reaction vessel where electricity is applied to aluminum and graphite plates to create flocculent to which arsenic adsorbs. When operated under the manufacturer’s specified conditions at this site, at an average flow rate of 32.1 gallons per minute (gpm), the ARS CFU-50 APC reduced the total arsenic concentration from an average of 12 micrograms per liter (µg/L) in the feed (untreated) water to 6 µg/L in the filtrate (treated) water.
TECHNOLOGY DESCRIPTION
The following technology description was provided by the manufacturer and has not been verified.
The ARS CFU-50 APC is a standard, full-scale, modular system for the removal of arsenic and other contaminants from water. The ARS CFU-50 APC is a self-contained, complete system that connects to a water supply source. If the source is not pressurized, a pump, supplied with the unit, is used to pump the water through the treatment system. The ARS CFU-50 APC requires a three-phase 480-volt AC electric power source to operate the reaction vessel, programmable logic controller (PLC), and ancillary equipment. The system used for this test is designed to treat flows up to a maximum flow rate of approximately 35 gpm (50,000 gallons per day [gpd]), from either a pressurized or unpressurized water source.
Untreated/contaminated water enters the unit through a regulated influent pipe. The flocculent generation and decontamination process occurs in the reaction vessel in a continuous process. Flocculent particles in the holding pipe/tank are subject to further growth and reaction after the electrolytic process. Sand filters separate the flocculent from the treated water. The filter surfaces are cleaned by automatic backwashing, and the flocculation sludge is flushed into the floc water reservoir tank. The low volume, thickened flocculation sludge accumulated in the floc water reservoir tank is pumped into the filter press by a pump, where it is pressed into a filter cake. After the treated water passes through the filter press, it is stored in the clean water tank for later use in filter backwashing and rinsing. As the clean water tank level reaches its maximum level, it is pumped out of the unit through the filtrate water pipe.
The ARS CFU-50 APC treatment system is fully automated and programmed to control all aspects of the treatment and filter operation. The control system automatically initiates backwash cycles based on an inlet pressure level set by the operator. The backwash cycle time is a fixed time duration that is programmed in the PLC. The control system monitors data from the system operation. This information is available to the on-site operator.
VERIFICATION TESTING DESCRIPTION
Test Site
The Bernalillo Well #3 site is a fenced property that includes a building that houses the well pump and chlorination equipment, a primary storage tank (approximately 1,000,000 gallons [gal]), and a secondary storage tank (approximately 200,000 gal). Water pumped at the site is a mixture from two wells, both of which pump water from the Rio Grande Group aquifer. The average daily water use for the Town of Bernalillo is approximately 2,000,000 gpd. Water quality data based on data collected between June 2002 and March 2004 shows total arsenic in the combined well water ranges from 14 to 68 µg/L and the primary arsenic species is arsenic (V). The water has a total hardness of approximately 70 to 90 milligrams per liter (mg/L) as CaCO3 and the pH is approximately 7.3.
06/ARS1/EPADWCTR The accompanying notice is an integral part of this verification statement. September 2006
VS-ii
Methods and Procedures
Operations, sampling, and analyses were performed in accordance with the Product Specific Test Plan (PSTP) developed and approved for this verification test. The PSTP included a Quality Assurance Project Plan (QAPP) to assure the quality of the data collected and to provide an accurate evaluation of the treatment system under field conditions. Testing included characterization of the feed water, an arsenic loss test (no electricity supplied to the reaction vessel), and a 14-day verification test.
The verification test was performed from April 18, through May 1, 2006. The ARS CFU-50 APC was operated for the 14-day verification test by using water supplied from the Town of Bernalillo. Flow rate, production volume, water temperature, and system pressure were monitored and recorded daily. Feed and filtrate (treated) water samples were analyzed on-site for pH, temperature, turbidity, free and total residual chlorine, color, and dissolved oxygen (DO) by the field operator. Grab samples were collected and delivered to the NSF Analytical Laboratory and were analyzed for alkalinity, aluminum, calcium, magnesium, iron, manganese, sulfate, chloride, total organic carbon (TOC), total suspended solids (TSS), and fluoride. Samples for total arsenic were collected daily, plus 14 samples were collected during a 48-hour intensive survey. In addition to the samples for total arsenic, arsenic samples were speciated during the test to determine the soluble arsenic concentration and the concentrations of arsenic (III) and the arsenic (V) present in the soluble fraction.
Complete descriptions of the verification testing results and quality assurance/quality control (QA/QC) procedures are included in the verification report.
VERIFICATION OF PERFORMANCE
System Operation
ARS performed the system startup and shakedown testing, which included optimization of the electrical feed rates (30 amps) to the reaction vessel. The verification test was conducted under the manufacturer’s specified operating conditions. The backwash system was set to backwash when the pressure differential across the filter exceeded 15 pounds per square inch (psi).
System pressure was monitored at the filter influent and filtrate. Head loss fluctuated between 6.4 and 15.9 psi during the inspections. The ARS CFU-50 APC PLC was not programmed to record pressure differentials at the start of backwash cycles, so the pressure differential evaluation for this verification was limited to whether the differential exceeded 15 psi during the time the FTO personnel inspected the device.
During the test, there were a total of four incidences (April 20, 21, 28, and 30) where a sensor triggered the PLC to shut down operations. During each incident, the sensor indicated that either the floc water reservoir tank had exceeded capacity or the filter press alarm went off. In each instance, the filter press had clogged to a point where it was prohibiting sufficient filtration to maintain the device’s rated throughput. ARS personnel recommended that the filter press be cleaned a minimum of once every 24 hours to prevent the ARS CFU-50 APC from automatically shutting down. After each shutdown incident, FTO personnel cleaned the filter press and resumed operation in accordance with the startup procedures outlined in the ARS Operations and Maintenance (O&M) manual. As a result of these incidents, the ARS CFU-50 APC experienced approximately 36 hours of downtime during the 14-day verification test.
The filtrate flow rate was 32.1 gpm over the 14 days. The total filtrate volume produced each day was also consistent, except for those days when operating time was lost due to the filter press alarm shutting down the system.
Water Quality Results
The results of total arsenic analyses are shown in Figure VS-1. The feed water total arsenic averaged 12 µg/L with most of the arsenic as arsenic (III), but with some arsenic (V) also present. The filtrate water total arsenic concentration averaged 6 µg/L. The data collected during the 48-hour intensive survey were 06/ARS1/EPADWCTR The accompanying notice is an integral part of this verification statement. September 2006
VS-iii
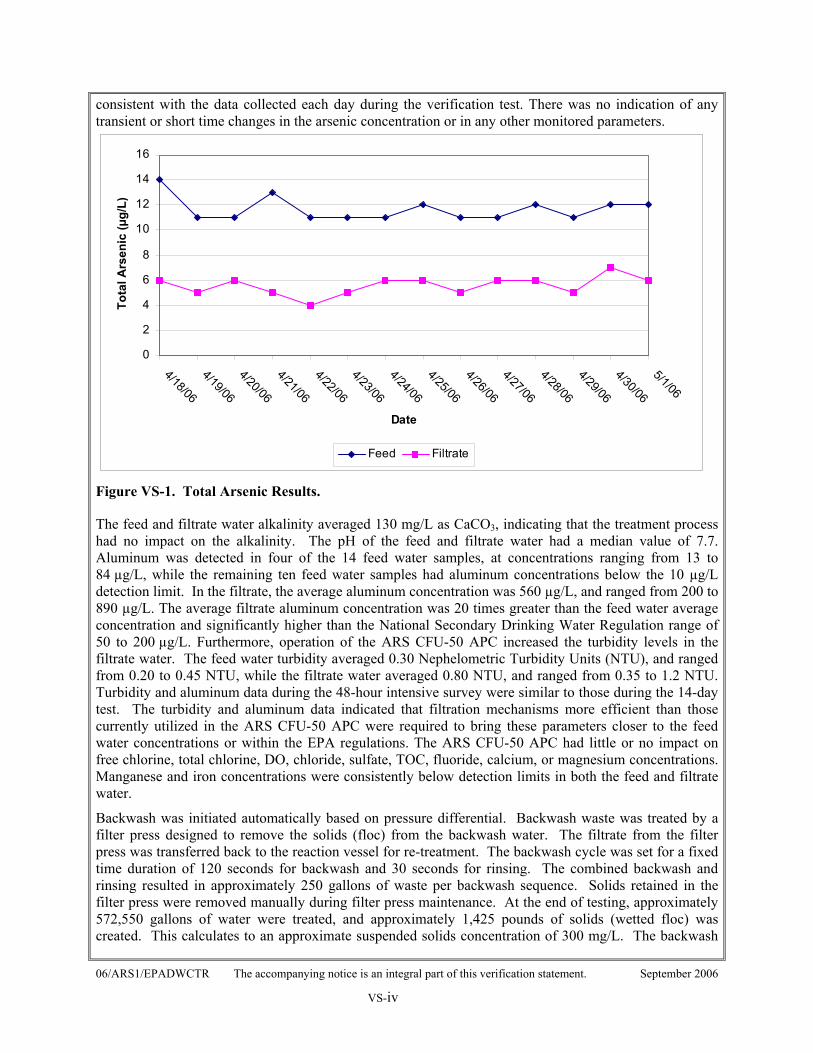
consistent with the data collected each day during the verification test. There was no indication of any transient or short time changes in the arsenic concentration or in any other monitored parameters.
0
2
4
6
8
10
12
14
16
4/18/06 4/19/06
4/20/06 4/21/06
4/22/06 4/23/06
4/24/06
4/25/06 4/26/06
4/27/06 4/28/06
4/29/06
4/30/06
5/1/06
Date
Tota
l Ars
enic
(µg/
L)
Fe e d Fi l t r a t e
Figure VS-1. Total Arsenic Results.
The feed and filtrate water alkalinity averaged 130 mg/L as CaCO3, indicating that the treatment process had no impact on the alkalinity. The pH of the feed and filtrate water had a median value of 7.7. Aluminum was detected in four of the 14 feed water samples, at concentrations ranging from 13 to 84 µg/L, while the remaining ten feed water samples had aluminum concentrations below the 10 µg/L detection limit. In the filtrate, the average aluminum concentration was 560 µg/L, and ranged from 200 to 890 µg/L. The average filtrate aluminum concentration was 20 times greater than the feed water average concentration and significantly higher than the National Secondary Drinking Water Regulation range of 50 to 200 µg/L. Furthermore, operation of the ARS CFU-50 APC increased the turbidity levels in the filtrate water. The feed water turbidity averaged 0.30 Nephelometric Turbidity Units (NTU), and ranged from 0.20 to 0.45 NTU, while the filtrate water averaged 0.80 NTU, and ranged from 0.35 to 1.2 NTU. Turbidity and aluminum data during the 48-hour intensive survey were similar to those during the 14-day test. The turbidity and aluminum data indicated that filtration mechanisms more efficient than those currently utilized in the ARS CFU-50 APC were required to bring these parameters closer to the feed water concentrations or within the EPA regulations. The ARS CFU-50 APC had little or no impact on free chlorine, total chlorine, DO, chloride, sulfate, TOC, fluoride, calcium, or magnesium concentrations. Manganese and iron concentrations were consistently below detection limits in both the feed and filtrate water.
Backwash was initiated automatically based on pressure differential. Backwash waste was treated by a filter press designed to remove the solids (floc) from the backwash water. The filtrate from the filter press was transferred back to the reaction vessel for re-treatment. The backwash cycle was set for a fixed time duration of 120 seconds for backwash and 30 seconds for rinsing. The combined backwash and rinsing resulted in approximately 250 gallons of waste per backwash sequence. Solids retained in the filter press were removed manually during filter press maintenance. At the end of testing, approximately 572,550 gallons of water were treated, and approximately 1,425 pounds of solids (wetted floc) was created. This calculates to an approximate suspended solids concentration of 300 mg/L. The backwash
06/ARS1/EPADWCTR The accompanying notice is an integral part of this verification statement. September 2006
VS-iv
solids were not considered a hazardous waste, based on Toxicity Characteristic Leaching Procedure (TCLP) metals analyses, which were below the regulatory limits under the Resource Conservation and Recovery Act (RCRA).
Operation and Maintenance Results
The ARS CFU-50 APC was found to be easy to operate and required little time for daily maintenance. The field staff was on-site for two to three hours per day. Most of the time on-site was spent performing field activities, including flow checks, calibrations, cleaning the filter press, and other verification-related activities.
The ARS CFU-50 APC O&M manual provides a detailed description of the system, appropriate safety precautions, and detailed descriptions of operating procedures, capability and operation of the computer control system, and specific instructions for utility operators. The maintenance section of the manual includes some descriptions of required maintenance, but refers the reader to the individual equipment literature supplied by the various pump and instrument manufacturers. A review of the O&M manual shows that the manual is well organized and easy to read.
The ARS CFU-50 APC was equipped with two sand filters, so that one filter could be in operation while the other was in backwash mode or standby. During the testing at this installation, there were no conditions where the pressure differential across both sand filters required that both filters backwashed at the same time. Issues regarding the efficacy of the filtration process, as shown in the aluminum and turbidity data, were noted during the verification test.
Backwash waste was treated by a filter press designed to remove the solids from the backwash water. During the testing, when the flocculent caked in the filter press to a point where water would no longer pass through it, the PLC shut down the entire system, as it was programmed to do. When this occurred, field personnel cleaned the filter press and restarted the system. Verification testing substantiated the importance of the filter press and its appropriate maintenance as a critical aspect of the function of the ARS CFU-50 APC.
The system PLC was designed to operate and monitor many of the operating functions of the device. The PLC readings were easy to use, but required an understanding of the PLC operating keys to display the readings. The PLC was not programmed to record data, so readouts on component performance, such as flow, pressure, and electrical settings had to be monitored and recorded manually. Because the PLC did not record data, information regarding the duration of filter runs, frequency of backwash cycles, and the pressure differentials across the sand filters could not be accurately recorded. The PLC was designed to shut the entire system down in the event any sensor recorded a condition outside preset operating limits. This condition was experienced four times during the verification. The cause of each shutdown was the filter press clogging to a point where water could not pass through it at the system’s rated throughput. During each shutdown condition, after the filter press was cleaned, the alarm conditions in the PLC were cleared and the system was restarted without difficulty.
Electrical power consumption was estimated based on the floc pump, clean water pump, backwash pump, reaction vessel, waste pump, and miscellaneous other devices (air compressor, PLC, lights, etc.). The power consumption was estimated to be 4.2 kilowatt hours (KwH).
Quality Assurance/Quality Control
NSF provided technical and QA oversight of the verification testing as described in the verification report, including an audit of nearly 100% of the data. The NSF QA department conducted a technical systems audit during testing to ensure the testing was in compliance with the test plan and performed a QA review of the analytical data. A complete description of the QA/QC procedures is provided in the verification report.
06/ARS1/EPADWCTR The accompanying notice is an integral part of this verification statement. September 2006
VS-v
Original signed by Sally Gutierrez September 22, 2006
Original signed by Robert Ferguson September 12, 2006
Sally Gutierrez Date Director National Risk Management Research Laboratory Office of Research and Development United States Environmental Protection Agency
Robert Ferguson Vice President Water Systems NSF International
Date
NOTICE: Verifications are based on an evaluation of technology performance under specific, predetermined criteria and the appropriate quality assurance procedures. EPA and NSF make no expressed or implied warranties as to the performance of the technology and do not certify that a technology will always operate as verified. The end-user is solely responsible for complying with any and all applicable federal, state, and local requirements. Mention of corporate names, trade names, or commercial products does not constitute endorsement or recommendation for use of specific products. This report is not an NSF Certification of the specific product mentioned herein.
Availability of Supporting Documents Copies of the ETV Protocol for Equipment Verification Testing for Arsenic Removal dated September 2003, the product-specific test plan, the verification statement, and the verification report (NSF Report #06/ARS1/EPADWCTR) are available from the following sources: (NOTE: Appendices are not included in the verification report. Appendices are available from NSF upon request.)
1. ETV Drinking Water Systems Center Manager (order hard copy) NSF International
P.O. Box 130140 Ann Arbor, Michigan 48113-0140
2. NSF web site: http://www.nsf.org/info/etv (electronic copy) 3. EPA web site: http://www.epa.gov/etv (electronic copy)
06/ARS1/EPADWCTR The accompanying notice is an integral part of this verification statement. September 2006
VS-vi
September 2006
Environmental Technology Verification Report
Removal of Arsenic in Drinking Water
ARS USA, LLC ARS CFU-50 APC Electroflocculation and Filtration
Water Treatment System
Prepared for:
NSF International Ann Arbor, Michigan 48105
Prepared by:
NSF International
Under a cooperative agreement with the U.S. Environmental Protection Agency
Jeffrey Q. Adams, Project Officer National Risk Management Research Laboratory
U.S. Environmental Protection Agency Cincinnati, Ohio 45268
Notice
The U.S. Environmental Protection Agency (EPA), through its Office of Research and Development, has financially supported and collaborated with NSF International (NSF) under Cooperative Agreement No. R-82833301. This verification effort was supported by the Drinking Water Systems (DWS) Center, operating under the Environmental Technology Verification (ETV) Program. This document has been peer reviewed, reviewed by NSF and EPA, and recommended for public release.
ii
Foreword
The U.S. Environmental Protection Agency (EPA) is charged by Congress with protecting the Nation’s land, air, and water resources. Under a mandate of national environmental laws, the Agency strives to formulate and implement actions leading to a compatible balance between human activities and the ability of natural systems to support and nurture life. To meet this mandate, EPA’s research program is providing data and technical support for solving environmental problems today and building a science knowledge base necessary to manage our ecological resources wisely, understand how pollutants affect our health, and prevent or reduce environmental risks in the future.
The National Risk Management Research Laboratory (NRMRL) is the Agency’s center for investigation of technological and management approaches for preventing and reducing risks from pollution that threaten human health and the environment. The focus of the Laboratory’s research program is on methods and their cost-effectiveness for prevention and control of pollution to air, land, water, and subsurface resources; protection of water quality in public water systems; remediation of contaminated sites, sediments and ground water; prevention and control of indoor air pollution; and restoration of ecosystems. NRMRL collaborates with both public and private sector partners to foster technologies that reduce the cost of compliance and to anticipate emerging problems. NRMRL’s research provides solutions to environmental problems by: developing and promoting technologies that protect and improve the environment; advancing scientific and engineering information to support regulatory and policy decisions; and providing the technical support and information transfer to ensure implementation of environmental regulations and strategies at the national, state, and community levels.
This publication has been produced as part of the Laboratory’s strategic long-term research plan. It is published and made available by EPA’s Office of Research and Development to assist the user community and to link researchers with their clients.
Sally Gutierrez, Director National Risk Management Research Laboratory
iii
Table of Contents
Verification Statement ...............................................................................................................VS-i Notice.............................................................................................................................................. ii Foreword ........................................................................................................................................ iii Table of Contents........................................................................................................................... iv List of Figures ................................................................................................................................. v List of Tables .................................................................................................................................. v Appendices..................................................................................................................................... vi Abbreviations and Acronyms ....................................................................................................... vii Acknowledgements...................................................................................................................... viii Chapter 1 Introduction .................................................................................................................... 1
1.1 ETV Purpose and Program Operation ............................................................................ 1 1.2 Testing Participants and Responsibilities ....................................................................... 1
1.2.1 NSF International.................................................................................................... 2 1.2.2 Field Testing Organization ..................................................................................... 2 1.2.3 Manufacturer........................................................................................................... 3 1.2.4 Analytical Laboratory ............................................................................................. 3 1.2.5 U.S. Environmental Protection Agency .................................................................. 4
1.3 Verification Testing Site ................................................................................................. 41.3.1 Site Background Information.................................................................................. 4 1.3.2 Source/Feed Water Quality..................................................................................... 4 1.3.3 Test Site Description............................................................................................... 5
Chapter 2 Equipment Capabilities and Description........................................................................ 7 2.1 Description of Equipment ............................................................................................... 7 2.2 Engineering and Scientific Concepts .............................................................................. 7
2.2.1 Physicochemical Efficient Mechanisms ................................................................. 8 2.3 Description of Treatment Train and Unit Processes ....................................................... 8 2.4 Description of Physical Construction and Components ............................................... 12 2.5 Chemical Consumption and Production of Waste Material ......................................... 12
2.5.1 Chemical Consumption......................................................................................... 12 2.5.2 Waste Production and Physical and Chemical Nature of Wastes......................... 13
2.6 Licensing Requirements................................................................................................ 13 2.7 Statement of Performance Objectives........................................................................... 13 2.8 Advantages of the ARS CFU-50 APC Process............................................................. 14 2.9 Potential Limitations of the Equipment ........................................................................ 14
Chapter 3 Methods and Procedures .............................................................................................. 15 3.1 Quantitative and Qualitative Evaluation Criteria.......................................................... 15 3.2 Key Water Quality Parameters ..................................................................................... 15 3.3 Operations and Maintenance......................................................................................... 15 3.4 Environmental Technology Verification Testing Plan ................................................. 16
3.4.1 Task A: Raw Water Characterization .................................................................. 16 3.4.2 Task B: Arsenic Loss Test ................................................................................... 16 3.4.3 Task C: Verification Test Procedures .................................................................. 16
3.5 Operation and Maintenance .......................................................................................... 18 3.5.1 Operability Evaluation .......................................................................................... 18
iv
Chapter 4 Results and Discussion................................................................................................. 19 4.1 Introduction................................................................................................................... 19 4.2 Equipment Installation, Start-up, and Shakedown........................................................ 19
4.2.1 Flow Measurement................................................................................................ 19 4.3 Task A: Raw Water Characterization .......................................................................... 20 4.4 Task B: Initial Test Runs .............................................................................................. 21
4.4.1 Arsenic Loss Test.................................................................................................. 21 4.5 Task C: Verification Test.............................................................................................. 24
4.5.1 Operating Results.................................................................................................. 24 4.5.2 Arsenic Results ..................................................................................................... 25 4.5.3 Feed and Filtrate Water Quality Results............................................................... 29
4.6 Operations and Maintenance Findings.......................................................................... 40 4.6.1 Electrical Consumption......................................................................................... 41 4.6.2 Sand Filters ........................................................................................................... 414.6.3 Filter Press ............................................................................................................ 42 4.6.4 Backwash Water Frequency and Quality.............................................................. 42 4.6.5 Programmable Logic Controller ........................................................................... 43
4.7 Quality Assurance/Quality Control............................................................................... 44 4.7.1 Documentation...................................................................................................... 44 4.7.2 Quality Audits....................................................................................................... 44 4.7.3 Data Quality Indicators ......................................................................................... 45 4.7.4 Effect of Sample Preservative on Arsenic Speciation .......................................... 52 4.7.5 Deviations from PSTP .......................................................................................... 53
Chapter 5 References .................................................................................................................... 54
List of Figures
Figure 2-1. ARS CFU-50 APC schematic view. ........................................................................... 9 Figure 2-2. ARS CFU-50 APC right isometric view................................................................... 11 Figure 2-3. ARS CFU-50 APC skid-mounted unit photograph................................................... 11 Figure 4-1. Verification test daily arsenic results. ....................................................................... 29 Figure 4-2. Verification test pH results........................................................................................ 31 Figure 4-3. Verification test turbidity results............................................................................... 33 Figure 4-4. Verification test alkalinity results. ............................................................................ 35 Figure 4-5. Verification test aluminum results. ........................................................................... 37
List of Tables
Table 1-1. Raw Water Quality Data .............................................................................................. 5Table 2-1. Test System Operating Conditions............................................................................. 10 Table 2-2. ARS CFU-50 APC System Specifications ................................................................. 10 Table 3-1. Key Filtrate Water Quality Parameters ...................................................................... 15 Table 4-1. Feed Water Characterization Data – April 18, 2006 .................................................. 20 Table 4-2. Task B Arsenic Loss Test Operating Data ................................................................. 21 Table 4-3. Task B Arsenic Loss Test Water Quality Results ...................................................... 23 Table 4-4. Operating Data............................................................................................................ 25
v
Table 4-5. Daily Total Arsenic Results (µg/L) ............................................................................ 26 Table 4-6. Total Arsenic Results for 48-Hour Intensive Survey (µg/L)...................................... 27 Table 4-7. Arsenic Speciation Data (µg/L).................................................................................. 28 Table 4-8. pH Results (S.U.)........................................................................................................ 30 Table 4-9. pH Results for the 48-Hour Intensive Survey (S.U.).................................................. 30 Table 4-10. Bench Top Turbidity Results.................................................................................... 32 Table 4-11. Bench Top Turbidity Results for the 48-Hour Intensive Survey ............................. 33 Table 4-12. Alkalinity Results ..................................................................................................... 34 Table 4-13. Alkalinity Results for the 48-Hour Intensive Survey ............................................... 35 Table 4-14. Aluminum Results .................................................................................................... 36 Table 4-15. Aluminum Results for the 48-Hour Intensive Survey.............................................. 37 Table 4-16. Total and Free Residual Chlorine and DO ............................................................... 38 Table 4-17. Total and Free Residual Chlorine and DO Results for 48-Hour Survey.................. 39 Table 4-18. Other Water Quality Parameters .............................................................................. 40 Table 4-19. Power Consumption ................................................................................................. 41 Table 4-20. Backwash Solids – TCLP and CAWET Analyses ................................................... 43 Table 4-21. Field Instrument Calibration Schedule..................................................................... 46 Table 4-22. Flow Meter Calibration Data.................................................................................... 47 Table 4-23. Precision Data – Field Duplicates for Laboratory Parameters ................................. 49 Table 4-24. Precision Data – Field Duplicates for Field Parameters........................................... 50 Table 4-25. Completeness Results............................................................................................... 52 Table 4-26. Deviations from PSTP.............................................................................................. 53
Appendices
Appendix A – Operation and Maintenance Manual Appendix B – Product Specific Test Plan Appendix C – Spreadsheets Appendix D – Field Data Logbook and Calibration Records Appendix E – NSF Laboratory Data Reports Appendix F – TriMatrix Laboratories Data Report for TCLP and CAWET Analyses
vi
Abbreviations and Acronyms
ARS ARS USA, LLC (formerly known as Advanced Remediation Systems USA, LLC)
CAWET California Waste Extraction Test °C Degree Celsius C.U. Color Units DO Dissolved Oxygen DWS Drinking Water Systems DWTS NSF International Drinking Water Treatment Systems Laboratory EPA U.S. Environmental Protection Agency ETV ft2
Environmental Technology Verification Square Feet or Square Foot
FTO Field Testing Organization gpm Gallon(s) Per Minute gpd Gallon(s) Per Day hp Horsepower KwH Kilowatt-hour LCS Laboratory Control Sample mg/L Milligram(s) per Liter mm Millimeter MSDS Material Safety Data Sheets NC Not Calculated NIST National Institute of Standards and Technology NR Not Recorded NRMRL National Risk Management Research Laboratory NSF NSF International NTU Nephelometric Turbidity Unit(s) O&M Operation and Maintenance ORD Office of Research and Development PLC Programmable Logic Controller psi Pounds per Square Inch PSTP Product Specific Test Plan QA/QC Quality Assurance/Quality Control QAPP Quality Assurance Project Plan RCRA Resource Conservation and Recovery Act %RSD Percent Relative Standard Deviation S.U. Standard Units TCLP Toxicity Characteristic Leaching Procedure TOC Total Organic Carbon TSS Total Suspended Solids µg/L Microgram(s) per Liter VAC Volts Alternating Current
vii
Acknowledgements
The Field Testing Organization (FTO), NSF International (NSF) Drinking Water Treatment Systems Laboratory (DWTS), was responsible for all elements in the testing sequence, including collection of samples, calibration and check of instrumentation, data collection and analysis, data management, data interpretation, and the preparation of this report.
NSF International Drinking Water Treatment Systems Laboratory 789 N. Dixboro Road Ann Arbor, Michigan 48105 Contact Person: Mr. Robert Herman
The laboratory selected for the analytical work for this test was:
NSF International Chemistry Laboratory 789 N. Dixboro Road Ann Arbor, Michigan 48105 Contact Person: Dr. Kurtis Kneen
The manufacturer of the equipment was:
ARS USA, LLCPO Box 1130 Bernalillo, NM 87004 Contact Person: Mr. Norbert Barcena
The NSF DWTS wishes to thank the following participants:
Mr. Bruce Bartley, Mr. Patrick Davison, and Ms. Angela Beach of the NSF Environmental Technology Verification (ETV) Drinking Water Systems (DWS) Center for their support, guidance, and program management.
The Town of Bernalillo staff, including Mr. Bill Plata and Mr. Les Swindle, for providing access to the test site.
ARS for supplying the verification test unit and support services during the start-up period. Mr. Andrew Polnicki coordinated building and shipping of the test unit, and worked at the site to optimize the operation of the system and provide training to the NSF field operators. Ms. Lauren Bull provided logistical assistance. Their work is greatly appreciated.
viii
Chapter 1 Introduction
1.1 ETV Purpose and Program Operation
The U.S. Environmental Protection Agency (EPA) has created the Environmental Technology Verification (ETV) Program to facilitate the deployment of innovative or improved environmental technologies through performance verification and dissemination of information. The goal of the ETV Program is to further environmental protection by accelerating the acceptance and use of improved and more cost-effective technologies. ETV seeks to achieve this goal by providing high-quality, peer-reviewed data on technology performance to those involved in the design, distribution, permitting, purchase, and use of environmental technologies.
ETV works in partnership with recognized standards and testing organizations; with stakeholder groups consisting of buyers, vendor organizations, and permitters; and with the full participation of individual technology developers. The program evaluates the performance of innovative technologies by developing test plans responsive to the needs of stakeholders, conducting field demonstrations, collecting and analyzing data, and preparing peer-reviewed reports. All evaluations are conducted in accordance with rigorous quality assurance protocols to ensure that data of known and adequate quality are generated and that the results are defensible.
The EPA has partnered with NSF International (NSF) under the ETV Drinking Water Systems (DWS) Center to verify the performance of small drinking water systems that serve small communities. A goal of verification testing is to enhance and facilitate the acceptance of small drinking water treatment equipment by state drinking water regulatory officials and consulting engineers, while reducing the need for testing of equipment at each location where the equipment’s use is contemplated. NSF meets this goal by working with manufacturers and NSF-qualified Field Testing Organizations (FTOs) to conduct verification testing under the approved protocols. It is important to note that verification of the equipment does not mean the equipment is “certified” by NSF or “accepted” by EPA. Rather, it recognizes that the performance of the equipment has been determined and verified by these organizations for those conditions tested by the FTO.
The DWS Center evaluated the performance of the ARS CFU-50 APC Electroflocculation and Filtration Water Treatment System (ARS CFU-50 APC), manufactured and distributed by ARS USA, LLC, which is a granular media filtration system used in drinking water treatment system applications for reduction of arsenic and dissolved iron in groundwater. This document provides the verification test results for the ARS CFU-50 APC.
1.2 Testing Participants and Responsibilities
The ETV testing of the ARS CFU-50 APC was a cooperative effort among the following participants:
• NSF • NSF International Drinking Water Treatment Systems Laboratory (DWTS)
1
• ARS • The Town of Bernalillo, New Mexico • EPA
The following is a brief description of all of the ETV participants and their roles and responsibilities.
1.2.1 NSF International
NSF is an independent, not-for-profit testing and certification organization dedicated to public health and safety and to the protection of the environment. Founded in 1946 and located in Ann Arbor, Michigan, NSF has been instrumental in the development of consensus standards for the protection of public health and the environment. NSF also provides testing and certification services to ensure products bearing the NSF Name, Logo and/or Mark meet those standards. The EPA partnered with NSF to verify the performance of drinking water treatment systems through the EPA’s ETV Program.
NSF provided technical oversight of the verification testing and conducted an audit of the field analytical and data gathering and recording procedures. NSF also provided review of the Product Specific Test Plan (PSTP) as well as this report.
Contact Information: NSF International 789 N. Dixboro Road Ann Arbor, Michigan 48105 Contact: Bruce Bartley, Project Manager Phone: (734) 769-8010 Fax: (734) 769-0109
Email: [email protected]
1.2.2 Field Testing Organization
The DWTS conducted the verification testing of the ARS CFU-50 APC. The DWTS is an NSF-qualified FTO for the ETV DWS Center.
The FTO provided all needed logistical support, established a communications network, and scheduled and coordinated activities of all participants. The FTO was responsible for ensuring the testing location and feed water conditions were such that the verification testing could meet its stated objectives. The FTO prepared the PSTP; oversaw the pilot testing; managed, evaluated, interpreted, and reported on the data generated by the testing; and evaluated and reported on the performance of the technology. The FTO was responsible for completing the raw water characterization testing, monitoring the ARS CFU-50 APC during the arsenic loss testing (24 hour test), and conducting the verification test over 14 calendar days.
DWTS employees conducted the on-site analyses and data recording during the test. The FTO’s Project Manager and Project Director provided oversight of the daily tests.
2
Contact Information: NSF International Drinking Water Treatment Systems Laboratory 789 N. Dixboro Road Ann Arbor, Michigan 48105 Contact Person: Mr. Robert Herman Phone: (734) 769-5349 Fax: (734) 827-7143 Email: [email protected]
1.2.3 Manufacturer
The treatment system was the ARS CFU-50 APC Electroflocculation and Filtration Water Treatment System for the removal of arsenic from drinking water. The manufacturer was responsible for supplying a field-ready electroflocculation and filtration system equipped with all necessary components, including treatment equipment, instrumentation and controls, and an operation and maintenance (O&M) manual. The manufacturer was responsible for providing logistical and technical support, as needed, as well as technical assistance to the FTO during operation and monitoring of the equipment undergoing field verification testing.
Contact Information: ARS USA, LLC PO Box 1170 Bernalillo, NM 87004 Contact Person: Mr. Norbert Barcena Phone: (505) 771-4344 Fax: (505) 771-4345 Email: [email protected]
1.2.4 Analytical Laboratory
The NSF Chemistry Laboratory in Ann Arbor, Michigan performed all water quality analyses.
Contact Information: NSF International Chemistry Laboratory 789 N. Dixboro Road Ann Arbor, Michigan 48105 Contact Person: Dr. Kurtis Kneen Phone: (734) 827-6874 Fax: (734) 827-7765 Email: [email protected]
3
Backwash toxicity analyses were performed by:
Contact Information: TriMatrix Laboratories, Inc. 5555 Glenwood Hills Parkway, SE Grand Rapids, Michigan 49588 Phone: (810) 220-2075 Fax: (810) 220-2803 Contact: Mr. Michael W. Movinski, Vice President, Sales and Marketing Email: [email protected]
1.2.5 U.S. Environmental Protection Agency
The EPA, through its Office of Research and Development (ORD), has financially supported and collaborated with NSF under Cooperative Agreement No. R-82833301. This verification effort was supported by the DWS Center operating under the ETV Program. This document has been peer reviewed, reviewed by NSF and EPA, and recommended for public release.
1.3 Verification Testing Site
1.3.1 Site Background Information
The Bernalillo Well #3 site is less than one acre and includes a two-room building which houses the well pump in one room and the chlorination equipment in the other room. The site also includes a primary storage tank (approximately 1 million gallons) and secondary storage tank (approximately 200,000 gallons). The two tanks are connected to each other as well as to Well #3 and Well #4. The water storage tanks are fixed wall tanks that do not have bladder inserts. When the water level in the storage tank drops below a preset level, Well #3 is activated to supplement water from Well #4. Once a preset limit is met, the pumps shut off. Chlorine is immediately added to the water from the wells prior to delivery to the storage tank.
The average daily water use for the Town of Bernalillo is approximately two million gallons per day (gpd). Well #3 typically produces approximately 600 to 800 gallons per minute (gpm) when it is operating, and Well #4 typically produces approximately 1,200 to 1,600 gpm. According to the Town of Bernalillo, both wells pump water from the Rio Grande group aquifer. Well #3 is approximately 660 feet deep and Well #4 is approximately 970 feet deep.
The supply water for the test is provided from the storage tanks at Well #3, and includes a blend of water from the two wells. The ARS CFU-50 APC unit was located on the grounds of the Well #3 site. The site was secured with a fence and locked gate, and provided ample space for adding the piping needed for the test unit and for storage of basic supplies and equipment needed during the testing.
1.3.2 Source/Feed Water Quality
Table 1-1 presents raw water quality for samples taken from samples collected and analyzed by ARS between January and April 2006, when the site was evaluated. The water had total hardness
4
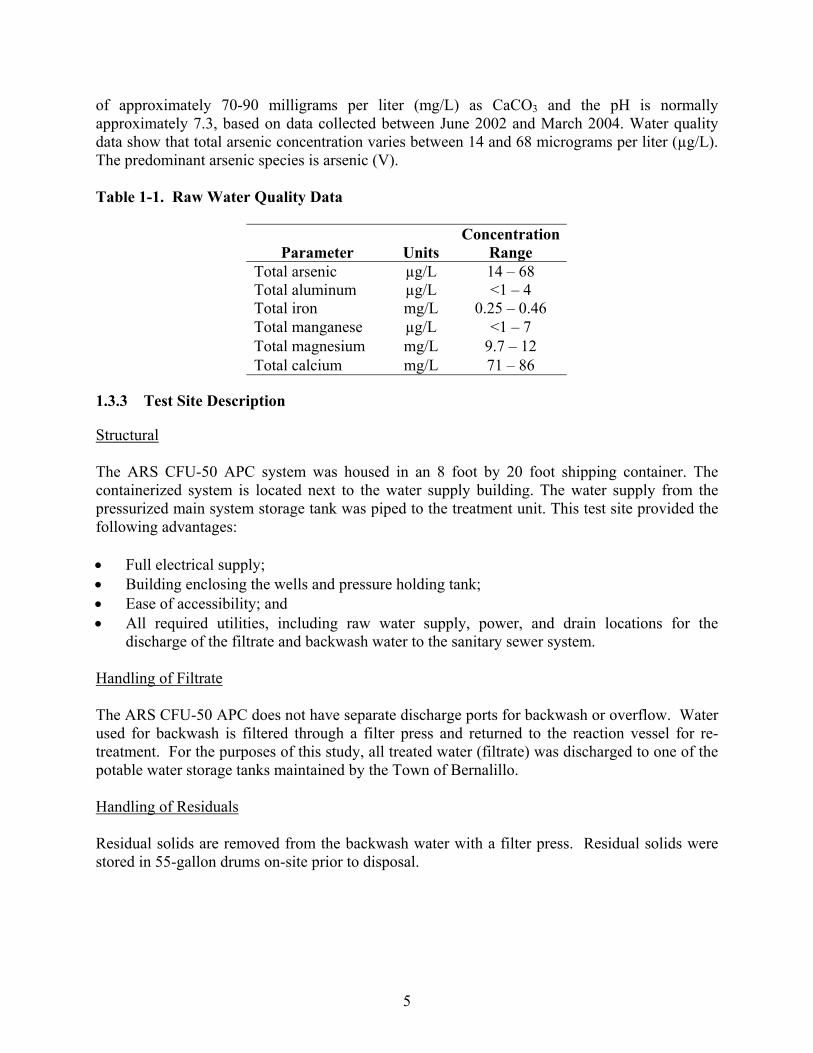
Concentration Parameter Units Range
Total arsenic µg/L 14 – 68 Total aluminum µg/L <1 – 4 Total iron mg/L 0.25 – 0.46 Total manganese µg/L <1 – 7 Total magnesium mg/L 9.7 – 12 Total calcium mg/L 71 – 86
of approximately 70-90 milligrams per liter (mg/L) as CaCO3 and the pH is normally approximately 7.3, based on data collected between June 2002 and March 2004. Water quality data show that total arsenic concentration varies between 14 and 68 micrograms per liter (µg/L). The predominant arsenic species is arsenic (V).
Table 1-1. Raw Water Quality Data
1.3.3 Test Site Description
Structural
The ARS CFU-50 APC system was housed in an 8 foot by 20 foot shipping container. The containerized system is located next to the water supply building. The water supply from the pressurized main system storage tank was piped to the treatment unit. This test site provided the following advantages:
• Full electrical supply; • Building enclosing the wells and pressure holding tank; • Ease of accessibility; and • All required utilities, including raw water supply, power, and drain locations for the
discharge of the filtrate and backwash water to the sanitary sewer system.
Handling of Filtrate
The ARS CFU-50 APC does not have separate discharge ports for backwash or overflow. Water used for backwash is filtered through a filter press and returned to the reaction vessel for re-treatment. For the purposes of this study, all treated water (filtrate) was discharged to one of the potable water storage tanks maintained by the Town of Bernalillo.
Handling of Residuals
Residual solids are removed from the backwash water with a filter press. Residual solids were stored in 55-gallon drums on-site prior to disposal.
5

Discharge Permits
No special discharge permits were required for the discharge of the filtrate, and backwash water from the test unit is recycled back to the reaction tank. The filter cake was characterized as part of the study (see Section 4.6). Previous tests conducted by the vendor indicate this material is non-hazardous.
6
Chapter 2 Equipment Capabilities and Description
The equipment capabilities and description provided in this section were provided by the vendor and does not represent verified information. The ETV evaluation focused on the ability of the device to remove arsenic from drinking water. Claims beyond arsenic removal are made by the vendor but were not verified as part of this study.
2.1 Description of Equipment
The ARS CFU-50 APC is a standard, full-scale, modular system supplied by ARS for the removal of arsenic and other contaminants from water. The ARS CFU-50 APC is a self-contained, complete system that connects to a water supply source. If the source is not pressurized, a pump, supplied with the unit, is used to pump the water through the treatment system. The ARS CFU-50 APC requires a three-phase 480-volt AC electric power source to operate the reaction vessel, programmable logic controller (PLC), and ancillary equipment. The system used for this test is designed to treat flows up to a maximum flow rate of approximately 35 gpm (50,000 gpd), from either a pressurized or unpressurized water source. Additional information on the equipment installation requirements and operation of the equipment is provided in the O&M manual, included Appendix A.
The ARS CFU-50 APC treatment system is fully automated and programmed to control all aspects of the treatment and filter operation. The control system automatically initiates backwash cycles based on an inlet pressure level set by the operator. The backwash cycle time is dependent on the water quality conditions and the amount of solids generated in the electroflocculation process. The control system monitors data from the system operation. This information is available to the on-site operator. Although the system is designed for automatic, unattended operation, the following information is available to an on-site operator:
• Pressure at key points of the device; • Flow rates and throughput totals; • Sand filter data: regeneration interval, total in-process times, current status (on
line, back flushing, standby, etc.); • Electrical process parameters (current and voltage); • Fault/alarm conditions, based on vessel levels, flow rate, pressure levels, gas
levels, air pressure loss, etc.; • Maintenance messages (for example, filter press cleanout required); and • Oxygen and hydrogen monitor readings.
2.2 Engineering and Scientific Concepts
The ARS CFU-50 APC treatment system relies on electroflocculation which develops an aluminum flocculent similar to alum and ferric flocculants. The ARS CFU-50 APC flocculent generates various hydroxyl water complexes that combine with cations and other contaminants within the source water. ARS claims there are several significant differences between the ARS process and the chemical processes:
7
• The ARS flocculent is generated without the addition of any chemical agents (the anode plate is the source of the aluminum used in the flocculation process);
• The ARS flocculent does not require any pretreatment or post treatment; • The ARS flocculent does not begin with a salt molecule and therefore does not affect a
change on water salinity; • The ARS process works in a pH range of 4.5 to 8.5. Higher pH ranges can be reduced
through a non-chemical ARS method; and • The ARS flocculent particles are a fraction of the size generated through chemical means,
resulting in flocs with extremely high surface area to volume ratios, making the ARS process more effective in removing arsenic.
These claims were not verified as part of the ETV study.
2.2.1 Physicochemical Efficient Mechanisms
The following two processes are running simultaneously during electrolytic water treatment:
• Electrolytic decomposition of water, and • Dissolution of the anodes accompanied by the formation of metal polyhydroxides and
metal water complexes.
The main advantage of electrolytically-formed flocculent is their adsorbing power. In this respect, they are highly active and show a very good binding capacity for divalent metallic ions. According to the manufacturer, the ARS process has delivered excellent results for the treatment of galvanizing wastewaters, dying backwaters, grinding wastewaters, lye solutions, emulsions, tannery backwaters and similar wastewaters.
Electrolytic water decomposition contributes considerably to the efficiency of complex procedures. Hydrogen and oxygen are released in a sequence of complex mechanisms. This so-called nascent hydrogen or oxygen offers a very high potential of reduction and oxidation, which provides for numerous secondary reactions with the water contents.
2.3 Description of Treatment Train and Unit Processes
With ARS, a floc of mixed oxide containing the arsenic contaminant is formed without the addition of chemicals. Flocculation is accomplished in a single reaction process, removing heavy metals. Water with minimum electrolytic conductivity is treatable in the reaction tank. Water with high saline content is managed by regulating the process current level.
Figure 2-1 is a schematic of the primary components in the ARS CFU-50 APC treatment system. In the switch cabinet (E), all processes are controlled and monitored. The power supply (P) converts the AC electric current to a regulated fixed DC current. Untreated/contaminated water enters the unit through a regulated influent pipe (1). The flocculent generation and decontamination process occurs in the reaction tank in a continuous process (2). Flocculent particles in the holding pipe/tank (3) are subject to further growth and reaction after the
8
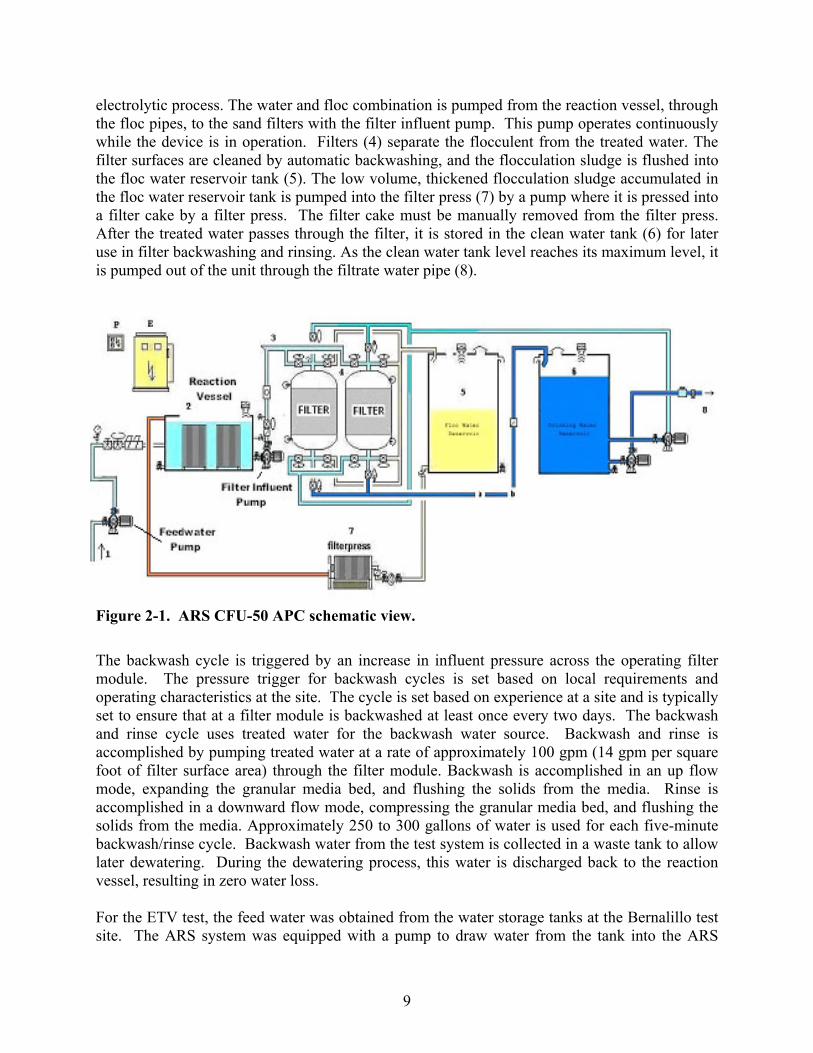
electrolytic process. The water and floc combination is pumped from the reaction vessel, through the floc pipes, to the sand filters with the filter influent pump. This pump operates continuously while the device is in operation. Filters (4) separate the flocculent from the treated water. The filter surfaces are cleaned by automatic backwashing, and the flocculation sludge is flushed into the floc water reservoir tank (5). The low volume, thickened flocculation sludge accumulated in the floc water reservoir tank is pumped into the filter press (7) by a pump where it is pressed into a filter cake by a filter press. The filter cake must be manually removed from the filter press. After the treated water passes through the filter, it is stored in the clean water tank (6) for later use in filter backwashing and rinsing. As the clean water tank level reaches its maximum level, it is pumped out of the unit through the filtrate water pipe (8).
Figure 2-1. ARS CFU-50 APC schematic view.
The backwash cycle is triggered by an increase in influent pressure across the operating filter module. The pressure trigger for backwash cycles is set based on local requirements and operating characteristics at the site. The cycle is set based on experience at a site and is typically set to ensure that at a filter module is backwashed at least once every two days. The backwash and rinse cycle uses treated water for the backwash water source. Backwash and rinse is accomplished by pumping treated water at a rate of approximately 100 gpm (14 gpm per square foot of filter surface area) through the filter module. Backwash is accomplished in an up flow mode, expanding the granular media bed, and flushing the solids from the media. Rinse is accomplished in a downward flow mode, compressing the granular media bed, and flushing the solids from the media. Approximately 250 to 300 gallons of water is used for each five-minute backwash/rinse cycle. Backwash water from the test system is collected in a waste tank to allow later dewatering. During the dewatering process, this water is discharged back to the reaction vessel, resulting in zero water loss.
For the ETV test, the feed water was obtained from the water storage tanks at the Bernalillo test site. The ARS system was equipped with a pump to draw water from the tank into the ARS
9
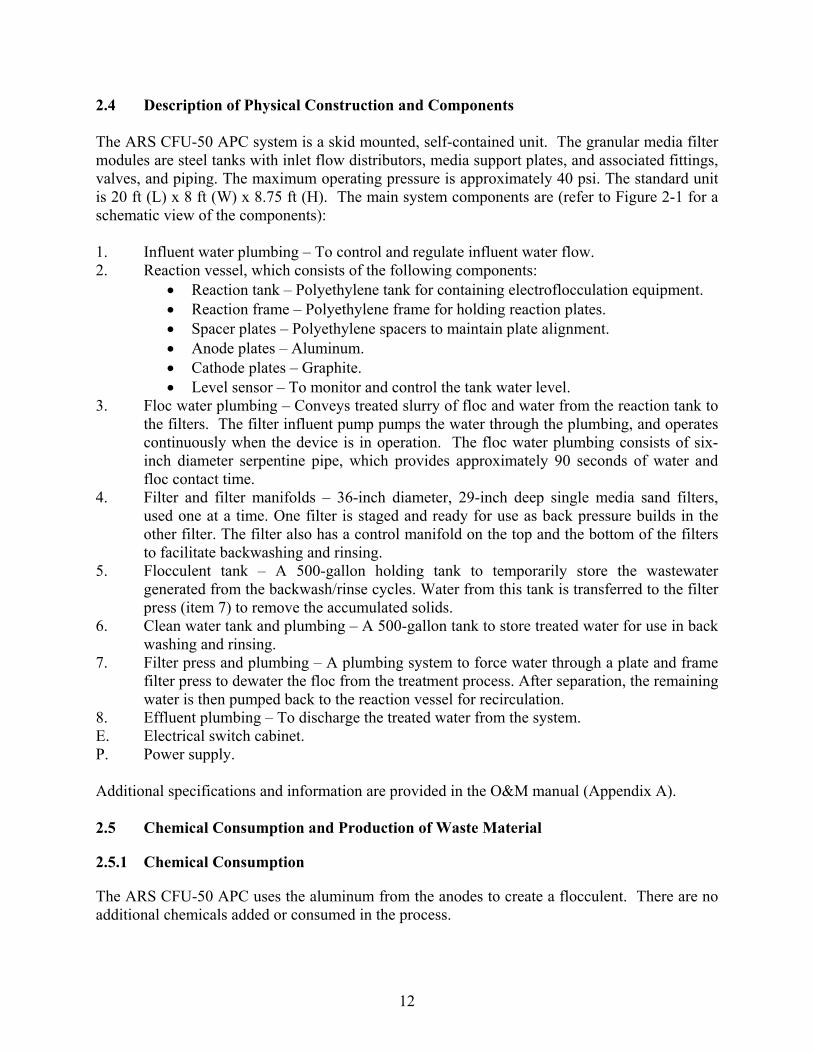
Parameter Specification Filtrate flow rate 35 gpm (50,000 gpd) Backwash flow rateBackwash flow velocity
100 gpm 14 gpm/square foot (ft2)
Backwash water per cycle 250 - 300 gallons Pressure maximum for backwash initiation 15 pounds per square inch (psi) Feed water pressure >20 psi Source water pressure >14 psi
Manufacturer ARS USA, LLC Model ARS CFU-50 APC Reactor tank dimensions 48 in. outer diameter, 48 in. tall Filter area per module 7.1 ft2
Filter module diameter 36 inches Media depth 29 inches Number of filter modules 2 (alternating in operation) Filter pressure rating 100 psi max operating pressure Media per filter module Single media #20 silica sand
Effective size 0.47 millimeter (mm) Uniformity coefficient 1.42
Skid 8 ft × 20 ft shipping container Piping Schedule 80 PVC
system. A pressure regulator and a flow control valve was installed downstream of a double back flow preventer to control the flow rate of feed water to the system. A flow meter was used to monitor the flow rate and total flow of feed water to the treatment portion of the process.
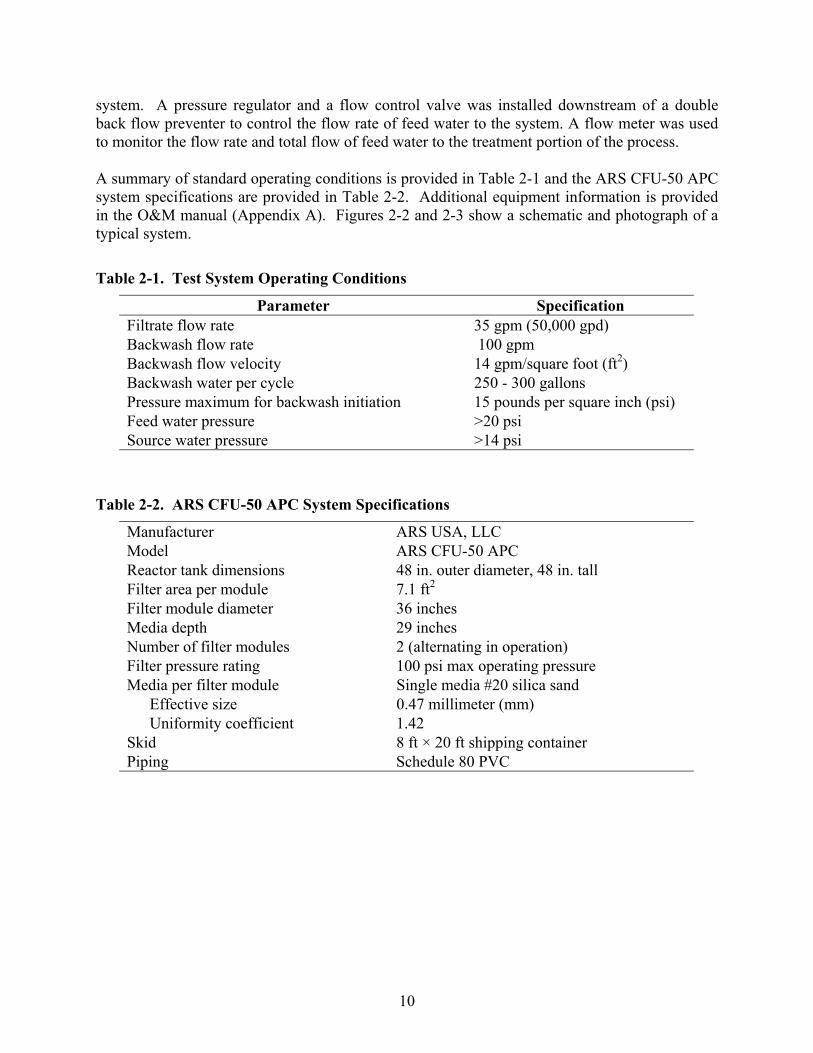
A summary of standard operating conditions is provided in Table 2-1 and the ARS CFU-50 APC system specifications are provided in Table 2-2. Additional equipment information is provided in the O&M manual (Appendix A). Figures 2-2 and 2-3 show a schematic and photograph of a typical system.
Table 2-1. Test System Operating Conditions
Table 2-2. ARS CFU-50 APC System Specifications
10
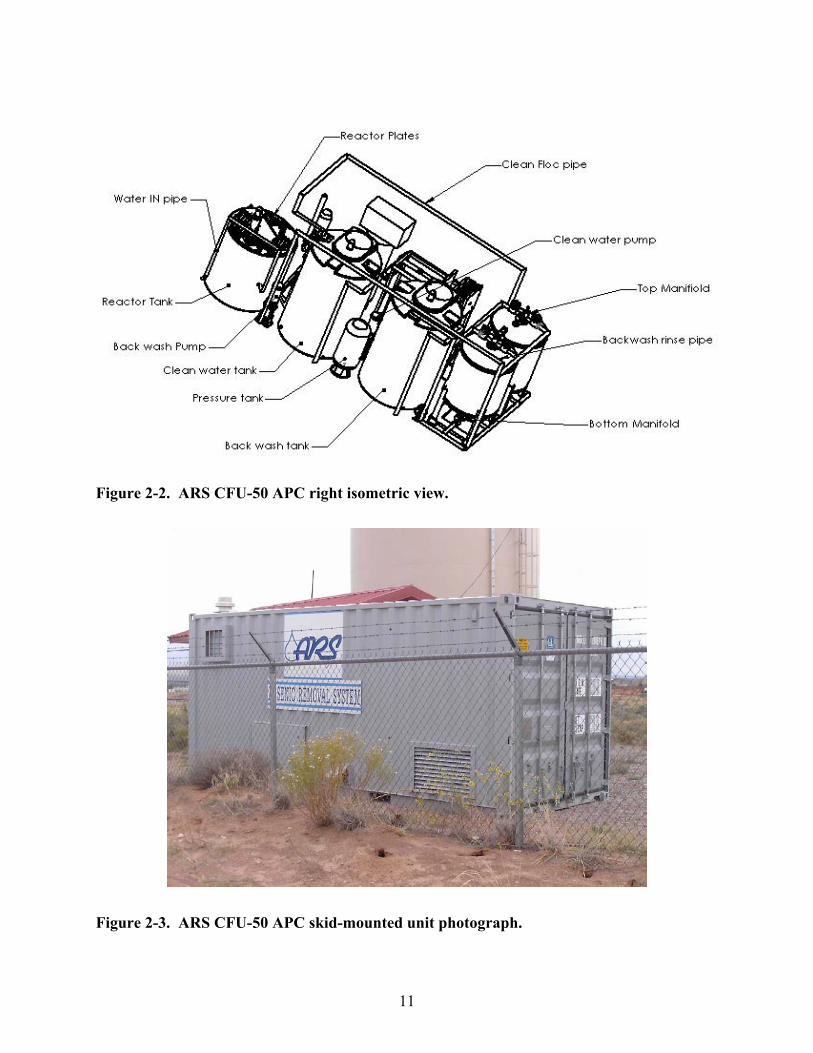
Figure 2-2. ARS CFU-50 APC right isometric view.
Figure 2-3. ARS CFU-50 APC skid-mounted unit photograph.
11
2.4 Description of Physical Construction and Components
The ARS CFU-50 APC system is a skid mounted, self-contained unit. The granular media filter modules are steel tanks with inlet flow distributors, media support plates, and associated fittings, valves, and piping. The maximum operating pressure is approximately 40 psi. The standard unit is 20 ft (L) x 8 ft (W) x 8.75 ft (H). The main system components are (refer to Figure 2-1 for a schematic view of the components):
1. Influent water plumbing – To control and regulate influent water flow. 2. Reaction vessel, which consists of the following components:
• Reaction tank – Polyethylene tank for containing electroflocculation equipment. • Reaction frame – Polyethylene frame for holding reaction plates. • Spacer plates – Polyethylene spacers to maintain plate alignment. • Anode plates – Aluminum. • Cathode plates – Graphite. • Level sensor – To monitor and control the tank water level.
3. Floc water plumbing – Conveys treated slurry of floc and water from the reaction tank to the filters. The filter influent pump pumps the water through the plumbing, and operates continuously when the device is in operation. The floc water plumbing consists of six-inch diameter serpentine pipe, which provides approximately 90 seconds of water and floc contact time.
4. Filter and filter manifolds – 36-inch diameter, 29-inch deep single media sand filters, used one at a time. One filter is staged and ready for use as back pressure builds in the other filter. The filter also has a control manifold on the top and the bottom of the filters to facilitate backwashing and rinsing.
5. Flocculent tank – A 500-gallon holding tank to temporarily store the wastewater generated from the backwash/rinse cycles. Water from this tank is transferred to the filter press (item 7) to remove the accumulated solids.
6. Clean water tank and plumbing – A 500-gallon tank to store treated water for use in back washing and rinsing.
7. Filter press and plumbing – A plumbing system to force water through a plate and frame filter press to dewater the floc from the treatment process. After separation, the remaining water is then pumped back to the reaction vessel for recirculation.
8. Effluent plumbing – To discharge the treated water from the system. E. Electrical switch cabinet. P. Power supply.
Additional specifications and information are provided in the O&M manual (Appendix A).
2.5 Chemical Consumption and Production of Waste Material
2.5.1 Chemical Consumption
The ARS CFU-50 APC uses the aluminum from the anodes to create a flocculent. There are no additional chemicals added or consumed in the process.
12
2.5.2 Waste Production and Physical and Chemical Nature of Wastes
The waste material from the ARS CFU-50 APC is limited to a small amount of hydrogen gas and filter cake, consisting of the flocculated materials.
Pages 61-65 of the O&M manual provide information on the filter press and its required maintenance (cleaning). The filter cake was stored on-site, pending characterization and disposal at the end of the testing. Water removed during filtration and filter cake production was pumped back into the reaction vessel for recirculation.
Some hydrogen is released to the atmosphere by the electrolysis process. Ventilation devices are built into the system as is a hydrogen monitor to insure that hydrogen concentration remains well below the lower explosive limit (four percent). Additional ventilation is provided if hydrogen buildup of one percent is detected, and if this does not mitigate the situation, an alarm state is entered when the level reaches two percent (one-half of the lower explosive limit), automatically stopping the process. ARS claims that no hydrogen buildup (to even one percent) has ever been observed except when ventilation was disabled to test the monitor and control logic.
Hydrogen is not classified as an atmospheric pollutant. The ventilation equipment dilutes the hydrogen with a sufficient quantity of air so that measurement of the resulting output is within the error band of the monitoring instrument. Insufficient hydrogen is generated to make capture for use as a possible fuel a viable option.
ARS also claims that an immeasurable quantity of oxygen is released as free gas. Most of the oxygen resulting from electrolysis is utilized in oxidizing reactions associated with the floc formation.
2.6 Licensing Requirements
There are no special licensing requirements to operate the ARS CFU-50 APC equipment during the ETV test.
2.7 Statement of Performance Objectives
The statement of performance objective tested in the verification is:
The ARS CFU-50 APC process is capable of reducing arsenic concentrations from a water source flowing at a maximum of 35 gpm with a total arsenic concentration of approximately 14 to 68 µg/L and a pH of approximately 7.3 to maintain an effluent arsenic concentration less than 10 µg/L after treatment.
Sampling and analysis of the test site indicated that arsenic concentrations in the 14 to 68 µg/L range would be achieved during the verification test. However, during the verification test, the arsenic concentrations in the feed water ranged only from 11 to 14 µg/L. An evaluation of the analytical data and the test site could not identify a cause for this decrease in arsenic concentrations. This is discussed in greater detail in Chapter 4.
13
2.8 Advantages of the ARS CFU-50 APC Process
According to ARS, the main advantages of the ARS CFU-50 APC process for removing arsenic from water are:
• The process does not require the addition of any water treatment chemicals; • The process is flexible and adaptable to the degree of impurities in the source water; • The process operates over a wide pH range; • The flocculent created during the electrolytic flocculation are easily settleable; • The electrolytic flocculation process creates nascent hydrogen and oxygen, which can also
treat organic compounds, and remove unwanted odors; • The electrolytic flocculation process can also remove variety of metals and radiological
elements (Hg, Pb, Cr, Zn, Cd, Mo, Ni, Ur, etc.); this claim is outside the protocol and was not verified during this test; and
• The electrolytic flocculation process can also remove a variety of polar and cleavable chemicals (not verified during this testing).
The verification testing did not include an evaluation of all of the aforementioned vendor performance claims.
2.9 Potential Limitations of the Equipment
Potential limitations of the ARS CFU-50 APC process for the treatment of raw drinking water with respect to source water quality are (note: these limitations were not verified as part of the verification test):
• Poor water quality in source water can cause high solids loadings to the filter, increasing backwash frequency and quantity of solids generated;
• While the system is automated and operation should be easy, a moderate level of operator skill may be required for successful use of the system. Variable source water quality may require adjustment of the power setting in order to maintain optimal removal efficiency;
• Anodes need replenishment to ensure adequate flocculent generation; • Possible passivation of the plates over days or weeks as a result of insulation buildup on the
anode and cathode plates, depending on the mineral content of the water. This may increase maintenance requirements;
• Electrical power consumption settings need to be calibrated to account for source water with high salinity; and
• For source water with fluctuating target contaminant concentrations, the electrical power consumption settings need to be set to target the highest contaminant concentration; when target contaminant concentrations are at the lower end of the range, treatment will still occur, however, the higher power consumption setting will increase operating costs.
14
Water Quality Inorganic Parameters Other Parameters • Temperature • Arsenic (speciation) • Manganese • Alkalinity • Iron • True Color • Hardness • Aluminum • Total Organic Carbon • pH • Total suspended solids (TOC) • Turbidity (TSS) • Chloride • Residual Chlorine • Sulfate
• Fluoride • Dissolved Oxygen (DO)
Chapter 3 Methods and Procedures
The testing methods and procedures were specified in the Product Specific Test Plan for the Advanced Remediation Systems USA, LLC ARS CFU-50 APC Electroflocculation and Filtration Water Treatment System for Arsenic Removal from Drinking Water (NSF International, March 2006). The PSTP, included in Appendix B, is summarized in this section. Deviations to the PSTP are summarized in Section 4.8 of this report.
3.1 Quantitative and Qualitative Evaluation Criteria
As defined in the ETV protocol, the objectives of the verification are to evaluate equipment in the following areas:
• Report the actual results obtained by the equipment as operated under the conditions at the test site;
• The measurement of residual materials generated during testing; • The impacts on performance of any variations in feed water quality or process variation; • The logistical, human and other resources necessary to operate the equipment; and • The reliability, ruggedness, ranges of usefulness and ease of operation of the equipment.
3.2 Key Water Quality Parameters
Key water quality parameters used for evaluation of the ARS CFU-50 APC are listed in Table 3-1. The Water Quality and Inorganic Parameter columns are the key parameters for evaluating the treatment process and water quality. The parameters listed in the Other Parameters column should not have an immediate impact on the treatment process, but are important parameters in drinking water supplies.
Table 3-1. Key Filtrate Water Quality Parameters
3.3 Operations and Maintenance
ARS provided a draft O&M manual with the ARS CFU-50 APC, which is included in Appendix A. As part of the verification testing, the ETV DWS Center reviewed the O&M documentation
15
for the ARS CFU-50 APC. Results of the review are included in this ETV report. In addition, the following aspects of operability are addressed in the report:
• Fluctuation of flow rates and pressures through the unit; • Presence of devices to aid the operator with flow control adjustment; • Availability of pressure measurement; • Measurement of feed water rate of flow; • Adequacy and ease of use of the PLC control system; • Ease of operating the computer control system; • Generation of residual materials; and • Availability of process data to the operator.
3.4 Environmental Technology Verification Testing Plan
The PSTP for the verification test was prepared in accordance with the ETV Protocol. The PSTP divided the work into three main tasks (A, B, C) with Task C, the verification test itself, divided into six tasks. The PSTP included a Quality Assurance Project Plan (QAPP), which specified procedures to be used to ensure the accurate documentation of both water quality and equipment performance.
An overview of each task is provided below with detailed information on testing procedures presented in later sections.
3.4.1 Task A: Raw Water Characterization
The objective of Task A was to obtain a chemical and physical characterization of the raw water. Information on the groundwater supply that provides the raw water was needed to aid in interpretation of feed water characterization. Grab samples of the raw water were analyzed for the parameters indicated in Table 3-1.
3.4.2 Task B: Arsenic Loss Test
During Task B, The ARS CFU-50 APC was run without supplying electrical power to the reaction vessel to evaluate the arsenic loss across the treatment train without powering the electroflocculation process.
The system was flushed to remove treated water from the tanks and piping, the filters were backwashed, and the waste material was removed. Following system clean out, the system was operated continuously for 24 hours. Feed water and filtrate samples were collected at six-hour intervals and analyzed for the parameters indicated in Table 3-1, in accordance with the PSTP.
3.4.3 Task C: Verification Test Procedures
Task 1: Verification Testing Runs
The ARS CFU-50 APC was operated over a 14–day timeframe to collect data on equipment performance and water quality for purposes of performance verification. During this timeframe,
16
operational problems with the filter press caused the system to shut down, resulting in an actual operation time of 287 hours, less than identified in the PSTP. The operational problems are described in greater detail in Chapter 4. Daily measurements and observation of operating parameters were made, and samples collected of the feed water and filtrate for analysis. Testing included one 48-hour intensive survey period. Results are presented in Chapter 4.
Task 2: Raw Water, Feed Water, and Filtrate Water Quality
During verification testing, feed water and filtrate water samples were collected and appropriate sample analyses performed. Samples were analyzed for aluminum to monitor the electroflocculation process, arsenic to evaluate arsenic removal, and other water quality analyses, such as pH, turbidity, hardness, alkalinity, etc., to monitor the impact of the treatment process on water quality.
Task 3: Operating Conditions and Performance
During verification testing, operating conditions and performance of the water treatment equipment were documented. Equipment performance information collected included data on filtrate flow rate and total filtrate volume produced, pressure differential across the granular media filters, electrical energy used and maintenance required during operation.
The PSTP called for collection of other filter operation data, including filter run lengths, frequency and duration of backwash cycles, and volume of water treated per filter run. This information was not collected during the testing, as described in Chapter 4.
Task 4: Total Arsenic Removal
Total arsenic in the feed and filtrate samples were measured to evaluate total arsenic removal during verification testing. Samples were collected daily over the 14-day period. This test phase included a 48-hour intensive sampling period that occurred at the end of the first week of testing. During this phase, samples were collected at the start (hour 0) and after hours 1, 3, 6, 12, 18 and 24; the filter was then backwashed and samples were collected at the same time intervals over the next 24 hours as during the first 24 hours.
All samples were analyzed for total arsenic, aluminum, pH, iron and residual chlorine. Other water quality parameters were analyzed at less frequent intervals. Speciation of arsenic was completed on samples collected at hours 0, 24 and 48 of the intensive sampling period.
Task 5: Data Management
The objective of this task was to establish an effective field protocol for data management at the field operations site, and for data transmission between the FTO and the ETV DWS Center. Master field logs were prepared and field sheets for data collection were used to ensure all scheduled activities were performed. The logs were delivered to the ETV DWS Center project coordinator on a weekly basis.
17
Task 6: Quality Assurance/Quality Control (QA/QC)
An important aspect of verification testing was the development of specific QA/QC procedures. The objective of this task was to assure accurate measurement of operational and water quality parameters during the verification test. Weekly and one-time QA/QC verifications were specified in the QAPP in Chapter 5 of the PSTP. Equipment flow rates were documented on a daily basis, and a daily walkthrough was completed to verify that each piece of equipment or instrumentation was operating properly. An audit of the FTO was also conducted during the testing.
3.5 Operation and Maintenance
An O&M manual was received from ARS when the ARS CFU-50 APC was installed. NSF reviewed the O&M manual and evaluated the instructions and procedures for their applicability during the verification test and for overall completeness.
3.5.1 Operability Evaluation
The basis of the review and evaluation for equipment operability during verification testing was formed from the factors listed below. These aspects of plant operation are reported, to the extent practical, in Chapter 4 of this report.
The factors considered included:
• Can automatic backwash be initiated by: − Reaching a set value for head loss? − Default minimum time?
• Is granular media pressure differential measurement provided? • Is rate of flow of feed water measured? • Is backwash rate of flow measured and variable? • Is backwash duration (time) variable?
Other factors and questions included:
• Does the equipment have sensors or monitoring equipment that can detect an equipment malfunction, unsatisfactory filtrate water quality, or operating conditions that exceed allowable limits?
• If so, during such situations can the equipment be automatically shut down? • Upon automatic shutdown, can notification be provided if the operator is not present?
18
Chapter 4 Results and Discussion
4.1 Introduction
The verification test program for the ARS CFU-50 APC began with equipment installation at the Bernalillo Well #3 site in Bernalillo, New Mexico, in April 2006 and ended with the completion of the verification test on May 2, 2006. The test site was described in Section 1.3. The ARS CFU-50 APC was described in Chapter 2.
The equipment was installed prior to the beginning of the ETV tests. Raw water characterization samples were collected on February 24 and March 9, 2005, prior to ETV tests. The arsenic loss test was performed from May 1-2, 2006. The 14-day verification test, including a 48-hour intensive survey, was performed from April 18 through May 1, 2006.
This chapter presents a summary of the water quality and operating data collected during the verification test. Activities and data collected during the start-up and shakedown of the equipment, and the raw water characterization were performed prior to the actual 14-day verification test. The arsenic loss test was performed immediately after the 14-day verification test. The results from the 14-day verification test are presented, including data on the feed and filtrate water arsenic concentration and other water quality parameters. Operating data are presented to describe the flow rates, volume of treated water produced, backwash information, pressure differential across the sand filter, electrical power, and related operating information. QA/QC information, as described by the QAPP in the PSTP for this verification test, is presented at the end of the chapter.
4.2 Equipment Installation, Start-up, and Shakedown
At the beginning of the ETV project, ARS and FTO personnel performed a thorough evaluation of the installation. This included ARS training FTO personnel on operations, maintenance of the device for FTO personnel, and FTO personnel conducting an evaluation on such things as how and where water samples would be collected, where critical flow and pressure readings would be read and recorded, a full evaluation of the PLC’s operating capabilities, maintenance requirements (especially how to maintain the filter press), emergency/safety considerations, and startup/shutdown operations). Based on tests conducted by ARS prior to ETV testing, it was determined that 30 amps of electrical power would need to be delivered to the reaction vessel in order to reduce the arsenic concentrations to a level consistently below 10 µg/L.
4.2.1 Flow Measurement
As part of normal operating conditions, the feed and filtrate water pumps, which pump water into the reaction vessel and drinking water reservoir tank, respectively, shut off intermittently, as controlled by the PLC. A high water level sensor in the reaction vessel would shut off the feed water flow when actuated, and the high and low level sensors in the drinking water reservoir tank would actuate the filtrate water pump. The instantaneous flow rate readings noted by the FTO were recorded when the respective pumps were operating. The actual flow rate through the system is less than either of the readings from these flow monitors. For the purposes of this
19
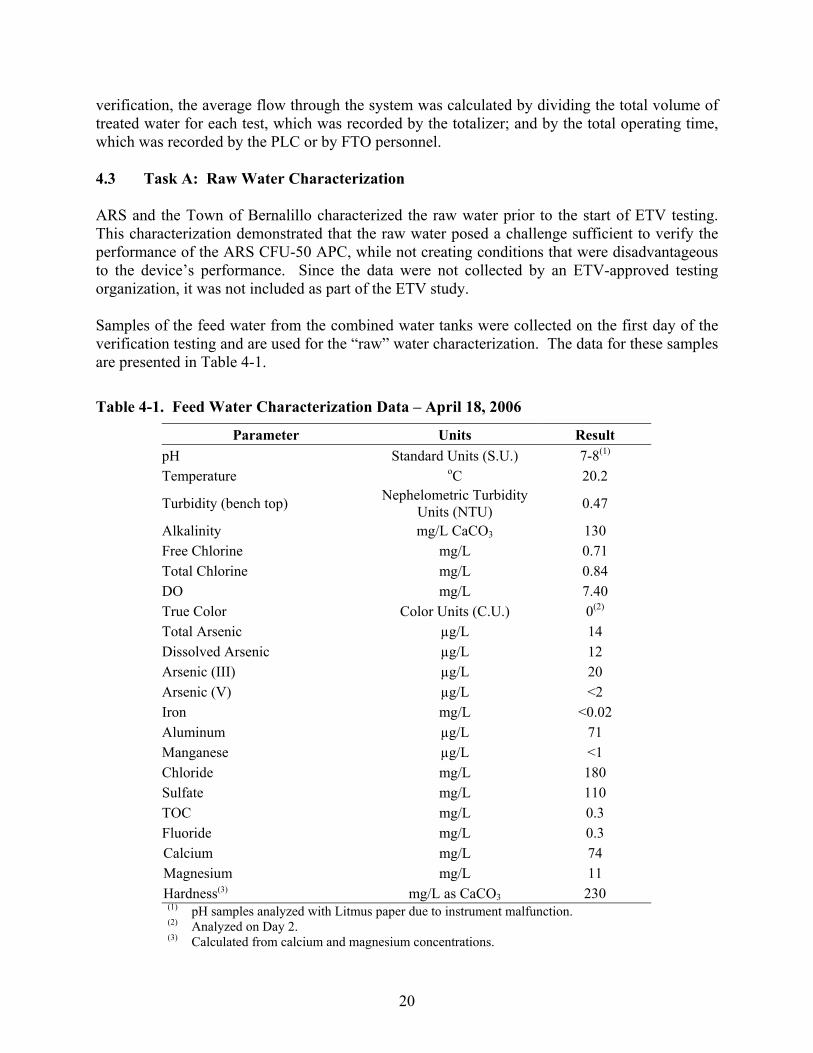
Parameter Units Result pH Temperature
Turbidity (bench top)
AlkalinityFree Chlorine Total Chlorine DO True Color Total Arsenic Dissolved Arsenic Arsenic (III) Arsenic (V) Iron AluminumManganese Chloride Sulfate TOC Fluoride CalciumMagnesiumHardness(3)
Standard Units (S.U.) oC
Nephelometric Turbidity Units (NTU)
mg/L CaCO3
mg/L mg/L mg/L
Color Units (C.U.) µg/L µg/L µg/L µg/L mg/L
µg/L µg/L mg/L mg/L mg/L mg/L
mg/L mg/L
mg/L as CaCO3
7-8(1)
20.2
0.47
130 0.71 0.84 7.40 0(2)
14 12 20 <2
<0.02 71 <1 180 110 0.3 0.3 74 11
230 (1)
(2)
(3)
pH samples analyzed with Litmus paper due to instrument malfunction. Analyzed on Day 2. Calculated from calcium and magnesium concentrations.
verification, the average flow through the system was calculated by dividing the total volume of treated water for each test, which was recorded by the totalizer; and by the total operating time, which was recorded by the PLC or by FTO personnel.
4.3 Task A: Raw Water Characterization
ARS and the Town of Bernalillo characterized the raw water prior to the start of ETV testing. This characterization demonstrated that the raw water posed a challenge sufficient to verify the performance of the ARS CFU-50 APC, while not creating conditions that were disadvantageous to the device’s performance. Since the data were not collected by an ETV-approved testing organization, it was not included as part of the ETV study.
Samples of the feed water from the combined water tanks were collected on the first day of the verification testing and are used for the “raw” water characterization. The data for these samples are presented in Table 4-1.
Table 4-1. Feed Water Characterization Data – April 18, 2006
20
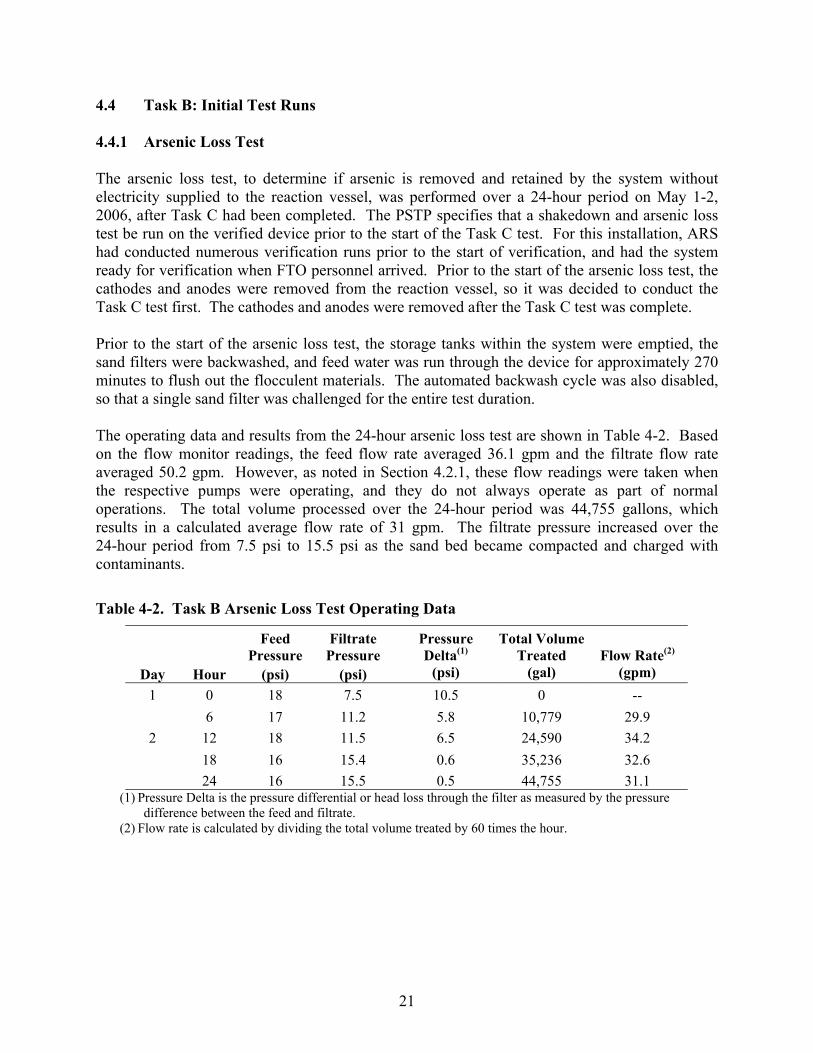
Feed Filtrate Pressure Total Volume Pressure Pressure Delta(1) Treated Flow Rate(2)
Day Hour (psi) (psi) (psi) (gal) (gpm) 1 0 18 7.5 10.5 0 --
6 17 11.2 5.8 10,779 29.9
2 12 18 11.5 6.5 24,590 34.2
18 16 15.4 0.6 35,236 32.6
24 16 15.5 0.5 44,755 31.1 (1) Pressure Delta is the pressure differential or head loss through the filter as measured by the pressure
difference between the feed and filtrate. (2) Flow rate is calculated by dividing the total volume treated by 60 times the hour.
4.4 Task B: Initial Test Runs
4.4.1 Arsenic Loss Test
The arsenic loss test, to determine if arsenic is removed and retained by the system without electricity supplied to the reaction vessel, was performed over a 24-hour period on May 1-2, 2006, after Task C had been completed. The PSTP specifies that a shakedown and arsenic loss test be run on the verified device prior to the start of the Task C test. For this installation, ARS had conducted numerous verification runs prior to the start of verification, and had the system ready for verification when FTO personnel arrived. Prior to the start of the arsenic loss test, the cathodes and anodes were removed from the reaction vessel, so it was decided to conduct the Task C test first. The cathodes and anodes were removed after the Task C test was complete.
Prior to the start of the arsenic loss test, the storage tanks within the system were emptied, the sand filters were backwashed, and feed water was run through the device for approximately 270 minutes to flush out the flocculent materials. The automated backwash cycle was also disabled, so that a single sand filter was challenged for the entire test duration.
The operating data and results from the 24-hour arsenic loss test are shown in Table 4-2. Based on the flow monitor readings, the feed flow rate averaged 36.1 gpm and the filtrate flow rate averaged 50.2 gpm. However, as noted in Section 4.2.1, these flow readings were taken when the respective pumps were operating, and they do not always operate as part of normal operations. The total volume processed over the 24-hour period was 44,755 gallons, which results in a calculated average flow rate of 31 gpm. The filtrate pressure increased over the 24-hour period from 7.5 psi to 15.5 psi as the sand bed became compacted and charged with contaminants.
Table 4-2. Task B Arsenic Loss Test Operating Data
21

Table 4-3 presents the water quality for the arsenic loss test. The statistical calculations of these data are presented in Appendix C. There was no loss of arsenic through the system over the 24-hour test, with both the feed and filtrate water total arsenic averaging 11 µg/L. Arsenic (III) was the predominant arsenic species in the feed water. Aluminum concentrations increased slightly through the system. All other water quality indicators remained steady and passed through the filter.
22
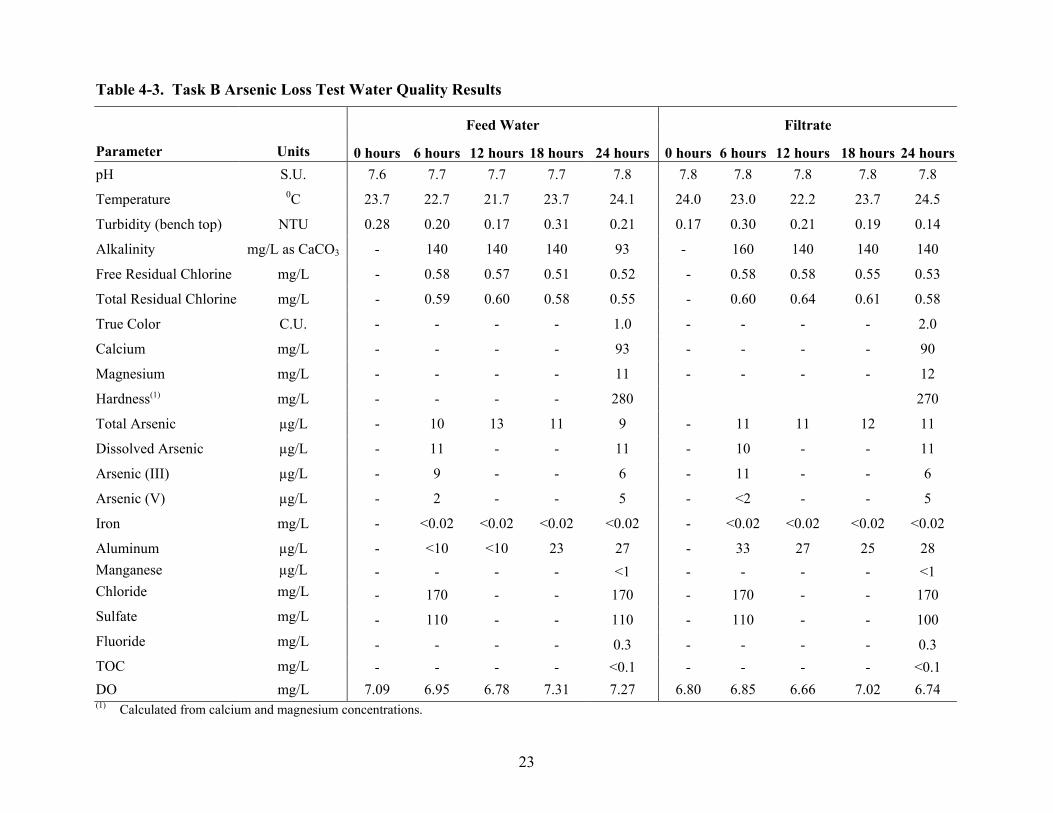
Table 4-3. Task B Arsenic Loss Test Water Quality Results
Parameter Units 0 hours
Feed Water
6 hours 12 hours 18 hours 24 hours
Filtrate
0 hours 6 hours 12 hours 18 hours 24 hours pH S.U. 7.6 7.7 7.7 7.7 7.8 7.8 7.8 7.8 7.8 7.8
Temperature 0C 23.7 22.7 21.7 23.7 24.1 24.0 23.0 22.2 23.7 24.5
Turbidity (bench top) NTU 0.28 0.20 0.17 0.31 0.21 0.17 0.30 0.21 0.19 0.14
Alkalinity mg/L as CaCO3 - 140 140 140 93 - 160 140 140 140
Free Residual Chlorine mg/L - 0.58 0.57 0.51 0.52 - 0.58 0.58 0.55 0.53
Total Residual Chlorine mg/L - 0.59 0.60 0.58 0.55 - 0.60 0.64 0.61 0.58
True Color C.U. - - - - 1.0 - - - - 2.0
Calcium mg/L - - - - 93 - - - - 90
Magnesium mg/L - - - - 11 - - - - 12
Hardness(1) mg/L - - - - 280 270
Total Arsenic µg/L - 10 13 11 9 - 11 11 12 11
Dissolved Arsenic µg/L - 11 - - 11 - 10 - - 11
Arsenic (III) µg/L - 9 - - 6 - 11 - - 6
Arsenic (V) µg/L - 2 - - 5 - <2 - - 5
Iron mg/L - <0.02 <0.02 <0.02 <0.02 - <0.02 <0.02 <0.02 <0.02
Aluminum µg/L - <10 <10 23 27 - 33 27 25 28 Manganese µg/L - - - - <1 - - - - <1 Chloride mg/L - 170 - - 170 - 170 - - 170 Sulfate mg/L - 110 - - 110 - 110 - - 100 Fluoride mg/L - - - - 0.3 - - - - 0.3 TOC mg/L - - - - <0.1 - - - - <0.1 DO mg/L 7.09 6.95 6.78 7.31 7.27 6.80 6.85 6.66 7.02 6.74 (1) Calculated from calcium and magnesium concentrations.
23
4.5 Task C: Verification Test
4.5.1 Operating Results
The ARS CFU-50 APC was set to the operating criteria established by ARS prior to ETV testing. Electrical power settings to the reaction vessel and other operational settings were set and verified prior to the start of testing. The verification test was started on April 18, 2006.
Table 4-4 shows the daily operating data for the verification test. During the test, there were a total of four incidents (April 20, 21, 28, and 30) where a sensor triggered the PLC to shut down operations. During each incident, the sensor indicated that either the floc water reservoir tank (see Figure 2-1) had exceeded capacity or the filter press alarm went off. Under the FTO’s supervision, ARS personnel analyzed the incidents and determined that in each instance, the filter press had clogged to a point where it was prohibiting sufficient filtration to maintain the device’s rated throughput. ARS personnel recommended that the filter press be cleaned a minimum of once every 24 hours to prevent the ARS CFU-50 APC from automatically shutting down. After each shutdown incident, FTO personnel cleaned the filter press and resumed operation in accordance with the startup procedures outlined in the ARS O&M manual. As a result of these incidents, the ARS CFU-50 APC experienced approximately 36 hours of downtime during the 14-day verification test.
The flow rate noted in Table 4-4 was calculated by dividing the volume of water treated by the device by the operating time. It is not associated with the instantaneous readings of any particular pump. During days when the device was functioning properly, the typical volume of water produced ranged from approximately 45,000 to 47,000 gpd or approximately 31.3 to 32.6 gpm. During these days, the average flow rate was 32.1 gpm. Over the entire test duration (approximately 287 hours), the filtrate flow rate was approximately 30.7 gpm. The filter influent pump was programmed to operate at a near-constant flow rate of 35 gpm. The difference in the flow rate for the device as a whole and this pump can be attributed to recirculated backwash water.
The system pressure was monitored at the feed and filtrate water locations (upstream and downstream of the sand filters). The FTO technician recorded the pressure readings in Table 4-4 manually as part of routine sampling and inspections. The ARS CFU-50 APC backwash cycles were programmed to initiate when the pressure differential reached 15 psi. The FTO pressure readings were not scheduled to evaluate whether the pressure differential reached 15 psi. Furthermore, the ARS CFU-50 APC PLC was not programmed to record pressure differentials at the start of backwash cycles, so the pressure differential evaluation for this verification was limited to whether the differential exceeded 15 psi during the time the FTO personnel inspected the device. There was one instance (April 28) when the pressure differential reached 15.9 psi; otherwise, the pressure differential noted by FTO personnel during sampling and inspection was below the 15 psi threshold, and averaged 10.9 psi during the inspections.
The amperage to the reaction vessel remained constant at 30 amps throughout the verification test, while the voltage averaged 4.23 volts and ranged between 3.84 and 5.51 volts.
24
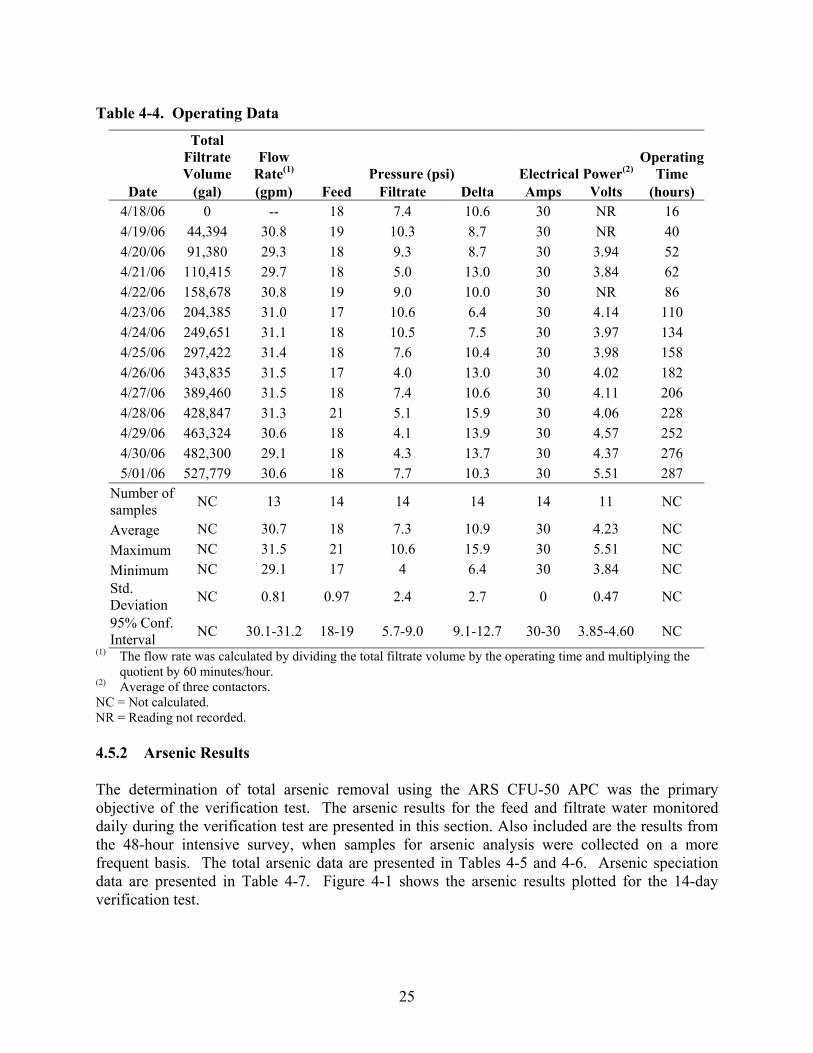
Table 4-4. Operating Data
Total Filtrate Volume
Flow Rate(1) Pressure (psi) Electrical Power(2)
Operating Time
Date (gal) (gpm) Feed Filtrate Delta Amps Volts (hours) 4/18/06 0 -- 18 7.4 10.6 30 NR 16 4/19/06 44,394 30.8 19 10.3 8.7 30 NR 40 4/20/06 91,380 29.3 18 9.3 8.7 30 3.94 52 4/21/06 110,415 29.7 18 5.0 13.0 30 3.84 62 4/22/06 158,678 30.8 19 9.0 10.0 30 NR 86 4/23/06 204,385 31.0 17 10.6 6.4 30 4.14 110 4/24/06 249,651 31.1 18 10.5 7.5 30 3.97 134 4/25/06 297,422 31.4 18 7.6 10.4 30 3.98 158 4/26/06 343,835 31.5 17 4.0 13.0 30 4.02 182 4/27/06 389,460 31.5 18 7.4 10.6 30 4.11 206 4/28/06 428,847 31.3 21 5.1 15.9 30 4.06 228 4/29/06 463,324 30.6 18 4.1 13.9 30 4.57 252 4/30/06 482,300 29.1 18 4.3 13.7 30 4.37 276 5/01/06 527,779 30.6 18 7.7 10.3 30 5.51 287
Number of samples NC 13 14 14 14 14 11 NC
Average NC 30.7 18 7.3 10.9 30 4.23 NC Maximum NC 31.5 21 10.6 15.9 30 5.51 NC Minimum NC 29.1 17 4 6.4 30 3.84 NC Std. Deviation NC 0.81 0.97 2.4 2.7 0 0.47 NC
95% Conf. NC 30.1-31.2 18-19 5.7-9.0 9.1-12.7 30-30 3.85-4.60 NCInterval (1) The flow rate was calculated by dividing the total filtrate volume by the operating time and multiplying the
quotient by 60 minutes/hour. (2) Average of three contactors. NC = Not calculated. NR = Reading not recorded.
4.5.2 Arsenic Results
The determination of total arsenic removal using the ARS CFU-50 APC was the primary objective of the verification test. The arsenic results for the feed and filtrate water monitored daily during the verification test are presented in this section. Also included are the results from the 48-hour intensive survey, when samples for arsenic analysis were collected on a more frequent basis. The total arsenic data are presented in Tables 4-5 and 4-6. Arsenic speciation data are presented in Table 4-7. Figure 4-1 shows the arsenic results plotted for the 14-day verification test.
25
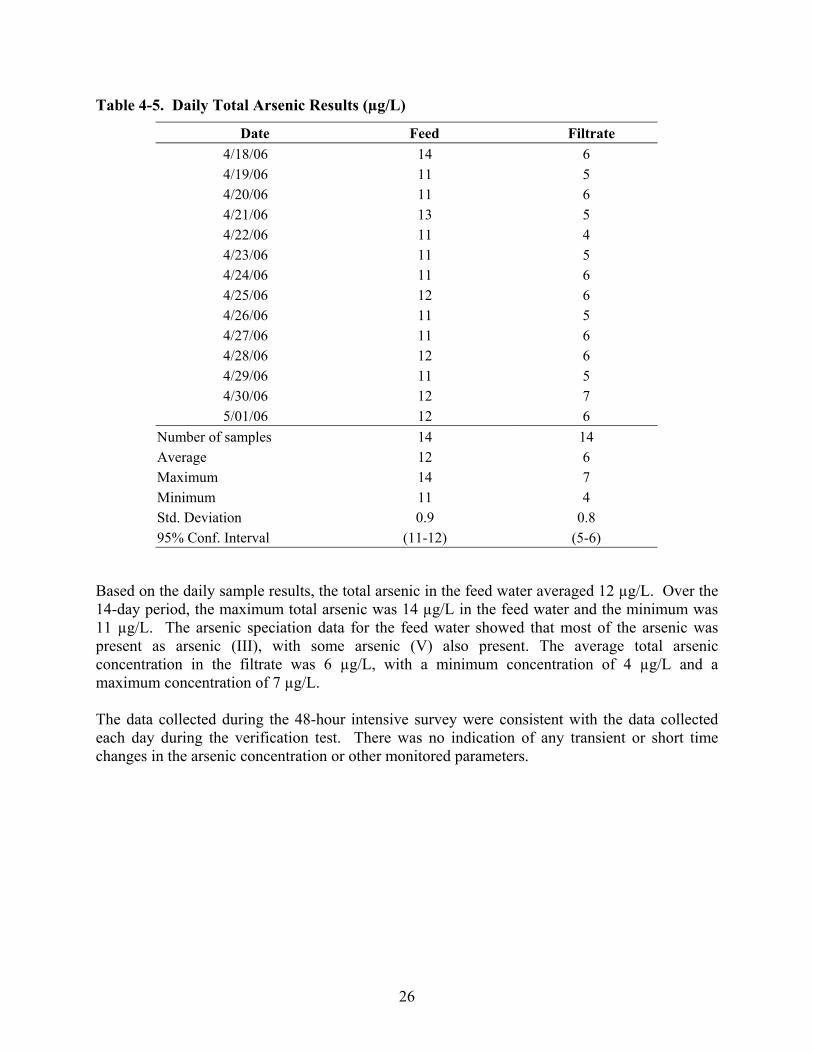
Date Feed Filtrate 4/18/06 14 6 4/19/06 11 5 4/20/06 11 6 4/21/06 13 5 4/22/06 11 4 4/23/06 11 5 4/24/06 11 6 4/25/06 12 6 4/26/06 11 5 4/27/06 11 6 4/28/06 12 6 4/29/06 11 5 4/30/06 12 7 5/01/06 12 6
Number of samples 14 14 Average 12 6 Maximum 14 7 Minimum 11 4 Std. Deviation 0.9 0.8 95% Conf. Interval (11-12) (5-6)
Table 4-5. Daily Total Arsenic Results (µg/L)
Based on the daily sample results, the total arsenic in the feed water averaged 12 µg/L. Over the 14-day period, the maximum total arsenic was 14 µg/L in the feed water and the minimum was 11 µg/L. The arsenic speciation data for the feed water showed that most of the arsenic was present as arsenic (III), with some arsenic (V) also present. The average total arsenic concentration in the filtrate was 6 µg/L, with a minimum concentration of 4 µg/L and a maximum concentration of 7 µg/L.
The data collected during the 48-hour intensive survey were consistent with the data collected each day during the verification test. There was no indication of any transient or short time changes in the arsenic concentration or other monitored parameters.
26
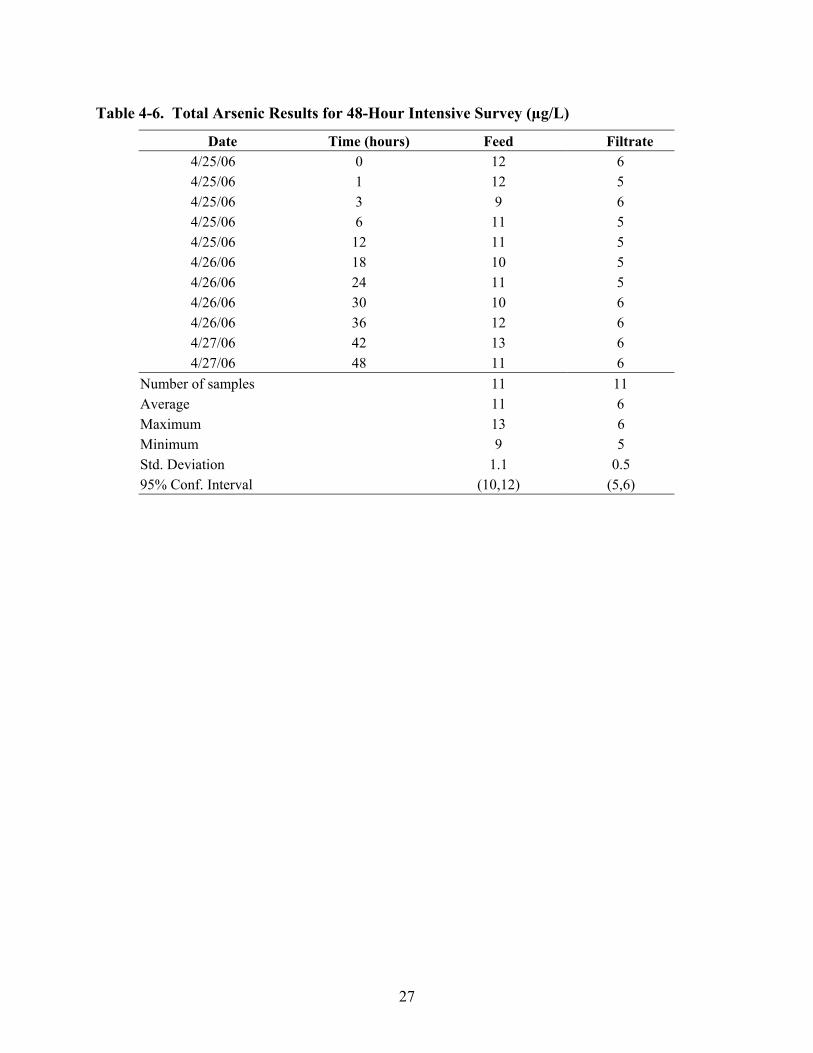
Date Time (hours) Feed Filtrate 4/25/06 0 12 6 4/25/06 1 12 5 4/25/06 3 9 6 4/25/06 6 11 5 4/25/06 12 11 5 4/26/06 18 10 5 4/26/06 24 11 5 4/26/06 30 10 6 4/26/06 36 12 6 4/27/06 42 13 6 4/27/06 48 11 6
Number of samples 11 11 Average 11 6Maximum 13 6Minimum 9 5Std. Deviation 1.1 0.5 95% Conf. Interval (10,12) (5,6)
Table 4-6. Total Arsenic Results for 48-Hour Intensive Survey (µg/L)
27
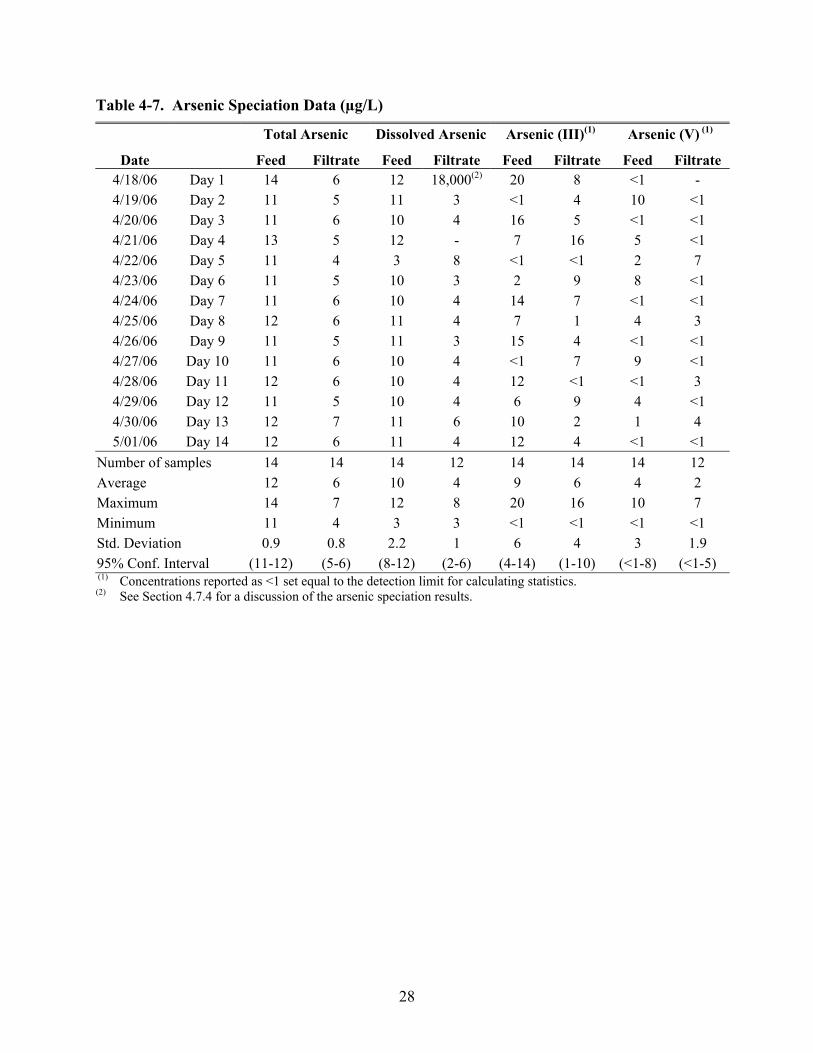
Total Arsenic Dissolved Arsenic Arsenic (III)(1) Arsenic (V) (1)
Date Feed Filtrate Feed Filtrate Feed Filtrate Feed Filtrate 4/18/06 Day 1 14 6 12 18,000(2) 20 8 <1 -4/19/06 Day 2 11 5 11 3 <1 4 10 <1 4/20/06 Day 3 11 6 10 4 16 5 <1 <1 4/21/06 Day 4 13 5 12 - 7 16 5 <1 4/22/06 Day 5 11 4 3 8 <1 <1 2 7 4/23/06 Day 6 11 5 10 3 2 9 8 <1 4/24/06 Day 7 11 6 10 4 14 7 <1 <1 4/25/06 Day 8 12 6 11 4 7 1 4 3 4/26/06 Day 9 11 5 11 3 15 4 <1 <1 4/27/06 Day 10 11 6 10 4 <1 7 9 <1 4/28/06 Day 11 12 6 10 4 12 <1 <1 3 4/29/06 Day 12 11 5 10 4 6 9 4 <1 4/30/06 Day 13 12 7 11 6 10 2 1 4 5/01/06 Day 14 12 6 11 4 12 4 <1 <1
Number of samples 14 14 14 12 14 14 14 12 Average 12 6 10 4 9 6 4 2 Maximum 14 7 12 8 20 16 10 7 Minimum 11 4 3 3 <1 <1 <1 <1 Std. Deviation 0.9 0.8 2.2 1 6 4 3 1.9 95% Conf. Interval (11-12) (5-6) (8-12) (2-6) (4-14) (1-10) (<1-8) (<1-5) (1)
(2) Concentrations reported as <1 set equal to the detection limit for calculating statistics. See Section 4.7.4 for a discussion of the arsenic speciation results.
Table 4-7. Arsenic Speciation Data (µg/L)
28
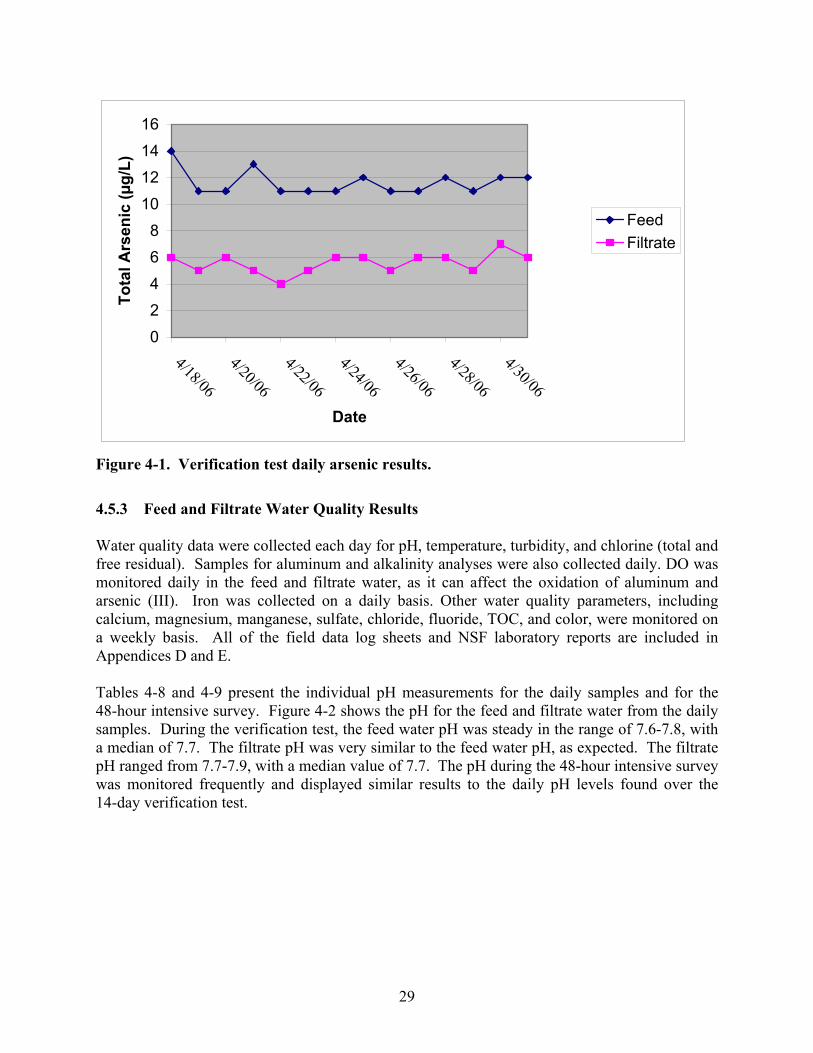
0
2 4
6 8
10
12 14
16
4/18/06
4/20/06
4/22/06
4/24/06
4/26/06
4/28/06
4/30/06 Date
Tota
l Ars
enic
(µg/
L)
Feed Filtrate
Figure 4-1. Verification test daily arsenic results.
4.5.3 Feed and Filtrate Water Quality Results
Water quality data were collected each day for pH, temperature, turbidity, and chlorine (total and free residual). Samples for aluminum and alkalinity analyses were also collected daily. DO was monitored daily in the feed and filtrate water, as it can affect the oxidation of aluminum and arsenic (III). Iron was collected on a daily basis. Other water quality parameters, including calcium, magnesium, manganese, sulfate, chloride, fluoride, TOC, and color, were monitored on a weekly basis. All of the field data log sheets and NSF laboratory reports are included in Appendices D and E.
Tables 4-8 and 4-9 present the individual pH measurements for the daily samples and for the 48-hour intensive survey. Figure 4-2 shows the pH for the feed and filtrate water from the daily samples. During the verification test, the feed water pH was steady in the range of 7.6-7.8, with a median of 7.7. The filtrate pH was very similar to the feed water pH, as expected. The filtrate pH ranged from 7.7-7.9, with a median value of 7.7. The pH during the 48-hour intensive survey was monitored frequently and displayed similar results to the daily pH levels found over the 14-day verification test.
29
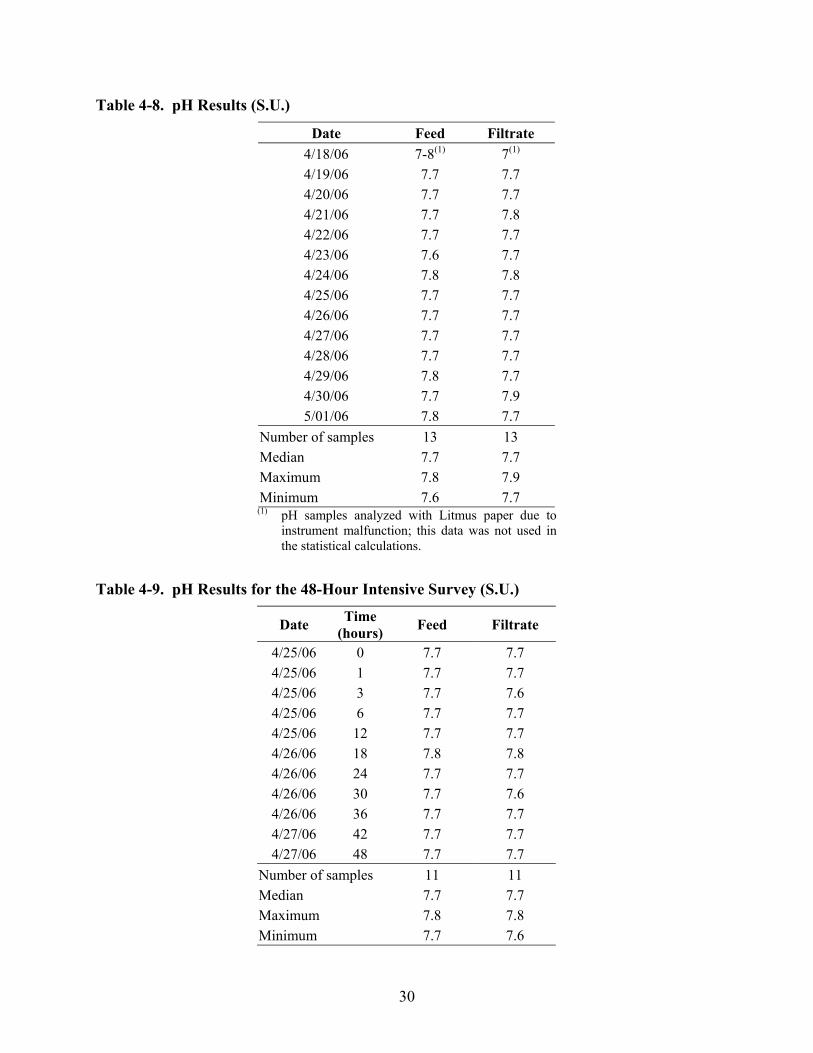
Date Feed Filtrate 7(1) 4/18/06 7-8(1)
4/19/06 7.7 7.7 4/20/06 7.7 7.7 4/21/06 7.7 7.8 4/22/06 7.7 7.7 4/23/06 7.6 7.7 4/24/06 7.8 7.8 4/25/06 7.7 7.7 4/26/06 7.7 7.7 4/27/06 7.7 7.7 4/28/06 7.7 7.7 4/29/06 7.8 7.7 4/30/06 7.7 7.9 5/01/06 7.8 7.7
Number of samples 13 13 Median 7.7 7.7 Maximum 7.8 7.9 Minimum 7.6 7.7
(1) pH samples analyzed with Litmus paper due to instrument malfunction; this data was not used in the statistical calculations.
Date Time(hours) Feed Filtrate
4/25/06 0 7.7 7.7 4/25/06 1 7.7 7.7 4/25/06 3 7.7 7.6 4/25/06 6 7.7 7.7 4/25/06 12 7.7 7.7 4/26/06 18 7.8 7.8 4/26/06 24 7.7 7.7 4/26/06 30 7.7 7.6 4/26/06 36 7.7 7.7 4/27/06 42 7.7 7.7 4/27/06 48 7.7 7.7
Number of samples 11 11 Median 7.7 7.7 Maximum 7.8 7.8 Minimum 7.7 7.6
Table 4-8. pH Results (S.U.)
Table 4-9. pH Results for the 48-Hour Intensive Survey (S.U.)
30
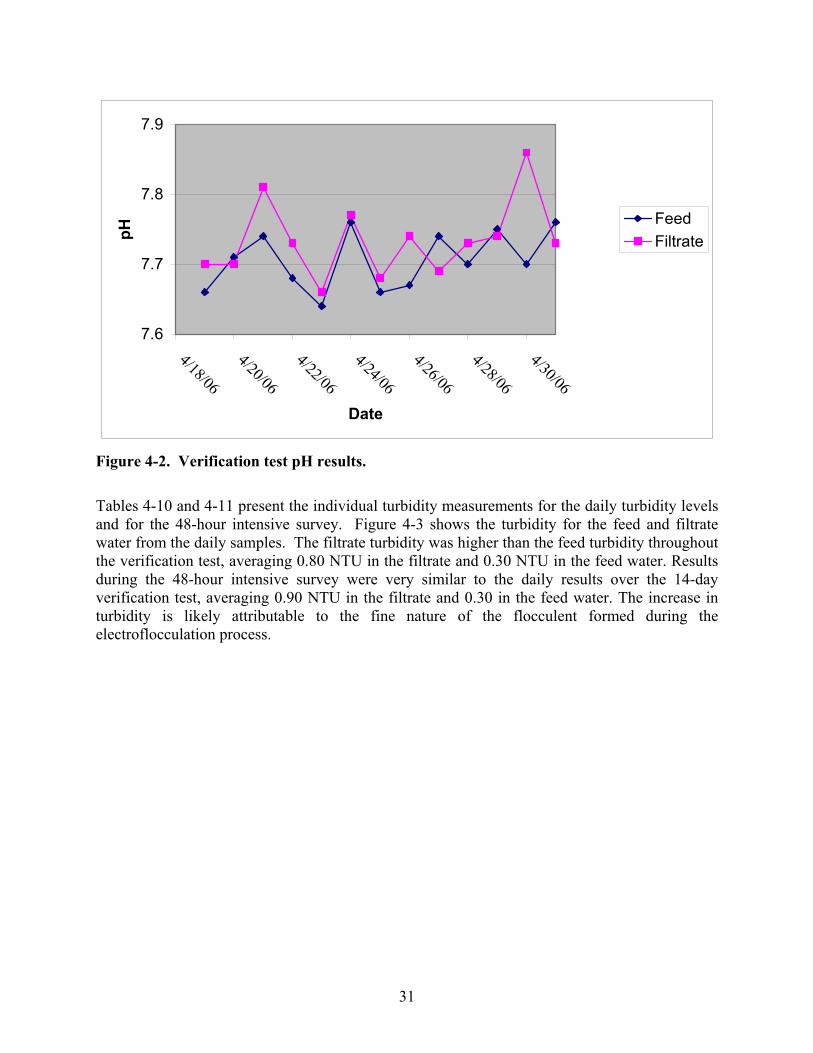
7.6
7.7
7.8
7.9
4/18/06
4/20/06
4/22/06
4/24/06
4/26/06
4/28/06
4/30/06 Date
pH
Feed Filtrate
Figure 4-2. Verification test pH results.
Tables 4-10 and 4-11 present the individual turbidity measurements for the daily turbidity levels and for the 48-hour intensive survey. Figure 4-3 shows the turbidity for the feed and filtrate water from the daily samples. The filtrate turbidity was higher than the feed turbidity throughout the verification test, averaging 0.80 NTU in the filtrate and 0.30 NTU in the feed water. Results during the 48-hour intensive survey were very similar to the daily results over the 14-day verification test, averaging 0.90 NTU in the filtrate and 0.30 in the feed water. The increase in turbidity is likely attributable to the fine nature of the flocculent formed during the electroflocculation process.
31
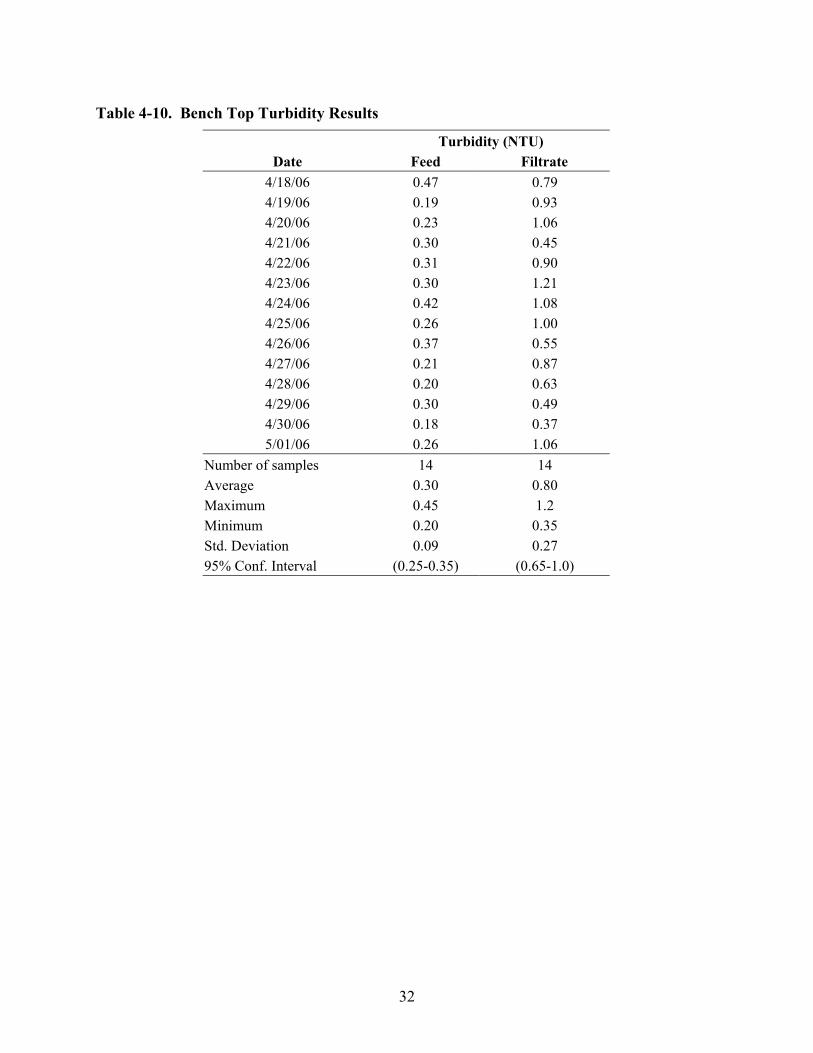
Table 4-10. Bench Top Turbidity Results
Turbidity (NTU) Date Feed Filtrate
4/18/06 0.47 0.79 4/19/06 0.19 0.93 4/20/06 0.23 1.06 4/21/06 0.30 0.45 4/22/06 0.31 0.90 4/23/06 0.30 1.21 4/24/06 0.42 1.08 4/25/06 0.26 1.00 4/26/06 0.37 0.55 4/27/06 0.21 0.87 4/28/06 0.20 0.63 4/29/06 0.30 0.49 4/30/06 0.18 0.37 5/01/06 0.26 1.06
Number of samples 14 14 Average 0.30 0.80 Maximum 0.45 1.2 Minimum 0.20 0.35 Std. Deviation 0.09 0.27 95% Conf. Interval (0.25-0.35) (0.65-1.0)
32
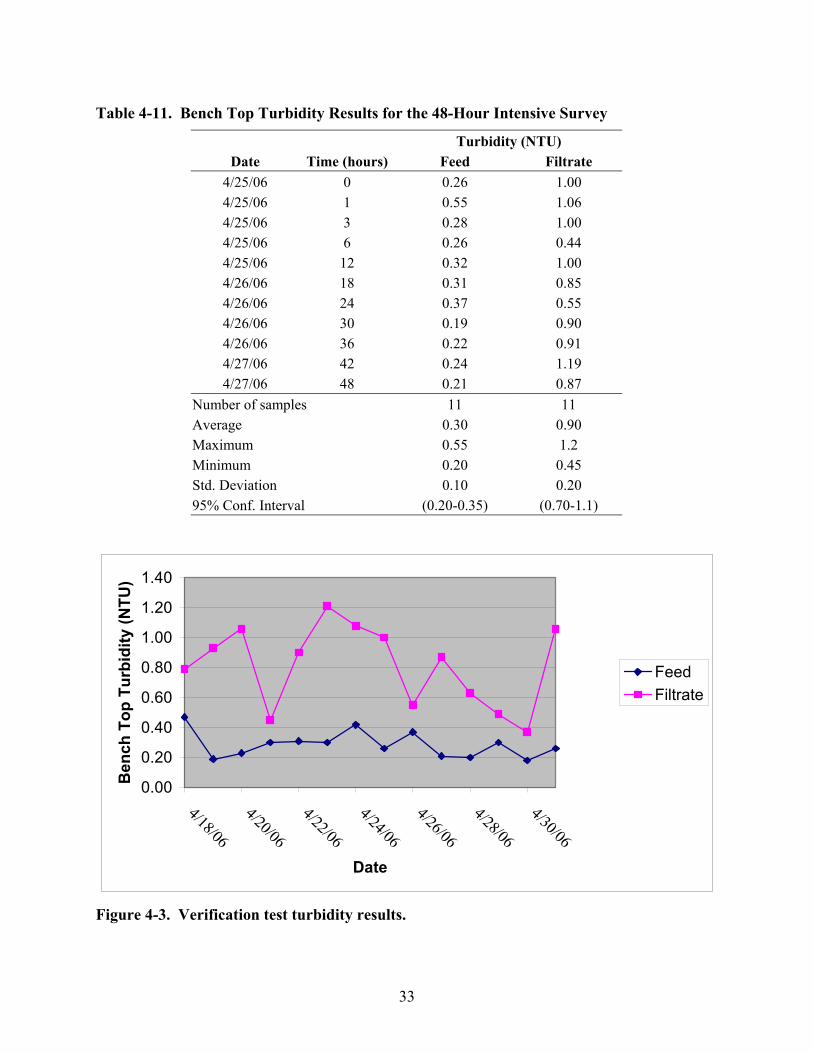
Turbidity (NTU) Date Time (hours) Feed Filtrate
4/25/06 0 0.26 1.00 4/25/06 1 0.55 1.06 4/25/06 3 0.28 1.00 4/25/06 6 0.26 0.44 4/25/06 12 0.32 1.00 4/26/06 18 0.31 0.85 4/26/06 24 0.37 0.55 4/26/06 30 0.19 0.90 4/26/06 36 0.22 0.91 4/27/06 42 0.24 1.19 4/27/06 48 0.21 0.87
Number of samples 11 11 Average 0.30 0.90 Maximum 0.55 1.2 Minimum 0.20 0.45 Std. Deviation 0.10 0.20 95% Conf. Interval (0.20-0.35) (0.70-1.1)
Table 4-11. Bench Top Turbidity Results for the 48-Hour Intensive Survey
0.00
0.20
0.40
0.60
0.80
1.00
1.20
1.40
4/18/06
4/20/06
4/22/06
4/24/06
4/26/06
4/28/06
4/30/06 Date
Ben
ch T
op T
urbi
dity
(NTU
)
Feed Filtrate
Figure 4-3. Verification test turbidity results.
33
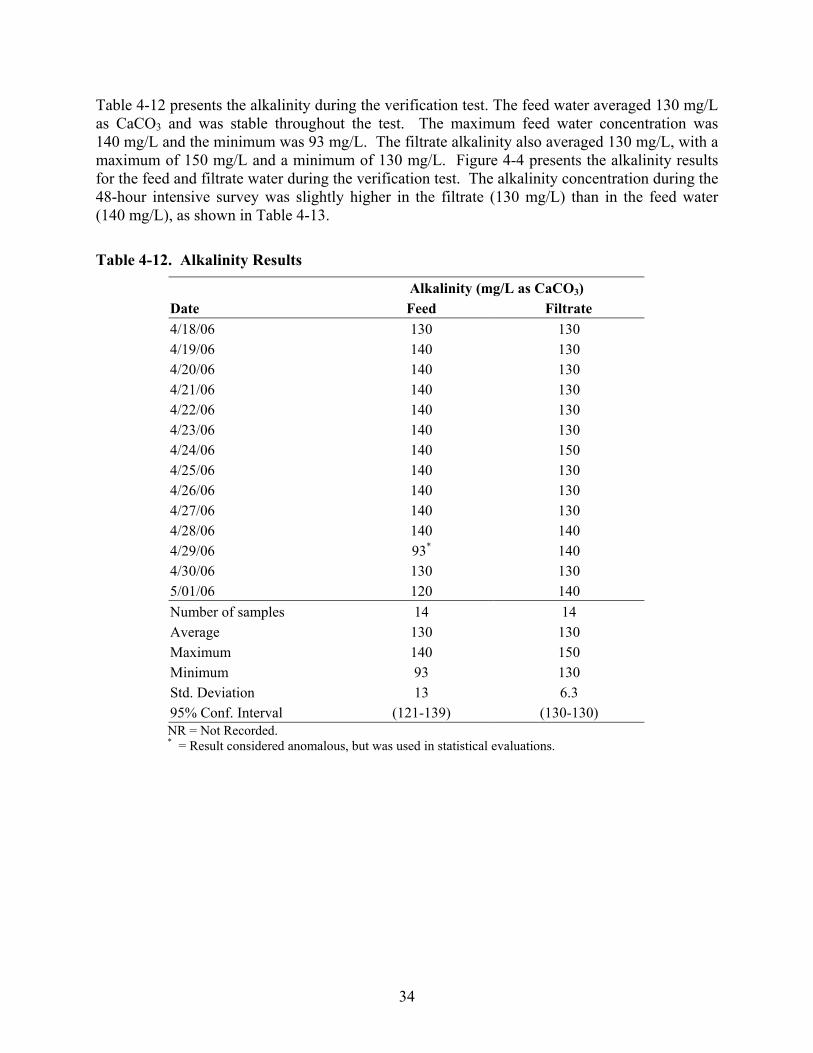
Alkalinity (mg/L as CaCO3) Date Feed Filtrate 4/18/064/19/064/20/064/21/064/22/064/23/064/24/064/25/064/26/064/27/064/28/064/29/064/30/065/01/06
130 140 140 140 140 140 140 140 140 140 140 93*
130 120
130 130 130 130 130 130 150 130 130 130 140
140 130 140
Number of samples 14 14 Average 130 130 Maximum 140 150 Minimum 93 130 Std. Deviation 13 6.3 95% Conf. Interval (121-139) (130-130) NR = Not Recorded. * = Result considered anomalous, but was used in statistical evaluations.
Table 4-12 presents the alkalinity during the verification test. The feed water averaged 130 mg/L as CaCO3 and was stable throughout the test. The maximum feed water concentration was 140 mg/L and the minimum was 93 mg/L. The filtrate alkalinity also averaged 130 mg/L, with a maximum of 150 mg/L and a minimum of 130 mg/L. Figure 4-4 presents the alkalinity results for the feed and filtrate water during the verification test. The alkalinity concentration during the 48-hour intensive survey was slightly higher in the filtrate (130 mg/L) than in the feed water (140 mg/L), as shown in Table 4-13.
Table 4-12. Alkalinity Results
34
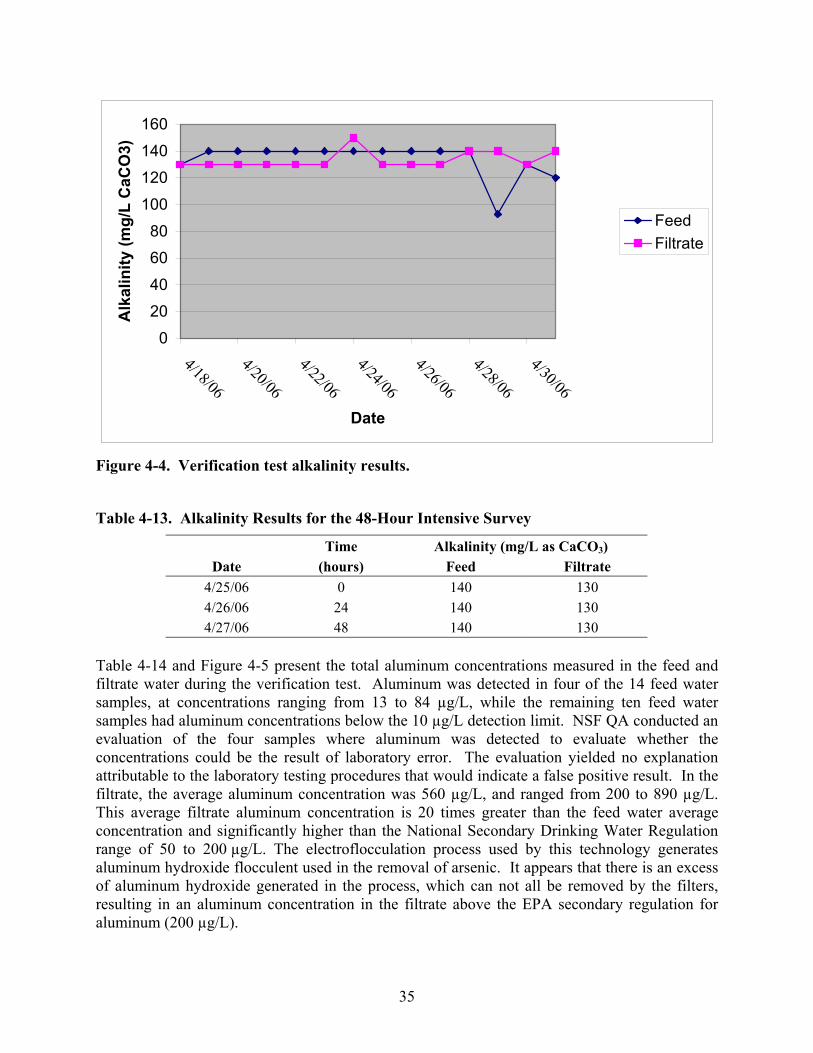
Time Alkalinity (mg/L as CaCO3) Date (hours) Feed Filtrate
4/25/06 0 140 130 4/26/06 24 140 130 4/27/06 48 140 130
0
20
40
60
80
100
120
140
160
4/18/06
4/20/06
4/22/06
4/24/06
4/26/06
4/28/06
4/30/06 Date
Alk
alin
ity (m
g/L
CaC
O3)
Feed Filtrate
Figure 4-4. Verification test alkalinity results.
Table 4-13. Alkalinity Results for the 48-Hour Intensive Survey
Table 4-14 and Figure 4-5 present the total aluminum concentrations measured in the feed and filtrate water during the verification test. Aluminum was detected in four of the 14 feed water samples, at concentrations ranging from 13 to 84 µg/L, while the remaining ten feed water samples had aluminum concentrations below the 10 µg/L detection limit. NSF QA conducted an evaluation of the four samples where aluminum was detected to evaluate whether the concentrations could be the result of laboratory error. The evaluation yielded no explanation attributable to the laboratory testing procedures that would indicate a false positive result. In the filtrate, the average aluminum concentration was 560 µg/L, and ranged from 200 to 890 µg/L. This average filtrate aluminum concentration is 20 times greater than the feed water average concentration and significantly higher than the National Secondary Drinking Water Regulation range of 50 to 200 µg/L. The electroflocculation process used by this technology generates aluminum hydroxide flocculent used in the removal of arsenic. It appears that there is an excess of aluminum hydroxide generated in the process, which can not all be removed by the filters, resulting in an aluminum concentration in the filtrate above the EPA secondary regulation for aluminum (200 µg/L).
35
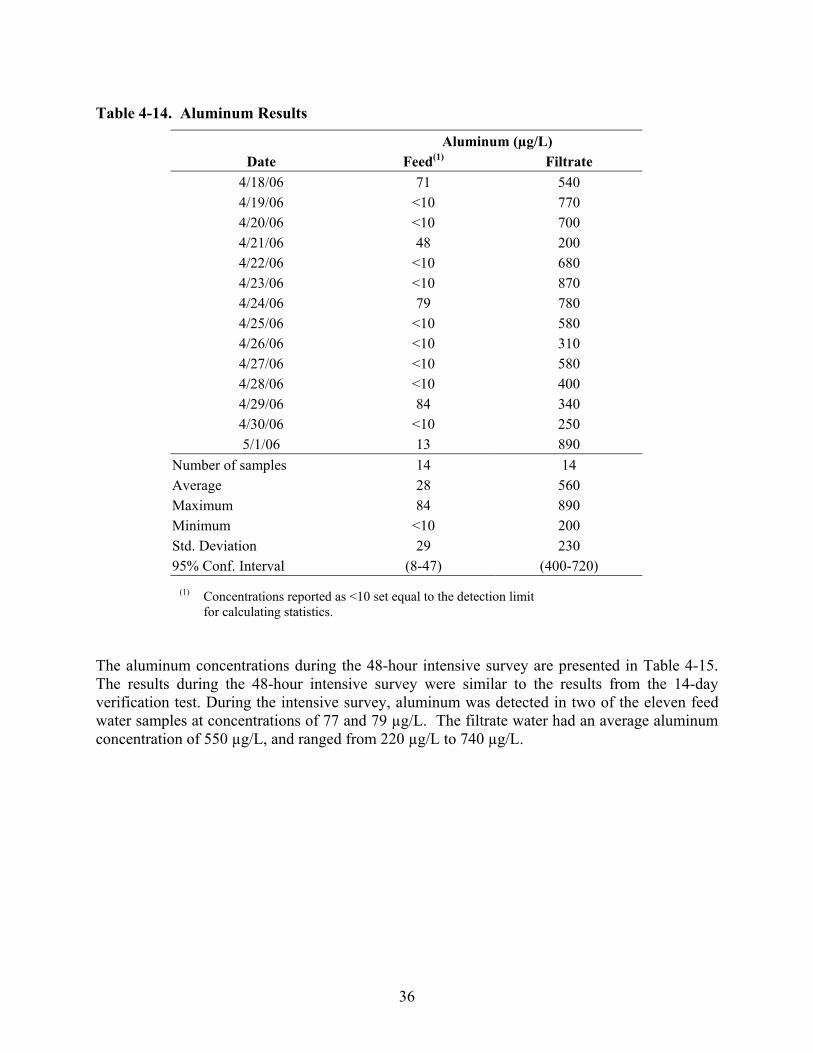
Table 4-14. Aluminum Results
Aluminum (µg/L) Date Feed(1) Filtrate
4/18/06 71 540 4/19/06 <10 770 4/20/06 <10 700 4/21/06 48 200 4/22/06 <10 680 4/23/06 <10 870 4/24/06 79 780 4/25/06 <10 580 4/26/06 <10 310 4/27/06 <10 580 4/28/06 <10 400 4/29/06 84 340 4/30/06 <10 250 5/1/06 13 890
Number of samples 14 14 Average 28 560 Maximum 84 890 Minimum <10 200 Std. Deviation 29 230 95% Conf. Interval (8-47) (400-720)
(1) Concentrations reported as <10 set equal to the detection limit for calculating statistics.
The aluminum concentrations during the 48-hour intensive survey are presented in Table 4-15. The results during the 48-hour intensive survey were similar to the results from the 14-day verification test. During the intensive survey, aluminum was detected in two of the eleven feed water samples at concentrations of 77 and 79 µg/L. The filtrate water had an average aluminum concentration of 550 µg/L, and ranged from 220 µg/L to 740 µg/L.
36
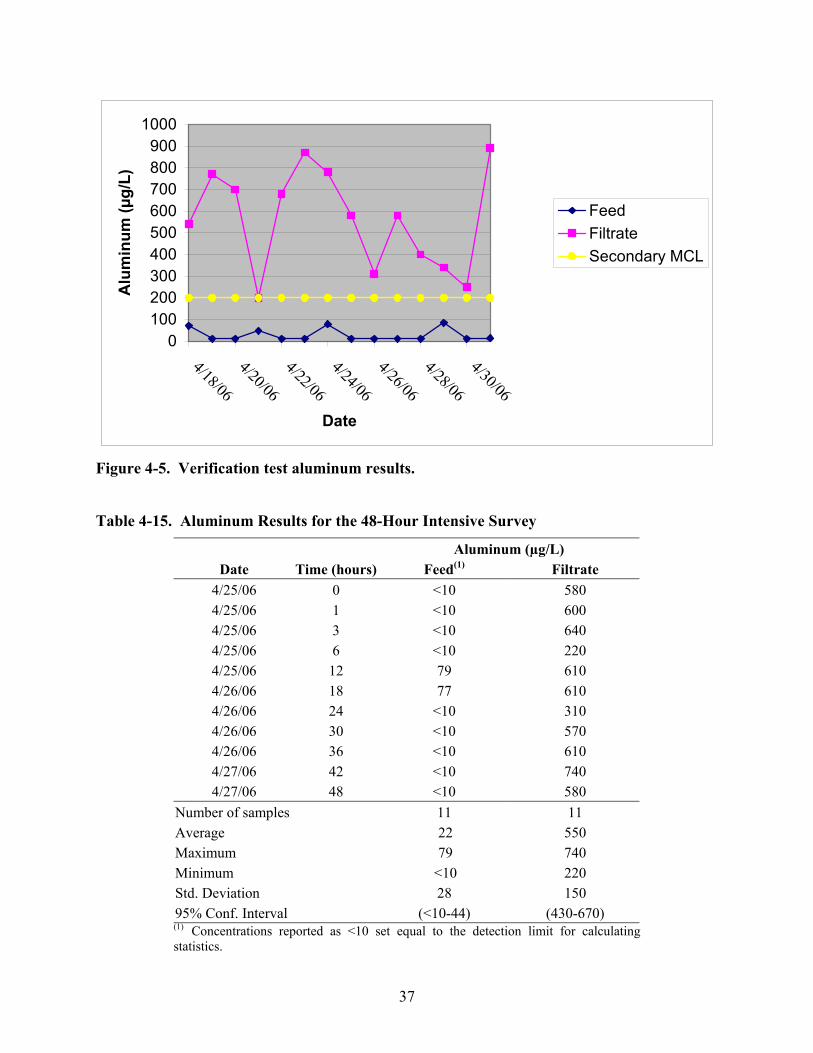
0 100 200 300 400 500 600 700 800 900
1000
4/18/06
4/20/06
4/22/06
4/24/06
4/26/06
4/28/06
4/30/06 Date
Alu
min
um (µ
g/L)
Feed Filtrate Secondary MCL
Figure 4-5. Verification test aluminum results.
Table 4-15. Aluminum Results for the 48-Hour Intensive Survey
Aluminum (µg/L) Date Time (hours) Feed(1) Filtrate
4/25/06 0 <10 580 4/25/06 1 <10 600 4/25/06 3 <10 640 4/25/06 6 <10 220 4/25/06 12 79 610 4/26/06 18 77 610 4/26/06 24 <10 310 4/26/06 30 <10 570 4/26/06 36 <10 610 4/27/06 42 <10 740 4/27/06 48 <10 580
Number of samples 11 11 Average 22 550 Maximum 79 740 Minimum <10 220 Std. Deviation 28 150 95% Conf. Interval (<10-44) (430-670) (1) Concentrations reported as <10 set equal to the detection limit for calculating statistics.
37
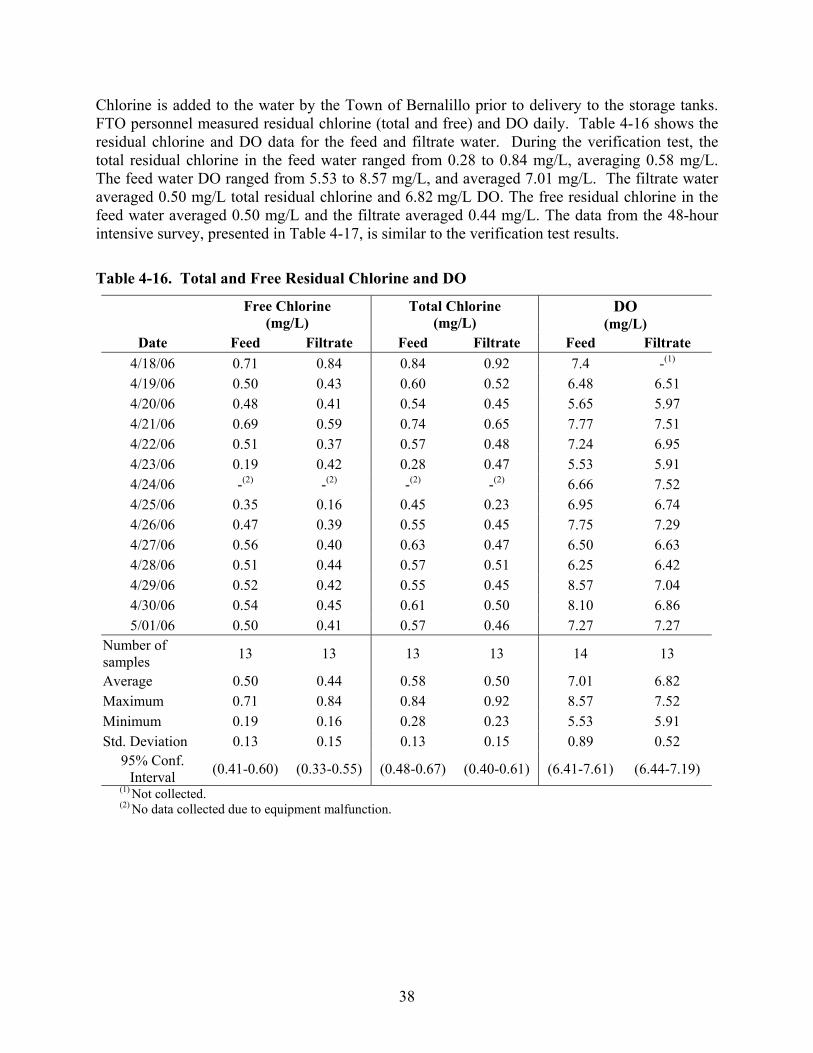
Chlorine is added to the water by the Town of Bernalillo prior to delivery to the storage tanks. FTO personnel measured residual chlorine (total and free) and DO daily. Table 4-16 shows the residual chlorine and DO data for the feed and filtrate water. During the verification test, the total residual chlorine in the feed water ranged from 0.28 to 0.84 mg/L, averaging 0.58 mg/L. The feed water DO ranged from 5.53 to 8.57 mg/L, and averaged 7.01 mg/L. The filtrate water averaged 0.50 mg/L total residual chlorine and 6.82 mg/L DO. The free residual chlorine in the feed water averaged 0.50 mg/L and the filtrate averaged 0.44 mg/L. The data from the 48-hour intensive survey, presented in Table 4-17, is similar to the verification test results.
Table 4-16. Total and Free Residual Chlorine and DO
Date
Free Chlorine (mg/L)
Feed Filtrate
Total Chlorine (mg/L)
Feed Filtrate
DO (mg/L)
Feed Filtrate 4/18/06 4/19/06 4/20/06 4/21/06 4/22/06 4/23/06 4/24/064/25/06 4/26/06 4/27/06 4/28/06 4/29/06 4/30/06 5/01/06
0.71 0.84 0.50 0.43 0.48 0.41 0.69 0.59 0.51 0.37 0.19 0.42 (2) (2)
0.35 0.16 0.47 0.39 0.56 0.40 0.51 0.44 0.52 0.42 0.54 0.45 0.50 0.41
0.84 0.92 0.60 0.52 0.54 0.45 0.74 0.65 0.57 0.48 0.28 0.47 (2) (2)
0.45 0.23 0.55 0.45 0.63 0.47 0.57 0.51 0.55 0.45 0.61 0.50 0.57 0.46
7.4 -(1)
6.48 6.51 5.65 5.97 7.77 7.51 7.24 6.95 5.53 5.91 6.66 7.52 6.95 6.74 7.75 7.29 6.50 6.63 6.25 6.42 8.57 7.04 8.10 6.86 7.27 7.27
Number of samples Average Maximum Minimum Std. Deviation
95% Conf. Interval
13 13
0.50 0.44 0.71 0.84 0.19 0.16 0.13 0.15
(0.41-0.60) (0.33-0.55)
13 13
0.58 0.50 0.84 0.92 0.28 0.23 0.13 0.15
(0.48-0.67) (0.40-0.61)
14 13
7.01 6.82 8.57 7.52 5.53 5.91 0.89 0.52
(6.41-7.61) (6.44-7.19) (1) Not collected. (2) No data collected due to equipment malfunction.
38
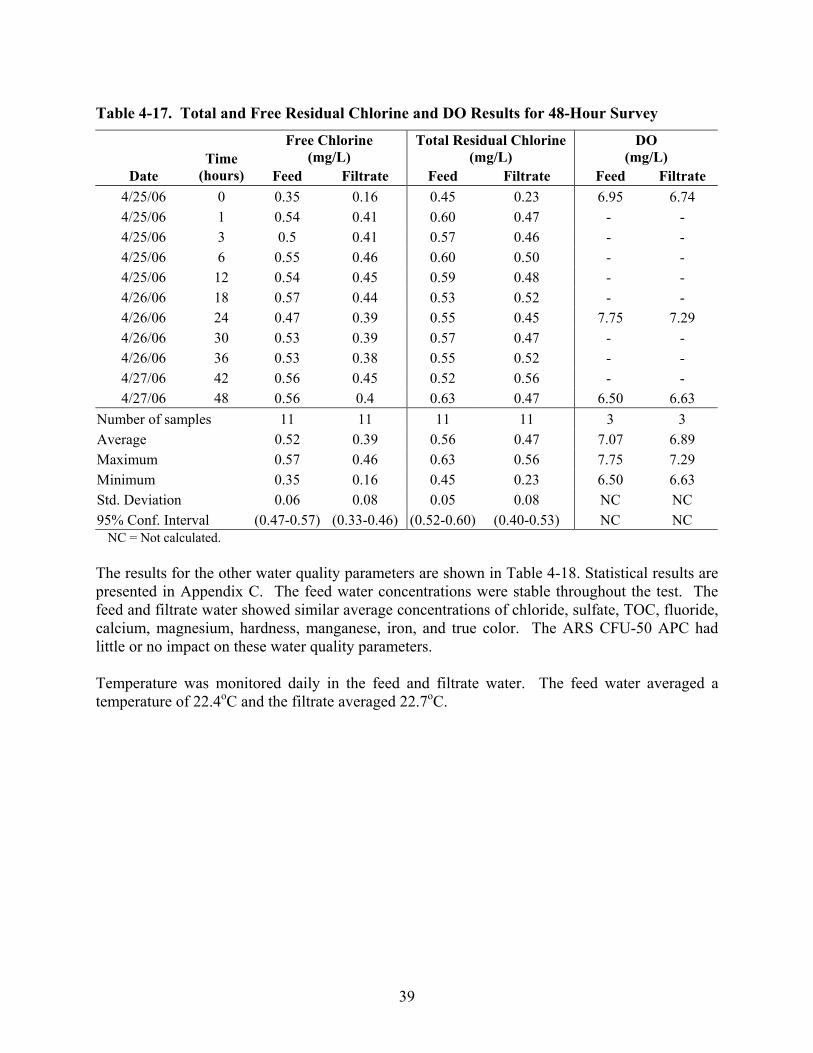
Table 4-17. Total and Free Residual Chlorine and DO Results for 48-Hour Survey
Date Time
(hours)
Free Chlorine (mg/L)
Feed Filtrate
Total Residual Chlorine (mg/L)
Feed Filtrate
DO (mg/L)
Feed Filtrate 4/25/06 0 4/25/06 1 4/25/06 3 4/25/06 6 4/25/06 12 4/26/06 18 4/26/06 24 4/26/06 30 4/26/06 36 4/27/06 42 4/27/06 48
0.35 0.16 0.54 0.41 0.5 0.41
0.55 0.46 0.54 0.45 0.57 0.44 0.47 0.39 0.53 0.39 0.53 0.38 0.56 0.45 0.56 0.4
0.45 0.23 0.60 0.47 0.57 0.46 0.60 0.50 0.59 0.48 0.53 0.52 0.55 0.45 0.57 0.47 0.55 0.52 0.52 0.56 0.63 0.47
6.95 6.74 - -- -- -- -- -
7.75 7.29 - -- -- -
6.50 6.63 Number of samples Average Maximum Minimum Std. Deviation 95% Conf. Interval
11 11 0.52 0.39 0.57 0.46 0.35 0.16 0.06 0.08
(0.47-0.57) (0.33-0.46)
11 11 0.56 0.47 0.63 0.56 0.45 0.23 0.05 0.08
(0.52-0.60) (0.40-0.53)
3 3 7.07 6.89 7.75 7.29 6.50 6.63 NC NC NC NC
NC = Not calculated.
The results for the other water quality parameters are shown in Table 4-18. Statistical results are presented in Appendix C. The feed water concentrations were stable throughout the test. The feed and filtrate water showed similar average concentrations of chloride, sulfate, TOC, fluoride, calcium, magnesium, hardness, manganese, iron, and true color. The ARS CFU-50 APC had little or no impact on these water quality parameters.
Temperature was monitored daily in the feed and filtrate water. The feed water averaged a temperature of 22.4oC and the filtrate averaged 22.7oC.
39
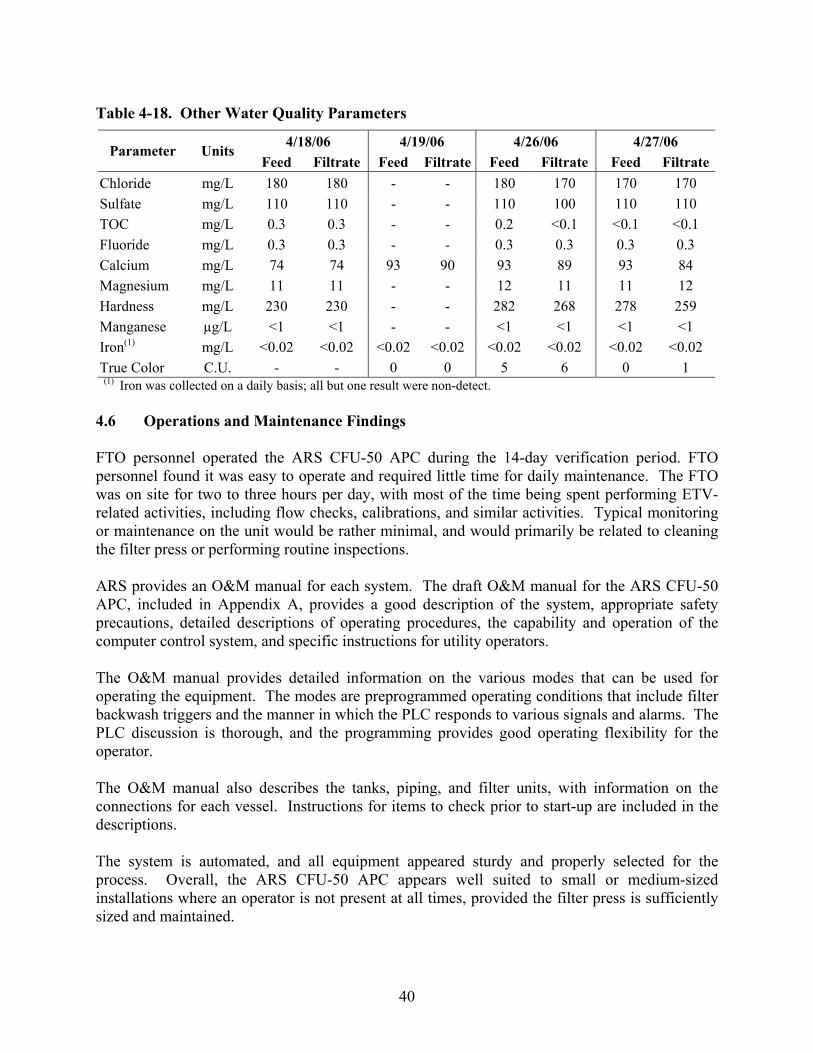
Table 4-18. Other Water Quality Parameters
4/18/06Parameter Units Feed Filtrate
4/19/06 Feed Filtrate
4/26/06 Feed Filtrate
4/27/06 Feed Filtrate
Chloride mg/L 180 180 Sulfate mg/L 110 110 TOC mg/L 0.3 0.3 Fluoride mg/L 0.3 0.3 Calcium mg/L 74 74 Magnesium mg/L 11 11 Hardness mg/L 230 230 Manganese µg/L <1 <1 Iron(1) mg/L <0.02 <0.02 True Color C.U. - -
- -- -- -- -
93 90 - -- -- -
<0.02 <0.02 0 0
180 170 110 100 0.2 <0.1 0.3 0.3 93 89 12 11
282 268 <1 <1
<0.02 <0.02 5 6
170 170 110 110 <0.1 <0.1 0.3 0.3 93 84 11 12
278 259 <1 <1
<0.02 <0.02 0 1
(1) Iron was collected on a daily basis; all but one result were non-detect.
4.6 Operations and Maintenance Findings
FTO personnel operated the ARS CFU-50 APC during the 14-day verification period. FTO personnel found it was easy to operate and required little time for daily maintenance. The FTO was on site for two to three hours per day, with most of the time being spent performing ETV-related activities, including flow checks, calibrations, and similar activities. Typical monitoring or maintenance on the unit would be rather minimal, and would primarily be related to cleaning the filter press or performing routine inspections.
ARS provides an O&M manual for each system. The draft O&M manual for the ARS CFU-50 APC, included in Appendix A, provides a good description of the system, appropriate safety precautions, detailed descriptions of operating procedures, the capability and operation of the computer control system, and specific instructions for utility operators.
The O&M manual provides detailed information on the various modes that can be used for operating the equipment. The modes are preprogrammed operating conditions that include filter backwash triggers and the manner in which the PLC responds to various signals and alarms. The PLC discussion is thorough, and the programming provides good operating flexibility for the operator.
The O&M manual also describes the tanks, piping, and filter units, with information on the connections for each vessel. Instructions for items to check prior to start-up are included in the descriptions.
The system is automated, and all equipment appeared sturdy and properly selected for the process. Overall, the ARS CFU-50 APC appears well suited to small or medium-sized installations where an operator is not present at all times, provided the filter press is sufficiently sized and maintained.
40
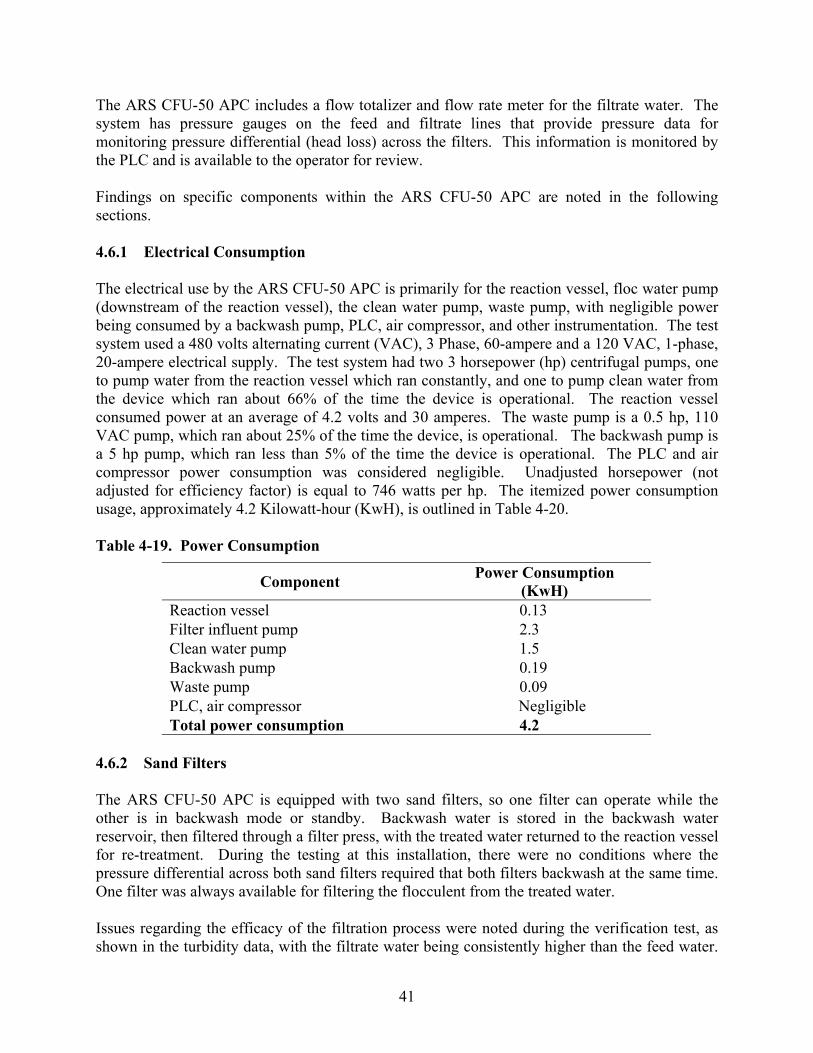
The ARS CFU-50 APC includes a flow totalizer and flow rate meter for the filtrate water. The system has pressure gauges on the feed and filtrate lines that provide pressure data for monitoring pressure differential (head loss) across the filters. This information is monitored by the PLC and is available to the operator for review.
Findings on specific components within the ARS CFU-50 APC are noted in the following sections.
4.6.1 Electrical Consumption
The electrical use by the ARS CFU-50 APC is primarily for the reaction vessel, floc water pump (downstream of the reaction vessel), the clean water pump, waste pump, with negligible power being consumed by a backwash pump, PLC, air compressor, and other instrumentation. The test system used a 480 volts alternating current (VAC), 3 Phase, 60-ampere and a 120 VAC, 1-phase, 20-ampere electrical supply. The test system had two 3 horsepower (hp) centrifugal pumps, one to pump water from the reaction vessel which ran constantly, and one to pump clean water from the device which ran about 66% of the time the device is operational. The reaction vessel consumed power at an average of 4.2 volts and 30 amperes. The waste pump is a 0.5 hp, 110 VAC pump, which ran about 25% of the time the device, is operational. The backwash pump is a 5 hp pump, which ran less than 5% of the time the device is operational. The PLC and air compressor power consumption was considered negligible. Unadjusted horsepower (not adjusted for efficiency factor) is equal to 746 watts per hp. The itemized power consumption usage, approximately 4.2 Kilowatt-hour (KwH), is outlined in Table 4-20.
Table 4-19. Power Consumption
Component Power Consumption (KwH)
Reaction vessel 0.13 Filter influent pump 2.3 Clean water pump 1.5 Backwash pump 0.19 Waste pump 0.09 PLC, air compressor Negligible Total power consumption 4.2
4.6.2 Sand Filters
The ARS CFU-50 APC is equipped with two sand filters, so one filter can operate while the other is in backwash mode or standby. Backwash water is stored in the backwash water reservoir, then filtered through a filter press, with the treated water returned to the reaction vessel for re-treatment. During the testing at this installation, there were no conditions where the pressure differential across both sand filters required that both filters backwash at the same time. One filter was always available for filtering the flocculent from the treated water.
Issues regarding the efficacy of the filtration process were noted during the verification test, as shown in the turbidity data, with the filtrate water being consistently higher than the feed water.
41
As noted in Table 4-10 and Figure 4-3, on average, the filtrate turbidity was 0.8 NTU while the feed turbidity was 0.3 NTU. Also, as summarized in Table 4-14 and shown in Figure 4-5, the aluminum concentrations in the filtrate water were consistently higher than the concentrations in the feed water, with the aluminum concentrations in the filtrate water exceeding the EPA National Secondary Drinking Water Regulations. The turbidity and aluminum data indicate that filtration mechanisms beyond those currently utilized in the ARS CFU-50 APC would be required to bring these concentrations closer to the feed water concentrations or within the EPA secondary regulations.
4.6.3 Filter Press
Backwash waste is treated by a filter press designed to remove the solids (flocculent) from the backwash water. The filtrate from the filter press was transferred back to the reaction vessel for re-treatment. During the testing, when the flocculent caked in the filter press to a point where water would no longer pass through it, the PLC shut down the entire system, as it is programmed to do. The procedures outlined in the O&M manual provide clear instructions on cleaning the filter press and resuming operation after cleaning. Page 65 of the O&M manual notes, “The use and operation of the filter press should not interfere with the normal and continuous use of the treatment unit…However, the treatment unit will only run for a limited time with the filter press disabled. The filter press is a vital aspect of the treatment unit and must be supported appropriately.” Verification testing substantiated the importance of the filter press and its appropriate maintenance as a critical aspect of the function of the ARS CFU-50 APC device.
4.6.4 Backwash Water Frequency and Quality
The ARS CFU-50 APC operates with an automated backwash sequence where backwash water is passed through a filter press. The backwash sequence uses water from the clean water storage tank. The backwash water is stored in the flocculent water reservoir tank prior to treatment in the filter press, where solids are removed and the filtered water is returned to the reaction vessel. The backwash cycle was set for a fixed time duration of 120 seconds for backwash and 30 seconds for rinsing. The combined backwash and rinsing resulted in approximately 250 gallons of waste per backwash sequence. Solids retained in the filter press are removed manually during filter press maintenance. Since the ARS CFU-50 APC does not have a separate backwash waste stream, the evaluation of the backwash water frequency and quality during the verification was limited to TSS analysis. The sample was collected from the flocculent water reservoir tank, which was equipped with a mixer and a sample port near the bottom of the tank. This sample yielded a concentration of 1,200 mg/L.
After the two weeks of operation, approximately 150 gallons of filter press sludge consisting of hydrated floc was removed from the filter press. The density of the floc is approximate 9.5 pounds per gallon, so approximately 1,425 pounds of hydrated floc was created. During this timeframe, approximately 572,550 gallons of water was treated. By dividing the weight of the hydrated flocculent by the volume of water treated, an approximate suspended solids (flocculent) concentration of 300 mg/L was generated by the reaction vessel.
42
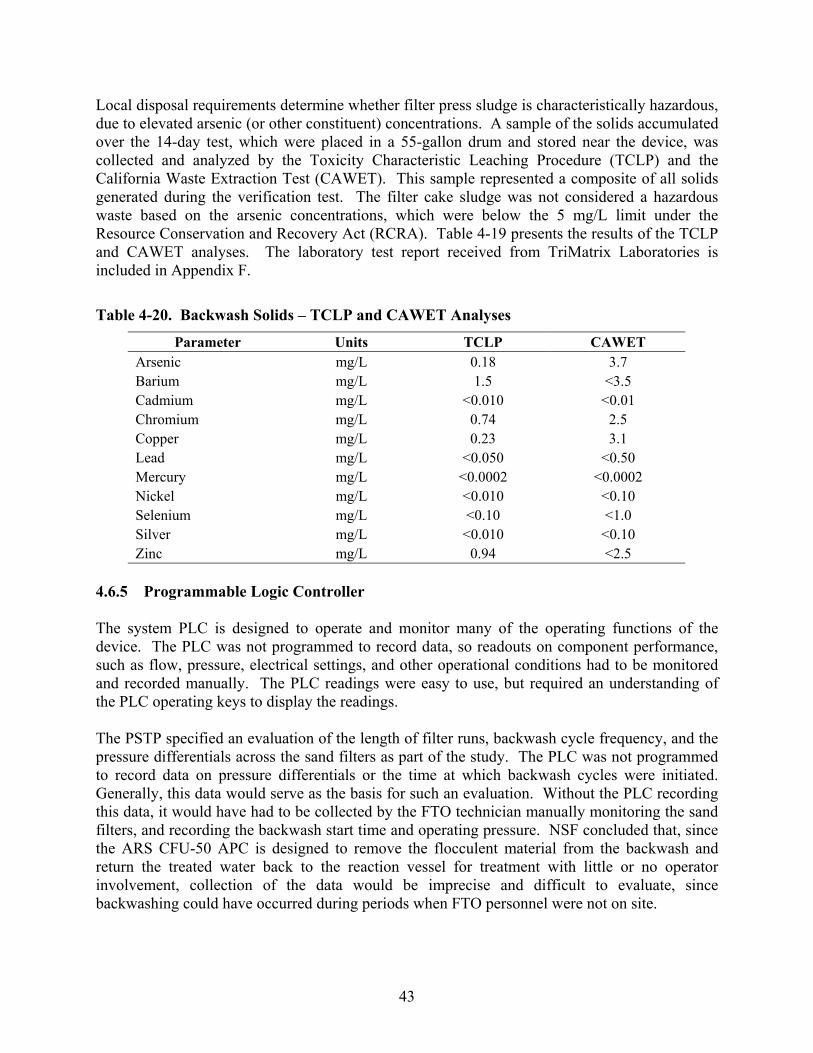
Local disposal requirements determine whether filter press sludge is characteristically hazardous, due to elevated arsenic (or other constituent) concentrations. A sample of the solids accumulated over the 14-day test, which were placed in a 55-gallon drum and stored near the device, was collected and analyzed by the Toxicity Characteristic Leaching Procedure (TCLP) and the California Waste Extraction Test (CAWET). This sample represented a composite of all solids generated during the verification test. The filter cake sludge was not considered a hazardous waste based on the arsenic concentrations, which were below the 5 mg/L limit under the Resource Conservation and Recovery Act (RCRA). Table 4-19 presents the results of the TCLP and CAWET analyses. The laboratory test report received from TriMatrix Laboratories is included in Appendix F.
Table 4-20. Backwash Solids – TCLP and CAWET Analyses
Parameter Units TCLP CAWET Arsenic mg/L 0.18 3.7 Barium mg/L 1.5 <3.5 Cadmium mg/L <0.010 <0.01 Chromium mg/L 0.74 2.5 Copper mg/L 0.23 3.1 Lead mg/L <0.050 <0.50 Mercury mg/L <0.0002 <0.0002 Nickel mg/L <0.010 <0.10 Selenium mg/L <0.10 <1.0 Silver mg/L <0.010 <0.10 Zinc mg/L 0.94 <2.5
4.6.5 Programmable Logic Controller
The system PLC is designed to operate and monitor many of the operating functions of the device. The PLC was not programmed to record data, so readouts on component performance, such as flow, pressure, electrical settings, and other operational conditions had to be monitored and recorded manually. The PLC readings were easy to use, but required an understanding of the PLC operating keys to display the readings.
The PSTP specified an evaluation of the length of filter runs, backwash cycle frequency, and the pressure differentials across the sand filters as part of the study. The PLC was not programmed to record data on pressure differentials or the time at which backwash cycles were initiated. Generally, this data would serve as the basis for such an evaluation. Without the PLC recording this data, it would have had to be collected by the FTO technician manually monitoring the sand filters, and recording the backwash start time and operating pressure. NSF concluded that, since the ARS CFU-50 APC is designed to remove the flocculent material from the backwash and return the treated water back to the reaction vessel for treatment with little or no operator involvement, collection of the data would be imprecise and difficult to evaluate, since backwashing could have occurred during periods when FTO personnel were not on site.
43
The PLC is designed to shut the entire system down in the event any sensor records a condition that is outside preset operating limits. This condition was experienced four times during the verification, resulting from the filter press being clogged to a point where no water passed through it. This resulted in high water levels in the Flocculent Water Reservoir, during which the PLC shut the system down as it was programmed to do. During each shutdown condition, after the filter press was cleaned, the alarm conditions in the PLC were cleared and the system was restarted with no difficulty.
4.7 Quality Assurance/Quality Control
As described in the PSTP, included in Appendix B, a structured QA/QC program was implemented as part of this verification to ensure the quality of the data being collected. A QAPP was developed as part of the PSTP and was followed by the field staff and laboratory during the testing period. Adherence to the established procedures ensured that the data presented in this report are sound, defensible, and representative of the equipment performance.
4.7.1 Documentation
The FTO recorded on-site data and calculations in a field logbook and prepared field log sheets. Daily measurements were recorded on specially prepared data log sheets. The operating logbook included calibration records for the field equipment used for on-site analyses. Copies of the logbook, the daily data log sheets, and calibration log sheets are included Appendix D.
Data from the on-site laboratory and data log sheets were entered into Excel spreadsheets, which were used to calculate various statistics (average, mean, standard deviation, etc.). The data in the spreadsheets were proofread by the initial data entry person and confirmed by NSF DWS Center staff by a 100% check of the data entries to confirm the information was correct. The spreadsheets are presented in Appendix C.
Samples collected and delivered to the NSF Chemistry Laboratory for analysis were tracked. Each sample was assigned a location name, date, and time of collection, and the parameters were written on the label. The laboratory reported the analytical results using the NSF Chemistry Laboratory management system reports. These reports were received and reviewed by the NSF DWS Center coordinator. These laboratory data were entered by DWS Center personnel into the data spreadsheets, corrected, and verified in the same manner as the field data. NSF laboratory reports are included in Appendix E.
4.7.2 Quality Audits
The NSF QA department performed an on-site audit on April 23 to review the field procedures, including the collection of operating data and performance of on-site analytical methods. The PSTP requirements and QAPP were used as the basis for the audit. The NSF QA auditor prepared an audit report, noting the following deficiencies:
1. The operations log does not indicate visitors to the site. 2. Photographs were not logged in the field logbook.
44
3. The standard concentrations used for the turbidimeter are not as listed on the checklist. 4. Pressure gauge accuracy was checked by another calibrated pressure gauge but not
checked with a dead weight pressure tester as indicated in the checklist. 5. The checklist indicated the thermometer would be calibrated monthly. However, the
thermometer tag indicated it would be calibrated every six months. 6. The checklist indicates that the DO meter would be air calibrated. However, a liquid
calibration method is used. 7. There are no Material Safety Data Sheets (MSDS) sheets at the site or the laboratory. 8. There is no eyewash station at the laboratory.
FTO personnel addressed deficiencies 1 and 2 immediately. Deficiencies 3 through 6 pertained to correlating the calibration methods used by FTO personnel with the documentation noted in the PSTP and checklist. MSDS information for the laboratory was attainable through NSF’s online database, which was accessible to the FTO personnel via computer. A portable eyewash station was in the process of being procured for the laboratory, but the project concluded prior to delivery.
The NSF QA Department reviewed the Chemistry Laboratory analytical results for adherence to the QA requirements for calibration, precision, and accuracy detailed in the project QAPP, and for compliance with the laboratory quality assurance requirements. The laboratory raw data records (run logs, bench sheets, calibrations records, etc.) are maintained at NSF and are available for review.
4.7.3 Data Quality Indicators
The data quality indictors established for the ETV project and described in the QAPP included:
• Representativeness; • Accuracy; • Precision; and • Completeness.
4.7.3.1 Representativeness
Representativeness refers to the degree to which the data accurately and precisely represent the conditions or characteristics of the parameter represented by the data. In this verification testing, representativeness was ensured by FTO personnel executing consistent sample collection procedures in accordance with established approved procedures, and following specific sample preservation, packaging, and delivery procedures. Approved analytical methods were used to provide results that represent the accurate and precise measurements of drinking water. For equipment operating data, representativeness entailed collecting and documenting a sufficient quantity of data during operation to be able to detect a change in operations. For most water treatment processes involving total arsenic removal, detecting a ±10% change in an operating parameter is sufficient. The primary operating parameter for this verification test was filtrate volume treated per day and water quality (e.g. total arsenic concentrations, fouling parameter concentrations, etc.). For this verification, the total arsenic concentrations were somewhat lower
45
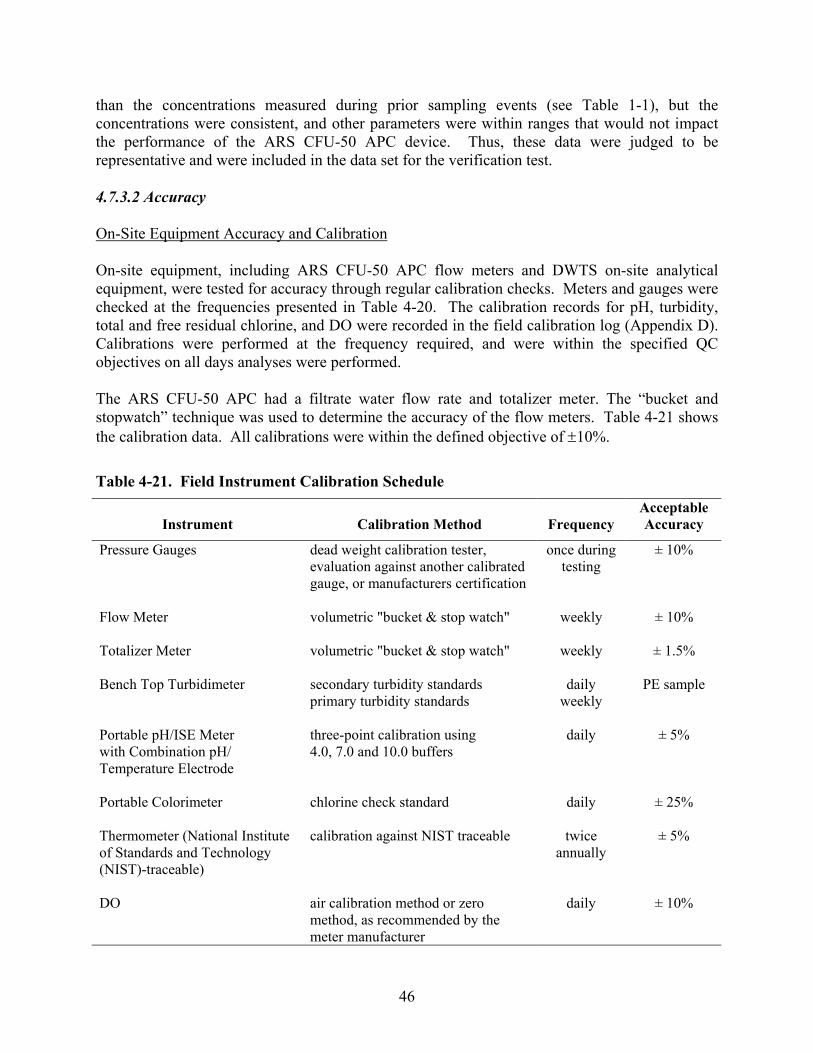
than the concentrations measured during prior sampling events (see Table 1-1), but the concentrations were consistent, and other parameters were within ranges that would not impact the performance of the ARS CFU-50 APC device. Thus, these data were judged to be representative and were included in the data set for the verification test.
4.7.3.2 Accuracy
On-Site Equipment Accuracy and Calibration
On-site equipment, including ARS CFU-50 APC flow meters and DWTS on-site analytical equipment, were tested for accuracy through regular calibration checks. Meters and gauges were checked at the frequencies presented in Table 4-20. The calibration records for pH, turbidity, total and free residual chlorine, and DO were recorded in the field calibration log (Appendix D). Calibrations were performed at the frequency required, and were within the specified QC objectives on all days analyses were performed.
The ARS CFU-50 APC had a filtrate water flow rate and totalizer meter. The “bucket and stopwatch” technique was used to determine the accuracy of the flow meters. Table 4-21 shows the calibration data. All calibrations were within the defined objective of ±10%.
Table 4-21. Field Instrument Calibration Schedule
Instrument Calibration Method Frequency Acceptable Accuracy
Pressure Gauges dead weight calibration tester, evaluation against another calibrated gauge, or manufacturers certification
once during testing
± 10%
Flow Meter volumetric "bucket & stop watch" weekly ± 10%
Totalizer Meter volumetric "bucket & stop watch" weekly ± 1.5%
Bench Top Turbidimeter secondary turbidity standards primary turbidity standards
daily weekly
PE sample
Portable pH/ISE Meter with Combination pH/ Temperature Electrode
three-point calibration using 4.0, 7.0 and 10.0 buffers
daily ± 5%
Portable Colorimeter chlorine check standard daily ± 25%
Thermometer (National Institute of Standards and Technology (NIST)-traceable)
calibration against NIST traceable twice annually
± 5%
DO air calibration method or zero method, as recommended by the meter manufacturer
daily ± 10%
46
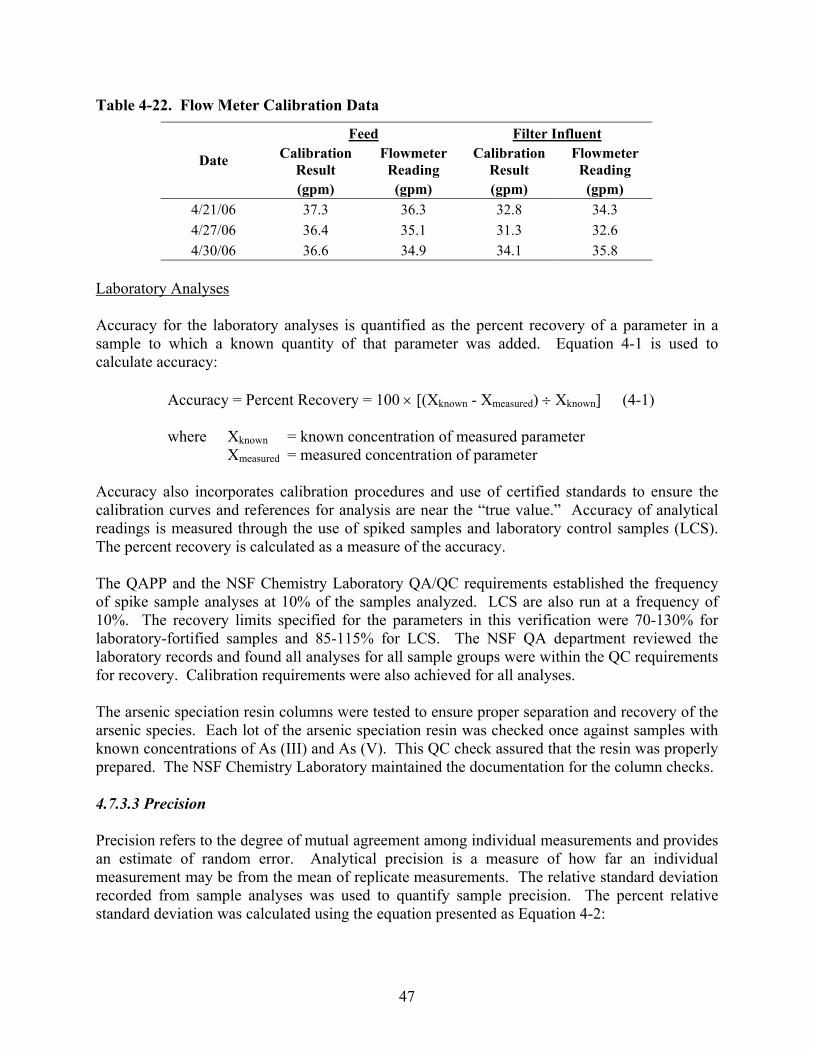
Table 4-22. Flow Meter Calibration Data
Feed Filter Influent
Date Calibration Result
Flowmeter Reading
Calibration Result
Flowmeter Reading
(gpm) (gpm) (gpm) (gpm) 4/21/06 37.3 36.3 32.8 34.3 4/27/06 36.4 35.1 31.3 32.6 4/30/06 36.6 34.9 34.1 35.8
Laboratory Analyses
Accuracy for the laboratory analyses is quantified as the percent recovery of a parameter in a sample to which a known quantity of that parameter was added. Equation 4-1 is used to calculate accuracy:
Accuracy = Percent Recovery = 100 × [(Xknown - Xmeasured) ÷ Xknown] (4-1)
where Xknown = known concentration of measured parameter Xmeasured = measured concentration of parameter
Accuracy also incorporates calibration procedures and use of certified standards to ensure the calibration curves and references for analysis are near the “true value.” Accuracy of analytical readings is measured through the use of spiked samples and laboratory control samples (LCS). The percent recovery is calculated as a measure of the accuracy.
The QAPP and the NSF Chemistry Laboratory QA/QC requirements established the frequency of spike sample analyses at 10% of the samples analyzed. LCS are also run at a frequency of 10%. The recovery limits specified for the parameters in this verification were 70-130% for laboratory-fortified samples and 85-115% for LCS. The NSF QA department reviewed the laboratory records and found all analyses for all sample groups were within the QC requirements for recovery. Calibration requirements were also achieved for all analyses.
The arsenic speciation resin columns were tested to ensure proper separation and recovery of the arsenic species. Each lot of the arsenic speciation resin was checked once against samples with known concentrations of As (III) and As (V). This QC check assured that the resin was properly prepared. The NSF Chemistry Laboratory maintained the documentation for the column checks.
4.7.3.3 Precision
Precision refers to the degree of mutual agreement among individual measurements and provides an estimate of random error. Analytical precision is a measure of how far an individual measurement may be from the mean of replicate measurements. The relative standard deviation recorded from sample analyses was used to quantify sample precision. The percent relative standard deviation was calculated using the equation presented as Equation 4-2:
47
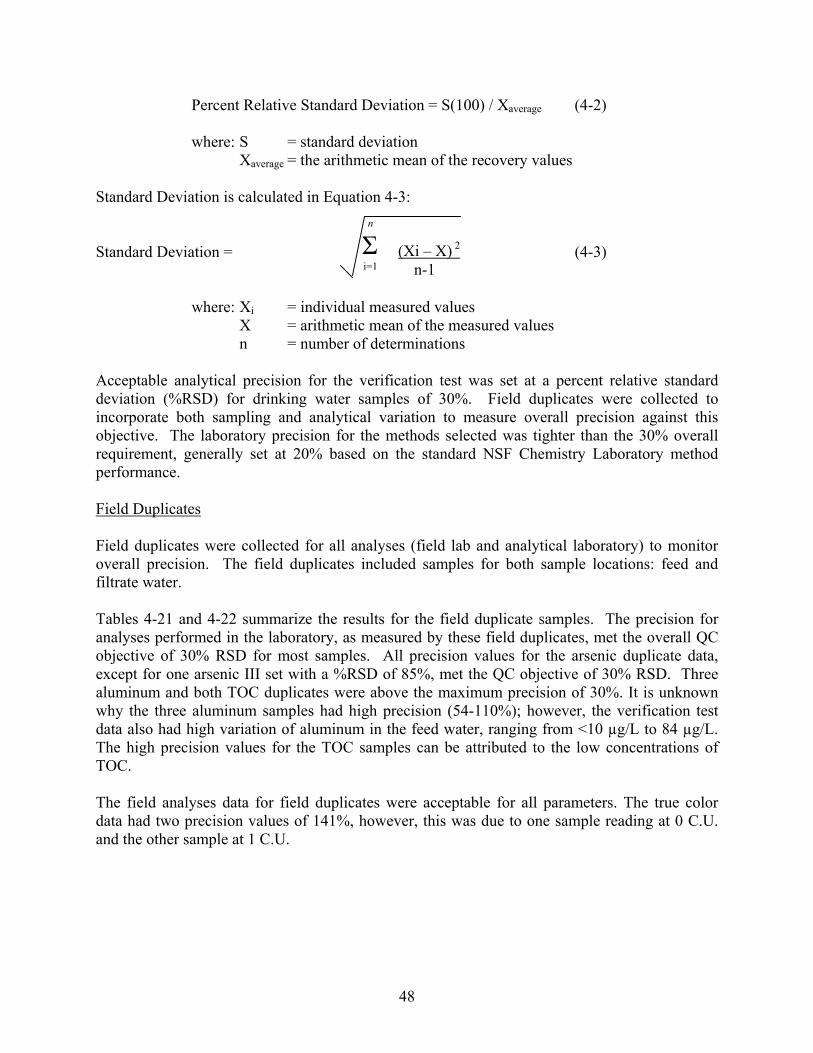
n
Σ (Xi – X) 2i=1 n-1
Percent Relative Standard Deviation = S(100) / Xaverage (4-2)
where: S = standard deviation Xaverage = the arithmetic mean of the recovery values
Standard Deviation is calculated in Equation 4-3:
Standard Deviation = (4-3)
where: Xi = individual measured values X = arithmetic mean of the measured values n = number of determinations
Acceptable analytical precision for the verification test was set at a percent relative standard deviation (%RSD) for drinking water samples of 30%. Field duplicates were collected to incorporate both sampling and analytical variation to measure overall precision against this objective. The laboratory precision for the methods selected was tighter than the 30% overall requirement, generally set at 20% based on the standard NSF Chemistry Laboratory method performance.
Field Duplicates
Field duplicates were collected for all analyses (field lab and analytical laboratory) to monitor overall precision. The field duplicates included samples for both sample locations: feed and filtrate water.
Tables 4-21 and 4-22 summarize the results for the field duplicate samples. The precision for analyses performed in the laboratory, as measured by these field duplicates, met the overall QC objective of 30% RSD for most samples. All precision values for the arsenic duplicate data, except for one arsenic III set with a %RSD of 85%, met the QC objective of 30% RSD. Three aluminum and both TOC duplicates were above the maximum precision of 30%. It is unknown why the three aluminum samples had high precision (54-110%); however, the verification test data also had high variation of aluminum in the feed water, ranging from <10 µg/L to 84 µg/L. The high precision values for the TOC samples can be attributed to the low concentrations of TOC.
The field analyses data for field duplicates were acceptable for all parameters. The true color data had two precision values of 141%, however, this was due to one sample reading at 0 C.U. and the other sample at 1 C.U.
48

Total Arsenic (µg/L) Feed Water Filtrate
Date Rep 1 Rep 2 %RSD Rep 1 Rep 2 %RSD 4/18/06 14 15 4.9 6 5 13 4/24/06 11 13 12 6 6 0 5/01/06 12 12 0 6 7 11
Dissolved Arsenic (µg/L) Feed Water Filtrate
Date Rep 1 Rep 2 %RSD Rep 1 Rep 2 %RSD 4/18/06 12 12 0 18000(1) 4 -5/01/06 11 11 0 4 5 16
Arsenic III (µg/L) Feed Water Filtrate
Date Rep 1 Rep 2 %RSD Rep 1 Rep 2 %RSD 4/18/06 20 5 85 8 7 9 5/01/06 12 10 13 4 5 16
Alkalinity (mg/L as CaCO3) Feed Water Filtrate
Date Rep 1 Rep 2 %RSD Rep 1 Rep 2 %RSD 4/18/06 130 140 5 - - -5/01/06 120 150 16 - - -
Aluminum (µg/L) Feed Water Filtrate
Date Rep 1 Rep 2 %RSD Rep 1 Rep 2 %RSD 4/18/06 71 75 3.9 540 240 54 4/24/06 79 <10 110 780 650 13 5/01/06 13 <10 18 890 240 81
Other Parameters Feed Water Filtrate
Parameter Rep 1 Rep 2 %RSD Rep 1 Rep 2 %RSD Chloride (mg/L) 180 180 0 180 180 0 Sulfate (mg/L) 110 120 6 110 110 0 Calcium (mg/L) 74 76 1.9 74 76 1.9 Magnesium 11 10 6.7 11 10 6.7 (mg/L) Manganese <1 <1 0 <1 <1 0 (µg/L) Fluoride (mg/L) 0.3 0.3 0 0.3 0.3 0 Iron (mg/L)(2) <0.02 <0.02 0 <0.02 <0.02 0 TOC (mg/L) 0.3 0.1 71 0.3 <0.1 71
Note: For the statistical calculations, all non-detect data were used as the minimum reporting limit. (1) This dissolved arsenic concentration was considered an outlier and was not used for statistical purposes. (2) Additional iron duplicate samples were collected; all duplicate set results were non-detect.
Table 4-23. Precision Data – Field Duplicates for Laboratory Parameters
49
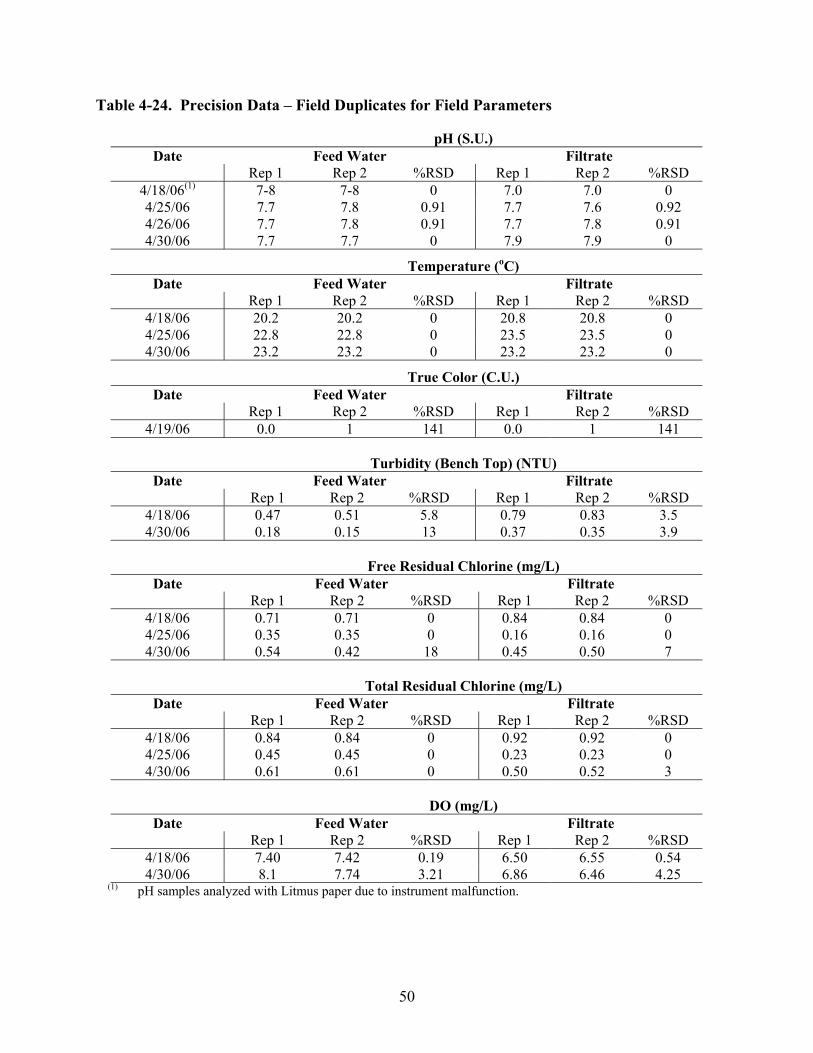
pH (S.U.) Date Feed Water
Rep 1 Rep 2 %RSD Rep 1 Filtrate
Rep 2 %RSD 4/18/06(1)
4/25/064/26/064/30/06
7-8 7.7 7.7 7.7
7-8 7.8 7.8 7.7
0 0.91 0.91
0
7.0 7.7 7.7 7.9
7.0 7.6 7.8 7.9
0 0.92 0.91
0
Temperature (oC) Date
Rep 1 Feed Water
Rep 2 %RSD Rep 1 Filtrate
Rep 2 %RSD 4/18/064/25/064/30/06
20.2 22.8 23.2
20.2 22.8 23.2
0 0 0
20.8 23.5 23.2
20.8 23.5 23.2
0 0 0
True Color (C.U.) Date
Rep 1 Feed Water
Rep 2 %RSD Rep 1 Filtrate
Rep 2 %RSD 4/19/06 0.0 1 141 0.0 1 141
Turbidity (Bench Top) (NTU) Date
Rep 1 Feed Water
Rep 2 %RSD Rep 1 Filtrate
Rep 2 %RSD 4/18/06 4/30/06
0.47 0.18
0.51 0.15
5.8 13
0.79 0.37
0.83 0.35
3.5 3.9
Free Residual Chlorine (mg/L) Date
Rep 1 Feed Water
Rep 2 %RSD Rep 1 Filtrate
Rep 2 %RSD 4/18/06 4/25/06 4/30/06
0.71 0.35 0.54
0.71 0.35 0.42
0 0
18
0.84 0.16 0.45
0.84 0.16 0.50
0 0 7
Total Residual Chlorine (mg/L) Date
Rep 1 Feed Water
Rep 2 %RSD Rep 1 Filtrate
Rep 2 %RSD 4/18/06 4/25/06 4/30/06
0.84 0.45 0.61
0.84 0.45 0.61
0 0 0
0.92 0.23 0.50
0.92 0.23 0.52
0 0 3
DO (mg/L) Date
Rep 1 Feed Water
Rep 2 %RSD Rep 1 Filtrate
Rep 2 %RSD 4/18/06 4/30/06
7.40 8.1
7.42 7.74
0.19 3.21
6.50 6.86
6.55 6.46
0.54 4.25
(1) pH samples analyzed with Litmus paper due to instrument malfunction.
Table 4-24. Precision Data – Field Duplicates for Field Parameters
50
Laboratory Analytical Duplicates
The NSF Chemistry Laboratory precision was monitored during the verifications test in accordance with QAPP and the NSF quality assurance program. Laboratory duplicates were analyzed at 10% frequency of samples analyzed. The NSF QA department reviewed the precision information and determined that the laboratory data met QC precision requirements.
4.7.3.4 Method Blanks
The laboratory included method blanks as part of the standard analysis procedures. Method blanks were analyzed in accordance with the approved methods. The NSF QA department reviewed the laboratory data and found the method blanks to be acceptable. No data were flagged as having been affected by method blank results.
4.7.3.5 Completeness
Completeness is defined as the following (Equation 4-4) for all measurements:
%C = (V/T) X 100 (4-4)
where: %C = percent completeness V = number of measurements judged valid T = total number of measurements
Completeness refers to the amount of valid, acceptable data collected from a measurement process compared to the expected amount to be obtained.
The completeness objective for data generated during this verification test was based on the number of samples collected and analyzed for each parameter and/or method. A completeness objective of 90% applied to: arsenic, aluminum, alkalinity, iron, temperature, pH, daily bench top turbidity, residual chlorine, and DO. Samples for these parameters were collected and analyzed at the frequency specified in the PSTP and QAPP for the verification test. All of the weekly parameters met or exceeded the completeness objective of 80%. A completeness objective of 90% applied to the following operating parameters: feed and filtrate flow rate and pressure differential across the filter. The completeness objective was met for these parameters. Table 4-24 provides a summary of the completeness results for the verification test.
51
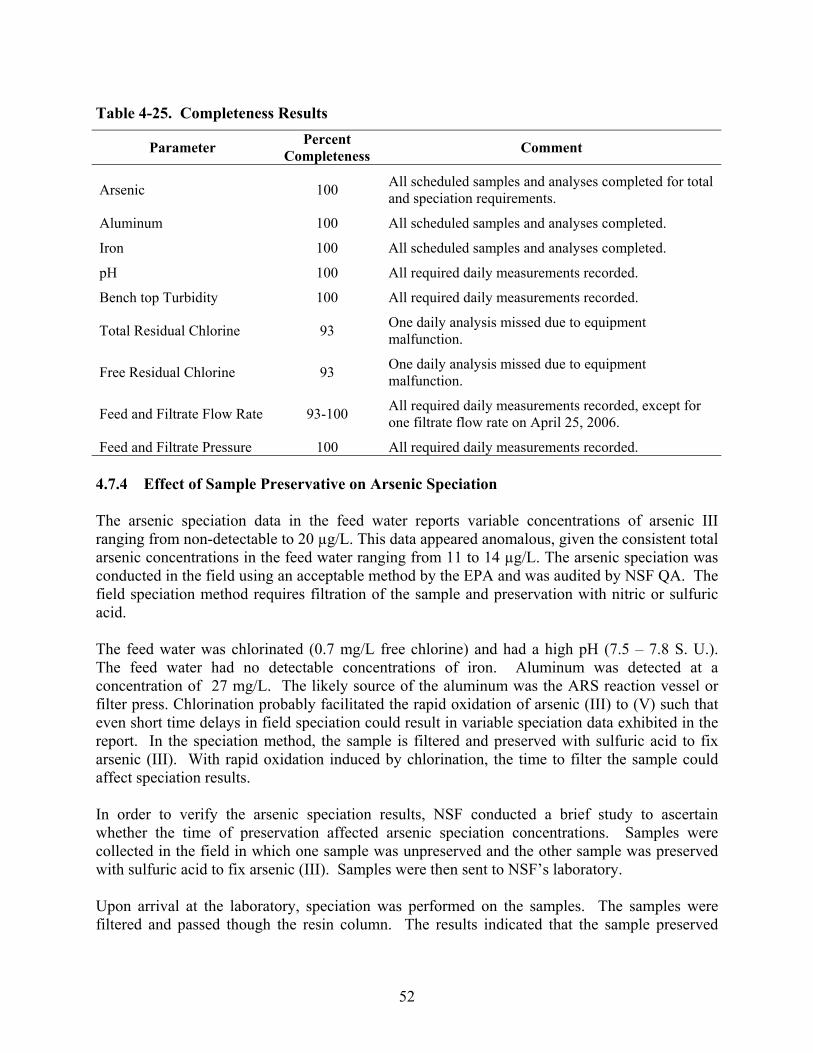
Parameter PercentCompleteness Comment
Arsenic
Aluminum
Iron
pH
Bench top Turbidity
Total Residual Chlorine
Free Residual Chlorine
Feed and Filtrate Flow Rate
Feed and Filtrate Pressure
100
100
100
100
100
93
93
93-100
100
All scheduled samples and analyses completed for total and speciation requirements.
All scheduled samples and analyses completed.
All scheduled samples and analyses completed.
All required daily measurements recorded.
All required daily measurements recorded.
One daily analysis missed due to equipment malfunction.
One daily analysis missed due to equipment malfunction.
All required daily measurements recorded, except for one filtrate flow rate on April 25, 2006.
All required daily measurements recorded.
Table 4-25. Completeness Results
4.7.4 Effect of Sample Preservative on Arsenic Speciation
The arsenic speciation data in the feed water reports variable concentrations of arsenic III ranging from non-detectable to 20 µg/L. This data appeared anomalous, given the consistent total arsenic concentrations in the feed water ranging from 11 to 14 µg/L. The arsenic speciation was conducted in the field using an acceptable method by the EPA and was audited by NSF QA. The field speciation method requires filtration of the sample and preservation with nitric or sulfuric acid.
The feed water was chlorinated (0.7 mg/L free chlorine) and had a high pH (7.5 – 7.8 S. U.). The feed water had no detectable concentrations of iron. Aluminum was detected at a concentration of 27 mg/L. The likely source of the aluminum was the ARS reaction vessel or filter press. Chlorination probably facilitated the rapid oxidation of arsenic (III) to (V) such that even short time delays in field speciation could result in variable speciation data exhibited in the report. In the speciation method, the sample is filtered and preserved with sulfuric acid to fix arsenic (III). With rapid oxidation induced by chlorination, the time to filter the sample could affect speciation results.
In order to verify the arsenic speciation results, NSF conducted a brief study to ascertain whether the time of preservation affected arsenic speciation concentrations. Samples were collected in the field in which one sample was unpreserved and the other sample was preserved with sulfuric acid to fix arsenic (III). Samples were then sent to NSF’s laboratory.
Upon arrival at the laboratory, speciation was performed on the samples. The samples were filtered and passed though the resin column. The results indicated that the sample preserved
52
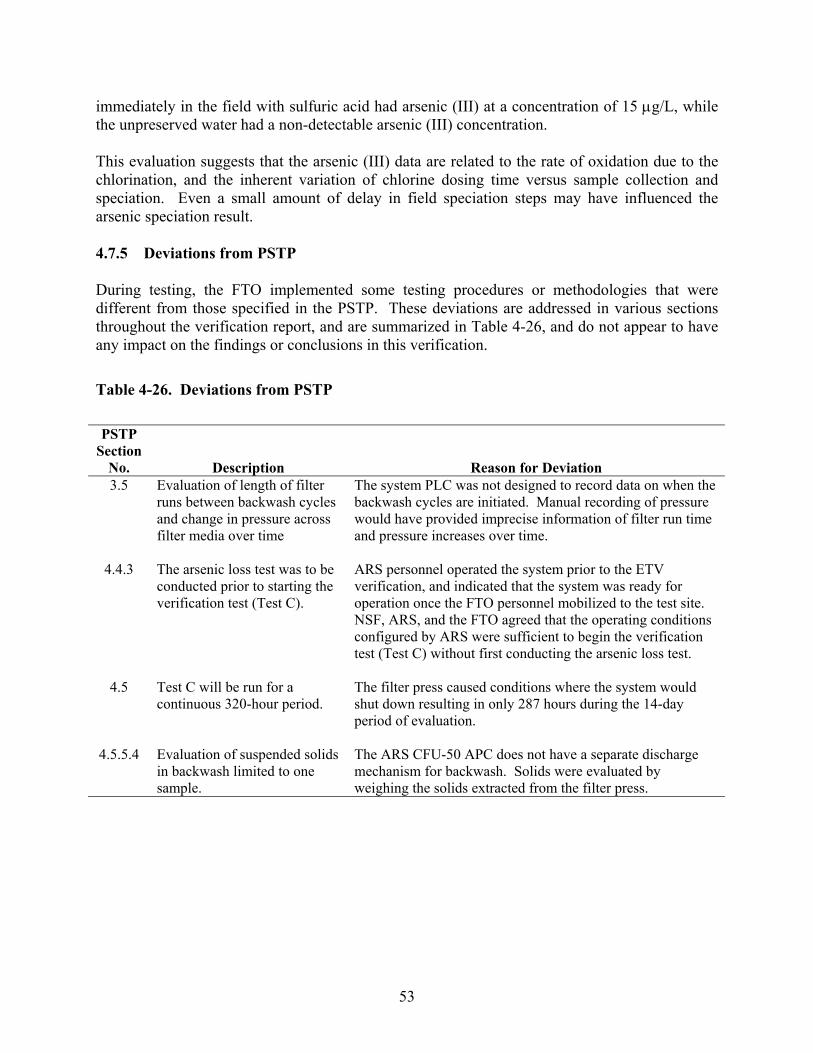
immediately in the field with sulfuric acid had arsenic (III) at a concentration of 15 µg/L, while the unpreserved water had a non-detectable arsenic (III) concentration.
This evaluation suggests that the arsenic (III) data are related to the rate of oxidation due to the chlorination, and the inherent variation of chlorine dosing time versus sample collection and speciation. Even a small amount of delay in field speciation steps may have influenced the arsenic speciation result.
4.7.5 Deviations from PSTP
During testing, the FTO implemented some testing procedures or methodologies that were different from those specified in the PSTP. These deviations are addressed in various sections throughout the verification report, and are summarized in Table 4-26, and do not appear to have any impact on the findings or conclusions in this verification.
Table 4-26. Deviations from PSTP
PSTP Section
No. Description Reason for Deviation 3.5 Evaluation of length of filter
runs between backwash cycles and change in pressure across filter media over time
The system PLC was not designed to record data on when the backwash cycles are initiated. Manual recording of pressure would have provided imprecise information of filter run time and pressure increases over time.
4.4.3 The arsenic loss test was to be conducted prior to starting the verification test (Test C).
ARS personnel operated the system prior to the ETV verification, and indicated that the system was ready for operation once the FTO personnel mobilized to the test site. NSF, ARS, and the FTO agreed that the operating conditions configured by ARS were sufficient to begin the verification test (Test C) without first conducting the arsenic loss test.
4.5 Test C will be run for a continuous 320-hour period.
The filter press caused conditions where the system would shut down resulting in only 287 hours during the 14-day period of evaluation.
4.5.5.4 Evaluation of suspended solids in backwash limited to one sample.
The ARS CFU-50 APC does not have a separate discharge mechanism for backwash. Solids were evaluated by weighing the solids extracted from the filter press.
53
Chapter 5 References
EPA/NSF ETV Protocol for Equipment Verification Testing for Arsenic Removal, U.S. EPA/NSF International. September 2003.
Product Specific Test Plan for the Advanced Remediation Systems USA, LLC ARS CFU-50 APC Electroflocculation and Filtration Water Treatment System for Arsenic Removal from Drinking Water. NSF International. March 2006.
Standard Methods for the Examination of Water and Wastewater, 20th edition, APHA, AWWA, and WEF, Washington D.C. 1999.
54