Embed Size (px)
Citation preview
Environmental Study through combustion
test of Indian coal
Draft Final Report
January 2017
JAPAN COAL ENERGY CENTER
Table of Contents
EXECUTIVE SUMMARY ........................................................................................ 1
1. INTRODUCTION ................................................................................................ 5
1.1 Background and Objective ....................................................................................................... 5
1.2 Characteristics of high-performance smoke dust removal system........................................... 6
2. IMPLEMENTATION DETAILS ............................................................................ 9
2.1 Test at the Combustion-AQCS Integrated Facility .................................................................... 9
2.2 Basic test ................................................................................................................................ 10
2.3 Overall process ....................................................................................................................... 10
3. TEST METHOD ................................................................................................. 11
3.1 Overall test at the Combustion-AQCS Integrated Facility ....................................................... 11
3.2 Evaluation of smoke dust removal performance .................................................................... 22
3.3 Performance evaluation of desulfurization ............................................................................. 27
3.4 Measurement of overall heat transfer coefficient in GGH ...................................................... 40
3.5 Abrasion property evaluation of GGH fin ................................................................................ 45
4. RESULTS AND DISCUSSION ......................................................................... 49
4.1 Characteristics of coal and combustion exhaust gas ............................................................. 49
4.2 Smoke dust removal performance ......................................................................................... 55
4.3 Desulfurization performance ................................................................................................... 72
4.4 Overall heat transfer coefficient in GGH ................................................................................. 79
4.5 Abrasion characteristics of GGH fins ...................................................................................... 83
5. SUMMARY OF COMBUSTION TEST ............................................................. 87
5.1 Overview of test results .......................................................................................................... 87
5.2 Vision of verification test in India ............................................................................................ 89
6.1 Background and objective ...................................................................................................... 92
6.2 Mercury Removal performance improvement method ........................................................... 92
7. MERCURY REMOVAL ..................................................................................... 96
7.4 Evaluation for mercury removal performance ...................................................................... 103
8. MERCURY REMOVAL, RESULTS ................................................................. 111
8.1 Mercury oxidation performance by catalyst ........................................................................... 111
8.2 Effect of temperature of dry EP on mercury removal performance ....................................... 113
8.3 Mercury removal performance when adding activated carbon ............................................. 118
9. SUMMARY OF MERCURY REMOVAL .......................................................... 123
10. TECHNICAL INFORMATION, DESULPHURIZATION AND DENTRIFICATION
........................................................................................................................... 125
10.1 Desulfurization performance depending on the difference of desulfurization method (dry,
semi-dry and wet) ....................................................................................................................... 125
10.2 Economy depending on the difference of desulfurization method (dry, semi-dry and wet) 136
10.3 Relationship between limestone property (purity) and gypsum property and effective
utilization method of gypsum ...................................................................................................... 138
10.4 Correlation between the denitrification rate at the time of using Indian coal and the amount
of ammonia injection ................................................................................................................... 143
10.5 Considerations for the design of denitrification device when combusting high ash content
Indian coal. ................................................................................................................................. 145
10.6 Denitrification catalyst geometry (plate and honeycomb); characteristics of each geometry
and how to select it ..................................................................................................................... 146
- 1 -
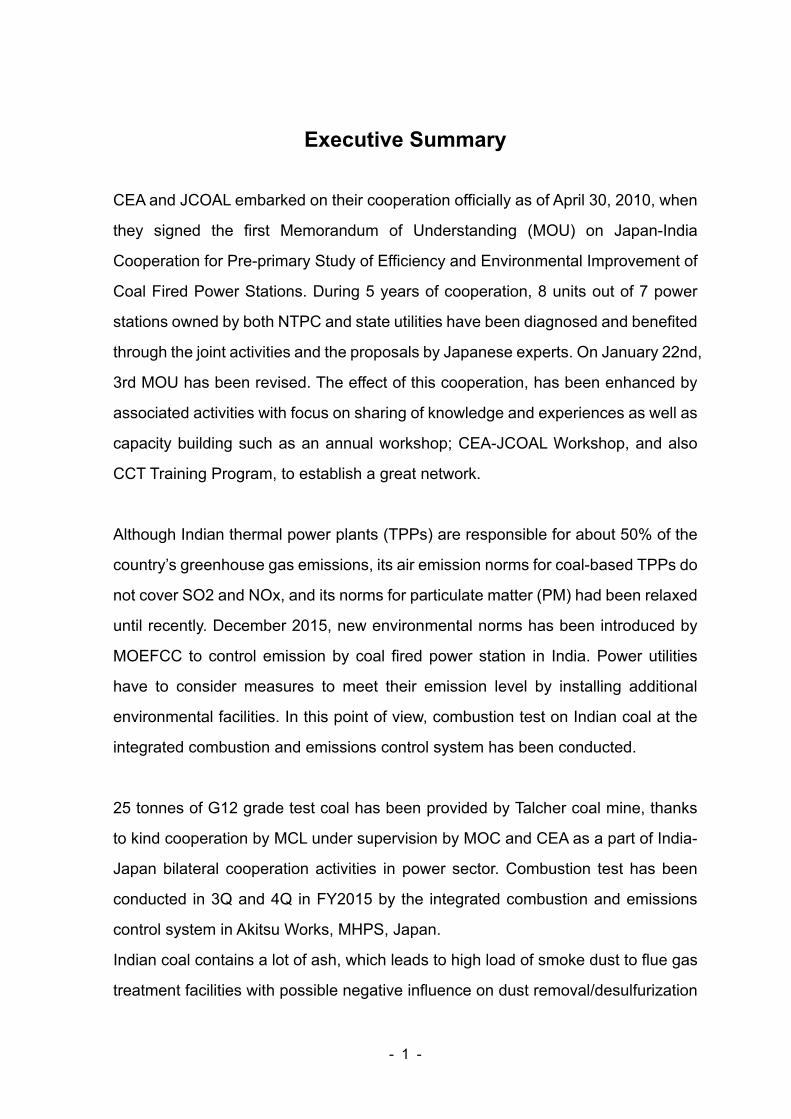
Executive Summary
CEA and JCOAL embarked on their cooperation officially as of April 30, 2010, when
they signed the first Memorandum of Understanding (MOU) on Japan-India
Cooperation for Pre-primary Study of Efficiency and Environmental Improvement of
Coal Fired Power Stations. During 5 years of cooperation, 8 units out of 7 power
stations owned by both NTPC and state utilities have been diagnosed and benefited
through the joint activities and the proposals by Japanese experts. On January 22nd,
3rd MOU has been revised. The effect of this cooperation, has been enhanced by
associated activities with focus on sharing of knowledge and experiences as well as
capacity building such as an annual workshop; CEA-JCOAL Workshop, and also
CCT Training Program, to establish a great network.
Although Indian thermal power plants (TPPs) are responsible for about 50% of the
country’s greenhouse gas emissions, its air emission norms for coal-based TPPs do
not cover SO2 and NOx, and its norms for particulate matter (PM) had been relaxed
until recently. December 2015, new environmental norms has been introduced by
MOEFCC to control emission by coal fired power station in India. Power utilities
have to consider measures to meet their emission level by installing additional
environmental facilities. In this point of view, combustion test on Indian coal at the
integrated combustion and emissions control system has been conducted.
25 tonnes of G12 grade test coal has been provided by Talcher coal mine, thanks
to kind cooperation by MCL under supervision by MOC and CEA as a part of India-
Japan bilateral cooperation activities in power sector. Combustion test has been
conducted in 3Q and 4Q in FY2015 by the integrated combustion and emissions
control system in Akitsu Works, MHPS, Japan.
Indian coal contains a lot of ash, which leads to high load of smoke dust to flue gas
treatment facilities with possible negative influence on dust removal/desulfurization
- 2 -
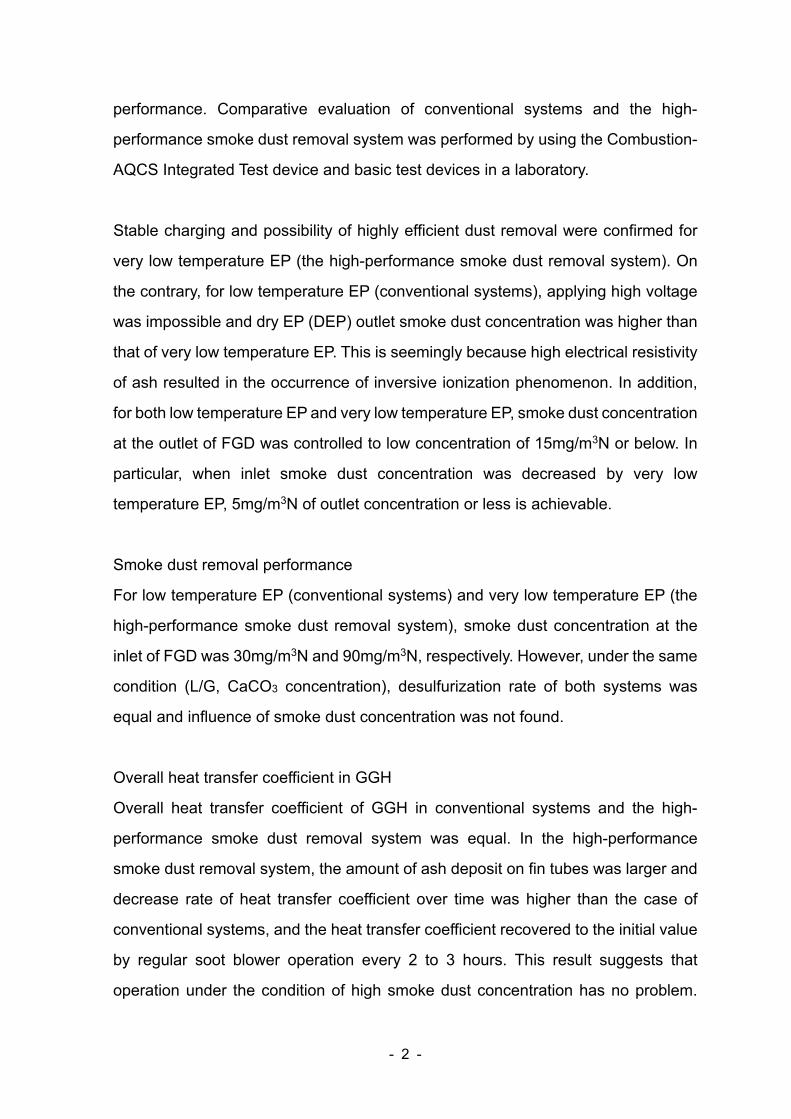
performance. Comparative evaluation of conventional systems and the high-
performance smoke dust removal system was performed by using the Combustion-
AQCS Integrated Test device and basic test devices in a laboratory.
Stable charging and possibility of highly efficient dust removal were confirmed for
very low temperature EP (the high-performance smoke dust removal system). On
the contrary, for low temperature EP (conventional systems), applying high voltage
was impossible and dry EP (DEP) outlet smoke dust concentration was higher than
that of very low temperature EP. This is seemingly because high electrical resistivity
of ash resulted in the occurrence of inversive ionization phenomenon. In addition,
for both low temperature EP and very low temperature EP, smoke dust concentration
at the outlet of FGD was controlled to low concentration of 15mg/m3N or below. In
particular, when inlet smoke dust concentration was decreased by very low
temperature EP, 5mg/m3N of outlet concentration or less is achievable.
Smoke dust removal performance
For low temperature EP (conventional systems) and very low temperature EP (the
high-performance smoke dust removal system), smoke dust concentration at the
inlet of FGD was 30mg/m3N and 90mg/m3N, respectively. However, under the same
condition (L/G, CaCO3 concentration), desulfurization rate of both systems was
equal and influence of smoke dust concentration was not found.
Overall heat transfer coefficient in GGH
Overall heat transfer coefficient of GGH in conventional systems and the high-
performance smoke dust removal system was equal. In the high-performance
smoke dust removal system, the amount of ash deposit on fin tubes was larger and
decrease rate of heat transfer coefficient over time was higher than the case of
conventional systems, and the heat transfer coefficient recovered to the initial value
by regular soot blower operation every 2 to 3 hours. This result suggests that
operation under the condition of high smoke dust concentration has no problem.
- 3 -
Abrasion speed in both systems was studied by using test pieces made of carbon
steel and sulfuric acid resistant steel. Difference in both systems was not found and
in terms of abrasion characteristics, operation of the high-performance smoke dust
removal system is assumed to cause no problem even under the condition of high
ash content.
Evaluation of economic efficiency
Based on relation between smoke dust removal performance and charge conditions,
under the condition where charge is 45kV and DEP outlet smoke dust concentration
is 30mg/m3N, very low temperature EP is estimated to reduce dust collection area
(EP volume) by approx. 25% compared to the case of low temperature EP.
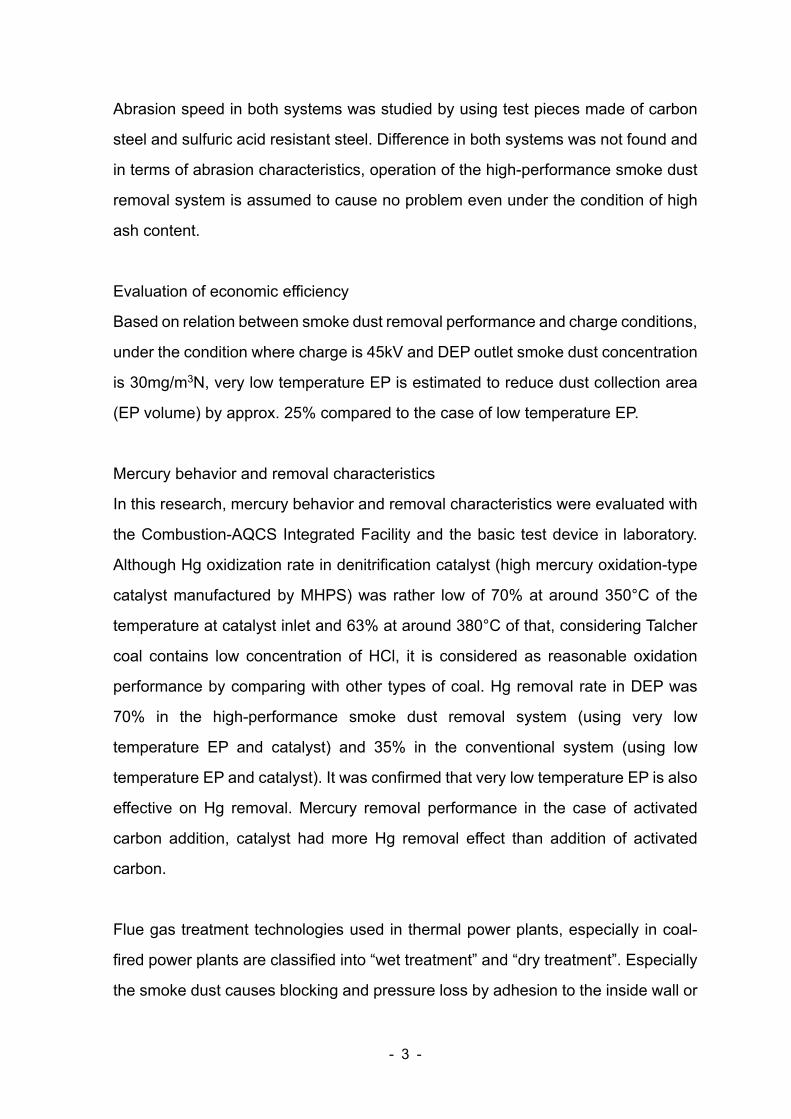
Mercury behavior and removal characteristics
In this research, mercury behavior and removal characteristics were evaluated with
the Combustion-AQCS Integrated Facility and the basic test device in laboratory.
Although Hg oxidization rate in denitrification catalyst (high mercury oxidation-type
catalyst manufactured by MHPS) was rather low of 70% at around 350°C of the
temperature at catalyst inlet and 63% at around 380°C of that, considering Talcher
coal contains low concentration of HCl, it is considered as reasonable oxidation
performance by comparing with other types of coal. Hg removal rate in DEP was
70% in the high-performance smoke dust removal system (using very low
temperature EP and catalyst) and 35% in the conventional system (using low
temperature EP and catalyst). It was confirmed that very low temperature EP is also
effective on Hg removal. Mercury removal performance in the case of activated
carbon addition, catalyst had more Hg removal effect than addition of activated
carbon.
Flue gas treatment technologies used in thermal power plants, especially in coal-
fired power plants are classified into “wet treatment” and “dry treatment”. Especially
the smoke dust causes blocking and pressure loss by adhesion to the inside wall or

- 4 -
deposit. It is therefore required to construct a system and design each facility by
addressing them. In this point of view, technical information regarding
desulphurization and denitrification are described.
- 5 -
1. INTRODUCTION
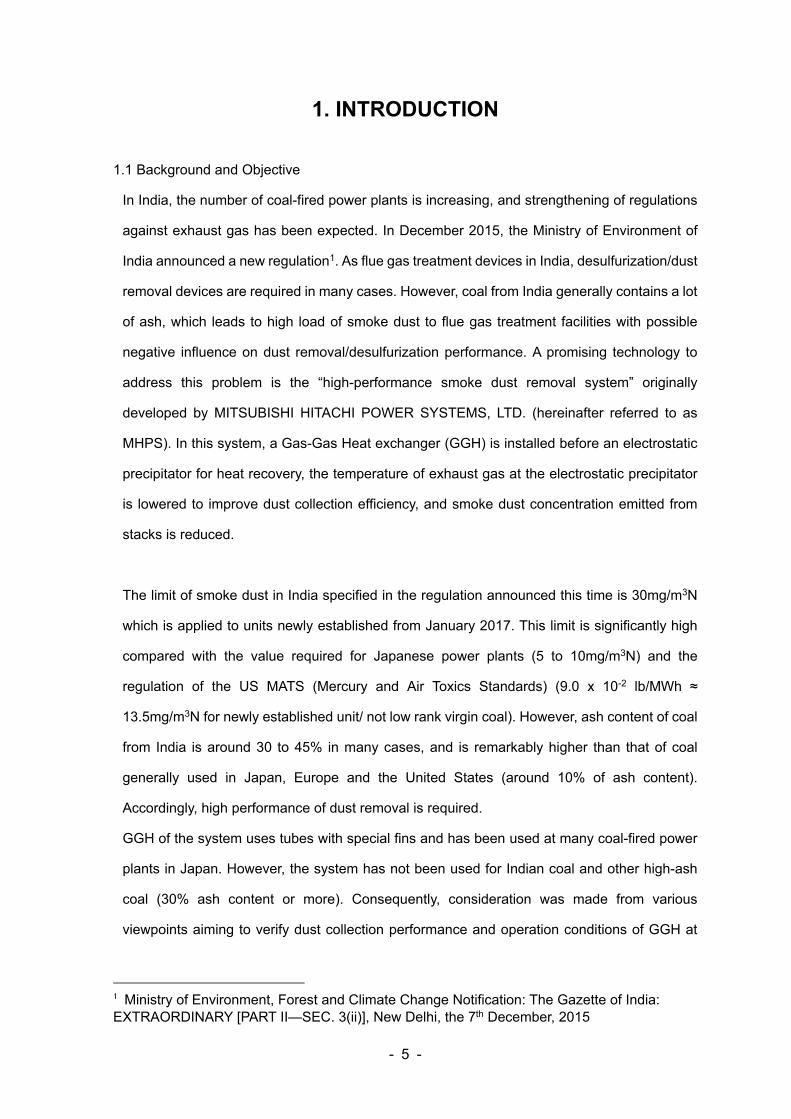
1.1 Background and Objective
In India, the number of coal-fired power plants is increasing, and strengthening of regulations
against exhaust gas has been expected. In December 2015, the Ministry of Environment of
India announced a new regulation1. As flue gas treatment devices in India, desulfurization/dust
removal devices are required in many cases. However, coal from India generally contains a lot
of ash, which leads to high load of smoke dust to flue gas treatment facilities with possible
negative influence on dust removal/desulfurization performance. A promising technology to
address this problem is the “high-performance smoke dust removal system” originally
developed by MITSUBISHI HITACHI POWER SYSTEMS, LTD. (hereinafter referred to as
MHPS). In this system, a Gas-Gas Heat exchanger (GGH) is installed before an electrostatic
precipitator for heat recovery, the temperature of exhaust gas at the electrostatic precipitator
is lowered to improve dust collection efficiency, and smoke dust concentration emitted from
stacks is reduced.
The limit of smoke dust in India specified in the regulation announced this time is 30mg/m3N
which is applied to units newly established from January 2017. This limit is significantly high
compared with the value required for Japanese power plants (5 to 10mg/m3N) and the
regulation of the US MATS (Mercury and Air Toxics Standards) (9.0 x 10⁻² lb/MWh ≈
13.5mg/m3N for newly established unit/ not low rank virgin coal). However, ash content of coal
from India is around 30 to 45% in many cases, and is remarkably higher than that of coal
generally used in Japan, Europe and the United States (around 10% of ash content).
Accordingly, high performance of dust removal is required.
GGH of the system uses tubes with special fins and has been used at many coal-fired power
plants in Japan. However, the system has not been used for Indian coal and other high-ash
coal (30% ash content or more). Consequently, consideration was made from various
viewpoints aiming to verify dust collection performance and operation conditions of GGH at
1 Ministry of Environment, Forest and Climate Change Notification: The Gazette of India: EXTRAORDINARY [PART II—SEC. 3(ii)], New Delhi, the 7th December, 2015
- 6 -
the large test facility owned by MHPS in advance. Successful application of the “high-
performance smoke dust removal system” to high-ash coal achieves differentiation from
foreign companies and ensures advantage in business for environmental devices in India in
the future.
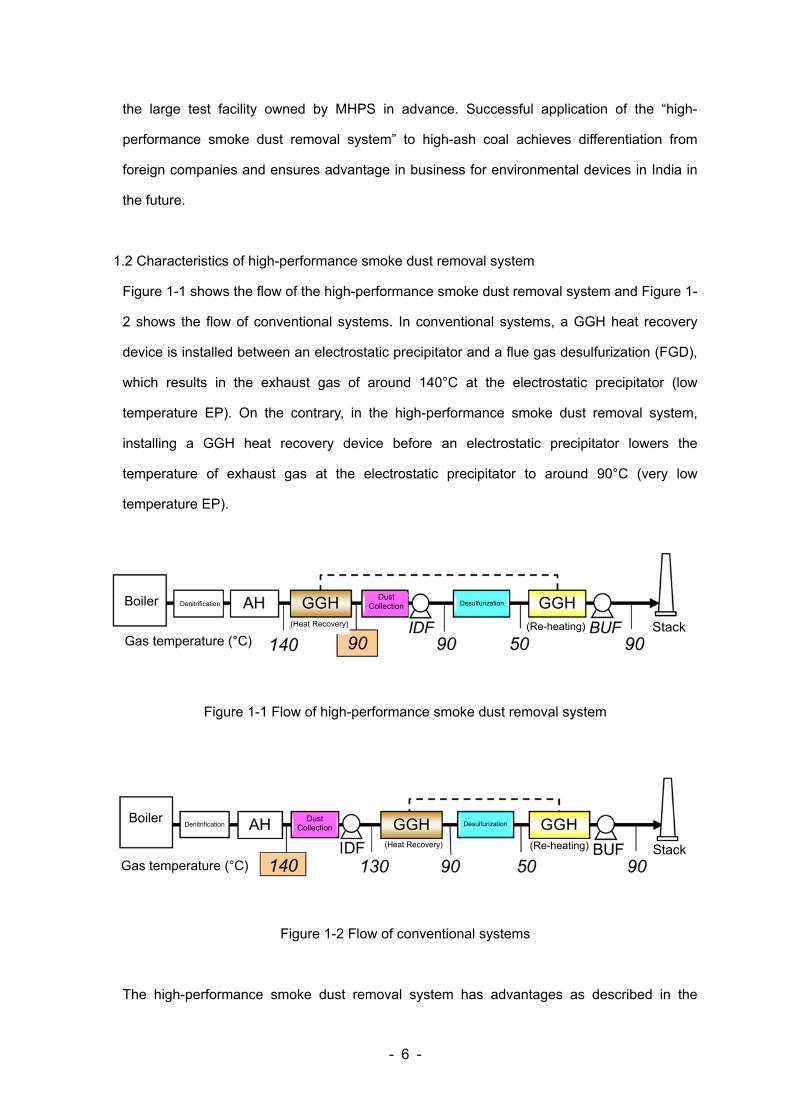
1.2 Characteristics of high-performance smoke dust removal system
Figure 1-1 shows the flow of the high-performance smoke dust removal system and Figure 1-
2 shows the flow of conventional systems. In conventional systems, a GGH heat recovery
device is installed between an electrostatic precipitator and a flue gas desulfurization (FGD),
which results in the exhaust gas of around 140°C at the electrostatic precipitator (low
temperature EP). On the contrary, in the high-performance smoke dust removal system,
installing a GGH heat recovery device before an electrostatic precipitator lowers the
temperature of exhaust gas at the electrostatic precipitator to around 90°C (very low
temperature EP).
Figure 1-1 Flow of high-performance smoke dust removal system
Figure 1-2 Flow of conventional systems
The high-performance smoke dust removal system has advantages as described in the
Denitrification Boiler
Gas temperature (°C)
(Heat Recovery)
Dust Collection Desulfurization
(Re-heating) Stack
Boiler Denitrification
(Heat Recovery)
Dust Collection Desulfurization
(Re-heating) StackGas temperature (°C)
- 7 -
references2,3.
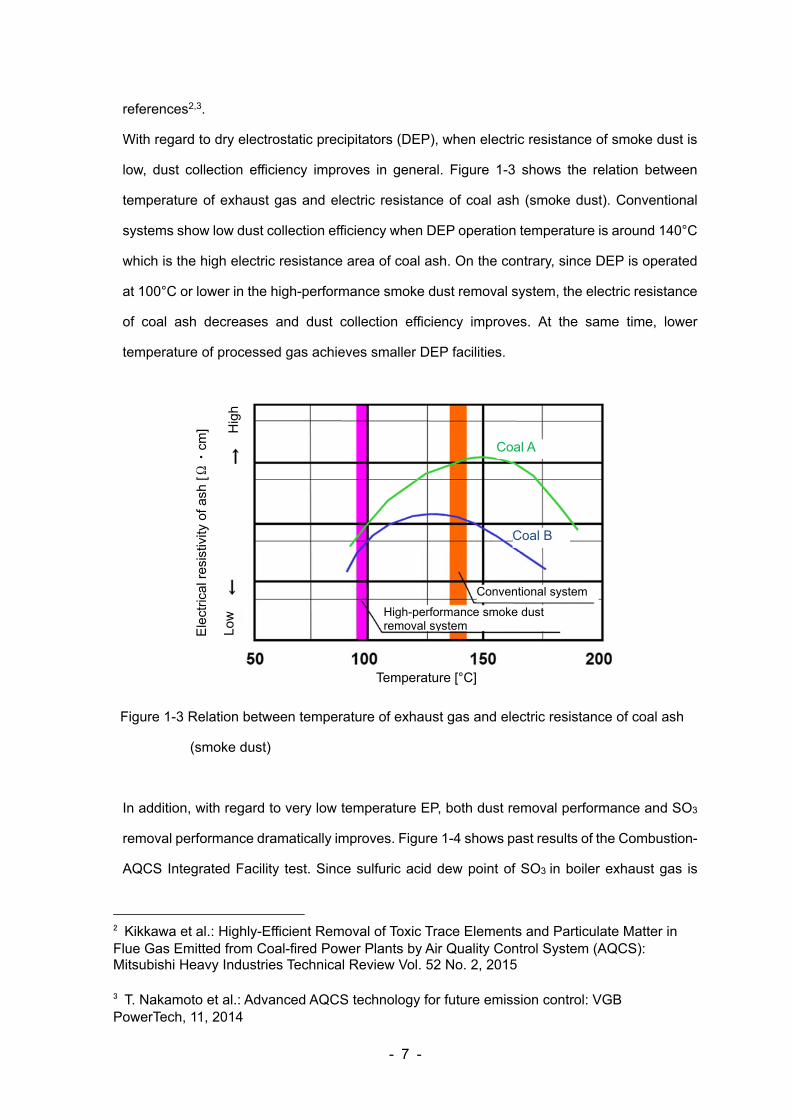
With regard to dry electrostatic precipitators (DEP), when electric resistance of smoke dust is
low, dust collection efficiency improves in general. Figure 1-3 shows the relation between
temperature of exhaust gas and electric resistance of coal ash (smoke dust). Conventional
systems show low dust collection efficiency when DEP operation temperature is around 140°C
which is the high electric resistance area of coal ash. On the contrary, since DEP is operated
at 100°C or lower in the high-performance smoke dust removal system, the electric resistance
of coal ash decreases and dust collection efficiency improves. At the same time, lower
temperature of processed gas achieves smaller DEP facilities.
Figure 1-3 Relation between temperature of exhaust gas and electric resistance of coal ash
(smoke dust)
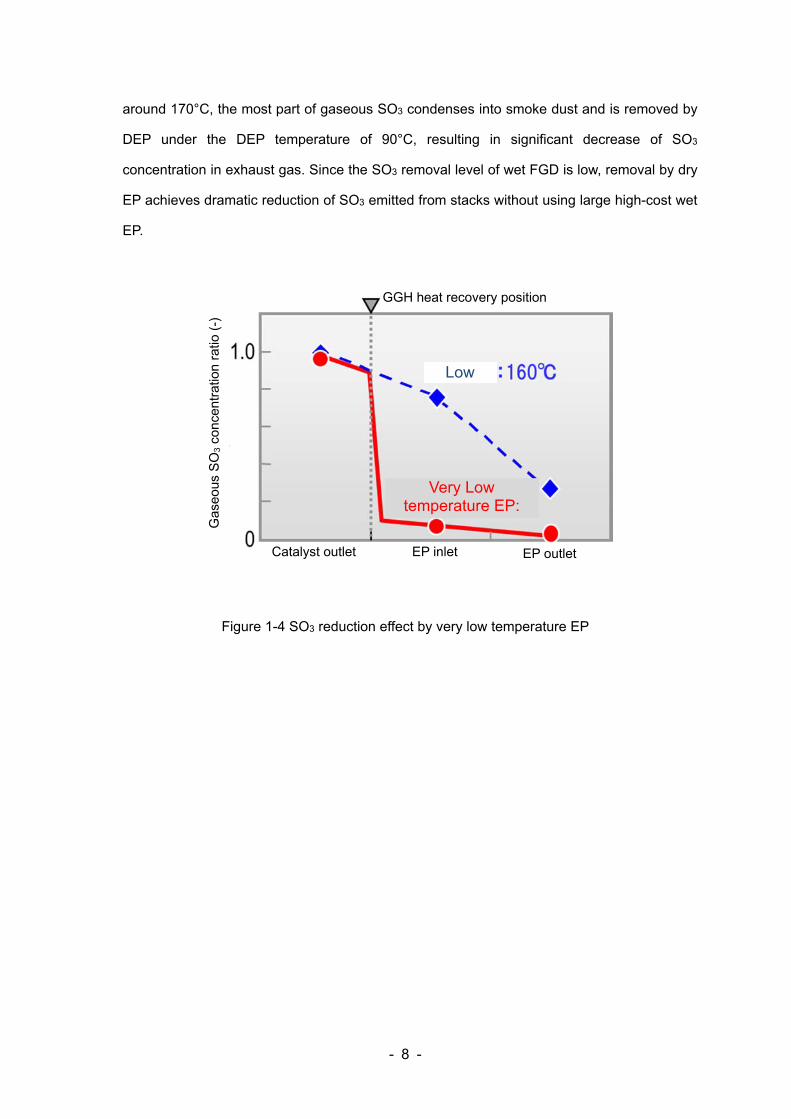
In addition, with regard to very low temperature EP, both dust removal performance and SO3
removal performance dramatically improves. Figure 1-4 shows past results of the Combustion-
AQCS Integrated Facility test. Since sulfuric acid dew point of SO3 in boiler exhaust gas is
2 Kikkawa et al.: Highly-Efficient Removal of Toxic Trace Elements and Particulate Matter in Flue Gas Emitted from Coal-fired Power Plants by Air Quality Control System (AQCS): Mitsubishi Heavy Industries Technical Review Vol. 52 No. 2, 2015 3 T. Nakamoto et al.: Advanced AQCS technology for future emission control: VGB PowerTech, 11, 2014
Temperature [°C]
Coal A
Low
Ele
ctric
al r
esis
tivity
of a
sh [Ω
・cm
] Hig
h
High-performance smoke dust removal system
Conventional system
Coal B
- 8 -
around 170°C, the most part of gaseous SO3 condenses into smoke dust and is removed by
DEP under the DEP temperature of 90°C, resulting in significant decrease of SO3
concentration in exhaust gas. Since the SO3 removal level of wet FGD is low, removal by dry
EP achieves dramatic reduction of SO3 emitted from stacks without using large high-cost wet
EP.
Figure 1-4 SO3 reduction effect by very low temperature EP
Low
GGH heat recovery position
Catalyst outlet
Gas
eous
SO
3 co
ncen
trat
ion
ratio
(-)
EP outlet EP inlet
Very Low temperature EP:
- 9 -
2. IMPLEMENTATION DETAILS
2.1 Test at the Combustion-AQCS Integrated Facility
2.1.1 Details of test
Coal from India (approx. 25 ton) provided by JCOAL was burned under the condition close to
actual pulverized coal fired boilers (approx. 200 kg of coal was fed per hour) for one week
(from Monday to Saturday) by using the “Combustion-AQCS Integrated Test Facility” of MHPS
to conduct test operation of exhaust gas treatment. The components of coal, combustion flue
gas, etc. were analyzed to evaluate performance of electrostatic precipitators and FGDs in
conventional systems and the high-performance smoke dust removal system. In addition, the
degree of heat exchange performance of an exhaust gas cooler (GGH heat recovery device)
used in the high-performance smoke dust removal system was evaluated under the condition
of high dust concentration. Detailed considerations are as follows:
(1) To understand heat-transfer performance, dust removal and desulfurization performance
when the high-performance smoke dust removal system is used under high smoke dust
concentration
(2) To understand heat-transfer performance,dust removal and desulfurization performance
when conventional systems are used under high smoke dust concentration
(3) To compare and evaluate economic efficiency based on test results of the both systems
(4) To propose verification tests using Indian actual devices based on this test
2.1.2 Main test operation conditions (plan)
(1) Combustion amount of coal: 185kg/h (ash content 40%)
(2) Gas temperature at the inlet of electrostatic precipitator:
90-100°C (high-performance smoke dust removal system), 140-150°C
(conventional systems)
(3) Electrostatic precipitator charge voltage: 25 to 45kV (3 conditions)
(4) Denitrification device: denitrification rate 90%
(5) Flue gas desulfurization: desulfurization rate 95%
- 10 -
2.2 Basic test
In order to support the result of desulfurization performance test conducted in the integrated
facility (influence of dust concentration), laboratory basic test was also conducted and the
result was closely reviewed.
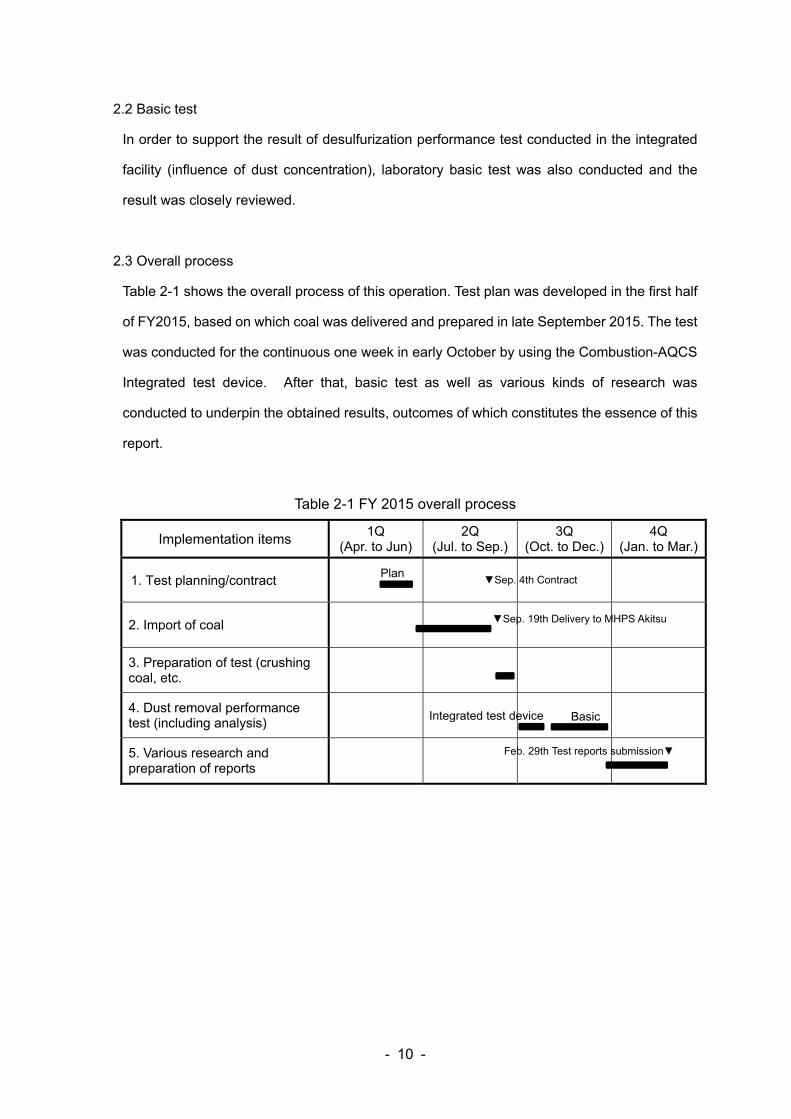
2.3 Overall process
Table 2-1 shows the overall process of this operation. Test plan was developed in the first half
of FY2015, based on which coal was delivered and prepared in late September 2015. The test
was conducted for the continuous one week in early October by using the Combustion-AQCS
Integrated test device. After that, basic test as well as various kinds of research was
conducted to underpin the obtained results, outcomes of which constitutes the essence of this
report.
Table 2-1 FY 2015 overall process
Implementation items 1Q
(Apr. to Jun)2Q
(Jul. to Sep.)3Q
(Oct. to Dec.) 4Q
(Jan. to Mar.)
1. Test planning/contract
2. Import of coal
3. Preparation of test (crushing coal, etc.
4. Dust removal performance test (including analysis)
5. Various research and preparation of reports
Sep. 19th Delivery to MHPS Akitsu
Feb. 29th Test reports submission
Integrated test device Basic
Sep. 4th Contract Plan
- 11 -
3. TEST METHOD
3.1 Overall test at the Combustion-AQCS Integrated Facility
3.1.1 Overview of the facility
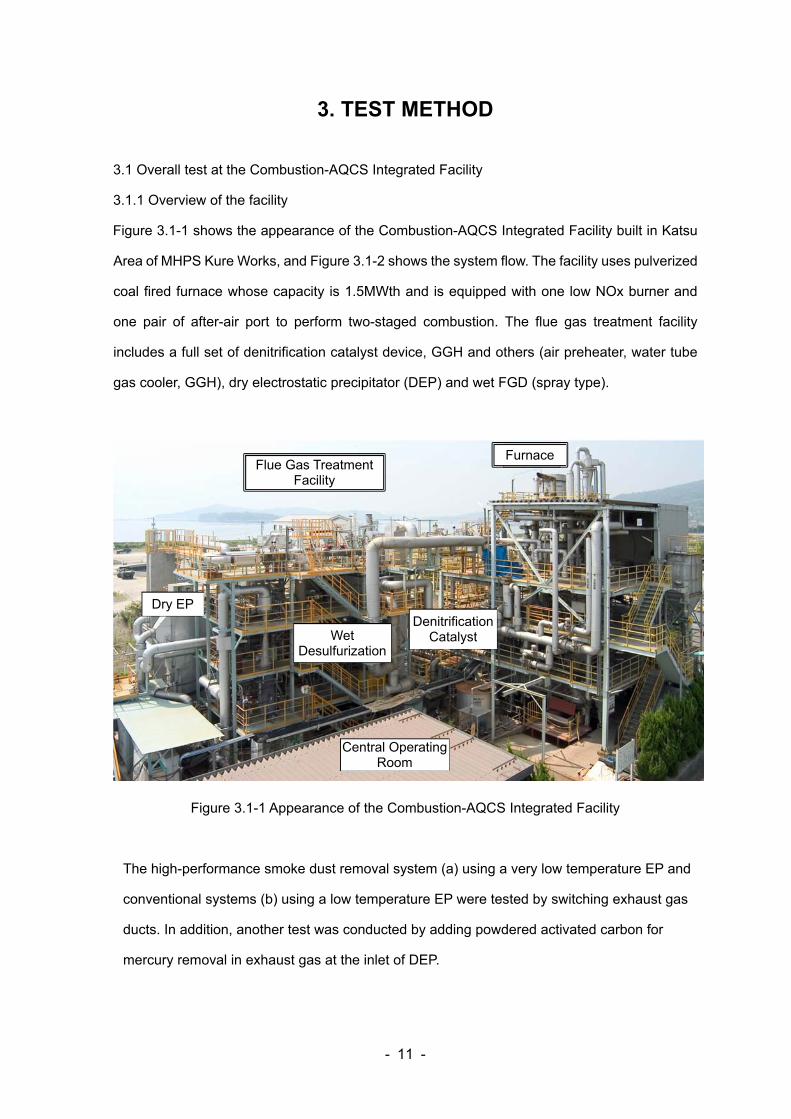
Figure 3.1-1 shows the appearance of the Combustion-AQCS Integrated Facility built in Katsu
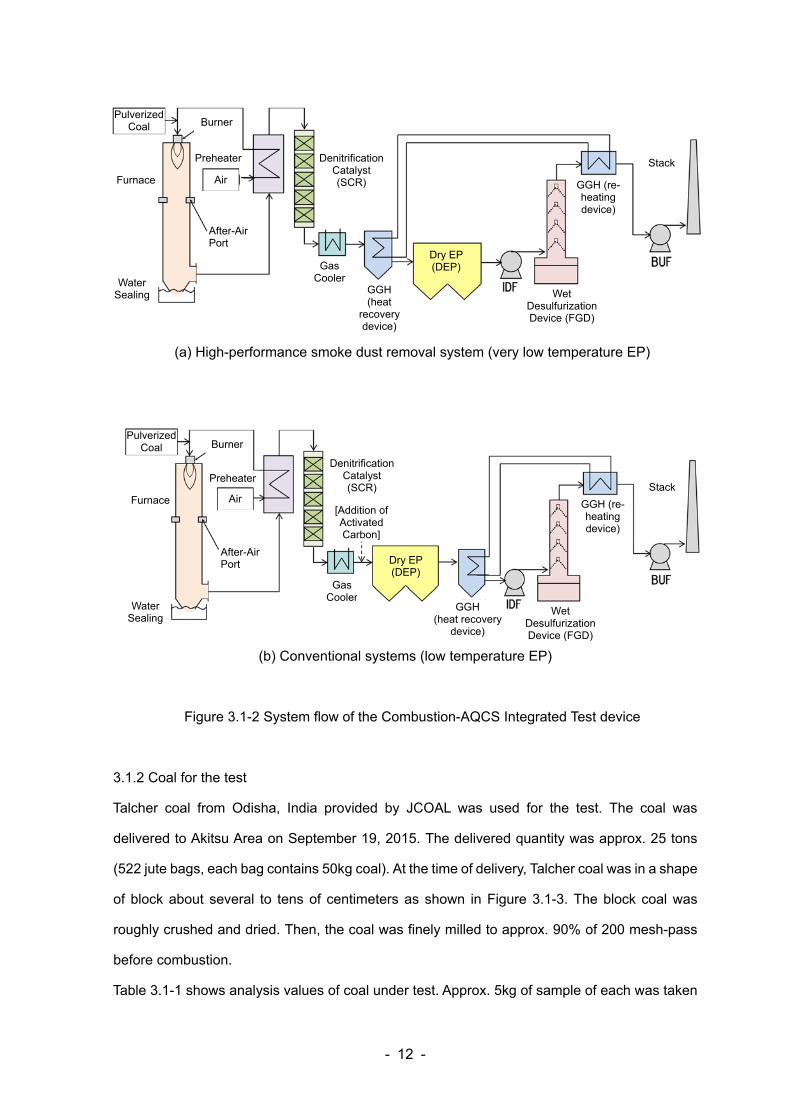
Area of MHPS Kure Works, and Figure 3.1-2 shows the system flow. The facility uses pulverized
coal fired furnace whose capacity is 1.5MWth and is equipped with one low NOx burner and
one pair of after-air port to perform two-staged combustion. The flue gas treatment facility
includes a full set of denitrification catalyst device, GGH and others (air preheater, water tube
gas cooler, GGH), dry electrostatic precipitator (DEP) and wet FGD (spray type).
Figure 3.1-1 Appearance of the Combustion-AQCS Integrated Facility
The high-performance smoke dust removal system (a) using a very low temperature EP and
conventional systems (b) using a low temperature EP were tested by switching exhaust gas
ducts. In addition, another test was conducted by adding powdered activated carbon for
mercury removal in exhaust gas at the inlet of DEP.
Dry EP
Flue Gas Treatment Facility
Furnace
Central Operating Room
Denitrification Catalyst Wet
Desulfurization
- 12 -
(a) High-performance smoke dust removal system (very low temperature EP)
(b) Conventional systems (low temperature EP)
Figure 3.1-2 System flow of the Combustion-AQCS Integrated Test device
3.1.2 Coal for the test
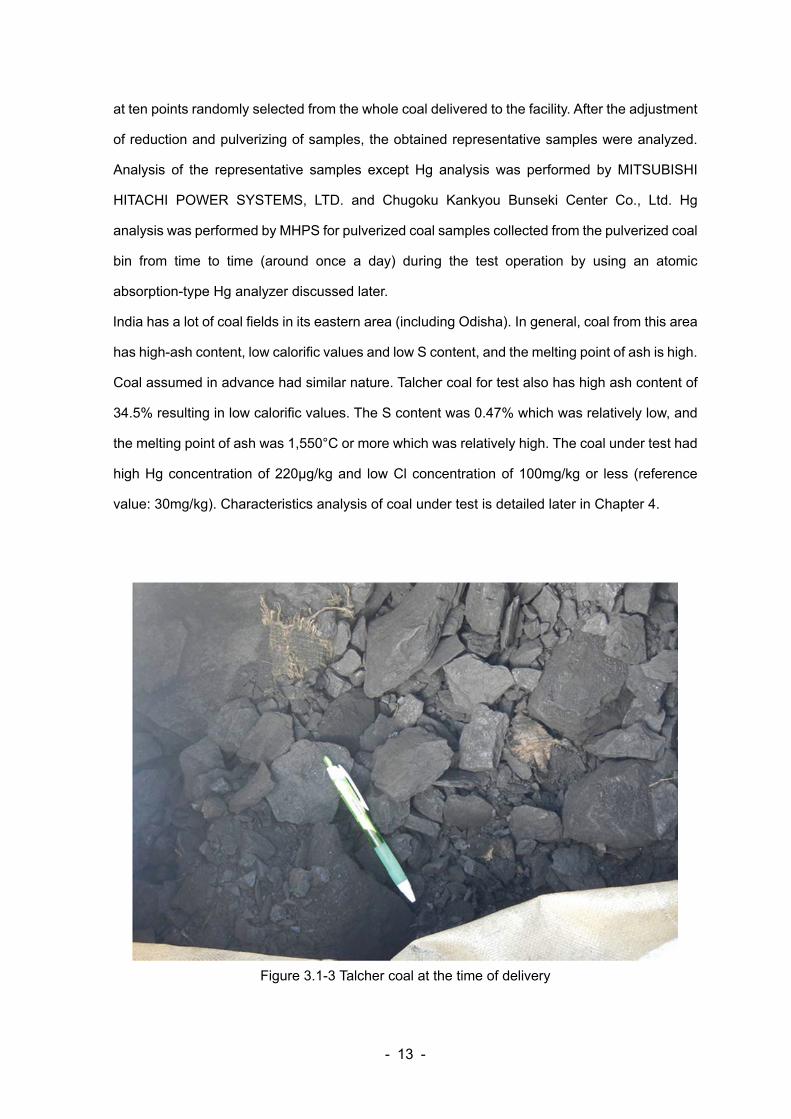
Talcher coal from Odisha, India provided by JCOAL was used for the test. The coal was
delivered to Akitsu Area on September 19, 2015. The delivered quantity was approx. 25 tons
(522 jute bags, each bag contains 50kg coal). At the time of delivery, Talcher coal was in a shape
of block about several to tens of centimeters as shown in Figure 3.1-3. The block coal was
roughly crushed and dried. Then, the coal was finely milled to approx. 90% of 200 mesh-pass
before combustion.
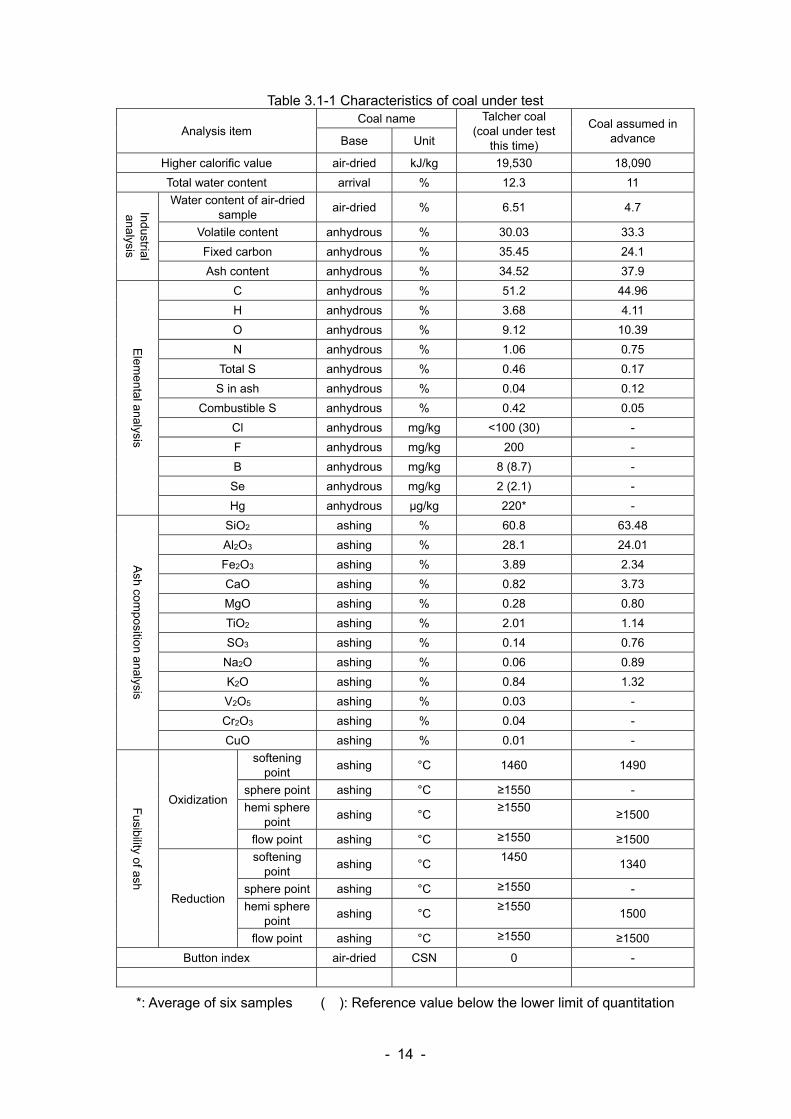
Table 3.1-1 shows analysis values of coal under test. Approx. 5kg of sample of each was taken
BurnerPulverized
Coal
Water Sealing
After-Air Port
Furnace
Gas Cooler
Denitrification Catalyst (SCR)
Preheater
AirStack
Wet Desulfurization Device (FGD)
Dry EP (DEP)
GGH (heat recovery
device)
GGH (re-heating device)
[Addition of Activated Carbon]
BurnerPulverized
Coal
Water Sealing
After-Air Port
Furnace
Gas Cooler
Denitrification Catalyst (SCR)
Preheater
Air
Stack
Wet Desulfurization Device (FGD)
Dry EP (DEP)
GGH (heat
recovery device)
GGH (re-heating device)
- 13 -
at ten points randomly selected from the whole coal delivered to the facility. After the adjustment
of reduction and pulverizing of samples, the obtained representative samples were analyzed.
Analysis of the representative samples except Hg analysis was performed by MITSUBISHI
HITACHI POWER SYSTEMS, LTD. and Chugoku Kankyou Bunseki Center Co., Ltd. Hg
analysis was performed by MHPS for pulverized coal samples collected from the pulverized coal
bin from time to time (around once a day) during the test operation by using an atomic
absorption-type Hg analyzer discussed later.
India has a lot of coal fields in its eastern area (including Odisha). In general, coal from this area
has high-ash content, low calorific values and low S content, and the melting point of ash is high.
Coal assumed in advance had similar nature. Talcher coal for test also has high ash content of
34.5% resulting in low calorific values. The S content was 0.47% which was relatively low, and
the melting point of ash was 1,550°C or more which was relatively high. The coal under test had
high Hg concentration of 220μg/kg and low Cl concentration of 100mg/kg or less (reference
value: 30mg/kg). Characteristics analysis of coal under test is detailed later in Chapter 4.
Figure 3.1-3 Talcher coal at the time of delivery
- 14 -
Table 3.1-1 Characteristics of coal under test
Analysis item Coal name Talcher coal
(coal under test this time)
Coal assumed in advance Base Unit
Higher calorific value air-dried kJ/kg 19,530 18,090
Total water content arrival % 12.3 11
Industrial
analysis
Water content of air-dried sample
air-dried % 6.51 4.7
Volatile content anhydrous % 30.03 33.3
Fixed carbon anhydrous % 35.45 24.1
Ash content anhydrous % 34.52 37.9
Elem
ental a
nalysis
C anhydrous % 51.2 44.96
H anhydrous % 3.68 4.11
O anhydrous % 9.12 10.39
N anhydrous % 1.06 0.75
Total S anhydrous % 0.46 0.17
S in ash anhydrous % 0.04 0.12
Combustible S anhydrous % 0.42 0.05
Cl anhydrous mg/kg <100 (30) -
F anhydrous mg/kg 200 -
B anhydrous mg/kg 8 (8.7) -
Se anhydrous mg/kg 2 (2.1) -
Hg anhydrous μg/kg 220* -
Ash com
position ana
lysis
SiO2 ashing % 60.8 63.48
Al2O3 ashing % 28.1 24.01
Fe2O3 ashing % 3.89 2.34
CaO ashing % 0.82 3.73
MgO ashing % 0.28 0.80
TiO2 ashing % 2.01 1.14
SO3 ashing % 0.14 0.76
Na2O ashing % 0.06 0.89
K2O ashing % 0.84 1.32
V2O5 ashing % 0.03 -
Cr2O3 ashing % 0.04 -
CuO ashing % 0.01 -
Fusibility of ash
Oxidization
softening point
ashing °C 1460 1490
sphere point ashing °C ≥1550 -
hemi sphere point
ashing °C ≥1550
≥1500
flow point ashing °C ≥1550 ≥1500
Reduction
softening point
ashing °C 1450
1340
sphere point ashing °C ≥1550 -
hemi sphere point
ashing °C ≥1550
1500
flow point ashing °C ≥1550 ≥1500
Button index air-dried CSN 0 -
*: Average of six samples ( ): Reference value below the lower limit of quantitation
- 15 -
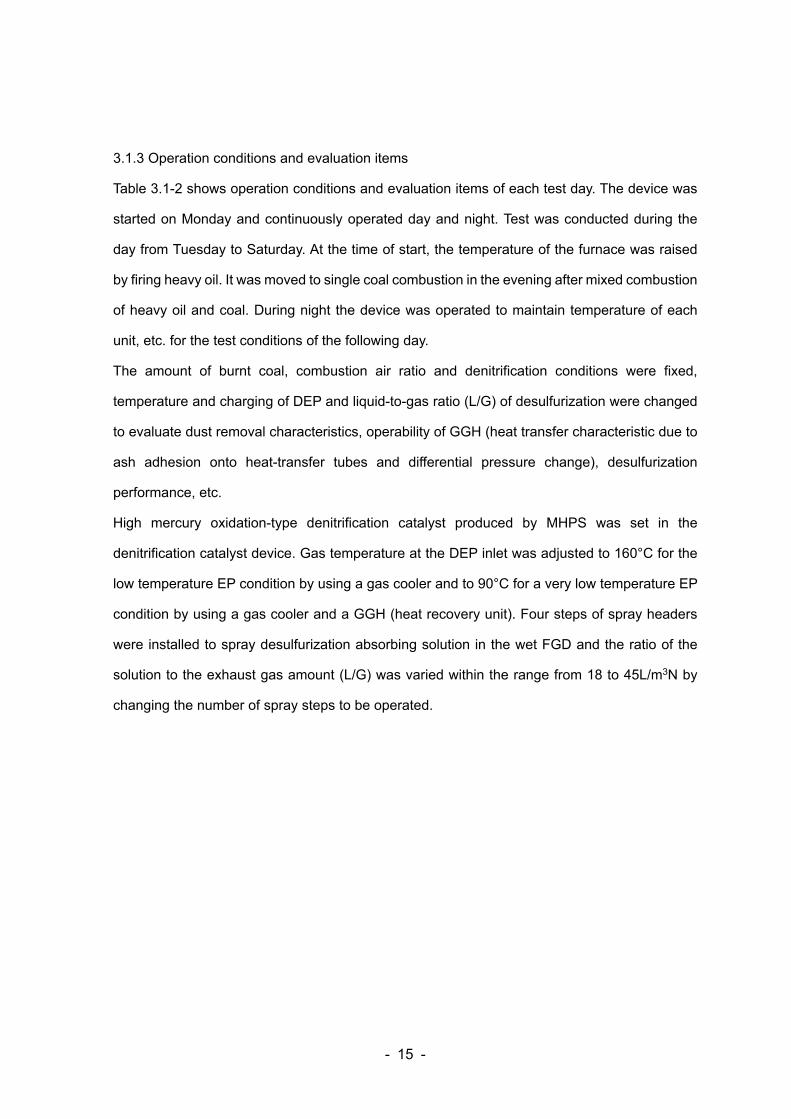
3.1.3 Operation conditions and evaluation items
Table 3.1-2 shows operation conditions and evaluation items of each test day. The device was
started on Monday and continuously operated day and night. Test was conducted during the
day from Tuesday to Saturday. At the time of start, the temperature of the furnace was raised
by firing heavy oil. It was moved to single coal combustion in the evening after mixed combustion
of heavy oil and coal. During night the device was operated to maintain temperature of each
unit, etc. for the test conditions of the following day.
The amount of burnt coal, combustion air ratio and denitrification conditions were fixed,
temperature and charging of DEP and liquid-to-gas ratio (L/G) of desulfurization were changed
to evaluate dust removal characteristics, operability of GGH (heat transfer characteristic due to
ash adhesion onto heat-transfer tubes and differential pressure change), desulfurization
performance, etc.
High mercury oxidation-type denitrification catalyst produced by MHPS was set in the
denitrification catalyst device. Gas temperature at the DEP inlet was adjusted to 160°C for the
low temperature EP condition by using a gas cooler and to 90°C for a very low temperature EP
condition by using a gas cooler and a GGH (heat recovery unit). Four steps of spray headers
were installed to spray desulfurization absorbing solution in the wet FGD and the ratio of the
solution to the exhaust gas amount (L/G) was varied within the range from 18 to 45L/m3N by
changing the number of spray steps to be operated.
- 16 -
Table 3.1-2 Scheduled operation conditions and evaluation items
Test day Oct. 5th(Mon.)
Oct. 6th(Tue.)
Oct. 7th(Wed.)
Oct. 8th (Thu.)
Oct. 9th (Fri.)
Oct. 10th(Sat.)
Operatio
n conditio
ns
System conditions
Start of device
very low temperature EP (90°C)
low temperature EP (160°C)
Feeding amount of coal 185 kg/h
Exhaust gas amount (air ratio: 1.4)
1,400 m3N/h, wet
Denitrification inlet temperature
380°C
Denitrification rate 90%
EP charge voltage (kV) (25 to 45,rating: 45)
Rating+ 2
conditions25 25
Rating + 2
conditions Rating
Desulfurization L/G (L/m3N) (18 to 45,rating: 45)
Rating Rating +
3 conditions
Rating + 2
conditions Rating Rating
Evalu
ation item
Smoke dust removal performance
-
Desulfurization inlet smoke dust particle size
- - - -
Desulfurization mist spreading amount
- - - - -
GGH heat transfer characteristics, change of differential pressure
- -
Desulfurization rate - -
- 17 -
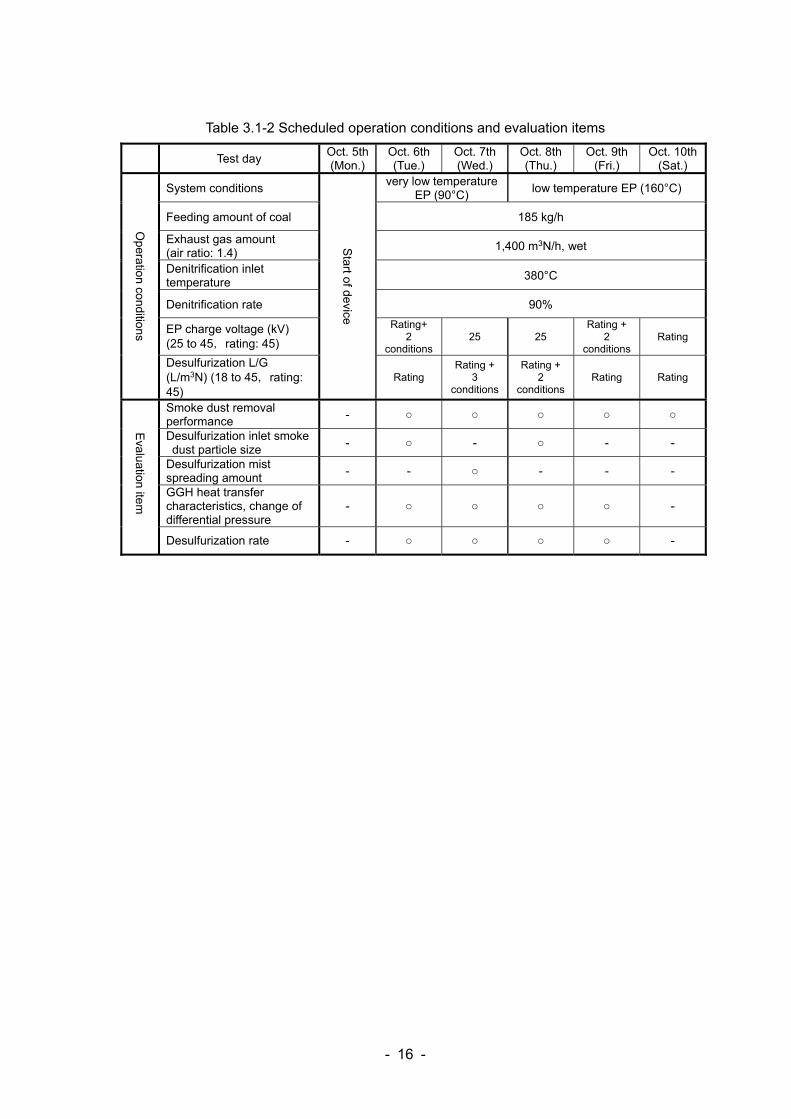
3.1.4 Measurement points
Figure 3.1-4 shows specific duct flows under the condition of a very low temperature EP (the
high-performance smoke dust removal system) and the condition of a low temperature EP
(conventional systems) and points of exhaust gas components measurement (sampling).
Manual analysis sampling was performed at each inlet and outlet of the denitrification device,
the dry EP and the FGD to evaluate characteristics of harmful component removal for each
device. In addition, concentration of SO2, NOx, CO, CO2 and O2 in exhaust gas was continuously
measured with a gas monitor at the denitrification inlet and the desulfurization outlets
Figure 3.1-4 Duct flows for each EP temperature condition and measurement points of exhaust
gas components
Air Preheater
From Furnace
Manual analysis Manual analysis + Continuous monitor Flow under the condition of low temperature EP
Flow under the condition of very low temperature EP
Gas Cooler Denitrification
Outlet
Denitrification Catalyst (SCR)
Denitrification Inlet
GGH Re-heating Device
To Stack
Wet Desulfurization Device (FGD)
(Activated Carbon Supply)
GGH Heat Recovery
Dry EP (DEP)
EP Inlet EP Outlet
(Desulfurization Inlet)
Desulfurization Outlet
- 18 -
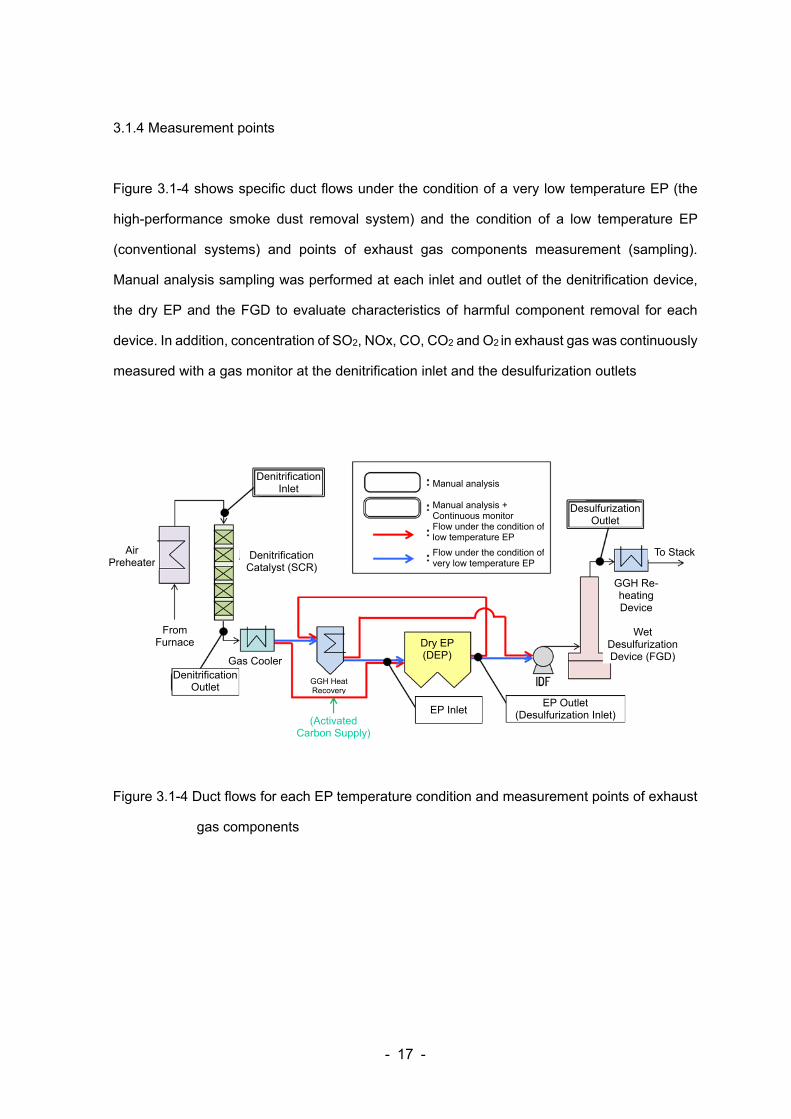
3.1.5 Measurement method
(1) Major exhaust gas components
At the denitrification inlet and the outlet of the FGD, concentration of SO2, NOx, CO, CO2 and
O2 in exhaust gas was measured and recorded with a continuous five components gas monitor
(HORIBA, Ltd./ENDA-5800) shown in Figure 3.1-5. Detection methods were the Non-dispersive
infrared method for SO2, NOx, CO and CO2, and the magnetic pressure method for O2.
Water content was measured and manually analyzed by moisture absorption tube method (JIS
Z 8808) using a calcium chloride tube. In addition, at the time of evaluation of desulfurization
performance, etc., concentration of each component was calculated by correcting O2
concentration to a certain level (6%).
Figure 3.1-5 Continuous gas monitor (HORIBA, Ltd./ENDA-5800)
(2) Amount of exhaust gas
With regard to the measurement of exhaust gas amount, pursuant to JIS Z8808, wet gas amount
was calculated based on the exhaust gas flow velocity measured by using a pitot tube and the
duct area, and the measured water content was subtracted from the obtained gas amount to
calculate dry gas amount.
(a) Case Body (b) Inner Parts
- 19 -
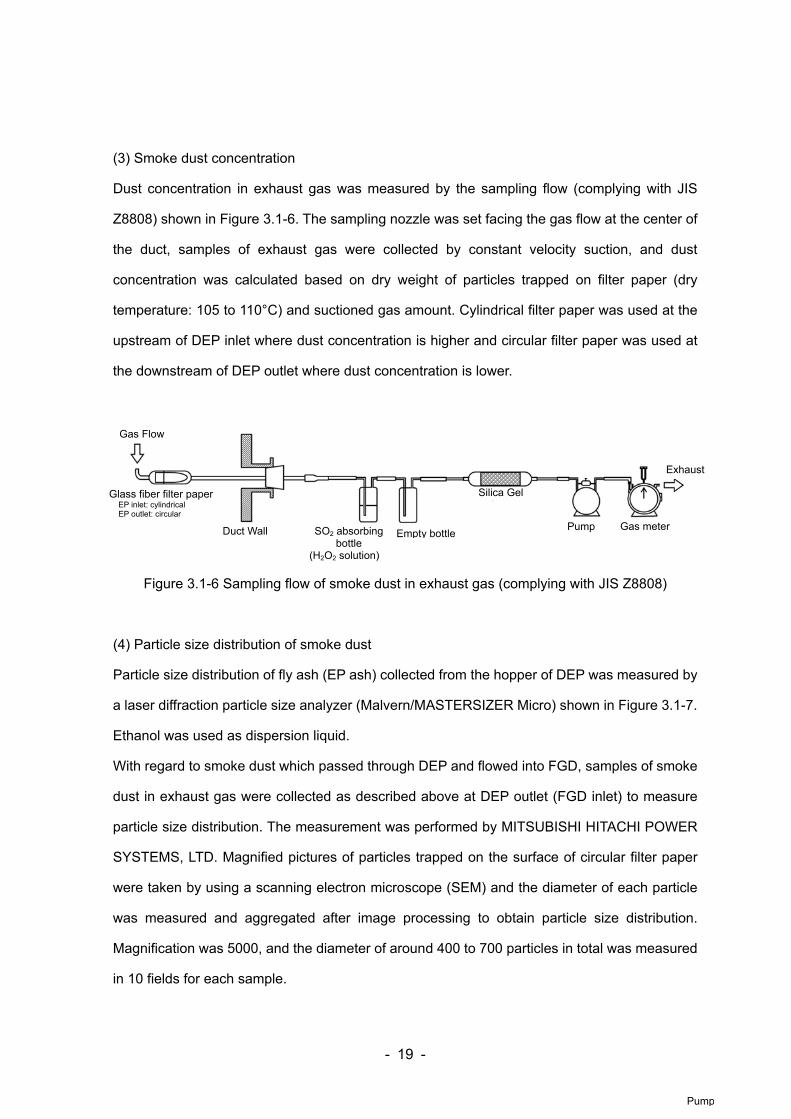
(3) Smoke dust concentration
Dust concentration in exhaust gas was measured by the sampling flow (complying with JIS
Z8808) shown in Figure 3.1-6. The sampling nozzle was set facing the gas flow at the center of
the duct, samples of exhaust gas were collected by constant velocity suction, and dust
concentration was calculated based on dry weight of particles trapped on filter paper (dry
temperature: 105 to 110°C) and suctioned gas amount. Cylindrical filter paper was used at the
upstream of DEP inlet where dust concentration is higher and circular filter paper was used at
the downstream of DEP outlet where dust concentration is lower.
Figure 3.1-6 Sampling flow of smoke dust in exhaust gas (complying with JIS Z8808)
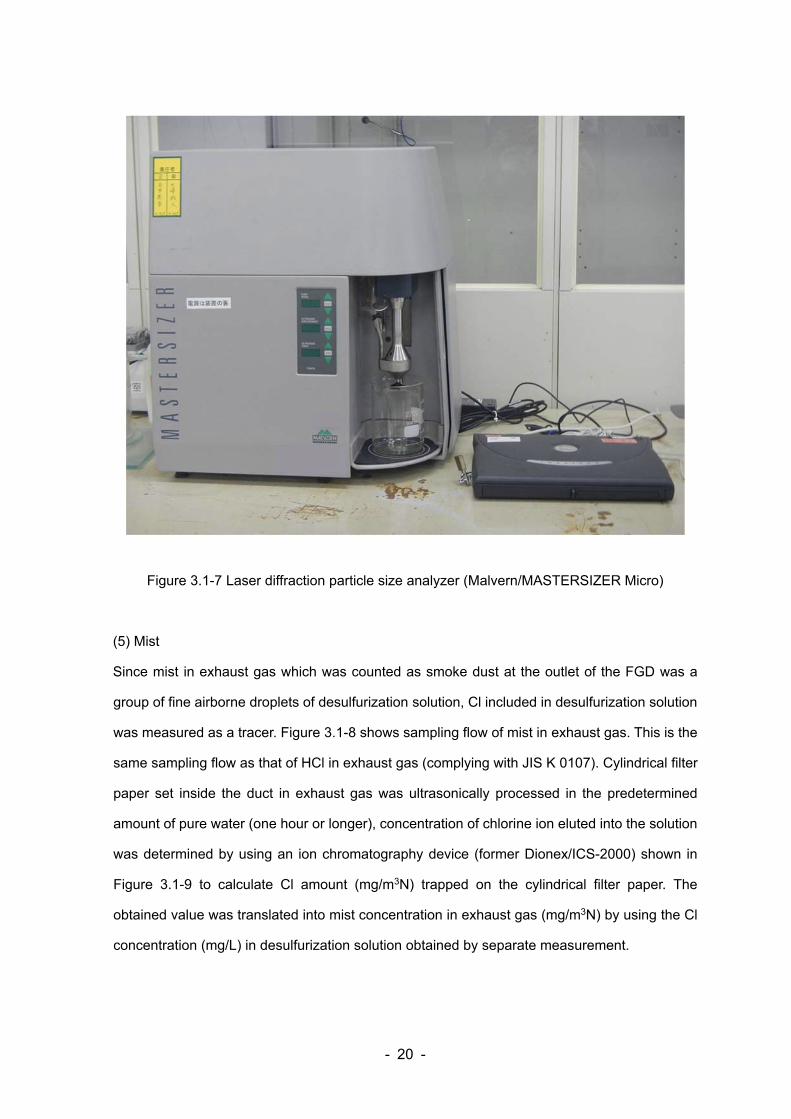
(4) Particle size distribution of smoke dust
Particle size distribution of fly ash (EP ash) collected from the hopper of DEP was measured by
a laser diffraction particle size analyzer (Malvern/MASTERSIZER Micro) shown in Figure 3.1-7.
Ethanol was used as dispersion liquid.
With regard to smoke dust which passed through DEP and flowed into FGD, samples of smoke
dust in exhaust gas were collected as described above at DEP outlet (FGD inlet) to measure
particle size distribution. The measurement was performed by MITSUBISHI HITACHI POWER
SYSTEMS, LTD. Magnified pictures of particles trapped on the surface of circular filter paper
were taken by using a scanning electron microscope (SEM) and the diameter of each particle
was measured and aggregated after image processing to obtain particle size distribution.
Magnification was 5000, and the diameter of around 400 to 700 particles in total was measured
in 10 fields for each sample.
PumpPumpPump
Empty bottle
Gas Flow
Glass fiber filter paper EP inlet: cylindrical EP outlet: circular
Duct Wall
Silica Gel
Gas meterPump SO2 absorbing bottle
(H2O2 solution)
Exhaust
- 20 -
Figure 3.1-7 Laser diffraction particle size analyzer (Malvern/MASTERSIZER Micro)
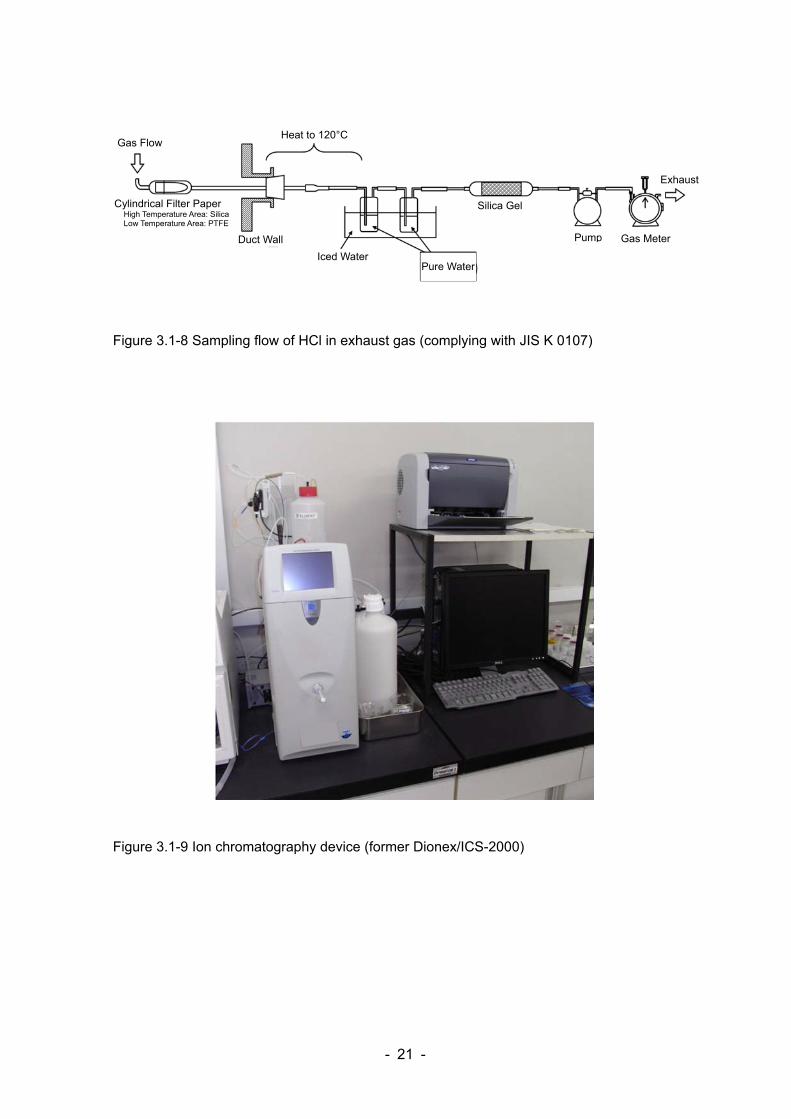
(5) Mist
Since mist in exhaust gas which was counted as smoke dust at the outlet of the FGD was a
group of fine airborne droplets of desulfurization solution, Cl included in desulfurization solution
was measured as a tracer. Figure 3.1-8 shows sampling flow of mist in exhaust gas. This is the
same sampling flow as that of HCl in exhaust gas (complying with JIS K 0107). Cylindrical filter
paper set inside the duct in exhaust gas was ultrasonically processed in the predetermined
amount of pure water (one hour or longer), concentration of chlorine ion eluted into the solution
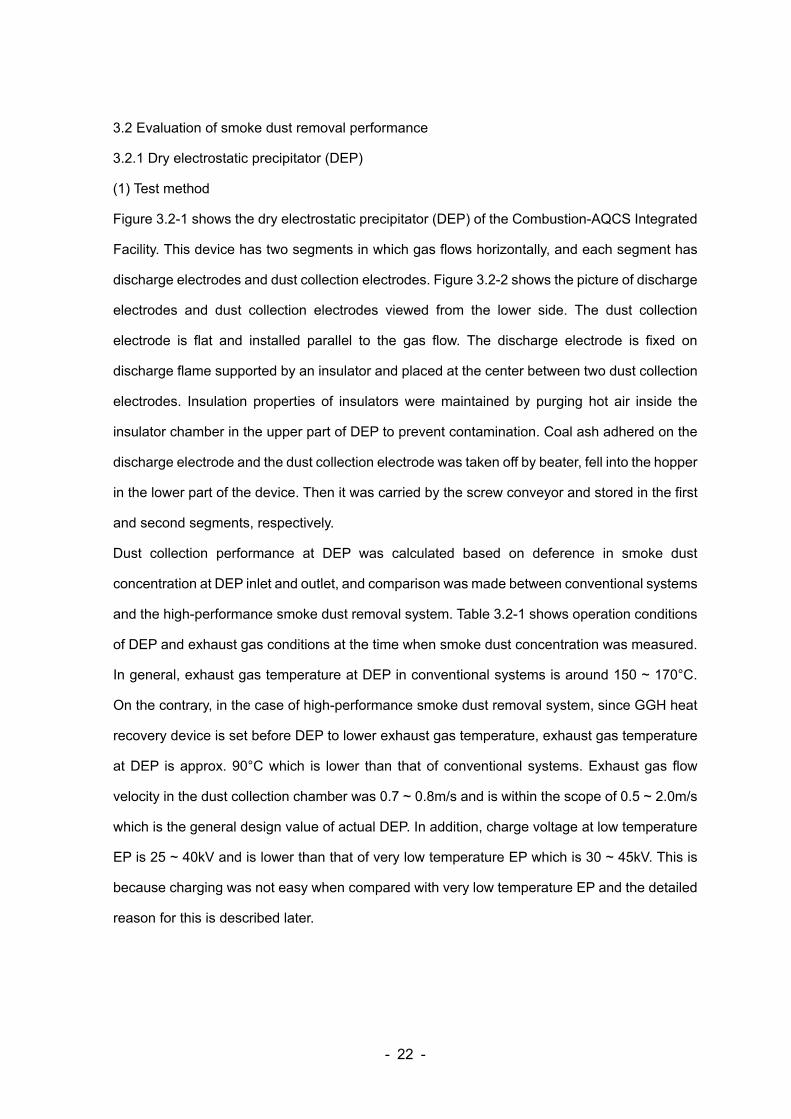
was determined by using an ion chromatography device (former Dionex/ICS-2000) shown in
Figure 3.1-9 to calculate Cl amount (mg/m3N) trapped on the cylindrical filter paper. The
obtained value was translated into mist concentration in exhaust gas (mg/m3N) by using the Cl
concentration (mg/L) in desulfurization solution obtained by separate measurement.
- 21 -
Figure 3.1-8 Sampling flow of HCl in exhaust gas (complying with JIS K 0107)
Figure 3.1-9 Ion chromatography device (former Dionex/ICS-2000)
Duct Wall
Heat to 120°C
Pure WaterIced Water
Silica Gel
Gas Flow
Exhaust
Gas MeterPump
Cylindrical Filter Paper High Temperature Area: Silica Low Temperature Area: PTFE
- 22 -
3.2 Evaluation of smoke dust removal performance
3.2.1 Dry electrostatic precipitator (DEP)
(1) Test method
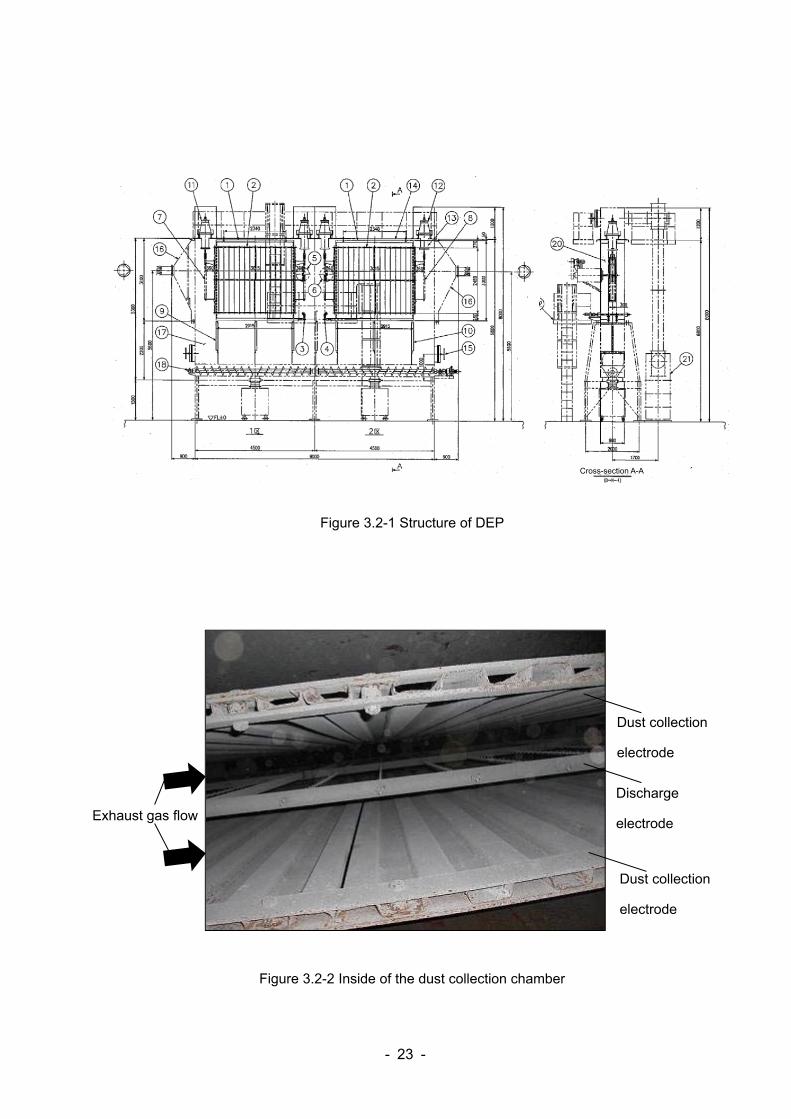
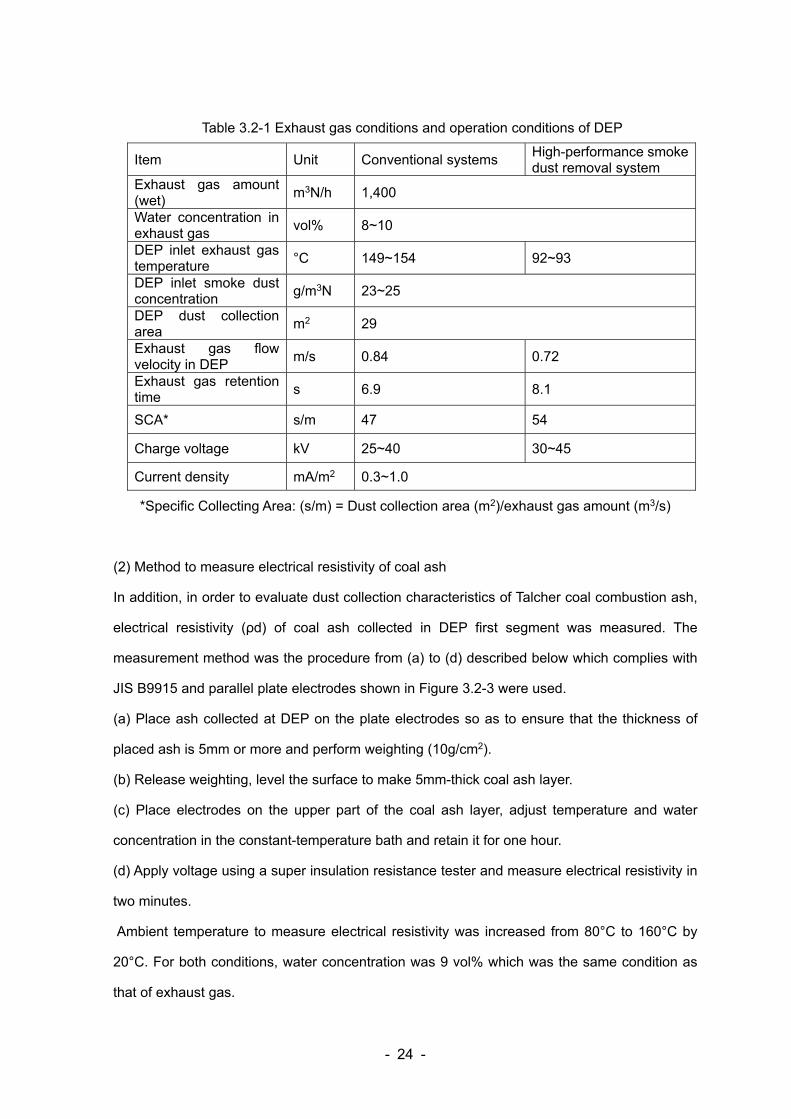
Figure 3.2-1 shows the dry electrostatic precipitator (DEP) of the Combustion-AQCS Integrated
Facility. This device has two segments in which gas flows horizontally, and each segment has
discharge electrodes and dust collection electrodes. Figure 3.2-2 shows the picture of discharge
electrodes and dust collection electrodes viewed from the lower side. The dust collection
electrode is flat and installed parallel to the gas flow. The discharge electrode is fixed on
discharge flame supported by an insulator and placed at the center between two dust collection
electrodes. Insulation properties of insulators were maintained by purging hot air inside the
insulator chamber in the upper part of DEP to prevent contamination. Coal ash adhered on the
discharge electrode and the dust collection electrode was taken off by beater, fell into the hopper
in the lower part of the device. Then it was carried by the screw conveyor and stored in the first
and second segments, respectively.
Dust collection performance at DEP was calculated based on deference in smoke dust
concentration at DEP inlet and outlet, and comparison was made between conventional systems
and the high-performance smoke dust removal system. Table 3.2-1 shows operation conditions
of DEP and exhaust gas conditions at the time when smoke dust concentration was measured.
In general, exhaust gas temperature at DEP in conventional systems is around 150 ~ 170°C.
On the contrary, in the case of high-performance smoke dust removal system, since GGH heat
recovery device is set before DEP to lower exhaust gas temperature, exhaust gas temperature
at DEP is approx. 90°C which is lower than that of conventional systems. Exhaust gas flow
velocity in the dust collection chamber was 0.7 ~ 0.8m/s and is within the scope of 0.5 ~ 2.0m/s
which is the general design value of actual DEP. In addition, charge voltage at low temperature
EP is 25 ~ 40kV and is lower than that of very low temperature EP which is 30 ~ 45kV. This is
because charging was not easy when compared with very low temperature EP and the detailed
reason for this is described later.
- 23 -
Figure 3.2-1 Structure of DEP
Figure 3.2-2 Inside of the dust collection chamber
Discharge
electrode
Dust collection
electrode
Dust collection
electrode
Exhaust gas flow
Cross-section A-A
- 24 -
Table 3.2-1 Exhaust gas conditions and operation conditions of DEP
Item Unit Conventional systems High-performance smoke dust removal system
Exhaust gas amount (wet)
m3N/h 1,400
Water concentration in exhaust gas
vol% 8~10
DEP inlet exhaust gas temperature
°C 149~154 92~93
DEP inlet smoke dust concentration
g/m3N 23~25
DEP dust collection area
m2 29
Exhaust gas flow velocity in DEP
m/s 0.84 0.72
Exhaust gas retention time
s 6.9 8.1
SCA* s/m 47 54
Charge voltage kV 25~40 30~45
Current density mA/m2 0.3~1.0
*Specific Collecting Area: (s/m) = Dust collection area (m2)/exhaust gas amount (m3/s)
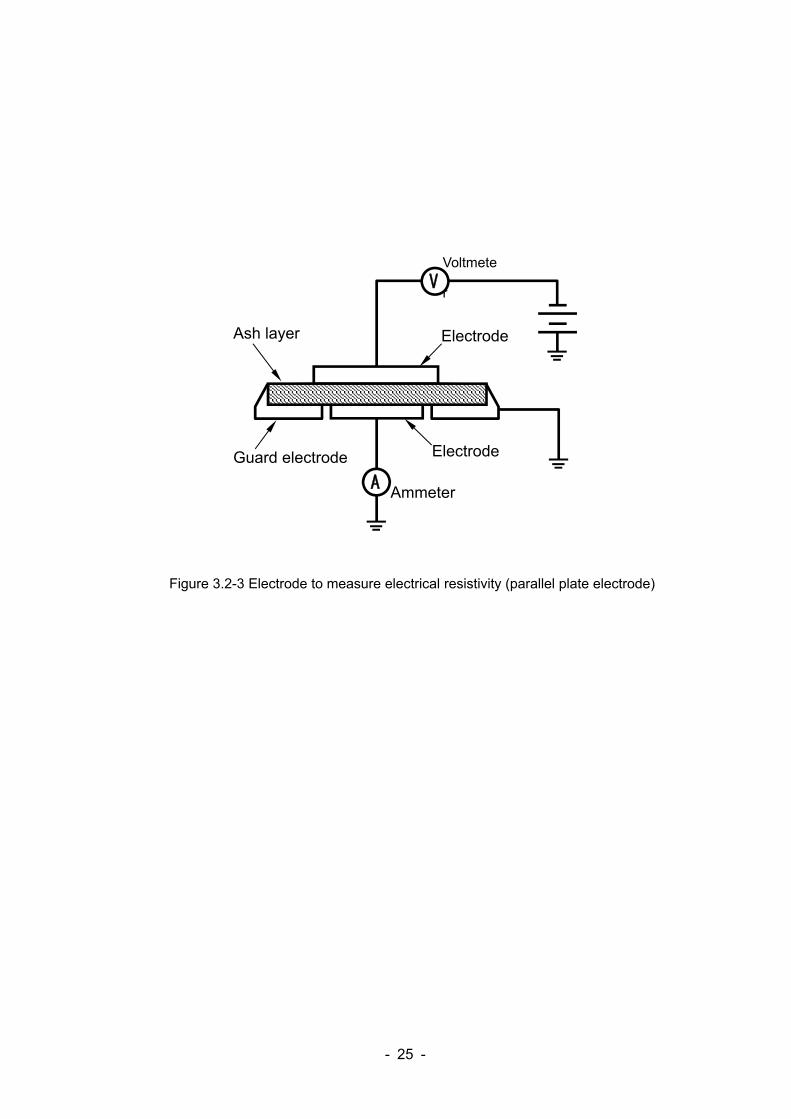
(2) Method to measure electrical resistivity of coal ash
In addition, in order to evaluate dust collection characteristics of Talcher coal combustion ash,
electrical resistivity (ρd) of coal ash collected in DEP first segment was measured. The
measurement method was the procedure from (a) to (d) described below which complies with
JIS B9915 and parallel plate electrodes shown in Figure 3.2-3 were used.
(a) Place ash collected at DEP on the plate electrodes so as to ensure that the thickness of
placed ash is 5mm or more and perform weighting (10g/cm2).
(b) Release weighting, level the surface to make 5mm-thick coal ash layer.
(c) Place electrodes on the upper part of the coal ash layer, adjust temperature and water
concentration in the constant-temperature bath and retain it for one hour.
(d) Apply voltage using a super insulation resistance tester and measure electrical resistivity in
two minutes.
Ambient temperature to measure electrical resistivity was increased from 80°C to 160°C by
20°C. For both conditions, water concentration was 9 vol% which was the same condition as
that of exhaust gas.
- 25 -
Figure 3.2-3 Electrode to measure electrical resistivity (parallel plate electrode)
Voltmete
r
Ammeter
Ash layer Electrode
Electrode Guard electrode
A
V
- 26 -
3.2.2 Flue gas desulfurization (FGD)
The smoke dust removal performance at FGD was evaluated under the conditions shown in
Table 3.2-2. Desulfurization L/G was set by changing the number of spray steps. With this, the
drop size of spray liquid does not change even when L/G is changed, and influence of L/G on
dust removal performance can be evaluated without change of the drop size of spray liquid. The
specification of FGD is described in section 3.3. The spray nozzle used for the FGD was small,
leading to higher spray pressure than that of actual device. Accordingly, with regard to influence
on dust removal performance, spray velocity was fast and the drop size of spray liquid was small
compared with actual devices. In addition, since the drop size of smoke dust may influence on
dust removal performance at FGD, smoke dust at DEP outlet was trapped by using circular filter
paper and observed with a SEM to obtain particle size distribution, as described in the above.
Table 3.2-2 Exhaust gas conditions at desulfurization inlet and operation conditions
Item unit Conventional systems
High-performance smoke dust removal system
Remark
Exhaust gas amount (wet)
m3N/h 1,440
Water concentration in exhaust gas
vol% 8~10
Desulfurization inlet smoke dust concentration
mg/m3N 200~1,300 8~78
L/G L/m3N 8~32
Spray pressure MPa 0.1 Actual device: 0.05~0.08MPa
Spray velocity m/s 10 Actual device: 7~9m/s
Spray droplet average size
μm 690 Actual device: 2,000μm
- 27 -
3.3 Performance evaluation of desulfurization
3.3.1 Combustion-AQCS Integrated Facility
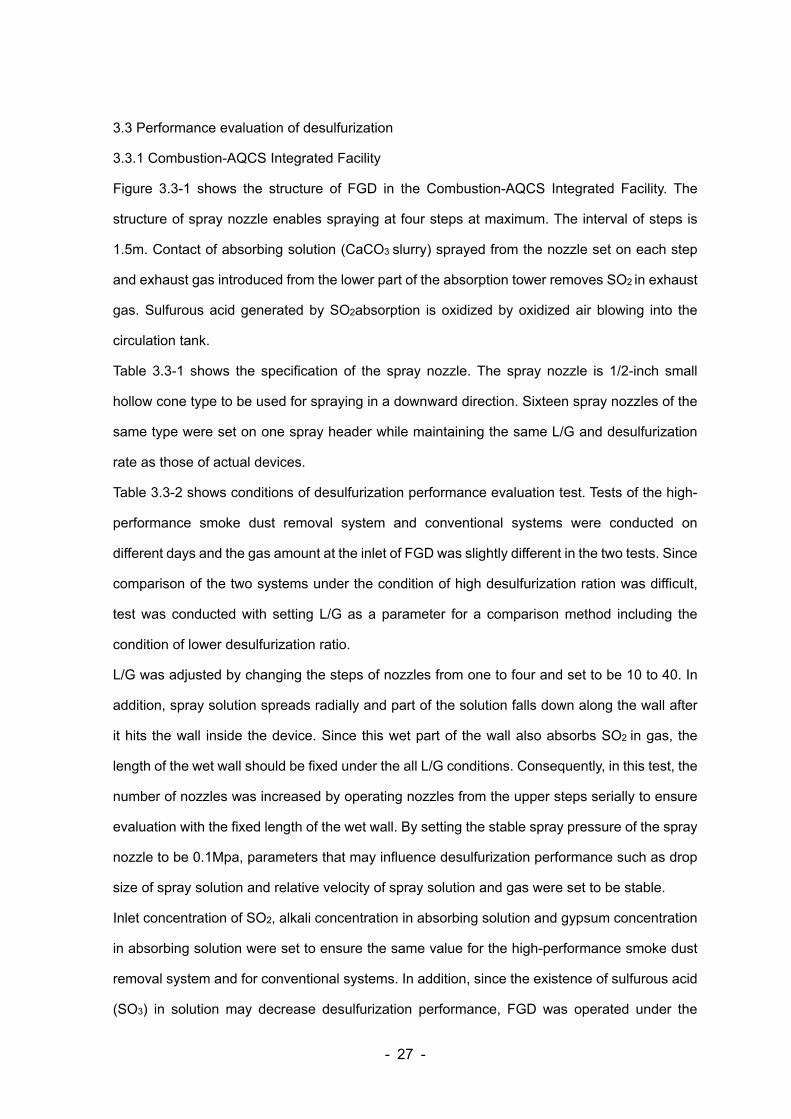
Figure 3.3-1 shows the structure of FGD in the Combustion-AQCS Integrated Facility. The
structure of spray nozzle enables spraying at four steps at maximum. The interval of steps is
1.5m. Contact of absorbing solution (CaCO3 slurry) sprayed from the nozzle set on each step
and exhaust gas introduced from the lower part of the absorption tower removes SO2 in exhaust
gas. Sulfurous acid generated by SO2absorption is oxidized by oxidized air blowing into the
circulation tank.
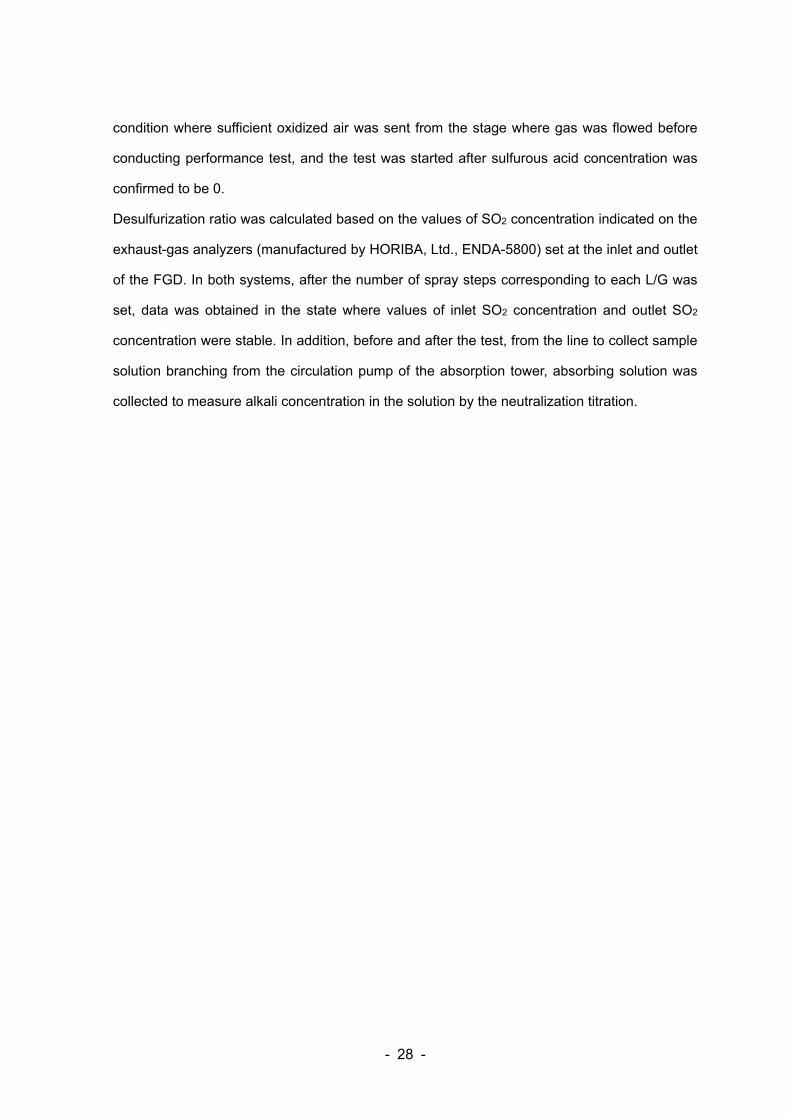
Table 3.3-1 shows the specification of the spray nozzle. The spray nozzle is 1/2-inch small
hollow cone type to be used for spraying in a downward direction. Sixteen spray nozzles of the
same type were set on one spray header while maintaining the same L/G and desulfurization
rate as those of actual devices.
Table 3.3-2 shows conditions of desulfurization performance evaluation test. Tests of the high-
performance smoke dust removal system and conventional systems were conducted on
different days and the gas amount at the inlet of FGD was slightly different in the two tests. Since
comparison of the two systems under the condition of high desulfurization ration was difficult,
test was conducted with setting L/G as a parameter for a comparison method including the
condition of lower desulfurization ratio.
L/G was adjusted by changing the steps of nozzles from one to four and set to be 10 to 40. In
addition, spray solution spreads radially and part of the solution falls down along the wall after
it hits the wall inside the device. Since this wet part of the wall also absorbs SO2 in gas, the
length of the wet wall should be fixed under the all L/G conditions. Consequently, in this test, the
number of nozzles was increased by operating nozzles from the upper steps serially to ensure
evaluation with the fixed length of the wet wall. By setting the stable spray pressure of the spray
nozzle to be 0.1Mpa, parameters that may influence desulfurization performance such as drop
size of spray solution and relative velocity of spray solution and gas were set to be stable.
Inlet concentration of SO2, alkali concentration in absorbing solution and gypsum concentration
in absorbing solution were set to ensure the same value for the high-performance smoke dust
removal system and for conventional systems. In addition, since the existence of sulfurous acid
(SO3) in solution may decrease desulfurization performance, FGD was operated under the
- 28 -
condition where sufficient oxidized air was sent from the stage where gas was flowed before
conducting performance test, and the test was started after sulfurous acid concentration was
confirmed to be 0.
Desulfurization ratio was calculated based on the values of SO2 concentration indicated on the
exhaust-gas analyzers (manufactured by HORIBA, Ltd., ENDA-5800) set at the inlet and outlet
of the FGD. In both systems, after the number of spray steps corresponding to each L/G was
set, data was obtained in the state where values of inlet SO2 concentration and outlet SO2
concentration were stable. In addition, before and after the test, from the line to collect sample
solution branching from the circulation pump of the absorption tower, absorbing solution was
collected to measure alkali concentration in the solution by the neutralization titration.
- 29 -
Figure 3.3-1 Structure of FGD
Height of absorbingsolution
Inner diameter of water seal
tube
Inlet gas
Nozzle set position
Outlet gas
Nozzle set position
Nozzle set position
Nozzle set position
Spray part
Circulation tank part
- 30 -
Table 3.3-1 Spray nozzle specification
Table 3.3-2 test conditions of comparative evaluation test of desulfurization performance
Item Unit Specification
Manufacturer - IKEUCHI
Model - AAP16
Size inch 1/2
Spraying method - hollow cone
Spray angle deg 80 (downward)
Number of nozzles on each step
piece/step 16
Item Unit Conventional systems High-performance smoke dust removal system
Gas amount m3N/h(dry) 1,200 1,300
Number of spray steps
step 1, 2, 3, 4
Set L/G (calculated value)
L/m3N 10 to 40
Spray pressure MPa 0.1
Spraying amount per step
m3/hr 11.0
Inlet SO2 concentration
ppm 500
Alkali concentration in absorbing solution
mM 30
Gypsum concentration in absorbing solution
wt% 15
Sulfurous acid concentration in solution
mM 0
- 31 -
3.3.2 Basic test device
(1) Al elution basic test
Under the condition of high smoke dust concentration, possible reaction that has influence on
desulfurization performance is elution of Al in smoke dust. When spray solution whose pH
decreased due to absorption of SO2 in gas contacts with exhaust gas smoke dust in gas, Al in
smoke dust may be eluted depending on pH conditions and contact time of spray solution and
characteristics of smoke dust. On this occasion, F derived from exhaust gas absorbed in spray
solution together with smoke dust and eluted Al react, and AlFx compound is generated. The
generated compound covers the surface of limestone particle, which possibly inhibits dissolution
of limestone.1),2),3)。As a result, pH of spray solution does not rise but stays low due to SO2
absorption. However, FGD is operated to keep pH stable, and hence limestone slurry is
excessively fed. When this phenomenon occurs, alkaline agent such as NaOH should be added
in the absorption tower to cause rise of pH and detach AlFx compound, which requires
installation of device to add NaOH. Since elution of Al in coal ash increases Al concentration in
absorbing solution under the condition of high smoke dust concentration, whether or not the
aforementioned phenomenon inhibiting dissolution of limestone occurs due to coal and smoke
dust concentration to be used should be clarified. Whether or not inhibition of limestone
dissolution occurs should be determined after the operation until Al and F concentration in the
system strikes balance at a fixed level. However, operating the Combustion-AQCS Integrated
Test device for several tens of hours is insufficient for Al and F in the system to balance.
Accordingly, in parallel with desulfurization performance comparison by using the Combustion-
AQCS Integrated Test device, basic test was conducted in a laboratory in order to confirm
phenomenon inhibiting dissolution of limestone.
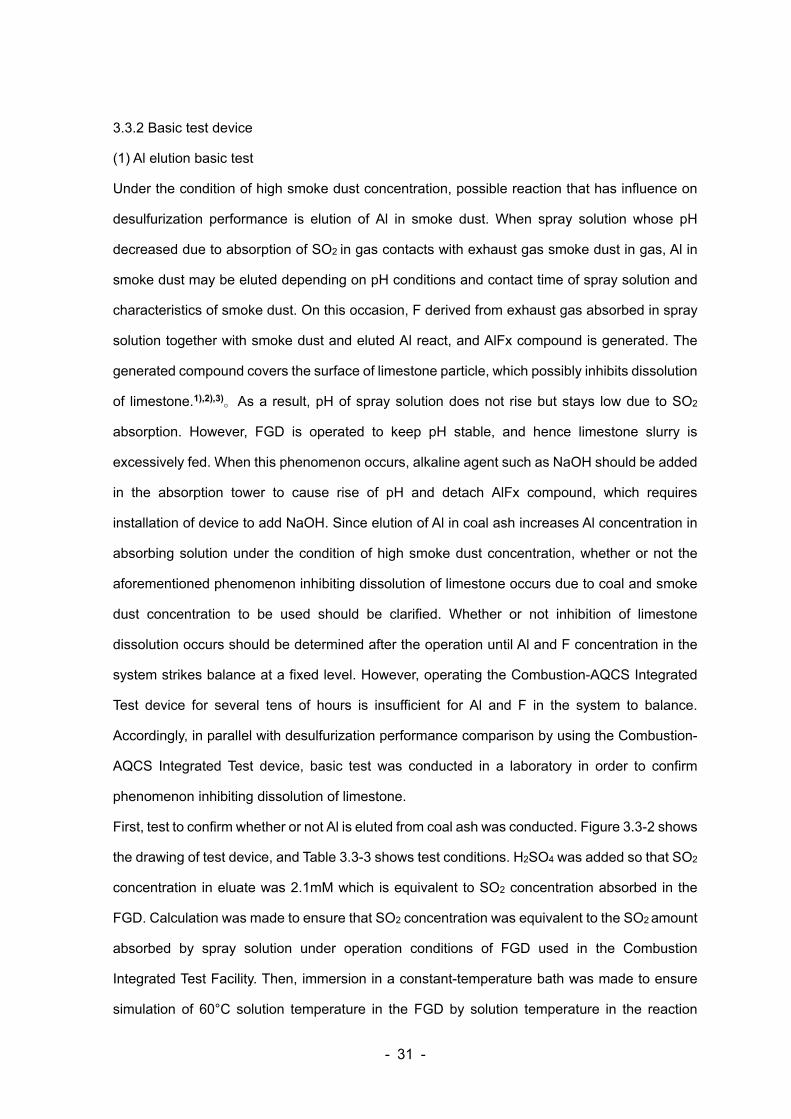
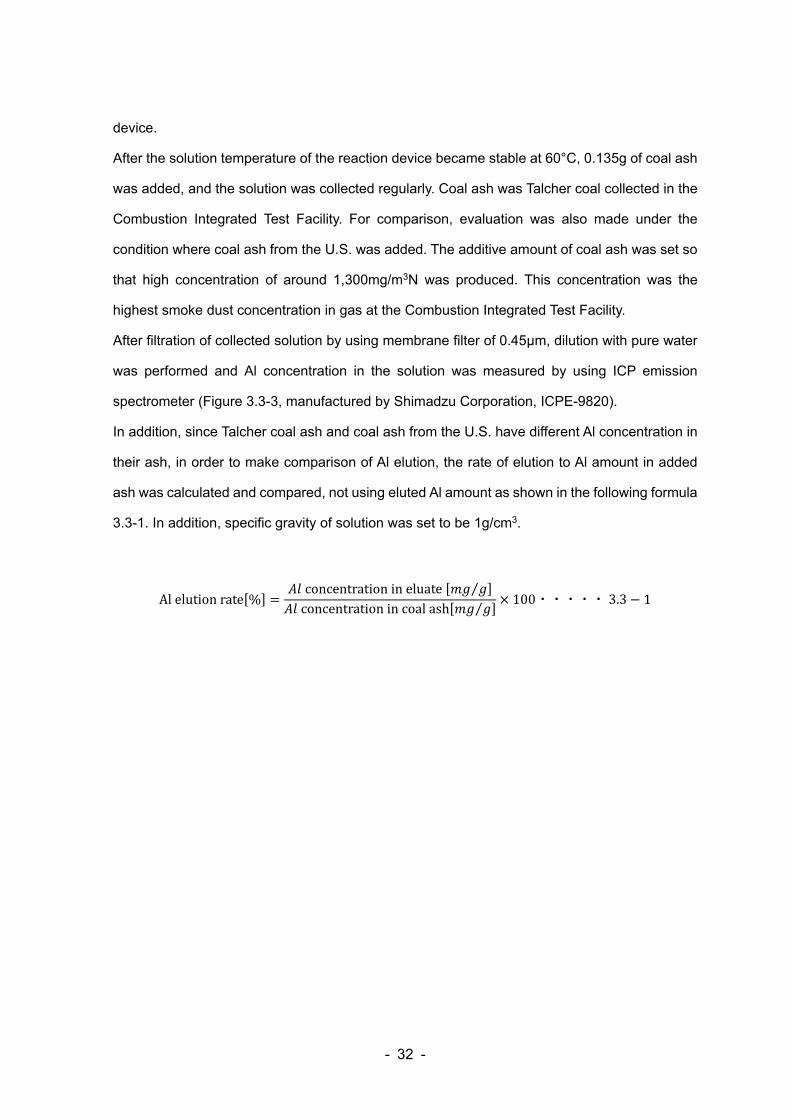
First, test to confirm whether or not Al is eluted from coal ash was conducted. Figure 3.3-2 shows
the drawing of test device, and Table 3.3-3 shows test conditions. H2SO4 was added so that SO2
concentration in eluate was 2.1mM which is equivalent to SO2 concentration absorbed in the
FGD. Calculation was made to ensure that SO2 concentration was equivalent to the SO2 amount
absorbed by spray solution under operation conditions of FGD used in the Combustion
Integrated Test Facility. Then, immersion in a constant-temperature bath was made to ensure
simulation of 60°C solution temperature in the FGD by solution temperature in the reaction
- 32 -
device.
After the solution temperature of the reaction device became stable at 60°C, 0.135g of coal ash
was added, and the solution was collected regularly. Coal ash was Talcher coal collected in the
Combustion Integrated Test Facility. For comparison, evaluation was also made under the
condition where coal ash from the U.S. was added. The additive amount of coal ash was set so
that high concentration of around 1,300mg/m3N was produced. This concentration was the
highest smoke dust concentration in gas at the Combustion Integrated Test Facility.
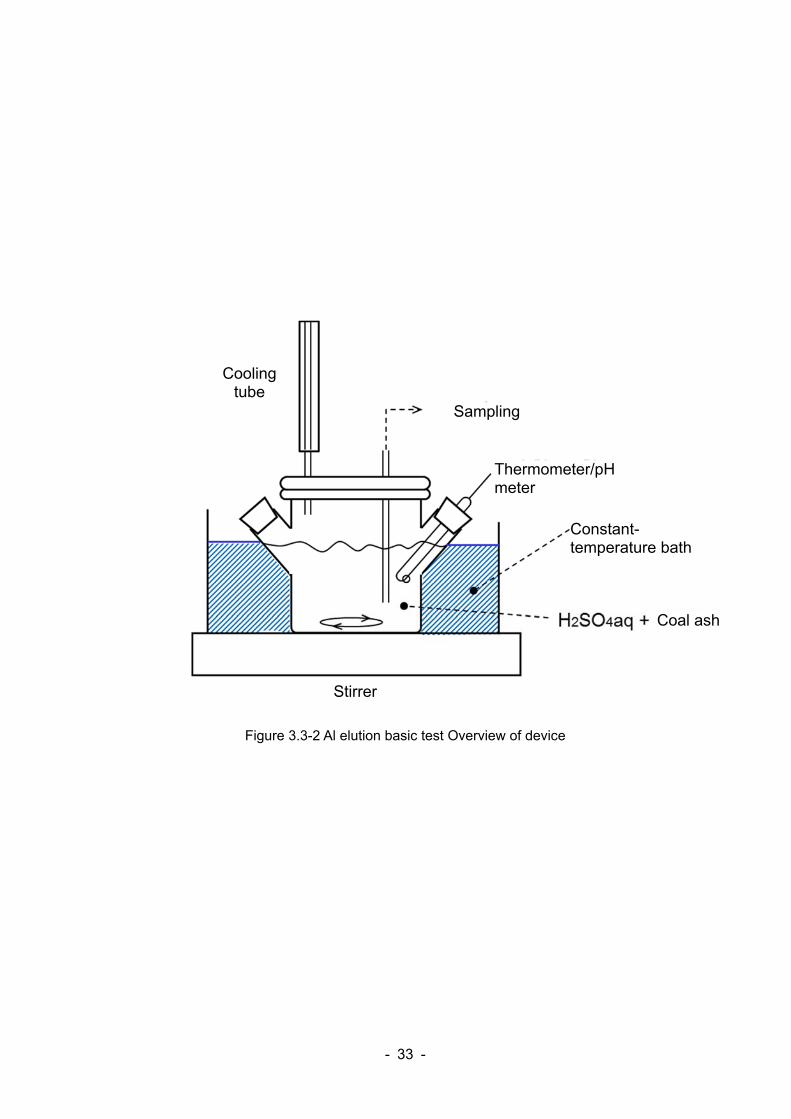
After filtration of collected solution by using membrane filter of 0.45μm, dilution with pure water
was performed and Al concentration in the solution was measured by using ICP emission
spectrometer (Figure 3.3-3, manufactured by Shimadzu Corporation, ICPE-9820).
In addition, since Talcher coal ash and coal ash from the U.S. have different Al concentration in
their ash, in order to make comparison of Al elution, the rate of elution to Al amount in added
ash was calculated and compared, not using eluted Al amount as shown in the following formula
3.3-1. In addition, specific gravity of solution was set to be 1g/cm3.
Alelutionrate %concentrationineluate ⁄concentrationincoalash ⁄
100・・・・・3.3 1
- 33 -
Figure 3.3-2 Al elution basic test Overview of device
Sampling
Cooling tube
Thermometer/pH meter
Coal ash
Stirrer
Constant-temperature bath
- 34 -
Table 3.3-3 Test conditions of Al elution basic test
Figure 3.3-3 Appearance of ICP emission spectrometer
Item Unit Value
Solution amount mL 500
SO2 concentration in solution mM 2.1
Elution temperature °C 60
Coal ash amount g 0.135
Elution time min 3 to 120
- 35 -
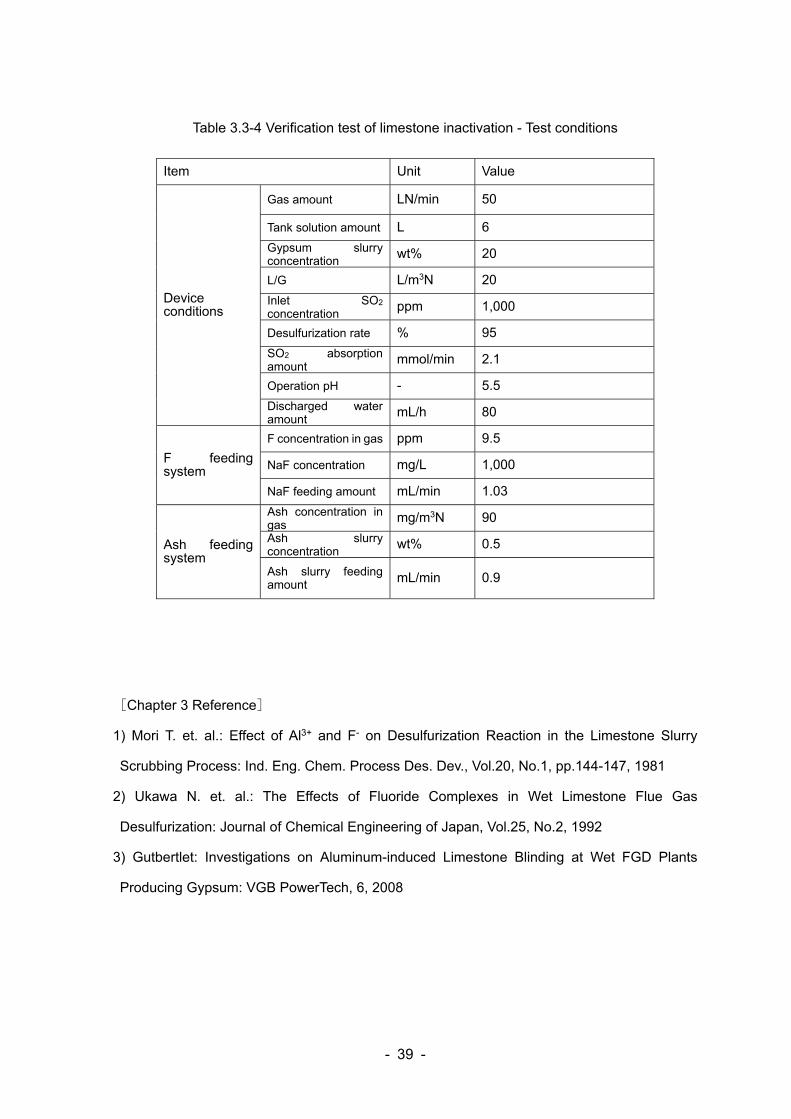
(2) Limestone inactivation verification test
After Al elution characteristics of ash described above was obtained, a small desulfurization test
device was used to see whether or not inhibition of limestone dissolution occurs in the simulation
of actual SO2 absorption reaction condition.
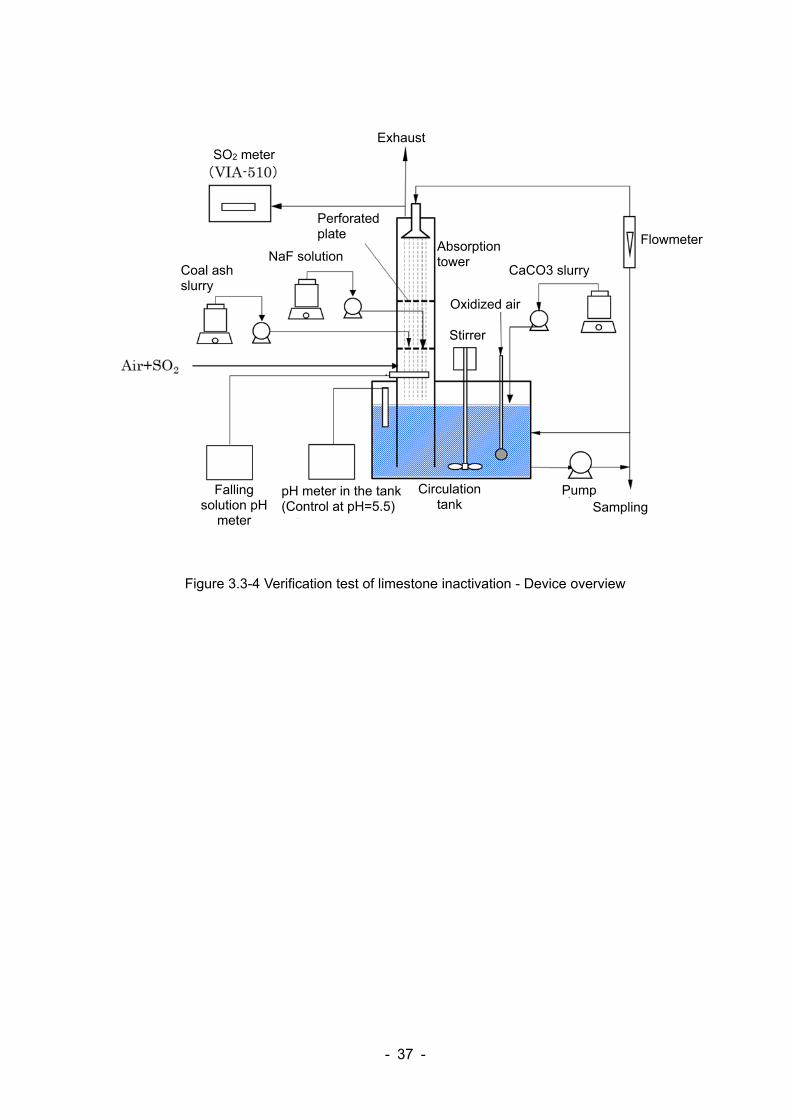
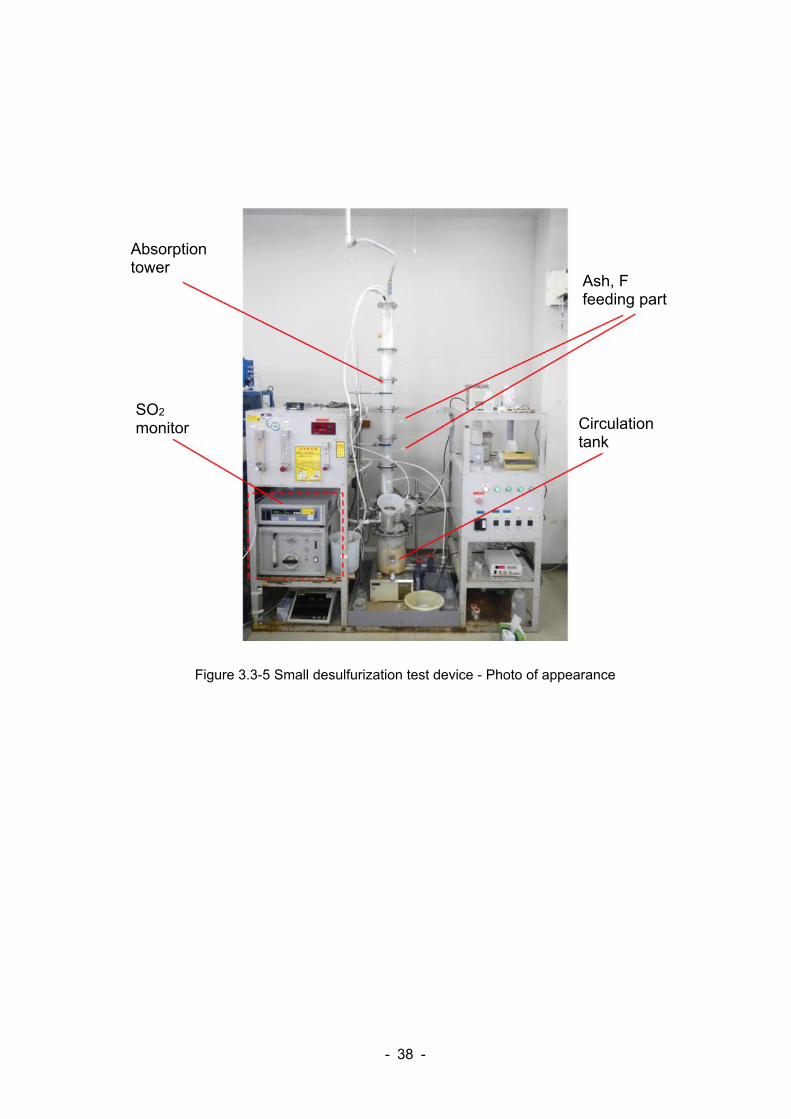
Figure 3.3-4 shows overview of a small desulfurization test device and Figure 3.3-5 shows the
photo of the actual device. In addition, Table 3.3-4 shows device operation conditions. Since
SO2 load to absorbing solution determines the amount of Al eluted from ash, in this test, L/G,
inlet SO2 concentration and desulfurization rate were set to ensure the same SO2 load as that
of the Combustion Integrated Test Facility. In addition, since spray part of the device was the
shower type which lowers desulfurization performance compared with the spray type, perforated
plates were installed in the tower to adjust desulfurization rate. In this test, two perforated plates
were installed to obtain desulfurization performance equivalent to the set value. SO2 were mixed
into air to adjust concentration of inlet SO2 gas, and inlet and outlet SO2 concentration was
monitored with a SO2 continuous analyzer (HORIBA, Ltd., VIA-510).
For the F feeding system, 1000mg/L of NaF solution was used. Feeding amount was adjusted
to ensure the concentration of 9.5mg/m3N which is equivalent to F concentration in gas at the
inlet of the FGD in the Combustion Integrated Test Facility, and the solution was added on the
perforated plates.
For the feeding system of ash, 0.5% slurry diluted with pure water was used. Under the condition
of high smoke dust concentration in which inactivation tends to occur, feeding amount was
adjusted to ensure 90mg/m3N of smoke dust concentration in gas, and the slurry was added on
the perforated plates.
In operation of actual FGD, to make gypsum concentration in the system stable, gypsum is
extracted on a regular basis. In addition, apart from this, water is discharged regularly to keep
Cl concentration in the system stable. At the time of gypsum extraction and water discharge, the
amount of Al and F taken out of the system balances with Al and F concentration flowing into
the system of FGD, and the final Al and F concentration in the system is determined. In this test,
Calculation was made to ensure that setting of Cl concentration in gas to be 2.7ppm (calculated
value based on coal exhaust gas) balances with 10,000ppm of Cl concentration in the system,
and the condition in which gypsum concentration was 20wt%, discharged water amount was
- 36 -
80mL/h was set.
Since most of F in solution is supposed to exist in the form of CaF2, and the solubility of CaF2 is
approx. 20mg/L, low under the condition of this test where pH is 5.5 and solution temperature is
20°C, all of flowing F except the amount of dissolved CaF2 is assumed to be solid. At this time,
the final balancing F concentration in the system is calculated to be approx. 15mM based on the
relation of extraction amount of gypsum, discharge amount and inflow amount.
With regard to Al concentration in the system, since the solubility of Al3+ when pH was 5.5 was
low as with the case of F, all of it except approx. 10mg/L of the solubility of Al(OH)3 was assumed
to be solid. At this time, based on the relation of discharge amount and inflow amount, the final
balancing Al concentration in the system is calculated to be approx. 16 mM when Talcher coal
is fed and to be approx. 6mM when coal from the U.S. is fed.
First, SO2 gas and CaCO3 were fed in the device, and continuous feeding of coal ash and NaF
was started when outlet SO2 concentration became stable. In parallel, CaCO3 concentration in
the system was measured on a regular basis.
In this test device, pH is controlled to be stable at 5.5. Accordingly, if CaCO3 concentration in
the system continues to increase, it is judged that the feeding amount of CaCO3 slurry necessary
to maintain pH in the system is increasing; that is, AlFx is generated and pH buffer action is
occurring in the system. Similarly, pH of spray solution falling from the shower part to the tank
part is not expected to decrease due to buffer action.
In contrast, in the stage where Al and F are fed until Al and F concentration reaches the final
balance concentration, if CaCO3 concentration in the system shows no significant rise and is
stable, it is judged that balance is kept in low concentration where AlFx is not generated or
inhibition of dissolution does not occur.
In addition, coal ash from the U.S. whose rate of Al elution from ash was high in Al elution test
was fed under the same condition for this test device, and the result was evaluated by
comparison with the Talcher coal result.
- 37 -
Figure 3.3-4 Verification test of limestone inactivation - Device overview
Absorption tower
SO2 meter
Sampling
Perforated plate Flowmeter
NaF solution CaCO3 slurry Coal ash
slurry
Circulation tank
pH meter in the tank(Control at pH=5.5)
Stirrer
Falling solution pH
meter
Oxidized air
Exhaust
Pump
- 38 -
Figure 3.3-5 Small desulfurization test device - Photo of appearance
Circulation tank
Ash, F feeding part
SO2 monitor
Absorption tower
- 39 -
Table 3.3-4 Verification test of limestone inactivation - Test conditions
[Chapter 3 Reference]
1) Mori T. et. al.: Effect of Al3+ and F- on Desulfurization Reaction in the Limestone Slurry
Scrubbing Process: Ind. Eng. Chem. Process Des. Dev., Vol.20, No.1, pp.144-147, 1981
2) Ukawa N. et. al.: The Effects of Fluoride Complexes in Wet Limestone Flue Gas
Desulfurization: Journal of Chemical Engineering of Japan, Vol.25, No.2, 1992
3) Gutbertlet: Investigations on Aluminum-induced Limestone Blinding at Wet FGD Plants
Producing Gypsum: VGB PowerTech, 6, 2008
Item Unit Value
Device conditions
Gas amount LN/min 50
Tank solution amount L 6
Gypsum slurryconcentration
wt% 20
L/G L/m3N 20
Inlet SO2
concentrationppm 1,000
Desulfurization rate % 95
SO2 absorption amount
mmol/min 2.1
Operation pH - 5.5
Discharged water amount
mL/h 80
F feeding system
F concentration in gas ppm 9.5
NaF concentration mg/L 1,000
NaF feeding amount mL/min 1.03
Ash feeding system
Ash concentration in gas
mg/m3N 90
Ash slurryconcentration
wt% 0.5
Ash slurry feeding amount mL/min 0.9
- 40 -
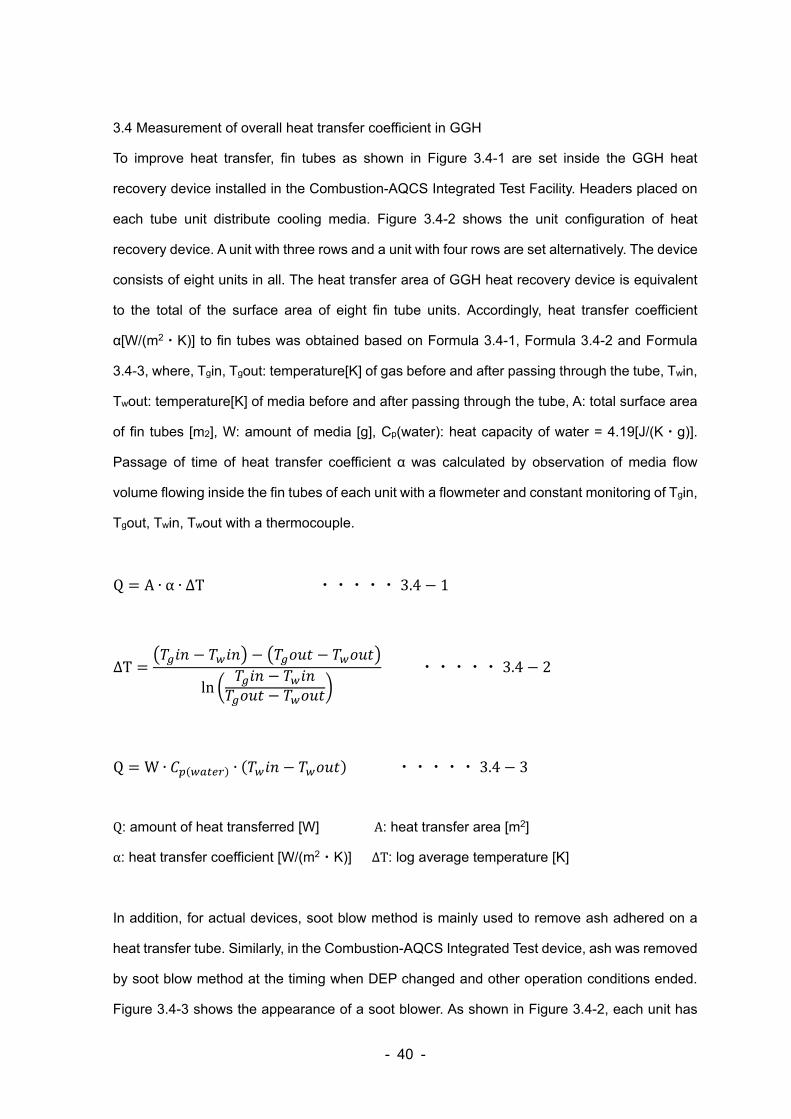
3.4 Measurement of overall heat transfer coefficient in GGH
To improve heat transfer, fin tubes as shown in Figure 3.4-1 are set inside the GGH heat
recovery device installed in the Combustion-AQCS Integrated Test Facility. Headers placed on
each tube unit distribute cooling media. Figure 3.4-2 shows the unit configuration of heat
recovery device. A unit with three rows and a unit with four rows are set alternatively. The device
consists of eight units in all. The heat transfer area of GGH heat recovery device is equivalent
to the total of the surface area of eight fin tube units. Accordingly, heat transfer coefficient
α[W/(m2・K)] to fin tubes was obtained based on Formula 3.4-1, Formula 3.4-2 and Formula
3.4-3, where, Tgin, Tgout: temperature[K] of gas before and after passing through the tube, Twin,
Twout: temperature[K] of media before and after passing through the tube, A: total surface area
of fin tubes [m2], W: amount of media [g], Cp(water): heat capacity of water = 4.19[J/(K・g)].
Passage of time of heat transfer coefficient α was calculated by observation of media flow
volume flowing inside the fin tubes of each unit with a flowmeter and constant monitoring of Tgin,
Tgout, Twin, Twout with a thermocouple.
Q A ∙ α ∙ ∆T・・・・・3.4 1
∆Tln
・・・・・3.4 2
Q W ∙ ∙ ・・・・・3.4 3
Q: amount of heat transferred [W] A: heat transfer area [m2]
α: heat transfer coefficient [W/(m2・K)] ∆T: log average temperature [K]
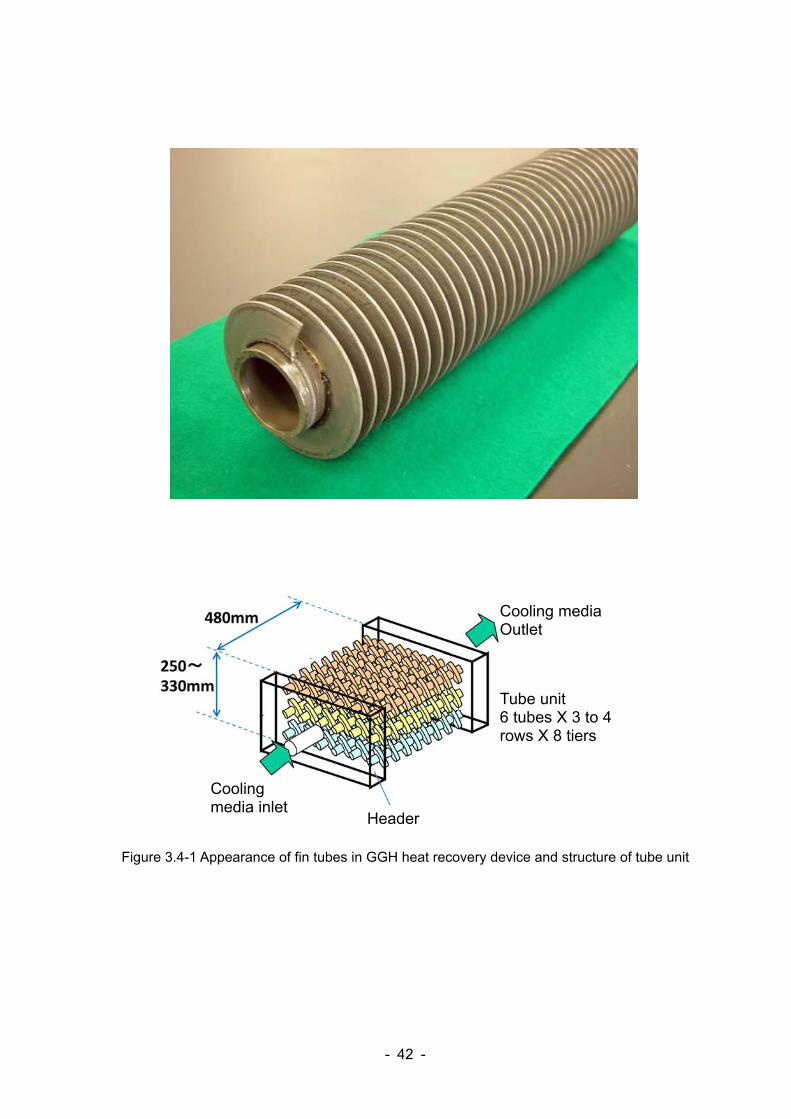
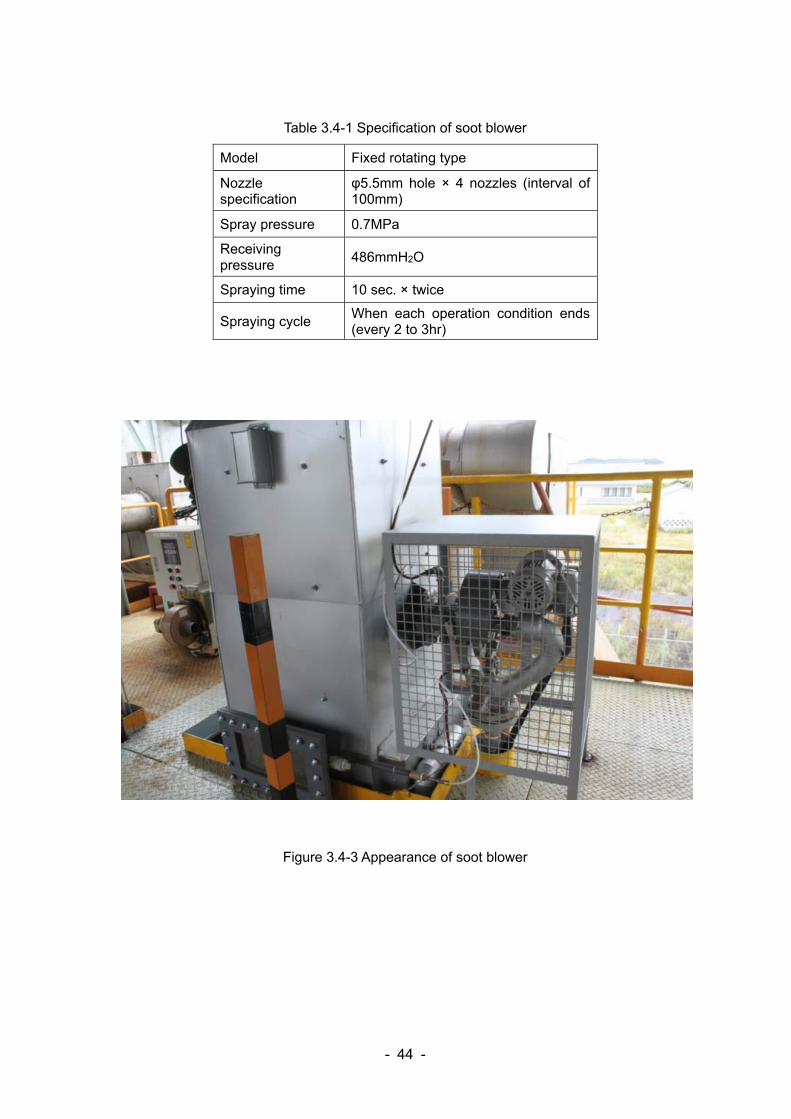
In addition, for actual devices, soot blow method is mainly used to remove ash adhered on a
heat transfer tube. Similarly, in the Combustion-AQCS Integrated Test device, ash was removed
by soot blow method at the timing when DEP changed and other operation conditions ended.
Figure 3.4-3 shows the appearance of a soot blower. As shown in Figure 3.4-2, each unit has

- 41 -
three steps. The specification of the device is as shown in Table 3.4-1. The soot blower was
fixed rotating type, and compressed air was used as spray medium. As shown in Figure 3.4-2,
the upper or lower side of a soot blower has an inspection window, through which photos were
taken to check situations of ash accumulation on fin tubes before and after soot blow in
conventional systems and the high-performance smoke dust removal system.
- 42 -
Figure 3.4-1 Appearance of fin tubes in GGH heat recovery device and structure of tube unit
Tube unit 6 tubes X 3 to 4 rows X 8 tiers
Header
Cooling media Outlet
Cooling media inlet
- 43 -
Figure 3.4-2 Unit structure of heat recovery device and installation position of soot blower
Soot blower
Gas
Unit 7 and 8 tiers
Unit 4~6 tiers
Unit 1~3 tiers
Inspection window
Gas
- 44 -
Table 3.4-1 Specification of soot blower
Figure 3.4-3 Appearance of soot blower
Model Fixed rotating type
Nozzle specification
φ5.5mm hole × 4 nozzles (interval of 100mm)
Spray pressure 0.7MPa
Receiving pressure
486mmH2O
Spraying time 10 sec. × twice
Spraying cycle When each operation condition ends (every 2 to 3hr)
- 45 -
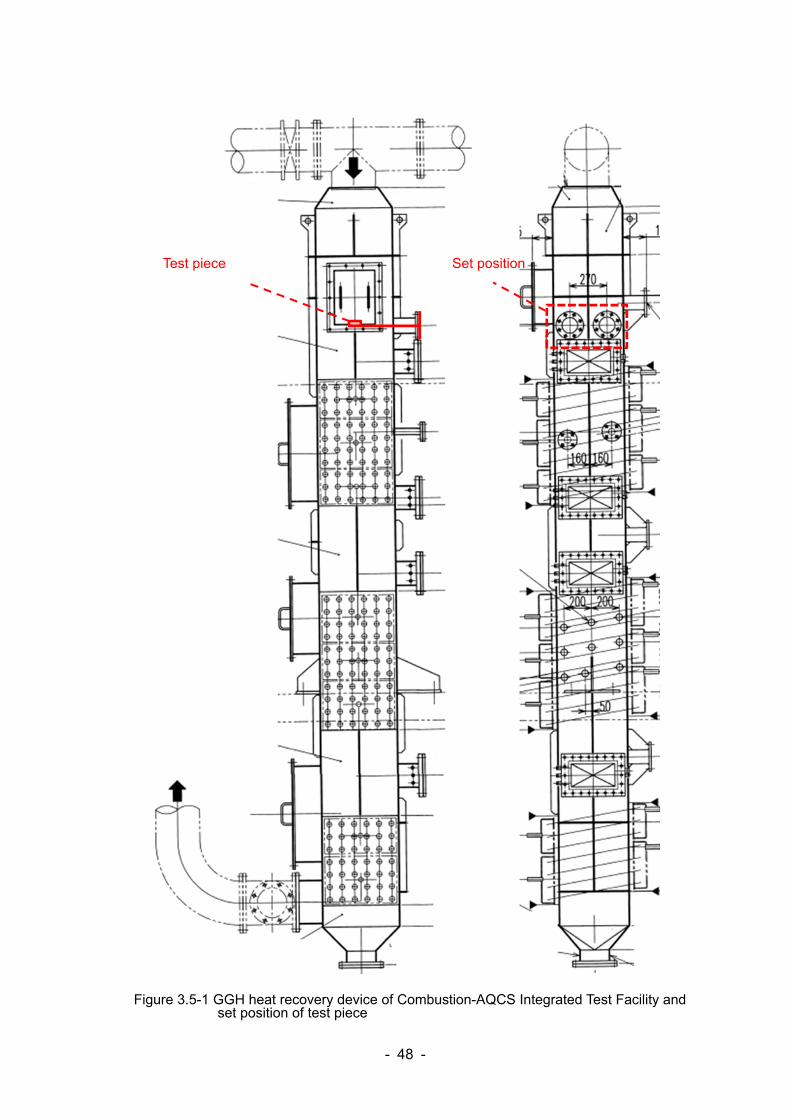
3.5 Abrasion property evaluation of GGH fin
In the high-performance smoke dust removal system, since GGH heat recovery device is
installed before DEP, fin tubes are exposed to smoke dust with high concentration. Furthermore,
since Talcher coal which is the subject of the evaluation in this test has high ash content,
abrasion characteristics were evaluated in addition to heat transfer characteristics evaluation of
GGH heat recovery device under the condition of high smoke dust concentration.
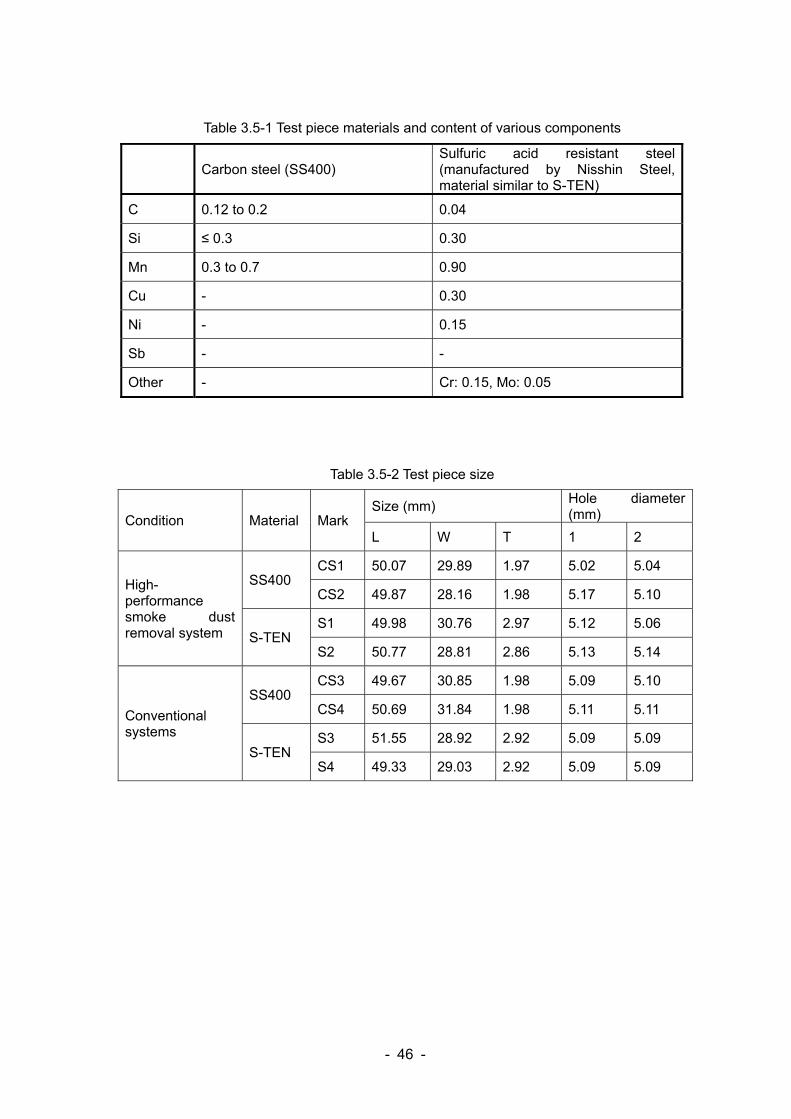
Abrasion characteristics were evaluated by the use of two kinds of materials, carbon steel
(SS400) and sulfuric acid resistant steel (manufactured by Nisshin Steel, material similar to S-
TEN) shown in Table 3.5-1, which are equivalent to those used for casing and fin tubes of actual
GGH heat recovery devices. These two kinds of materials were processed in the size shown in
Table 3.5-2 to be used as test pieces and set on the inlet side of GGH heat recovery device as
shown in Figure 3.5-1 to be exposed to coal combustion exhaust gas. Position of test pieces
was set to be between soot blower and fin tubes, and the removal of coal ash accumulated on
test pieces by regular soot blow was made possible in the same manner as the case with fin
tubes.
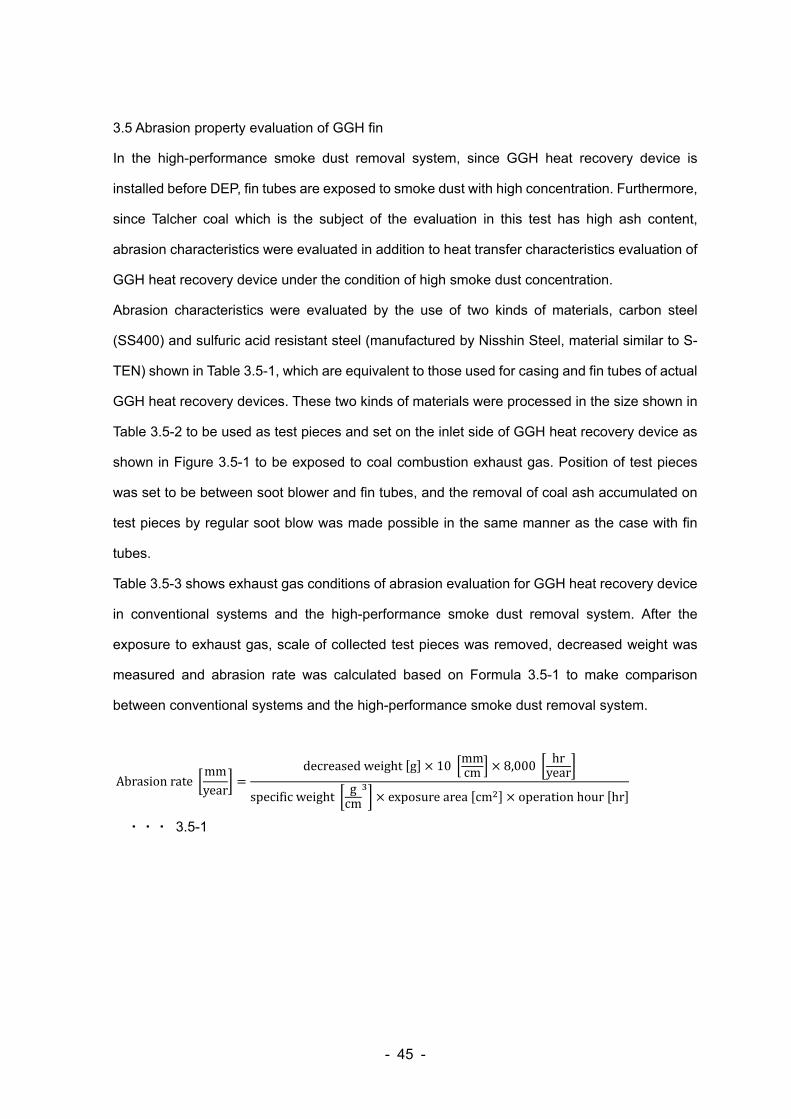
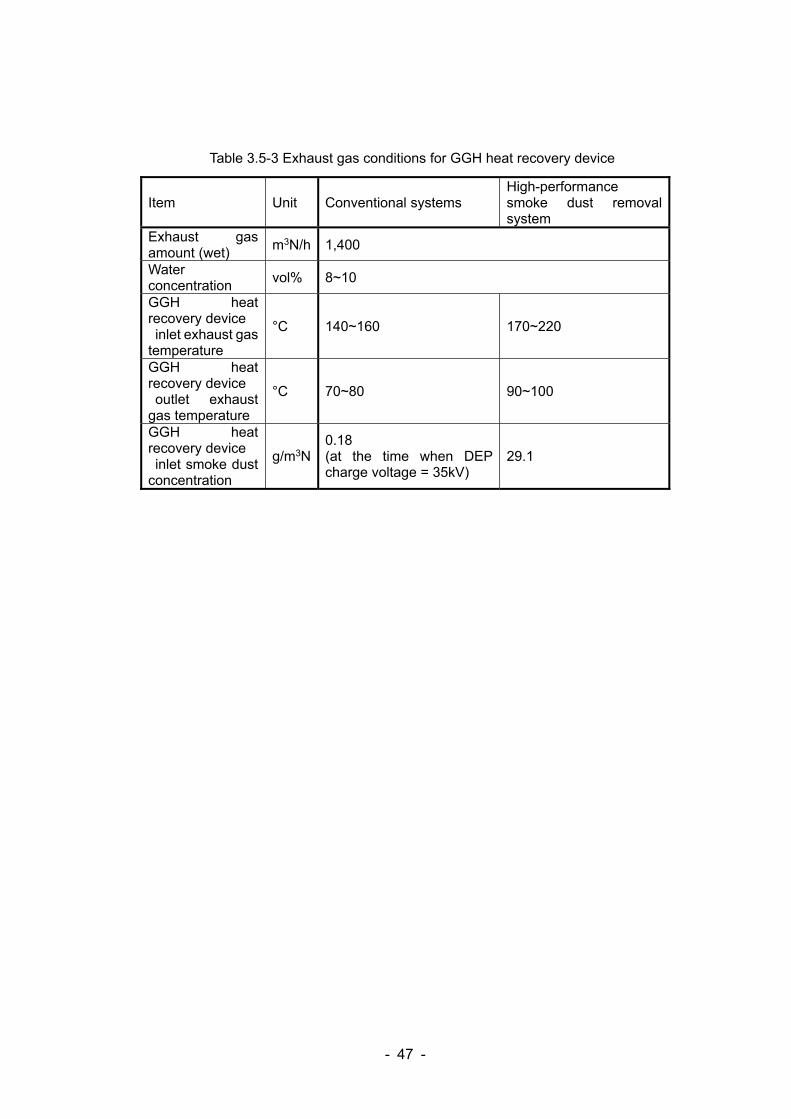
Table 3.5-3 shows exhaust gas conditions of abrasion evaluation for GGH heat recovery device
in conventional systems and the high-performance smoke dust removal system. After the
exposure to exhaust gas, scale of collected test pieces was removed, decreased weight was
measured and abrasion rate was calculated based on Formula 3.5-1 to make comparison
between conventional systems and the high-performance smoke dust removal system.
Abrasionratemmyear
decreasedweight g 10mmcm 8,000
hryear
specificweightgcm exposurearea cm operationhour hr
・・・ 3.5-1
- 46 -
Table 3.5-1 Test piece materials and content of various components
Table 3.5-2 Test piece size
Condition Material Mark Size (mm)
Hole diameter (mm)
L W T 1 2
High-performance smoke dust removal system
SS400 CS1 50.07 29.89 1.97 5.02 5.04
CS2 49.87 28.16 1.98 5.17 5.10
S-TEN S1 49.98 30.76 2.97 5.12 5.06
S2 50.77 28.81 2.86 5.13 5.14
Conventional systems
SS400 CS3 49.67 30.85 1.98 5.09 5.10
CS4 50.69 31.84 1.98 5.11 5.11
S-TEN S3 51.55 28.92 2.92 5.09 5.09
S4 49.33 29.03 2.92 5.09 5.09
Carbon steel (SS400) Sulfuric acid resistant steel (manufactured by Nisshin Steel, material similar to S-TEN)
C 0.12 to 0.2 0.04
Si ≤ 0.3 0.30
Mn 0.3 to 0.7 0.90
Cu - 0.30
Ni - 0.15
Sb - -
Other - Cr: 0.15, Mo: 0.05
- 47 -
Table 3.5-3 Exhaust gas conditions for GGH heat recovery device
Item Unit Conventional systems High-performance smoke dust removal system
Exhaust gas amount (wet)
m3N/h 1,400
Water concentration
vol% 8~10
GGH heat recovery device inlet exhaust gas temperature
°C 140~160 170~220
GGH heat recovery device outlet exhaust gas temperature
°C 70~80 90~100
GGH heat recovery device inlet smoke dust concentration
g/m3N 0.18 (at the time when DEP charge voltage = 35kV)
29.1
- 48 -
Figure 3.5-1 GGH heat recovery device of Combustion-AQCS Integrated Test Facility and set position of test piece
Test piece Set position
- 49 -
4. RESULTS AND DISCUSSION
4.1 Characteristics of coal and combustion exhaust gas
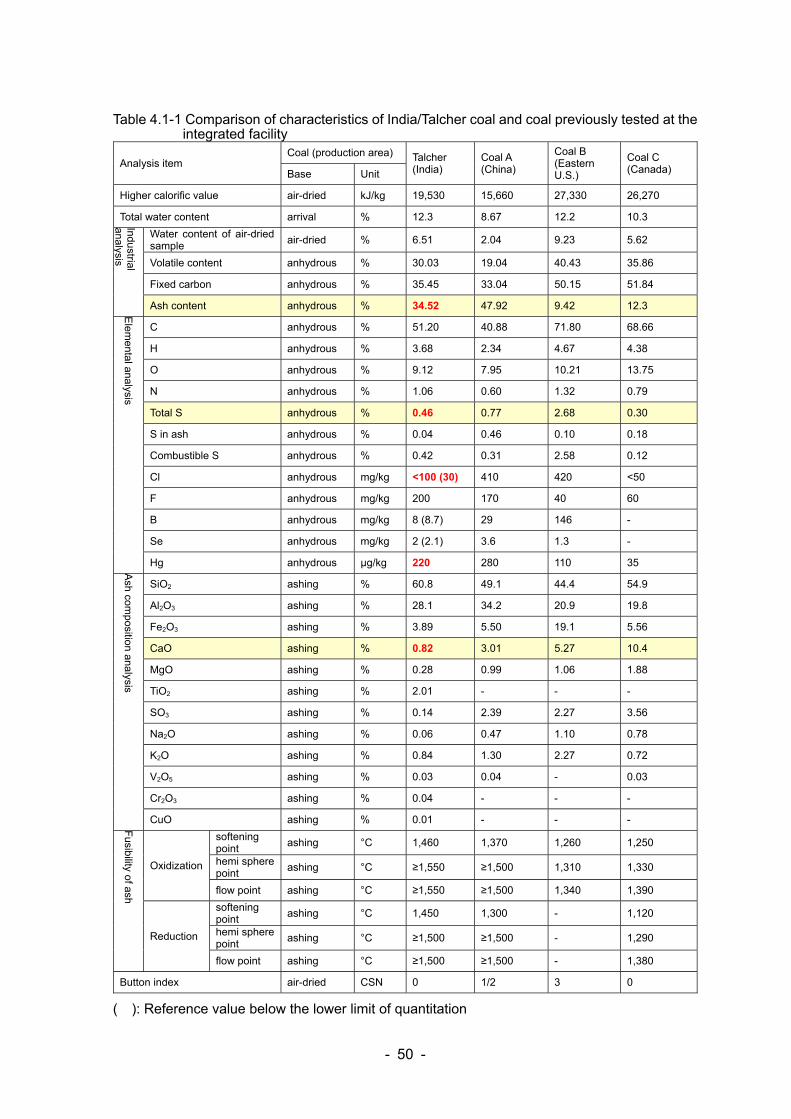
4.1.1 Evaluation of coal under test
Table 4.1-1 shows comparison of characteristics (published data) of Talcher coal used in this
test and other representative coal (A, B, C) previously used in the Combustion-AQCS Integrated
Facility.
The most distinct characteristics of Talcher coal is its high ash content of 34.5%. Although the
percentage is lower than that of coal A (from China) which is 47.9%, Talcher coal has approx.
three fold higher ash content than that (around 10%) of general coal from North America,
Australia, etc. Since high ash content leads to low calorific value, increase of burning amount is
required to obtain prescribed heat input amount. With regard to composition of ash, SiO2, the
main acid component is 60.8% which is high, whereas CaO, the main alkali component is 0.82%
which is very low. This imbalance between acid and alkali may partly contribute to high melting
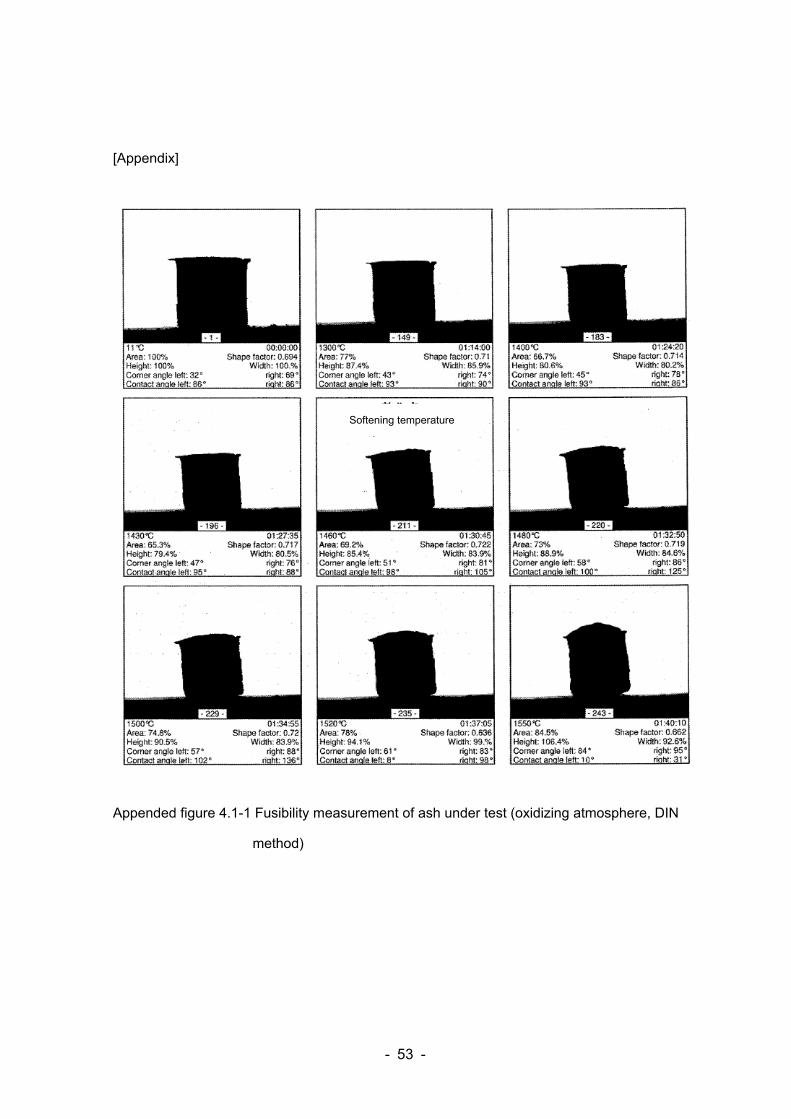
point of ash which is 1,550°C or more (See Appended figure 4.1-1, 4.1-2).
Total S was 0.47% which is low, and S in ash was 0.04%, most of which was combustible S.
Other characteristics are that content of mercury (Hg), and fluorine (F) is high (200mg/kg), and
content of boron (B) was very low (8mg/kg) compared with other kinds of coal.
- 50 -
Table 4.1-1 Comparison of characteristics of India/Talcher coal and coal previously tested at the integrated facility
Analysis item Coal (production area) Talcher
(India) Coal A (China)
Coal B (Eastern U.S.)
Coal C (Canada) Base Unit
Higher calorific value air-dried kJ/kg 19,530 15,660 27,330 26,270
Total water content arrival % 12.3 8.67 12.2 10.3
Industrial analysis
Water content of air-dried sample
air-dried % 6.51 2.04 9.23 5.62
Volatile content anhydrous % 30.03 19.04 40.43 35.86
Fixed carbon anhydrous % 35.45 33.04 50.15 51.84
Ash content anhydrous % 34.52 47.92 9.42 12.3
Elem
ental analysis
C anhydrous % 51.20 40.88 71.80 68.66
H anhydrous % 3.68 2.34 4.67 4.38
O anhydrous % 9.12 7.95 10.21 13.75
N anhydrous % 1.06 0.60 1.32 0.79
Total S anhydrous % 0.46 0.77 2.68 0.30
S in ash anhydrous % 0.04 0.46 0.10 0.18
Combustible S anhydrous % 0.42 0.31 2.58 0.12
Cl anhydrous mg/kg <100 (30) 410 420 <50
F anhydrous mg/kg 200 170 40 60
B anhydrous mg/kg 8 (8.7) 29 146 -
Se anhydrous mg/kg 2 (2.1) 3.6 1.3 -
Hg anhydrous μg/kg 220 280 110 35
Ash com
position analysis
SiO2 ashing % 60.8 49.1 44.4 54.9
Al2O3 ashing % 28.1 34.2 20.9 19.8
Fe2O3 ashing % 3.89 5.50 19.1 5.56
CaO ashing % 0.82 3.01 5.27 10.4
MgO ashing % 0.28 0.99 1.06 1.88
TiO2 ashing % 2.01 - - -
SO3 ashing % 0.14 2.39 2.27 3.56
Na2O ashing % 0.06 0.47 1.10 0.78
K2O ashing % 0.84 1.30 2.27 0.72
V2O5 ashing % 0.03 0.04 - 0.03
Cr2O3 ashing % 0.04 - - -
CuO ashing % 0.01 - - -
Fusib
ility of a
sh
Oxidization
softening point
ashing °C 1,460 1,370 1,260 1,250
hemi sphere point
ashing °C ≥1,550 ≥1,500 1,310 1,330
flow point ashing °C ≥1,550 ≥1,500 1,340 1,390
Reduction
softening point
ashing °C 1,450 1,300 - 1,120
hemi sphere point
ashing °C ≥1,500 ≥1,500 - 1,290
flow point ashing °C ≥1,500 ≥1,500 - 1,380
Button index air-dried CSN 0 1/2 3 0
( ): Reference value below the lower limit of quantitation
- 51 -
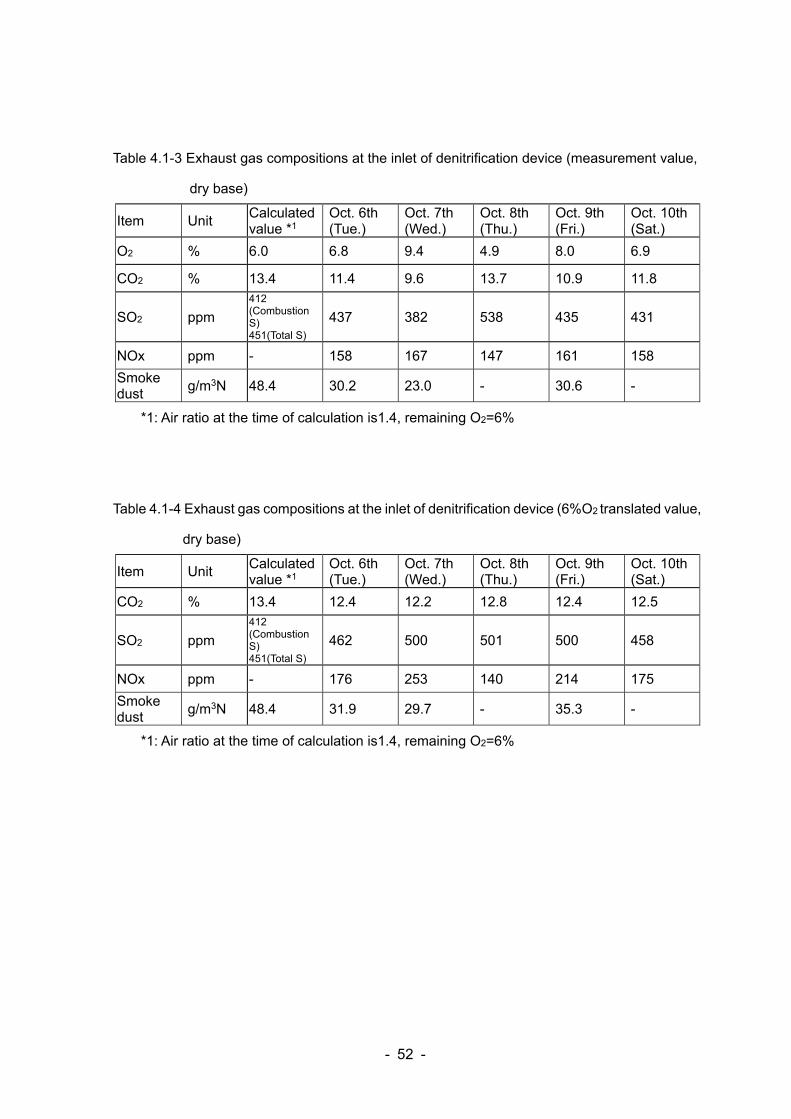
4.1.2 Characteristics of combustion exhaust gas
Table 4.1-3 shows measurement value and Table 4.1-4 shows 6%O2 translated value of exhaust
gas components calculated from coal compositions and exhaust gas compositions measured at
denitrification catalyst inlet at the time of test operation, respectively. Measurement values of
SO2, NOx, CO2, O2 were average of measurement values obtained every minute through
continuous monitoring (from 9 o’clock in the morning to 6 o’clock in the afternoon, excluding
clear abnormal values). In addition, smoke dust concentration was average value of two
measurements by exhaust gas sampling.
Exhaust gas composition during test operation greatly varied within a day and from day to day.
This was seemingly due to great variation of coal characteristics. In 6%O2 translation, SO2 was
from 460 to 500ppm, and NOx was from 140 to 250ppm. Smoke dust was from 30 to 35g/m3N
which is low compared with the calculated value (48g/m3N). This is possibly because the
existence of an approx. five-meter long horizontal duct between the furnace outlet and
denitrification inlet caused decrease of smoke dust as it fell and accumulated in this horizontal
duct.
- 52 -
Table 4.1-3 Exhaust gas compositions at the inlet of denitrification device (measurement value,
dry base)
Item Unit Calculated value *1
Oct. 6th (Tue.)
Oct. 7th (Wed.)
Oct. 8th (Thu.)
Oct. 9th (Fri.)
Oct. 10th (Sat.)
O2 % 6.0 6.8 9.4 4.9 8.0 6.9
CO2 % 13.4 11.4 9.6 13.7 10.9 11.8
SO2 ppm
412 (Combustion S) 451(Total S)
437 382 538 435 431
NOx ppm - 158 167 147 161 158
Smoke dust
g/m3N 48.4 30.2 23.0 - 30.6 -
*1: Air ratio at the time of calculation is1.4, remaining O2=6%
Table 4.1-4 Exhaust gas compositions at the inlet of denitrification device (6%O2 translated value,
dry base)
Item Unit Calculated value *1
Oct. 6th (Tue.)
Oct. 7th (Wed.)
Oct. 8th (Thu.)
Oct. 9th (Fri.)
Oct. 10th (Sat.)
CO2 % 13.4 12.4 12.2 12.8 12.4 12.5
SO2 ppm
412 (Combustion S) 451(Total S)
462 500 501 500 458
NOx ppm - 176 253 140 214 175
Smoke dust
g/m3N 48.4 31.9 29.7 - 35.3 -
*1: Air ratio at the time of calculation is1.4, remaining O2=6%
- 53 -
[Appendix]
Appended figure 4.1-1 Fusibility measurement of ash under test (oxidizing atmosphere, DIN
method)
Softening temperature
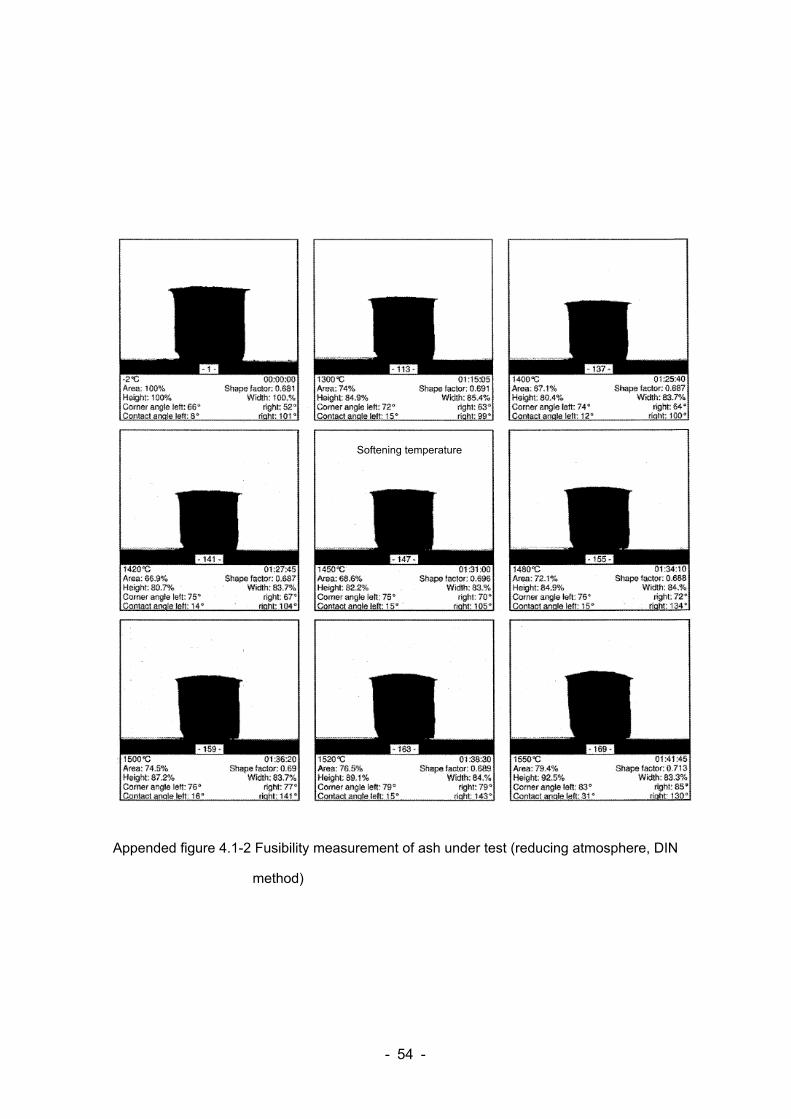
- 54 -
Appended figure 4.1-2 Fusibility measurement of ash under test (reducing atmosphere, DIN
method)
Softening temperature
- 55 -
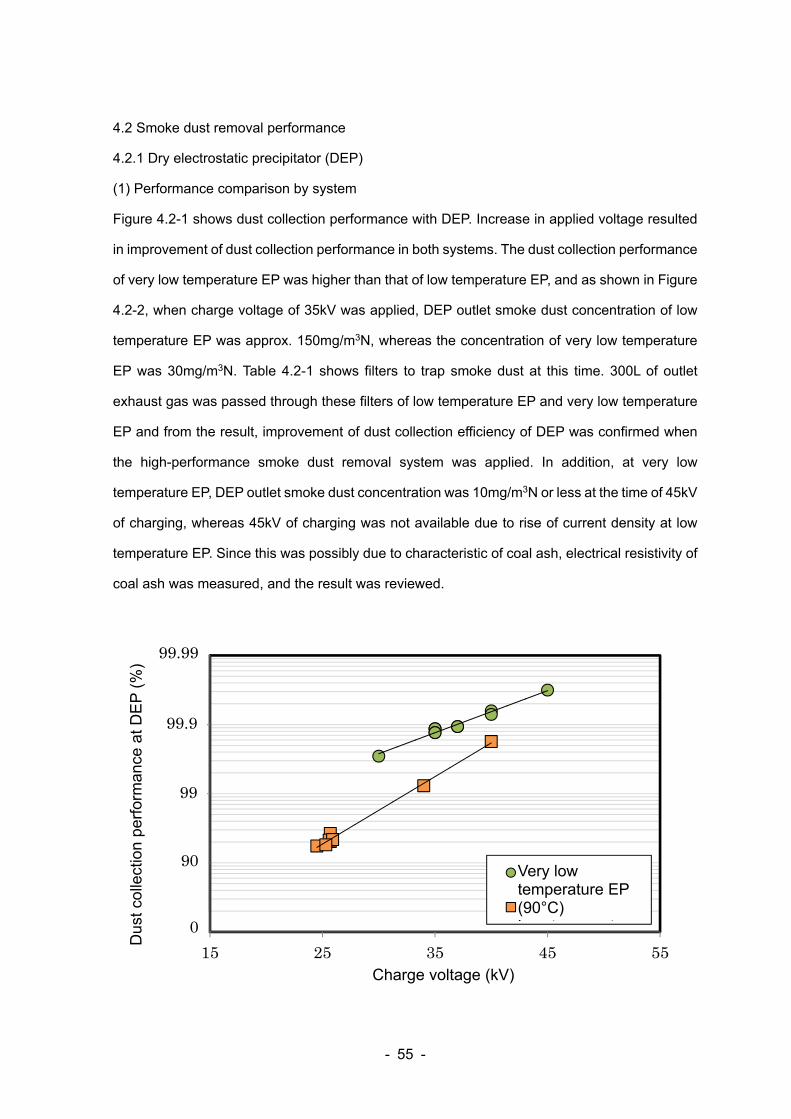
4.2 Smoke dust removal performance
4.2.1 Dry electrostatic precipitator (DEP)
(1) Performance comparison by system
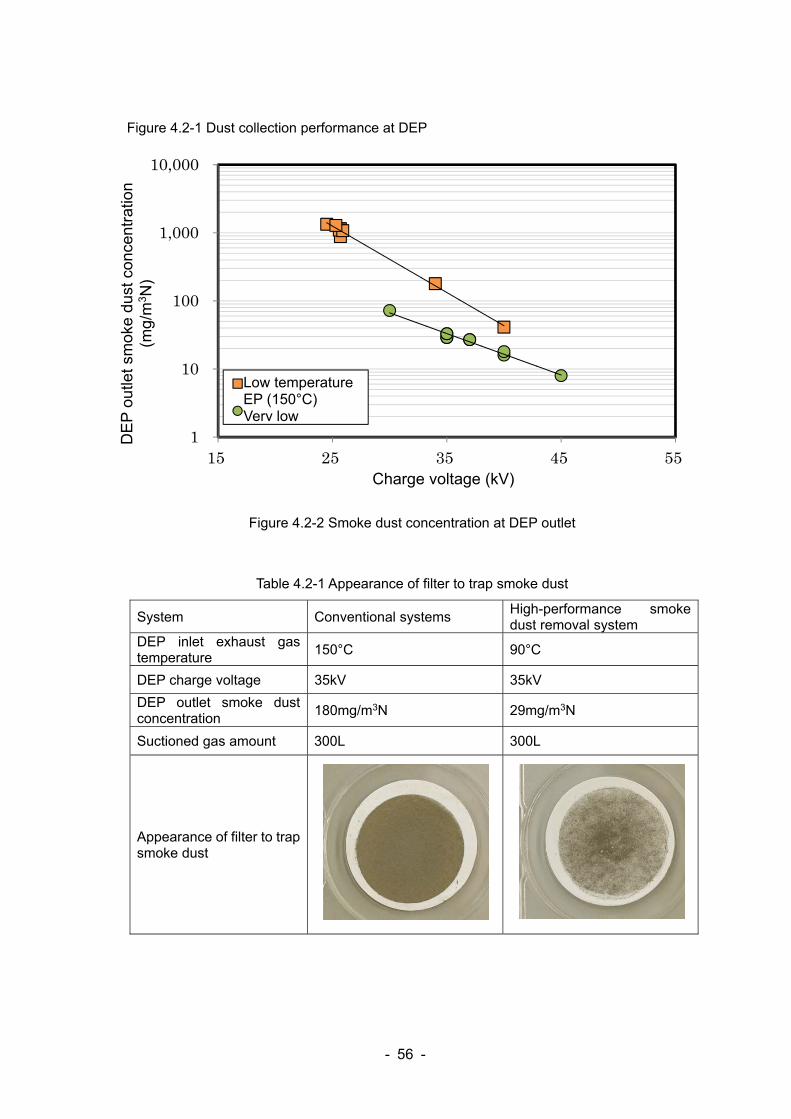
Figure 4.2-1 shows dust collection performance with DEP. Increase in applied voltage resulted
in improvement of dust collection performance in both systems. The dust collection performance
of very low temperature EP was higher than that of low temperature EP, and as shown in Figure
4.2-2, when charge voltage of 35kV was applied, DEP outlet smoke dust concentration of low
temperature EP was approx. 150mg/m3N, whereas the concentration of very low temperature
EP was 30mg/m3N. Table 4.2-1 shows filters to trap smoke dust at this time. 300L of outlet
exhaust gas was passed through these filters of low temperature EP and very low temperature
EP and from the result, improvement of dust collection efficiency of DEP was confirmed when
the high-performance smoke dust removal system was applied. In addition, at very low
temperature EP, DEP outlet smoke dust concentration was 10mg/m3N or less at the time of 45kV
of charging, whereas 45kV of charging was not available due to rise of current density at low
temperature EP. Since this was possibly due to characteristic of coal ash, electrical resistivity of
coal ash was measured, and the result was reviewed.
1
10
100
1,000
10,000
15 25 35 45 55
DEPで
の集
塵性
能(%)
荷電圧 (kV)
低低温EP(90)
低温EP(150)0
90
99
99.9
99.99
Very low temperature EP (90°C) L t t
Charge voltage (kV)
Dus
t col
lect
ion
perf
orm
ance
at D
EP
(%
)
- 56 -
Figure 4.2-1 Dust collection performance at DEP
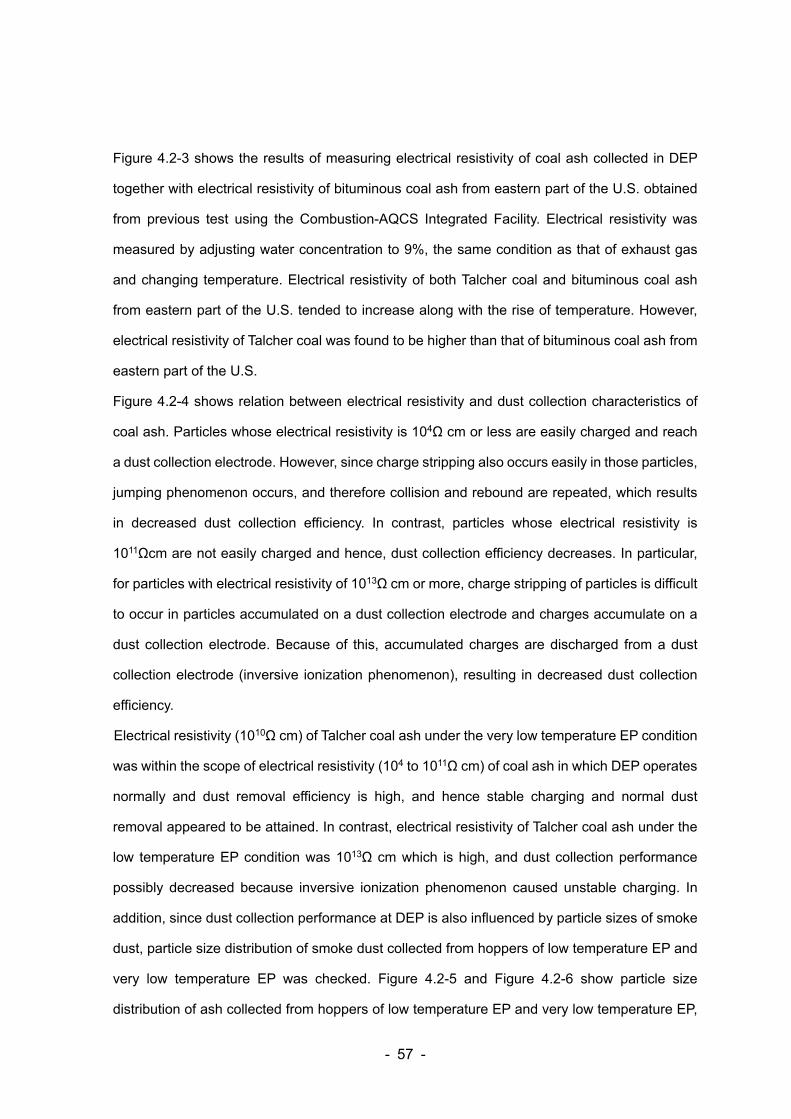
Figure 4.2-2 Smoke dust concentration at DEP outlet
Table 4.2-1 Appearance of filter to trap smoke dust
System Conventional systems High-performance smoke dust removal system
DEP inlet exhaust gas temperature
150°C 90°C
DEP charge voltage 35kV 35kV
DEP outlet smoke dust concentration
180mg/m3N 29mg/m3N
Suctioned gas amount 300L 300L
Appearance of filter to trap smoke dust
1
10
100
1,000
10,000
15 25 35 45 55
DEP出
口煤
塵濃
度(mg/m3 N)
荷電圧(kV)
低温EP(150)
低低温EP(90)
Low temperature EP (150°C) Very low
Charge voltage (kV)
DE
P o
utle
t sm
oke
dust
con
cent
ratio
n (m
g/m
3 N)
- 57 -
Figure 4.2-3 shows the results of measuring electrical resistivity of coal ash collected in DEP
together with electrical resistivity of bituminous coal ash from eastern part of the U.S. obtained
from previous test using the Combustion-AQCS Integrated Facility. Electrical resistivity was
measured by adjusting water concentration to 9%, the same condition as that of exhaust gas
and changing temperature. Electrical resistivity of both Talcher coal and bituminous coal ash
from eastern part of the U.S. tended to increase along with the rise of temperature. However,
electrical resistivity of Talcher coal was found to be higher than that of bituminous coal ash from
eastern part of the U.S.
Figure 4.2-4 shows relation between electrical resistivity and dust collection characteristics of
coal ash. Particles whose electrical resistivity is 104Ω cm or less are easily charged and reach
a dust collection electrode. However, since charge stripping also occurs easily in those particles,
jumping phenomenon occurs, and therefore collision and rebound are repeated, which results
in decreased dust collection efficiency. In contrast, particles whose electrical resistivity is
1011Ωcm are not easily charged and hence, dust collection efficiency decreases. In particular,
for particles with electrical resistivity of 1013Ω cm or more, charge stripping of particles is difficult
to occur in particles accumulated on a dust collection electrode and charges accumulate on a
dust collection electrode. Because of this, accumulated charges are discharged from a dust
collection electrode (inversive ionization phenomenon), resulting in decreased dust collection
efficiency.
Electrical resistivity (1010Ω cm) of Talcher coal ash under the very low temperature EP condition
was within the scope of electrical resistivity (104 to 1011Ω cm) of coal ash in which DEP operates
normally and dust removal efficiency is high, and hence stable charging and normal dust
removal appeared to be attained. In contrast, electrical resistivity of Talcher coal ash under the
low temperature EP condition was 1013Ω cm which is high, and dust collection performance
possibly decreased because inversive ionization phenomenon caused unstable charging. In
addition, since dust collection performance at DEP is also influenced by particle sizes of smoke
dust, particle size distribution of smoke dust collected from hoppers of low temperature EP and
very low temperature EP was checked. Figure 4.2-5 and Figure 4.2-6 show particle size
distribution of ash collected from hoppers of low temperature EP and very low temperature EP,
- 58 -
respectively. Average diameter (d50) of smoke dust removed at low temperature EP was 26.4μm
in the segment 1 and 16.2μm in the segment 2. On the contrary, average diameter of smoke
dust removed at very low temperature EP was 20.5μm in the segment 1 and 10.2 μm in the
segment 2, showing smaller values than those of low temperature EP. In other words, even
though particle size of smoke dust is small in very low temperature EP compared with that in
case of low temperature EP, dust collection performance of very low temperature EP was found
to be higher than that of low temperature EP.
Based on the above, lowering exhaust gas temperature at DEP by applying the high-
performance smoke dust removal system and lowering electrical resistivity of coal ash is
assumed to be an effective way to improve dust collection performance.
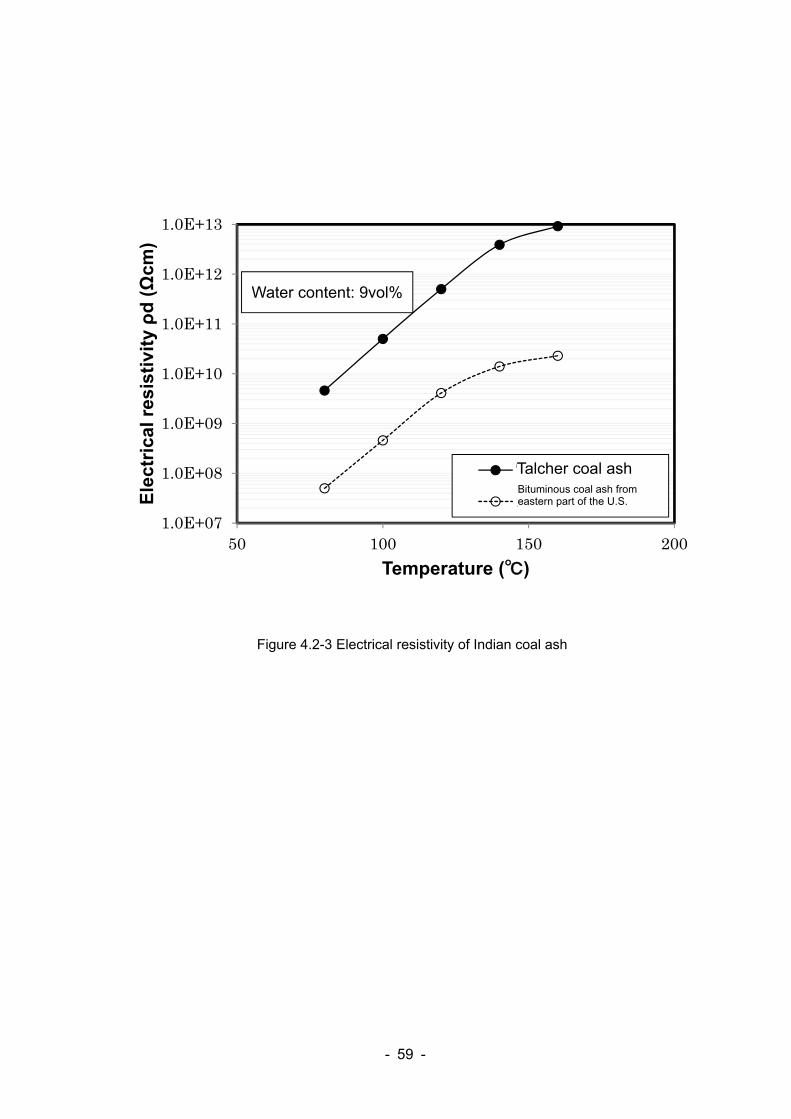
- 59 -
Figure 4.2-3 Electrical resistivity of Indian coal ash
1.0E+07
1.0E+08
1.0E+09
1.0E+10
1.0E+11
1.0E+12
1.0E+13
50 100 150 200
Ele
ctri
cal r
esis
tivi
tyρ
d(Ω
cm)
Temperature ()
Talcher炭灰
米国東部瀝青炭灰
Water content: 9vol%
Bituminous coal ash from eastern part of the U.S.
Talcher coal ash
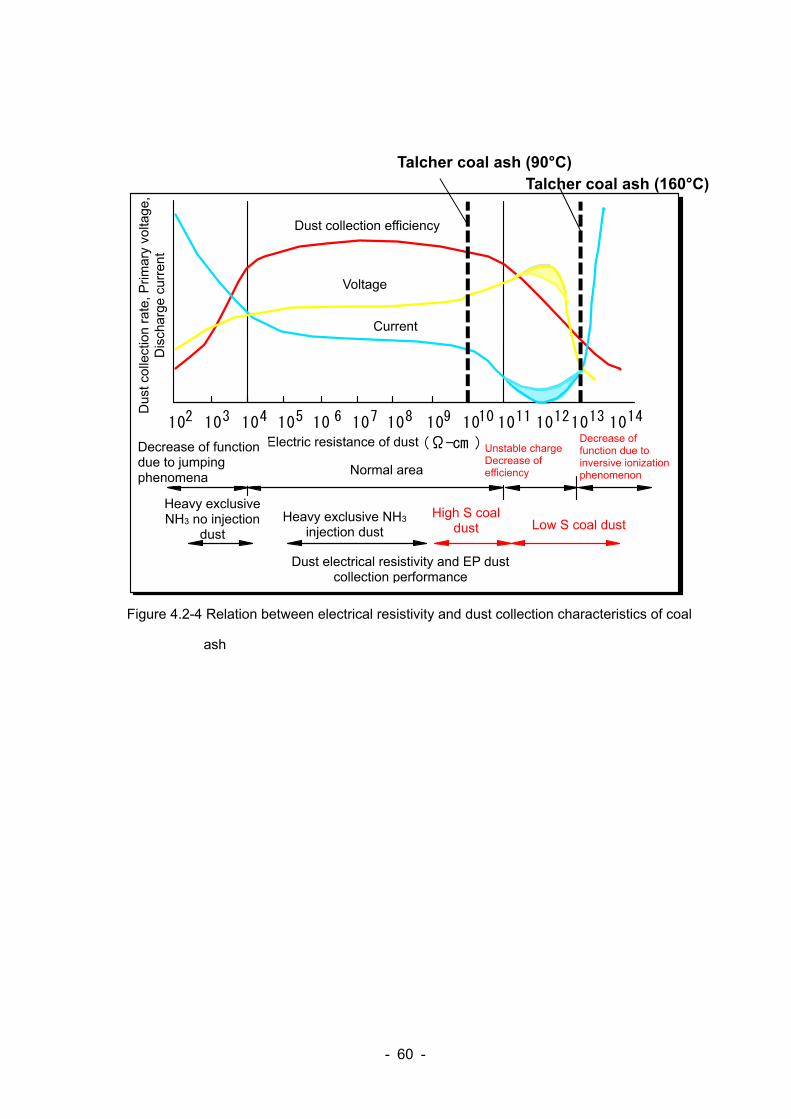
- 60 -
Figure 4.2-4 Relation between electrical resistivity and dust collection characteristics of coal
ash
ダスト電気抵抗率とEP集じん性能
重専N H 3注入ダスト重専N H 3無
注入ダスト
ダストの電気抵抗(Ω-cm )
集じ
ん率
,一次
電圧 ,放
電電
流
102 103 104 105 10 6 107 108 109 1010 1011 10121013 1014
集じん効率
電圧
電流
ジャンピング現象
による機能低下 正常領域逆電離現象に
よる機能低下
荷電不安定
効率低下
低S炭ダスト高S炭ダスト
Talcher coal ash (160°C)Talcher coal ash (90°C)
Voltage
Dust collection efficiency
Electric resistance of dust
Dus
t col
lect
ion
rate
, Pri
mar
y vo
ltage
, D
isch
arge
cur
rent
Decrease of function due to jumping phenomena
Current
Heavy exclusive NH3 injection dust
Heavy exclusive NH3 no injection
dust
Unstable charge Decrease of efficiency Normal area
Decrease of function due to inversive ionization phenomenon
Low S coal dust High S coal
dust
Dust electrical resistivity and EP dust collection performance
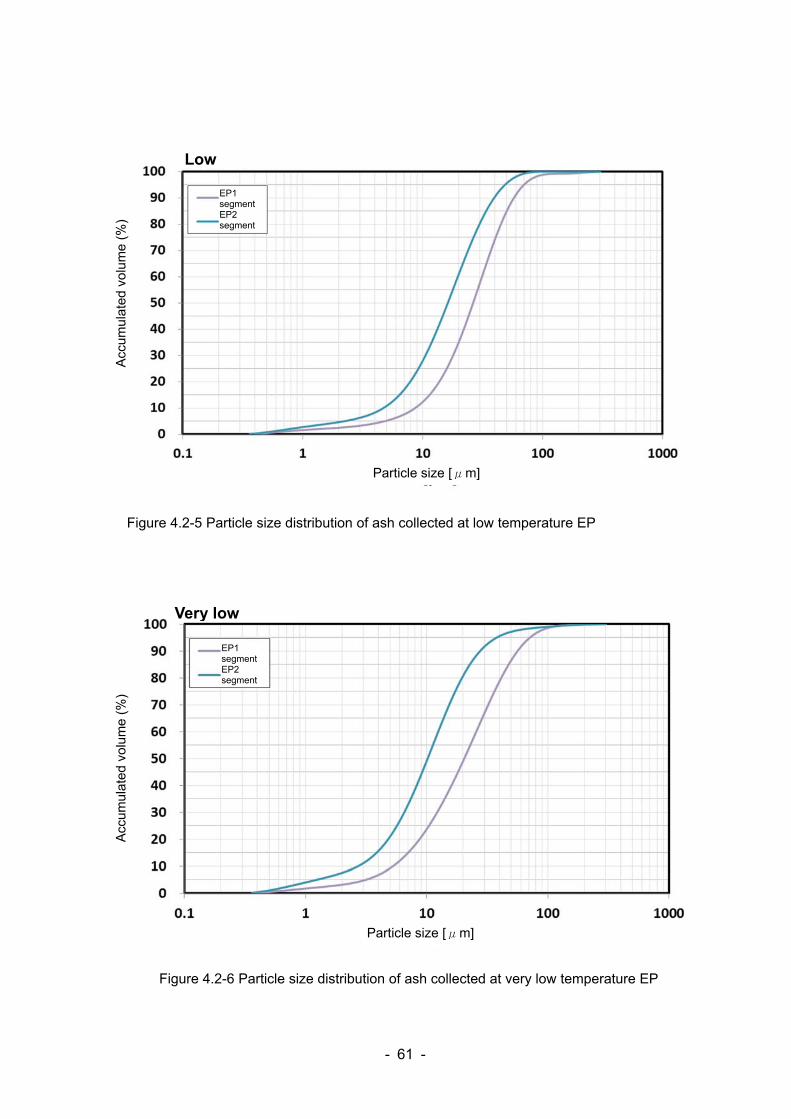
- 61 -
Figure 4.2-5 Particle size distribution of ash collected at low temperature EP
Figure 4.2-6 Particle size distribution of ash collected at very low temperature EP
Low
EP1 segment EP2 segment
Particle size [μm]
Acc
umul
ated
vol
ume
(%)
Very low
Acc
umul
ated
vol
ume
(%)
Particle size [μm]
EP1 segment EP2 segment
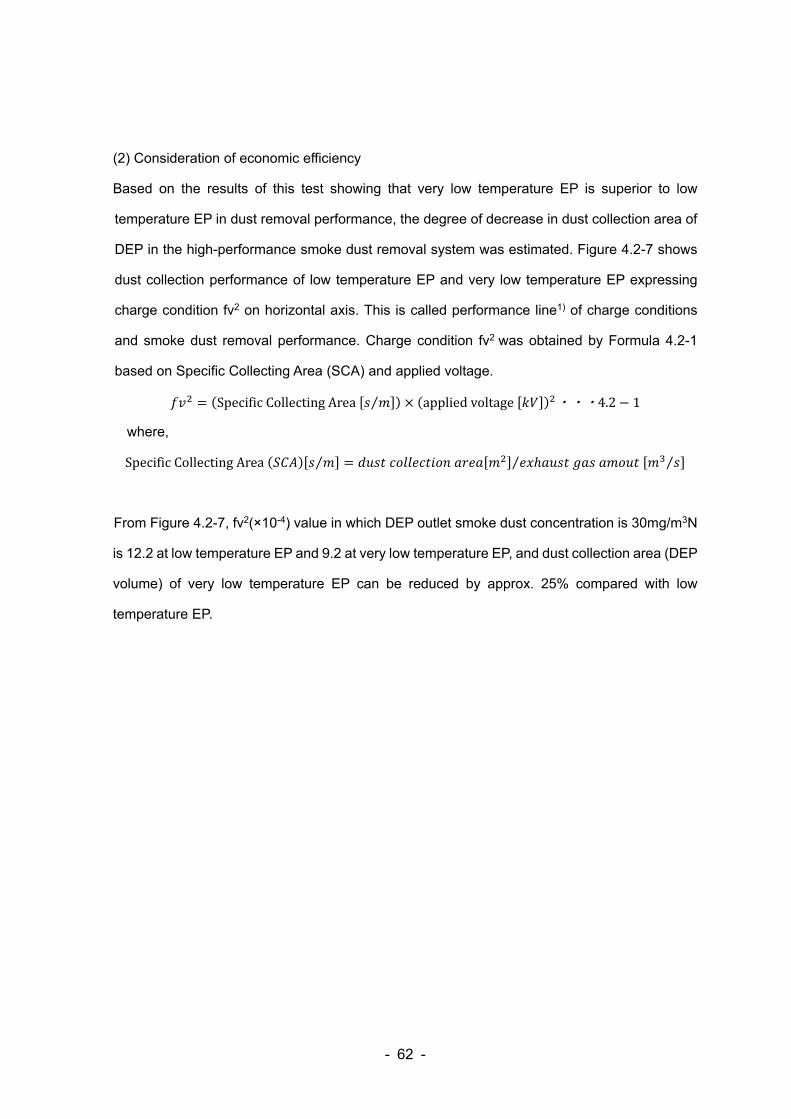
- 62 -
(2) Consideration of economic efficiency
Based on the results of this test showing that very low temperature EP is superior to low
temperature EP in dust removal performance, the degree of decrease in dust collection area of
DEP in the high-performance smoke dust removal system was estimated. Figure 4.2-7 shows
dust collection performance of low temperature EP and very low temperature EP expressing
charge condition fv2 on horizontal axis. This is called performance line1) of charge conditions
and smoke dust removal performance. Charge condition fv2 was obtained by Formula 4.2-1
based on Specific Collecting Area (SCA) and applied voltage.
SpecificCollectingArea ⁄ appliedvoltage ・・・4.2 1
where,
SpecificCollectingArea ⁄ ⁄⁄
From Figure 4.2-7, fv2(×10-4) value in which DEP outlet smoke dust concentration is 30mg/m3N
is 12.2 at low temperature EP and 9.2 at very low temperature EP, and dust collection area (DEP
volume) of very low temperature EP can be reduced by approx. 25% compared with low
temperature EP.
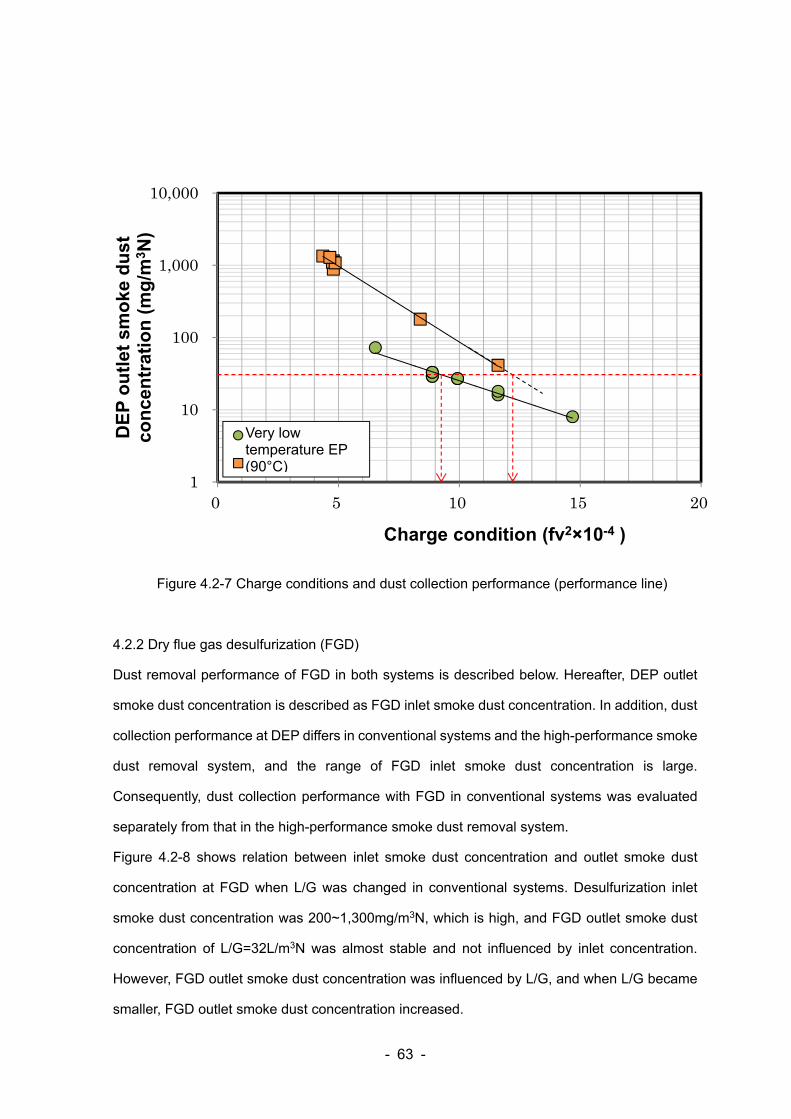
- 63 -
Figure 4.2-7 Charge conditions and dust collection performance (performance line)
4.2.2 Dry flue gas desulfurization (FGD)
Dust removal performance of FGD in both systems is described below. Hereafter, DEP outlet
smoke dust concentration is described as FGD inlet smoke dust concentration. In addition, dust
collection performance at DEP differs in conventional systems and the high-performance smoke
dust removal system, and the range of FGD inlet smoke dust concentration is large.
Consequently, dust collection performance with FGD in conventional systems was evaluated
separately from that in the high-performance smoke dust removal system.
Figure 4.2-8 shows relation between inlet smoke dust concentration and outlet smoke dust
concentration at FGD when L/G was changed in conventional systems. Desulfurization inlet
smoke dust concentration was 200~1,300mg/m3N, which is high, and FGD outlet smoke dust
concentration of L/G=32L/m3N was almost stable and not influenced by inlet concentration.
However, FGD outlet smoke dust concentration was influenced by L/G, and when L/G became
smaller, FGD outlet smoke dust concentration increased.
1
10
100
1,000
10,000
0 5 10 15 20
DE
P o
utl
et s
mo
ke d
ust
co
nce
ntr
atio
n(m
g/m
3 N)
Charge condition (fv2×10-4 )
低低温EP(90)
低温EP(150)
Very low temperature EP (90°C)
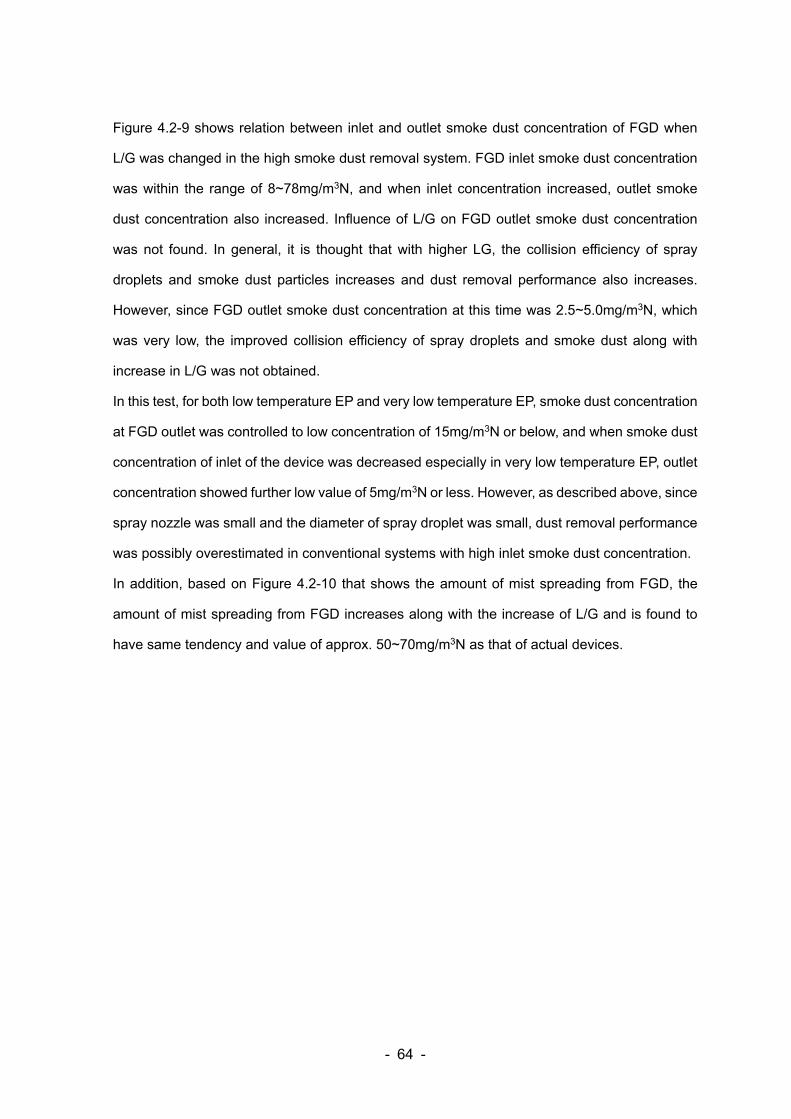
- 64 -
Figure 4.2-9 shows relation between inlet and outlet smoke dust concentration of FGD when
L/G was changed in the high smoke dust removal system. FGD inlet smoke dust concentration
was within the range of 8~78mg/m3N, and when inlet concentration increased, outlet smoke
dust concentration also increased. Influence of L/G on FGD outlet smoke dust concentration
was not found. In general, it is thought that with higher LG, the collision efficiency of spray
droplets and smoke dust particles increases and dust removal performance also increases.
However, since FGD outlet smoke dust concentration at this time was 2.5~5.0mg/m3N, which
was very low, the improved collision efficiency of spray droplets and smoke dust along with
increase in L/G was not obtained.
In this test, for both low temperature EP and very low temperature EP, smoke dust concentration
at FGD outlet was controlled to low concentration of 15mg/m3N or below, and when smoke dust
concentration of inlet of the device was decreased especially in very low temperature EP, outlet
concentration showed further low value of 5mg/m3N or less. However, as described above, since
spray nozzle was small and the diameter of spray droplet was small, dust removal performance
was possibly overestimated in conventional systems with high inlet smoke dust concentration.
In addition, based on Figure 4.2-10 that shows the amount of mist spreading from FGD, the
amount of mist spreading from FGD increases along with the increase of L/G and is found to
have same tendency and value of approx. 50~70mg/m3N as that of actual devices.
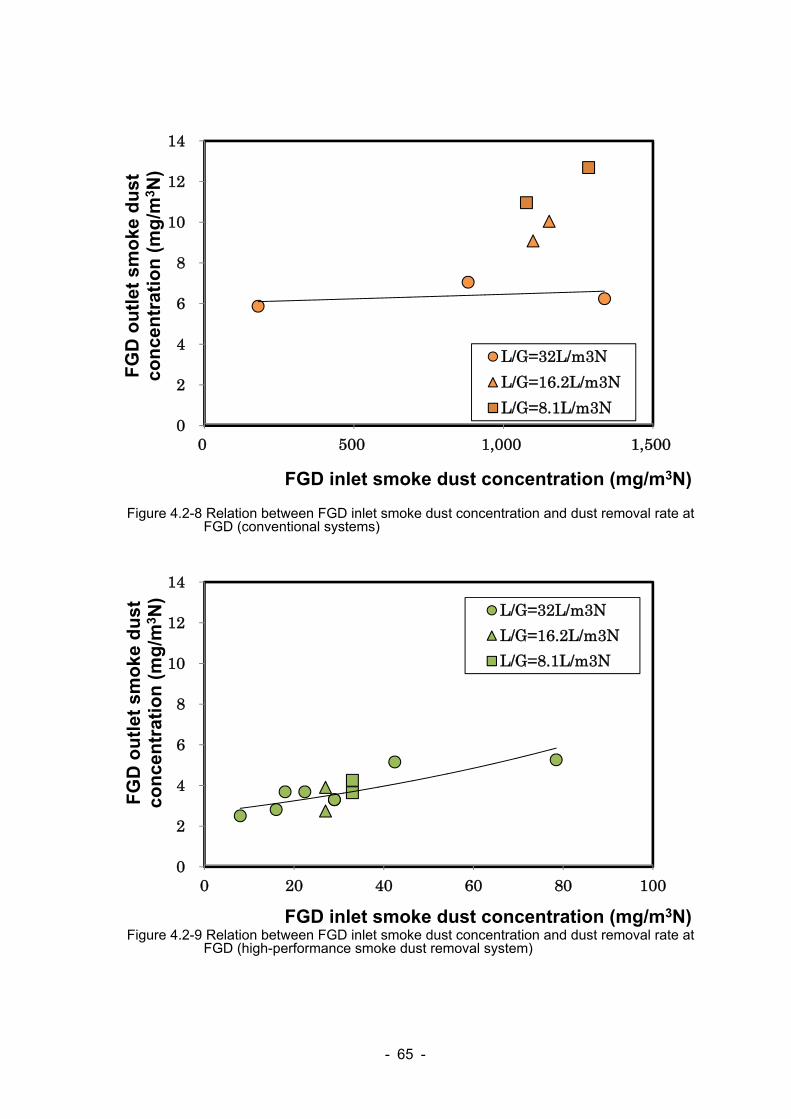
- 65 -
Figure 4.2-8 Relation between FGD inlet smoke dust concentration and dust removal rate at FGD (conventional systems)
Figure 4.2-9 Relation between FGD inlet smoke dust concentration and dust removal rate at FGD (high-performance smoke dust removal system)
0
2
4
6
8
10
12
14
0 500 1,000 1,500
FG
Do
utl
et s
mo
ke d
ust
co
nce
ntr
atio
n (
mg
/m3 N
)
FGD inlet smoke dust concentration (mg/m3N)
L/G=32L/m3N
L/G=16.2L/m3N
L/G=8.1L/m3N
0
2
4
6
8
10
12
14
0 20 40 60 80 100
FG
D o
utl
et s
mo
ke d
ust
co
nce
ntr
atio
n (
mg
/m3 N
)
FGD inlet smoke dust concentration (mg/m3N)
L/G=32L/m3N
L/G=16.2L/m3N
L/G=8.1L/m3N
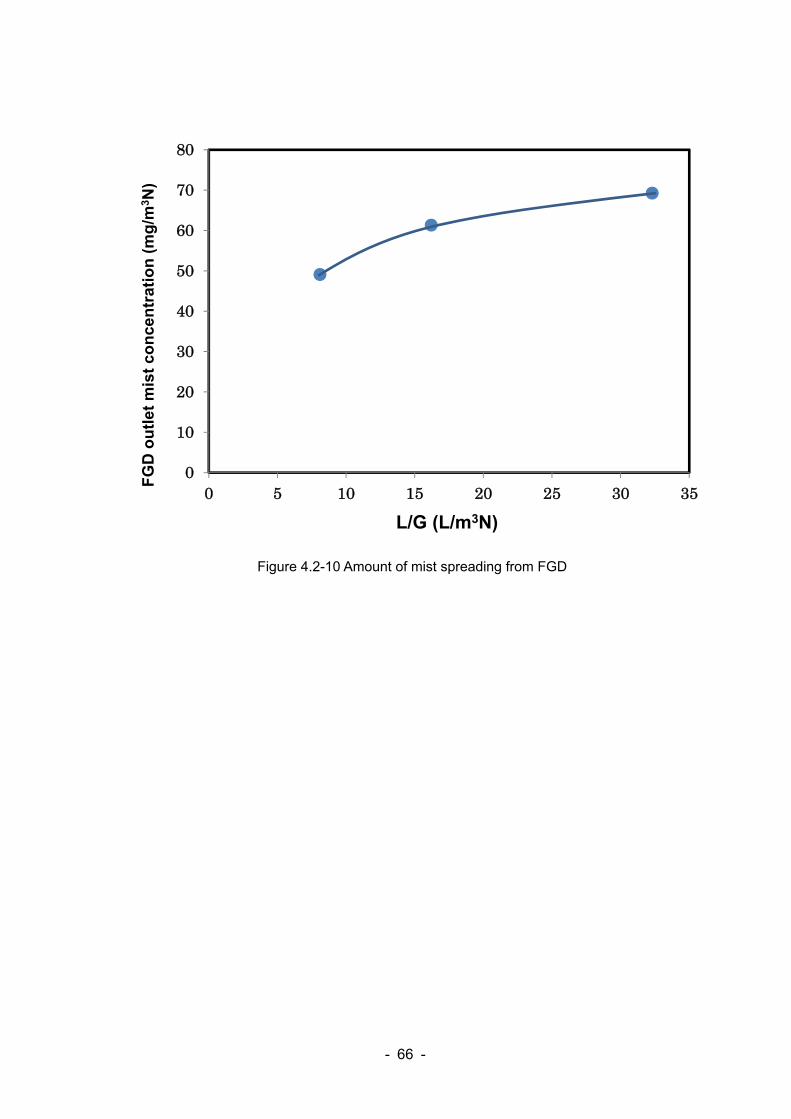
- 66 -
Figure 4.2-10 Amount of mist spreading from FGD
0
10
20
30
40
50
60
70
80
0 5 10 15 20 25 30 35
FG
D o
utl
et m
ist
con
cen
trat
ion
(mg
/m3 N
)
L/G (L/m3N)
- 67 -
The study result of particle sizes of smoke dust flowing in FGD is described here. Dust removal
in FGD was possibly due to inertial collision of spray droplets and smoke dust particles, and
efficiency of collision with spray droplets varies depending on smoke dust particle sizes.
Consequently, measurement of smoke dust drop size at FGD inlet is important. In this study,
sampling of DEP outlet exhaust gas was conducted by using circular filter paper, and SEM
images of coal ash trapped on the filter surface were analyzed to obtain particle size distribution.
Figure 4.2-11 and Figure 4.2-12 show SEM observation images of DEP outlet smoke dust in
conventional systems and the high-performance smoke dust removal system, respectively.
Individual particles were measured by using these SEM images of coal ash as shown in Figure
4.2-13 to obtain average drop size. Figure 4.2-14 shows particle size distribution of smoke dust
in DEP outlet exhaust gas in conventional systems and the high-performance smoke dust
removal system obtained from SEM image analysis. From Figure 4.2-14, the average drop size
(d50) of coal ash not removed at DEP and flowing in FGD was 4.6μm at low temperature EP
and 6.5μm at very low temperature EP. Dust removal performance of very low temperature EP
is high, and removal of smaller particles than the case with low temperature EP leads to stronger
influence of coarse particles, suggesting that the average drop size of coal ash in DEP outlet
exhaust gas tends to be large.
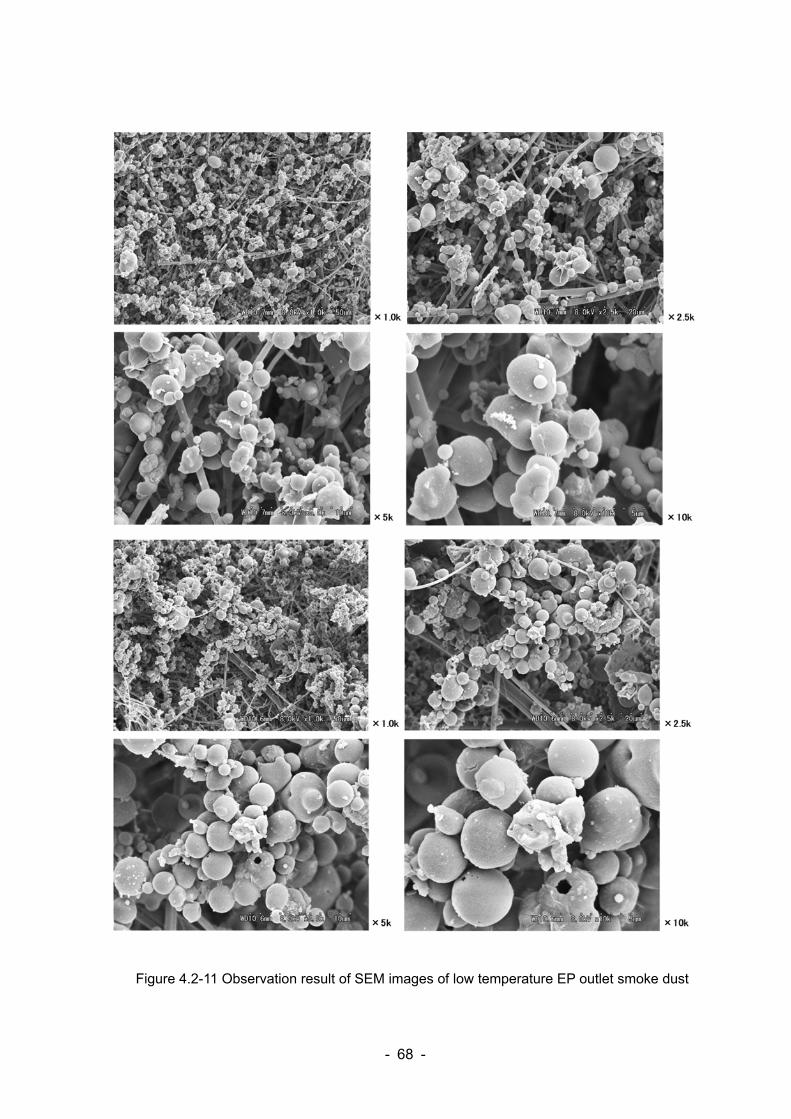
- 68 -
Figure 4.2-11 Observation result of SEM images of low temperature EP outlet smoke dust
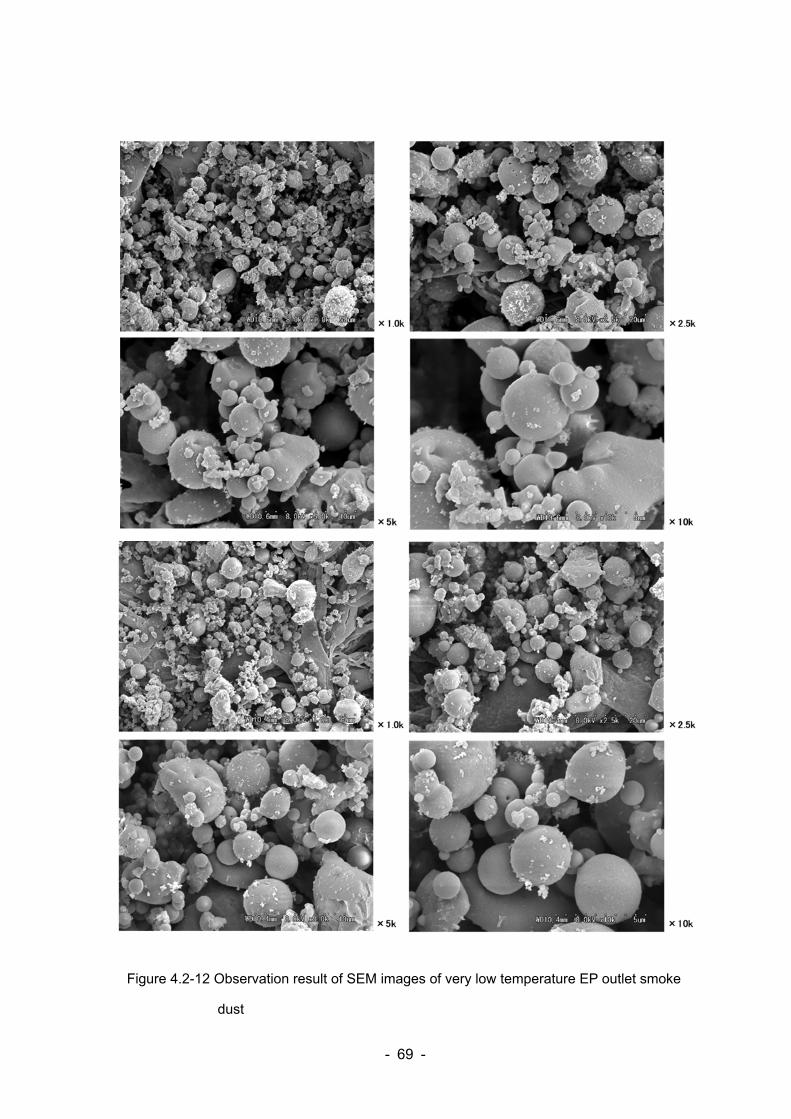
- 69 -
Figure 4.2-12 Observation result of SEM images of very low temperature EP outlet smoke
dust
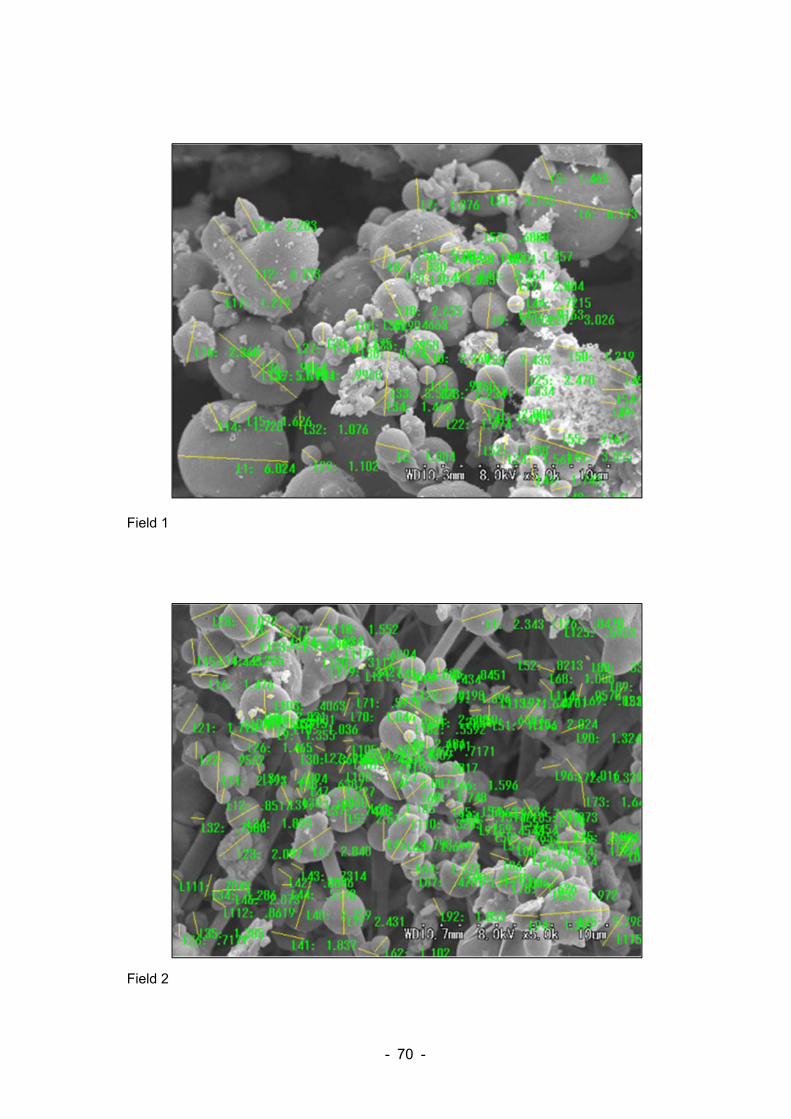
- 70 -
Field 1
Field 2
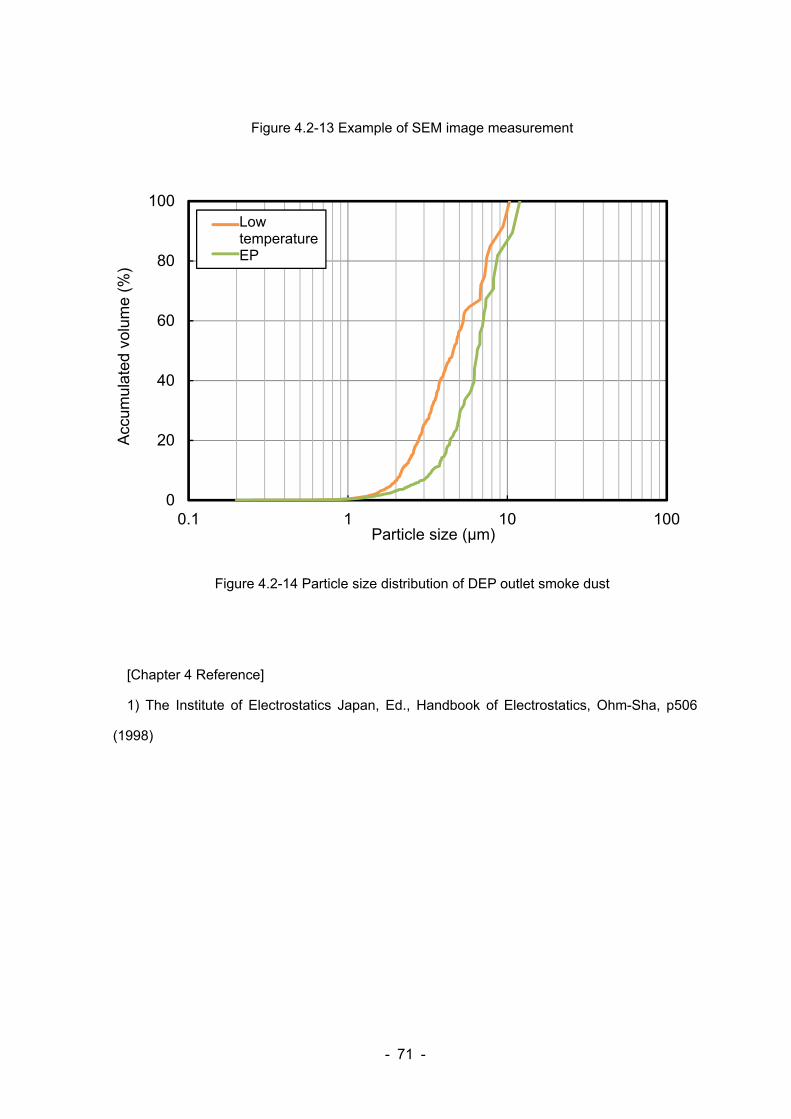
- 71 -
Figure 4.2-13 Example of SEM image measurement
Figure 4.2-14 Particle size distribution of DEP outlet smoke dust
[Chapter 4 Reference]
1) The Institute of Electrostatics Japan, Ed., Handbook of Electrostatics, Ohm-Sha, p506
(1998)
0
20
40
60
80
100
0.1 1 10 100
Acc
umul
ated
vol
ume
(%)
Particle size (μm)
低温EP
低低温EP
Low temperature EP
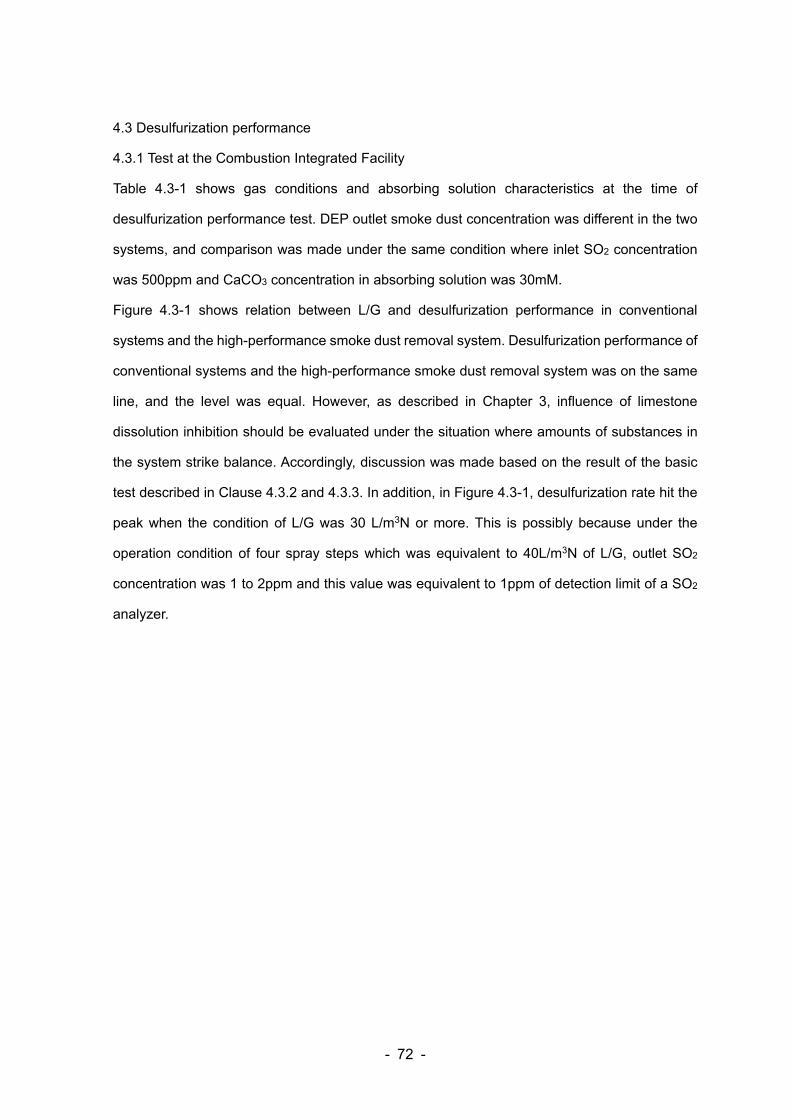
- 72 -
4.3 Desulfurization performance
4.3.1 Test at the Combustion Integrated Facility
Table 4.3-1 shows gas conditions and absorbing solution characteristics at the time of
desulfurization performance test. DEP outlet smoke dust concentration was different in the two
systems, and comparison was made under the same condition where inlet SO2 concentration
was 500ppm and CaCO3 concentration in absorbing solution was 30mM.
Figure 4.3-1 shows relation between L/G and desulfurization performance in conventional
systems and the high-performance smoke dust removal system. Desulfurization performance of
conventional systems and the high-performance smoke dust removal system was on the same
line, and the level was equal. However, as described in Chapter 3, influence of limestone
dissolution inhibition should be evaluated under the situation where amounts of substances in
the system strike balance. Accordingly, discussion was made based on the result of the basic
test described in Clause 4.3.2 and 4.3.3. In addition, in Figure 4.3-1, desulfurization rate hit the
peak when the condition of L/G was 30 L/m3N or more. This is possibly because under the
operation condition of four spray steps which was equivalent to 40L/m3N of L/G, outlet SO2
concentration was 1 to 2ppm and this value was equivalent to 1ppm of detection limit of a SO2
analyzer.
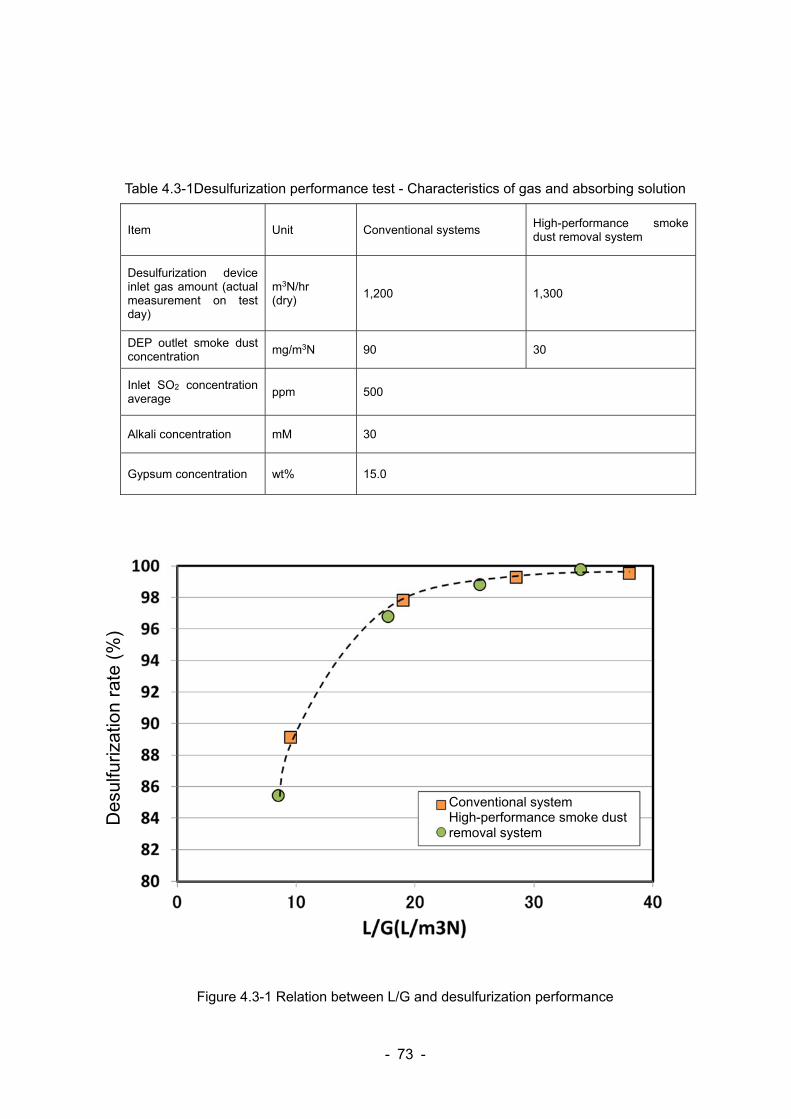
- 73 -
Table 4.3-1Desulfurization performance test - Characteristics of gas and absorbing solution
Item Unit Conventional systems High-performance smoke dust removal system
Desulfurization device inlet gas amount (actual measurement on test day)
m3N/hr (dry)
1,200 1,300
DEP outlet smoke dust concentration
mg/m3N 90 30
Inlet SO2 concentration average
ppm 500
Alkali concentration mM 30
Gypsum concentration wt% 15.0
Figure 4.3-1 Relation between L/G and desulfurization performance
Conventional system High-performance smoke dust removal system
Des
ulfu
rizat
ion
rate
(%
)
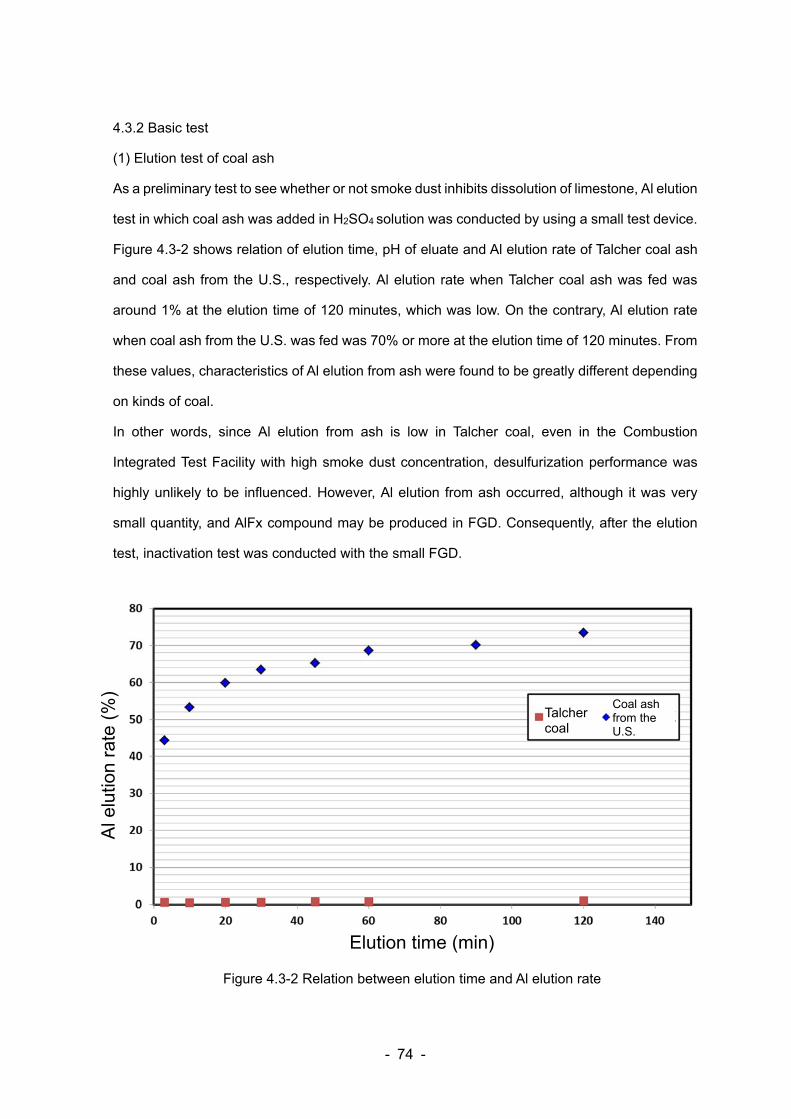
- 74 -
4.3.2 Basic test
(1) Elution test of coal ash
As a preliminary test to see whether or not smoke dust inhibits dissolution of limestone, Al elution
test in which coal ash was added in H2SO4 solution was conducted by using a small test device.
Figure 4.3-2 shows relation of elution time, pH of eluate and Al elution rate of Talcher coal ash
and coal ash from the U.S., respectively. Al elution rate when Talcher coal ash was fed was
around 1% at the elution time of 120 minutes, which was low. On the contrary, Al elution rate
when coal ash from the U.S. was fed was 70% or more at the elution time of 120 minutes. From
these values, characteristics of Al elution from ash were found to be greatly different depending
on kinds of coal.
In other words, since Al elution from ash is low in Talcher coal, even in the Combustion
Integrated Test Facility with high smoke dust concentration, desulfurization performance was
highly unlikely to be influenced. However, Al elution from ash occurred, although it was very
small quantity, and AlFx compound may be produced in FGD. Consequently, after the elution
test, inactivation test was conducted with the small FGD.
Figure 4.3-2 Relation between elution time and Al elution rate
Talcher coal
Elution time (min)
Al e
lutio
n ra
te (
%)
Coal ash from the U.S.
- 75 -
(2) Inactivation test of limestone
After the elution test described above, the possibility of dissolution inhibition of limestone was
studied with a small desulfurization test device by continuously feeding ash and NaF. First,
Figure 4.3-3 shows Al concentration, F concentration and CaCO3 concentration in the system,
pH of solution falling from the absorption tower and desulfurization rate during continuous
operation test using Talcher coal ash. L/G was 20 L/m3N, pH in the system was 5.5 and the
system was operated under certain conditions. In order to shorten test time, addition speed of
ash and NaF was increased temporarily in some period for which the graph shows rise (NaF:
600 to 930min, ash: 930 to 1260min). Since ash and NaF were continuously fed, the level of Al
concentration and F concentration in the system continued to increase. However, absorbing
solution and gypsum were extracted regularly, and hence the final Al concentration of approx.
16 mM and F concentration of approx. 15mM are assumed to be balanced in the system as
described in Chapter 3.
When the feeding of ash and F in the system was started, the level of CaCO3 concentration
temporarily increased to 20mM at a maximum. At this time, desulfurization rate also tended to
increase and CaCO3 concentration in the system was seemingly unstable. Then CaCO3
concentration became stable at around 10 to 15mM, and even after Al and F concentration in
the system reached the calculated balancing concentration of 16mM and 15mM, respectively,
increase of CaCO3 concentration was not found. pH of falling solution was stable at around 3.5,
suggesting that inhibition of limestone dissolution did not occur.
Consequently, for Talcher coal, it is assumed that limestone dissolution is not inhibited and
desulfurization performance is not influenced even under the condition where smoke dust of
high concentration flows in FGD. This assumption is consistent with the result showing the same
level of desulfurization performance in the same CaCO3 concentration both in conventional
systems and the high-performance smoke dust removal system as described in 4.3.1.
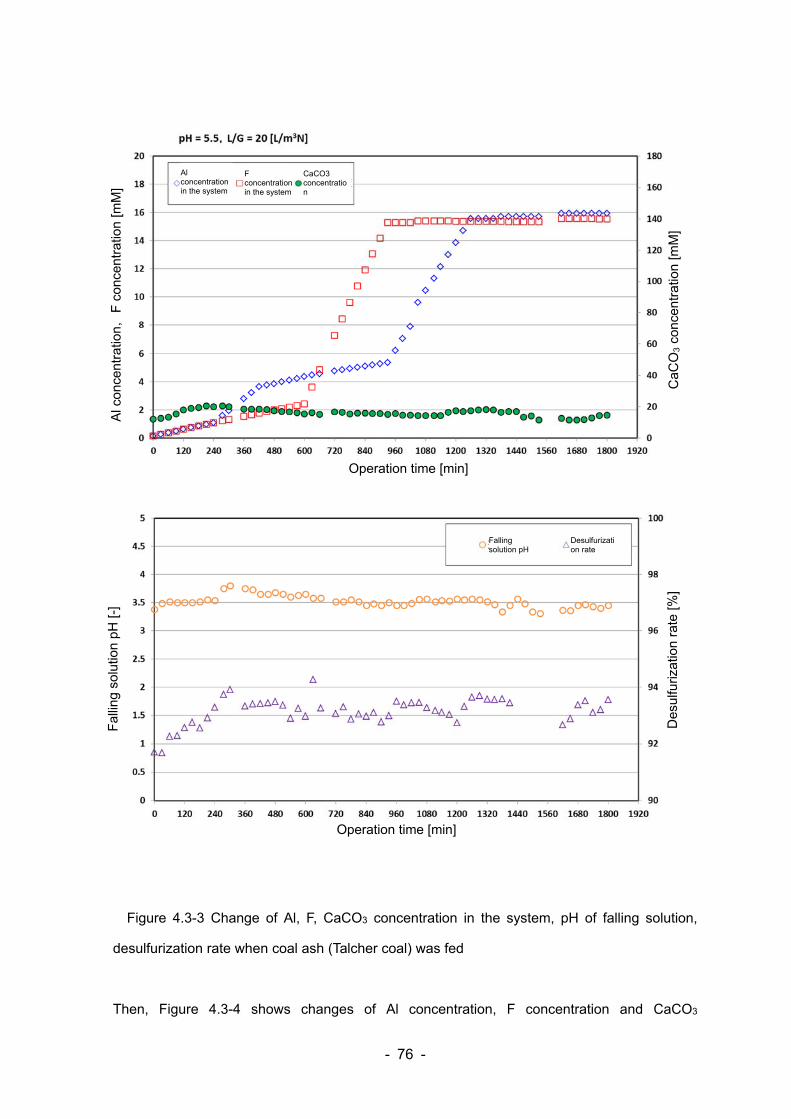
- 76 -
Figure 4.3-3 Change of Al, F, CaCO3 concentration in the system, pH of falling solution,
desulfurization rate when coal ash (Talcher coal) was fed
Then, Figure 4.3-4 shows changes of Al concentration, F concentration and CaCO3
Al concentration in the system
Operation time [min]
Al c
once
ntra
tion,
F c
once
ntra
tion
[mM
]
CaC
O3
conc
entr
atio
n [m
M]
F concentration in the system
CaCO3 concentration
Operation time [min]
Fal
ling
solu
tion
pH [-
]
Des
ulfu
rizat
ion
rate
[%]
Falling solution pH
Desulfurization rate
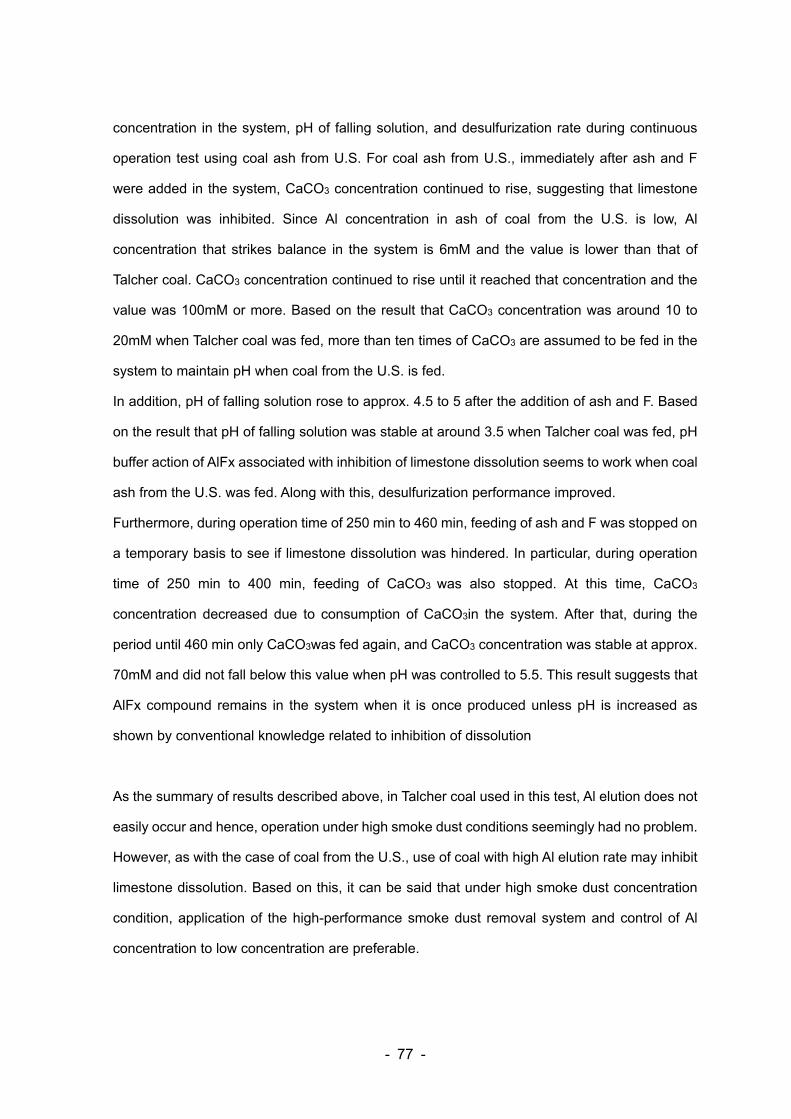
- 77 -
concentration in the system, pH of falling solution, and desulfurization rate during continuous
operation test using coal ash from U.S. For coal ash from U.S., immediately after ash and F
were added in the system, CaCO3 concentration continued to rise, suggesting that limestone
dissolution was inhibited. Since Al concentration in ash of coal from the U.S. is low, Al
concentration that strikes balance in the system is 6mM and the value is lower than that of
Talcher coal. CaCO3 concentration continued to rise until it reached that concentration and the
value was 100mM or more. Based on the result that CaCO3 concentration was around 10 to
20mM when Talcher coal was fed, more than ten times of CaCO3 are assumed to be fed in the
system to maintain pH when coal from the U.S. is fed.
In addition, pH of falling solution rose to approx. 4.5 to 5 after the addition of ash and F. Based
on the result that pH of falling solution was stable at around 3.5 when Talcher coal was fed, pH
buffer action of AlFx associated with inhibition of limestone dissolution seems to work when coal
ash from the U.S. was fed. Along with this, desulfurization performance improved.
Furthermore, during operation time of 250 min to 460 min, feeding of ash and F was stopped on
a temporary basis to see if limestone dissolution was hindered. In particular, during operation
time of 250 min to 400 min, feeding of CaCO3 was also stopped. At this time, CaCO3
concentration decreased due to consumption of CaCO3in the system. After that, during the
period until 460 min only CaCO3was fed again, and CaCO3 concentration was stable at approx.
70mM and did not fall below this value when pH was controlled to 5.5. This result suggests that
AlFx compound remains in the system when it is once produced unless pH is increased as
shown by conventional knowledge related to inhibition of dissolution
As the summary of results described above, in Talcher coal used in this test, Al elution does not
easily occur and hence, operation under high smoke dust conditions seemingly had no problem.
However, as with the case of coal from the U.S., use of coal with high Al elution rate may inhibit
limestone dissolution. Based on this, it can be said that under high smoke dust concentration
condition, application of the high-performance smoke dust removal system and control of Al
concentration to low concentration are preferable.
- 78 -
Figure 4.3-4 Change of Al, F, CaCO3 concentration in the system, pH of falling solution,
desulfurization rate when coal ash (coal from the U.S.) was fed
Al concentration in the system
Operation time [min]
Al c
once
ntra
tion,
F c
once
ntra
tion
[mM
]
CaC
O3
conc
entr
atio
n [m
M]
F concentration in the system
CaCO3 concentration
Operation time [min]
Fal
ling
solu
tion
pH [-
]
Des
ulfu
rizat
ion
rate
[%]
Falling solution pH
Desulfurization rate
Stop feeding of Ash, NaF and CaCO3
Stop feeding of Ash and NaF
Stop feeding of Ash, NaF and CaCO3
Stop feeding of Ash and NaF
- 79 -
4.4 Overall heat transfer coefficient in GGH
Figure 4.4-1 shows change of overall heat transfer coefficient α at GGH heat recovery device in
conventional systems. The change of overall heat transfer coefficient was from 10 to 13 W/(m2・
K). Soot blower was operated at 10:00, 11:30, 14:00 and 16:20 as expressed with red line in the
figure. After the operation of soot blower, ash accumulated on fin tubes as time passed, heat
transfer area on the surface of heat exchanger decreased, and overall heat transfer coefficient
decreased. Average decrease rate of heat transfer coefficient for a certain period of time was
0.6 to 0.9 W/(m2・K)/h. After that, by removal of accumulated ash at the timing of soot blower
operation, heat transfer coefficient recovered to the initial 12 to 13 W/(m2・K). However, in
conventional systems, GGH heat recovery device is installed after DEP, smoke dust
concentration flowing in GGH heat recovery device is low, and the amount of ash accumulated
on fin tubes is small compared to the case where the high-performance smoke dust removal
system is operated as described later. Figure 4.4-1 shows images of fine tubes taken before
and after soot blow. Significant difference in accumulated amount of ash was not found before
and after soot blow, and these images indicate that the degree of heat transfer coefficient
decrease is small.
Then, Figure 4.4-2 shows the change of overall heat transfer coefficient α at GGH heat recovery
device in the high-performance smoke dust removal system. The change of overall heat transfer
coefficient was from 8 to 13 W/(m2・K), showing almost the same level as conventional systems
although the lower lever was found in some time zones. Soot blower was operated at 10:05,
12:40, 15:25 and 17:20 as expressed with red line in the figure. As is the case with conventional
systems shown in Figure 4.4-1, after soot blower was operated, heat transfer coefficient
decreased and recovered to the initial 12W/(m2・K) immediately after soot blow. As described
above, in the high-performance smoke dust removal system, since GGH heat recovery device
was set before DEP, smoke dust concentration flowing in the heat recovery device is higher and
the ash amount accumulated on fin tubes is larger than the case of conventional systems.
Accordingly, average decrease rate of heat transfer coefficient for a certain period of time was
1.0 to 1.4W/(m2・K)/h showing higher values than those of conventional systems. However, the
high-performance smoke dust removal system shows the same recovery of heat transfer
coefficient to 12W/(m2・K) or more as conventional systems immediately after soot blower

- 80 -
operation. Based on this, if accumulated ash is removed on a regular basis in actual devices,
even under the condition of high smoke dust concentration, GGH heat recovery devices can be
operated without problem. Figure 4.4-2 shows images that were taken before and after soot
blower operation and soot blow was found to remove almost all ash accumulated on and
covered the whole fin tube.
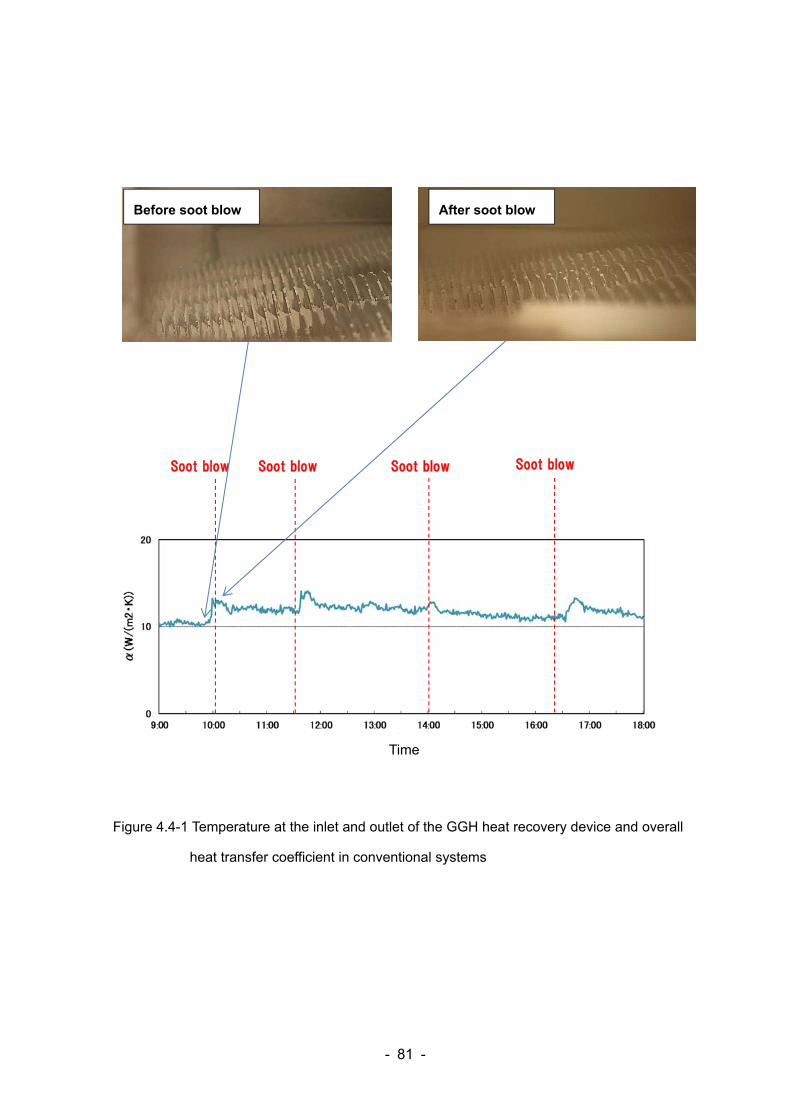
- 81 -
Figure 4.4-1 Temperature at the inlet and outlet of the GGH heat recovery device and overall
heat transfer coefficient in conventional systems
Soot blow Soot blow Soot blow Soot blow
Before soot blow After soot blow
Time
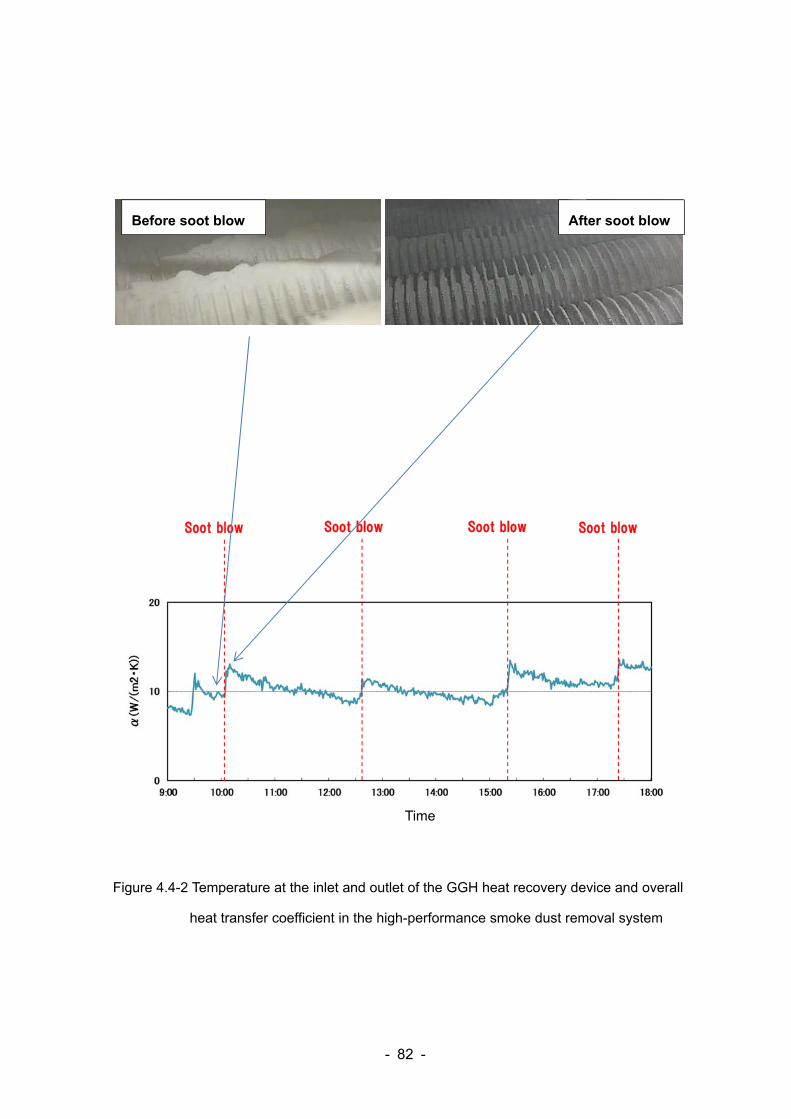
- 82 -
Figure 4.4-2 Temperature at the inlet and outlet of the GGH heat recovery device and overall
heat transfer coefficient in the high-performance smoke dust removal system
Soot blow Soot blow Soot blow Soot blow
Before soot blow After soot blow
Time
- 83 -
4.5 Abrasion characteristics of GGH fins
Comparison of appearance and weight of test pieces set in the GGH heat recovery device were
made before and after exposure to coal combustion exhaust gas. Table 4.5-1 shows the result
of test pieces made of carbon steel and Table 4.5-2 shows the result of test pieces made of
sulfuric acid resistant steel. After exposure to coal combustion exhaust gas, test pieces were
descaled for observation and weight measurement. Test pieces were separately exposed to
exhaust gas in conventional systems and the high-performance smoke dust removal system.
Exposure time was 40 hours for the high-performance smoke dust removal system and 55 hours
for conventional systems.
Figure 4.5-1 shows abrasion speed obtained based on the weight before and after exposure to
coal combustion exhaust gas. Although both test pieces made of carbon steel and sulfuric acid
resistant steel had variation in abrasion speed in the high-performance smoke dust removal
system, great difference was not found in abrasion speed depending on materials and exhaust
gas conditions of conventional systems and the high-performance smoke dust removal system.
In other words, under the condition of the high-performance smoke dust removal system in this
test, GGH heat recovery device inlet smoke dust concentration was approx. 160 times higher
than that under the condition of conventional systems (when applied voltage at DEP was 35kV).
However, abrasion speed of materials showed the same level as that of conventional systems.
From these results, in terms of abrasion characteristics of GGH heat recovery devices, adoption
of the high-performance smoke dust removal system as an exhaust gas processing system of
coal with high ash content such as Indian coal is assumed to cause no problem.
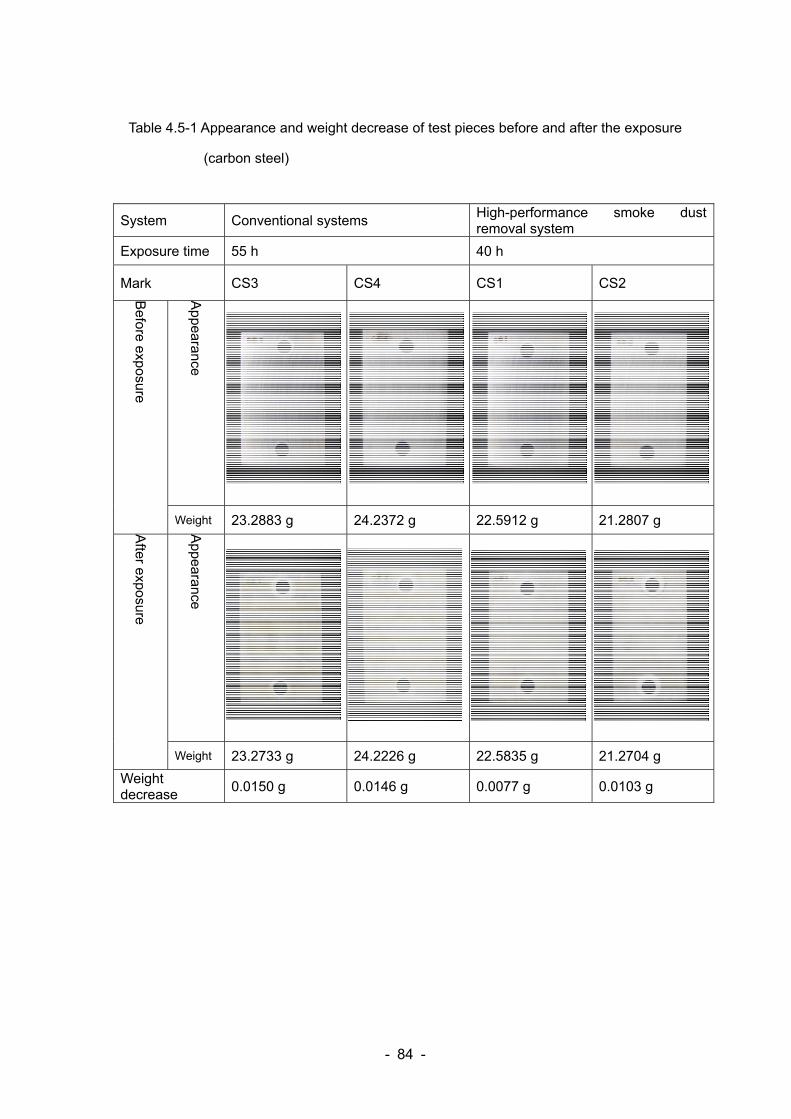
- 84 -
Table 4.5-1 Appearance and weight decrease of test pieces before and after the exposure
(carbon steel)
System Conventional systems High-performance smoke dust removal system
Exposure time 55 h 40 h
Mark CS3 CS4 CS1 CS2
Before expo
sure
Appearance
Weight 23.2883 g 24.2372 g 22.5912 g 21.2807 g
After exposure
Appearance
Weight 23.2733 g 24.2226 g 22.5835 g 21.2704 g
Weight decrease
0.0150 g 0.0146 g 0.0077 g 0.0103 g
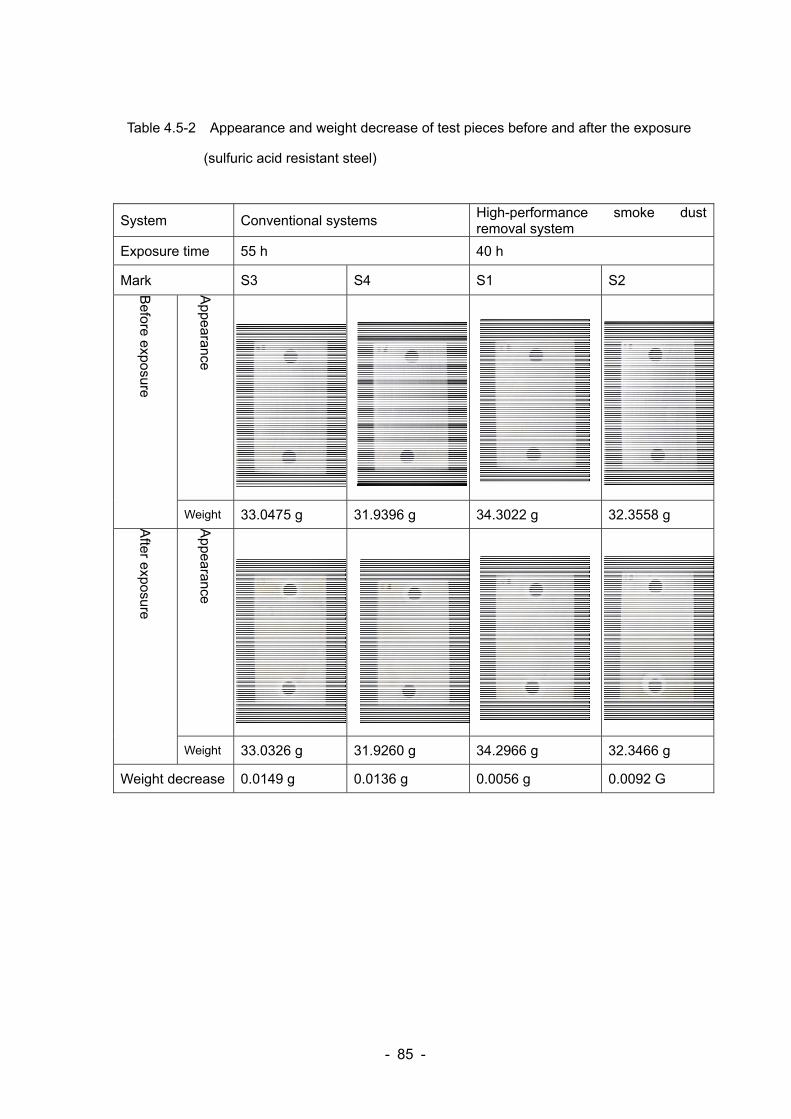
- 85 -
Table 4.5-2 Appearance and weight decrease of test pieces before and after the exposure
(sulfuric acid resistant steel)
System Conventional systems High-performance smoke dust removal system
Exposure time 55 h 40 h
Mark S3 S4 S1 S2
Before expo
sure
Appearance
Weight 33.0475 g 31.9396 g 34.3022 g 32.3558 g
After exposure
Appearance
Weight 33.0326 g 31.9260 g 34.2966 g 32.3466 g
Weight decrease 0.0149 g 0.0136 g 0.0056 g 0.0092 G
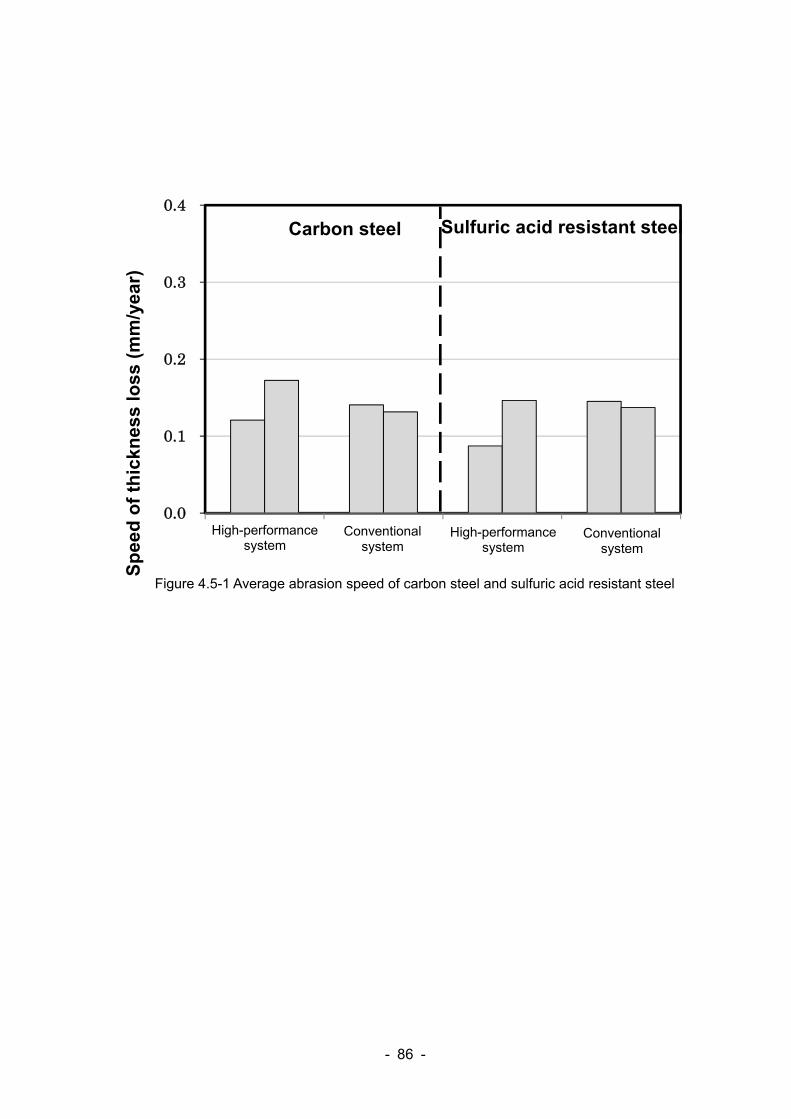
- 86 -
Figure 4.5-1 Average abrasion speed of carbon steel and sulfuric acid resistant steel
0.0
0.1
0.2
0.3
0.4
高性能システム 従来システム 高性能システム 従来システム
Sp
eed
of
thic
knes
s lo
ss(m
m/y
ear)
Carbon steel Sulfuric acid resistant steel
High-performance system
High-performance system
Conventional system
Conventional system
- 87 -
5. SUMMARY OF COMBUSTION TEST
5.1 Overview of test results
Indian coal contains a lot of ash, which leads to high load of smoke dust to flue gas treatment
facilities with possible negative influence on dust removal/desulfurization performance.
Accordingly, in this research, comparative evaluation of conventional systems and the high-
performance smoke dust removal system was performed by using the Combustion-AQCS
Integrated Test device and basic test devices in a laboratory. Major results are described below.
(1) Smoke dust removal performance
Stable charging and possibility of highly efficient dust removal were confirmed for very low
temperature EP (the high-performance smoke dust removal system). On the contrary, for low
temperature EP (conventional systems), applying high voltage was impossible and DEP outlet
smoke dust concentration was higher than that of very low temperature EP. This is seemingly
because high electrical resistivity of ash resulted in the occurrence of inversive ionization
phenomenon. Consequently, when electrical resistivity of ash is high as with the case of Talcher
coal, an effective way is that applying very low temperature EP is applied and exhaust gas
temperature at DEP is decreased to lower the electrical resistivity of ash.
In addition, for both low temperature EP and very low temperature EP, smoke dust concentration
at the outlet of FGD was controlled to low concentration of 15mg/m3N or below. In particular,
when inlet smoke dust concentration was decreased by very low temperature EP, 5mg/m3N of
outlet concentration or less is achievable.
(2) Desulfurization performance
For low temperature EP (conventional systems) and very low temperature EP (the high-
performance smoke dust removal system), smoke dust concentration at the inlet of FGD was
30mg/m3N and 90mg/m3N, respectively. However, under the same condition (L/G, CaCO3
concentration), desulfurization rate of both systems was equal and influence of smoke dust
concentration was not found.
In order to understand the reason for this, test of Al elution from ash was conducted. The result
- 88 -
of this test showed that the rate of Al elution from coal ash was a small value of less than 1%
for elution time of Talcher coal with actual FGD. In addition, limestone inactivation was not found
when ash and F were fed under the condition of high smoke dust concentration at a small FGD.
However, for the same test device, limestone inactivation was found when coal from the U.S.
with high rate of Al elution from ash was fed. Based on this result, the reason why limestone
inactivation did not occur under the condition of high smoke dust concentration for Talcher coal
was low rate of Al elution from ash. Consequently, for coal in which Al elution from ash easily
occurs and under the condition of high smoke dust concentration, limestone inactivation is highly
likely to occur.
(3) Overall heat transfer coefficient in GGH
Overall heat transfer coefficient of GGH in conventional systems and the high-performance
smoke dust removal system was equal. In the high-performance smoke dust removal system,
the amount of ash deposit on fin tubes was larger and decrease rate of heat transfer coefficient
over time was higher than the case of conventional systems, and the heat transfer coefficient
recovered to the initial value by regular soot blower operation every 2 to 3 hours. This result
suggests that operation under the condition of high smoke dust concentration has no problem.
(4) Abrasion characteristic of GGH fin
Abrasion speed in both systems was studied by using test pieces made of carbon steel and
sulfuric acid resistant steel. Difference in both systems was not found and in terms of abrasion
characteristics, operation of the high-performance smoke dust removal system is assumed to
cause no problem even under the condition of high ash content.
(5) Evaluation of economic efficiency
Based on relation between smoke dust removal performance and charge conditions, under the
condition where charge is 45kV and DEP outlet smoke dust concentration is 30mg/m3N, very
low temperature EP is estimated to reduce dust collection area (EP volume) by approx. 25%
compared to the case of low temperature EP.
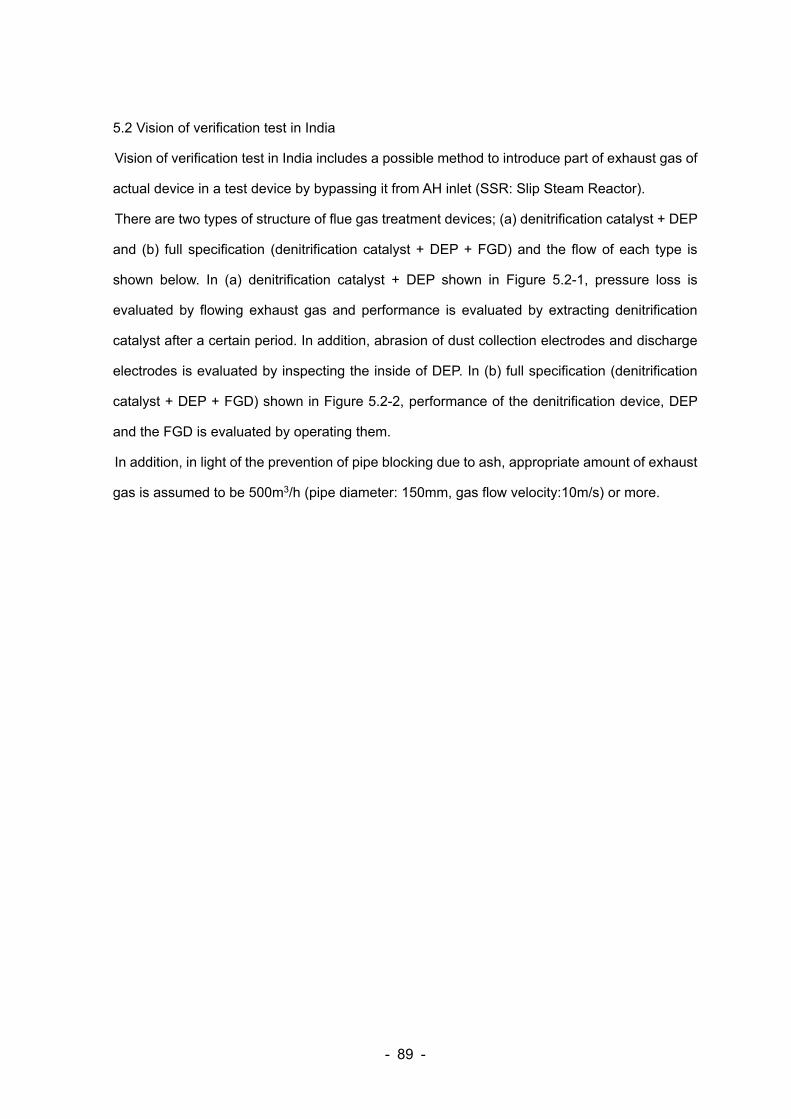
- 89 -
5.2 Vision of verification test in India
Vision of verification test in India includes a possible method to introduce part of exhaust gas of
actual device in a test device by bypassing it from AH inlet (SSR: Slip Steam Reactor).
There are two types of structure of flue gas treatment devices; (a) denitrification catalyst + DEP
and (b) full specification (denitrification catalyst + DEP + FGD) and the flow of each type is
shown below. In (a) denitrification catalyst + DEP shown in Figure 5.2-1, pressure loss is
evaluated by flowing exhaust gas and performance is evaluated by extracting denitrification
catalyst after a certain period. In addition, abrasion of dust collection electrodes and discharge
electrodes is evaluated by inspecting the inside of DEP. In (b) full specification (denitrification
catalyst + DEP + FGD) shown in Figure 5.2-2, performance of the denitrification device, DEP
and the FGD is evaluated by operating them.
In addition, in light of the prevention of pipe blocking due to ash, appropriate amount of exhaust
gas is assumed to be 500m3/h (pipe diameter: 150mm, gas flow velocity:10m/s) or more.
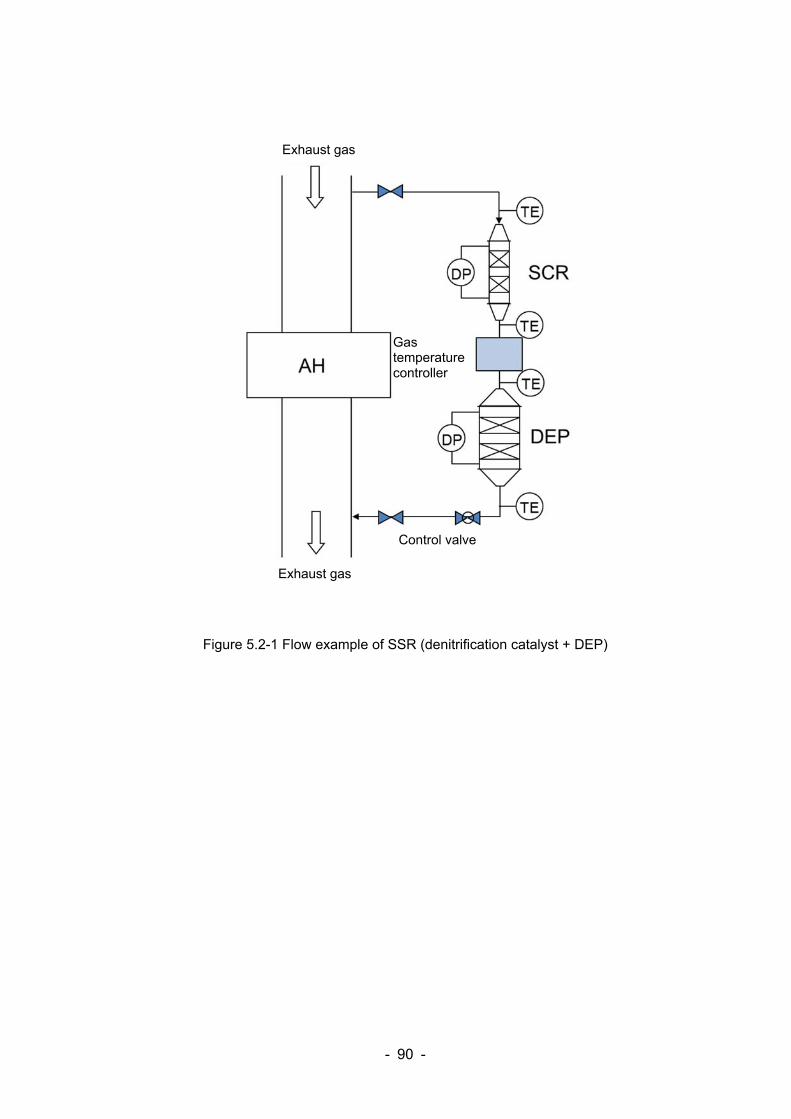
- 90 -
Figure 5.2-1 Flow example of SSR (denitrification catalyst + DEP)
Control valve
Gas temperature controller
Exhaust gas
Exhaust gas
- 91 -
Figure 5.2-2 Flow example of SSR (denitrification catalyst + DEP + FGD)
Cooling media
Stack
Limestone slurry tank
Oxidized air
Ammonia
GGH reheating device
Exhaust gas
GGH heat recovery device
Exhaust gas
Exhaust gas
- 92 -
6. Mercury Removal
6.1 Background and objective
The limit of mercury in India specified in the regulation announced this time is 30μg/m3N which
is applied to units newly established from January 2017. This limit is significantly high compared
the regulation of the US MATS (Mercury and Air Toxics Standards) (3.0×10⁻³ lb/GWh ≈
0.45μg/m3N for newly established unit/not low rank virgin coal). However, coal from India might
contain high concentration of mercury and low concentration of chlorine like the coal tested this
time (Talcher coal) and the removal performance could be lowered due to low oxidation rate of
mercury. Accordingly, mercury behavior in the exhaust gas and effectiveness of the removal
performance improvement method should be confirmed. Then, evaluation and examination
were made at a large-scale test facility held by MHPS as to mercury removal characteristics in
the high mercury oxidation-type denitrification catalyst + high smoke dust removal system (very
low temperature EP) which is MHPS technology and the system highly anticipated mainly in the
U.S. in which activated carbon is added to exhaust gas and mercury is removed by DEP.
6.2 Mercury Removal performance improvement method
6.2.1 Denitrification catalyst + high-performance smoke dust removal system
Although mercury (Hg) in coal is emitted from high-temperature boiler furnace mainly as metallic
mercury vapor in reduced state, it is converted into oxidized mercury (HgCl2) by combining
mostly with chlorine (Cl) in exhaust gas as the exhaust gas is cooled and adsorbed by smoke
dust or dissolved in the liquid of the wet desulfurization device, then, removed from the exhaust
gas. Therefore, improvement of the mercury oxidation rate, the adsorption rate of oxidized
mercury on smoke dust and the removal rate of smoke dust on which mercury is adsorbed are
important.
The latest MHPS exhaust gas treatment system2),3) allows to promote adsorption of oxidized
mercury on ash and significantly improve mercury removal rate at in EP by efficiently oxidizing
mercury with high mercury oxidation-type denitrification catalyst and then introducing the
exhaust gas to very low temperature EP after lowering the temperature to about 90°C by the
heat recovery device (high-performance smoke dust removal system). Furthermore, since a
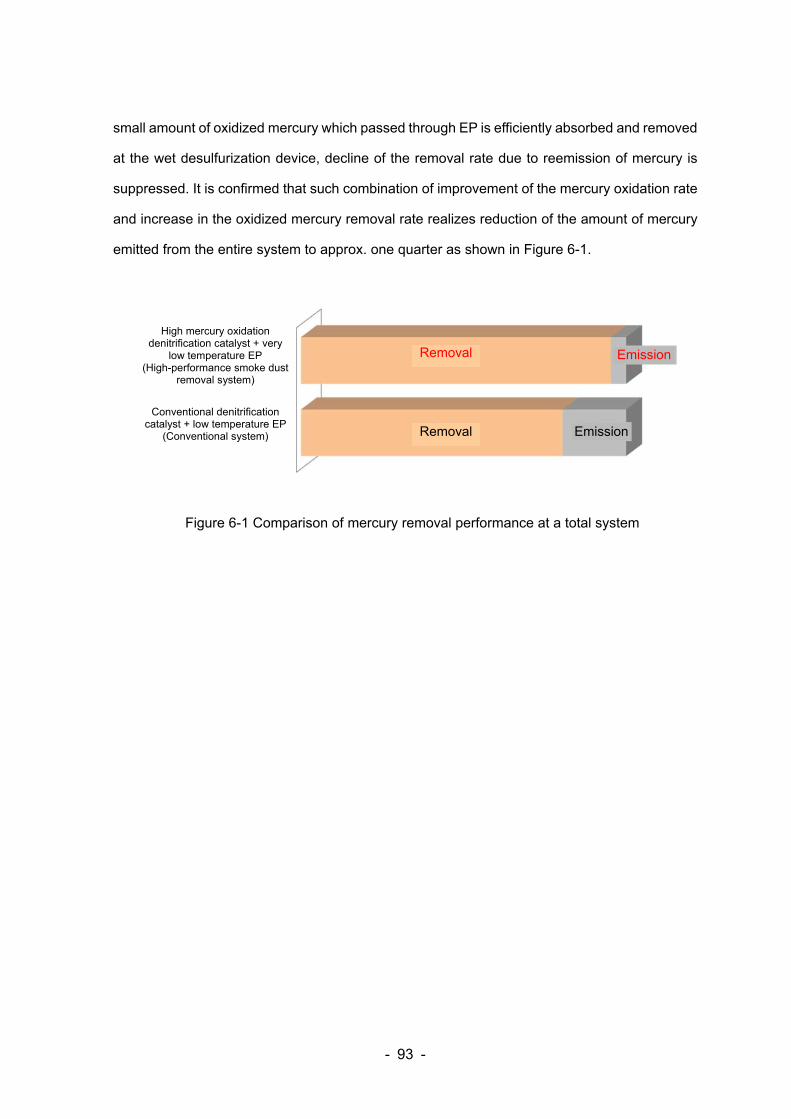
- 93 -
small amount of oxidized mercury which passed through EP is efficiently absorbed and removed
at the wet desulfurization device, decline of the removal rate due to reemission of mercury is
suppressed. It is confirmed that such combination of improvement of the mercury oxidation rate
and increase in the oxidized mercury removal rate realizes reduction of the amount of mercury
emitted from the entire system to approx. one quarter as shown in Figure 6-1.
Figure 6-1 Comparison of mercury removal performance at a total system
Removal
High mercury oxidation denitrification catalyst + very
low temperature EP (High-performance smoke dust
removal system)
Conventional denitrification catalyst + low temperature EP
(Conventional system)
Emission
Removal Emission
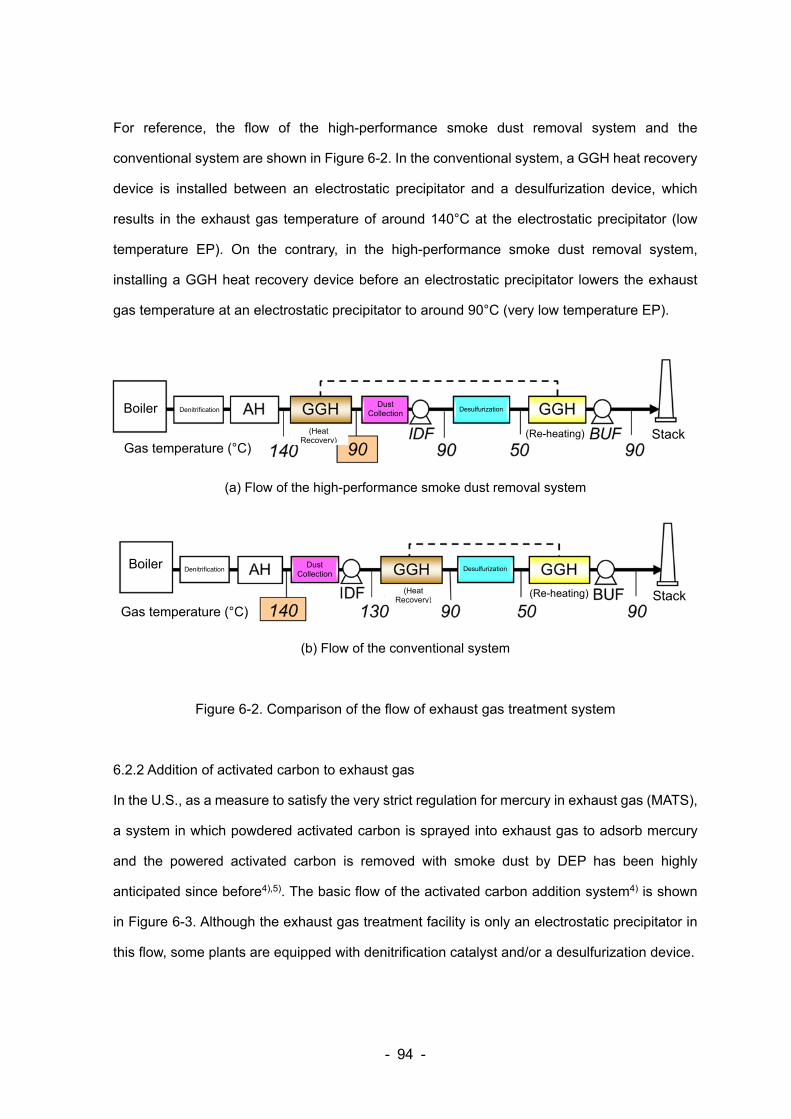
- 94 -
For reference, the flow of the high-performance smoke dust removal system and the
conventional system are shown in Figure 6-2. In the conventional system, a GGH heat recovery
device is installed between an electrostatic precipitator and a desulfurization device, which
results in the exhaust gas temperature of around 140°C at the electrostatic precipitator (low
temperature EP). On the contrary, in the high-performance smoke dust removal system,
installing a GGH heat recovery device before an electrostatic precipitator lowers the exhaust
gas temperature at an electrostatic precipitator to around 90°C (very low temperature EP).
(a) Flow of the high-performance smoke dust removal system
(b) Flow of the conventional system
Figure 6-2. Comparison of the flow of exhaust gas treatment system
6.2.2 Addition of activated carbon to exhaust gas
In the U.S., as a measure to satisfy the very strict regulation for mercury in exhaust gas (MATS),
a system in which powdered activated carbon is sprayed into exhaust gas to adsorb mercury
and the powered activated carbon is removed with smoke dust by DEP has been highly
anticipated since before4),5). The basic flow of the activated carbon addition system4) is shown
in Figure 6-3. Although the exhaust gas treatment facility is only an electrostatic precipitator in
this flow, some plants are equipped with denitrification catalyst and/or a desulfurization device.
Denitrification Boiler
Gas temperature (°C)
(Heat Recovery)
Dust Collection
Desulfurization
(Re-heating) Stack
Boiler Denitrification
(Heat Recovery)
Dust Collection
Desulfurization
(Re-heating) StackGas temperature (°C)
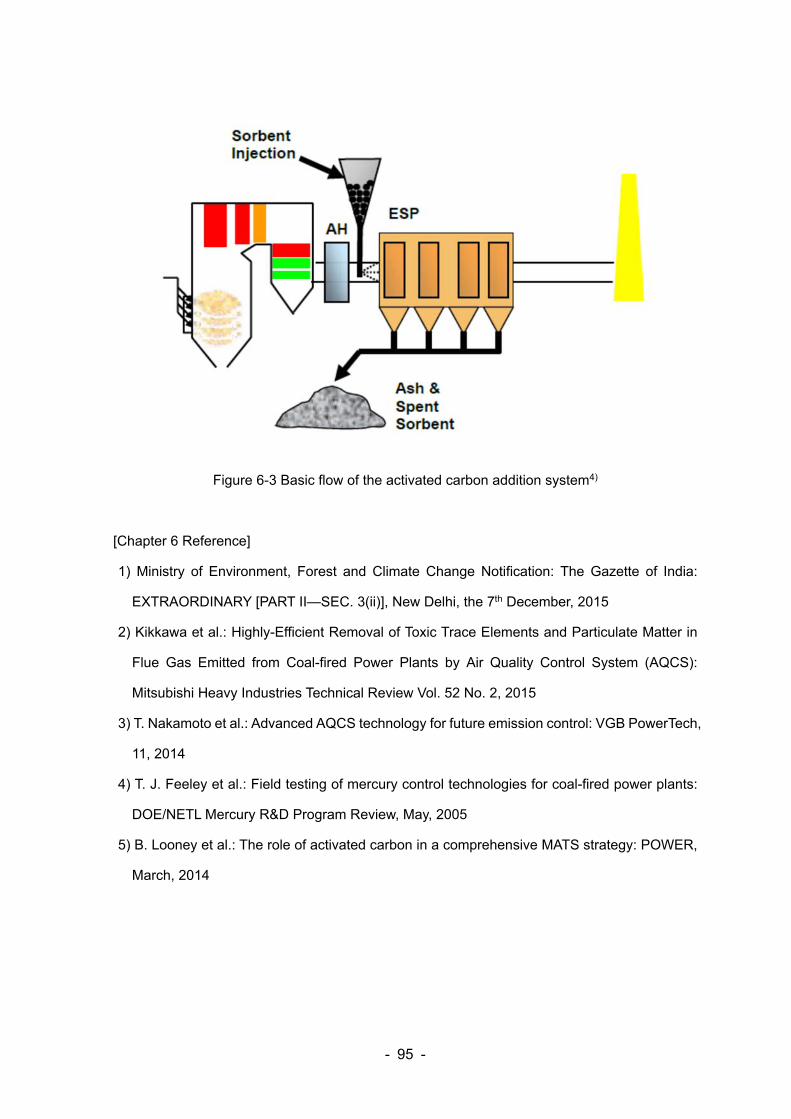
- 95 -
Figure 6-3 Basic flow of the activated carbon addition system4)
[Chapter 6 Reference]
1) Ministry of Environment, Forest and Climate Change Notification: The Gazette of India:
EXTRAORDINARY [PART II—SEC. 3(ii)], New Delhi, the 7th December, 2015
2) Kikkawa et al.: Highly-Efficient Removal of Toxic Trace Elements and Particulate Matter in
Flue Gas Emitted from Coal-fired Power Plants by Air Quality Control System (AQCS):
Mitsubishi Heavy Industries Technical Review Vol. 52 No. 2, 2015
3) T. Nakamoto et al.: Advanced AQCS technology for future emission control: VGB PowerTech,
11, 2014
4) T. J. Feeley et al.: Field testing of mercury control technologies for coal-fired power plants:
DOE/NETL Mercury R&D Program Review, May, 2005
5) B. Looney et al.: The role of activated carbon in a comprehensive MATS strategy: POWER,
March, 2014
- 96 -
7. MERCURY REMOVAL
7.1 Details of test
Coal from India (approx. 25 ton) provided by JCOAL was burned under the condition close to
actual pulverized coal fired boilers (approx. 200 kg of coal was fed per hour) for one week (from
Monday to Saturday) by using the “Combustion-AQCS Integrated Facility” held by MHPS to
conduct test operation of exhaust gas treatment. Conducting component analysis of coal and
combustion exhaust gas, etc., mercury removal performance of the conventional system (low
temperature EP) and the high-performance smoke dust removal system (very low temperature
EP) were compared. In addition, injecting activated carbon into exhaust gas, the following data
with respect to mercury removal was obtained.
・ Mercury concentration in coal
・ Mercury concentration in exhaust gas in the case where activated carbon is not injected
(after each device for dust removal and desulfurization)
・ Mercury oxidation rate at the denitrification device
・ Mercury concentration in exhaust gas in the case where activated carbon is injected (after
each device for dust removal and desulfurization)
7.2 Main test operation conditions (plan)
(1) Combustion amount of coal: 185kg/h (ash content 40%)
(2) Gas temperature at inlet of the electrostatic precipitator:
90-100°C (high-performance smoke dust removal system),
140-150°C (conventional system)
(3) Electrostatic precipitator charge voltage: 25 to 45kV (3 conditions)
(4) Denitrification device: denitrification rate 90%
(5) Desulfurization device: desulfurization rate 95%
In order to support the result of mercury removal performance test conducted at the integrated
facility (influence of lowering of DEP temperature to very cold and addition of activated carbon),
laboratory basic test was also conducted and the result was closely reviewed.
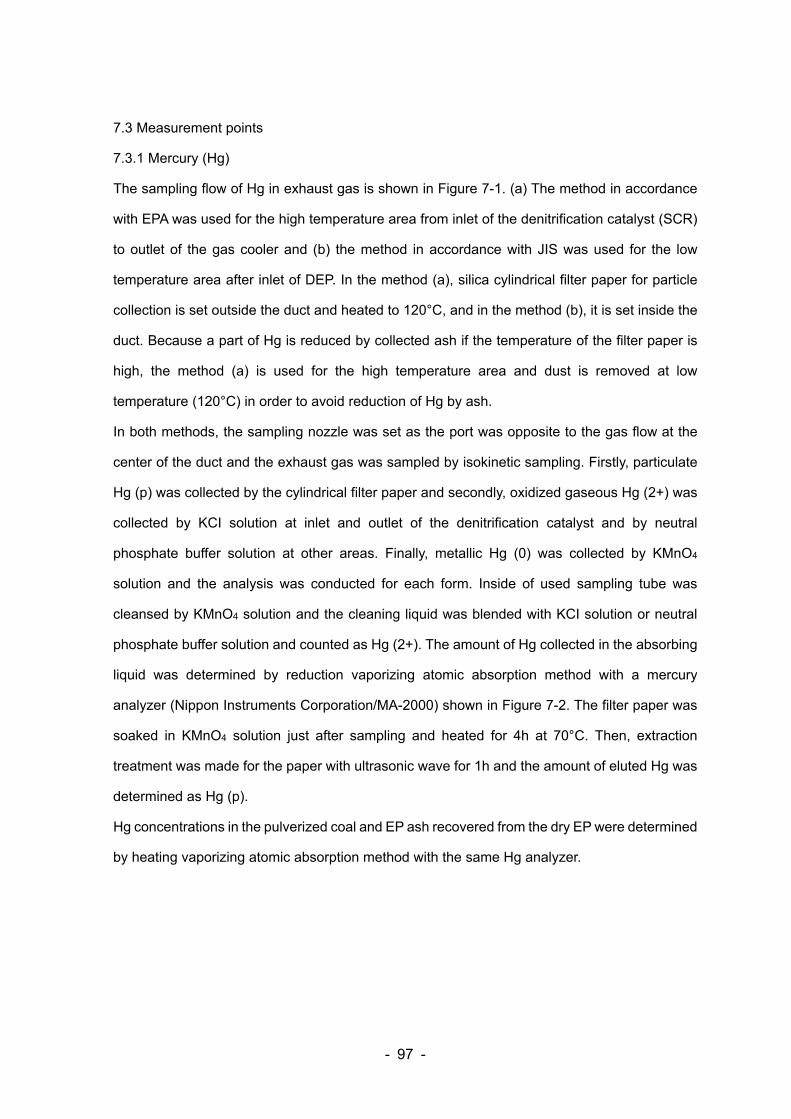
- 97 -
7.3 Measurement points
7.3.1 Mercury (Hg)
The sampling flow of Hg in exhaust gas is shown in Figure 7-1. (a) The method in accordance
with EPA was used for the high temperature area from inlet of the denitrification catalyst (SCR)
to outlet of the gas cooler and (b) the method in accordance with JIS was used for the low
temperature area after inlet of DEP. In the method (a), silica cylindrical filter paper for particle
collection is set outside the duct and heated to 120°C, and in the method (b), it is set inside the
duct. Because a part of Hg is reduced by collected ash if the temperature of the filter paper is
high, the method (a) is used for the high temperature area and dust is removed at low
temperature (120°C) in order to avoid reduction of Hg by ash.
In both methods, the sampling nozzle was set as the port was opposite to the gas flow at the
center of the duct and the exhaust gas was sampled by isokinetic sampling. Firstly, particulate
Hg (p) was collected by the cylindrical filter paper and secondly, oxidized gaseous Hg (2+) was
collected by KCI solution at inlet and outlet of the denitrification catalyst and by neutral
phosphate buffer solution at other areas. Finally, metallic Hg (0) was collected by KMnO4
solution and the analysis was conducted for each form. Inside of used sampling tube was
cleansed by KMnO4 solution and the cleaning liquid was blended with KCI solution or neutral
phosphate buffer solution and counted as Hg (2+). The amount of Hg collected in the absorbing
liquid was determined by reduction vaporizing atomic absorption method with a mercury
analyzer (Nippon Instruments Corporation/MA-2000) shown in Figure 7-2. The filter paper was
soaked in KMnO4 solution just after sampling and heated for 4h at 70°C. Then, extraction
treatment was made for the paper with ultrasonic wave for 1h and the amount of eluted Hg was
determined as Hg (p).
Hg concentrations in the pulverized coal and EP ash recovered from the dry EP were determined
by heating vaporizing atomic absorption method with the same Hg analyzer.
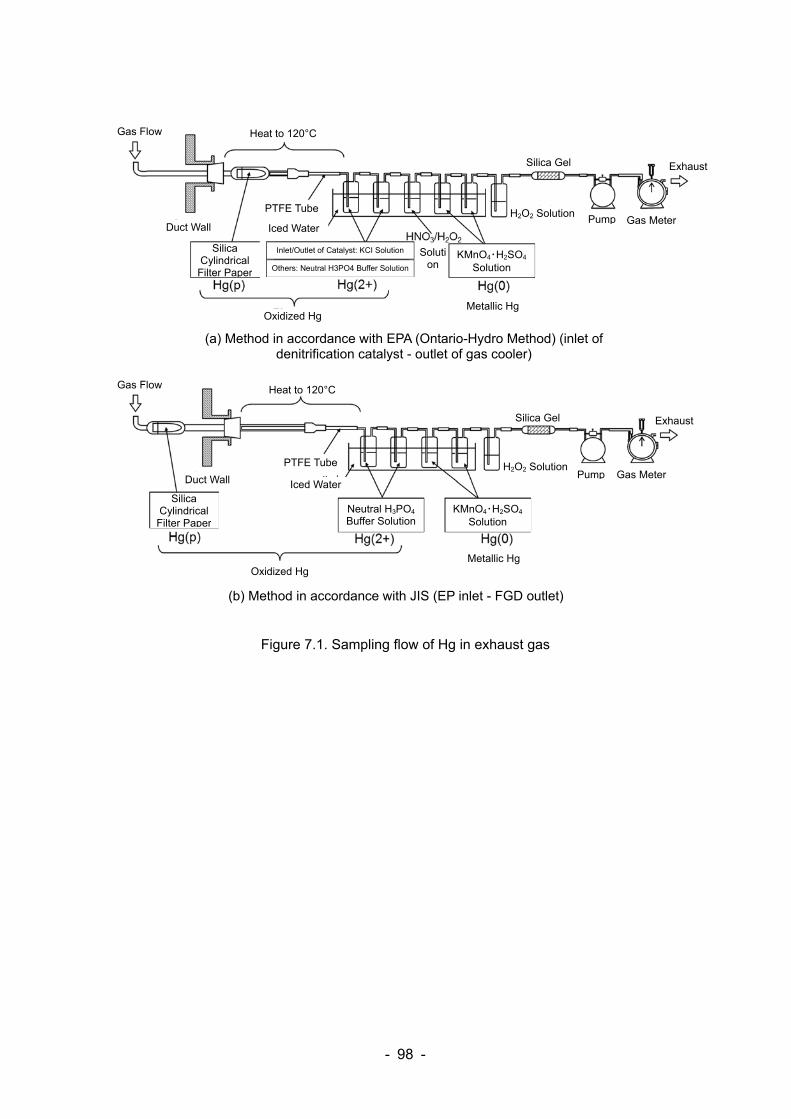
- 98 -
Figure 7.1. Sampling flow of Hg in exhaust gas
Gas Flow
Metallic Hg
(a) Method in accordance with EPA (Ontario-Hydro Method) (inlet of denitrification catalyst - outlet of gas cooler)
Gas Flow
Duct Wall
Duct Wall
Heat to 120°C
Heat to 120°C
Silica Cylindrical
Filter Paper
Silica Cylindrical
Filter Paper
PTFE Tube
PTFE Tube
Iced Water
Iced Water
Inlet/Outlet of Catalyst: KCI Solution
Others: Neutral H3PO4 Buffer Solution
Oxidized Hg
Oxidized Hg
Solution
Silica Gel
H2O2 Solution
Metallic Hg
KMnO4・H2SO4 Solution
KMnO4・H2SO4 Solution
H2O2 Solution
Silica Gel
Gas Flow
Exhaust
Gas MeterPump
Pump Gas Meter
Exhaust
(b) Method in accordance with JIS (EP inlet - FGD outlet)
Neutral H3PO4 Buffer Solution
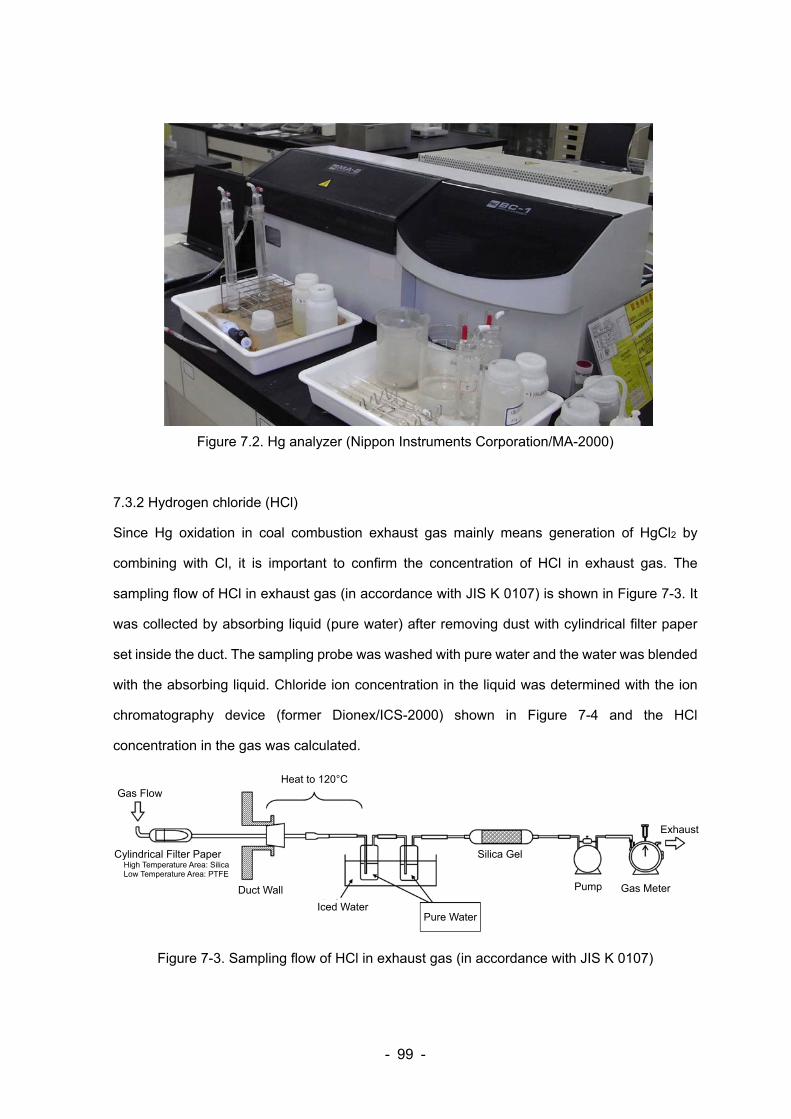
- 99 -
Figure 7.2. Hg analyzer (Nippon Instruments Corporation/MA-2000)
7.3.2 Hydrogen chloride (HCl)
Since Hg oxidation in coal combustion exhaust gas mainly means generation of HgCl2 by
combining with Cl, it is important to confirm the concentration of HCl in exhaust gas. The
sampling flow of HCl in exhaust gas (in accordance with JIS K 0107) is shown in Figure 7-3. It
was collected by absorbing liquid (pure water) after removing dust with cylindrical filter paper
set inside the duct. The sampling probe was washed with pure water and the water was blended
with the absorbing liquid. Chloride ion concentration in the liquid was determined with the ion
chromatography device (former Dionex/ICS-2000) shown in Figure 7-4 and the HCl
concentration in the gas was calculated.
Figure 7-3. Sampling flow of HCl in exhaust gas (in accordance with JIS K 0107)
Duct Wall
Heat to 120°C
Pure WaterIced Water
Silica Gel
Gas Flow
Exhaust
Gas MeterPump
Cylindrical Filter Paper High Temperature Area: Silica Low Temperature Area: PTFE
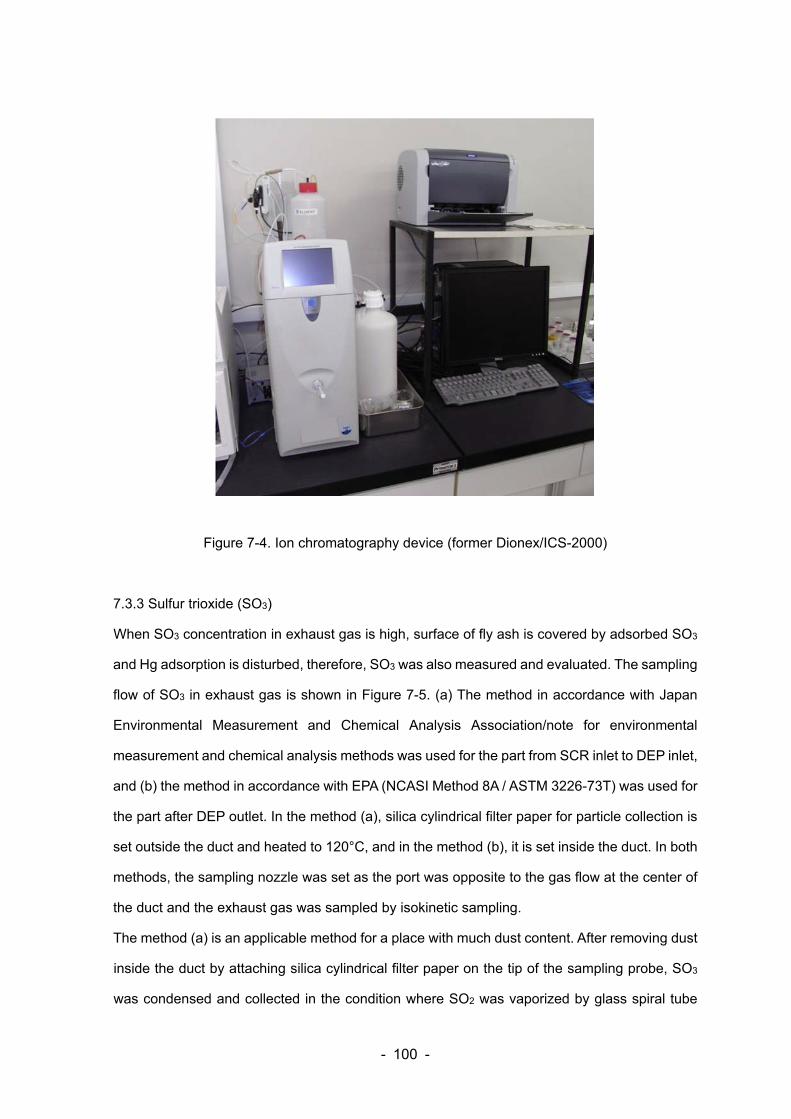
- 100 -
Figure 7-4. Ion chromatography device (former Dionex/ICS-2000)
7.3.3 Sulfur trioxide (SO3)
When SO3 concentration in exhaust gas is high, surface of fly ash is covered by adsorbed SO3
and Hg adsorption is disturbed, therefore, SO3 was also measured and evaluated. The sampling
flow of SO3 in exhaust gas is shown in Figure 7-5. (a) The method in accordance with Japan
Environmental Measurement and Chemical Analysis Association/note for environmental
measurement and chemical analysis methods was used for the part from SCR inlet to DEP inlet,
and (b) the method in accordance with EPA (NCASI Method 8A / ASTM 3226-73T) was used for
the part after DEP outlet. In the method (a), silica cylindrical filter paper for particle collection is
set outside the duct and heated to 120°C, and in the method (b), it is set inside the duct. In both
methods, the sampling nozzle was set as the port was opposite to the gas flow at the center of
the duct and the exhaust gas was sampled by isokinetic sampling.
The method (a) is an applicable method for a place with much dust content. After removing dust
inside the duct by attaching silica cylindrical filter paper on the tip of the sampling probe, SO3
was condensed and collected in the condition where SO2 was vaporized by glass spiral tube
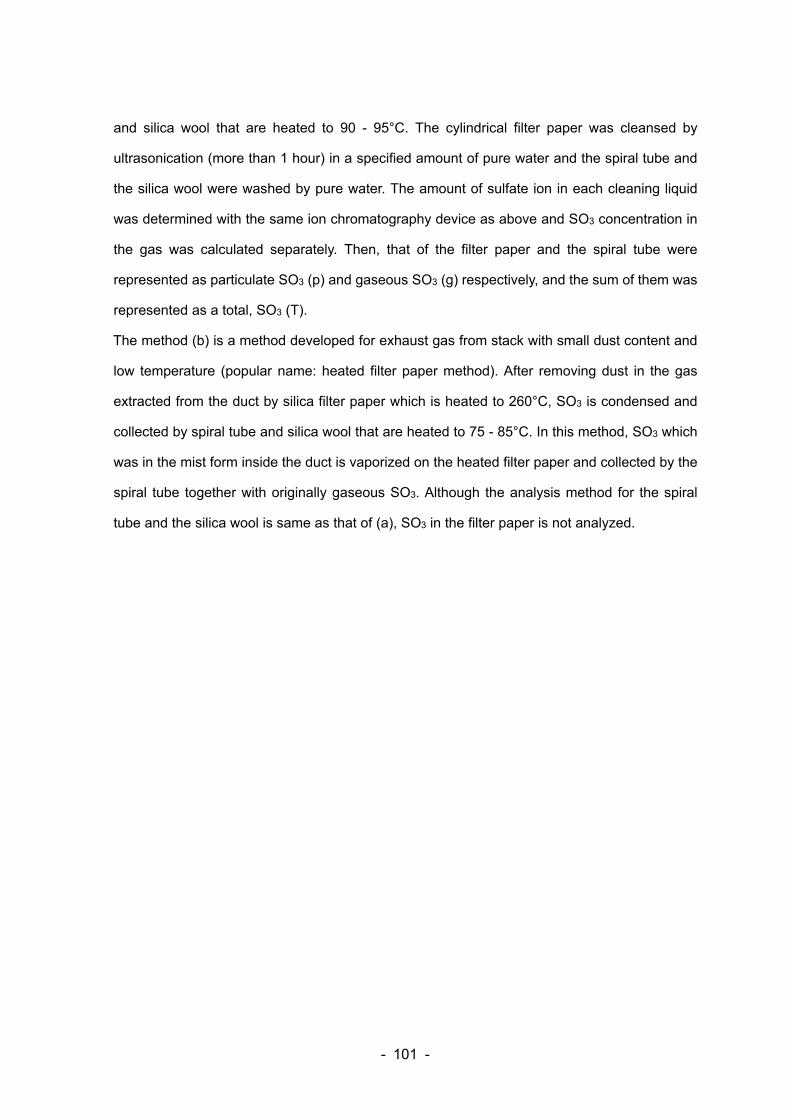
- 101 -
and silica wool that are heated to 90 - 95°C. The cylindrical filter paper was cleansed by
ultrasonication (more than 1 hour) in a specified amount of pure water and the spiral tube and
the silica wool were washed by pure water. The amount of sulfate ion in each cleaning liquid
was determined with the same ion chromatography device as above and SO3 concentration in
the gas was calculated separately. Then, that of the filter paper and the spiral tube were
represented as particulate SO3 (p) and gaseous SO3 (g) respectively, and the sum of them was
represented as a total, SO3 (T).
The method (b) is a method developed for exhaust gas from stack with small dust content and
low temperature (popular name: heated filter paper method). After removing dust in the gas
extracted from the duct by silica filter paper which is heated to 260°C, SO3 is condensed and
collected by spiral tube and silica wool that are heated to 75 - 85°C. In this method, SO3 which
was in the mist form inside the duct is vaporized on the heated filter paper and collected by the
spiral tube together with originally gaseous SO3. Although the analysis method for the spiral
tube and the silica wool is same as that of (a), SO3 in the filter paper is not analyzed.
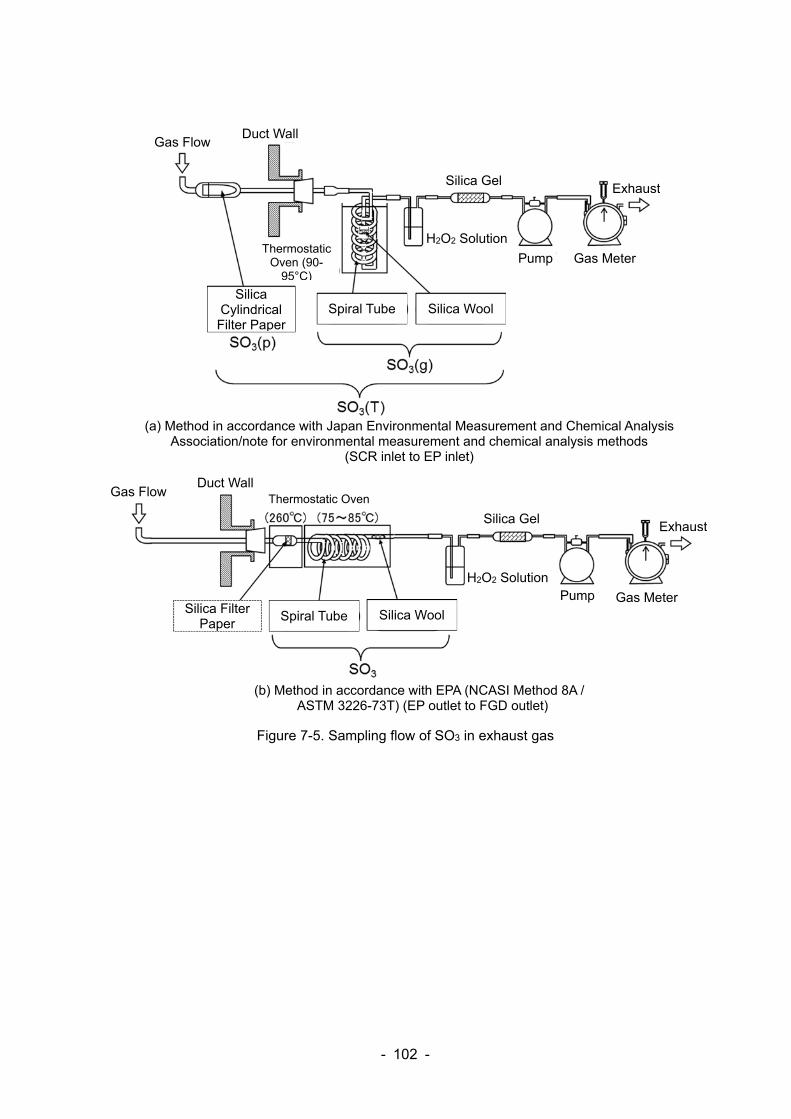
- 102 -
Figure 7-5. Sampling flow of SO3 in exhaust gas
Duct Wall
Thermostatic Oven (90-
95°C)
Silica Cylindrical Filter Paper
Silica Gel
H2O2 Solution
Gas Flow
Exhaust
Gas Meter Pump
Gas Flow Duct Wall
ExhaustSilica Gel
Pump Gas Meter
H2O2 Solution
(a) Method in accordance with Japan Environmental Measurement and Chemical Analysis Association/note for environmental measurement and chemical analysis methods
(SCR inlet to EP inlet)
Spiral Tube
Thermostatic Oven
Silica Wool
Spiral Tube Silica WoolSilica Filter Paper
(b) Method in accordance with EPA (NCASI Method 8A / ASTM 3226-73T) (EP outlet to FGD outlet)
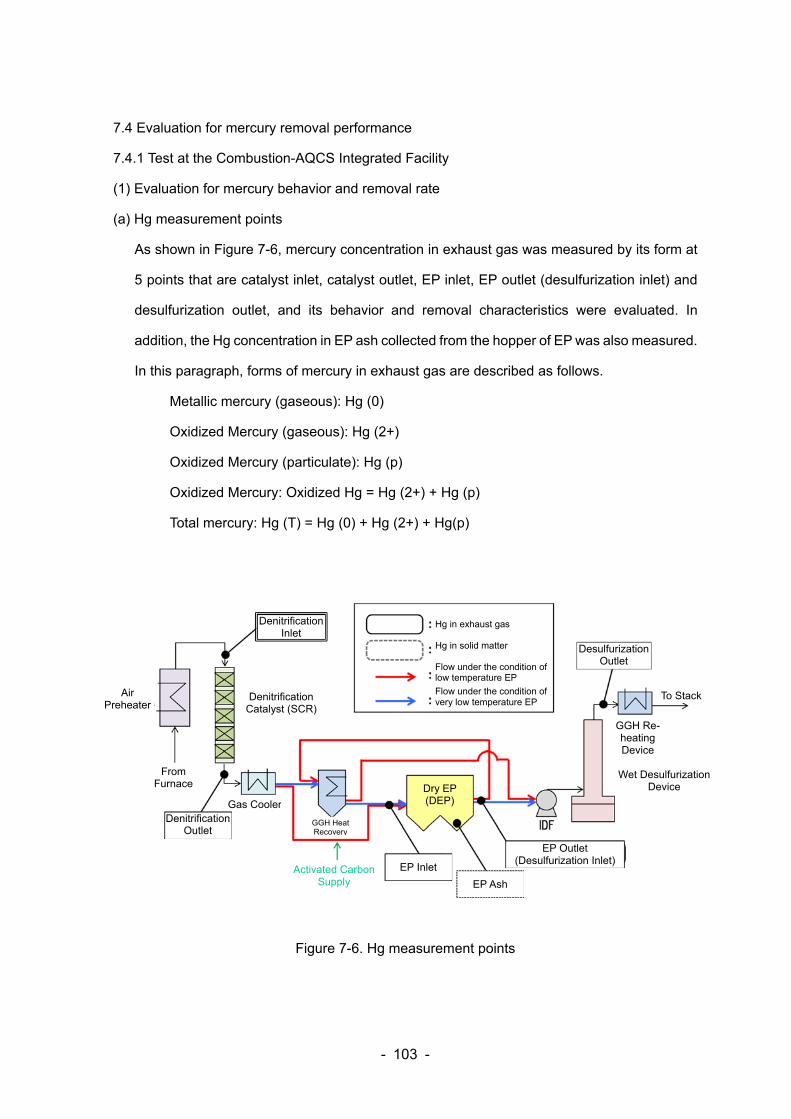
- 103 -
7.4 Evaluation for mercury removal performance
7.4.1 Test at the Combustion-AQCS Integrated Facility
(1) Evaluation for mercury behavior and removal rate
(a) Hg measurement points
As shown in Figure 7-6, mercury concentration in exhaust gas was measured by its form at
5 points that are catalyst inlet, catalyst outlet, EP inlet, EP outlet (desulfurization inlet) and
desulfurization outlet, and its behavior and removal characteristics were evaluated. In
addition, the Hg concentration in EP ash collected from the hopper of EP was also measured.
In this paragraph, forms of mercury in exhaust gas are described as follows.
Metallic mercury (gaseous): Hg (0)
Oxidized Mercury (gaseous): Hg (2+)
Oxidized Mercury (particulate): Hg (p)
Oxidized Mercury: Oxidized Hg = Hg (2+) + Hg (p)
Total mercury: Hg (T) = Hg (0) + Hg (2+) + Hg(p)
Figure 7-6. Hg measurement points
Air Preheater
From Furnace
Hg in exhaust gas Hg in solid matter Flow under the condition of low temperature EP
Flow under the condition of very low temperature EP
Gas Cooler Denitrification
Outlet
Denitrification Catalyst (SCR)
Denitrification Inlet
GGH Re-heating Device
To Stack
Wet Desulfurization Device
GGH Heat Recovery
Dry EP (DEP)
Activated Carbon Supply
Desulfurization Outlet
EP Inlet
EP Outlet (Desulfurization Inlet)
EP Ash
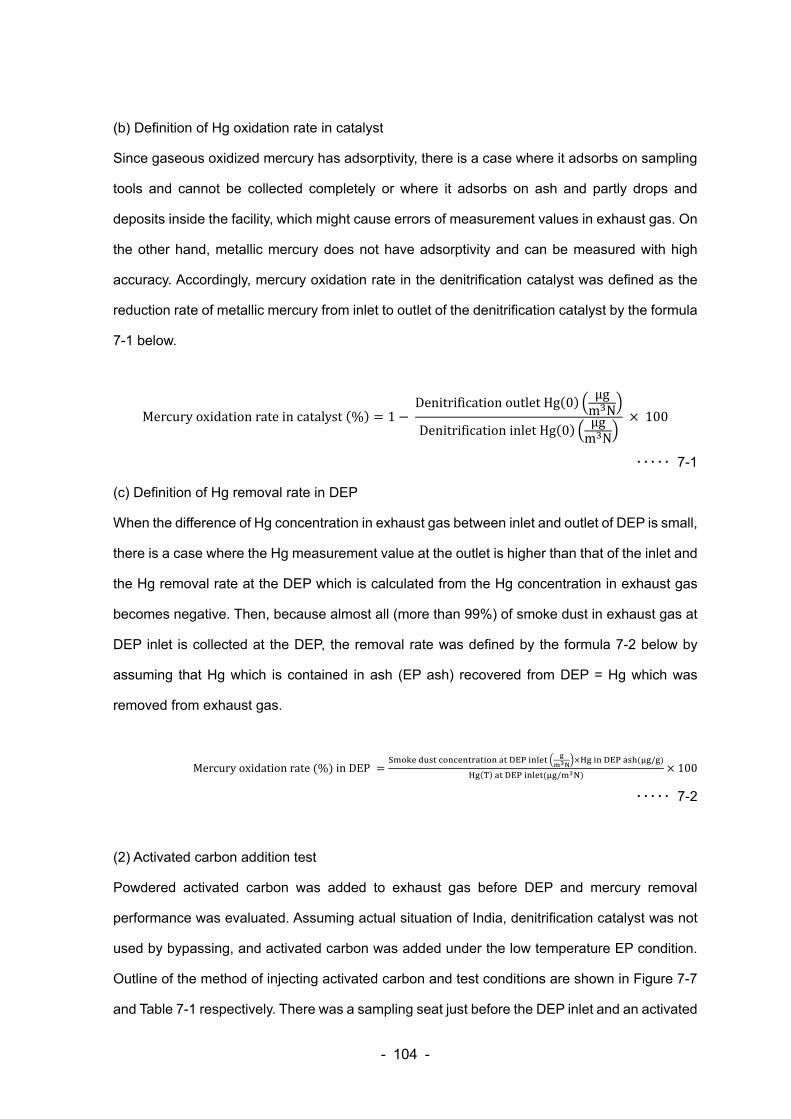
- 104 -
(b) Definition of Hg oxidation rate in catalyst
Since gaseous oxidized mercury has adsorptivity, there is a case where it adsorbs on sampling
tools and cannot be collected completely or where it adsorbs on ash and partly drops and
deposits inside the facility, which might cause errors of measurement values in exhaust gas. On
the other hand, metallic mercury does not have adsorptivity and can be measured with high
accuracy. Accordingly, mercury oxidation rate in the denitrification catalyst was defined as the
reduction rate of metallic mercury from inlet to outlet of the denitrification catalyst by the formula
7-1 below.
Mercuryoxidationrateincatalyst % 1 DenitrificationoutletHg 0
μgm N
DenitrificationinletHg 0μgm N
100
・・・・・ 7-1
(c) Definition of Hg removal rate in DEP
When the difference of Hg concentration in exhaust gas between inlet and outlet of DEP is small,
there is a case where the Hg measurement value at the outlet is higher than that of the inlet and
the Hg removal rate at the DEP which is calculated from the Hg concentration in exhaust gas
becomes negative. Then, because almost all (more than 99%) of smoke dust in exhaust gas at
DEP inlet is collected at the DEP, the removal rate was defined by the formula 7-2 below by
assuming that Hg which is contained in ash (EP ash) recovered from DEP = Hg which was
removed from exhaust gas.
Mercuryoxidationrate % inDEP /
/100
・・・・・ 7-2
(2) Activated carbon addition test
Powdered activated carbon was added to exhaust gas before DEP and mercury removal
performance was evaluated. Assuming actual situation of India, denitrification catalyst was not
used by bypassing, and activated carbon was added under the low temperature EP condition.
Outline of the method of injecting activated carbon and test conditions are shown in Figure 7-7
and Table 7-1 respectively. There was a sampling seat just before the DEP inlet and an activated
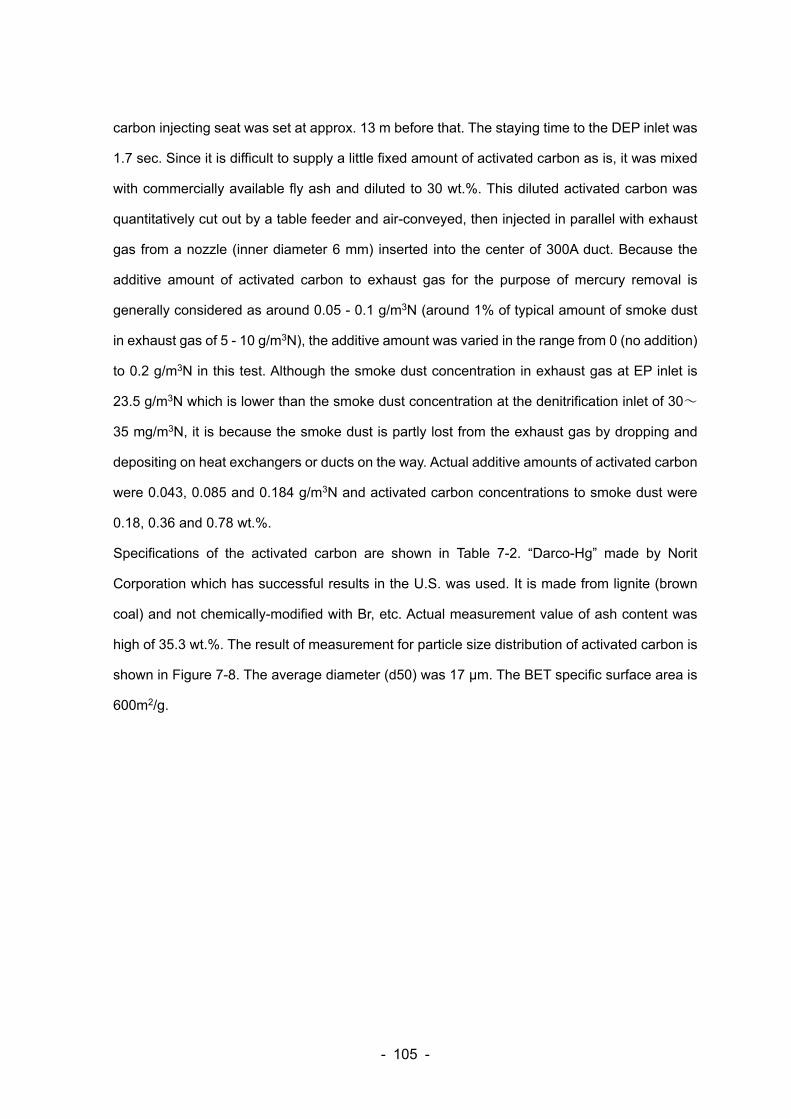
- 105 -
carbon injecting seat was set at approx. 13 m before that. The staying time to the DEP inlet was
1.7 sec. Since it is difficult to supply a little fixed amount of activated carbon as is, it was mixed
with commercially available fly ash and diluted to 30 wt.%. This diluted activated carbon was
quantitatively cut out by a table feeder and air-conveyed, then injected in parallel with exhaust
gas from a nozzle (inner diameter 6 mm) inserted into the center of 300A duct. Because the
additive amount of activated carbon to exhaust gas for the purpose of mercury removal is
generally considered as around 0.05 - 0.1 g/m3N (around 1% of typical amount of smoke dust
in exhaust gas of 5 - 10 g/m3N), the additive amount was varied in the range from 0 (no addition)
to 0.2 g/m3N in this test. Although the smoke dust concentration in exhaust gas at EP inlet is
23.5 g/m3N which is lower than the smoke dust concentration at the denitrification inlet of 30~
35 mg/m3N, it is because the smoke dust is partly lost from the exhaust gas by dropping and
depositing on heat exchangers or ducts on the way. Actual additive amounts of activated carbon
were 0.043, 0.085 and 0.184 g/m3N and activated carbon concentrations to smoke dust were
0.18, 0.36 and 0.78 wt.%.
Specifications of the activated carbon are shown in Table 7-2. “Darco-Hg” made by Norit
Corporation which has successful results in the U.S. was used. It is made from lignite (brown
coal) and not chemically-modified with Br, etc. Actual measurement value of ash content was
high of 35.3 wt.%. The result of measurement for particle size distribution of activated carbon is
shown in Figure 7-8. The average diameter (d50) was 17 μm. The BET specific surface area is
600m2/g.
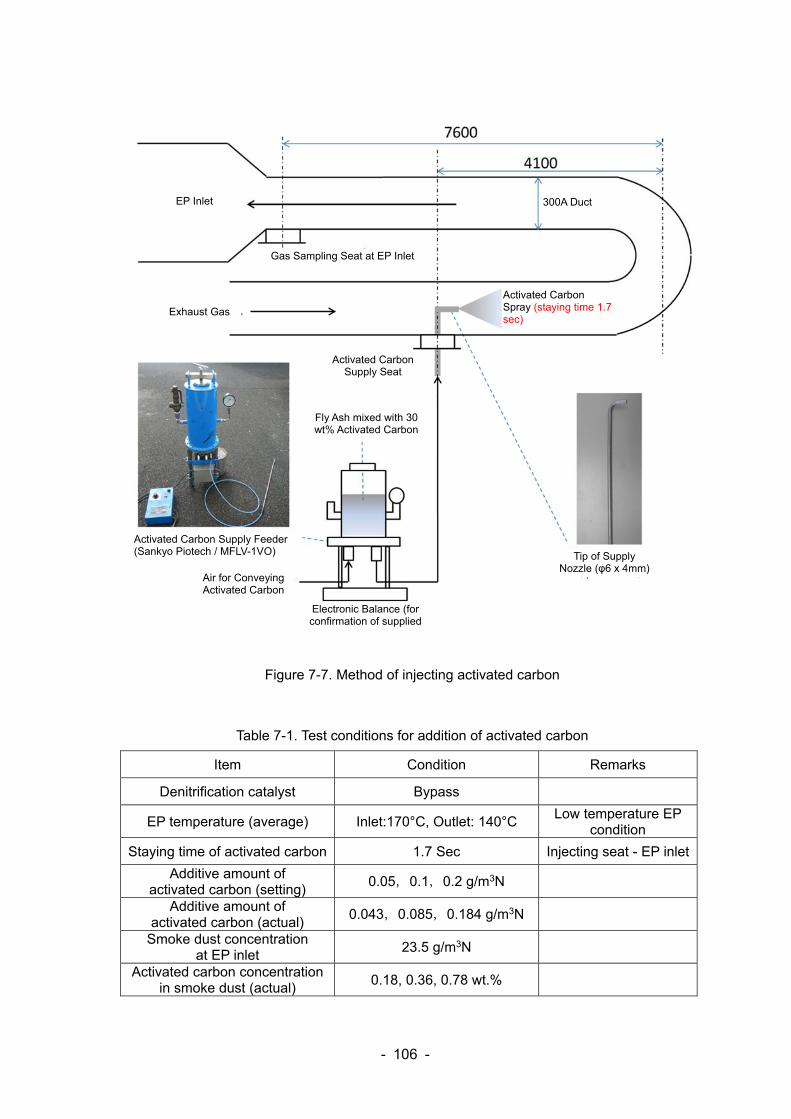
- 106 -
Figure 7-7. Method of injecting activated carbon
Table 7-1. Test conditions for addition of activated carbon
Item Condition Remarks
Denitrification catalyst Bypass
EP temperature (average) Inlet:170°C, Outlet: 140°C Low temperature EP
condition
Staying time of activated carbon 1.7 Sec Injecting seat - EP inlet
Additive amount of activated carbon (setting)
0.05,0.1,0.2 g/m3N
Additive amount of activated carbon (actual)
0.043,0.085,0.184 g/m3N
Smoke dust concentration at EP inlet
23.5 g/m3N
Activated carbon concentration in smoke dust (actual)
0.18, 0.36, 0.78 wt.%
Activated Carbon Spray (staying time 1.7 sec)
300A Duct
Gas Sampling Seat at EP Inlet
EP Inlet
Tip of Supply Nozzle (φ6 x 4mm)
Air for Conveying Activated Carbon
Activated Carbon Supply Feeder (Sankyo Piotech / MFLV-1VO)
Exhaust Gas
Activated Carbon Supply Seat
Electronic Balance (for confirmation of supplied
Fly Ash mixed with 30 wt% Activated Carbon
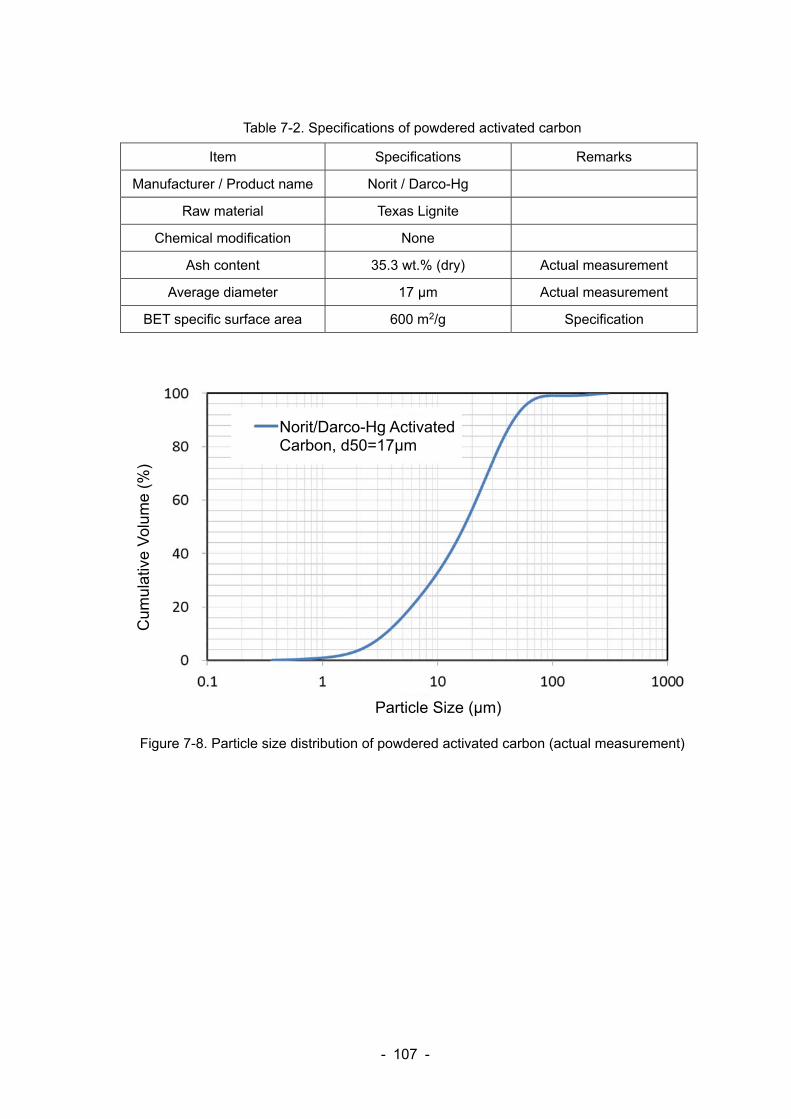
- 107 -
Table 7-2. Specifications of powdered activated carbon
Item Specifications Remarks
Manufacturer / Product name Norit / Darco-Hg
Raw material Texas Lignite
Chemical modification None
Ash content 35.3 wt.% (dry) Actual measurement
Average diameter 17 μm Actual measurement
BET specific surface area 600 m2/g Specification
Figure 7-8. Particle size distribution of powdered activated carbon (actual measurement)
Norit/Darco-Hg Activated Carbon, d50=17μm
Particle Size (μm)
Cum
ulat
ive
Vol
ume
(%)
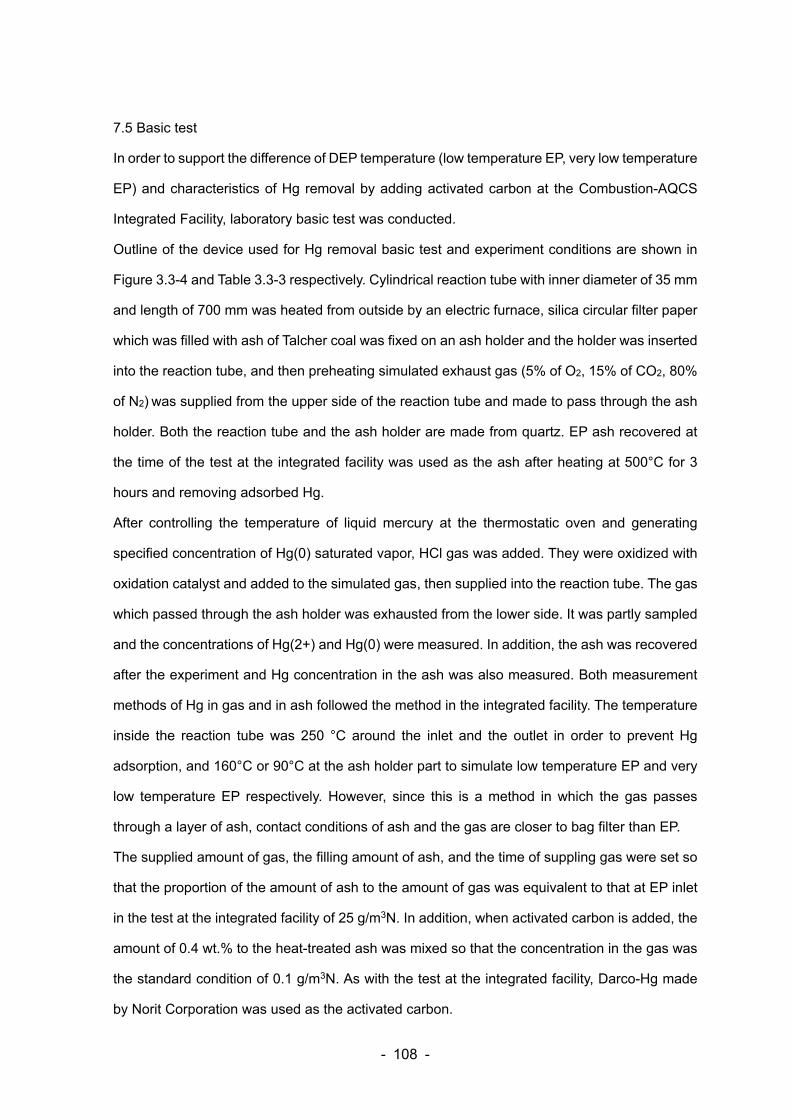
- 108 -
7.5 Basic test
In order to support the difference of DEP temperature (low temperature EP, very low temperature
EP) and characteristics of Hg removal by adding activated carbon at the Combustion-AQCS
Integrated Facility, laboratory basic test was conducted.
Outline of the device used for Hg removal basic test and experiment conditions are shown in
Figure 3.3-4 and Table 3.3-3 respectively. Cylindrical reaction tube with inner diameter of 35 mm
and length of 700 mm was heated from outside by an electric furnace, silica circular filter paper
which was filled with ash of Talcher coal was fixed on an ash holder and the holder was inserted
into the reaction tube, and then preheating simulated exhaust gas (5% of O2, 15% of CO2, 80%
of N2) was supplied from the upper side of the reaction tube and made to pass through the ash
holder. Both the reaction tube and the ash holder are made from quartz. EP ash recovered at
the time of the test at the integrated facility was used as the ash after heating at 500°C for 3
hours and removing adsorbed Hg.
After controlling the temperature of liquid mercury at the thermostatic oven and generating
specified concentration of Hg(0) saturated vapor, HCl gas was added. They were oxidized with
oxidation catalyst and added to the simulated gas, then supplied into the reaction tube. The gas
which passed through the ash holder was exhausted from the lower side. It was partly sampled
and the concentrations of Hg(2+) and Hg(0) were measured. In addition, the ash was recovered
after the experiment and Hg concentration in the ash was also measured. Both measurement
methods of Hg in gas and in ash followed the method in the integrated facility. The temperature
inside the reaction tube was 250 °C around the inlet and the outlet in order to prevent Hg
adsorption, and 160°C or 90°C at the ash holder part to simulate low temperature EP and very
low temperature EP respectively. However, since this is a method in which the gas passes
through a layer of ash, contact conditions of ash and the gas are closer to bag filter than EP.
The supplied amount of gas, the filling amount of ash, and the time of suppling gas were set so
that the proportion of the amount of ash to the amount of gas was equivalent to that at EP inlet
in the test at the integrated facility of 25 g/m3N. In addition, when activated carbon is added, the
amount of 0.4 wt.% to the heat-treated ash was mixed so that the concentration in the gas was
the standard condition of 0.1 g/m3N. As with the test at the integrated facility, Darco-Hg made
by Norit Corporation was used as the activated carbon.
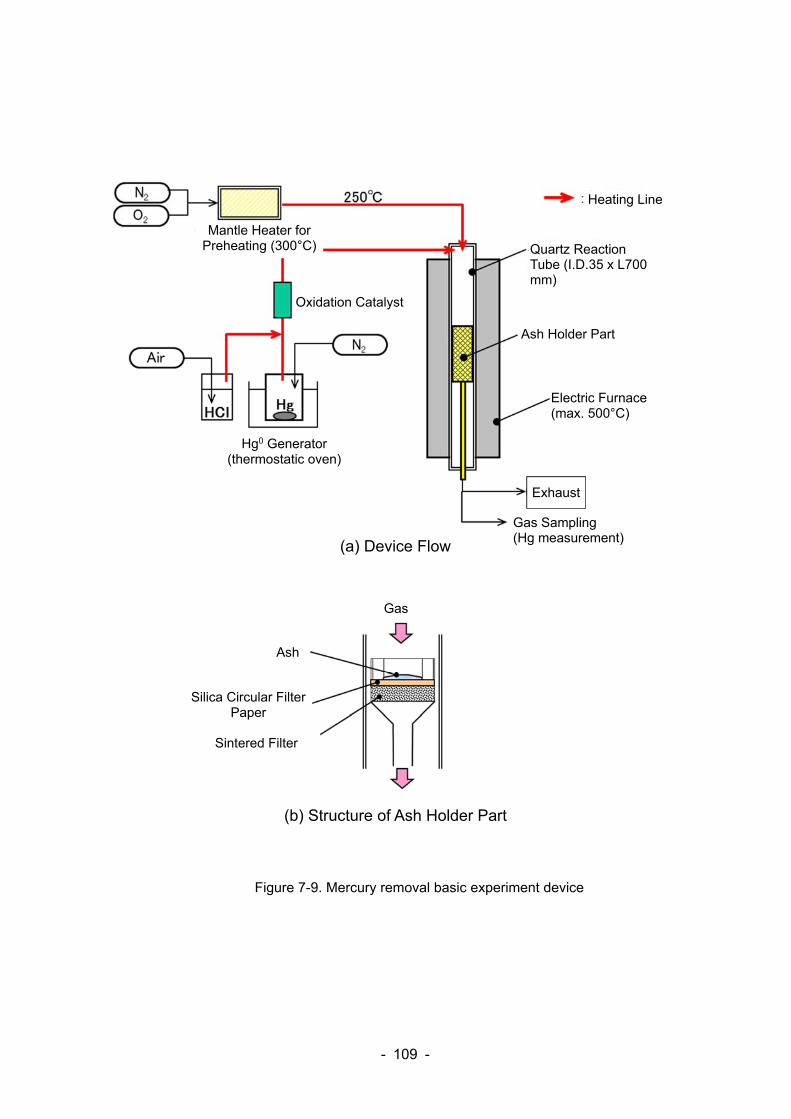
- 109 -
Figure 7-9. Mercury removal basic experiment device
Mantle Heater for Preheating (300°C)
Heating Line
(a) Device Flow
Electric Furnace (max. 500°C)
Ash Holder Part
Quartz Reaction Tube (I.D.35 x L700 mm)
Hg0 Generator (thermostatic oven)
Oxidation Catalyst
Gas Sampling (Hg measurement)
Exhaust
Sintered Filter
Silica Circular Filter Paper
Ash
Gas
(b) Structure of Ash Holder Part
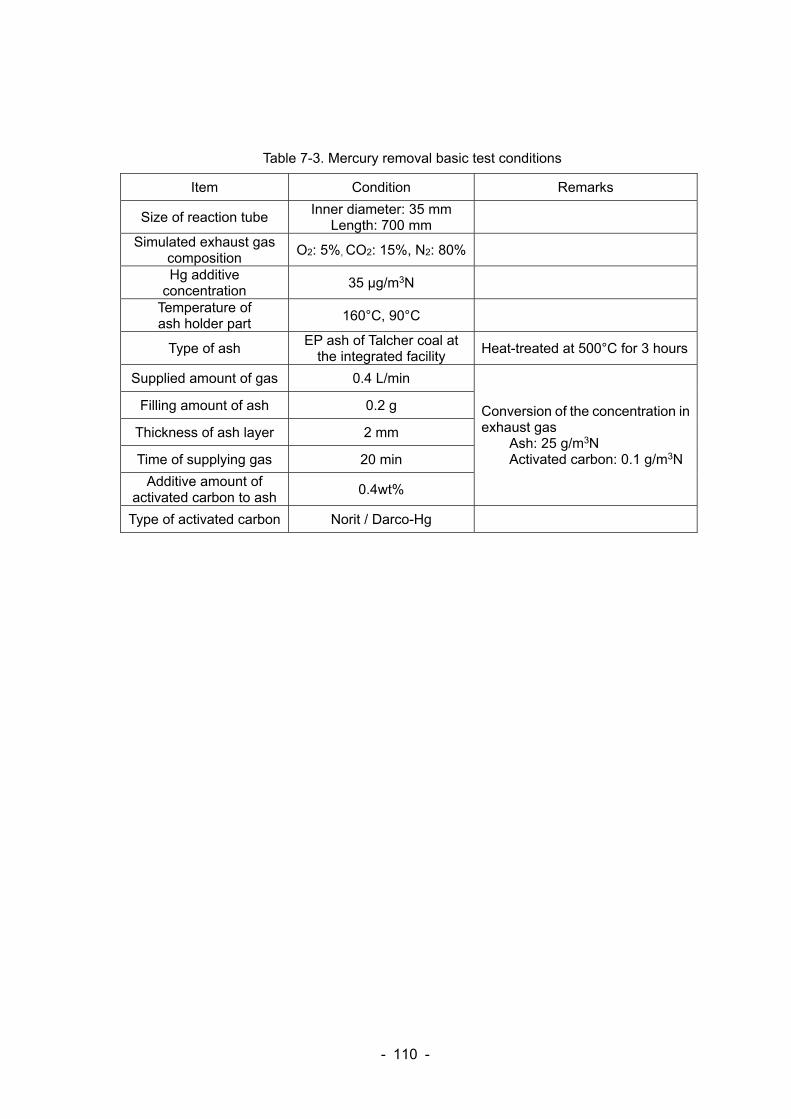
- 110 -
Table 7-3. Mercury removal basic test conditions
Item Condition Remarks
Size of reaction tube Inner diameter: 35 mm
Length: 700 mm
Simulated exhaust gas composition
O2: 5%, CO2: 15%, N2: 80%
Hg additive concentration
35 μg/m3N
Temperature of ash holder part
160°C, 90°C
Type of ash EP ash of Talcher coal at
the integrated facility Heat-treated at 500°C for 3 hours
Supplied amount of gas 0.4 L/min
Conversion of the concentration in exhaust gas
Ash: 25 g/m3N Activated carbon: 0.1 g/m3N
Filling amount of ash 0.2 g
Thickness of ash layer 2 mm
Time of supplying gas 20 min
Additive amount of activated carbon to ash
0.4wt%
Type of activated carbon Norit / Darco-Hg
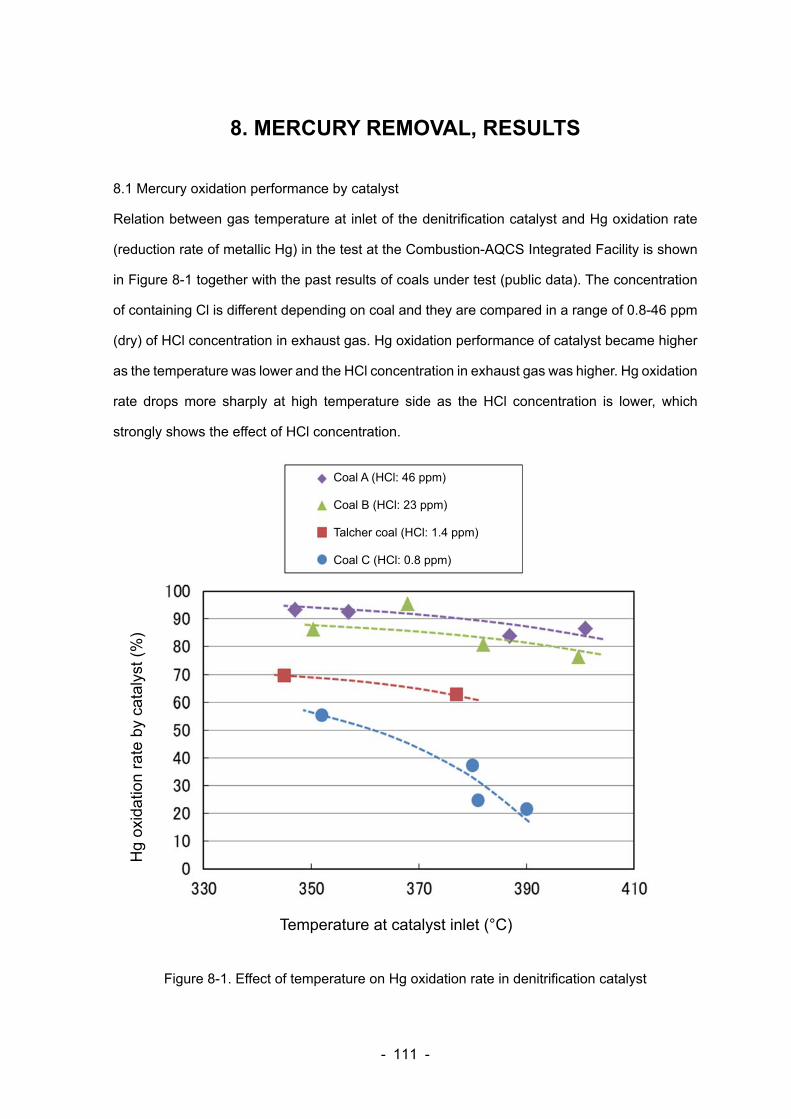
- 111 -
8. MERCURY REMOVAL, RESULTS
8.1 Mercury oxidation performance by catalyst
Relation between gas temperature at inlet of the denitrification catalyst and Hg oxidation rate
(reduction rate of metallic Hg) in the test at the Combustion-AQCS Integrated Facility is shown
in Figure 8-1 together with the past results of coals under test (public data). The concentration
of containing Cl is different depending on coal and they are compared in a range of 0.8-46 ppm
(dry) of HCl concentration in exhaust gas. Hg oxidation performance of catalyst became higher
as the temperature was lower and the HCl concentration in exhaust gas was higher. Hg oxidation
rate drops more sharply at high temperature side as the HCl concentration is lower, which
strongly shows the effect of HCl concentration.
Figure 8-1. Effect of temperature on Hg oxidation rate in denitrification catalyst
Temperature at catalyst inlet (°C)
Coal A (HCl: 46 ppm) Coal B (HCl: 23 ppm) Talcher coal (HCl: 1.4 ppm) Coal C (HCl: 0.8 ppm)
Hg
oxid
atio
n ra
te b
y ca
taly
st (
%)
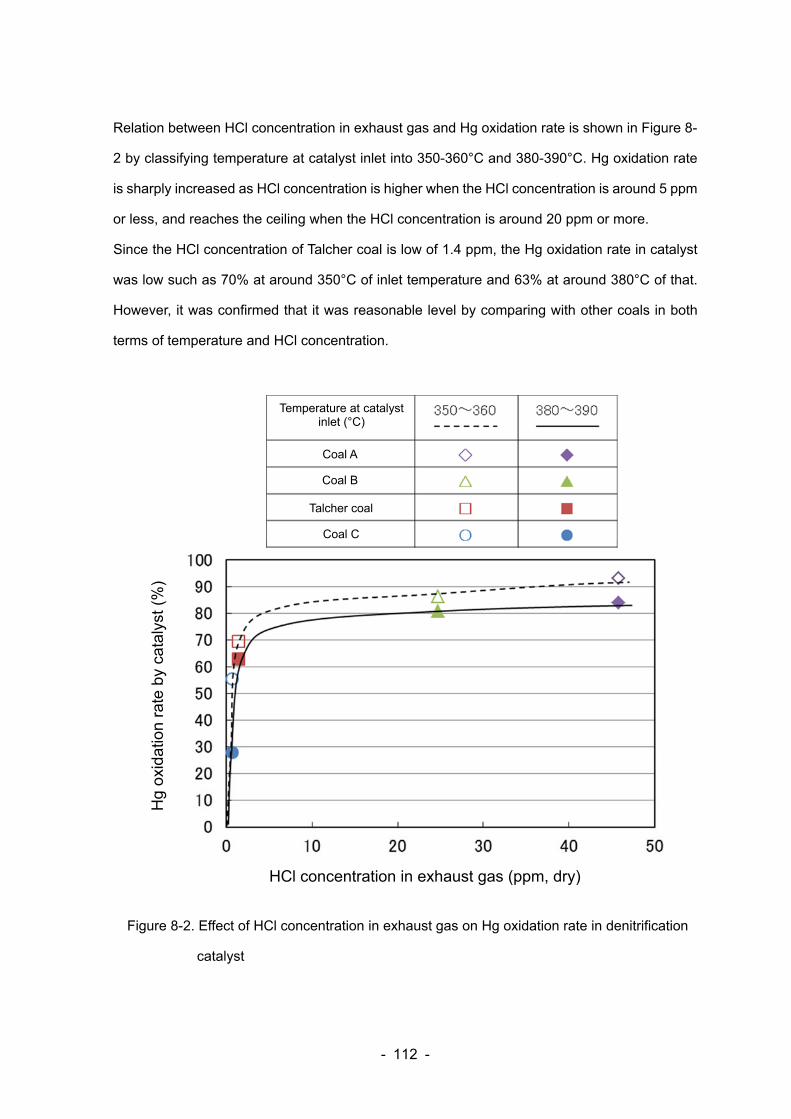
- 112 -
Relation between HCl concentration in exhaust gas and Hg oxidation rate is shown in Figure 8-
2 by classifying temperature at catalyst inlet into 350-360°C and 380-390°C. Hg oxidation rate
is sharply increased as HCl concentration is higher when the HCl concentration is around 5 ppm
or less, and reaches the ceiling when the HCl concentration is around 20 ppm or more.
Since the HCl concentration of Talcher coal is low of 1.4 ppm, the Hg oxidation rate in catalyst
was low such as 70% at around 350°C of inlet temperature and 63% at around 380°C of that.
However, it was confirmed that it was reasonable level by comparing with other coals in both
terms of temperature and HCl concentration.
Figure 8-2. Effect of HCl concentration in exhaust gas on Hg oxidation rate in denitrification
catalyst
Temperature at catalyst inlet (°C)
Hg
oxid
atio
n ra
te b
y ca
taly
st (
%)
HCl concentration in exhaust gas (ppm, dry)
Coal A
Coal C
Talcher coal
Coal B
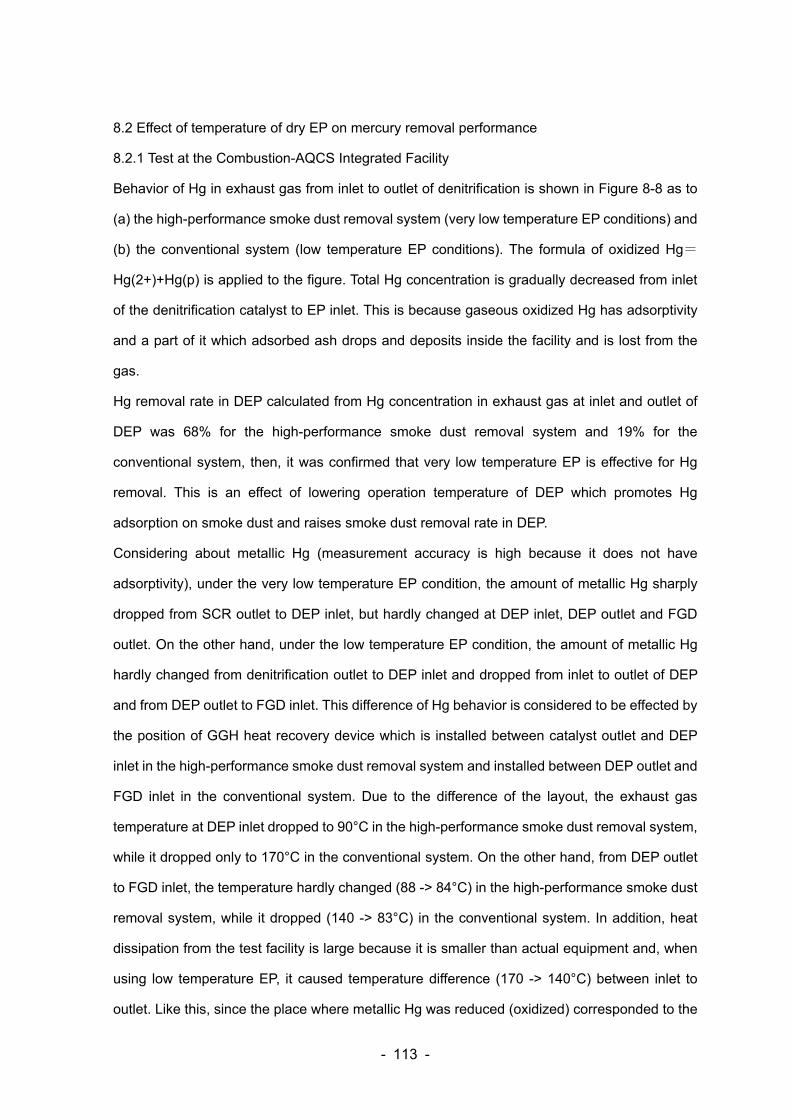
- 113 -
8.2 Effect of temperature of dry EP on mercury removal performance
8.2.1 Test at the Combustion-AQCS Integrated Facility
Behavior of Hg in exhaust gas from inlet to outlet of denitrification is shown in Figure 8-8 as to
(a) the high-performance smoke dust removal system (very low temperature EP conditions) and
(b) the conventional system (low temperature EP conditions). The formula of oxidized Hg=
Hg(2+)+Hg(p) is applied to the figure. Total Hg concentration is gradually decreased from inlet
of the denitrification catalyst to EP inlet. This is because gaseous oxidized Hg has adsorptivity
and a part of it which adsorbed ash drops and deposits inside the facility and is lost from the
gas.
Hg removal rate in DEP calculated from Hg concentration in exhaust gas at inlet and outlet of
DEP was 68% for the high-performance smoke dust removal system and 19% for the
conventional system, then, it was confirmed that very low temperature EP is effective for Hg
removal. This is an effect of lowering operation temperature of DEP which promotes Hg
adsorption on smoke dust and raises smoke dust removal rate in DEP.
Considering about metallic Hg (measurement accuracy is high because it does not have
adsorptivity), under the very low temperature EP condition, the amount of metallic Hg sharply
dropped from SCR outlet to DEP inlet, but hardly changed at DEP inlet, DEP outlet and FGD
outlet. On the other hand, under the low temperature EP condition, the amount of metallic Hg
hardly changed from denitrification outlet to DEP inlet and dropped from inlet to outlet of DEP
and from DEP outlet to FGD inlet. This difference of Hg behavior is considered to be effected by
the position of GGH heat recovery device which is installed between catalyst outlet and DEP
inlet in the high-performance smoke dust removal system and installed between DEP outlet and
FGD inlet in the conventional system. Due to the difference of the layout, the exhaust gas
temperature at DEP inlet dropped to 90°C in the high-performance smoke dust removal system,
while it dropped only to 170°C in the conventional system. On the other hand, from DEP outlet
to FGD inlet, the temperature hardly changed (88 -> 84°C) in the high-performance smoke dust
removal system, while it dropped (140 -> 83°C) in the conventional system. In addition, heat
dissipation from the test facility is large because it is smaller than actual equipment and, when
using low temperature EP, it caused temperature difference (170 -> 140°C) between inlet to
outlet. Like this, since the place where metallic Hg was reduced (oxidized) corresponded to the

- 114 -
place where the exhaust gas temperature dropped, it was suggested that Hg oxidization is
promoted by lowering the exhaust gas temperature.
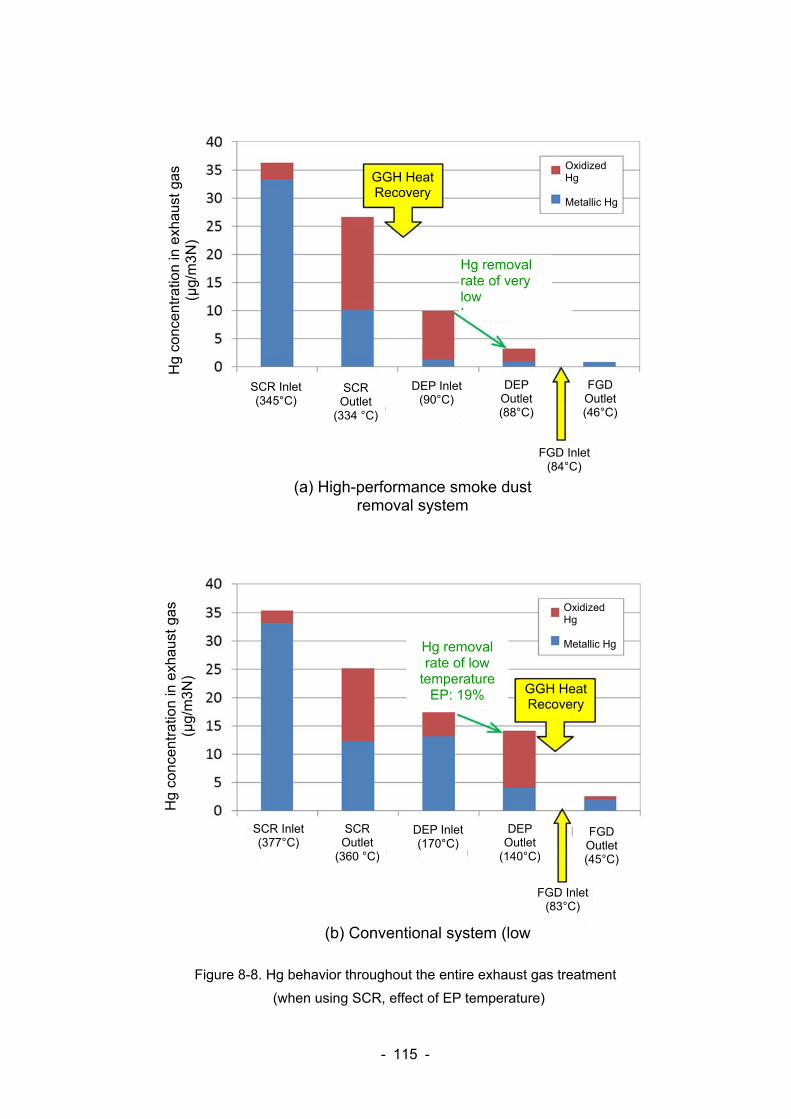
- 115 -
Figure 8-8. Hg behavior throughout the entire exhaust gas treatment
(when using SCR, effect of EP temperature)
Oxidized Hg Metallic Hg
SCR Inlet (345°C)
Hg
conc
entr
atio
n in
exh
aust
gas
(μ
g/m
3N
)
(a) High-performance smoke dust removal system
FGD Inlet (84°C)
FGD Outlet (46°C)
DEP Outlet (88°C)
DEP Inlet (90°C)
SCR Outlet
(334 °C)
GGH Heat Recovery
Hg removal rate of very low temperature
Hg removal rate of low
temperature EP: 19%
Oxidized Hg Metallic Hg
SCR Inlet (377°C)
Hg
conc
entr
atio
n in
exh
aust
gas
(μ
g/m
3N
)
(b) Conventional system (low
FGD Inlet (83°C)
FGD Outlet (45°C)
DEP Outlet
(140°C)
DEP Inlet (170°C)
SCR Outlet
(360 °C)
GGH Heat Recovery
- 116 -
With respect to Hg concentration at FGD outlet, in the high-performance smoke dust removal
system, it was mostly accounted for by metallic Hg and low level of 1 μg/m3N or less, and most
of oxidized Hg remaining in outlet of very low temperature EP was removed in FGD. On the
other hand, Hg concentration at FGD outlet in the conventional system was rather high of 2.5
μg/m3N. However, since metallic Hg does not dissolve in desulfurization absorbing liquid,
metallic Hg remaining in EP outlet is usually exhausted as is from FGD outlet, while 4 μg/m3N
of metallic Hg which existed at outlet of low temperature EP in the conventional system was
decreased to approx. half at FGD outlet. This also suggests that Hg oxidization was promoted
by lowering temperature from EP outlet to FGD inlet and as a result, it is considered that Hg
was removed by dissolving in FGD absorbing liquid as oxidized Hg. In addition, oxidized Hg
remained much more at outlet of low temperature EP than outlet of very low temperature EP.
This flows into FGD and it is inferred that Hg concentration in desulfurization absorbing liquid in
the conventional system is much higher than that in the high-performance smoke dust removal
system. When Hg concentration in desulfurization absorbing liquid becomes high, there is a risk
that Hg which once dissolved is reduced and reemitted depending on liquid conditions including
pH and concentration of sulfurous acid, and Hg concentration at FGD outlet is highly raised1),2).
Accordingly, high-performance smoke dust removal system using very low temperature EP can
reduce the final amount of exhaust Hg more reliably.
8.2.2 Basic test
In the test at the Combustion-AQCS Integrated Facility, the difference of Hg removal rate in DEP
between the conventional system and the high-performance smoke dust removal system was
considered to be caused by the difference of exhaust gas temperature in DEP. In order to verify
this, using the basic test device, the amount of Hg which adsorbed on coal ash was evaluated
by making the temperature of the holder part which holds coal ash be 2 conditions of low
temperature EP (160°C) and very low temperature EP (90°C). The results are shown in Figure
8-9. Hg concentration by chemical form under each condition was obtained by measuring Hg
concentration in the gas at outlet of the reaction tube and in coal ash after supplying gas.
Under the very low temperature EP condition, out of Hg detected at outlet of the device, the
amount of Hg which adsorbed on ash was 43% of the total Hg and higher than 2% of that under
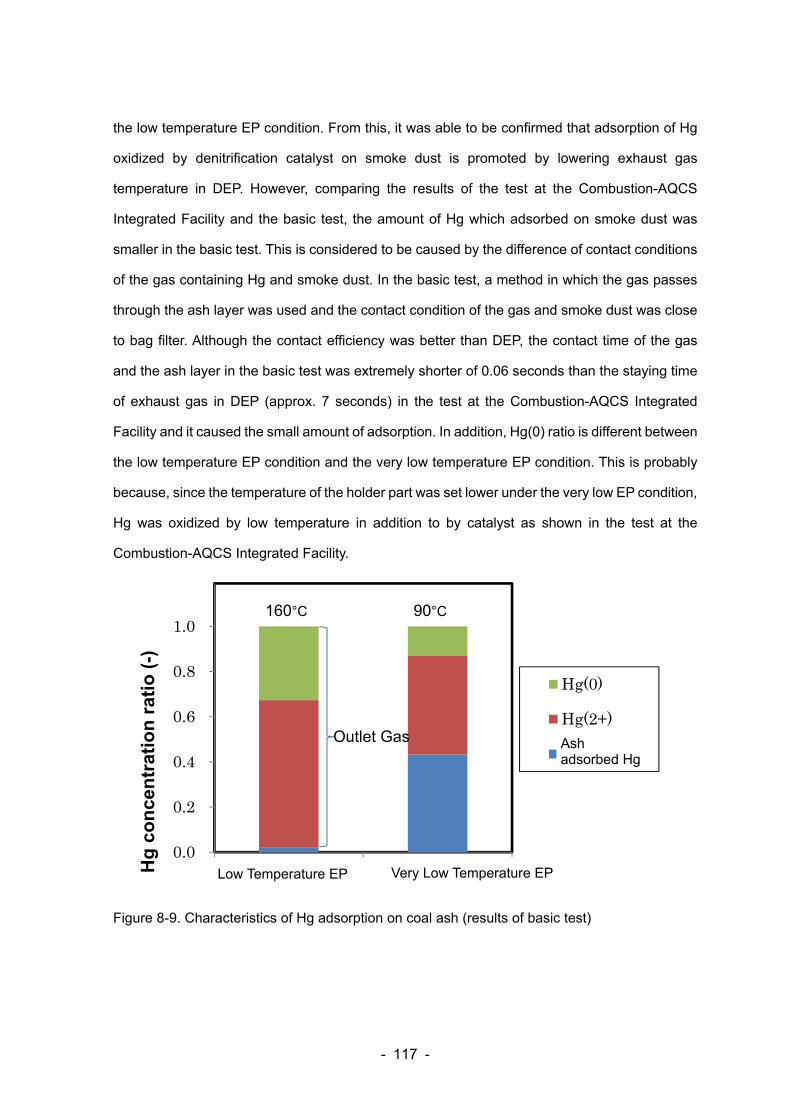
- 117 -
the low temperature EP condition. From this, it was able to be confirmed that adsorption of Hg
oxidized by denitrification catalyst on smoke dust is promoted by lowering exhaust gas
temperature in DEP. However, comparing the results of the test at the Combustion-AQCS
Integrated Facility and the basic test, the amount of Hg which adsorbed on smoke dust was
smaller in the basic test. This is considered to be caused by the difference of contact conditions
of the gas containing Hg and smoke dust. In the basic test, a method in which the gas passes
through the ash layer was used and the contact condition of the gas and smoke dust was close
to bag filter. Although the contact efficiency was better than DEP, the contact time of the gas
and the ash layer in the basic test was extremely shorter of 0.06 seconds than the staying time
of exhaust gas in DEP (approx. 7 seconds) in the test at the Combustion-AQCS Integrated
Facility and it caused the small amount of adsorption. In addition, Hg(0) ratio is different between
the low temperature EP condition and the very low temperature EP condition. This is probably
because, since the temperature of the holder part was set lower under the very low EP condition,
Hg was oxidized by low temperature in addition to by catalyst as shown in the test at the
Combustion-AQCS Integrated Facility.
Figure 8-9. Characteristics of Hg adsorption on coal ash (results of basic test)
0.0
0.2
0.4
0.6
0.8
1.0
低温EP 低低温EPHg
co
nce
ntr
atio
n r
atio
(-)
Hg(0)
Hg(2+)
灰吸着HgOutlet Gas
Very Low Temperature EP Low Temperature EP
Ash adsorbed Hg
160°C 90°C
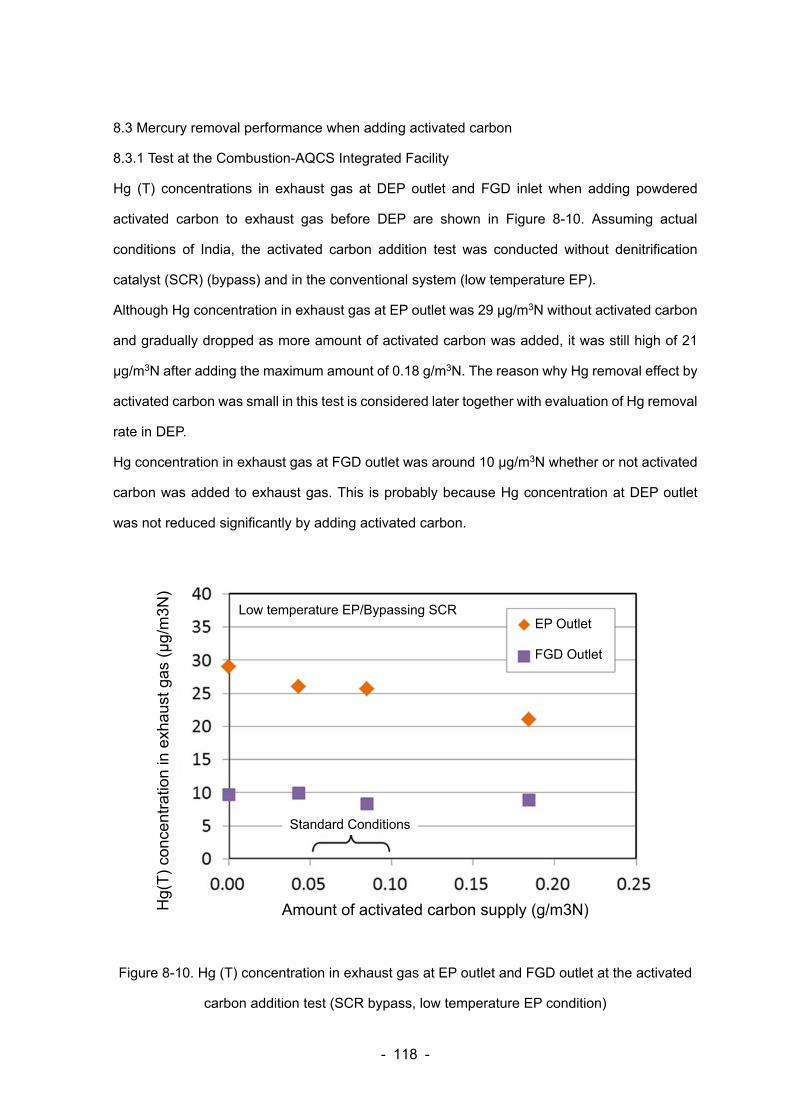
- 118 -
8.3 Mercury removal performance when adding activated carbon
8.3.1 Test at the Combustion-AQCS Integrated Facility
Hg (T) concentrations in exhaust gas at DEP outlet and FGD inlet when adding powdered
activated carbon to exhaust gas before DEP are shown in Figure 8-10. Assuming actual
conditions of India, the activated carbon addition test was conducted without denitrification
catalyst (SCR) (bypass) and in the conventional system (low temperature EP).
Although Hg concentration in exhaust gas at EP outlet was 29 μg/m3N without activated carbon
and gradually dropped as more amount of activated carbon was added, it was still high of 21
μg/m3N after adding the maximum amount of 0.18 g/m3N. The reason why Hg removal effect by
activated carbon was small in this test is considered later together with evaluation of Hg removal
rate in DEP.
Hg concentration in exhaust gas at FGD outlet was around 10 μg/m3N whether or not activated
carbon was added to exhaust gas. This is probably because Hg concentration at DEP outlet
was not reduced significantly by adding activated carbon.
Figure 8-10. Hg (T) concentration in exhaust gas at EP outlet and FGD outlet at the activated
carbon addition test (SCR bypass, low temperature EP condition)
EP Outlet FGD Outlet
Hg(
T)
conc
entr
atio
n in
exh
aust
gas
(μ
g/m
3N)
Low temperature EP/Bypassing SCR
Amount of activated carbon supply (g/m3N)
Standard Conditions
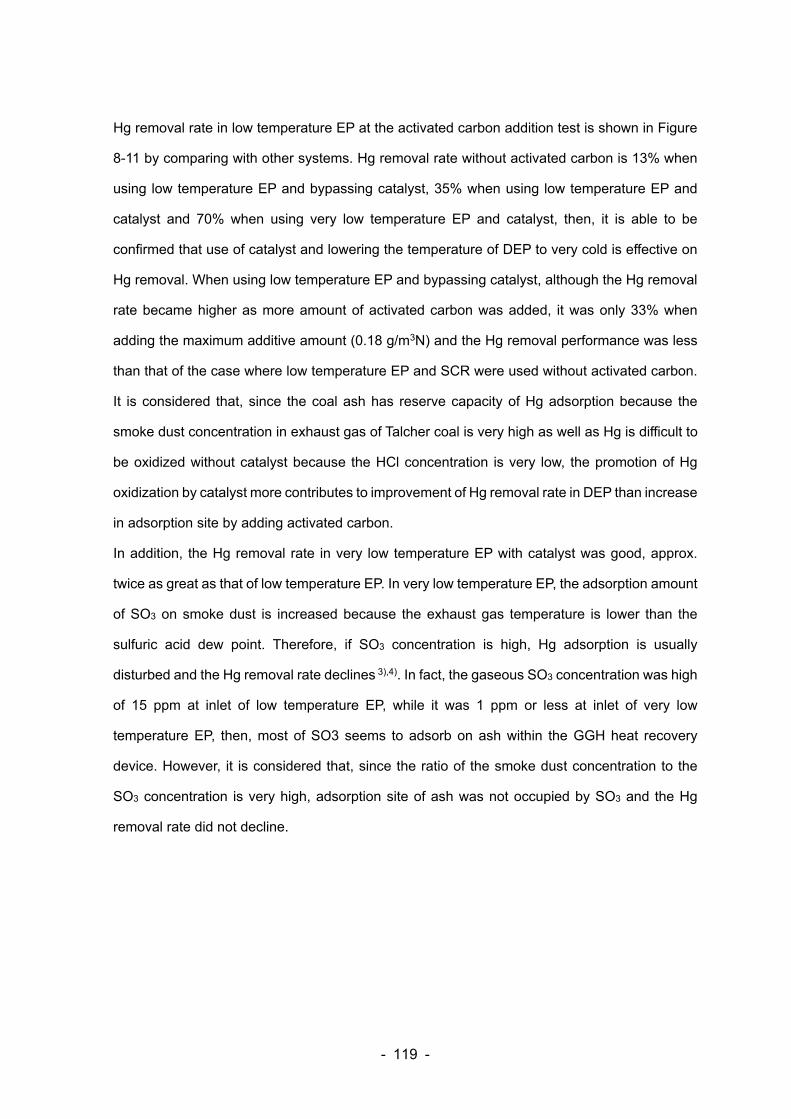
- 119 -
Hg removal rate in low temperature EP at the activated carbon addition test is shown in Figure
8-11 by comparing with other systems. Hg removal rate without activated carbon is 13% when
using low temperature EP and bypassing catalyst, 35% when using low temperature EP and
catalyst and 70% when using very low temperature EP and catalyst, then, it is able to be
confirmed that use of catalyst and lowering the temperature of DEP to very cold is effective on
Hg removal. When using low temperature EP and bypassing catalyst, although the Hg removal
rate became higher as more amount of activated carbon was added, it was only 33% when
adding the maximum additive amount (0.18 g/m3N) and the Hg removal performance was less
than that of the case where low temperature EP and SCR were used without activated carbon.
It is considered that, since the coal ash has reserve capacity of Hg adsorption because the
smoke dust concentration in exhaust gas of Talcher coal is very high as well as Hg is difficult to
be oxidized without catalyst because the HCl concentration is very low, the promotion of Hg
oxidization by catalyst more contributes to improvement of Hg removal rate in DEP than increase
in adsorption site by adding activated carbon.
In addition, the Hg removal rate in very low temperature EP with catalyst was good, approx.
twice as great as that of low temperature EP. In very low temperature EP, the adsorption amount
of SO3 on smoke dust is increased because the exhaust gas temperature is lower than the
sulfuric acid dew point. Therefore, if SO3 concentration is high, Hg adsorption is usually
disturbed and the Hg removal rate declines 3),4). In fact, the gaseous SO3 concentration was high
of 15 ppm at inlet of low temperature EP, while it was 1 ppm or less at inlet of very low
temperature EP, then, most of SO3 seems to adsorb on ash within the GGH heat recovery
device. However, it is considered that, since the ratio of the smoke dust concentration to the
SO3 concentration is very high, adsorption site of ash was not occupied by SO3 and the Hg
removal rate did not decline.
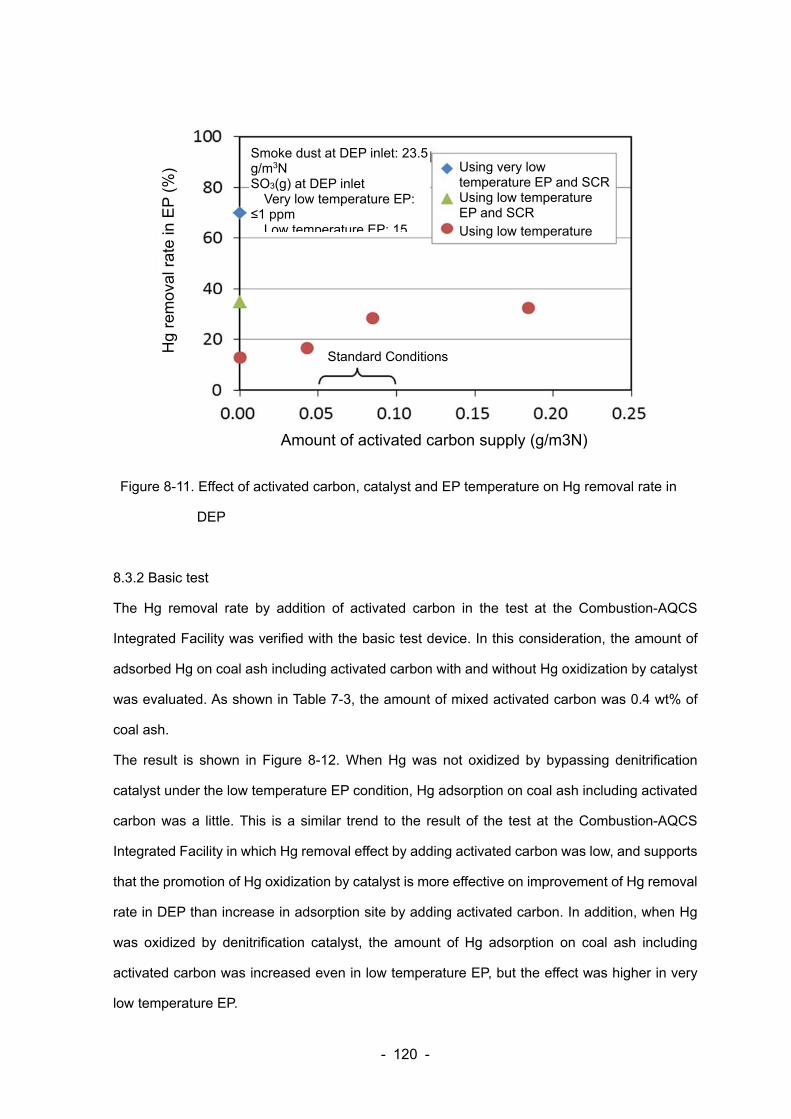
- 120 -
Figure 8-11. Effect of activated carbon, catalyst and EP temperature on Hg removal rate in
DEP
8.3.2 Basic test
The Hg removal rate by addition of activated carbon in the test at the Combustion-AQCS
Integrated Facility was verified with the basic test device. In this consideration, the amount of
adsorbed Hg on coal ash including activated carbon with and without Hg oxidization by catalyst
was evaluated. As shown in Table 7-3, the amount of mixed activated carbon was 0.4 wt% of
coal ash.
The result is shown in Figure 8-12. When Hg was not oxidized by bypassing denitrification
catalyst under the low temperature EP condition, Hg adsorption on coal ash including activated
carbon was a little. This is a similar trend to the result of the test at the Combustion-AQCS
Integrated Facility in which Hg removal effect by adding activated carbon was low, and supports
that the promotion of Hg oxidization by catalyst is more effective on improvement of Hg removal
rate in DEP than increase in adsorption site by adding activated carbon. In addition, when Hg
was oxidized by denitrification catalyst, the amount of Hg adsorption on coal ash including
activated carbon was increased even in low temperature EP, but the effect was higher in very
low temperature EP.
Using very low temperature EP and SCR Using low temperature EP and SCR
Using low temperature
Smoke dust at DEP inlet: 23.5 g/m3N SO3(g) at DEP inlet Very low temperature EP: ≤1 ppm
Low temperature EP: 15
Hg
rem
oval
rat
e in
EP
(%
)
Amount of activated carbon supply (g/m3N)
Standard Conditions
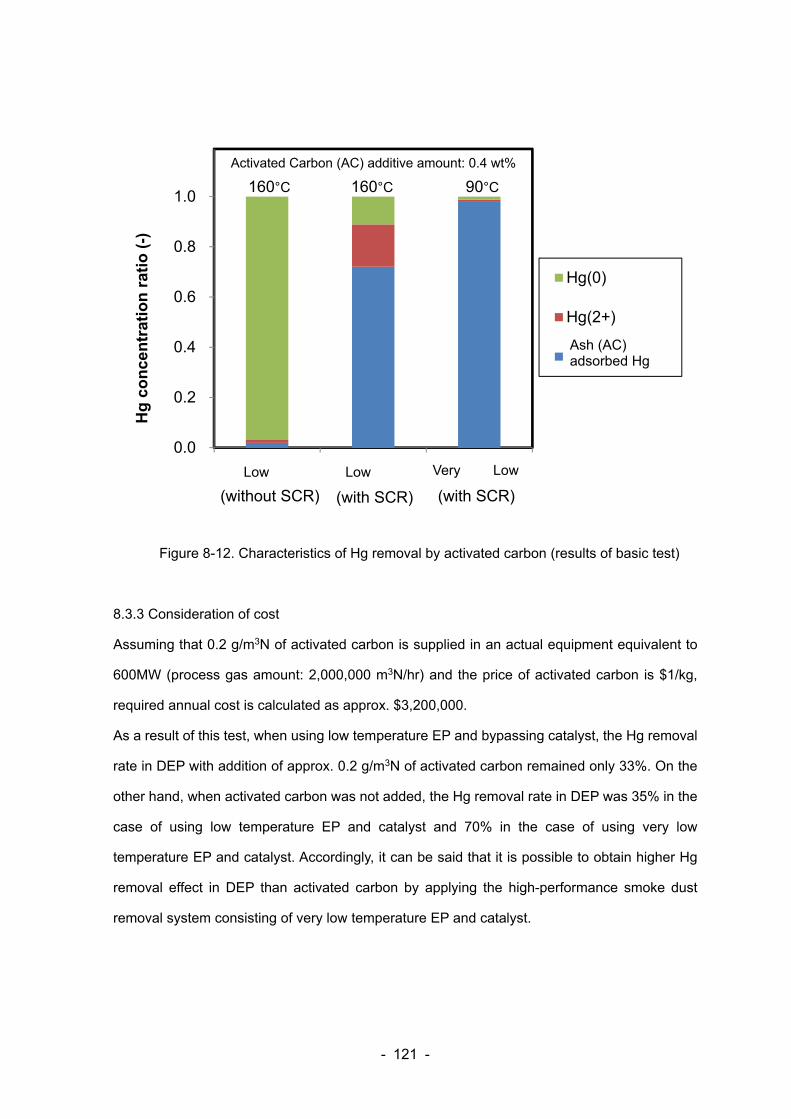
- 121 -
Figure 8-12. Characteristics of Hg removal by activated carbon (results of basic test)
8.3.3 Consideration of cost
Assuming that 0.2 g/m3N of activated carbon is supplied in an actual equipment equivalent to
600MW (process gas amount: 2,000,000 m3N/hr) and the price of activated carbon is $1/kg,
required annual cost is calculated as approx. $3,200,000.
As a result of this test, when using low temperature EP and bypassing catalyst, the Hg removal
rate in DEP with addition of approx. 0.2 g/m3N of activated carbon remained only 33%. On the
other hand, when activated carbon was not added, the Hg removal rate in DEP was 35% in the
case of using low temperature EP and catalyst and 70% in the case of using very low
temperature EP and catalyst. Accordingly, it can be said that it is possible to obtain higher Hg
removal effect in DEP than activated carbon by applying the high-performance smoke dust
removal system consisting of very low temperature EP and catalyst.
0.0
0.2
0.4
0.6
0.8
1.0
低温EP 低温EP 低低温EP
Hg
con
cen
trat
ion
rat
io(-
)
Hg(0)
Hg(2+)
灰(AC)吸着Hg
(without SCR) (with SCR)(with SCR)
160°C 90°C160°C
Activated Carbon (AC) additive amount: 0.4 wt%
Very Low
Ash (AC) adsorbed Hg
Low Low
- 122 -
[Chapter 4 Reference]
1) C. Senior, Review of the role of aqueous chemistry in mercury removal by acid gas scrubbers
on incinerator systems: Environ Eng Sci 24(8), 2007
2) N. Omine et.al., Study of elemental mercury re-emission in a simulated wet scrubber: Fuel,
Vol.91, Issue 1, 2012
3) J. Jervis & F. Meselole: SO3 Effect on Mercury Control:Power Engineering, January, 2008
4) N. Imada et.al., Development of Mercury and SO3 Control Technology using Gas-Gas Heater:
The 35rd International Technical Conference on Coal Utilization & Fuel Systems, 2010
- 123 -
9. SUMMARY OF MERCURY REMOVAL
Since Talcher coal from India contains high concentration of mercury (Hg) and very low
concentration of chlorine (Cl), there was a possibility that the oxidation rate and the removal rate
of mercury fell to the low level. In view of the aforesaid, under the Study, mercury behavior and
removal characteristics were evaluated with the Combustion-AQCS Integrated Facility and the
basic testing equipment in the laboratory.
Main results are described below.
(1) Mercury oxidization performance by catalyst
Although Hg oxidization rate in denitrification catalyst (high mercury oxidation-type catalyst
manufactured by MHPS) was rather low of 70% at around 350°C of the temperature at
catalyst inlet and 63% at around 380°C of that, considering Talcher coal contains low
concentration of HCl, it is considered as reasonable oxidation performance by comparing
with other types of coal.
(2) Mercury removal performance in DEP
Hg removal rate in DEP was 70% in the high-performance smoke dust removal system (using
very low temperature EP and catalyst) and 35% in the conventional system (using low
temperature EP and catalyst), then, it was confirmed that very low temperature EP is effective
on Hg removal.
(3) Mercury removal performance at the time of adding activated carbon
Hg removal rate becomes higher in the order of using very low temperature EP and catalyst
> using low temperature EP and catalyst > using low temperature EP and bypassing catalyst
(with the maximum amount of activated carbon) > using low temperature EP and bypassing
catalyst (without activated carbon), then, catalyst had more Hg removal effect than addition
of activated carbon. It is probably because the ash has reserve capacity of Hg adsorption
even without activated carbon due to the high smoke dust concentration and Hg is hardly
oxidized without catalyst due to the very low HCl concentration. Also in the basic test with a
- 124 -
small electric furnace, it was confirmed that the amount of Hg which adsorbs on coal ash
including activated carbon is significantly increased by installing catalyst (Hg oxidization).
(4) Economic evaluation
Assuming that 0.2 g/m3N of activated carbon is supplied in an actual equipment equivalent
to 600MW (process gas amount: 2,000,000 m3N/hr) and the price of activated carbon is
$1/kg, required annual cost is calculated as approx. $3,200,000. In addition, the Hg removal
rate in DEP when adding approx. 0.2 g/m3N of activated carbon was equal to that of the
conventional system with low temperature EP and SCR. Furthermore, when applying the
high-performance smoke dust removal system consisting of very low temperature EP and
SCR, the Hg removal rate was significantly higher than that of the case where 0.2 g/m3N of
activated carbon was added.
- 125 -
10. TECHNICAL INFORMATION, DESULPHURIZATION
AND DENTRIFICATION
10.1 Desulfurization performance depending on the difference of desulfurization method (dry,
semi-dry and wet)
Flue gas treatment technologies used in thermal power plants, especially in coal-fired power
plants are classified into “wet treatment” and “dry treatment” as showed in Figure 10-1.
Since flue gas from coal-fired boilers contains nitrogen oxides, sulfur oxides and smoke dust in
large quantities, denitrification device, desulfurization device and electrostatic precipitator are
installed. Especially the smoke dust causes blocking and pressure loss by adhesion to the inside
wall or deposit. It is therefore required to construct a system and design each facility by taking
into account for them. In Japan, wet treatment is mainly used.
Although heavy oil has been mainly fired in thermal power plants until the oil shock and an
electrostatic precipitator (EP) was once installed before denitrification device in consideration of
adhesion/corrosion due to SO3 in the exhaust gas and acid ammonium sulfate generated by
chemical reaction with MH3 used for denitrification, after the oil shock, as coal-fired power has
become main-stream, the operation temperature of EP has been lowered. This is because, in
the case of coal-fired boilers, the smoke dust concentration in the exhaust gas is very high of
10-20 g/m3N and the dust collection performance of EP is more efficient at lower temperature.
In a flow in the second column, the smoke dust concentration at the stack outlet becomes around
15-25 mg/m3N by providing a dust removing tower called cooling tower to the desulfurization
device (FGD).
In addition, a flow in the third column enables reduction of the smoke dust concentration at the
stack outlet to 5 mg/m3N or less by adding a dry EP to it.
Currently, by use of “very low temperature EP” in which EP is installed after a gas-gas heater
(GGH), called high-performance system, there is a process that achieves the smoke dust
concentration at the stack outlet of 5 mg/m3N or less without a wet EP. This high-performance
system can remove SO3 in the exhaust gas without a wet EP.
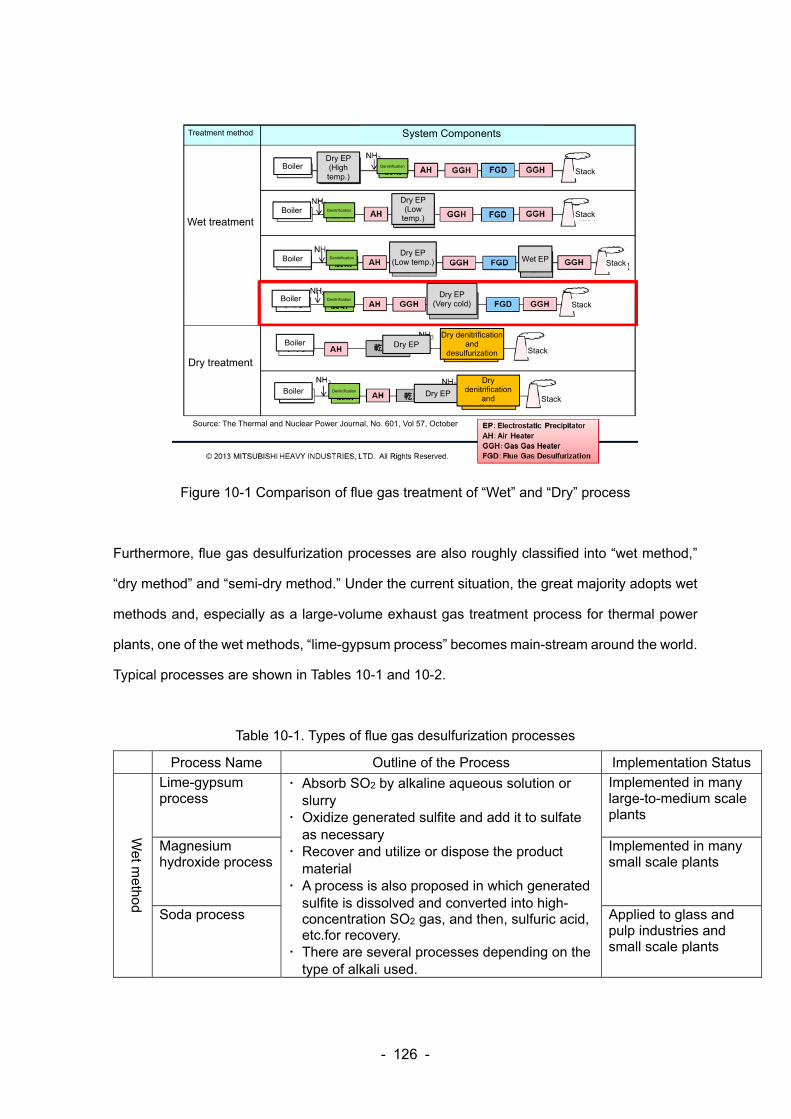
- 126 -
Figure 10-1 Comparison of flue gas treatment of “Wet” and “Dry” process
Furthermore, flue gas desulfurization processes are also roughly classified into “wet method,”
“dry method” and “semi-dry method.” Under the current situation, the great majority adopts wet
methods and, especially as a large-volume exhaust gas treatment process for thermal power
plants, one of the wet methods, “lime-gypsum process” becomes main-stream around the world.
Typical processes are shown in Tables 10-1 and 10-2.
Table 10-1. Types of flue gas desulfurization processes
Process Name Outline of the Process Implementation Status
Wet m
ethod
Lime-gypsum process
・ Absorb SO2 by alkaline aqueous solution or slurry
・ Oxidize generated sulfite and add it to sulfate as necessary
・ Recover and utilize or dispose the product material
・ A process is also proposed in which generated sulfite is dissolved and converted into high-concentration SO2 gas, and then, sulfuric acid, etc.for recovery.
・ There are several processes depending on the type of alkali used.
Implemented in many large-to-medium scale plants
Magnesium hydroxide process
Implemented in many small scale plants
Soda process Applied to glass and pulp industries and small scale plants
Dry EP
Dry EP
Treatment method
Wet treatment
System Components
Stack Boiler
Boiler
Boiler
Boiler
Boiler
Boiler
Denitrification
Dry EP (High temp.)
Denitrification
Denitrification
Denitrification
Denitrification
Stack
Stack
Stack
Stack
Stack
Dry EP (Low
temp.)
Dry EP (Low temp.)
Dry EP (Very cold)
Wet EP
Dry denitrification and
desulfurization
Dry denitrification
and d lf i ti
Source: The Thermal and Nuclear Power Journal, No. 601, Vol 57, October
Dry treatment
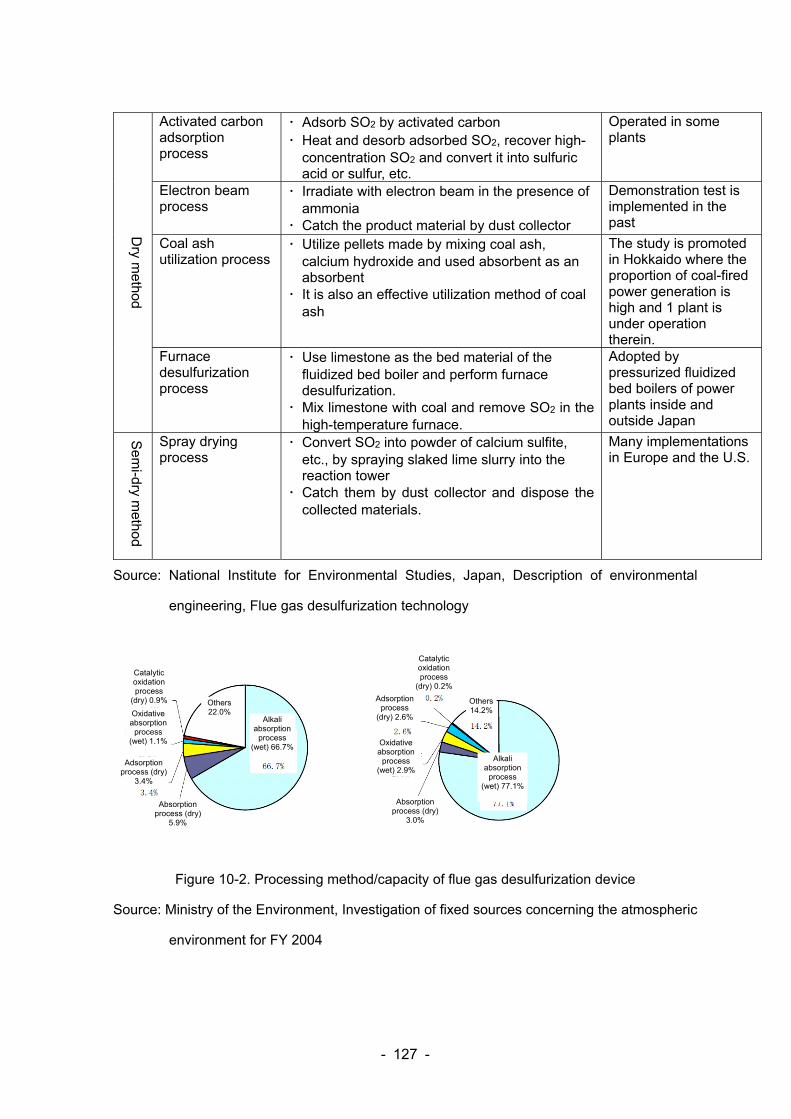
- 127 -
Dry m
ethod
Activated carbon adsorption process
・ Adsorb SO2 by activated carbon ・ Heat and desorb adsorbed SO2, recover high-
concentration SO2 and convert it into sulfuric acid or sulfur, etc.
Operated in some plants
Electron beam process
・ Irradiate with electron beam in the presence of ammonia
・ Catch the product material by dust collector
Demonstration test is implemented in the past
Coal ash utilization process
・ Utilize pellets made by mixing coal ash, calcium hydroxide and used absorbent as an absorbent
・ It is also an effective utilization method of coal ash
The study is promoted in Hokkaido where the proportion of coal-fired power generation is high and 1 plant is under operation therein.
Furnace desulfurization process
・ Use limestone as the bed material of the fluidized bed boiler and perform furnace desulfurization.
・ Mix limestone with coal and remove SO2 in the high-temperature furnace.
Adopted by pressurized fluidized bed boilers of power plants inside and outside Japan
Sem
i-dry method
Spray drying process
・ Convert SO2 into powder of calcium sulfite, etc., by spraying slaked lime slurry into the reaction tower
・ Catch them by dust collector and dispose the collected materials.
Many implementations in Europe and the U.S.
Source: National Institute for Environmental Studies, Japan, Description of environmental
engineering, Flue gas desulfurization technology
Figure 10-2. Processing method/capacity of flue gas desulfurization device
Source: Ministry of the Environment, Investigation of fixed sources concerning the atmospheric
environment for FY 2004
Alkali absorption
process (wet) 66.7%
Absorption process (dry)
5.9%
Adsorption process (dry)
3.4%
Oxidative absorption
process (wet) 1.1%
Catalytic oxidation process
(dry) 0.9% Others 22.0%
Alkali absorption
process (wet) 77.1%
Absorption process (dry)
3.0%
Oxidative absorption
process (wet) 2.9%
Adsorption process
(dry) 2.6%
Catalytic oxidation process
(dry) 0.2%
Others 14.2%
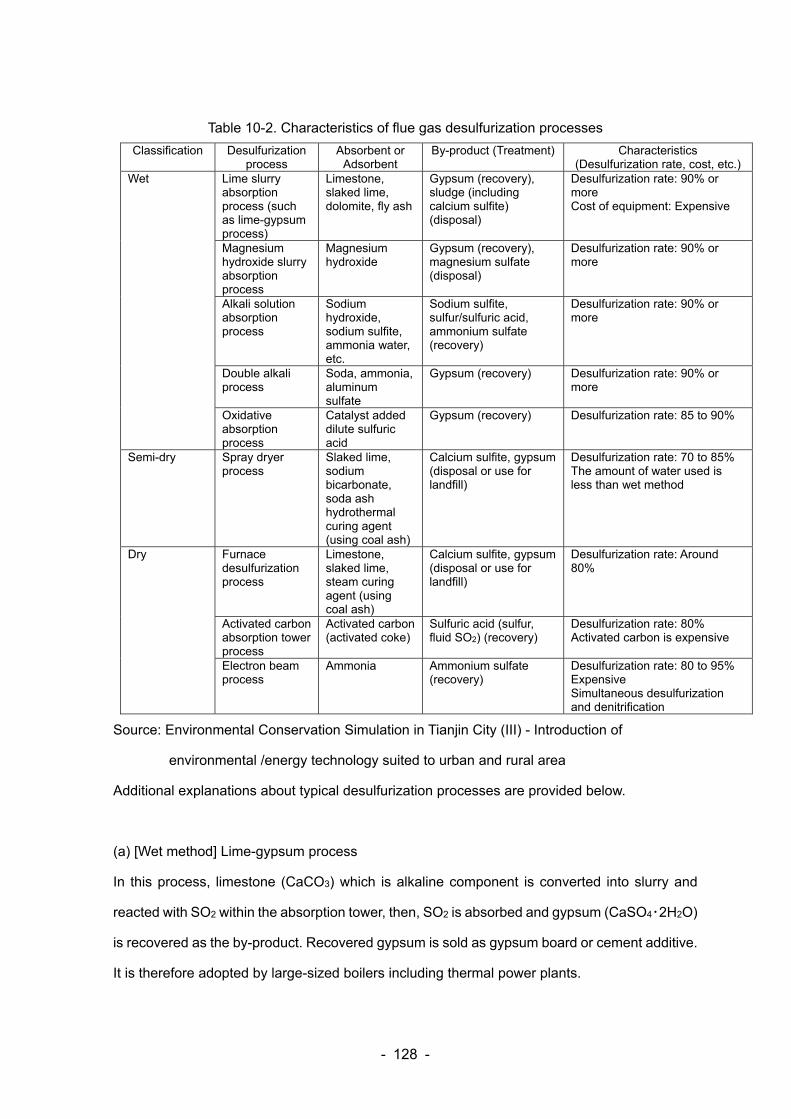
- 128 -
Table 10-2. Characteristics of flue gas desulfurization processes
Classification Desulfurization process
Absorbent or Adsorbent
By-product (Treatment) Characteristics (Desulfurization rate, cost, etc.)
Wet Lime slurry absorption process (such as lime-gypsum process)
Limestone, slaked lime, dolomite, fly ash
Gypsum (recovery), sludge (including calcium sulfite) (disposal)
Desulfurization rate: 90% or more Cost of equipment: Expensive
Magnesium hydroxide slurry absorption process
Magnesium hydroxide
Gypsum (recovery), magnesium sulfate (disposal)
Desulfurization rate: 90% or more
Alkali solution absorption process
Sodium hydroxide, sodium sulfite, ammonia water, etc.
Sodium sulfite, sulfur/sulfuric acid, ammonium sulfate (recovery)
Desulfurization rate: 90% or more
Double alkali process
Soda, ammonia, aluminum sulfate
Gypsum (recovery) Desulfurization rate: 90% or more
Oxidative absorption process
Catalyst added dilute sulfuric acid
Gypsum (recovery) Desulfurization rate: 85 to 90%
Semi-dry Spray dryer process
Slaked lime, sodium bicarbonate, soda ash hydrothermal curing agent (using coal ash)
Calcium sulfite, gypsum (disposal or use for landfill)
Desulfurization rate: 70 to 85% The amount of water used is less than wet method
Dry Furnace desulfurization process
Limestone, slaked lime, steam curing agent (using coal ash)
Calcium sulfite, gypsum (disposal or use for landfill)
Desulfurization rate: Around 80%
Activated carbon absorption tower process
Activated carbon (activated coke)
Sulfuric acid (sulfur, fluid SO2) (recovery)
Desulfurization rate: 80% Activated carbon is expensive
Electron beam process
Ammonia Ammonium sulfate (recovery)
Desulfurization rate: 80 to 95% Expensive Simultaneous desulfurization and denitrification
Source: Environmental Conservation Simulation in Tianjin City (III) - Introduction of
environmental /energy technology suited to urban and rural area
Additional explanations about typical desulfurization processes are provided below.
(a) [Wet method] Lime-gypsum process
In this process, limestone (CaCO3) which is alkaline component is converted into slurry and
reacted with SO2 within the absorption tower, then, SO2 is absorbed and gypsum (CaSO4・2H2O)
is recovered as the by-product. Recovered gypsum is sold as gypsum board or cement additive.
It is therefore adopted by large-sized boilers including thermal power plants.
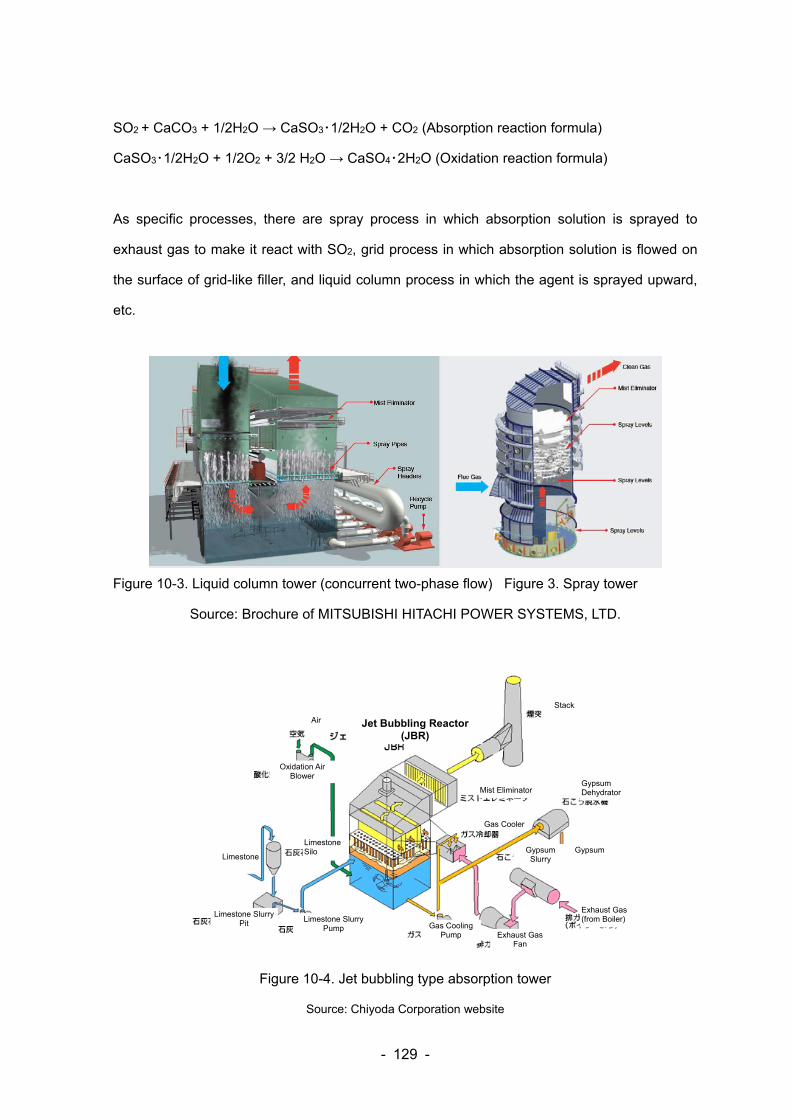
- 129 -
SO2 + CaCO3 + 1/2H2O → CaSO3・1/2H2O + CO2 (Absorption reaction formula)
CaSO3・1/2H2O + 1/2O2 + 3/2 H2O → CaSO4・2H2O (Oxidation reaction formula)
As specific processes, there are spray process in which absorption solution is sprayed to
exhaust gas to make it react with SO2, grid process in which absorption solution is flowed on
the surface of grid-like filler, and liquid column process in which the agent is sprayed upward,
etc.
Figure 10-3. Liquid column tower (concurrent two-phase flow) Figure 3. Spray tower
Source: Brochure of MITSUBISHI HITACHI POWER SYSTEMS, LTD.
Figure 10-4. Jet bubbling type absorption tower
Source: Chiyoda Corporation website
Air
Gypsum Dehydrator Mist Eliminator
Oxidation Air Blower
Stack
Jet Bubbling Reactor (JBR)
Exhaust Gas (from Boiler)
Gas Cooler
Limestone Silo
Limestone
Limestone Slurry Pump
Limestone Slurry Pit
Gypsum Gypsum Slurry
Exhaust Gas Fan
Gas Cooling Pump
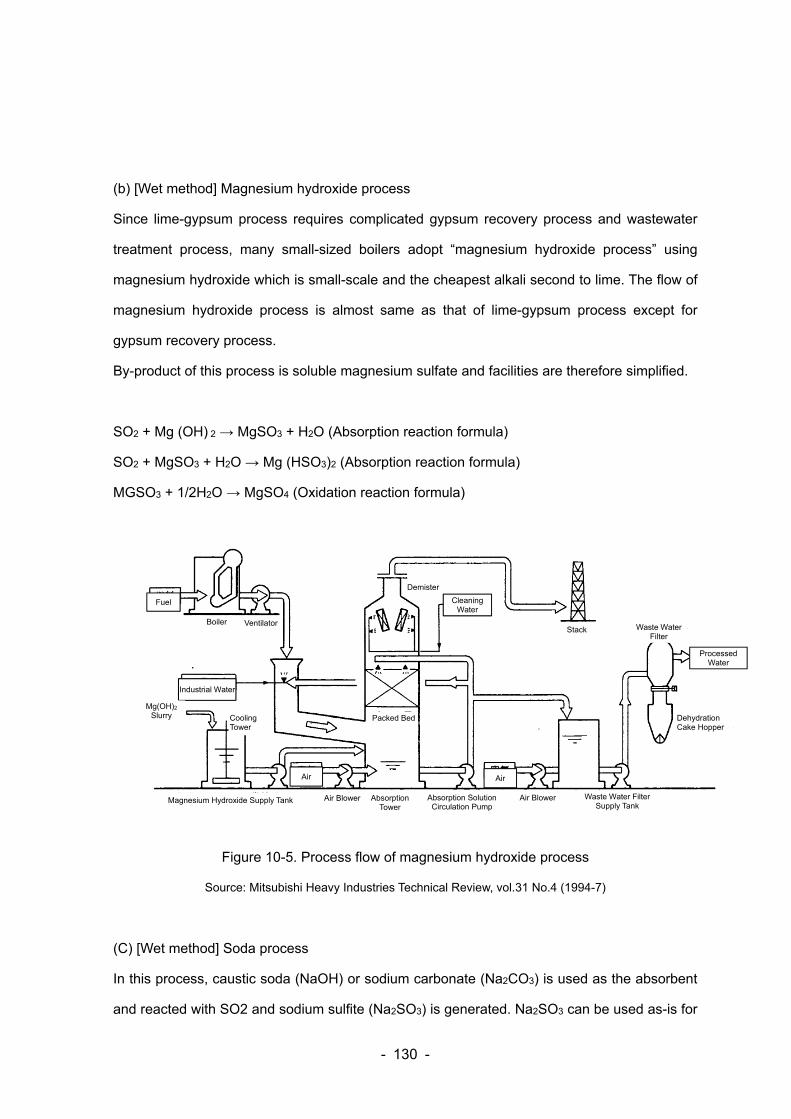
- 130 -
(b) [Wet method] Magnesium hydroxide process
Since lime-gypsum process requires complicated gypsum recovery process and wastewater
treatment process, many small-sized boilers adopt “magnesium hydroxide process” using
magnesium hydroxide which is small-scale and the cheapest alkali second to lime. The flow of
magnesium hydroxide process is almost same as that of lime-gypsum process except for
gypsum recovery process.
By-product of this process is soluble magnesium sulfate and facilities are therefore simplified.
SO2 + Mg (OH) 2 → MgSO3 + H2O (Absorption reaction formula)
SO2 + MgSO3 + H2O → Mg (HSO3)2 (Absorption reaction formula)
MGSO3 + 1/2H2O → MgSO4 (Oxidation reaction formula)
Figure 10-5. Process flow of magnesium hydroxide process
Source: Mitsubishi Heavy Industries Technical Review, vol.31 No.4 (1994-7)
(C) [Wet method] Soda process
In this process, caustic soda (NaOH) or sodium carbonate (Na2CO3) is used as the absorbent
and reacted with SO2 and sodium sulfite (Na2SO3) is generated. Na2SO3 can be used as-is for
Packed Bed
Boiler
Fuel
Stack
Demister
Ventilator
Cleaning Water
Industrial Water
Magnesium Hydroxide Supply Tank
Waste Water Filter
Processed Water
Dehydration Cake Hopper
Air
Cooling Tower
Mg(OH)2 Slurry
Air
Absorption Solution Circulation Pump
Absorption Tower
Air Blower Waste Water Filter Supply Tank
Air BlowerMagnesium Hydroxide Supply Tank
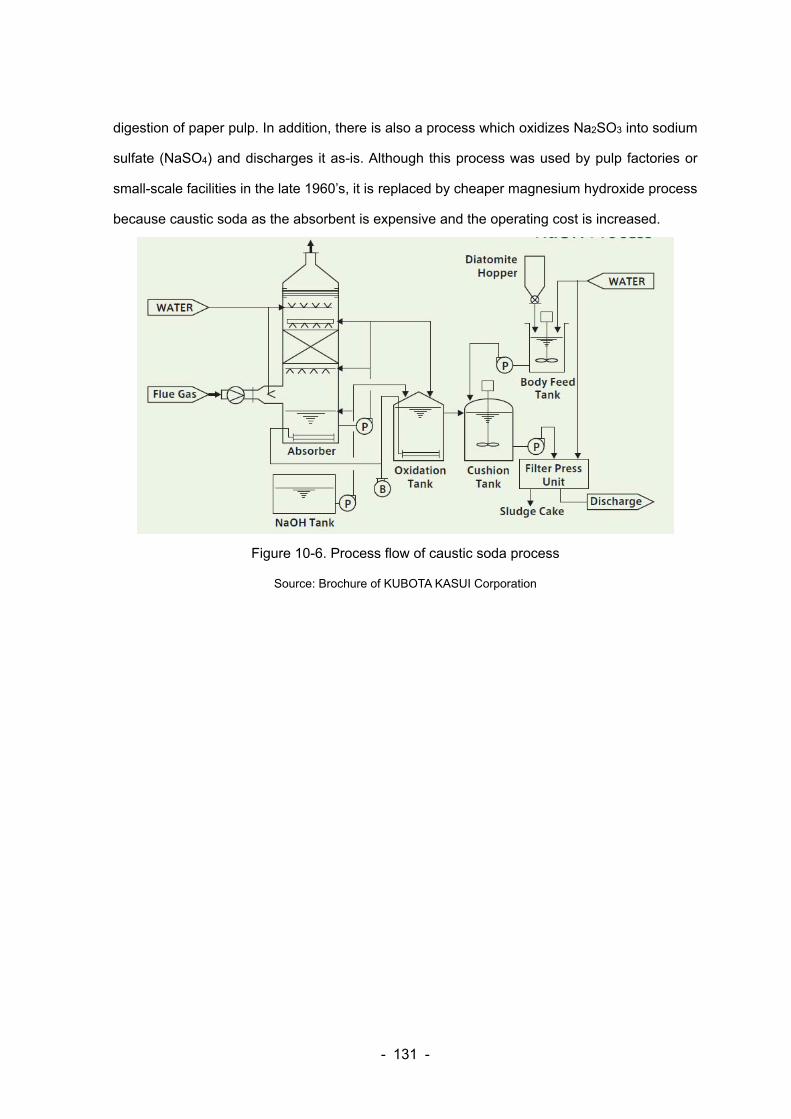
- 131 -
digestion of paper pulp. In addition, there is also a process which oxidizes Na2SO3 into sodium
sulfate (NaSO4) and discharges it as-is. Although this process was used by pulp factories or
small-scale facilities in the late 1960’s, it is replaced by cheaper magnesium hydroxide process
because caustic soda as the absorbent is expensive and the operating cost is increased.
Figure 10-6. Process flow of caustic soda process
Source: Brochure of KUBOTA KASUI Corporation
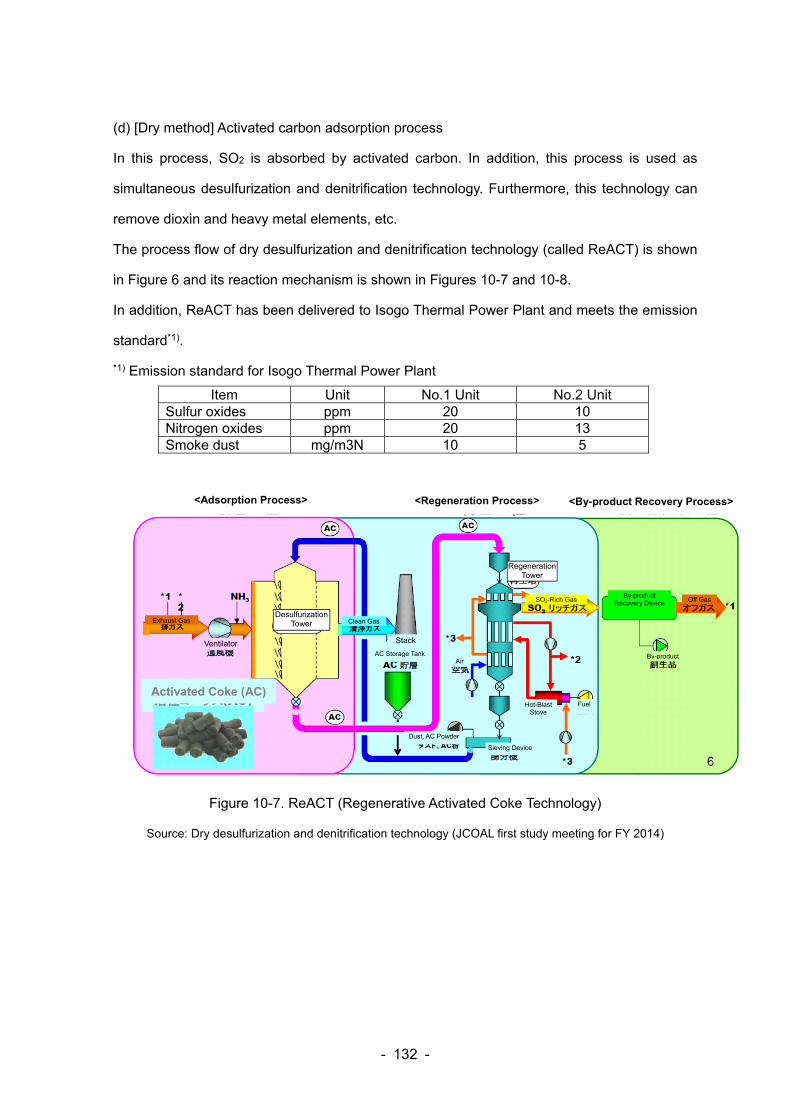
- 132 -
(d) [Dry method] Activated carbon adsorption process
In this process, SO2 is absorbed by activated carbon. In addition, this process is used as
simultaneous desulfurization and denitrification technology. Furthermore, this technology can
remove dioxin and heavy metal elements, etc.
The process flow of dry desulfurization and denitrification technology (called ReACT) is shown
in Figure 6 and its reaction mechanism is shown in Figures 10-7 and 10-8.
In addition, ReACT has been delivered to Isogo Thermal Power Plant and meets the emission
standard*1).
*1) Emission standard for Isogo Thermal Power Plant
Item Unit No.1 Unit No.2 Unit Sulfur oxides ppm 20 10 Nitrogen oxides ppm 20 13 Smoke dust mg/m3N 10 5
Figure 10-7. ReACT (Regenerative Activated Coke Technology)
Source: Dry desulfurization and denitrification technology (JCOAL first study meeting for FY 2014)
Regeneration Tower
Stack
Activated Coke (AC)
Desulfurization Tower
Ventilator
Exhaust Gas
<Adsorption Process> <Regeneration Process>
SO2-Rich Gas
AC Storage Tank
Clean Gas
Air
Dust, AC Powder
By-product Recovery Device
Sieving Device
Hot-Blast Stove
Fuel
<By-product Recovery Process>
Off Gas
By-product
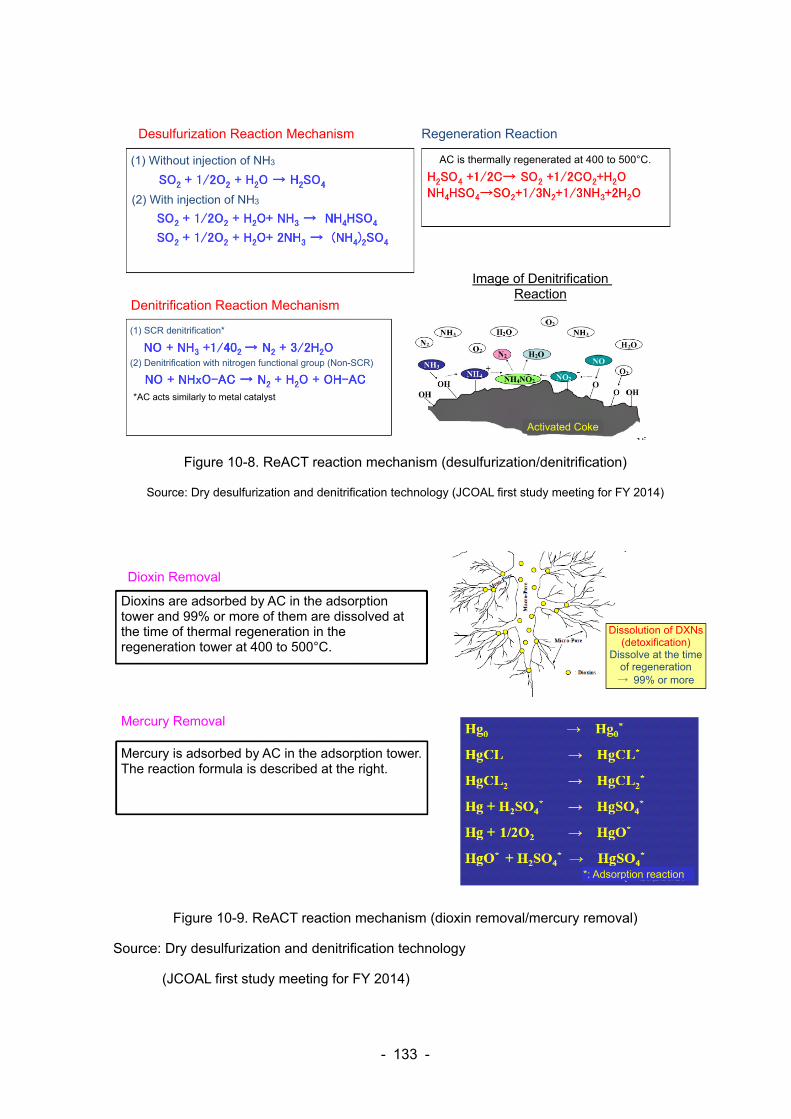
- 133 -
Figure 10-8. ReACT reaction mechanism (desulfurization/denitrification)
Source: Dry desulfurization and denitrification technology (JCOAL first study meeting for FY 2014)
Figure 10-9. ReACT reaction mechanism (dioxin removal/mercury removal)
Source: Dry desulfurization and denitrification technology
(JCOAL first study meeting for FY 2014)
*AC acts similarly to metal catalyst
Image of Denitrification Reaction
Activated Coke
AC is thermally regenerated at 400 to 500°C. (1) Without injection of NH3
Desulfurization Reaction Mechanism
(2) With injection of NH3
Regeneration Reaction
Denitrification Reaction Mechanism
(1) SCR denitrification*
(2) Denitrification with nitrogen functional group (Non-SCR)
Dioxin Removal
Dioxins are adsorbed by AC in the adsorption tower and 99% or more of them are dissolved at the time of thermal regeneration in the regeneration tower at 400 to 500°C.
Dissolution of DXNs (detoxification)
Dissolve at the time of regeneration → 99% or more
Mercury Removal
Mercury is adsorbed by AC in the adsorption tower.The reaction formula is described at the right.
*: Adsorption reaction
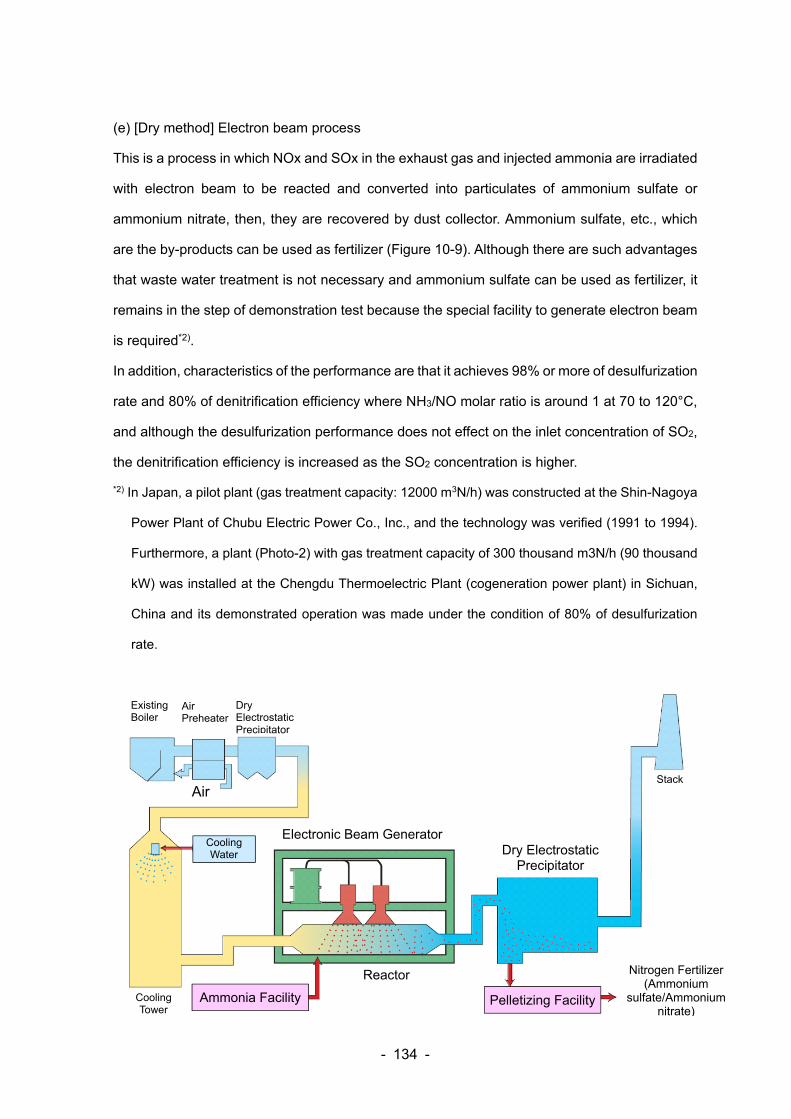
- 134 -
(e) [Dry method] Electron beam process
This is a process in which NOx and SOx in the exhaust gas and injected ammonia are irradiated
with electron beam to be reacted and converted into particulates of ammonium sulfate or
ammonium nitrate, then, they are recovered by dust collector. Ammonium sulfate, etc., which
are the by-products can be used as fertilizer (Figure 10-9). Although there are such advantages
that waste water treatment is not necessary and ammonium sulfate can be used as fertilizer, it
remains in the step of demonstration test because the special facility to generate electron beam
is required*2).
In addition, characteristics of the performance are that it achieves 98% or more of desulfurization
rate and 80% of denitrification efficiency where NH3/NO molar ratio is around 1 at 70 to 120°C,
and although the desulfurization performance does not effect on the inlet concentration of SO2,
the denitrification efficiency is increased as the SO2 concentration is higher.
*2) In Japan, a pilot plant (gas treatment capacity: 12000 m3N/h) was constructed at the Shin-Nagoya
Power Plant of Chubu Electric Power Co., Inc., and the technology was verified (1991 to 1994).
Furthermore, a plant (Photo-2) with gas treatment capacity of 300 thousand m3N/h (90 thousand
kW) was installed at the Chengdu Thermoelectric Plant (cogeneration power plant) in Sichuan,
China and its demonstrated operation was made under the condition of 80% of desulfurization
rate.
Existing Boiler
Dry Electrostatic Precipitator
Electronic Beam GeneratorCooling Water
StackAir
Dry Electrostatic Precipitator
Air Preheater
Nitrogen Fertilizer (Ammonium
sulfate/Ammonium nitrate)
Reactor
Ammonia Facility Cooling Tower
Pelletizing Facility
- 135 -
Figure 10-10. Process flow of electron beam process
Source: New Energy and Industrial Technology Development Organization/Japan Coal Energy
Center, “Japanese Clean Coal Technologies (5B3. Simultaneous desulfurization and
denitrification technology)”
- 136 -
10.2 Economy depending on the difference of desulfurization method (dry, semi-dry and wet)
There are few documents in which economy depending on the difference of desulfurization
method is quantitatively evaluated and, in this research study, the description is only in
“Preliminary research of desulfurization cost” written by Yoshitaka Nitta, et al. (Keio Economic
Observatory) showed in Figure 10-10. In such document, assuming that desulfurization device
for coal combustion becomes common in developing countries, its cost data is investigated
based on information in existing main literature and organized. Specifically, it is reported that
the cost of wet desulfurization is, if it is manufactured in Japan and installed in China, approx.
15 thousand yen/kW for the cost of equipment and 0.5 yen/kWh for the operating cost, and by
simplifying the system, they become approx. 10 thousand yen/kW and around 0.1 yen/kWh
respectively. In addition, electron beam process is also reported as a dry method and it costs
approx. 15 thousand yen/kW for the cost of equipment and 0.4 yen/kWh for the operating cost.
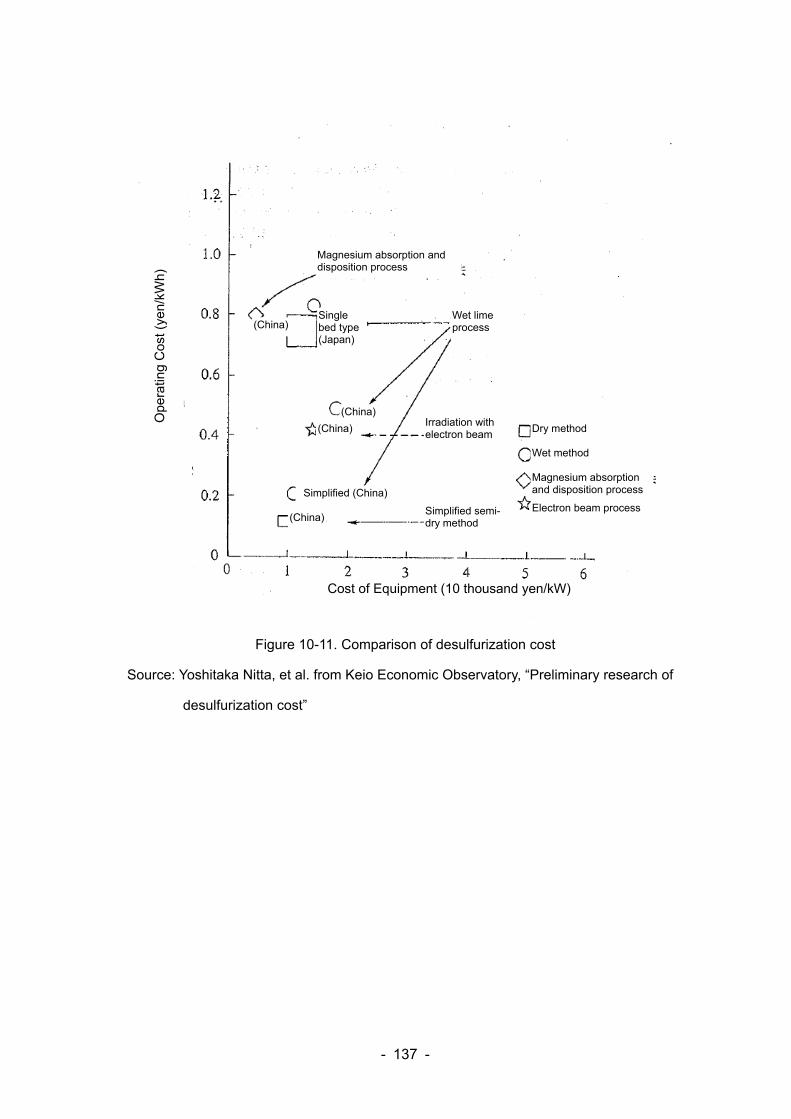
- 137 -
Figure 10-11. Comparison of desulfurization cost
Source: Yoshitaka Nitta, et al. from Keio Economic Observatory, “Preliminary research of
desulfurization cost”
Simplified semi-dry method
Irradiation with electron beam
Wet lime process
Single bed type (Japan)
(China)
Magnesium absorption and disposition process
Cost of Equipment (10 thousand yen/kW)
Ope
ratin
g C
ost (
yen/
kWh)
(China)
(China)
(China)
Simplified (China)
Dry method Wet method Magnesium absorption and disposition process
Electron beam process
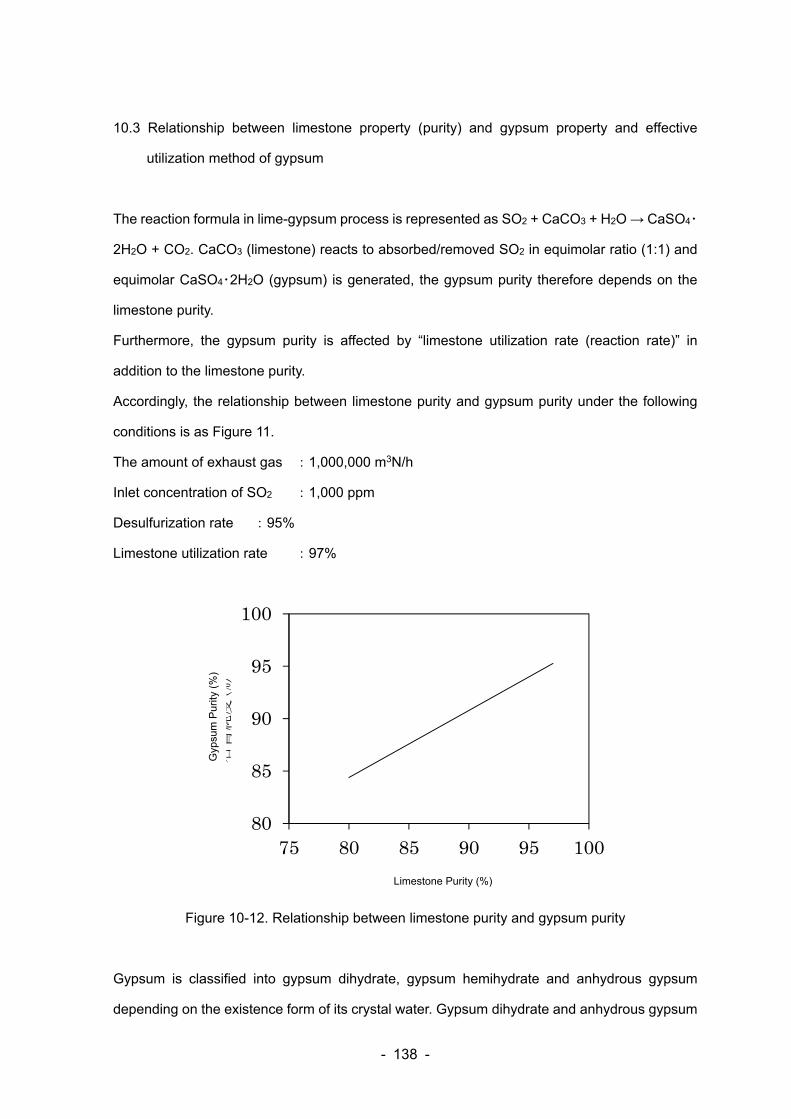
- 138 -
10.3 Relationship between limestone property (purity) and gypsum property and effective
utilization method of gypsum
The reaction formula in lime-gypsum process is represented as SO2 + CaCO3 + H2O → CaSO4・
2H2O + CO2. CaCO3 (limestone) reacts to absorbed/removed SO2 in equimolar ratio (1:1) and
equimolar CaSO4・2H2O (gypsum) is generated, the gypsum purity therefore depends on the
limestone purity.
Furthermore, the gypsum purity is affected by “limestone utilization rate (reaction rate)” in
addition to the limestone purity.
Accordingly, the relationship between limestone purity and gypsum purity under the following
conditions is as Figure 11.
The amount of exhaust gas :1,000,000 m3N/h
Inlet concentration of SO2 :1,000 ppm
Desulfurization rate :95%
Limestone utilization rate :97%
Figure 10-12. Relationship between limestone purity and gypsum purity
Gypsum is classified into gypsum dihydrate, gypsum hemihydrate and anhydrous gypsum
depending on the existence form of its crystal water. Gypsum dihydrate and anhydrous gypsum
80
85
90
95
100
75 80 85 90 95 100
石灰石純度(%)
石膏純度(%)
Limestone Purity (%)
Gyp
sum
Pur
ity (
%)
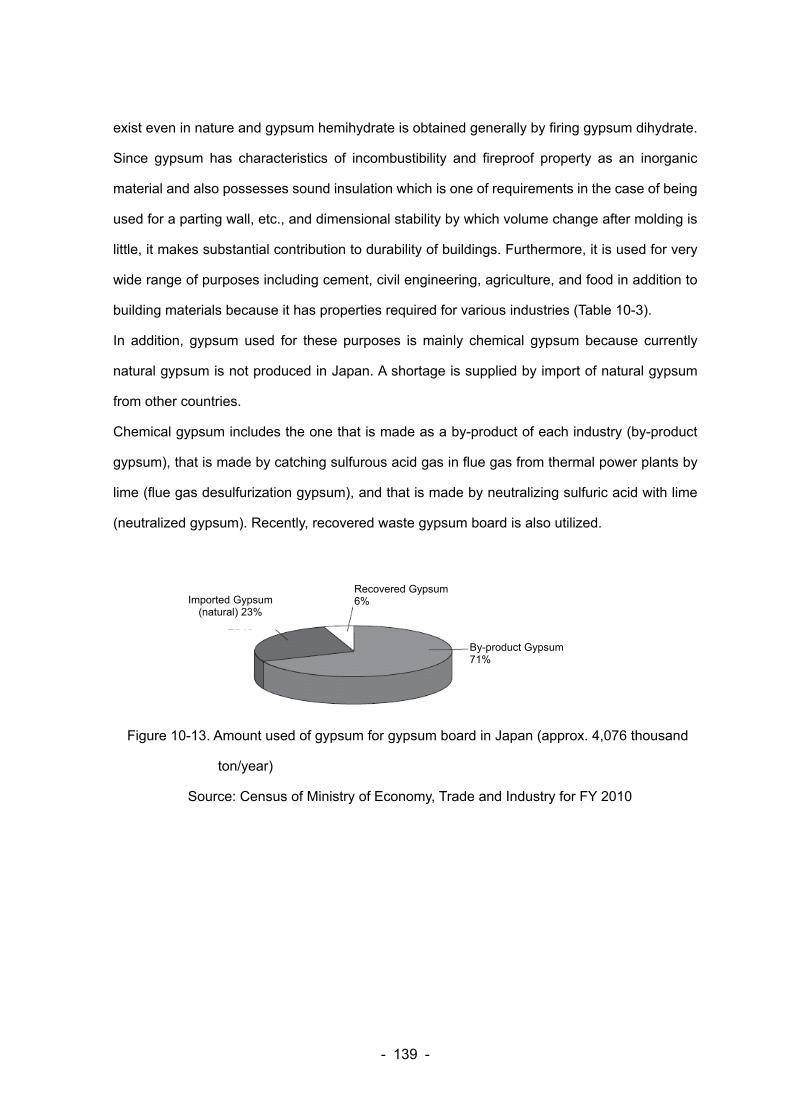
- 139 -
exist even in nature and gypsum hemihydrate is obtained generally by firing gypsum dihydrate.
Since gypsum has characteristics of incombustibility and fireproof property as an inorganic
material and also possesses sound insulation which is one of requirements in the case of being
used for a parting wall, etc., and dimensional stability by which volume change after molding is
little, it makes substantial contribution to durability of buildings. Furthermore, it is used for very
wide range of purposes including cement, civil engineering, agriculture, and food in addition to
building materials because it has properties required for various industries (Table 10-3).
In addition, gypsum used for these purposes is mainly chemical gypsum because currently
natural gypsum is not produced in Japan. A shortage is supplied by import of natural gypsum
from other countries.
Chemical gypsum includes the one that is made as a by-product of each industry (by-product
gypsum), that is made by catching sulfurous acid gas in flue gas from thermal power plants by
lime (flue gas desulfurization gypsum), and that is made by neutralizing sulfuric acid with lime
(neutralized gypsum). Recently, recovered waste gypsum board is also utilized.
Figure 10-13. Amount used of gypsum for gypsum board in Japan (approx. 4,076 thousand
ton/year)
Source: Census of Ministry of Economy, Trade and Industry for FY 2010
Imported Gypsum (natural) 23%
Recovered Gypsum 6%
By-product Gypsum 71%
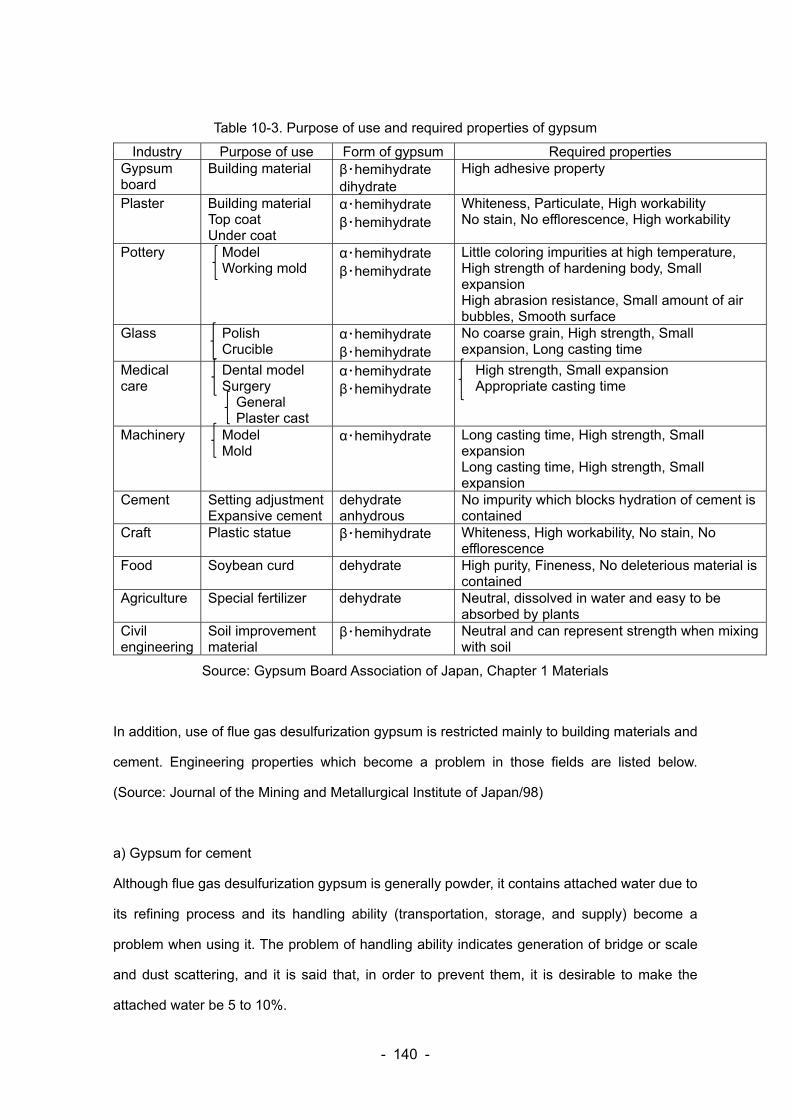
- 140 -
Table 10-3. Purpose of use and required properties of gypsum
Industry Purpose of use Form of gypsum Required properties Gypsum board
Building material β・hemihydrate dihydrate
High adhesive property
Plaster Building material Top coat Under coat
α・hemihydrate β・hemihydrate
Whiteness, Particulate, High workability No stain, No efflorescence, High workability
Pottery Model Working mold
α・hemihydrate β・hemihydrate
Little coloring impurities at high temperature, High strength of hardening body, Small expansion High abrasion resistance, Small amount of air bubbles, Smooth surface
Glass Polish Crucible
α・hemihydrate β・hemihydrate
No coarse grain, High strength, Small expansion, Long casting time
Medical care
Dental model Surgery General
Plaster cast
α・hemihydrate β・hemihydrate
High strength, Small expansion Appropriate casting time
Machinery Model Mold
α・hemihydrate Long casting time, High strength, Small expansion Long casting time, High strength, Small expansion
Cement Setting adjustment Expansive cement
dehydrate anhydrous
No impurity which blocks hydration of cement is contained
Craft Plastic statue β・hemihydrate Whiteness, High workability, No stain, No efflorescence
Food Soybean curd dehydrate High purity, Fineness, No deleterious material is contained
Agriculture Special fertilizer dehydrate Neutral, dissolved in water and easy to be absorbed by plants
Civil engineering
Soil improvement material
β・hemihydrate Neutral and can represent strength when mixing with soil
Source: Gypsum Board Association of Japan, Chapter 1 Materials
In addition, use of flue gas desulfurization gypsum is restricted mainly to building materials and
cement. Engineering properties which become a problem in those fields are listed below.
(Source: Journal of the Mining and Metallurgical Institute of Japan/98)
a) Gypsum for cement
Although flue gas desulfurization gypsum is generally powder, it contains attached water due to
its refining process and its handling ability (transportation, storage, and supply) become a
problem when using it. The problem of handling ability indicates generation of bridge or scale
and dust scattering, and it is said that, in order to prevent them, it is desirable to make the
attached water be 5 to 10%.
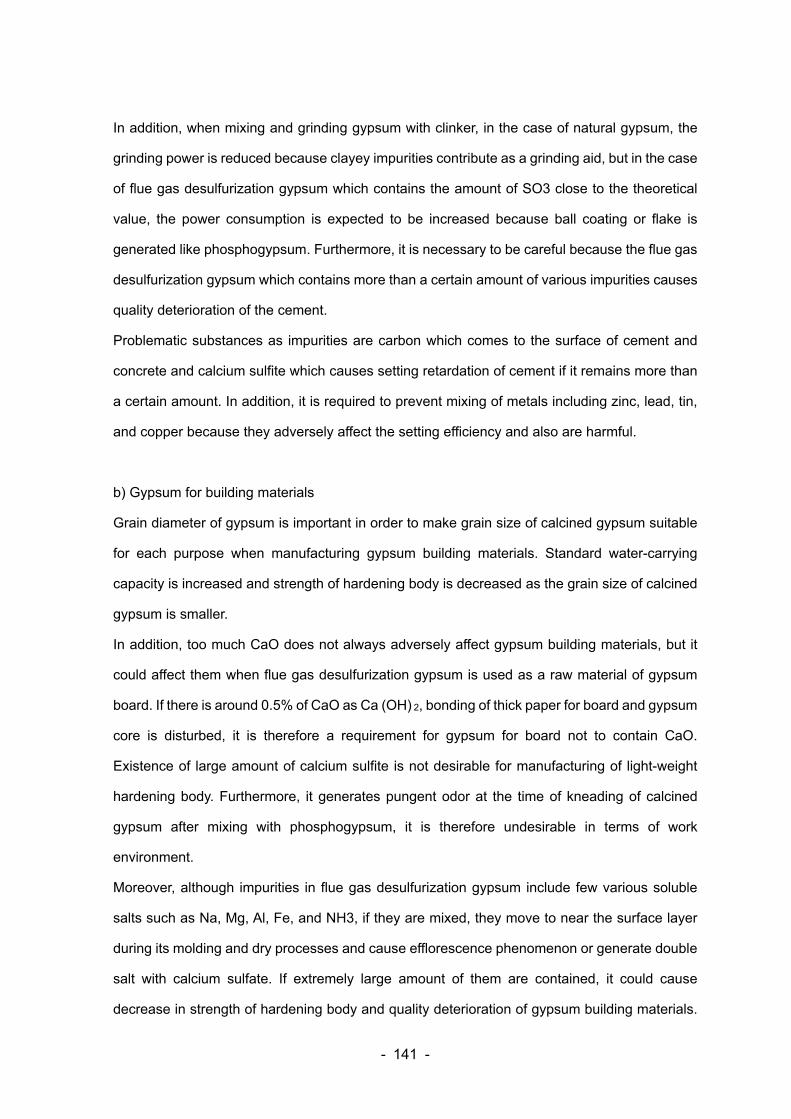
- 141 -
In addition, when mixing and grinding gypsum with clinker, in the case of natural gypsum, the
grinding power is reduced because clayey impurities contribute as a grinding aid, but in the case
of flue gas desulfurization gypsum which contains the amount of SO3 close to the theoretical
value, the power consumption is expected to be increased because ball coating or flake is
generated like phosphogypsum. Furthermore, it is necessary to be careful because the flue gas
desulfurization gypsum which contains more than a certain amount of various impurities causes
quality deterioration of the cement.
Problematic substances as impurities are carbon which comes to the surface of cement and
concrete and calcium sulfite which causes setting retardation of cement if it remains more than
a certain amount. In addition, it is required to prevent mixing of metals including zinc, lead, tin,
and copper because they adversely affect the setting efficiency and also are harmful.
b) Gypsum for building materials
Grain diameter of gypsum is important in order to make grain size of calcined gypsum suitable
for each purpose when manufacturing gypsum building materials. Standard water-carrying
capacity is increased and strength of hardening body is decreased as the grain size of calcined
gypsum is smaller.
In addition, too much CaO does not always adversely affect gypsum building materials, but it
could affect them when flue gas desulfurization gypsum is used as a raw material of gypsum
board. If there is around 0.5% of CaO as Ca (OH) 2, bonding of thick paper for board and gypsum
core is disturbed, it is therefore a requirement for gypsum for board not to contain CaO.
Existence of large amount of calcium sulfite is not desirable for manufacturing of light-weight
hardening body. Furthermore, it generates pungent odor at the time of kneading of calcined
gypsum after mixing with phosphogypsum, it is therefore undesirable in terms of work
environment.
Moreover, although impurities in flue gas desulfurization gypsum include few various soluble
salts such as Na, Mg, Al, Fe, and NH3, if they are mixed, they move to near the surface layer
during its molding and dry processes and cause efflorescence phenomenon or generate double
salt with calcium sulfate. If extremely large amount of them are contained, it could cause
decrease in strength of hardening body and quality deterioration of gypsum building materials.
- 142 -
On the other hand, because pH of most gypsum and gypsum products is near neutral and there
is no direct relation to the quality, the pH value is only a reference in many cases.
c) Gypsum for soil improvement
It is said that, when using flue gas desulfurization gypsum for soil improvement, it is desirable
to make its grain diameter be 2 to 5 mm by granulating operation and provide it with properties
including 500 g/pellet or more of crushing strength and disintegration in water.
In addition, it is also reported that Central Research Institute of Electric Power Industry makes
an effort to develop environmental cleanup materials (apatite hydroxide) made from
desulfurization gypsum and waste gypsum board. (Source: CRIEPI REPORT V05011)
Apatite hydroxide is one of the calcium phosphate minerals which has a composition of Ca10
(PO4)6(OH) 2. CRIEPI performed an elution test (Environment Agency notification No. 46) for a
synthesized apatite hydroxide sample as a soil environment cleanup material and got a result
that all of the elution amount of lead, cadmium, fluorine, arsenic, selenium and hexavalent
chromium are less than their soil environmental standard values. CRIEPI says, in the future,
optimization considering the cost and long-term adsorption evaluation, etc., are necessary.
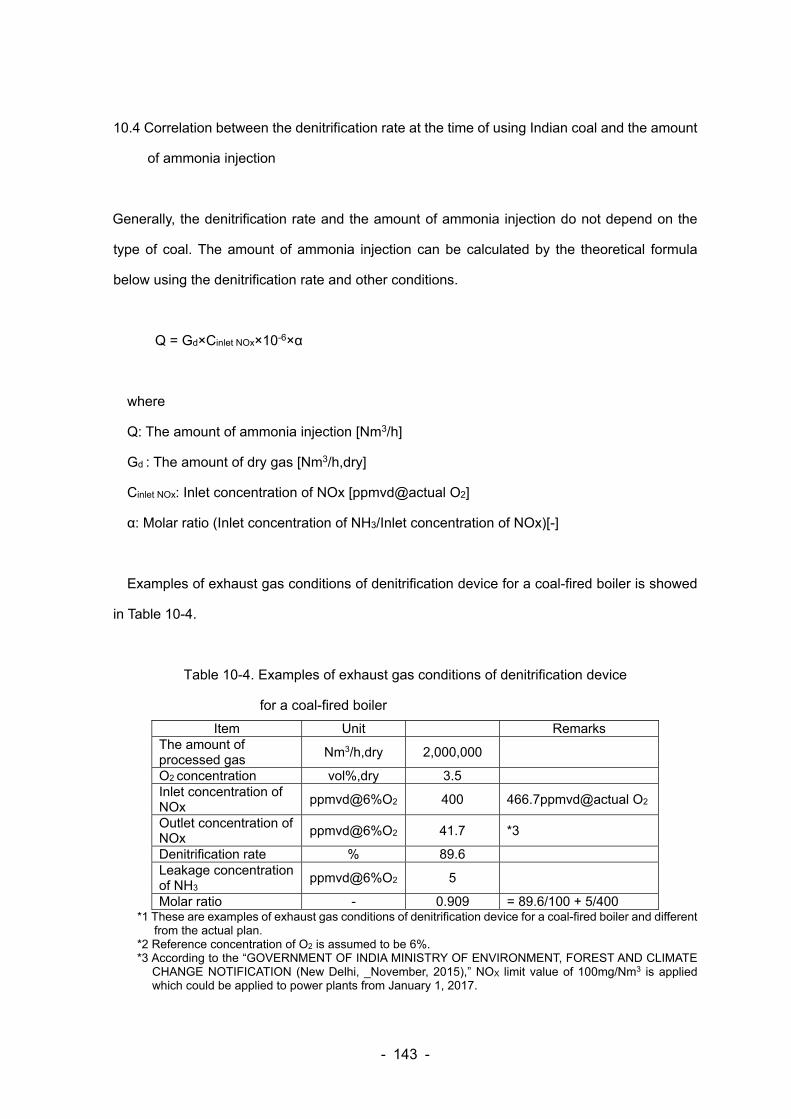
- 143 -
10.4 Correlation between the denitrification rate at the time of using Indian coal and the amount
of ammonia injection
Generally, the denitrification rate and the amount of ammonia injection do not depend on the
type of coal. The amount of ammonia injection can be calculated by the theoretical formula
below using the denitrification rate and other conditions.
Q = Gd×Cinlet NOx×10-6×α
where
Q: The amount of ammonia injection [Nm3/h]
Gd : The amount of dry gas [Nm3/h,dry]
Cinlet NOx: Inlet concentration of NOx [ppmvd@actual O2]
α: Molar ratio (Inlet concentration of NH3/Inlet concentration of NOx)[-]
Examples of exhaust gas conditions of denitrification device for a coal-fired boiler is showed
in Table 10-4.
Table 10-4. Examples of exhaust gas conditions of denitrification device
for a coal-fired boiler
Item Unit Remarks The amount of processed gas
Nm3/h,dry 2,000,000
O2 concentration vol%,dry 3.5 Inlet concentration of NOx
ppmvd@6%O2 400 466.7ppmvd@actual O2
Outlet concentration of NOx
ppmvd@6%O2 41.7 *3
Denitrification rate % 89.6 Leakage concentration of NH3
ppmvd@6%O2 5
Molar ratio - 0.909 = 89.6/100 + 5/400 *1 These are examples of exhaust gas conditions of denitrification device for a coal-fired boiler and different
from the actual plan. *2 Reference concentration of O2 is assumed to be 6%. *3 According to the “GOVERNMENT OF INDIA MINISTRY OF ENVIRONMENT, FOREST AND CLIMATE
CHANGE NOTIFICATION (New Delhi, _November, 2015),” NOX limit value of 100mg/Nm3 is applied which could be applied to power plants from January 1, 2017.

- 144 -
In this case, the amount of ammonia injection, Q is obtained by the formula below.
Q = 2,000,000×466.7×10-6×0.909 = 848.5[Nm3/h]
- 145 -
10.5 Considerations for the design of denitrification device when combusting high ash content
Indian coal.
As showed in Table 10-5, Indian coal is characterized by higher smoke dust concentration of 50
to 100g/Nm3 than other types of coal. Because of this, there are considerations for design of
denitrification device as follows.
(1) Abrasion
Due to increase in the amount of smoke dust in the exhaust gas, it is required to take
measures against abrasion of instruments such as a duct, inside structure of duct, ammonia
injection nozzle, guide vane, and denitrification catalyst. Especially, since the denitrification
catalyst is a key component of denitrification device, abrasion of the denitrification catalyst
could cause deterioration of denitrification performance. It is therefore necessary to take
measures by designing of the denitrification reactor according to the appropriate flow
velocity as well as by uniformizing the flow velocity distribution at the inlet of the
denitrification catalyst. In order to confirm that the flow velocity distribution at the inlet of the
denitrification catalyst is appropriate, CFD (Computational Fluid Dynamics) analysis and
model test are considered for utilization.
(2) Ash deposit
Due to increase in the amount of smoke dust in the exhaust gas, ash deposit on a horizontal
part of the duct or on the catalyst layer and blocking of the denitrification catalyst are
concerned. In order to avoid the blocking of the denitrification catalyst, as with the measures
against abrasion of the catalyst, it is important to design the denitrification reactor according
to the appropriate flow velocity and to uniformize the flow velocity distribution at the inlet of
the denitrification catalyst. In addition, installation of a dust removal device including a
steam soot blower and a sonic horn (sonic soot blower) for each catalyst layer is cited as
one of the measures to prevent ash deposit.
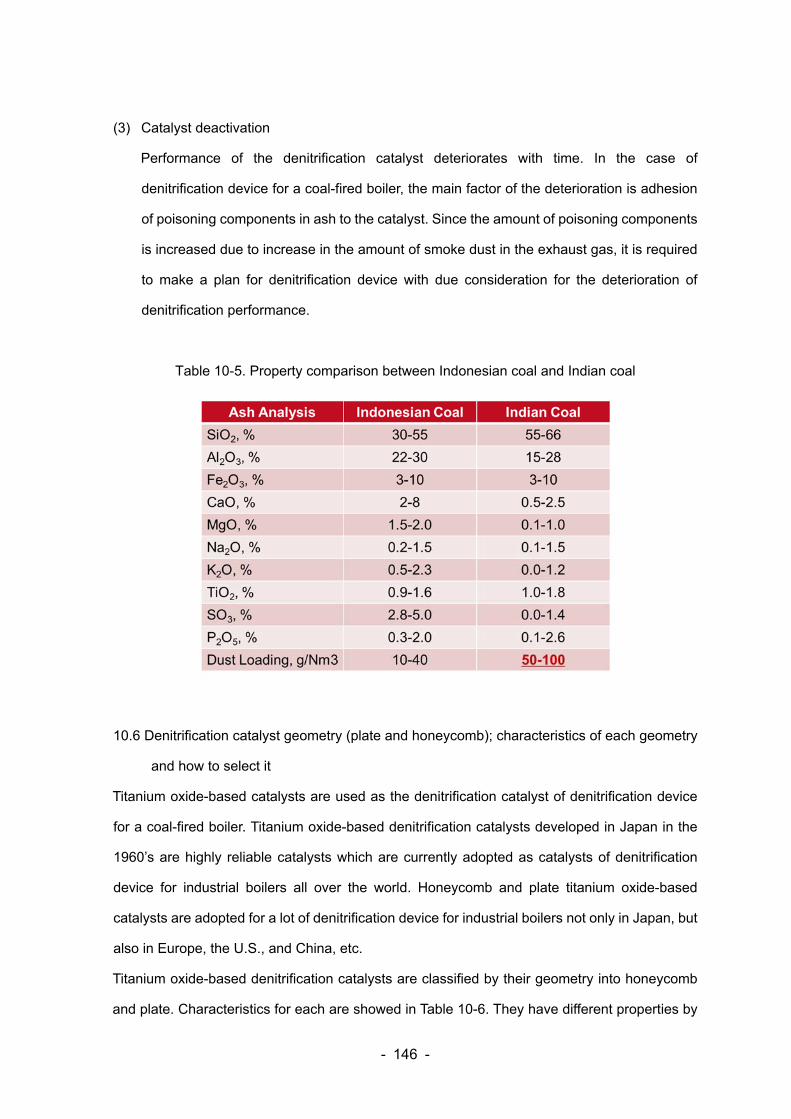
- 146 -
(3) Catalyst deactivation
Performance of the denitrification catalyst deteriorates with time. In the case of
denitrification device for a coal-fired boiler, the main factor of the deterioration is adhesion
of poisoning components in ash to the catalyst. Since the amount of poisoning components
is increased due to increase in the amount of smoke dust in the exhaust gas, it is required
to make a plan for denitrification device with due consideration for the deterioration of
denitrification performance.
Table 10-5. Property comparison between Indonesian coal and Indian coal
10.6 Denitrification catalyst geometry (plate and honeycomb); characteristics of each geometry
and how to select it
Titanium oxide-based catalysts are used as the denitrification catalyst of denitrification device
for a coal-fired boiler. Titanium oxide-based denitrification catalysts developed in Japan in the
1960’s are highly reliable catalysts which are currently adopted as catalysts of denitrification
device for industrial boilers all over the world. Honeycomb and plate titanium oxide-based
catalysts are adopted for a lot of denitrification device for industrial boilers not only in Japan, but
also in Europe, the U.S., and China, etc.
Titanium oxide-based denitrification catalysts are classified by their geometry into honeycomb
and plate. Characteristics for each are showed in Table 10-6. They have different properties by
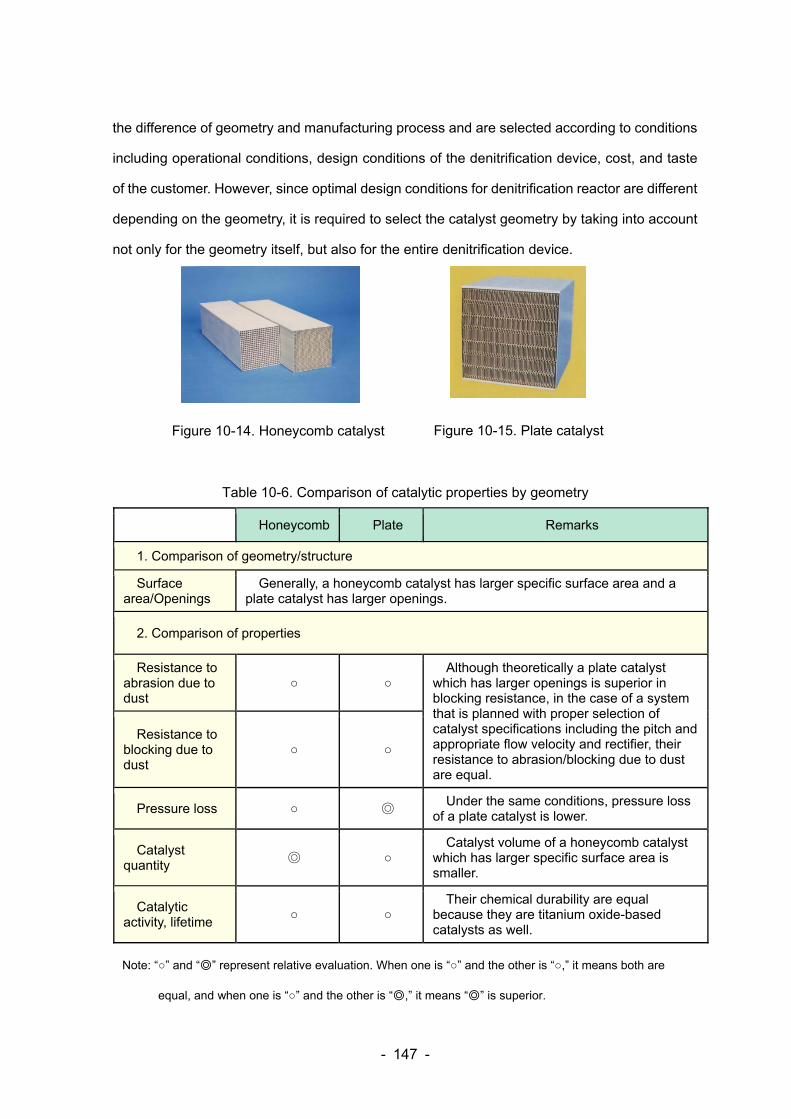
- 147 -
the difference of geometry and manufacturing process and are selected according to conditions
including operational conditions, design conditions of the denitrification device, cost, and taste
of the customer. However, since optimal design conditions for denitrification reactor are different
depending on the geometry, it is required to select the catalyst geometry by taking into account
not only for the geometry itself, but also for the entire denitrification device.
Table 10-6. Comparison of catalytic properties by geometry
Honeycomb Plate Remarks
1. Comparison of geometry/structure
Surface area/Openings
Generally, a honeycomb catalyst has larger specific surface area and a plate catalyst has larger openings.
2. Comparison of properties
Resistance to abrasion due to dust
Although theoretically a plate catalyst
which has larger openings is superior in blocking resistance, in the case of a system that is planned with proper selection of catalyst specifications including the pitch and appropriate flow velocity and rectifier, their resistance to abrasion/blocking due to dust are equal.
Resistance to blocking due to dust
Pressure loss Under the same conditions, pressure loss
of a plate catalyst is lower.
Catalyst quantity
Catalyst volume of a honeycomb catalyst
which has larger specific surface area is smaller.
Catalytic activity, lifetime
Their chemical durability are equal
because they are titanium oxide-based catalysts as well.
Figure 10-14. Honeycomb catalyst Figure 10-15. Plate catalyst
Note: “” and “” represent relative evaluation. When one is “” and the other is “,” it means both are
equal, and when one is “” and the other is “,” it means “” is superior.
![[PPT]Coal Combustion - BGU · Web viewCoal Combustion Nadine Spitz Environmental Engineering Ben-Gurion University Contents What is coal? Formation, sources, applications. Coal combustion](https://img.pdfslide.us/doc/110x75/5ad704077f8b9a5b538c15a7/pptcoal-combustion-viewcoal-combustion-nadine-spitz-environmental-engineering.jpg)