Embed Size (px)
Citation preview

1
Environmental Services Sector Report This report covers environmental services: waste and environmental services: water
1. This is a report for the House of Commons Committee on Exiting the European Union following the motion passed at the Opposition Day debate on 1 November, which called on the Government to provide the Committee with impact assessments arising from the sectoral analysis it has conducted with regards to the list of 58 sectors referred to in the answer of 26 June 2017 to Question 239.
2. As the Government has already made clear, it is not the case that 58 sectoral impact assessments exist. The Government’s sectoral analysis is a wide mix of qualitative and quantitative analysis contained in a range of documents developed at different times since the referendum. This report brings together information about the sector in a way that is accessible and informative. Some reports aggregate some sectors in order to either avoid repetition of information or because of the strong interlinkages between some of these sectors.
3. This report covers: a description of the sector, the current EU regulatory regime,
existing frameworks for how trade is facilitated between countries in this sector, and sector views. It does not contain commercially-, market- or negotiation-sensitive information.
Description of sector 4. The water and waste sectors provide essential infrastructure and services to homes
and businesses in the UK. 5. The two sectors are structurally different. The water sector is price-regulated and
largely serves a UK market. 6. In contrast, the waste sector is characterised by a much larger number of players,
serving customers in the UK and abroad in a competitive market. Water
7. The structure of the water industry is complex:
● In England and Wales, all services are provided by private companies1:
o Twenty-one undertakers hold a regional monopoly over the supply of wholesale water and/or sewerage services and household retail services in their area of appointment. A small and decreasing number also offer retail services to business and other non-household customers. Of the twenty-one companies, some are publicly listed while one is not-for- profit.
1 Licences, Ofwat, 2016: http://www.ofwat.gov.uk/regulated-companies/licences/ .
2
o Twenty-three licensees compete nationally to provide water supply and/or sewerage retail services to business and other non-household customers.
● In Scotland, wholesale services for water and sewerage (collection, treatment and distribution) and household retail services are provided by a government-owned company. Twenty-six private companies2 are licensed to provide business retail services in a competitive market.
● In Northern Ireland, all services are provided by a government-owned company.
The variation in delivery models derives from historical differences in provision of these services, rather than the nature of service provision in these regions.
8. Revenues and workforce for the largest companies are presented in Figures 1 and 2. Figure 3 shows the structure of the water industry across the UK.3
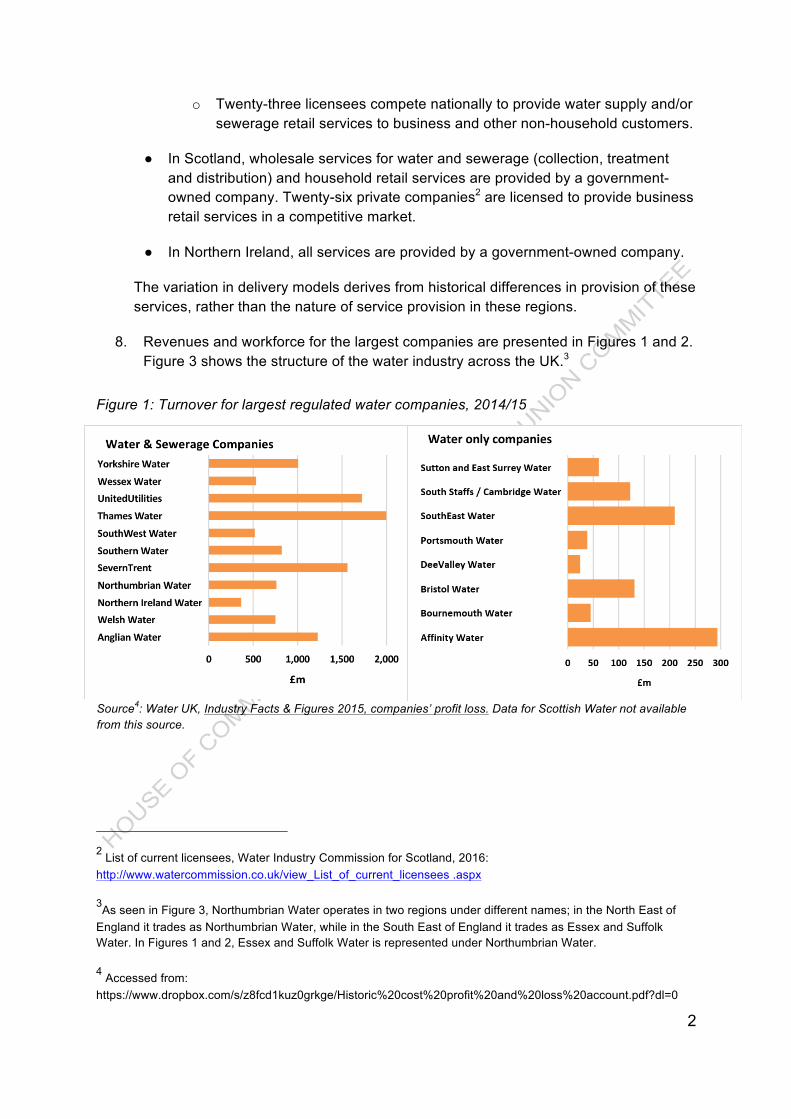
Figure 1: Turnover for largest regulated water companies, 2014/15
Source4: Water UK, Industry Facts & Figures 2015, companies’ profit loss. Data for Scottish Water not available from this source.
2 List of current licensees, Water Industry Commission for Scotland, 2016: http://www.watercommission.co.uk/view_List_of_current_licensees .aspx
3As seen in Figure 3, Northumbrian Water operates in two regions under different names; in the North East of England it trades as Northumbrian Water, while in the South East of England it trades as Essex and Suffolk Water. In Figures 1 and 2, Essex and Suffolk Water is represented under Northumbrian Water.
4 Accessed from: https://www.dropbox.com/s/z8fcd1kuz0grkge/Historic%20cost%20profit%20and%20loss%20account.pdf?dl=0
3
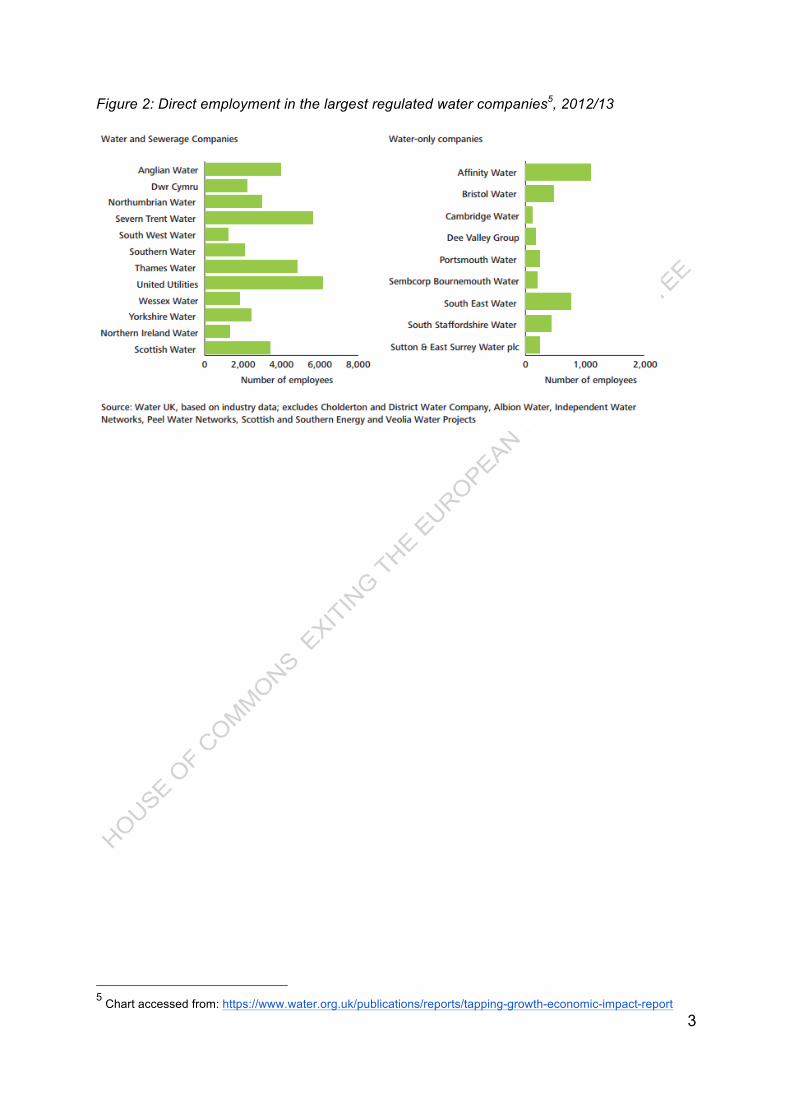
Figure 2: Direct employment in the largest regulated water companies5, 2012/13
5 Chart accessed from: https://www.water.org.uk/publications/reports/tapping-growth-economic-impact-report

4
Figure 3: Structure of the UK water sector
Licensees are not depicted. Some undertakers have appointments in separate regions: Cambridge Water is owned by South Staffordshire Water, Essex and Suffolk Water is owned by Northumbrian Water and Hartlepool Water is owned by Anglian Water. Bournemouth Water and South West Water share the same parent company (Pennon Group).
9. The structure of the industry in England is evolving, with increased potential for competition and trade:
● Since April 2017, all non-household (e.g. business, public sector and charity) customers have been able to switch between retailers for both water supply and sewerage services, with new entry into these retail markets anticipated. Previously, only those with a high water consumption could do this, and only for water supply.
● Beyond this, Ofwat is enabling competition in the wholesale water and sewerage markets (i.e. for licensees to provide water resources into the supply network and to provide sewage sludge collection, treatment and disposal services); and is
5
driving water companies to procure the delivery and management of new assets. Many of these changes will take effect from 2020. 6
● In addition, last year, Ofwat examined the costs and benefits of extending competition to the household retail market. They identified a range of scenarios, finding potential benefits of up to £2.9 billion.7 Further work needs to be done however, both to make sure that these benefits could be realised, and to understand and mitigate any impacts there could be on vulnerable customers. It is also important to learn the lessons from the opening of the business market.
10. The privatisation model applied in parts of the UK is unique, with undertakers having responsibility for planning, financing, delivering and operating the necessary infrastructure. Elsewhere in the EU, public authorities typically retain responsibility for planning and financing infrastructure, with a large number of small public and private companies delivering and operating infrastructure.
11. The Water Act 2014 reforms aim to make it easier for businesses to change their water suppliers. The reforms also open up the water and sewerage market to greater competition. The market reforms introduced in the Act extend to both England and Wales. To date, the key reforms have been commenced in England, but not in most respects in Wales. As the structure of the water industry in England evolves, there may be greater opportunities for UK businesses to compete overseas. For example, licensed retailers may be able to compete in utility retail markets in the UK and abroad. Equally, there may be significant potential for foreign operators to enter into the English market, for example to deliver and operate new assets, or to provide sewage sludge treatment services.
Waste
12. The waste sector is primarily waste management services. These include the collection, recovery and disposal of both non-hazardous and hazardous waste, from households and the private and public sectors. Waste recovery and disposal services cover reuse, recycling, incineration of waste, biological processes such as anaerobic digestion of food waste, and landfilling of residual waste.
13. In the UK, demand for these services are mandated: local authorities are required to offer waste collection and disposal services to households, and businesses are required to manage their waste appropriately. The type of waste management provision for households depends on location. In England, although local authorities have to offer some form of recycling, it is up to the discretion of local authorities to decide what type of service is provided. The collection service provided will impact directly on the appropriate types of recovery and disposal services. Waste
6 Ofwat (2020) ‘Delivering Water 2020: Consulting on our methodology for the 2019 price review’ https://www.ofwat.gov.uk/consultation/delivering-water2020-consulting-on-our-methodology-for-the-2019-price-review/
7 Ofwat :www.ofwat.gov.uk/regulated-companies/future-markets/extending-retail-competition-to-households/cost-benefit/

6
management is a devolved responsibility. In Wales, for example, statutory recycling targets and a standardised model have led to high recycling rates, and separate food waste collection.
14. The number of firms involved in waste management and remediation activities grew by more than a third between 2008 and 2014 from 4,499 to 6,182.
Figure 4: Structure of the UK waste sector: waste management and remediation activities (number of enterprises), 2008-15
2008 2009 2010 2011 2012 2013 2014 2015
Waste collection 1461 1921 2053 2186 2356 2377 2363 2463
Waste and treatment disposal
879 617 706 803 946 989 994 1061
Materials recovery 2027 1905 1837 1951 1884 1977 1902 1889
Remediation activities and other waste management services
132 245 347 459 603 696 768 794
Total waste management and remediation activities
4499 4688 4943 5399 5789 6039 6027 6207
Source: ONS Annual Business Survey, 2017
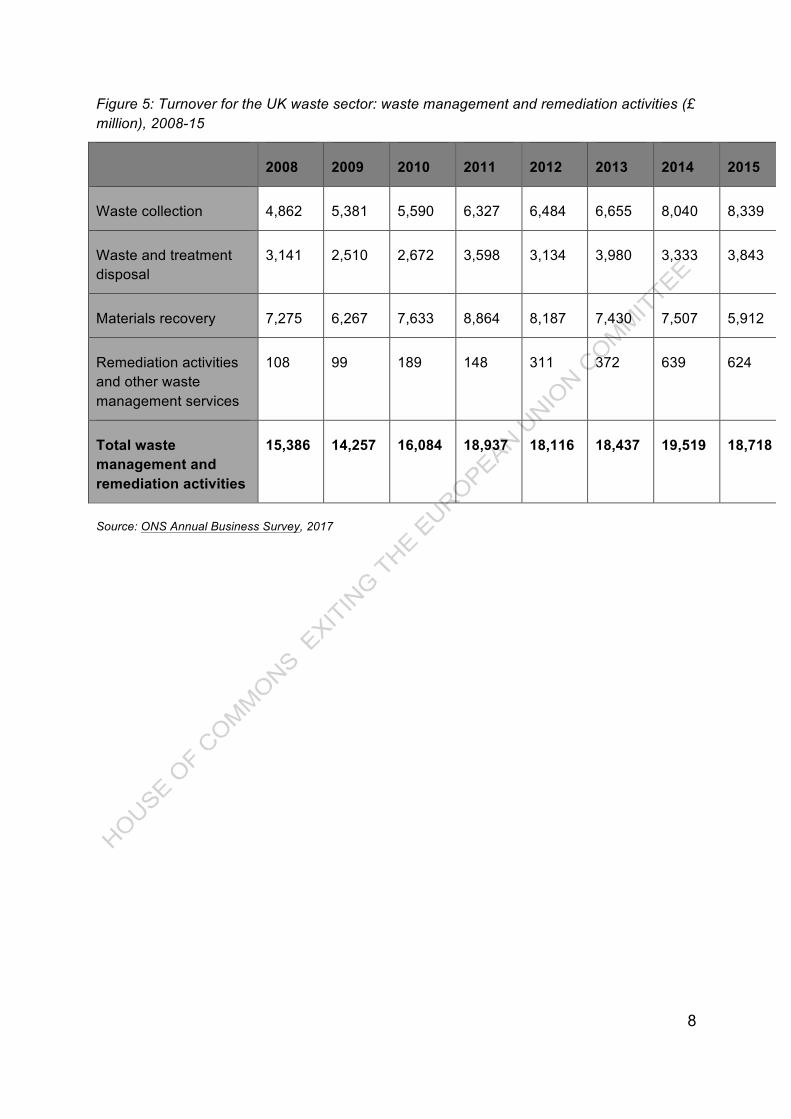
15. Turnover in the sector increased 16.2% between 2008 and 2016, mainly driven by growth in waste collection turnover (71.5%) - see figure 5.
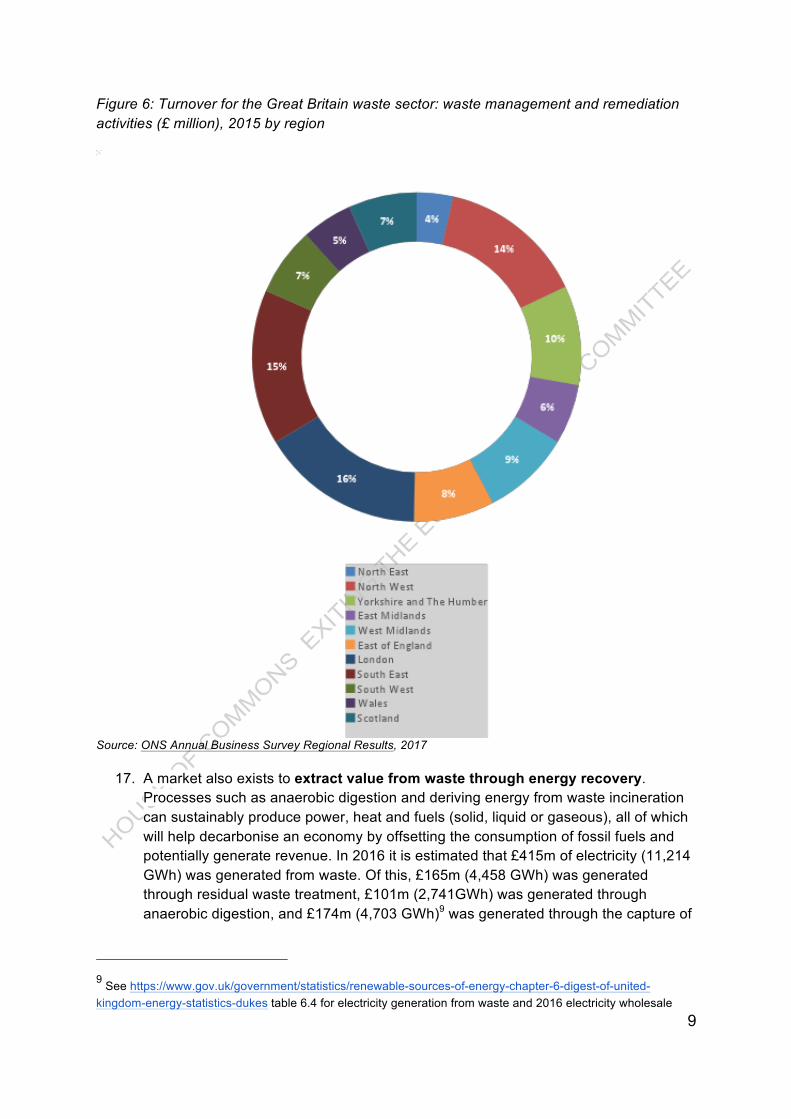
16. Waste management services are distributed according to waste generation, which is driven by consumption and economic activity. As such, turnover in the sector is higher in areas with higher population and levels of economic activity, such as the South East (17%), North West (13%), and London (14%)8.
8 2015/16 figures for local authority collected waste, available at: https://www.gov.uk/government/statistical-data-sets/env18-local-authority-collected-waste-annual-results-tables

7
8
Figure 5: Turnover for the UK waste sector: waste management and remediation activities (£ million), 2008-15
2008 2009 2010 2011 2012 2013 2014 2015
Waste collection 4,862 5,381 5,590 6,327 6,484 6,655 8,040 8,339
Waste and treatment disposal
3,141 2,510 2,672 3,598 3,134 3,980 3,333 3,843
Materials recovery 7,275 6,267 7,633 8,864 8,187 7,430 7,507 5,912
Remediation activities and other waste management services
108 99 189 148 311 372 639 624
Total waste management and remediation activities
15,386 14,257 16,084 18,937 18,116 18,437 19,519 18,718
Source: ONS Annual Business Survey, 2017
9
Figure 6: Turnover for the Great Britain waste sector: waste management and remediation activities (£ million), 2015 by region
Source: ONS Annual Business Survey Regional Results, 2017
17. A market also exists to extract value from waste through energy recovery. Processes such as anaerobic digestion and deriving energy from waste incineration can sustainably produce power, heat and fuels (solid, liquid or gaseous), all of which will help decarbonise an economy by offsetting the consumption of fossil fuels and potentially generate revenue. In 2016 it is estimated that £415m of electricity (11,214 GWh) was generated from waste. Of this, £165m (4,458 GWh) was generated through residual waste treatment, £101m (2,741GWh) was generated through anaerobic digestion, and £174m (4,703 GWh)9 was generated through the capture of
9 See https://www.gov.uk/government/statistics/renewable-sources-of-energy-chapter-6-digest-of-united-kingdom-energy-statistics-dukes table 6.4 for electricity generation from waste and 2016 electricity wholesale

10
landfill gas. The value of energy recovered is included within the definition of waste management services.
18. The sector’s business model has diversified such that it now receives revenue from the sale of recovered materials (such as recycled plastic packaging; the use of recycled plastic in automotive parts; glass bottles; construction aggregate). Using recycled materials can offset consumption of virgin material, thereby helping to manage supply risks, minimise price volatility and improve sustainability. Value can also be derived from the sale of waste and scrap materials themselves (such as selling scrap metal). However the market for recyclate is volatile and particularly vulnerable to changes in market conditions and commodity prices. Some of the value of these activities is included within the definition of waste management services (SIC code 38)10, such as the sorting and pelleting of plastics to produce secondary raw material; and crushing, cleaning and sorting of glass. But activities such as remelting ferrous waste and scrap, or the manufacture of new final products from secondary raw materials (e.g. making pulp from paper waste; or the production of metal from scrap metal), will be captured within other sectors, predominantly manufacturing. Activities such as the wholesale of waste and scrap are dependent on the waste sector. Although not explicitly covered here to avoid overlap with other sector reports, these activities should be borne in mind when assessing the economic importance of the waste sector.
19. Figure 7 and Figure 8 describe the economic impact of a different grouping of waste activities which relate to a low carbon economy, rather than the narrower definition of the sector presented throughout most of this report. Note that as defined, much of this activity sits outside SICs 38 and 3911.
Figure 7: Turnover for the UK waste sector: recycling, energy from waste and biomass activities, including supply chain (turnover, £ million nominal), 2010-13
2010 2011 2012 2013
Recycling: recovery and reprocessing of materials from waste 18700 15900 19000 21800
Energy generation from waste and biomass 3800 3500 4000 4100
Alternative fuels 14400 13600 18500 26100
Biomass equipment 2100 2000 2200 2500
prices at https://www.gov.uk/government/uploads/system/uploads/attachment_data/file/599601/Annex-m-price-growth-assumptions.xls.
10 Standard industrial classification of economic activities 11 Ibid

11
Total recycling, energy from waste and biomass activities 39000 35000 43700 54600
Source: BEIS, The size and performance of the UK low-carbon economy, 2015
Figure 8: Firms, employment, turnover and GVA for recycling, energy from UK waste and biomass activities, including supply chain, 2013
Source: BEIS, The size and performance of the UK low-carbon economy, 2015
The Water and Waste Sector Supply Chains
20. Both the water and waste sectors depend on a supply chain that provides goods and services for both UK and overseas markets (including to other sectors). The supply chain largely sits outside the classification of the water and waste sectors.
21. The water sector supply chain includes businesses, including many SMEs, with expertise in issues including:
● engineering consultancy services; ● financial consultancy services; ● flood risk management;
● network and environmental monitoring;
● mobile data transmission;

12
● smart water and leakage management;
● asset management and optimisation;
● waste and wastewater treatment; ● energy recovery from wastewater;
and ● water efficiency.
22. The waste sector supply chain includes businesses with expertise in issues such as:
● waste management consultancy services (e.g. on waste management strategy, options appraisal, scenario modelling, capacity building, service design, procurement, implementation and monitoring);
● biological treatment technologies (e.g. anaerobic digestion and mechanical biological treatments to produce solid fuels);
● thermal treatment technologies (e.g. incineration, gasification and pyrolysis);
● technical testing and analysis and certification;
● regulation of environmental protection programmes; and
● clean technologies.
23. The direction of travel in the waste sector is to move beyond thinking about how to manage waste, to a more circular economy approach focus on improved resource efficiency. This approach encompasses much more than just the disposal of waste, but the design of more resource efficient goods; increased use of recycled materials substituting for virgin materials; and extending product life. This holistic approach to resource efficiency holds significant opportunity: WRAP12 believes that it has the potential to increase the UK‘s net exports by more than £20bn and create 10,000 new jobs in the recycling sector alone, also allowing business to reduce costs by more than £50bn/year by 202013.
Figure 9: Circular economy
Contribution to GVA
24. The water and waste sectors generated £17.8 billion GVA in 2016. Much of this was generated by the Waste management sector (industries 37-39), which accounted for
12 WRAP (Waste, Resources and Action Programme) is a registered charity. It works with businesses, individuals and communities to achieve a circular economy through helping them reduce waste, develop sustainable products and use resources in an efficient way.
13 http://www.policyconnect.org.uk/apsrg/news/wrap-ceo-says-uk-requires-new-business-models

13
£12.9 billion GVA. Figures for the other UK administrations are not published by ONS to avoid disclosure.
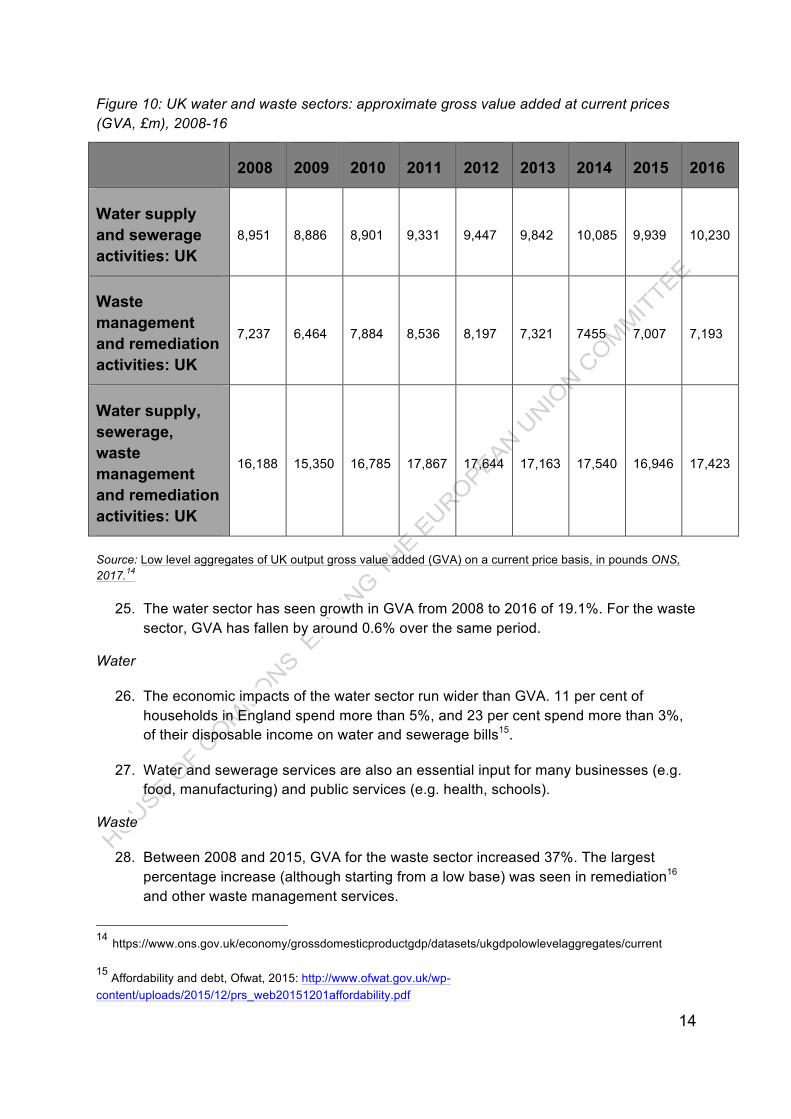
14
Figure 10: UK water and waste sectors: approximate gross value added at current prices (GVA, £m), 2008-16
2008 2009 2010 2011 2012 2013 2014 2015 2016
Water supply and sewerage activities: UK
8,951 8,886 8,901 9,331 9,447 9,842 10,085 9,939 10,230
Waste management and remediation activities: UK
7,237 6,464 7,884 8,536 8,197 7,321 7455 7,007 7,193
Water supply, sewerage, waste management and remediation activities: UK
16,188 15,350 16,785 17,867 17,644 17,163 17,540 16,946 17,423
Source: Low level aggregates of UK output gross value added (GVA) on a current price basis, in pounds ONS, 2017.14
25. The water sector has seen growth in GVA from 2008 to 2016 of 19.1%. For the waste sector, GVA has fallen by around 0.6% over the same period.
Water
26. The economic impacts of the water sector run wider than GVA. 11 per cent of households in England spend more than 5%, and 23 per cent spend more than 3%, of their disposable income on water and sewerage bills15.
27. Water and sewerage services are also an essential input for many businesses (e.g. food, manufacturing) and public services (e.g. health, schools).
Waste
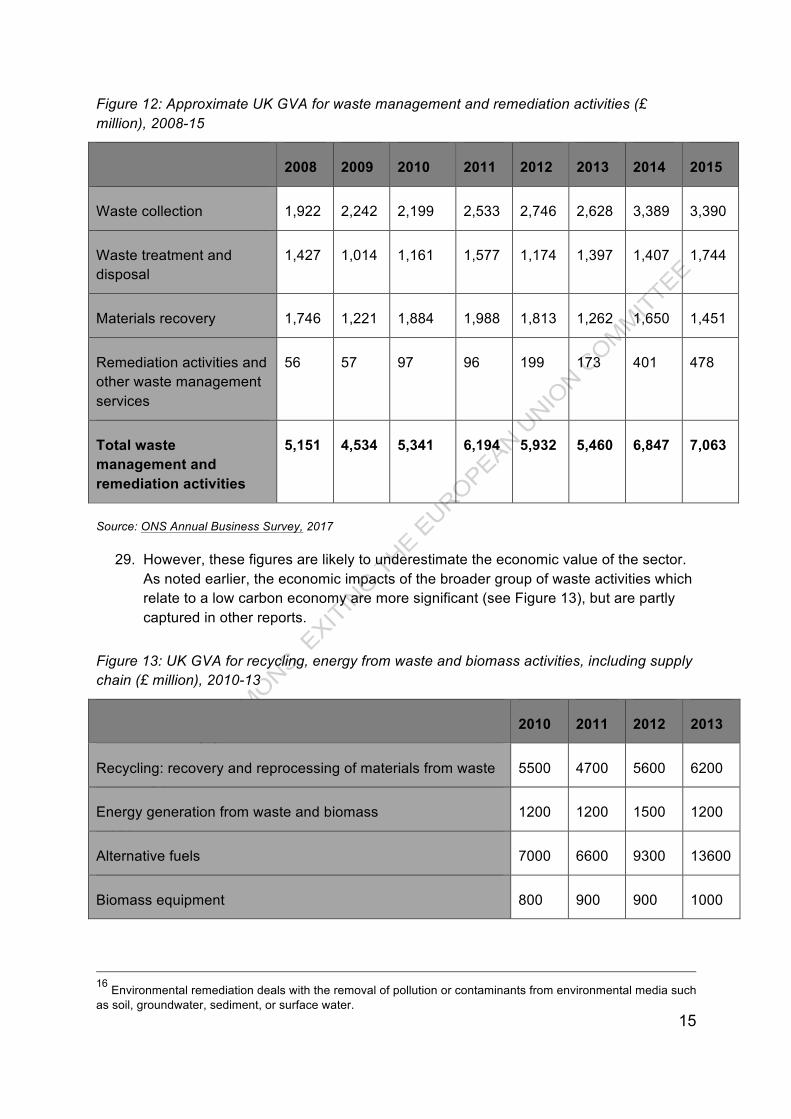
28. Between 2008 and 2015, GVA for the waste sector increased 37%. The largest percentage increase (although starting from a low base) was seen in remediation16 and other waste management services.
14 https://www.ons.gov.uk/economy/grossdomesticproductgdp/datasets/ukgdpolowlevelaggregates/current
15 Affordability and debt, Ofwat, 2015: http://www.ofwat.gov.uk/wp-content/uploads/2015/12/prs_web20151201affordability.pdf
15
Figure 12: Approximate UK GVA for waste management and remediation activities (£ million), 2008-15
2008 2009 2010 2011 2012 2013 2014 2015
Waste collection 1,922 2,242 2,199 2,533 2,746 2,628 3,389 3,390
Waste treatment and disposal
1,427 1,014 1,161 1,577 1,174 1,397 1,407 1,744
Materials recovery 1,746 1,221 1,884 1,988 1,813 1,262 1,650 1,451
Remediation activities and other waste management services
56 57 97 96 199 173 401 478
Total waste management and remediation activities
5,151 4,534 5,341 6,194 5,932 5,460 6,847 7,063
Source: ONS Annual Business Survey, 2017
29. However, these figures are likely to underestimate the economic value of the sector. As noted earlier, the economic impacts of the broader group of waste activities which relate to a low carbon economy are more significant (see Figure 13), but are partly captured in other reports.
Figure 13: UK GVA for recycling, energy from waste and biomass activities, including supply chain (£ million), 2010-13
2010 2011 2012 2013
Recycling: recovery and reprocessing of materials from waste 5500 4700 5600 6200
Energy generation from waste and biomass 1200 1200 1500 1200
Alternative fuels 7000 6600 9300 13600
Biomass equipment 800 900 900 1000
16 Environmental remediation deals with the removal of pollution or contaminants from environmental media such as soil, groundwater, sediment, or surface water.
16
Total recycling, energy from waste and biomass activities 14500 13300 17300 21900
Source: BEIS, The size and performance of the UK low-carbon economy, 2015
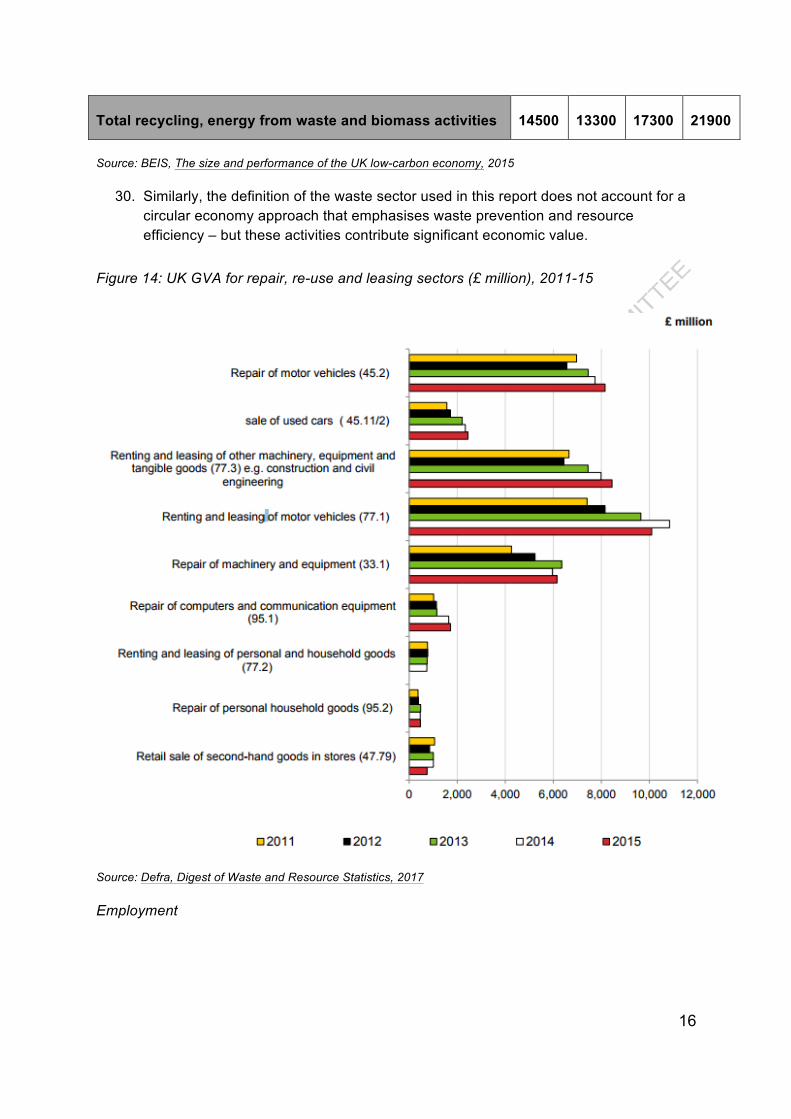
30. Similarly, the definition of the waste sector used in this report does not account for a circular economy approach that emphasises waste prevention and resource efficiency – but these activities contribute significant economic value.
Figure 14: UK GVA for repair, re-use and leasing sectors (£ million), 2011-15
Source: Defra, Digest of Waste and Resource Statistics, 2017
Employment

17
31. The Annual Business Survey suggests that there were 167,000 people employed in the water and waste sectors in the UK on average during 2015. 100,000 of these jobs were provided by the waste sector17.
Water
32. The water sector accounted for 62,000 jobs in 201618. Employment in the water sector is relatively evenly distributed across the UK (see Figure 2).
33. Three per cent of the workforce (1,740 jobs) consists of foreign nationals. Of this, two-thirds are EU nationals (1160 jobs) and one-third are from outside the EU (580 jobs).19 There are no water industry occupations on the UK Shortage Occupation list. However, the sector currently makes use of skilled migration to address an increasing shortage of scientists, engineers and technicians20.
34. The wider supply chain for water employs an estimated 117,000 people in the UK. According to analysis by Energy and Utility Skills21, 16.6 per cent of the workforce involved in the construction of water projects is drawn from the EU.
Waste
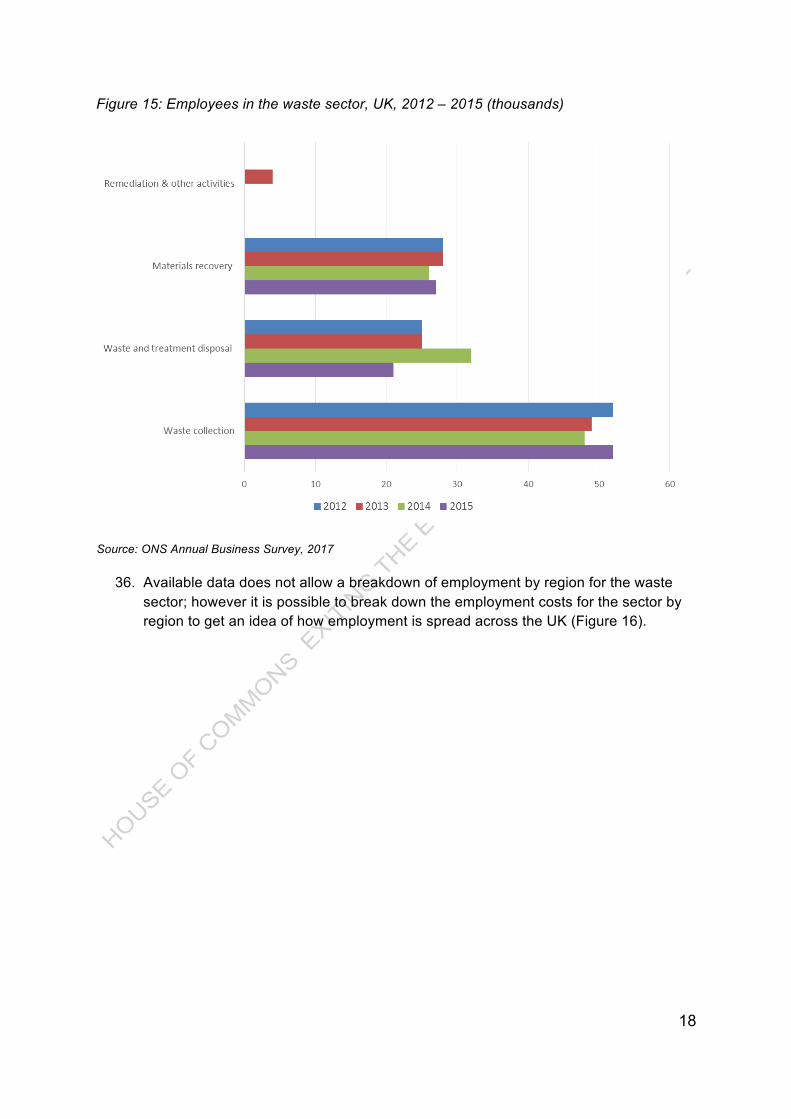
35. Figure 15 details the recent trends in employment across waste collection, treatment and disposal, materials recovery and remediation activities.
17 ONS Annual Business Survey,(2016) : https://www.ons.gov.uk/businessindustryandtrade/business/businessservices/datasets/uknonfinancialbusinesseconomyannualbusinesssurveysectionsas. 18 ONS, Annual Business Survey (2016) : https://www.ons.gov.uk/businessindustryandtrade/business/businessservices/datasets/uknonfinancialbusinesseconomyannualbusinesssurveysectionsas
19 Energy & Utility Skills interrogation of ONS (2015) Labour Force Survey. Taken from Energy & Utility Skills (2017) ‘Migration Advisory Committee: Call for Evidence- A sector response from Energy & Utility Skills’. Note this is not a published document, available on request from Energy & Utility Skills. http://www.euskills.co.uk/contact-us.
20 The skills deficit: consequences and opportunities for UK water infrastructure, Atkins, 2015: http://www.atkinsglobal.co.uk/~/media/Files/A/Atkins-Corporate/uk-and-europe/uk-thought-leadership/reports/The Skills Deficit Report for Water.pdf.
21 Energy & Utility Skills interrogation of ONS (2015) Labour Force Survey. See Energy & Utility Skills (2017) ‘A sector response from Energy & Utility Skills’
18
Figure 15: Employees in the waste sector, UK, 2012 – 2015 (thousands)
Source: ONS Annual Business Survey, 2017
36. Available data does not allow a breakdown of employment by region for the waste sector; however it is possible to break down the employment costs for the sector by region to get an idea of how employment is spread across the UK (Figure 16).
19
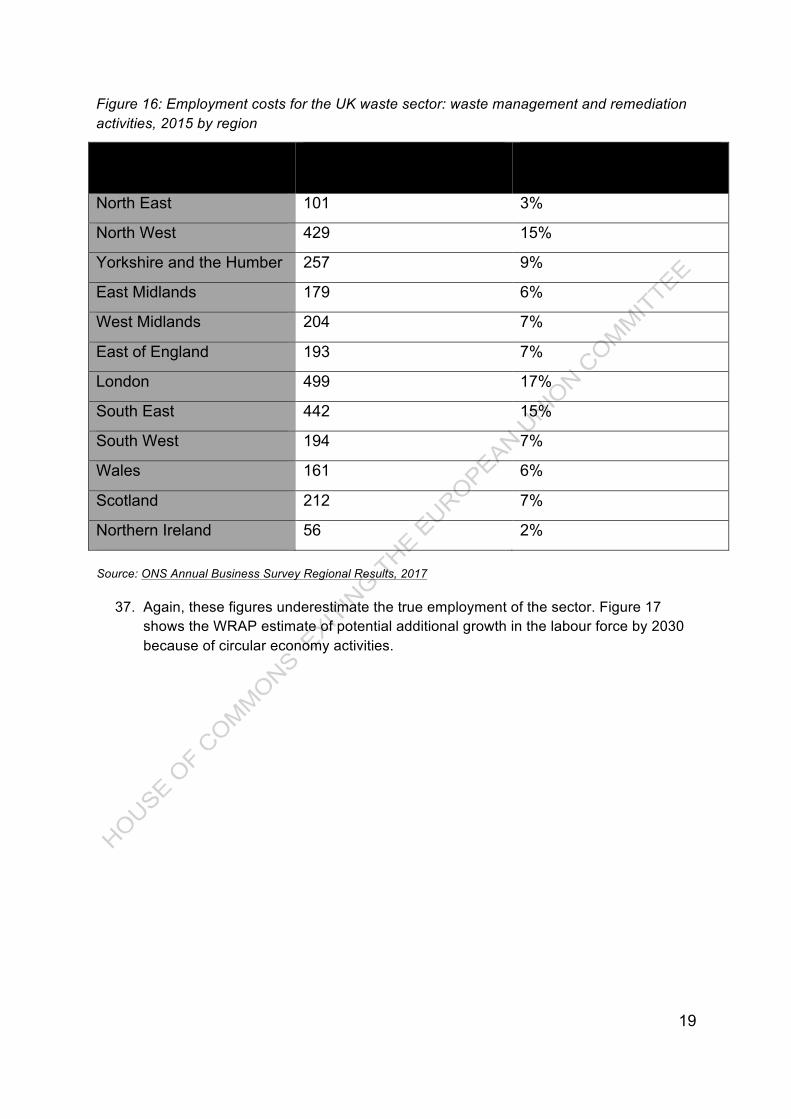
Figure 16: Employment costs for the UK waste sector: waste management and remediation activities, 2015 by region
Region Total Employment Costs (£ million)
Percentage of the total sector
North East 101 3%
North West 429 15%
Yorkshire and the Humber 257 9%
East Midlands 179 6%
West Midlands 204 7%
East of England 193 7%
London 499 17%
South East 442 15%
South West 194 7%
Wales 161 6%
Scotland 212 7%
Northern Ireland 56 2%
Source: ONS Annual Business Survey Regional Results, 2017
37. Again, these figures underestimate the true employment of the sector. Figure 17 shows the WRAP estimate of potential additional growth in the labour force by 2030 because of circular economy activities.

20
Figure 17: Net job creation in circular economy activity to 2030 at current growth rate, as a per cent of the labour force
Source: WRAP
38. Figure 18 shows the employment contribution of waste activities related to the low carbon economy, which are not fully captured in the data for SIC 38 and 39.
Figure 18: UK employment in recycling, energy from waste and biomass activities, including supply chain (workforce jobs), 2010-13
2010 2011 2012 2013
Recycling: recovery and reprocessing of materials from waste
85200 86200 89600 93500
Energy generation from waste and biomass 20100 20100 20600 21900
Alternative fuels 17100 17800 18700 19800
Biomass equipment 10900 11700 11700 11700
Total recycling, energy from waste and biomass activities
133300
135800
140600
146900
Source: BEIS, The size and performance of the UK low-carbon economy, 2015
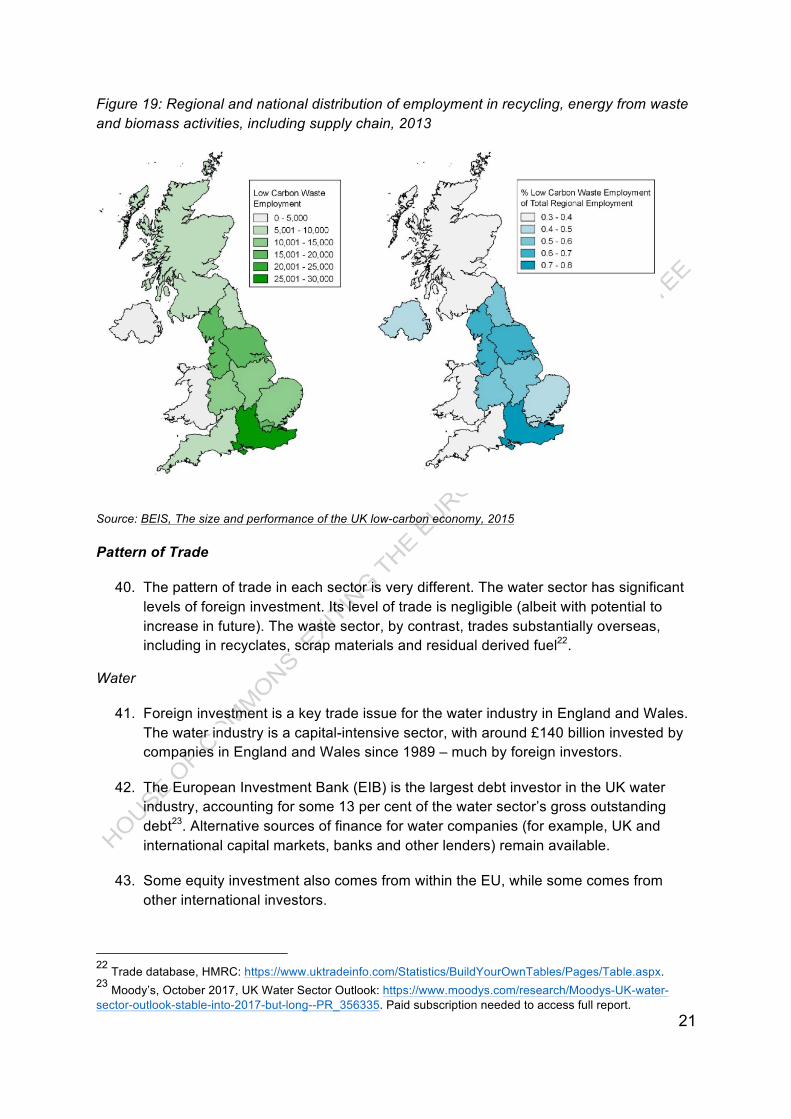
39. Low carbon waste employment is fairly evenly split across the UK, although highest in the more industrial regions of England (Figure 19).
21
Figure 19: Regional and national distribution of employment in recycling, energy from waste and biomass activities, including supply chain, 2013
Source: BEIS, The size and performance of the UK low-carbon economy, 2015
Pattern of Trade
40. The pattern of trade in each sector is very different. The water sector has significant levels of foreign investment. Its level of trade is negligible (albeit with potential to increase in future). The waste sector, by contrast, trades substantially overseas, including in recyclates, scrap materials and residual derived fuel22.
Water
41. Foreign investment is a key trade issue for the water industry in England and Wales. The water industry is a capital-intensive sector, with around £140 billion invested by companies in England and Wales since 1989 – much by foreign investors.
42. The European Investment Bank (EIB) is the largest debt investor in the UK water industry, accounting for some 13 per cent of the water sector’s gross outstanding debt23. Alternative sources of finance for water companies (for example, UK and international capital markets, banks and other lenders) remain available.
43. Some equity investment also comes from within the EU, while some comes from other international investors.
22 Trade database, HMRC: https://www.uktradeinfo.com/Statistics/BuildYourOwnTables/Pages/Table.aspx. 23 Moody’s, October 2017, UK Water Sector Outlook: https://www.moodys.com/research/Moodys-UK-water-sector-outlook-stable-into-2017-but-long--PR_356335. Paid subscription needed to access full report.
22
44. Three per cent of the water industry workforce is from outside the UK. Some essential inputs are currently imported very largely from the EU, e.g. certain water treatment chemicals.
45. Trade in water and sewerage services itself is negligible, for reasons that are explained above. Trade in these services generated £16 million of imports and £3 million of exports in 2014. Market reform is expected to change this – increasing the potential for entry by overseas firms into parts of the sector and creating opportunities for UK businesses to sell new and innovative services abroad.
Waste
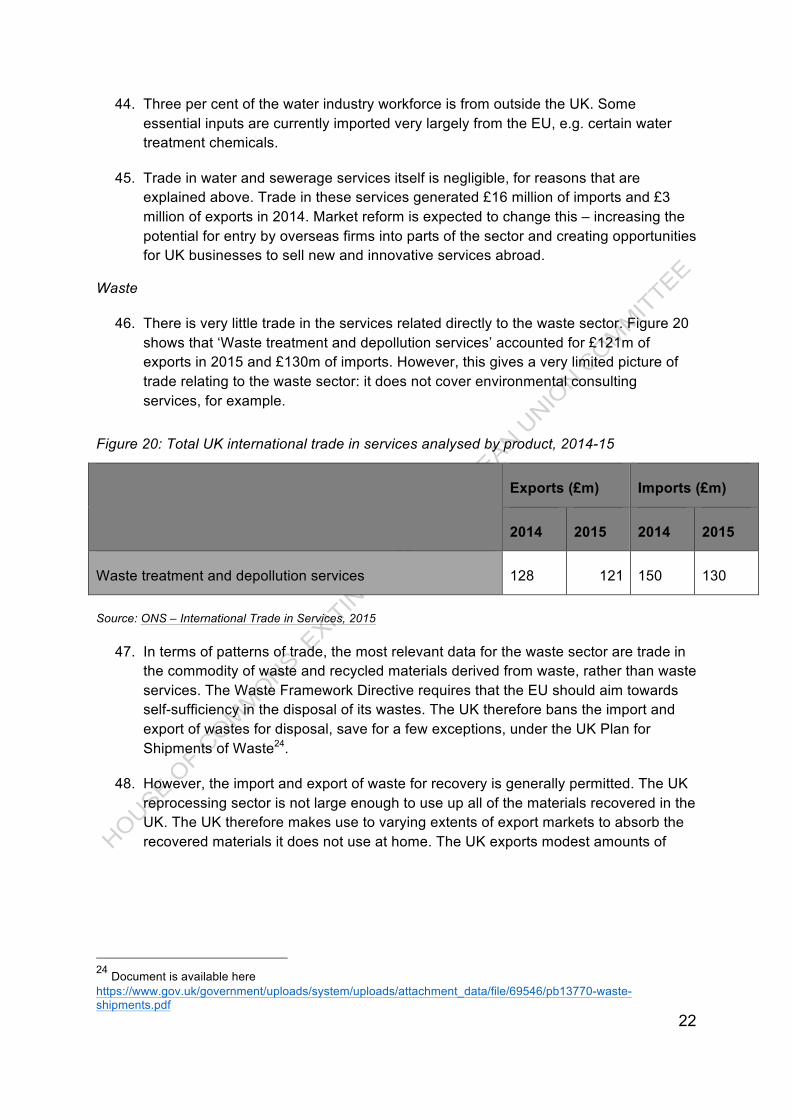
46. There is very little trade in the services related directly to the waste sector. Figure 20 shows that ‘Waste treatment and depollution services’ accounted for £121m of exports in 2015 and £130m of imports. However, this gives a very limited picture of trade relating to the waste sector: it does not cover environmental consulting services, for example.
Figure 20: Total UK international trade in services analysed by product, 2014-15
Exports (£m) Imports (£m)
2014 2015 2014 2015
Waste treatment and depollution services 128 121 150 130
Source: ONS – International Trade in Services, 2015
47. In terms of patterns of trade, the most relevant data for the waste sector are trade in the commodity of waste and recycled materials derived from waste, rather than waste services. The Waste Framework Directive requires that the EU should aim towards self-sufficiency in the disposal of its wastes. The UK therefore bans the import and export of wastes for disposal, save for a few exceptions, under the UK Plan for Shipments of Waste24.
48. However, the import and export of waste for recovery is generally permitted. The UK reprocessing sector is not large enough to use up all of the materials recovered in the UK. The UK therefore makes use to varying extents of export markets to absorb the recovered materials it does not use at home. The UK exports modest amounts of
24 Document is available here https://www.gov.uk/government/uploads/system/uploads/attachment_data/file/69546/pb13770-waste-shipments.pdf
23
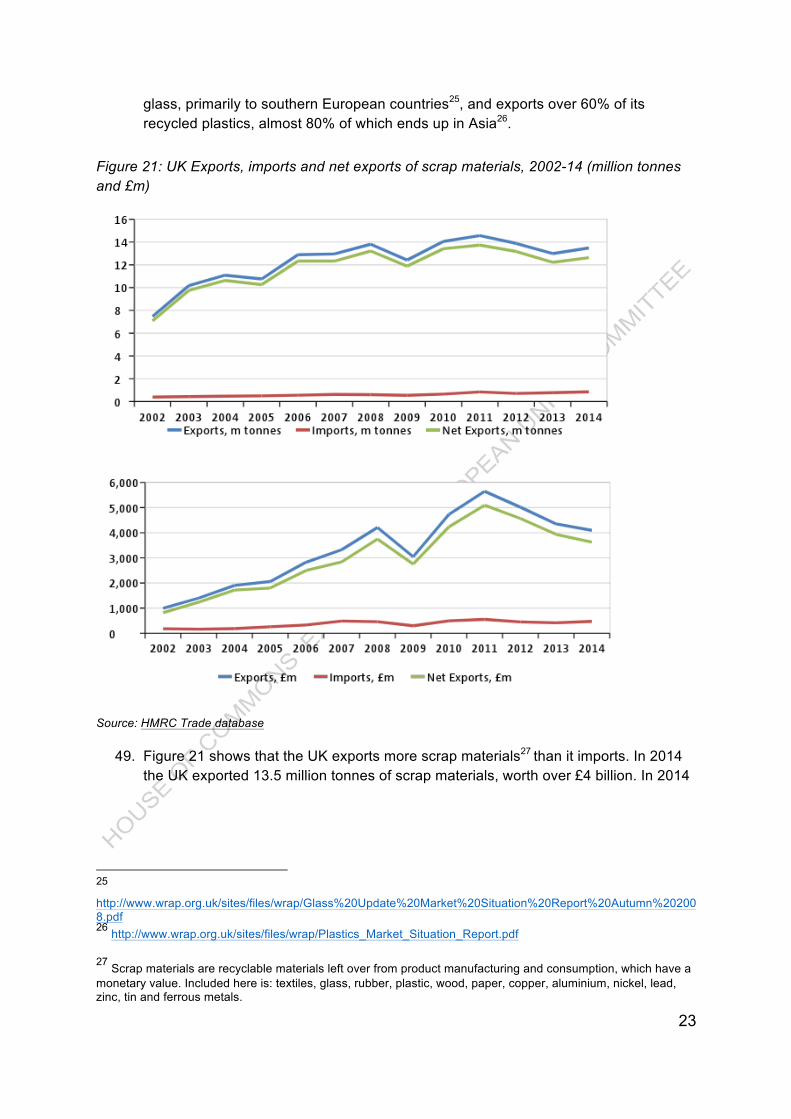
glass, primarily to southern European countries25, and exports over 60% of its recycled plastics, almost 80% of which ends up in Asia26.
Figure 21: UK Exports, imports and net exports of scrap materials, 2002-14 (million tonnes and £m)
Source: HMRC Trade database
49. Figure 21 shows that the UK exports more scrap materials27 than it imports. In 2014 the UK exported 13.5 million tonnes of scrap materials, worth over £4 billion. In 2014
25 http://www.wrap.org.uk/sites/files/wrap/Glass%20Update%20Market%20Situation%20Report%20Autumn%202008.pdf 26 http://www.wrap.org.uk/sites/files/wrap/Plastics_Market_Situation_Report.pdf
27 Scrap materials are recyclable materials left over from product manufacturing and consumption, which have a monetary value. Included here is: textiles, glass, rubber, plastic, wood, paper, copper, aluminium, nickel, lead, zinc, tin and ferrous metals.
24
there was a small increase in the tonnage of all scrap materials exported, but also a decrease in the monetary value of these exports28.
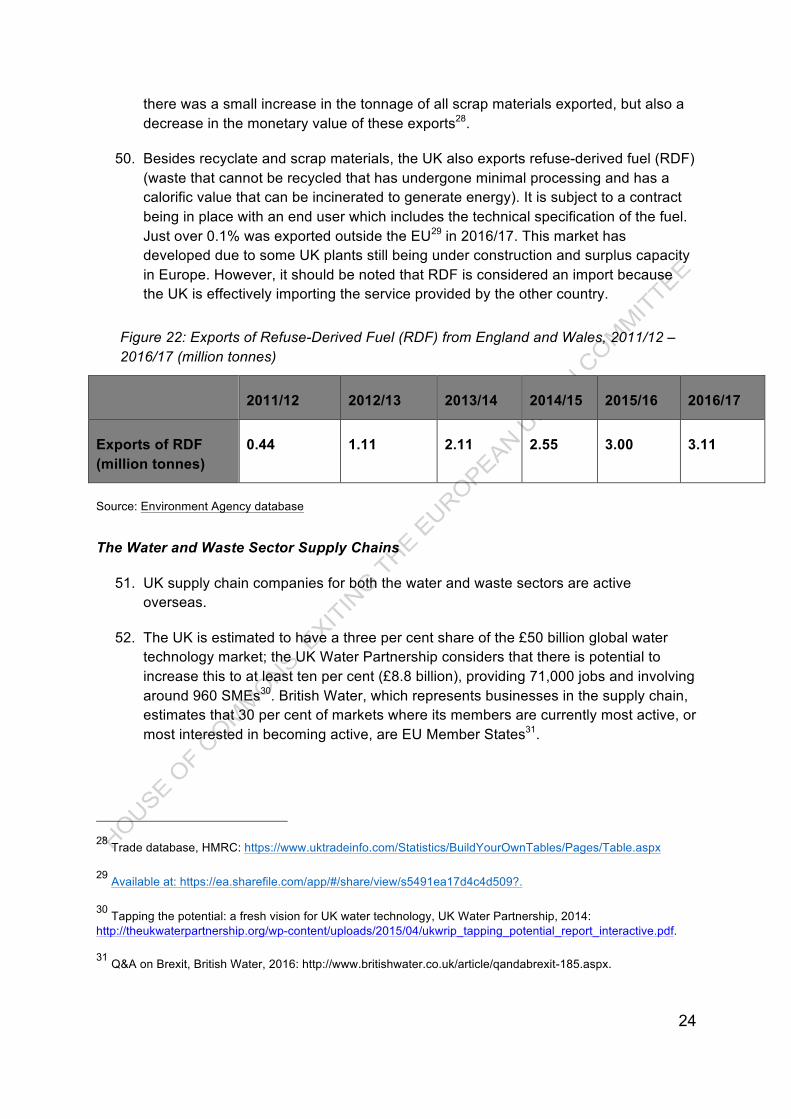
50. Besides recyclate and scrap materials, the UK also exports refuse-derived fuel (RDF) (waste that cannot be recycled that has undergone minimal processing and has a calorific value that can be incinerated to generate energy). It is subject to a contract being in place with an end user which includes the technical specification of the fuel. Just over 0.1% was exported outside the EU29 in 2016/17. This market has developed due to some UK plants still being under construction and surplus capacity in Europe. However, it should be noted that RDF is considered an import because the UK is effectively importing the service provided by the other country.
Figure 22: Exports of Refuse-Derived Fuel (RDF) from England and Wales, 2011/12 – 2016/17 (million tonnes)
2011/12 2012/13 2013/14 2014/15 2015/16 2016/17
Exports of RDF (million tonnes)
0.44 1.11 2.11 2.55 3.00 3.11
Source: Environment Agency database
The Water and Waste Sector Supply Chains
51. UK supply chain companies for both the water and waste sectors are active overseas.
52. The UK is estimated to have a three per cent share of the £50 billion global water technology market; the UK Water Partnership considers that there is potential to increase this to at least ten per cent (£8.8 billion), providing 71,000 jobs and involving around 960 SMEs30. British Water, which represents businesses in the supply chain, estimates that 30 per cent of markets where its members are currently most active, or most interested in becoming active, are EU Member States31.
28 Trade database, HMRC: https://www.uktradeinfo.com/Statistics/BuildYourOwnTables/Pages/Table.aspx
29 Available at: https://ea.sharefile.com/app/#/share/view/s5491ea17d4c4d509?.
30 Tapping the potential: a fresh vision for UK water technology, UK Water Partnership, 2014: http://theukwaterpartnership.org/wp-content/uploads/2015/04/ukwrip_tapping_potential_report_interactive.pdf.
31 Q&A on Brexit, British Water, 2016: http://www.britishwater.co.uk/article/qandabrexit-185.aspx.
25
53. The UK also exports services related to the waste sector that are captured in other sectors. For example, the UK provides environmental consultancy services and specialist engineering.
Historical Trends and Future Prospects
54. In line with historic performance, economic activity in both sectors is expected to increase with growth in population and the economy. Historical data for each sector are presented in section 1.
Water
55. For the water sector, the future trajectory of customer bills and services remain the Government’s priority. Here, external factors (population growth, climate change, environmental standards) are likely to create a need for significant additional investment. In England and Wales, continued access to low-cost capital will remain a priority for the sector.
56. Reforms to the water market in England are intended to promote competition and lower barriers to market entry, helping the sector to meet these challenges through enhanced efficiency and innovation. From a trade perspective, this will create new potential for international players to enter the English market, and for UK water companies to access new markets abroad.
Waste
57. For the waste sector, profitability will be heavily influenced by commodity prices in the short-run, and policy ambition on landfill diversion, recycling and greenhouse gas emissions abatement in the medium term. Policy direction has a significant impact on the sector.
58. Changes in both sectors will create new opportunities for the supply chain, which will need to adapt to meet demand at home and abroad. For example, the global market for water knowledge and capability is expected to grow substantially in coming years due to climate change, increasingly water-intensive lifestyles and changing land use. As well as accessing new water sources, countries around the world will need to find ways of using water much more efficiently and sustainably. Key growth markets include: systems for domestic metering and network monitoring; urban water management; low-energy treatment; flood security; wastewater reuse; shale gas extraction; dry sanitation; and megacities.
EU Funding
26
Water
59. As noted above, the European Investment Bank (EIB) is the largest debt investor in the UK water industry, accounting for 13 per cent of the water sector’s gross outstanding debt32.
60. In addition, the water industry is the recipient of European R&D funding. Sources include European Research Areas, the European Water Partnership, Eureka Cluster (Acqueau), Horizon 2020, Innowater, the Joint Programming Initiative and the Water Supply and Sanitation Technology Platform.
61. The sector receives EU funding for environmental programmes (e.g. LIFE), and (indirectly) from wider funds (such as agri-environment programmes under the Common Agricultural Policy), which reduce the amount the industry has to spend on treating water polluted by other sectors.
Waste
62. According to a report by Tolvik Consulting, two of the largest EU-based waste management companies owned roughly 36 per cent of the UK’s energy from waste capacity in 201633.
63. Over the 9 year period from 2007 to 2015 total infrastructure investment within the sector is likely to have been in the region of approximately £7-9 billion34.
Strategic / Political Importance of the Sector
Water
64. The water sector provides essential services to homes and businesses across the UK. Water is an essential input for many businesses (e.g. food, manufacturing) and public services (e.g. health, schools). The water industry delivers clean and safe drinking water to over 63 million people. In addition the industry collects, treats and disposes of wastewater.
65. The total economic impact of the sector in 2012/13 was estimated to be £15 billion. This activity supports 127,000 jobs (this includes direct and indirect jobs). This includes 4,000 construction jobs, 3,000 jobs in transport and 14,000 jobs in distribution. The industry spends £4.5 billion on investing in assets, working to tackle leakage, flooding and drought.
32 Moody’s, October 2017, UK Water Sector Outlook: https://www.moodys.com/research/Moodys-UK-water-sector-outlook-stable-into-2017-but-long--PR_356335. Paid subscription needed to access full report.
33Document is available here UK Energy from Waste Statistics – 2016, Tolvik Consulting, June 2017; operator market shares table.
34 Document is available here http://www.grantthornton.co.uk/globalassets/1.-member-firms/united-kingdom/pdf/publication/annual-waste-review.pdf

27
66. The benefits are wider than these direct spending effects. This includes: the value created in the associated supply chain industries; and the spillover effects for the broader UK economy. For example the water industry’s contribution to reducing the UK’s carbon footprint, and improvements to UK labour skills and employability through apprenticeships (in 2012/13, the industry took on almost 200 apprentices in a wide range of roles).
Waste
67. The waste sector provides essential services to homes and businesses across the UK (i.e. the collection, treatment and final disposal of both household and business waste).
68. The services provided by the sector are spread evenly across all parts of the UK, but are delivered in very different ways.
69. The sector has a high visibility amongst the general public and particularly where there is any local failure of the provision of its services. Furthermore, energy from waste is an increasingly important part of the UK energy mix.
70. As mentioned in other parts of this report, recovered waste as a commodity is also an input into many other economic activities – such as the wholesale of scrap and secondary raw materials.
The Current EU Regulatory Regime
Summary
71. European legislation plays a greater role in determining the shape and size of the waste market than in water. Regulations include:
● those relating to activities that have a direct impact upon the general environment;
● those that impose financial and other obligations upon the producers of equipment placed on the UK market; and
● those that introduce substance restrictions.
Similarly, there is a larger set of international rules and standards relating to waste.
72. Legislation on provision of water and sewerage services is primarily domestic, although the sector must also operate according to EU rules on the quality of drinking water and the water environment. Both the water and waste sectors are affected by cross-cutting regulation, e.g. on the environment, procurement, competition and health and safety.
28
73. Competence in relation to both water and waste is mainly devolved, and there are significant differences in policy approach between the administrations. Waste policy is a devolved matter, but some waste management regimes are handled at a GB or UK level by mutual consent.35 Water industry policy is wholly devolved in Scotland and Northern Ireland. Most regulation-making powers in both water and sewerage are already devolved to the Welsh ministers, although some have remained reserved for UK government. This is set out in more detail in section ‘Devolved Areas of Responsibility’.
Scope of Areas Covered By Directives and Regulations
Water
74. Legislation on provision of water and sewerage services is primarily domestic (in particular the Water Industry Act 1991 and the Water Resources Act 1991).
75. The sector must also operate according to EU rules on the quality of drinking water and the water environment.
76. These standards are an important driver of investment in the water industry in the UK and other EU Member States, informing how and when investment is targeted. They provide a common framework for management of shared resources. Significant pieces of legislation include:
● The Drinking Water Directive (98/83/EC, amended by Directive 2015/1787/EU) on the quality of water intended for human consumption. The Drinking Water Directive draws on other legislation which is relevant to drinking water quality (e.g. Euratom Directive 2013/51/EURATOM).
● The Urban Waste Water Treatment Directive (91/271/EEC; also Decision 2014/431/EU) which establishes collection and treatment standards for waste water treatment from sewage works and certain industrial processes before discharge to the water environment.
● The Water Framework Directive (2000/60/EC) which provides a strategic, integrated planning system of environmental water management, methodologies for assessing the overall quality of the water environment and for setting improvement objectives. ‘Daughter’ directives cover issues such as protection of groundwater (2006/118/EC) and environmental quality standards (2008/105/EC).
● The Nitrates Directive (91/676/EEC) which aims to reduce water pollution from nitrate from agriculture. It requires land draining to water that is polluted (or at risk of pollution) from nitrate to be designated as Nitrate Vulnerable Zones (NVZs) and farmers within such zones to be subject to specific measures.
35 For example, the Environmental Permitting (England and Wales) Regulations 2016 extend to England and Wales (see: https://www.legislation.gov.uk/uksi/2016/1154/pdfs/uksi_20161154_en.pdf) and Producer Responsibiliy regulations apply to England, Scotland and Wales: http://www.legislation.gov.uk/uksi/2007/871/pdfs/uksi_20070871_en.pdf
29
● The Floods Directive (2007/60/EC), which requires Member States to assess water courses and coastlines at risk from flooding, to map the flood extent and assets and humans at risk in these areas, and to take adequate and coordinated measures to reduce this flood risk.
● The revised Bathing Waters Directive (2006/7/EC) puts in place rules to ensure that bathing waters (e.g. at beaches) are clean and safeguard public health.
Waste
77. Waste legislation derives predominantly from EU governance. Much is transposed into UK law via statutory instruments, although there are UK Acts of Parliament which have enabled the transposition of EU directives into UK law. In particular, the Environmental Protection Act 1990 deals with issues relating to waste on land, defines all aspects of waste management and places a duty on local authorities to collect waste. It also places a Duty of Care on anyone who produces, imports, carries, keeps, treats or disposes of controlled waste, or as a broker has control of such waste.
78. Waste legislation serves to provide important environmental protections as well as creating markets and encouraging resource efficiency, for example either through producer responsibility schemes (to ensure costs of disposal are met by those placing products on the market, e.g. Waste Electrical and Electronic Equipment Directive) or by encouraging greater recycling of materials.
79. Significant pieces of legislation include:
● The Landfill Directive (1999/31/EC), which sets out the rules for the type of waste that can be landfilled and the technical requirements for the operation of landfill sites. The purpose of the Directive is to prevent or reduce the negative effects on the environment, in particular the pollution of surface water, groundwater, soil and air, as well as the global environment and the risk to human health. The Directive has been instrumental in incentivising diversion from landfill, creating markets in energy from waste and recycling.
● The Waste Framework Directive (2008/98/EC), which sets out a framework for waste management, detailing the basic concepts and definitions, such as those for waste, recycling and recovery. It explains when waste ceases to be waste and becomes a secondary raw material (known as end-of-waste criteria), and how to distinguish between waste and by-products.
● The Industrial Emissions Directive (2010/75/EC), which regulates polluting emissions from industrial installations, as air pollutants, discharges of waste water and the generation of waste from industrial production processes account for a considerable share of the overall pollution in Europe. The Directive aims to achieve a high level of protection of human health and the environment taken as a whole by reducing harmful industrial emissions across the EU, in particular through the better application of Best Available Techniques (BAT).
30
● The Waste Shipments Regulation (EC/1013/2006), which sets out the procedures for the transboundary shipment of waste within the EU and between the EU and other countries. It also places a ban on the export of hazardous wastes to countries not in the OECD as well as a ban on the export of waste for disposal. This implements the UK’s international obligations under the UN Basel Convention on the Control of Transboundary Movement of Hazardous Wastes and their disposal and the OECD decision establishing a control system for wastes destined for recovery (C(2001)107/FINAL).
● The Mining Waste Directive (2006/21/EC), which sets out rules for the management of waste resulting from the prospecting, extraction, treatment and storage of mineral resources and the working of quarries (extractive waste). Its purpose is to prevent or reduce as far as possible any adverse impacts on the environment, in particular water, air, soil, fauna and flora and landscape, and any resultant risks to human health.
● The Ship Recycling Regulation (EU/1257/2013) sets out a number of requirements for European ships, European ship owners and ship recycling facilities wishing to recycle European ships. It aims to reduce the negative impacts linked to the recycling of EU-flagged ships. It covers the obligations of the international Hong Kong Convention for the Safe and Environmentally Sound Recycling of Ships (not yet in force).
● Producer responsibility legislation, including:
o The Packaging and Packaging Waste Directive (94/62/EC), which was the first ‘Producer Responsibility’ Directive. It aims to ensure that those that manufacture, import and sell products in the European Single Market take responsibility for the end of life/waste disposal costs and impacts. The Directive aims to provide environmental protection from packaging waste, but also ensures the functioning of the internal market by removing any potential barriers to trade (the same definitions and substance restrictions of lead, mercury, cadmium and hexavalent chromium apply) and either the distortion or restriction of competition. The most recent amendment to the Directive came last year with the adoption of Directive EU/2015/720, which addresses the use and consumption of lightweight carrier bags.
o The End of Life Vehicles (ELV) Directive (2000/53/EC), which aims to minimise the impact of dismantling and recycling cars, when disposed of by the last owner. It sets targets for the reuse, recovery and recycling of end of life vehicles, but also place restrictions on the level of hazardous substances (lead, mercury, cadmium and hexavalent chromium) that can be used in the manufacture of new vehicles to help with the end of life treatment operations.
o The Waste Electrical & Electronic Equipment (WEEE) Directive (2012/19/EU), which addresses the potential environmental and health
31
problems impacts of the fastest growing waste stream in the EU. It is also designed to raise the levels of resource efficiency and promote a more circular economy, as well as improving the collection, treatment and recycling of this equipment at the waste disposal stage. The WEEE Directive also has a ‘sister’ Directive, (the Restriction of the use of certain Hazardous Substances in electrical & electrical equipment (RoHS) Directive – 2011/65/EU), which restricts the same four heavy metals, plus two families of brominated flame retardants as both the Packaging and End of Life Vehicles Directives.
o The Batteries and Accumulators Directive (2006/66/EC), which contributes to the protection, preservation and improvement of the quality of the environment by minimising the negative impact of batteries and accumulators and waste batteries and accumulators. Like the Packaging, End of Life Vehicles and Restriction of Hazardous Substances Directives, it also ensures the smooth functioning of the internal market by harmonising requirements as regards the placing on the market of batteries and accumulators.
Main Cross-Sectoral Rules, Technical Requirements and Frameworks
Water
80. For the water sector, the primary areas are:
● environmental/public health law, both in relation to the water environment but also other areas (e.g. the Habitats Directive);
● procurement rules, in relation to awarding contracts above a certain value; and
● competition law, which affects the design of markets within the UK (e.g. Services Directive).
81. Other cross-cutting issues (e.g. employment law, state aid, consumer protection) are not expected to have a disproportionate impact on the water sector.
Waste
82. For the waste sector, the primary areas are:
● environmental law, particularly in relation to waste (see above);
● procurement rules, in relation to awarding contracts above a certain value;
● health and safety rules, for example to minimise the impacts of ill health from potentially hazardous substances or microorganisms during collection and sorting activities; and
● competition law (see below).

32
83. Many operators have developed economic activities connected to the specific characteristics of this sector, in so doing, creating a host of markets. Competition considerations would cover: the prevention of anti-competitive practices such as market sharing or price fixing; the assurance of a framework which allows choices between several waste management systems for the companies obliged under national legislation to recycle their waste; and the avoidance of exclusive arrangements of all kinds without solid and convincing economic justification.
84. Other cross-cutting issues (e.g. employment law, state aid, consumer protection) are not expected to have a disproportionate impact on the waste sector.
International Rules and Standards
Water
85. EU rules interpret international rules and standards for water and sewerage services. The latter are relatively limited, in part reflecting the varying international quality (and availability) of water and sewerage services. These include:
● U.N. Human Rights Council Resolution on The Human Rights to Safe Drinking Water and Sanitation, A/HRC/71/53/Add.1 (29 September 2016); and
● U.N. General Assembly Resolution on the Human Rights to Safe Drinking Water and Sanitation, A/Res/70/169 (17 December 2015).
Waste
86. International rules are more developed for waste. They include:
● The Basel Convention on the Control of Transboundary Movements of Hazardous Wastes and their Disposal is an international treaty that aims to reduce the movements of hazardous waste between nations and specifically to prevent transfer of hazardous waste from developed to less developed countries. This prohibits the export of hazardous and certain other wastes (such as mixed municipal wastes) to non-parties to the Convention, unless specific bilateral arrangements have been made that have at least similar standards to the Convention.
● The OECD Decision C(2001)/107/FINAL establishes control procedures for the shipment of wastes destined for recovery between OECD countries. This allows for an active market in waste recovery to be established with OECD countries that are non-Parties to Basel, such as the US. The UK’s obligations under both the Basel Convention (including an amendment to the Convention that has not yet entered into force that prohibits the export of hazardous wastes to non-OECD countries) and the OECD decision are implemented through the EU Waste Shipment Regulations. The EU Waste Shipment Regulations also prohibit the export of wastes for disposal outside the EU.
● The Hong Kong Convention for the Safe and Environmentally Sound Recycling of Ships. The Hong Kong Convention is not yet in force but is aimed at ensuring that ships, when being recycled after reaching the end of their

33
operational lives, do not pose any unnecessary risk to human health and safety or to the environment. Efforts are being made to ensure that the EU Ship Recycling Regulation fulfil the obligations that would arise under that Convention.
● Regulation (EU) No 1257/2013 of the European Parliament and of the Council on Ship Recycling aims to reduce the negative impacts linked to the recycling of ships flying the flag of Member States of the Union. The Regulation brings forward the requirements of the 2009 Hong Kong Convention for the Safe and Environmentally Sound Recycling of Ships, therefore contributing to its global entry into force.
87. The European Committee for Standardization (CEN) and the European Committee for Electrotechnical Standardisation (CENELEC) are officially recognised by the European Union (EU Regulation 1025/2012) as European Standardization Organizations (ESOs) responsible for developing and defining standards at European level. Voluntary CEN and CENELEC standards ensure conformity with relevant legislation and ensure access to and free movement of goods across the European Single Market. The ‘CE’ mark is the visible declaration of conformity placed on the product or equipment by the manufacturer. CEN and CENELEC closely cooperate with their international counterparts, respectively the International Organization for Standardization (ISO) and the International Electrotechnical Commission (IEC).
Trade Rules
Water
88. As noted earlier, trade in water and sewerage services is currently very limited. The trade of inputs to the relevant supply chains (e.g. chemicals, technology, construction, professional services, business services, financial services) is covered in other sectoral assessments.
89. Market reform in England means that trade in water and sewerage services could increase in future. Further work is needed to assess the rules that would affect entry of businesses outside the EU into the UK market for water and sewerage services, since the retail market has only opened as of April 2017.
Waste
90. Trade in waste services is much more significant36. To enter UK or EU markets, businesses in non-EU countries must comply with the same requirements as businesses in the UK or other Member States.
91. The UK is a party to both the Basel Convention and the OECD Decision in its own right. Therefore, once the UK leaves the EU a key change is that the EU will no longer be able to export waste to the UK that were destined for disposal. While the
36 Document is available here, Trade database, HMRC: https://www.uktradeinfo.com/Statistics/BuildYourOwnTables/Pages/Table.aspx
34
UK Plan for Waste Shipments already prohibits the shipment of waste into and out of the UK for disposal there are some exceptions (such as where there are no sound disposal options within the UK or EU country of origin) which might be adversely affected. Waste shipments between the UK and the EU would become subject to customs procedures. The Government’s vision for a future partnership on customs is set out in the Future customs arrangements future partnership paper.
Devolved Areas of Responsibility
92. Most European Single Market legislation automatically applies to the devolved administrations and Gibraltar. The Crown Dependencies are not members of the EU, but certain aspects of EU law relating to the trade in goods and the Customs Union apply to them and are set out in Protocol Three to the UK’s Treaty of Accession.
93. The issues in this paper have particular relevance for Northern Ireland and Ireland. In August 2017, the UK government published the Northern Ireland and Ireland position paper outlining the UK’s position on addressing the unique circumstances of Northern Ireland and Ireland in light of the UK’s EU withdrawal. The UK and the EU have mapped out areas of cooperation under the Belfast (‘Good Friday’) Agreement that function on a cross-border North-South basis. This detailed work demonstrates a wide range of cooperation across different aspects of the economy, public services, and the environment.
Water
94. Water industry policy is wholly devolved in Scotland and Northern Ireland.
95. Most regulation-making powers in both water and sewerage are already devolved to the Welsh Ministers, although some have remained reserved for UK Government. The original Welsh devolution settlement reflected the fact that several water companies cross the national border and that water from Wales supplies some customers in England. Regulation has been made on the basis of a water company being “wholly or mainly in England” or “wholly or mainly in Wales”. The Wales Act 2017 sets up a revised devolution settlement and a new reserved powers model. When the relevant provision is implemented there will be an alignment of the national boundary on both water and sewerage and regulation will be primarily on an England or Wales basis.
96. Policy on the water environment is fully devolved to Wales, Scotland and Northern Ireland, with some arrangements for cooperation in cross-border areas. EU rules on the water environment provide for the management of cross-border catchments between Member States, including across Northern Ireland and Ireland.
97. EU water quality, industry, and flood risk legislation is generally applicable to Gibraltar but not Crown Dependencies or other Overseas Territories. Water services in Gibraltar have been partly privatised and are delivered under licence by a subsidiary of Northumbrian Water. Gibraltar is not dependent on Spain for water supplies.
35
Waste
98. Although transposition of most directives is done at a UK level, many aspects of EU waste legislation and implementation are devolved. For example, each of the four UK administrations has its own approach to managing municipal waste, for instance setting its own targets for recycling – in some cases more ambitious than those set at EU level. Some aspects of waste management policy are managed at a UK level, but in close cooperation with the devolved administrations – for example, the UK Government leads on tax measures to encourage recycling. While environment policy is generally devolved, policy on the shipment of waste falls within the export and import reservation.
99. EU waste legislation is generally applicable to Gibraltar, except for legislation with a Single Market legal base. For example, Gibraltar produces waste management plans to fulfil the requirements of the Waste Framework Directive. Waste services in Gibraltar are heavily interlinked with Spain, which currently receives waste from Gibraltar37.
100. EU waste legislation does not apply to Crown Dependencies or other Overseas Territories.
Existing Frameworks for How Trade in Water and Waste is Facilitated Between Countries
101. The arrangements described in this section are examples of existing arrangements between countries. They should not be taken to represent the options being considered by the Government for the future economic relationship between the UK and the EU. The Government has been clear that it is seeking pragmatic and innovative solutions to issues related to the future deep and special partnership that we want with the European Union.
102. This section has already discussed the international rules and standards which exist in the water and waste sectors. As a general principle:
● international trade in water as a good is not facilitated by any particular agreement, though there are some international agreements in place; and
● some rules on the trade of waste as a good are set at an international level; specific bilateral or multilateral agreements on trade then tend to reflect those international rules, rather than containing specific text relating to trade in waste.
37 See Gibraltar’s 2013 Waste management plan here: https://www.gibraltar.gov.gi/new/sites/default/files/Press%20archives/Press%20Releases/2013/838.1-2013.pdf

36
As context, it is important to note that it is typical for trade agreements to contain best endeavours commitments in relation to sustainable development. For instance, the European Commission’s current trade strategy, published in 2015, states that: The Commission makes a clear pledge that no trade agreement will ever lower levels of regulatory protection; that any change to levels of protection can only be upward; and that the right to regulate will always be protected.38
103. Similarly, the 2009 Recommendation from the Commission to the Council to open negotiations on CETA underlines:
The commitment of the parties to sustainable development and the contribution of international trade to sustainable development in its economic, social and environmental dimensions.39
104. Chapter 22 of CETA - Trade and Sustainable Development - therefore requires the parties, inter alia, to aim to:
● promote sustainable development through the enhanced coordination and integration of their respective labour, environmental and trade policies, and measures; and
● promote dialogue and cooperation between the Parties with a view to developing their trade and economic relations in a manner that supports their respective labour and environmental protection measures and standards; and to upholding their environmental and labour protection objectives in a context of trade relations that are free, open and transparent.40
Water
105. Very few FTAs touch on trade in water.41 CETA, for instance, states that water in its natural state is not a ‘good or product’ for the purposes of the agreement, and is only therefore subject to Chapters Twenty-Two (Trade and Sustainable Development) and Twenty-Four (Trade and Environment); and a number of exceptions and reservations exist in relation to the collection, purification, and distribution of water.42
38 The document is available here http://trade.ec.europa.eu/doclib/docs/2015/october/tradoc_153846.pdf, p.5
39 The document is available here http://data.consilium.europa.eu/doc/document/ST-9036-2009-EXT-2/en/pdf, para. 5
40 The document is available here http://trade.ec.europa.eu/doclib/docs/2014/september/tradoc_152806.pdf, p.180
41 With the exception of those where it is covered in its ‘non-natural state’, eg as a bottled drinking product
42 For example, provisions on measures relating to licensing requirements in Article 12 do not apply to the collection, purification, and distribution of water

37
106. International standards for water and sewerage services are relatively limited. Important international rules in this space are the:
● U.N. Human Rights Council Resolution on The Human Rights to Safe Drinking Water and Sanitation, A/HRC/71/53/Add.1 (29 September 2016); and
● U.N. General Assembly Resolution on the Human Rights to Safe Drinking Water and Sanitation, A/Res/70/169 (17 December 2015).
Waste
107. As discussed above, the UK’s involvement in trade in waste is more significant. There are numerous international agreements covering the movement and trade of waste, which are also described in more detail above, but which include:
● the Basel Convention on the Control of Transboundary Movements of Hazardous Wastes and their Disposal; and
● the OECD Decision C(2001)/107/FINAL.
108. Existing international agreements to facilitate trade tend to seek to ensure the effective implementation of these extant multilateral environmental agreements, rather than create new commitments on the trade in waste. Waste does not tend to be included on its own terms in Free Trade Agreements.
Sector Views
[This information was provided by the Government to the Committee, but the Committee has decided not to publish this section]