Embed Size (px)
Citation preview
Leader’s Guide
Project Area: Environmental Science
Skill Level: Intermediate‐Advanced
Learner Outcomes:
‐Define biodiversity
‐Be able to count and calculate diversity metrics
‐Understand why biodiversity is important
Tennessee Science Curriculum Standard GLEs:
S1. Embedded Inquiry 0607.Inq.1‐5, 0707.Inq.1‐5, 0807.Inq.1‐5
S5. Biodiversity & Change 0807.5.1, 0807.5.5 TNCore Math: 7.NS. 2‐3 7.EE.1‐4
Science Skills: Develop hypothesis, observe, collect data, interpret
Math Skills: Solve real‐world problems using numerical and algebraic equa ons; apply mul ple opera ons on ra onal numbers (add, subtract, mul ply, divide)
Life Skills: Observing, Reasoning, Communica ng
Tags: Biodiversity, communi es
Time Needed:
Set up: 5 minutes
In class: 30 minutes
Materials:
‐Small items that can be sorted by color, size, shape, etc. (e.g., animal counters, Lego blocks, beads, cards with pictures of animals, etc.), approximately 20 per group of students
‐Chalkboard or large wri ng pad for recording observa ons
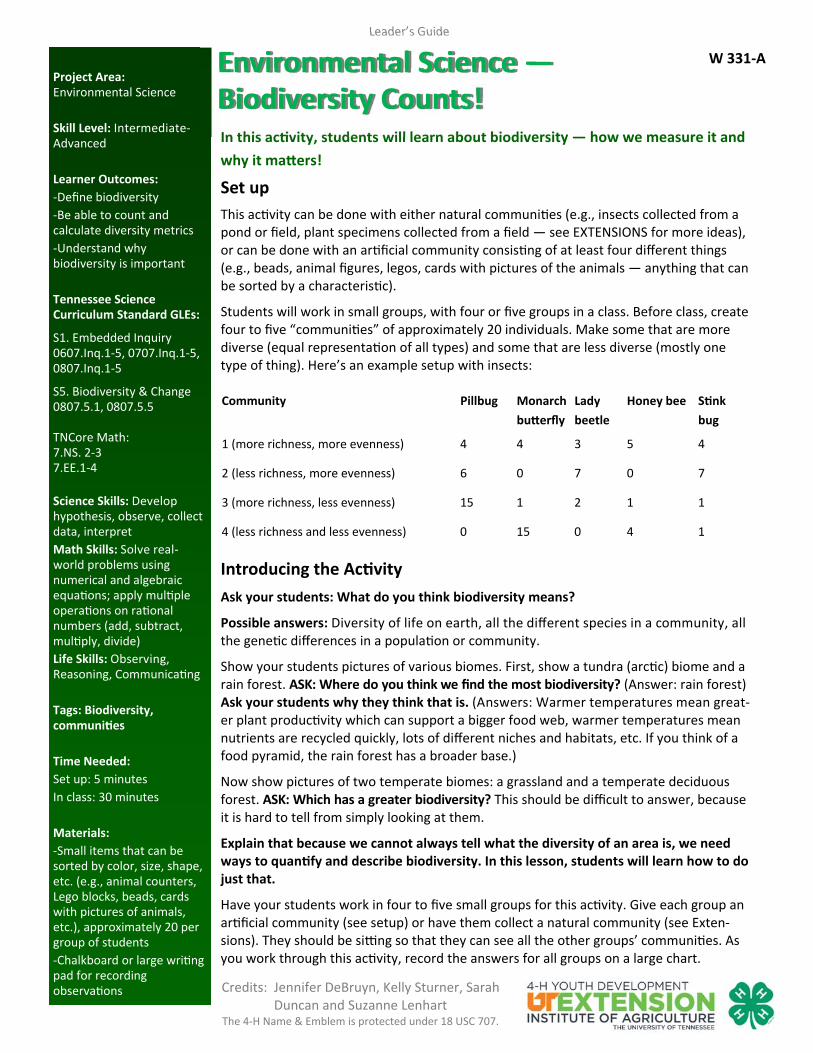
Set up
This ac vity can be done with either natural communi es (e.g., insects collected from a pond or field, plant specimens collected from a field — see EXTENSIONS for more ideas), or can be done with an ar ficial community consis ng of at least four different things (e.g., beads, animal figures, legos, cards with pictures of the animals — anything that can be sorted by a characteris c).
Students will work in small groups, with four or five groups in a class. Before class, create four to five “communi es” of approximately 20 individuals. Make some that are more diverse (equal representa on of all types) and some that are less diverse (mostly one type of thing). Here’s an example setup with insects:
Introducing the Ac vity
Ask your students: What do you think biodiversity means?
Possible answers: Diversity of life on earth, all the different species in a community, all the gene c differences in a popula on or community.
Show your students pictures of various biomes. First, show a tundra (arc c) biome and a rain forest. ASK: Where do you think we find the most biodiversity? (Answer: rain forest) Ask your students why they think that is. (Answers: Warmer temperatures mean great‐er plant produc vity which can support a bigger food web, warmer temperatures mean nutrients are recycled quickly, lots of different niches and habitats, etc. If you think of a food pyramid, the rain forest has a broader base.)
Now show pictures of two temperate biomes: a grassland and a temperate deciduous forest. ASK: Which has a greater biodiversity? This should be difficult to answer, because it is hard to tell from simply looking at them.
Explain that because we cannot always tell what the diversity of an area is, we need ways to quan fy and describe biodiversity. In this lesson, students will learn how to do just that.
Have your students work in four to five small groups for this ac vity. Give each group an ar ficial community (see setup) or have them collect a natural community (see Exten‐sions). They should be si ng so that they can see all the other groups’ communi es. As you work through this ac vity, record the answers for all groups on a large chart.
In this ac vity, students will learn about biodiversity — how we measure it and
why it ma ers!
Credits: Jennifer DeBruyn, Kelly Sturner, Sarah Duncan and Suzanne Lenhart
The 4‐H Name & Emblem is protected under 18 USC 707.
Community Pillbug Monarch
bu erfly
Lady
beetle
Honey bee S nk
bug
1 (more richness, more evenness) 4 4 3 5 4
2 (less richness, more evenness) 6 0 7 0 7
3 (more richness, less evenness) 15 1 2 1 1
4 (less richness and less evenness) 0 15 0 4 1
Environmental Science — Biodiversity Counts!
W 331‐A

Part 1. Calcula ng biodiversity
Predict: Ask your students to look at the different communi es. Have them make two predic ons: 1. Which community has the highest diversity? 2. Which community has the lowest diversity?
Inves gate: Explain that one way we can quan fy diversity is by coun ng richness: This is the number of types of species in your community. Have students count the number of species and record their observa ons. (In the example data set, richness = 5, because there are five different species present.)
Now explain that diversity takes into account both richness and evenness: This is the rela ve abundance of each species (or how they are distributed). The highest evenness occurs when every species has equal representa on in the community. Have students rate each community as high, medium or low evenness.
Have them look at the richness and evenness scores and determine the diversity of each community.
Have your students calculate Simpsons diversity index.1
D = Simpsons Index of Diversity Σ = summation S= number of species ni= number of individuals within the ith species N= total number of individuals within the sample
Example dataset and calculation:
First, calculate the numerator (top): = (1(1-1) + 9(9-1) + 2(2-1) + 4(4-1) + 5(5-1)) = 1(0)+9(8)+2(1)+4(3)+5(4) = 0 + 72 + 2 + 12 + 20 = 106 Then, calculate the denominator (bottom): N = 1 + 9 + 2 + 4 + 5 = 21 N(N-1) = 21(20) = 420 Then, put it all together: D = 1 - ( 106 / 420 ) D = 1 - (0.25) = 0.75
This equa on shows that if you randomly pick two species, you have a 75 percent chance of those two individuals being different species. We can say the diversity is HIGH (the closer to 1, the higher the diversity). Have your students record the diversity on their data sheets.
Revisit the hypothesis: Were their original predic ons correct? Who had the most diverse and who had the least diverse community?
1Simpson, Edward H. (1949). Measurement of diversity. Nature, 163, 688
Leader’s Guide
Credits: Jennifer DeBruyn, Kelly Sturner, Sarah Duncan and Suzanne Lenhart The 4‐H Name & Emblem is protected under 18 USC 707.
Species Number of individuals
Pillbug 1
Monarch bu erfly
9
Lady beetle 2
Honey bee 4
S nk bug 5
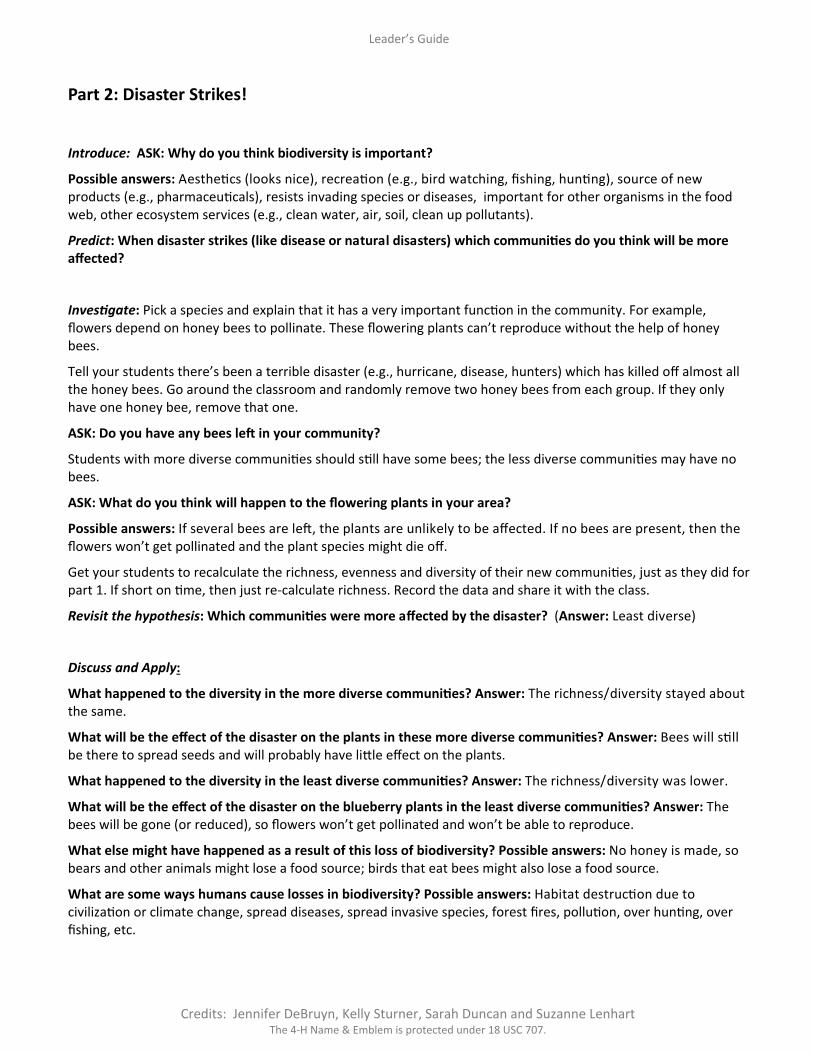
Part 2: Disaster Strikes!
Introduce: ASK: Why do you think biodiversity is important?
Possible answers: Aesthe cs (looks nice), recrea on (e.g., bird watching, fishing, hun ng), source of new products (e.g., pharmaceu cals), resists invading species or diseases, important for other organisms in the food web, other ecosystem services (e.g., clean water, air, soil, clean up pollutants).
Predict: When disaster strikes (like disease or natural disasters) which communi es do you think will be more affected?
Inves gate: Pick a species and explain that it has a very important func on in the community. For example, flowers depend on honey bees to pollinate. These flowering plants can’t reproduce without the help of honey bees.
Tell your students there’s been a terrible disaster (e.g., hurricane, disease, hunters) which has killed off almost all the honey bees. Go around the classroom and randomly remove two honey bees from each group. If they only have one honey bee, remove that one.
ASK: Do you have any bees le in your community?
Students with more diverse communi es should s ll have some bees; the less diverse communi es may have no bees.
ASK: What do you think will happen to the flowering plants in your area?
Possible answers: If several bees are le , the plants are unlikely to be affected. If no bees are present, then the flowers won’t get pollinated and the plant species might die off.
Get your students to recalculate the richness, evenness and diversity of their new communi es, just as they did for part 1. If short on me, then just re‐calculate richness. Record the data and share it with the class.
Revisit the hypothesis: Which communi es were more affected by the disaster? (Answer: Least diverse)
Discuss and Apply:
What happened to the diversity in the more diverse communi es? Answer: The richness/diversity stayed about the same.
What will be the effect of the disaster on the plants in these more diverse communi es? Answer: Bees will s ll be there to spread seeds and will probably have li le effect on the plants.
What happened to the diversity in the least diverse communi es? Answer: The richness/diversity was lower.
What will be the effect of the disaster on the blueberry plants in the least diverse communi es? Answer: The bees will be gone (or reduced), so flowers won’t get pollinated and won’t be able to reproduce.
What else might have happened as a result of this loss of biodiversity? Possible answers: No honey is made, so bears and other animals might lose a food source; birds that eat bees might also lose a food source.
What are some ways humans cause losses in biodiversity? Possible answers: Habitat destruc on due to civiliza on or climate change, spread diseases, spread invasive species, forest fires, pollu on, over hun ng, over fishing, etc.
Leader’s Guide
Credits: Jennifer DeBruyn, Kelly Sturner, Sarah Duncan and Suzanne Lenhart The 4‐H Name & Emblem is protected under 18 USC 707.
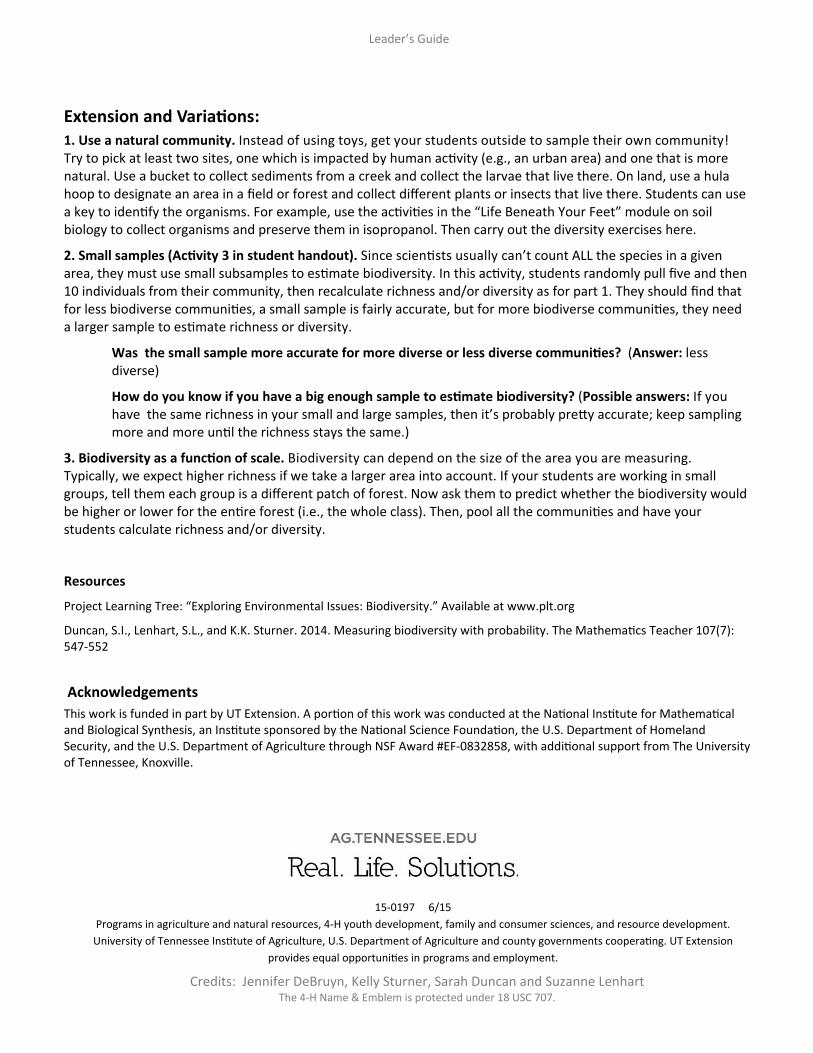
Extension and Varia ons: 1. Use a natural community. Instead of using toys, get your students outside to sample their own community! Try to pick at least two sites, one which is impacted by human ac vity (e.g., an urban area) and one that is more natural. Use a bucket to collect sediments from a creek and collect the larvae that live there. On land, use a hula hoop to designate an area in a field or forest and collect different plants or insects that live there. Students can use a key to iden fy the organisms. For example, use the ac vi es in the “Life Beneath Your Feet” module on soil biology to collect organisms and preserve them in isopropanol. Then carry out the diversity exercises here.
2. Small samples (Ac vity 3 in student handout). Since scien sts usually can’t count ALL the species in a given area, they must use small subsamples to es mate biodiversity. In this ac vity, students randomly pull five and then 10 individuals from their community, then recalculate richness and/or diversity as for part 1. They should find that for less biodiverse communi es, a small sample is fairly accurate, but for more biodiverse communi es, they need a larger sample to es mate richness or diversity.
Was the small sample more accurate for more diverse or less diverse communi es? (Answer: less diverse)
How do you know if you have a big enough sample to es mate biodiversity? (Possible answers: If you have the same richness in your small and large samples, then it’s probably pre y accurate; keep sampling more and more un l the richness stays the same.)
3. Biodiversity as a func on of scale. Biodiversity can depend on the size of the area you are measuring. Typically, we expect higher richness if we take a larger area into account. If your students are working in small groups, tell them each group is a different patch of forest. Now ask them to predict whether the biodiversity would be higher or lower for the en re forest (i.e., the whole class). Then, pool all the communi es and have your students calculate richness and/or diversity.
Resources
Project Learning Tree: “Exploring Environmental Issues: Biodiversity.” Available at www.plt.org
Duncan, S.I., Lenhart, S.L., and K.K. Sturner. 2014. Measuring biodiversity with probability. The Mathema cs Teacher 107(7): 547‐552
Acknowledgements
This work is funded in part by UT Extension. A por on of this work was conducted at the Na onal Ins tute for Mathema cal and Biological Synthesis, an Ins tute sponsored by the Na onal Science Founda on, the U.S. Department of Homeland Security, and the U.S. Department of Agriculture through NSF Award #EF‐0832858, with addi onal support from The University of Tennessee, Knoxville.
Leader’s Guide
Credits: Jennifer DeBruyn, Kelly Sturner, Sarah Duncan and Suzanne Lenhart The 4‐H Name & Emblem is protected under 18 USC 707.
15‐0197 6/15
Programs in agriculture and natural resources, 4‐H youth development, family and consumer sciences, and resource development.
University of Tennessee Ins tute of Agriculture, U.S. Department of Agriculture and county governments coopera ng. UT Extension
provides equal opportuni es in programs and employment.
Student Handout
Words to
Explore
Biodiversity
Richness
Evenness
Community
Species
Keystone species
Did You Know? Each year, about 15,000 NEW species are discovered!
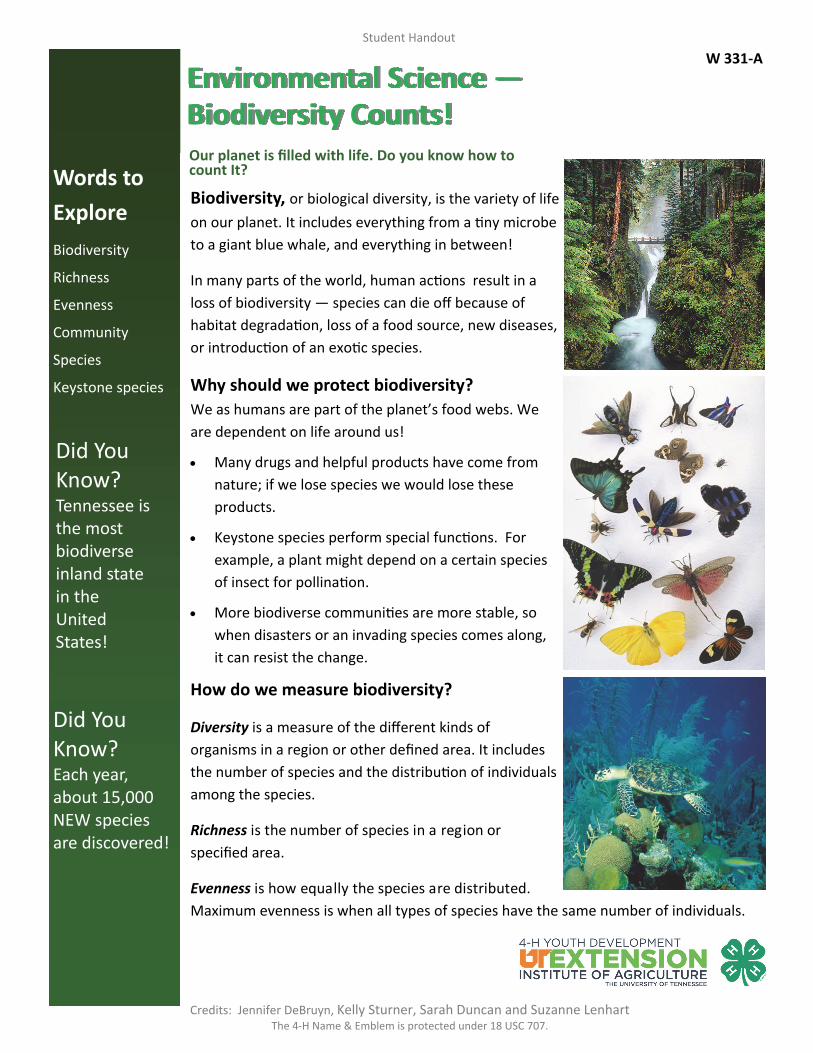
Environmental Science — Biodiversity Counts! Our planet is filled with life. Do you know how to count It?
Biodiversity, or biological diversity, is the variety of life
on our planet. It includes everything from a ny microbe
to a giant blue whale, and everything in between!
In many parts of the world, human ac ons result in a
loss of biodiversity — species can die off because of
habitat degrada on, loss of a food source, new diseases,
or introduc on of an exo c species.
Why should we protect biodiversity?
We as humans are part of the planet’s food webs. We
are dependent on life around us!
Many drugs and helpful products have come from
nature; if we lose species we would lose these
products.
Keystone species perform special func ons. For
example, a plant might depend on a certain species
of insect for pollina on.
More biodiverse communi es are more stable, so
when disasters or an invading species comes along,
it can resist the change.
How do we measure biodiversity?
Diversity is a measure of the different kinds of
organisms in a region or other defined area. It includes
the number of species and the distribu on of individuals
among the species.
Richness is the number of species in a region or
specified area.
Evenness is how equally the species are distributed.
Maximum evenness is when all types of species have the same number of individuals.
Credits: Jennifer DeBruyn, Kelly Sturner, Sarah Duncan and Suzanne Lenhart The 4‐H Name & Emblem is protected under 18 USC 707.
Did You Know? Tennessee is the most biodiverse inland state in the United States!
W 331‐A
Student Handout
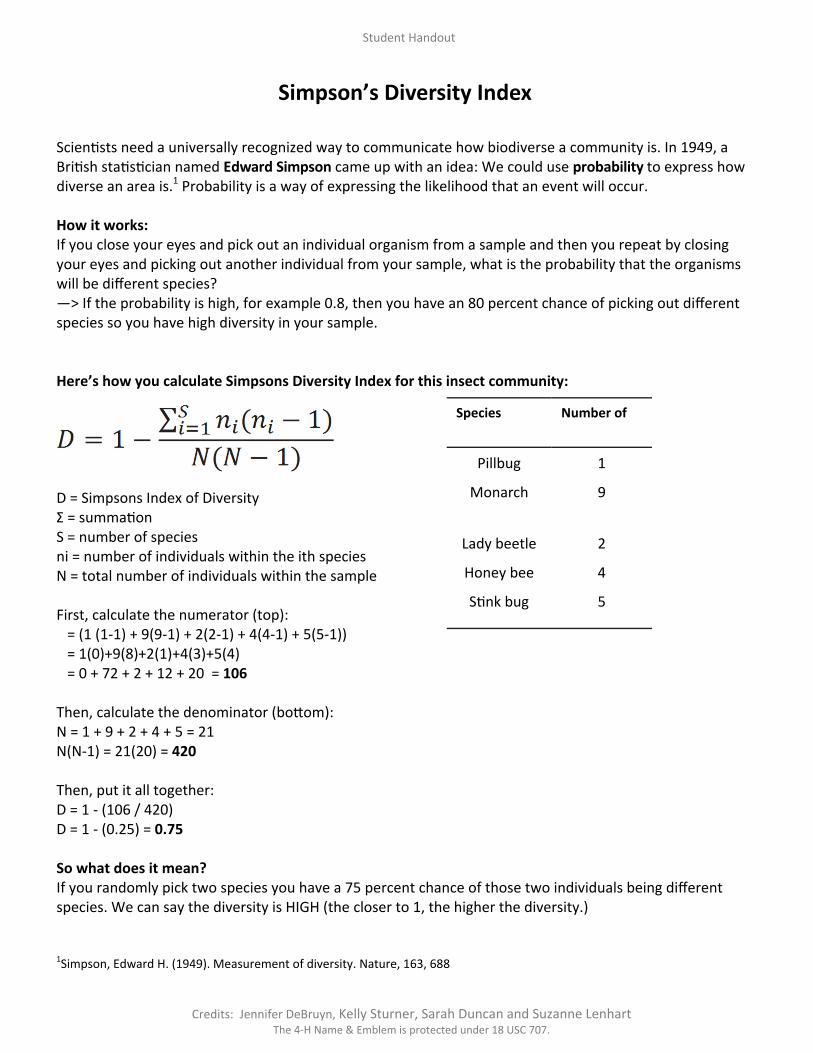
Simpson’s Diversity Index
Scien sts need a universally recognized way to communicate how biodiverse a community is. In 1949, a Bri sh sta s cian named Edward Simpson came up with an idea: We could use probability to express how diverse an area is.1 Probability is a way of expressing the likelihood that an event will occur. How it works: If you close your eyes and pick out an individual organism from a sample and then you repeat by closing your eyes and picking out another individual from your sample, what is the probability that the organisms will be different species? —> If the probability is high, for example 0.8, then you have an 80 percent chance of picking out different species so you have high diversity in your sample. Here’s how you calculate Simpsons Diversity Index for this insect community:
D = Simpsons Index of Diversity Σ = summa on S = number of species ni = number of individuals within the ith species N = total number of individuals within the sample First, calculate the numerator (top): = (1 (1‐1) + 9(9‐1) + 2(2‐1) + 4(4‐1) + 5(5‐1)) = 1(0)+9(8)+2(1)+4(3)+5(4) = 0 + 72 + 2 + 12 + 20 = 106 Then, calculate the denominator (bo om): N = 1 + 9 + 2 + 4 + 5 = 21 N(N‐1) = 21(20) = 420 Then, put it all together: D = 1 ‐ (106 / 420) D = 1 ‐ (0.25) = 0.75 So what does it mean? If you randomly pick two species you have a 75 percent chance of those two individuals being different species. We can say the diversity is HIGH (the closer to 1, the higher the diversity.) 1Simpson, Edward H. (1949). Measurement of diversity. Nature, 163, 688
Credits: Jennifer DeBruyn, Kelly Sturner, Sarah Duncan and Suzanne Lenhart The 4‐H Name & Emblem is protected under 18 USC 707.
Species Number of
Pillbug 1
Monarch 9
Lady beetle 2
Honey bee 4
S nk bug 5
Student Handout
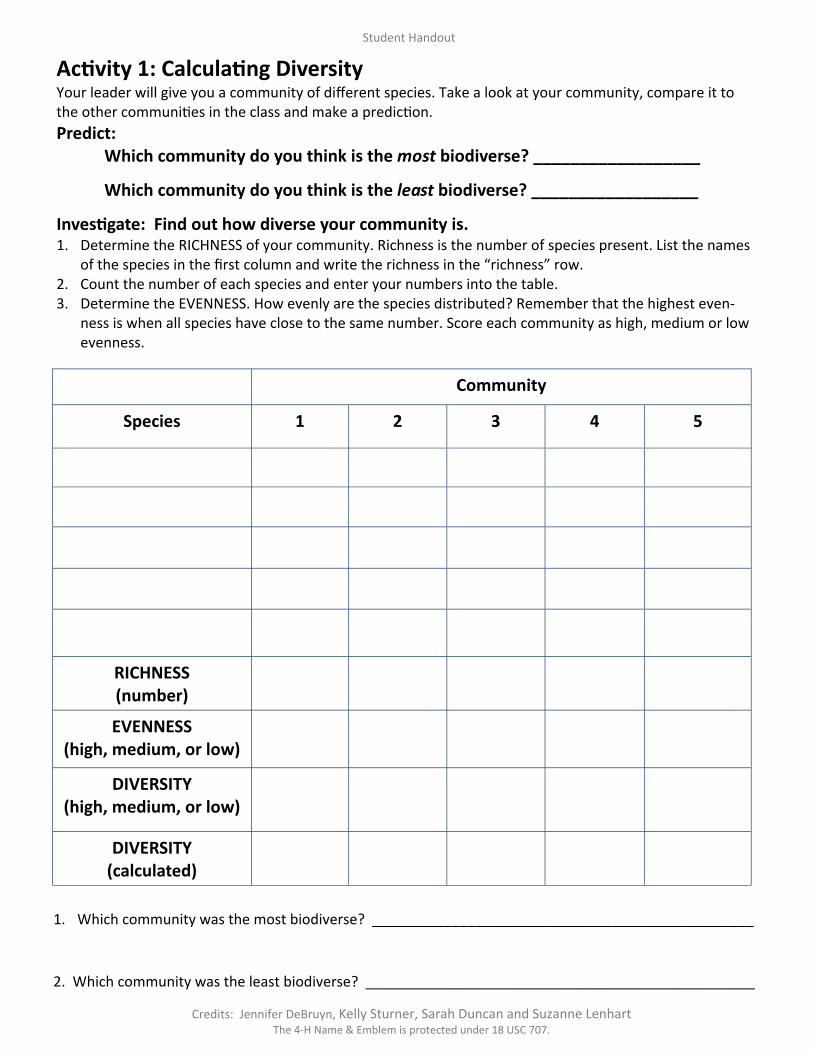
Ac vity 1: Calcula ng Diversity Your leader will give you a community of different species. Take a look at your community, compare it to the other communi es in the class and make a predic on.
Predict: Which community do you think is the most biodiverse? __________________
Which community do you think is the least biodiverse? __________________
Inves gate: Find out how diverse your community is. 1. Determine the RICHNESS of your community. Richness is the number of species present. List the names
of the species in the first column and write the richness in the “richness” row. 2. Count the number of each species and enter your numbers into the table. 3. Determine the EVENNESS. How evenly are the species distributed? Remember that the highest even‐
ness is when all species have close to the same number. Score each community as high, medium or low evenness.
Species 1 2 3 4 5
Community
RICHNESS (number)
EVENNESS (high, medium, or low)
DIVERSITY (high, medium, or low)
DIVERSITY (calculated)
1. Which community was the most biodiverse? ________________________________________________
2. Which community was the least biodiverse? _________________________________________________
Credits: Jennifer DeBruyn, Kelly Sturner, Sarah Duncan and Suzanne Lenhart The 4‐H Name & Emblem is protected under 18 USC 707.
Student Handout
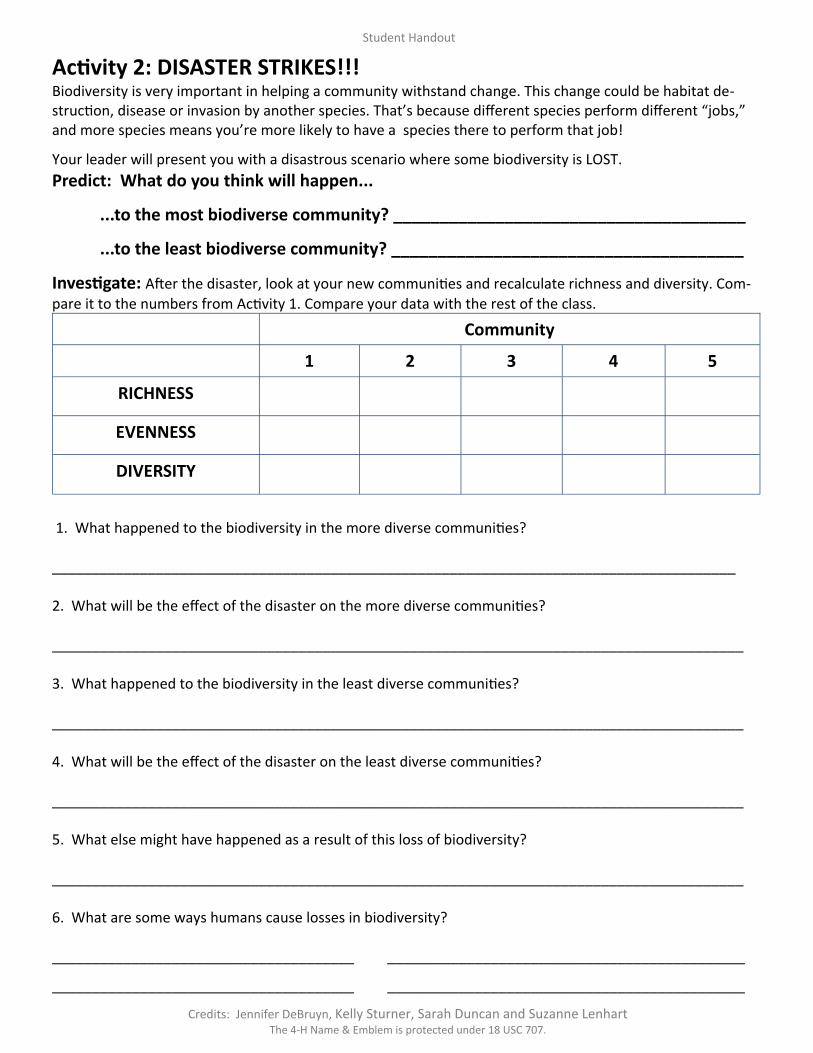
Ac vity 2: DISASTER STRIKES!!! Biodiversity is very important in helping a community withstand change. This change could be habitat de‐struc on, disease or invasion by another species. That’s because different species perform different “jobs,” and more species means you’re more likely to have a species there to perform that job!
Your leader will present you with a disastrous scenario where some biodiversity is LOST.
Predict: What do you think will happen...
...to the most biodiverse community? ______________________________________
...to the least biodiverse community? ______________________________________
Inves gate: A er the disaster, look at your new communi es and recalculate richness and diversity. Com‐
pare it to the numbers from Ac vity 1. Compare your data with the rest of the class.
1. What happened to the biodiversity in the more diverse communi es? ______________________________________________________________________________________ 2. What will be the effect of the disaster on the more diverse communi es? _______________________________________________________________________________________ 3. What happened to the biodiversity in the least diverse communi es? _______________________________________________________________________________________ 4. What will be the effect of the disaster on the least diverse communi es? _______________________________________________________________________________________ 5. What else might have happened as a result of this loss of biodiversity? _______________________________________________________________________________________ 6. What are some ways humans cause losses in biodiversity? ______________________________________ _____________________________________________
______________________________________ _____________________________________________
Credits: Jennifer DeBruyn, Kelly Sturner, Sarah Duncan and Suzanne Lenhart The 4‐H Name & Emblem is protected under 18 USC 707.
Community
1 2 3 4 5
RICHNESS
EVENNESS
DIVERSITY
Student Handout
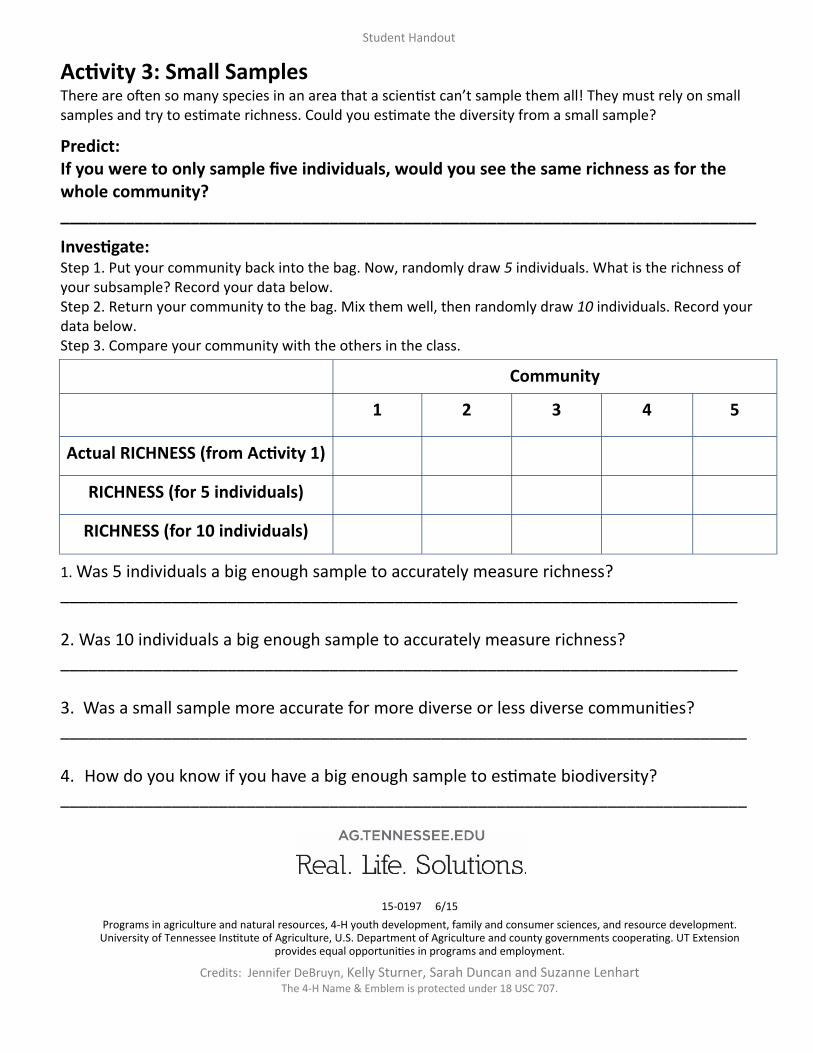
Ac vity 3: Small Samples There are o en so many species in an area that a scien st can’t sample them all! They must rely on small samples and try to es mate richness. Could you es mate the diversity from a small sample?
Predict: If you were to only sample five individuals, would you see the same richness as for the whole community? ___________________________________________________________________________
Inves gate: Step 1. Put your community back into the bag. Now, randomly draw 5 individuals. What is the richness of your subsample? Record your data below. Step 2. Return your community to the bag. Mix them well, then randomly draw 10 individuals. Record your data below. Step 3. Compare your community with the others in the class.
1. Was 5 individuals a big enough sample to accurately measure richness? _________________________________________________________________________ 2. Was 10 individuals a big enough sample to accurately measure richness? _________________________________________________________________________ 3. Was a small sample more accurate for more diverse or less diverse communi es? __________________________________________________________________________ 4. How do you know if you have a big enough sample to es mate biodiversity? __________________________________________________________________________
Community
1 2 3 4 5
RICHNESS (for 5 individuals)
RICHNESS (for 10 individuals)
Actual RICHNESS (from Ac vity 1)
15‐0197 6/15
Programs in agriculture and natural resources, 4‐H youth development, family and consumer sciences, and resource development. University of Tennessee Ins tute of Agriculture, U.S. Department of Agriculture and county governments coopera ng. UT Extension
provides equal opportuni es in programs and employment.
Credits: Jennifer DeBruyn, Kelly Sturner, Sarah Duncan and Suzanne Lenhart The 4‐H Name & Emblem is protected under 18 USC 707.