Embed Size (px)
Citation preview
Environmental Scan: External Factors Spring 2011, Page 1 of 17
Environmental Scan: Summary of External Trends
Compiled by: Office of Research, Planning, & Development Spring 2011
In preparation for the development of the 2011-2014 Strategic Plan, this summary of external trends identifies critical trends and potential developments outside of NVC that are likely to affect the college and the future of the college. The external factors included in the environmental scan lie beyond NVC’s control, but NVC should be aware of these factors in drafting plans for the next few years. The trends are organized around seven themes:
o Accountability & Institutional Effectiveness o Political Environment (Policy Changes) o State Budget o Economy & Workforce o Educational Environment o Demographic Changes among Service Area & Incoming Students o Accelerating Rate of Change
Supporting data related to these trends are presented at the national, state, and county levels. Approximately 27% of NVC credit students over the past few years have resided in Solano County. Therefore, Solano County is treated as part of NVC’s greater service area, and information about Solano County is incorporated into this report. This summary draws heavily from materials collected by the Los Rios Community College District Office of Institutional Research (with permission) (Key Issues for Planning, Los Rios Community College District Office of Institutional Research, August 2010) A summary of trends internal to NVC will follow this document and complete the environmental scan provided to inform the development of the 2011-2014 NVC Strategic Plan. The internal trends document will include data tracking NVC’s recent performance and describing the population of recent students.
Environmental Scan: External Factors Spring 2011, Page 2 of 17
Accountability & Institutional Effectiveness
Demands for increasing accountability within the community college system have become more
frequent in recent years.
o This demand “is fueled by a wide variety of issues including the increased cost *of attending+
colleges and universities; widely reported data showing the United States is no longer a leader in
educational attainment and has fallen behind many other countries in the number of citizens
who hold a bachelor’s degree; and an increased perception by pundits and the general public
alike that higher education may not offer the value it once did.
“Community colleges are perhaps under the greatest scrutiny as they enroll the vast majority of
students in higher education including the majority of low income and [racially/]ethnically
diverse students. This has led governments, foundations, and think tanks to focus on improved
student performance at the community college level as a way to increase degree attainment
nationally” (Key Issues for Planning, Los Rios Community College District Office of Institutional
Research, August 2010, page 1).
A number of recent reports and articles have highlighted the ineffectiveness of California community colleges. Some examples include:
o 70% of students seeking degrees did not manage to attain them or transfer to four-year institutions within six years. (Source: Community Colleges Not Preparing California’s Future Workforce, Study Says, L.A. Times, 20 October 2010)
o There is an expressed interest in compressing the amount of time required for developmental students to become college-ready. (Source: Something’s Got to Give: California Can’t Improve College Completions without Rethinking Developmental Education at Its Community Colleges, EdSource, October 2010)
Within the California community college system, the increased demand for accountability has resulted
in new reporting requirements:
o The development of Accountability Reporting for Community Colleges (ARCC), implemented in 2007. The Chancellor’s Office worked with the State Legislature to identify appropriate indicators to measure performance among individual campuses and across the system as a whole. Compliance with the new accountability system is a legislative requirement.
o Perkins IV Accountability implemented in 2008-2009. The program integrates academic and career technical education (CTE) training to prepare students for high demand, high skill, and high wage careers. The increased accountability comes in two forms: the state and local use of funds and performance measures. Funding is tied to performance on key indicators, with sanctions possible if colleges fall short of their pre-identified performance levels.
Environmental Scan: External Factors Spring 2011, Page 3 of 17
o Basic Skills Initiative, which began in 2006 as part of the strategic planning efforts of the Chancellor’s Office, has identified a number of effective practices for community colleges to increase the success of underprepared students. The literature and effective practices encourage community colleges to rethink and restructure the delivery of instruction and support services. Funding is tied to enrollments within basic skills courses.
The Accrediting Commission for Community and Junior Colleges (ACCJC) has also increased accountability among community colleges, by focusing on the “value added” to students’ skill sets. The current accreditation standard (adopted in 2002) focus on student learning outcomes and the assessment of student learning at the course, program, and institutional levels. With the demand for accountability, a number of initiatives have emerged, designed to track student and institutional performance and incorporate national benchmarks. Some examples include Achieving the Dream, the National Community College Benchmark Project, and the Community College Survey of Student Engagement (CCSSE).
Environmental Scan: External Factors Spring 2011, Page 4 of 17
Political Environment (Policy Changes) Closely related to the increasing demand for accountability is the political environment and recent policy changes related to education, and specifically the work of the community colleges. “Growing concerns about student success rates in community colleges have prompted calls for better measures of student progress and for holding colleges more accountable for that progress. In 2010 in California, that momentum crystallized into several legislative proposals to change state policy related to such issues as transfer requirements and state funding formulas” (Something’s Got to Give: California Can’t Improve College Completions without Rethinking Developmental Education at Its Community Colleges, EdSource, October 2010, page 23).
o SB 1440, the Student Transfer Achievement Reform (STAR) Act was signed in September 2010. The new law requires institutions within the California State University (CSU) system to guarantee admission (with junior status) to community college students who have completed the requirements for transfer as well as the requirements for an associate’s degree within a specific major. Another bill (AB 2302) calls on the University of California (UC) system to develop a similar transfer pathway.
o SB 1143 (signed September 2010) “calls on the Board of Governors [BOG] to adopt a plan for promoting and improving student success, including ‘alternative funding options instituted in other states for improving student success and completion’” (Something’s Got to Give: California Can’t Improve College Completions without Rethinking Developmental Education at Its Community Colleges, EdSource, October 2010, page 19). The BOG recommendations are anticipated by March 2012.
Although the community college mission has traditionally been focused on the provision of vocational/career technical education, basic skills, and transfer preparation, the California Community Colleges Chancellor’s Office (CCCCO) has increasingly underscored these three aspects of the community college mission, particularly within the constraints associated with the current budget crisis. Access vs. Success has been a theme for community colleges for quite some time. Some recent developments and potential policy shifts have recently renewed the discussion of access, success, and the relationship between the two.
o In 2009, the Academic Senate for California Community Colleges (ASCCC) passed a resolution recommending changes to Title 5, which would shift the requirement for English, reading, and mathematics prerequisite validation (for college-level courses outside of the discipline) from statistical analysis to content review. The debate over prerequisites directly relates to the issue of access vs. success. A decision on the prerequisite validation proposal is pending.
o In its Vision 2020, the Community College League of California’s (CCLC’s) Commission on the
Future identifies three equally important values for the system – access, success, and equity – and articulates an interest in balancing success with access and equity without sacrificing quality. The explicit goal of the Commission on the Future relates directly to success, as the Commission has called for a system-wide increase of one million certificates and associate degrees by 2020. This increase amounts to almost doubling the number of degrees and quadrupling the number of certificates conferred annually, over the 2008-2009 baseline.
Environmental Scan: External Factors Spring 2011, Page 5 of 17
(Source: Vision 2020: Student Success – A Report of the Commission on the Future of the Community College League of California, 2010) For NVC, this goal translates into approximately 1250 degrees (over the baseline of 640) and approximately 1075 certificates (over the baseline of 291).
Developments among other segments of the California educational system also impact the community colleges.
o The adoption of the Common Core State Standards by the California State Board of Education (in August 2010) might facilitate students’ transition from high school to community college. “Many see the Common Core adoption as a crucial first step in increasing the percentage of high school graduates qualified to enter college without remediation because it could result in a closer alignment between high school graduation requirements and the readiness expectations of community colleges” (Something’s Got to Give: California Can’t Improve College Completions without Rethinking Developmental Education at Its Community Colleges, EdSource, October 2010, page 21).
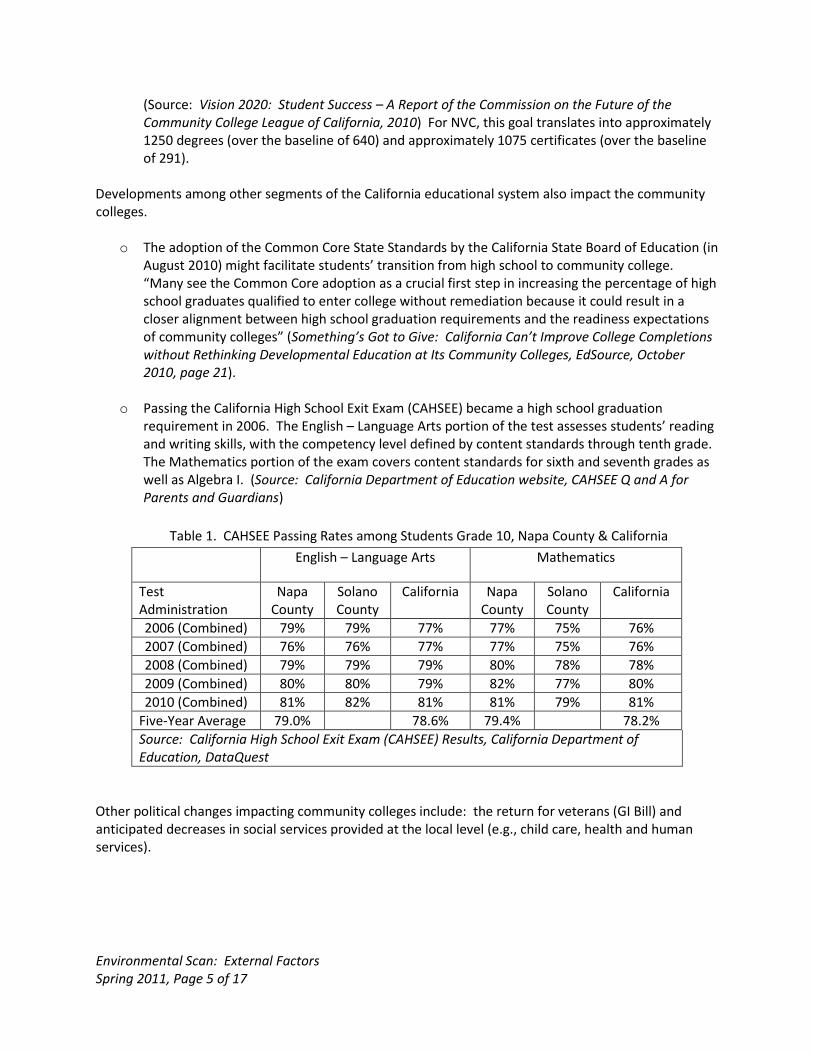
o Passing the California High School Exit Exam (CAHSEE) became a high school graduation requirement in 2006. The English – Language Arts portion of the test assesses students’ reading and writing skills, with the competency level defined by content standards through tenth grade. The Mathematics portion of the exam covers content standards for sixth and seventh grades as well as Algebra I. (Source: California Department of Education website, CAHSEE Q and A for Parents and Guardians)
Table 1. CAHSEE Passing Rates among Students Grade 10, Napa County & California
English – Language Arts Mathematics
Test Administration
Napa County
Solano County
California Napa County
Solano County
California
2006 (Combined) 79% 79% 77% 77% 75% 76%
2007 (Combined) 76% 76% 77% 77% 75% 76%
2008 (Combined) 79% 79% 79% 80% 78% 78%
2009 (Combined) 80% 80% 79% 82% 77% 80%
2010 (Combined) 81% 82% 81% 81% 79% 81%
Five-Year Average 79.0% 78.6% 79.4% 78.2%
Source: California High School Exit Exam (CAHSEE) Results, California Department of Education, DataQuest
Other political changes impacting community colleges include: the return for veterans (GI Bill) and anticipated decreases in social services provided at the local level (e.g., child care, health and human services).
Environmental Scan: External Factors Spring 2011, Page 6 of 17
State Budget “Nationally, higher education has seen a decline in state funding support over the past decade. The recent recession has only exacerbated that trend. Most experts do not see a significant reversal of funding declines for higher education over the next few years. At the same time, enrollment fees have been on the rise as colleges and universities try to recoup their losses by charging students more. Even enrollment fees for California’s community colleges have increased 30% from 2008-09 to 2009-10. Due to budget cuts and increased fees at all three of California’s public higher education systems, many thousands of students are being denied access, and programs and services are being underfunded. The loss of access poses a serious threat to the economic and social viability of our state and nation” (Key Issues for Planning, Los Rios Community College District Office of Institutional Research, August 2010, page 2). Recent changes to state funding include:
o cuts to Matriculation funding, along with more flexible use of Matriculation funds; and o cut to Basic Skills Initiative allocations.
Within the context of the budget and discussion of cost-reduction strategies at the state level, suspension of some policies and practices that limit the flexibility of campuses to respond to the budget crisis have been considered. Examples include the full-time faculty obligation, the 50% law, and limitations on contracting out for non-instructional activities. At the time of printing this summary of external factors impacting the college, the proposed 2011-2012 budget does not include mid-year cuts or additional cuts to Matriculation. However, it does include a fee increase from $26/unit to $36/unit, potential changes in apportionment and funding formulas/census accounting practices, and extension of Matriculation flexibility for two more years (through 2014-2015). The Community College League of California (CCLC) has outlined three possible scenarios for the community colleges, to help guide planning efforts. The first (best case) scenario assumes that the June tax package proposed by Governor Brown obtains voter approval. If this scenario holds, NVC can anticipate budget losses of $1.5M (along with a loss of approximately 838 students). If the tax package does not gain voter approval and Proposition 98 is funded at the minimum level, NVC will need to cut approximately $2.6M (and lose 1,474 students). If the tax package fails and Prop. 98 is suspended, NVC will need to cut approximately $4.1M (and lose 2,280 students). (Source: District Budget Impact for Napa Valley College, Budget Advocacy Action Center, Community College League of California, January 21, 2011) California Community Colleges charge the lowest resident undergraduate tuition among community colleges in the nation. In 2009-2010, the tuition for a full-time California community college student was $780 (based on 30 semester hours; $26 * 30 = $780). The national average was $3,029, and the range among the remaining states (not including South Dakota) was $1,125 to $6,262. (Source: 2009-20 Tuition & Fee Rates: A National Comparison, Washington Higher Education Coordinating Board, March 2010). Over the past couple of years, NVC has pursued a number of different cost-saving and revenue-generating measures. Examples include: cutting sections, reviewing spending and photocopying practices, restricting travel budgets, reorganizations, an early retirement incentive (ERI), and pursuing negotiable items to cut costs.
Environmental Scan: External Factors Spring 2011, Page 7 of 17
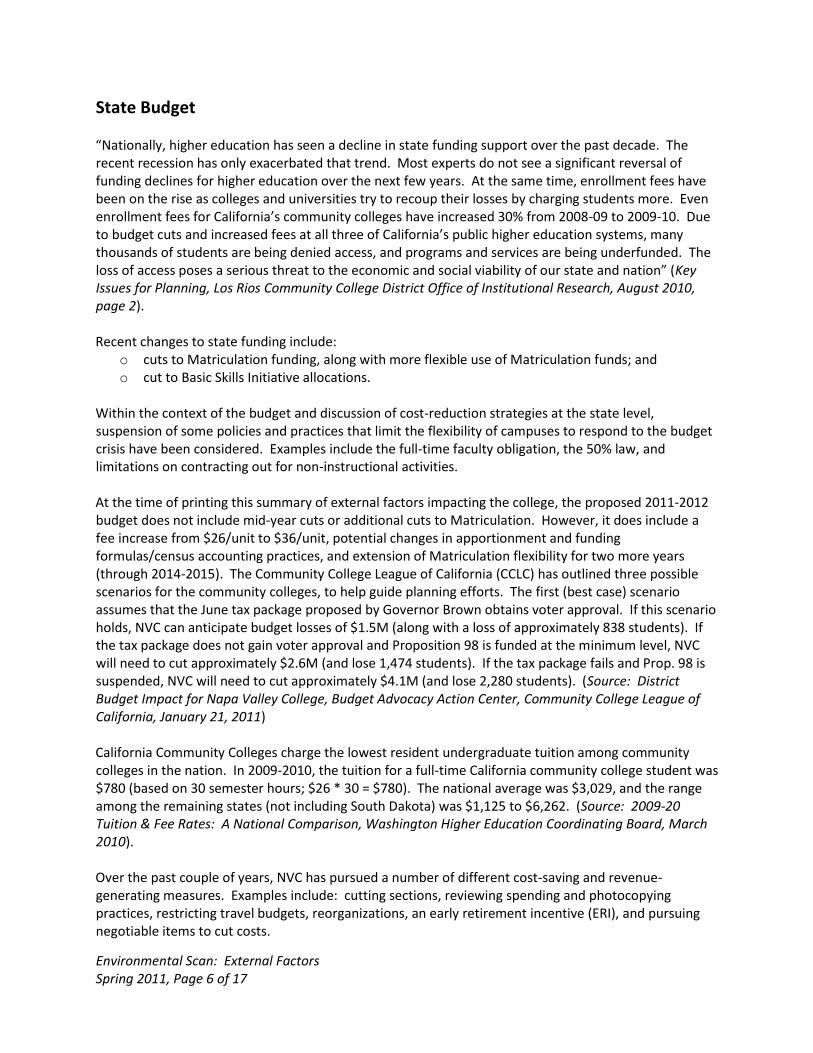
Economy & Workforce For the first time in U.S. history, the education level of incoming workers is the same or less than that of the previous generation. With Baby Boomers reaching traditional retirement age, there are insufficient numbers of new workers to replace them or fill newly created positions. “Increasing numbers of the Baby Boom generation will reach retirement age in the coming decade with the first wave turning age 65 in2011. The U.S. Census Bureau defines this generation as those who were born between 1946 and 1964. During the same period, seventy-six million American children were born. Due to the Great Recession of 2008, some Baby Boomers have placed their retirements on hold but with an improved economy, it is expected that higher education will be faced with massive losses of experienced faculty, staff and managers. Competition for talented individuals across the country to replace the retiring Baby Boomers will be extremely high as the next generation following the Baby Boomers is much smaller in size” (Key Issues for Planning, Los Rios Community College District Office of Institutional Research, August 2010, page 4). Not only does this trend have the potential of impacting NVC’s recruiting and replacement efforts (as its own faculty and staff retire), but it is also incumbent on the college to provide appropriate training to replace the retiring skilled workforce. While these trends are expected to affect California as well as the country in general, dramatic changes might come to Napa County even sooner than other regions because the age distribution within Napa County has tended toward the higher end. As shown in the table below, the median age among the population of Napa County tends to be approximately 5 years above the median within California.
Table 2. Median Age among Population of U.S., California, & Napa & Solano Counties
Geographic Region 2000 Census 2007-2009 ACS
United States 35.3 36.7
California 33.3 34.7
Napa County 38.3 39.3
Solano County 33.9 36.2
Source: U.S. Census 2000 & American Community Survey (ACS) 2007-2009, American FactFinder
Described as “America’s Perfect Storm,” there are three converging forces expected to impact our ability to compete internationally in the coming years. The three factors are:
o Divergent skill distributions among school-age and adult populations: As measured by high school graduation rates, achievement gaps, literacy and numeracy skills;
o Economic restructuring: Shift in composition of jobs – toward those employing individuals with higher levels of education and skills, result of technological innovation and globalization; and
o Demographic changes: larger, older, and more diverse population, with immigration significantly impacting population growth/demographics.
“Employing demographic projections combined with current skill distributions, we estimate that by 2030 the average levels of literacy and numeracy in the working-age population will have decreased by about 5 percent while inequality will have increased by about 7 percent. Put crudely, over the next 25 years or so, as better-educated individuals leave the workforce they will be replaced by those who, on average, have lower levels of education and skill. Over this same period, nearly half of the projected job growth
Environmental Scan: External Factors Spring 2011, Page 8 of 17
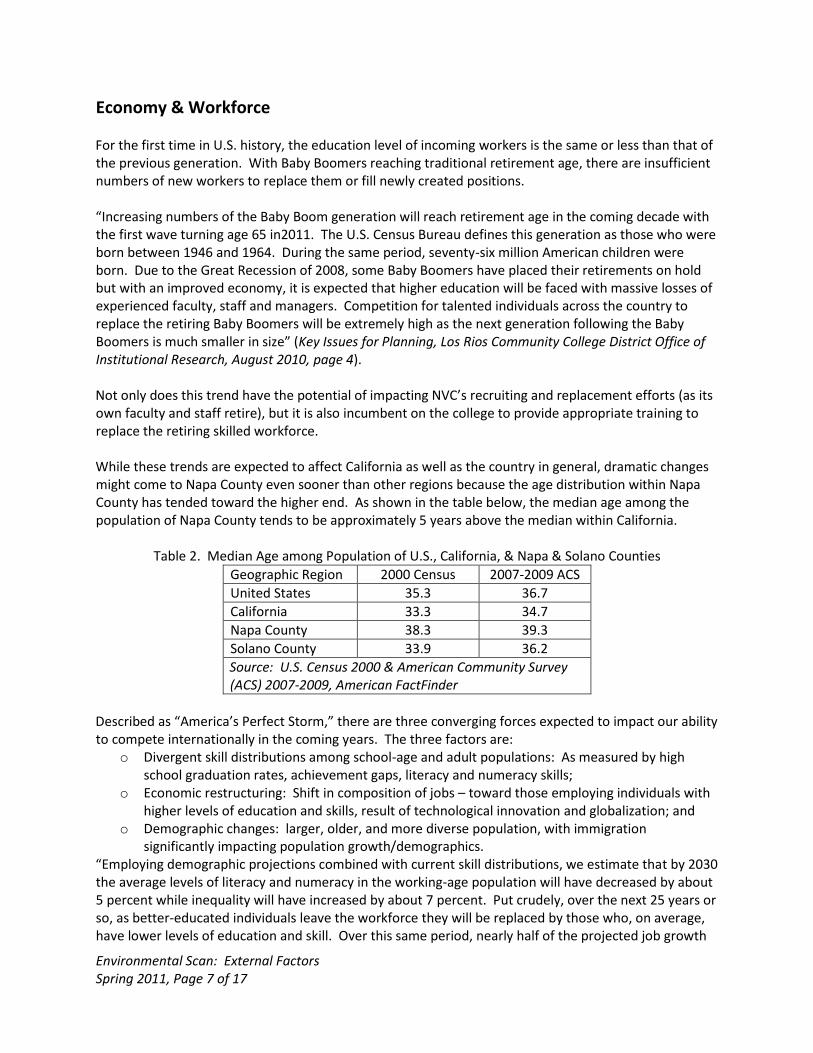
will be concentrated in occupations associated with higher education and skill levels. This means that tens of millions more of our students and adults will be less able to qualify for higher-paying jobs. Instead, they will be competing not only with each other and millions of newly arrived immigrants but also with the equally (or better) skilled workers in lower-wage economies around the world” (American’s Pefect Storm: Three Forces Changing Our Nation’s Future, Educational Testing Service, January 2007, page 4). As shown in the table below, Napa County tends to claim a lower unemployment rate than California, while Solano County’s unemployment rate tends to reflect that of the state.
Table 3. Unemployment Rates within Napa County, Solano County, & California
Month Napa County Solano County California
December 2010 10.6% 12.1% 12.3%
September 2010 9.3% 12.1% 12.2%
June 2010 9.3% 12.2% 12.2%
March 2010 10.8% 13.0% 13.0%
Source: California Employment Development Department (EDD)
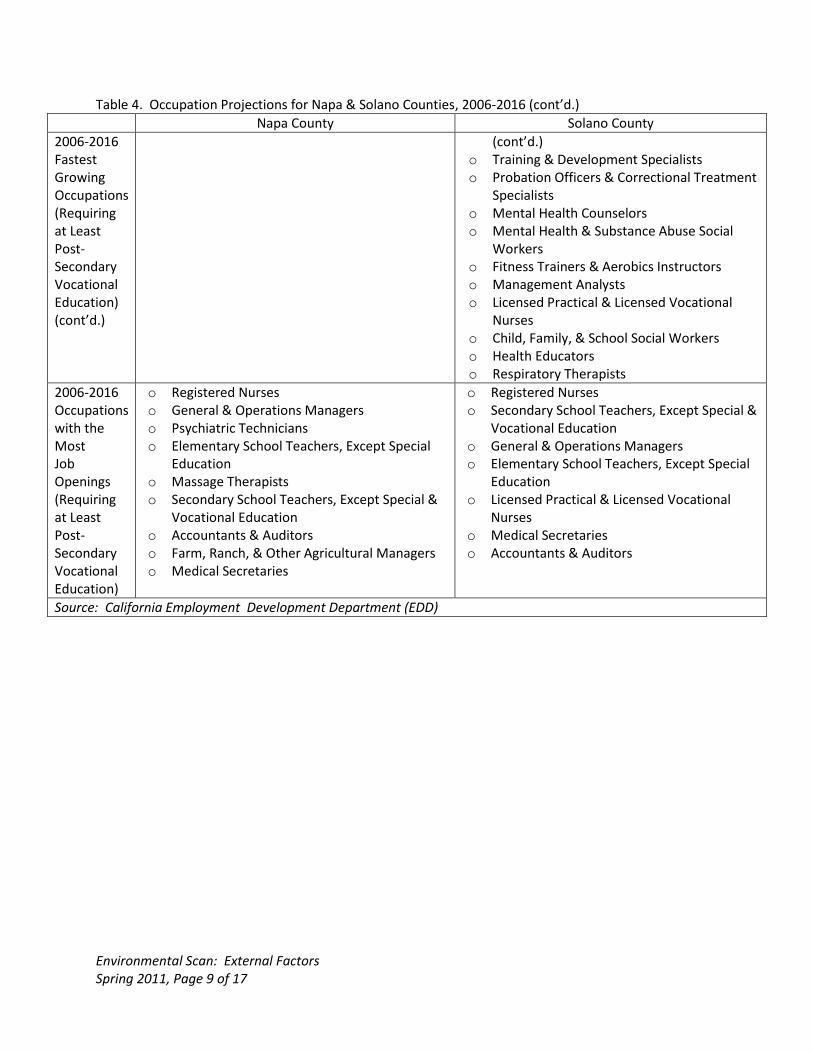
The table below identifies the fastest growing occupations as well as the occupations with the most job openings requiring at least a post-secondary vocational education in Napa and Solano Counties between 2006 and 2016.
Table 4. Occupation Projections for Napa & Solano Counties, 2006-2016
Napa County Solano County
2006-2016 Fastest Growing Occupations (Requiring at Least Post-Secondary Vocational Education)
o Massage Therapists o Farm, Ranch, & Other Agricultural Managers o Vocational Education Teachers,
Postsecondary o Accountants & Auditors o Registered Nurses o Computer Support Specialists o Physical Therapists o Medical & Health Services Managers o Financial Managers o Industrial Production Managers o Chemists o Dental Hygienists
o Computer Software Engineers, Applications o Biological Technicians o Registered Nurses o Welders, Cutters, Solderers, & Brazers o Physical Therapists o Computer Systems Analysts o Mobile Heavy Equipment Mechanics, Except
Engines o Veterinary Technologists & Technicians o Insurance Sales Agents o Radiologic Technologists & Technicians o Dental Hygienists o Medical & Health Services Managers o Network & Computer Systems
Administrators o Pharmacists o Industrial Production Managers o Substance Abuse & Behavioral Disorder
Counselors o Lawyers o Medical Records & Health Information
Technicians o Medical Secretaries
Environmental Scan: External Factors Spring 2011, Page 9 of 17
Table 4. Occupation Projections for Napa & Solano Counties, 2006-2016 (cont’d.) Napa County Solano County
2006-2016 Fastest Growing Occupations (Requiring at Least Post-Secondary Vocational Education) (cont’d.)
(cont’d.) o Training & Development Specialists o Probation Officers & Correctional Treatment
Specialists o Mental Health Counselors o Mental Health & Substance Abuse Social
Workers o Fitness Trainers & Aerobics Instructors o Management Analysts o Licensed Practical & Licensed Vocational
Nurses o Child, Family, & School Social Workers o Health Educators o Respiratory Therapists
2006-2016 Occupations with the Most Job Openings (Requiring at Least Post-Secondary Vocational Education)
o Registered Nurses o General & Operations Managers o Psychiatric Technicians o Elementary School Teachers, Except Special
Education o Massage Therapists o Secondary School Teachers, Except Special &
Vocational Education o Accountants & Auditors o Farm, Ranch, & Other Agricultural Managers o Medical Secretaries
o Registered Nurses o Secondary School Teachers, Except Special &
Vocational Education o General & Operations Managers o Elementary School Teachers, Except Special
Education o Licensed Practical & Licensed Vocational
Nurses o Medical Secretaries o Accountants & Auditors
Source: California Employment Development Department (EDD)
Environmental Scan: External Factors Spring 2011, Page 10 of 17
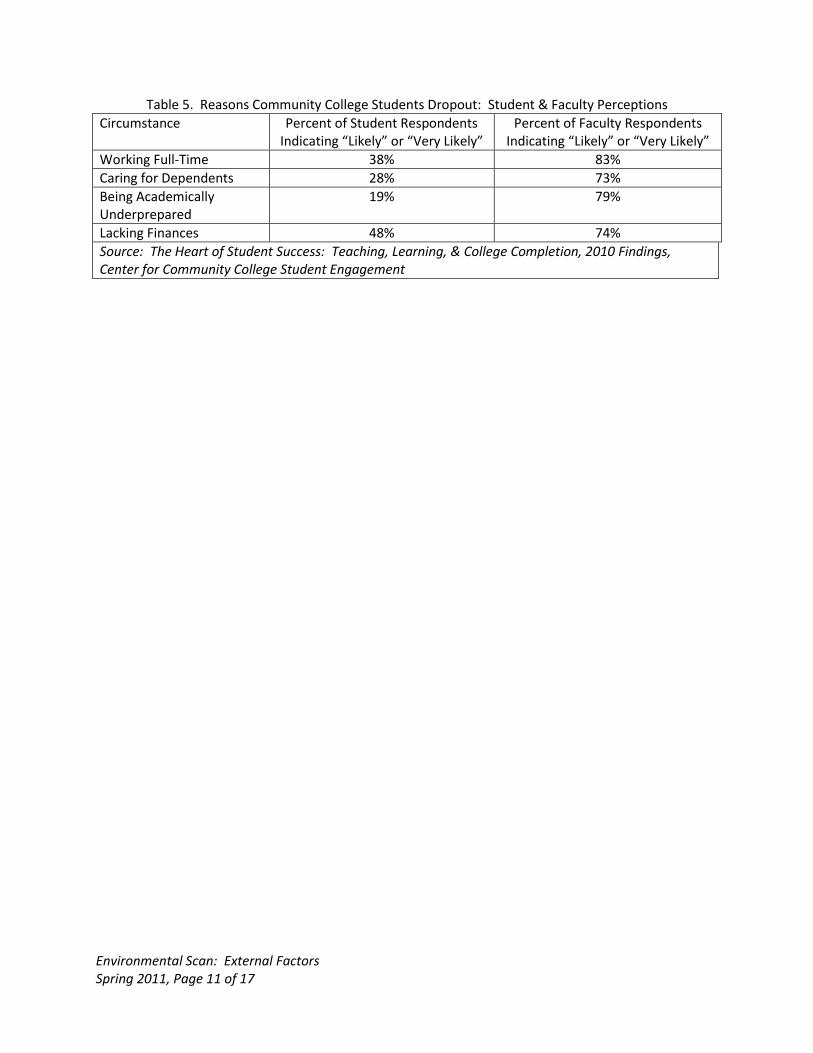
Educational Environment The educational marketplace is becoming increasingly competitive. “The educational market place is becoming crowded and students have more options than ever before. Prestigious colleges and universities are offering online courses and programs to students in far-flung places around the globe. Meanwhile, the number of two-year and four-year for-profit educational institutions . . .” has increased. These institutions tend to offer many of the high-demand programs offered by community colleges. “While for-profit institutions have recently come under more scrutiny, most experts believe their unprecedented growth will continue as students find it more difficult to enter public colleges and universities and look for alternative ways to acquire job skills quickly. The two primary selling points that for-profit institutions market are short time to completion and ‘guaranteed’ job placement” (Key Issues for Planning, Los Rios Community College District Office of Institutional Research, August 2010, pages 3-4). While online courses and programs offer students within the NVC service area an alternative to NVC (and thereby challenge NVC), online education also offers an opportunity for NVC to expand into new/distant markets. Stabilization of the educational environment is not expected anytime soon. The recent past and present is likely the status quo of the future – changes to global economic, technological, and competitive landscapes will continue at a relatively accelerated pace. (Source: AACRAO Strategic Enrollment Management Conference, Fall 2010) As a result of decreasing admissions as well as increasing tuition at CSU and UC institutions, students will continue to revert to community colleges for post-secondary education. The tension between open access and high academic expectations is likely to continue. Coordination between educational segments (K-12, community colleges, and four-year institutions) will be encouraged, in order to facilitate transitions for students and limit the number of standardized test requirements. The California community college system implemented higher English and math degree requirements, beginning with students who entered in fall 2009. The English requirement equates to college composition/transfer-level English, and the math requirement equates to intermediate algebra/one level below transfer. (Title 5, §55063 of the Education Code) Based on results from the 2010 Community College Survey of Student Engagement (CCSSE), the Center for Community College Student Engagement (CCCSE, affiliated with UT-Austin) identified a number of significant differences between student and faculty perceptions. “The contrast between student and faculty responses shows that faculty are far more likely to believe that various circumstances, including working full-time, caring for dependents, or being academically underprepared, would be likely causes for students to drop out of college” (The Heart of Student Success: Teaching, Learning, & College Completion, 2010 Findings, Center for Community College Student Engagement , page 6).
Environmental Scan: External Factors Spring 2011, Page 11 of 17
Table 5. Reasons Community College Students Dropout: Student & Faculty Perceptions
Circumstance Percent of Student Respondents Indicating “Likely” or “Very Likely”
Percent of Faculty Respondents Indicating “Likely” or “Very Likely”
Working Full-Time 38% 83%
Caring for Dependents 28% 73%
Being Academically Underprepared
19% 79%
Lacking Finances 48% 74%
Source: The Heart of Student Success: Teaching, Learning, & College Completion, 2010 Findings, Center for Community College Student Engagement
Environmental Scan: External Factors Spring 2011, Page 12 of 17
Demographic Changes among Service Area & Incoming Students “Higher education is coming off the greatest ‘bull market’ that it has ever experienced. Between 1990 and 2009, the national number of high school graduates increased by more than 35%, from 2.4 million to 3.3 million. But like the boom in the stock market, the bull market in higher education is ending. The peak of 3.3 million high school graduates is not likely to be seen again until 2020. According to the Western Interstate Commission for Higher Education (WISCHE) which has been tracking the number of future high school graduates by race and region for decades, the picture for California shows a leveling off of graduates. . . . “Digging a little deeper into the data, we see the continued diversification of California’s students over the coming few years is truly striking and potentially has more far-reaching implications. Between 2010 and 2020, the numbers of African American and white high school graduates are expected to decline by 2.4% and 15.2% respectively; while the numbers of Native American, Asian and Hispanic high school graduates will increase by 10.2%, 60.5% and 88% respectively. Future college students will not only be more diverse, but as suggested by a recent Pew Research study, will in many ways also resemble the great immigrant influx of the early 20th century. “These students could well have different educational aspirations and different expectations of what a college education should provide. They will be more employment oriented. And, while they are likely to be equally, if not more, academically motivated compared to students of the past decade, they will likely be less prepared academically with many coming from first-generation households in which English is a second language” (Key Issues for Planning, Los Rios Community College District Office of Institutional Research, August 2010, page 3).
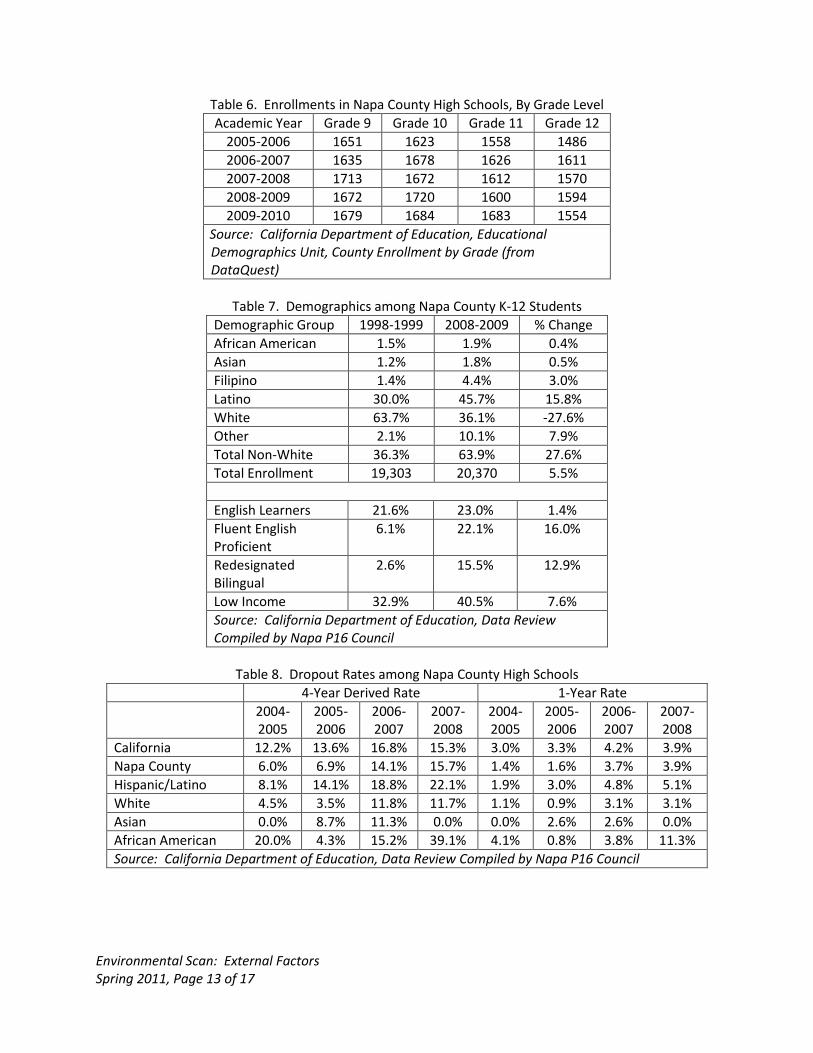
The following tables present information about the Napa County high school student population that
will likely impact NVC. Some highlights include:
o Over the past five years, the number of high school seniors in Napa County has increased by
4.6%. (See Table 6.)
o The Napa County high school population is becoming increasingly diverse. Over the past ten
years, the non-white population share has increased by approximately 28%. The largest
increases in population share have come among Latino students and those that define
themselves as “Other.” (See Table 7.)
o Prior to 2006-2007, Napa County’s dropout rate was significantly lower than that of California. In
recent years, however, the local dropout rate has reflected that of the state. Hispanic/Latino
and African American students tend to claim the highest dropout rates. (See Table 8.)
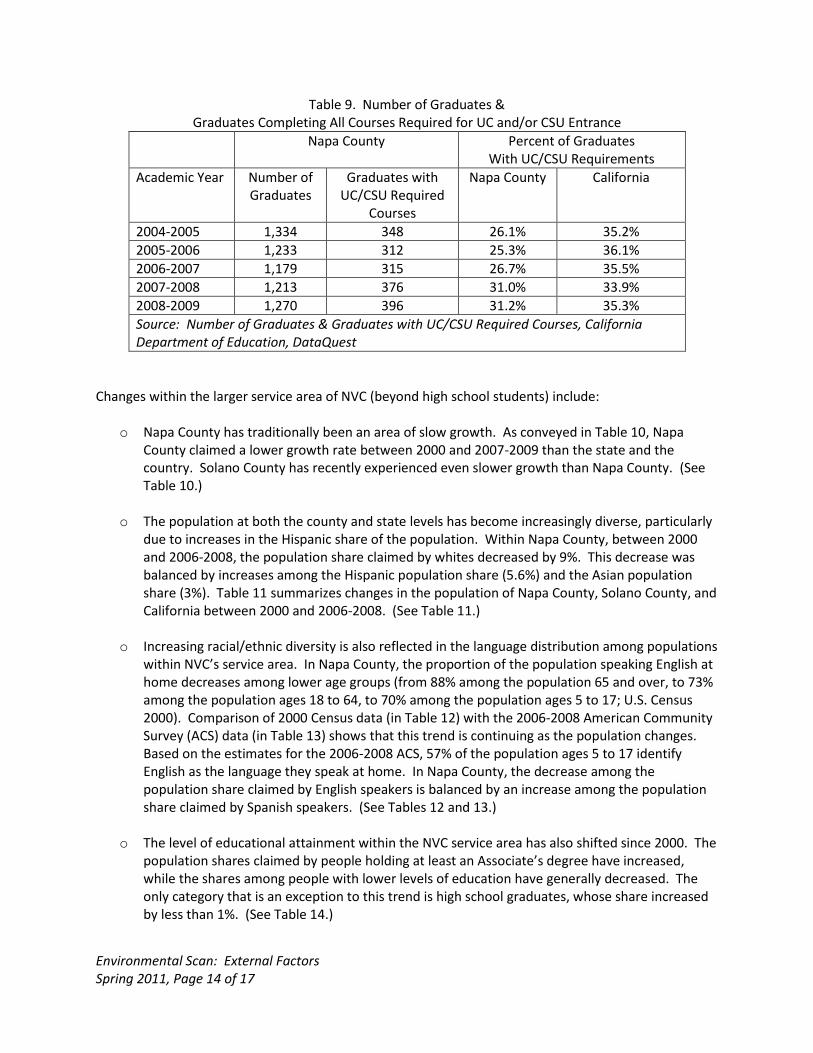
o In each of the past four years, approximately 1,200 students have graduated from Napa County
high schools. Roughly 25% to 31% of recent graduates have completed requirements for
UC/CSU admission. The Napa County rate of “UC/CSU readiness” tends to be lower than that of
the state. (See Table 9.)
Environmental Scan: External Factors Spring 2011, Page 13 of 17
Table 6. Enrollments in Napa County High Schools, By Grade Level
Academic Year Grade 9 Grade 10 Grade 11 Grade 12
2005-2006 1651 1623 1558 1486
2006-2007 1635 1678 1626 1611
2007-2008 1713 1672 1612 1570
2008-2009 1672 1720 1600 1594
2009-2010 1679 1684 1683 1554
Source: California Department of Education, Educational Demographics Unit, County Enrollment by Grade (from DataQuest)
Table 7. Demographics among Napa County K-12 Students
Demographic Group 1998-1999 2008-2009 % Change
African American 1.5% 1.9% 0.4%
Asian 1.2% 1.8% 0.5%
Filipino 1.4% 4.4% 3.0%
Latino 30.0% 45.7% 15.8%
White 63.7% 36.1% -27.6%
Other 2.1% 10.1% 7.9%
Total Non-White 36.3% 63.9% 27.6%
Total Enrollment 19,303 20,370 5.5%
English Learners 21.6% 23.0% 1.4%
Fluent English Proficient
6.1% 22.1% 16.0%
Redesignated Bilingual
2.6% 15.5% 12.9%
Low Income 32.9% 40.5% 7.6%
Source: California Department of Education, Data Review Compiled by Napa P16 Council
Table 8. Dropout Rates among Napa County High Schools
4-Year Derived Rate 1-Year Rate
2004- 2005
2005- 2006
2006- 2007
2007- 2008
2004- 2005
2005- 2006
2006- 2007
2007- 2008
California 12.2% 13.6% 16.8% 15.3% 3.0% 3.3% 4.2% 3.9%
Napa County 6.0% 6.9% 14.1% 15.7% 1.4% 1.6% 3.7% 3.9%
Hispanic/Latino 8.1% 14.1% 18.8% 22.1% 1.9% 3.0% 4.8% 5.1%
White 4.5% 3.5% 11.8% 11.7% 1.1% 0.9% 3.1% 3.1%
Asian 0.0% 8.7% 11.3% 0.0% 0.0% 2.6% 2.6% 0.0%
African American 20.0% 4.3% 15.2% 39.1% 4.1% 0.8% 3.8% 11.3%
Source: California Department of Education, Data Review Compiled by Napa P16 Council
Environmental Scan: External Factors Spring 2011, Page 14 of 17
Table 9. Number of Graduates & Graduates Completing All Courses Required for UC and/or CSU Entrance
Napa County Percent of Graduates With UC/CSU Requirements
Academic Year Number of Graduates
Graduates with UC/CSU Required
Courses
Napa County California
2004-2005 1,334 348 26.1% 35.2%
2005-2006 1,233 312 25.3% 36.1%
2006-2007 1,179 315 26.7% 35.5%
2007-2008 1,213 376 31.0% 33.9%
2008-2009 1,270 396 31.2% 35.3%
Source: Number of Graduates & Graduates with UC/CSU Required Courses, California Department of Education, DataQuest
Changes within the larger service area of NVC (beyond high school students) include:
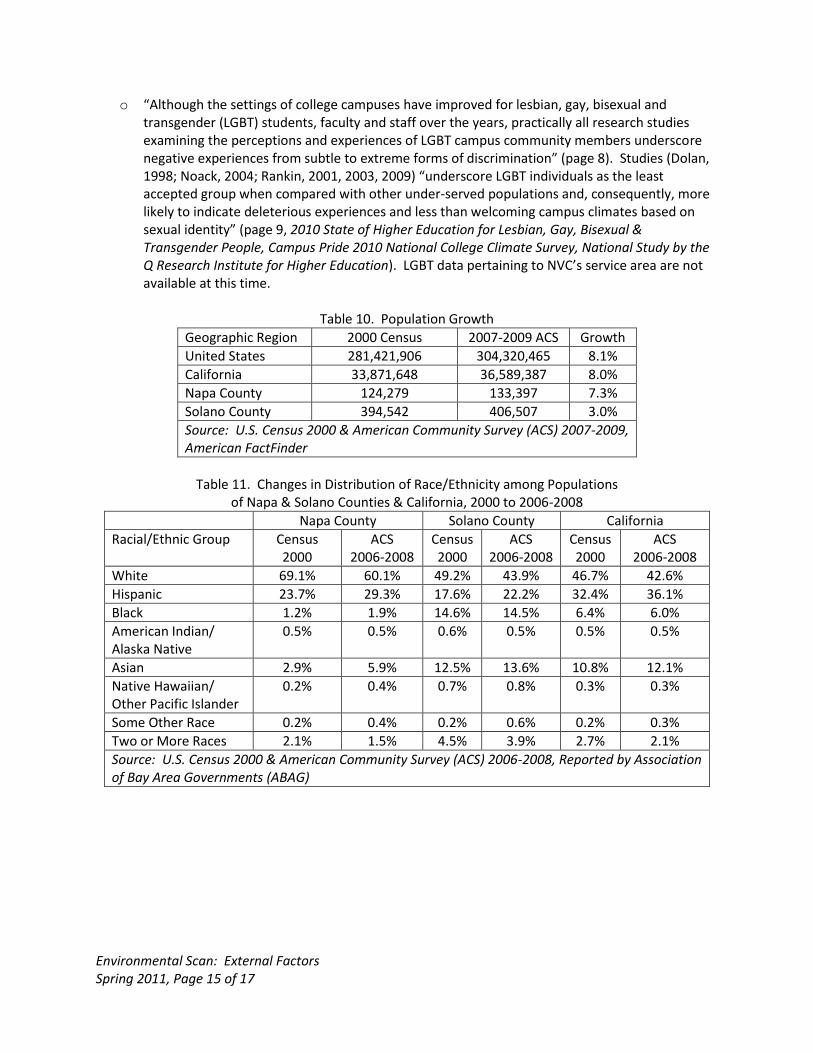
o Napa County has traditionally been an area of slow growth. As conveyed in Table 10, Napa County claimed a lower growth rate between 2000 and 2007-2009 than the state and the country. Solano County has recently experienced even slower growth than Napa County. (See Table 10.)
o The population at both the county and state levels has become increasingly diverse, particularly due to increases in the Hispanic share of the population. Within Napa County, between 2000 and 2006-2008, the population share claimed by whites decreased by 9%. This decrease was balanced by increases among the Hispanic population share (5.6%) and the Asian population share (3%). Table 11 summarizes changes in the population of Napa County, Solano County, and California between 2000 and 2006-2008. (See Table 11.)
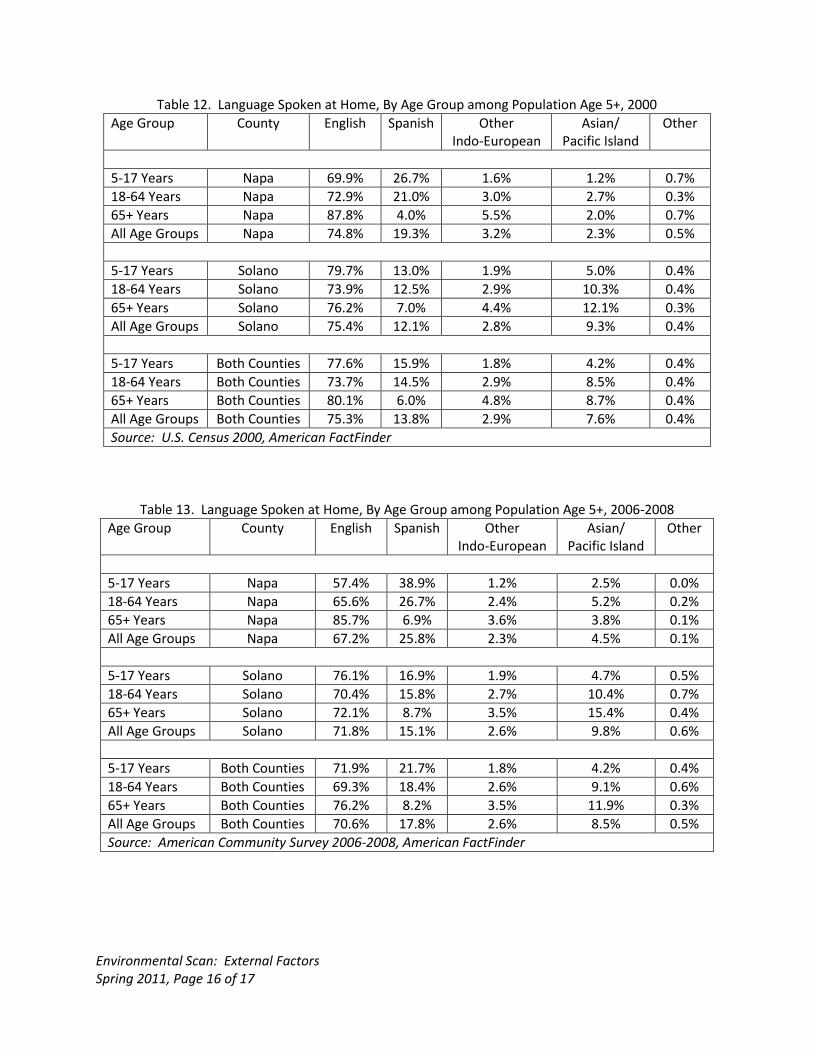
o Increasing racial/ethnic diversity is also reflected in the language distribution among populations
within NVC’s service area. In Napa County, the proportion of the population speaking English at home decreases among lower age groups (from 88% among the population 65 and over, to 73% among the population ages 18 to 64, to 70% among the population ages 5 to 17; U.S. Census 2000). Comparison of 2000 Census data (in Table 12) with the 2006-2008 American Community Survey (ACS) data (in Table 13) shows that this trend is continuing as the population changes. Based on the estimates for the 2006-2008 ACS, 57% of the population ages 5 to 17 identify English as the language they speak at home. In Napa County, the decrease among the population share claimed by English speakers is balanced by an increase among the population share claimed by Spanish speakers. (See Tables 12 and 13.)
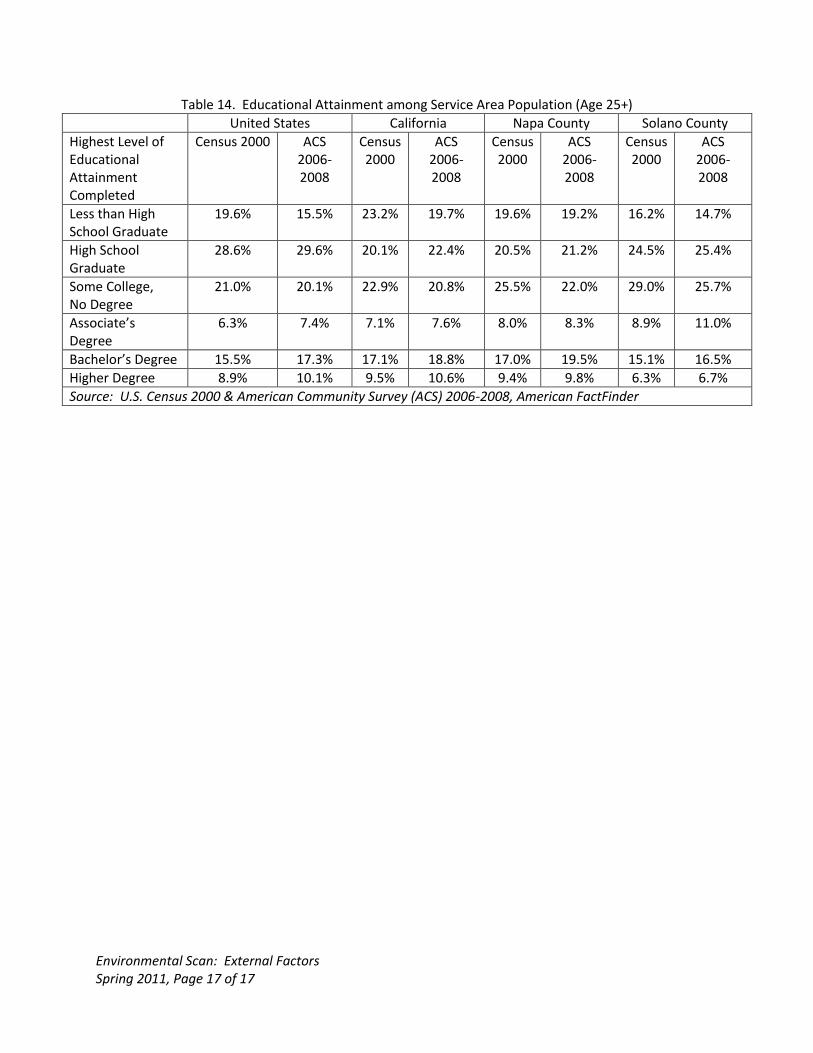
o The level of educational attainment within the NVC service area has also shifted since 2000. The
population shares claimed by people holding at least an Associate’s degree have increased, while the shares among people with lower levels of education have generally decreased. The only category that is an exception to this trend is high school graduates, whose share increased by less than 1%. (See Table 14.)
Environmental Scan: External Factors Spring 2011, Page 15 of 17
o “Although the settings of college campuses have improved for lesbian, gay, bisexual and transgender (LGBT) students, faculty and staff over the years, practically all research studies examining the perceptions and experiences of LGBT campus community members underscore negative experiences from subtle to extreme forms of discrimination” (page 8). Studies (Dolan, 1998; Noack, 2004; Rankin, 2001, 2003, 2009) “underscore LGBT individuals as the least accepted group when compared with other under-served populations and, consequently, more likely to indicate deleterious experiences and less than welcoming campus climates based on sexual identity” (page 9, 2010 State of Higher Education for Lesbian, Gay, Bisexual & Transgender People, Campus Pride 2010 National College Climate Survey, National Study by the Q Research Institute for Higher Education). LGBT data pertaining to NVC’s service area are not available at this time.
Table 10. Population Growth
Geographic Region 2000 Census 2007-2009 ACS Growth
United States 281,421,906 304,320,465 8.1%
California 33,871,648 36,589,387 8.0%
Napa County 124,279 133,397 7.3%
Solano County 394,542 406,507 3.0%
Source: U.S. Census 2000 & American Community Survey (ACS) 2007-2009, American FactFinder
Table 11. Changes in Distribution of Race/Ethnicity among Populations
of Napa & Solano Counties & California, 2000 to 2006-2008
Napa County Solano County California
Racial/Ethnic Group Census 2000
ACS 2006-2008
Census 2000
ACS 2006-2008
Census 2000
ACS 2006-2008
White 69.1% 60.1% 49.2% 43.9% 46.7% 42.6%
Hispanic 23.7% 29.3% 17.6% 22.2% 32.4% 36.1%
Black 1.2% 1.9% 14.6% 14.5% 6.4% 6.0%
American Indian/ Alaska Native
0.5% 0.5% 0.6% 0.5% 0.5% 0.5%
Asian 2.9% 5.9% 12.5% 13.6% 10.8% 12.1%
Native Hawaiian/ Other Pacific Islander
0.2% 0.4% 0.7% 0.8% 0.3% 0.3%
Some Other Race 0.2% 0.4% 0.2% 0.6% 0.2% 0.3%
Two or More Races 2.1% 1.5% 4.5% 3.9% 2.7% 2.1%
Source: U.S. Census 2000 & American Community Survey (ACS) 2006-2008, Reported by Association of Bay Area Governments (ABAG)
Environmental Scan: External Factors Spring 2011, Page 16 of 17
Table 12. Language Spoken at Home, By Age Group among Population Age 5+, 2000
Age Group County English Spanish Other Indo-European
Asian/ Pacific Island
Other
5-17 Years Napa 69.9% 26.7% 1.6% 1.2% 0.7%
18-64 Years Napa 72.9% 21.0% 3.0% 2.7% 0.3%
65+ Years Napa 87.8% 4.0% 5.5% 2.0% 0.7%
All Age Groups Napa 74.8% 19.3% 3.2% 2.3% 0.5%
5-17 Years Solano 79.7% 13.0% 1.9% 5.0% 0.4%
18-64 Years Solano 73.9% 12.5% 2.9% 10.3% 0.4%
65+ Years Solano 76.2% 7.0% 4.4% 12.1% 0.3%
All Age Groups Solano 75.4% 12.1% 2.8% 9.3% 0.4%
5-17 Years Both Counties 77.6% 15.9% 1.8% 4.2% 0.4%
18-64 Years Both Counties 73.7% 14.5% 2.9% 8.5% 0.4%
65+ Years Both Counties 80.1% 6.0% 4.8% 8.7% 0.4%
All Age Groups Both Counties 75.3% 13.8% 2.9% 7.6% 0.4%
Source: U.S. Census 2000, American FactFinder
Table 13. Language Spoken at Home, By Age Group among Population Age 5+, 2006-2008
Age Group County English Spanish Other Indo-European
Asian/ Pacific Island
Other
5-17 Years Napa 57.4% 38.9% 1.2% 2.5% 0.0%
18-64 Years Napa 65.6% 26.7% 2.4% 5.2% 0.2%
65+ Years Napa 85.7% 6.9% 3.6% 3.8% 0.1%
All Age Groups Napa 67.2% 25.8% 2.3% 4.5% 0.1%
5-17 Years Solano 76.1% 16.9% 1.9% 4.7% 0.5%
18-64 Years Solano 70.4% 15.8% 2.7% 10.4% 0.7%
65+ Years Solano 72.1% 8.7% 3.5% 15.4% 0.4%
All Age Groups Solano 71.8% 15.1% 2.6% 9.8% 0.6%
5-17 Years Both Counties 71.9% 21.7% 1.8% 4.2% 0.4%
18-64 Years Both Counties 69.3% 18.4% 2.6% 9.1% 0.6%
65+ Years Both Counties 76.2% 8.2% 3.5% 11.9% 0.3%
All Age Groups Both Counties 70.6% 17.8% 2.6% 8.5% 0.5%
Source: American Community Survey 2006-2008, American FactFinder
Environmental Scan: External Factors Spring 2011, Page 17 of 17
Table 14. Educational Attainment among Service Area Population (Age 25+)
United States California Napa County Solano County
Highest Level of Educational Attainment Completed
Census 2000 ACS 2006-2008
Census 2000
ACS 2006-2008
Census 2000
ACS 2006-2008
Census 2000
ACS 2006-2008
Less than High School Graduate
19.6% 15.5% 23.2% 19.7% 19.6% 19.2% 16.2% 14.7%
High School Graduate
28.6% 29.6% 20.1% 22.4% 20.5% 21.2% 24.5% 25.4%
Some College, No Degree
21.0% 20.1% 22.9% 20.8% 25.5% 22.0% 29.0% 25.7%
Associate’s Degree
6.3% 7.4% 7.1% 7.6% 8.0% 8.3% 8.9% 11.0%
Bachelor’s Degree 15.5% 17.3% 17.1% 18.8% 17.0% 19.5% 15.1% 16.5%
Higher Degree 8.9% 10.1% 9.5% 10.6% 9.4% 9.8% 6.3% 6.7%
Source: U.S. Census 2000 & American Community Survey (ACS) 2006-2008, American FactFinder
Environmental Scan: External Factors Spring 2011, Page 18 of 17
Accelerating Rate of Change “. . . We live in a time of rapid change in every part of our lives. This phenomenon is evident everywhere: rapid advances in technology, medicine and science; quickly changing governmental regulations and requirements; increasingly volatile economic cycles. . . . Change is occurring faster than ever before. “Nowhere is this more evident than in the rapid rise of the ‘mobile’ society. Use of the Internet, smart phones, text messaging, video on demand, social networking, e-books and a host of other technological applications and devices have produced a generation that is unwired but completely connected. This ‘mobile’ society is accustomed to getting answers and services immediately on a 24/7 basis and to accommodating services and programming to their schedules. “. . . Change is so pervasive and so accelerated that the U.S. Department of Labor estimates that today’s learner will have worked in 10 to 14 jobs by the age of 38. Today, 25% of workers have been in their jobs for less than one year; and a full 50% have been in their jobs for less than five years. “Businesses and institutions which are not nimble enough to manage this high rate of change risk catastrophic failure” (Key Issues for Planning, Los Rios Community College District Office of Institutional Research, August 2010, page 5).