Embed Size (px)
Citation preview
United StatesEnvironmental ProtectionAgency
Office of Research and EPA!600/R-92/226Development January 1993
. Washington, DC 20460 .
aEPA Life Cycle DesignGuidance Manual
EnvironmentalRequirements andThe Product System
Refl'OOuct'd by:National TechDcial Infonnalion Serviceus. Depattmelt ofCornrnerceSpringfield, VA 22161
PB93-164507

TECHNICAL REPORT DATA(Plt:au rt:ad IflStrut:tions on tht: rt:I't:ru bt:fort: com"lt:tin'
1. REPORT NO.12
•, 3. R PB9 3-16IJ50 1
EPA/600/R-92/226---,--
4. TITL.E AND SUBTITL.E 5. REPORT DATE
Life Cycle Design Guidance Manual: Environmental January 1993Requirements and the Product System 6. PERFORMING ORGANIZATION COOE
7. AUTHORIS) 8. PERFORMING ORGANIZATION REPORT NO.
'Gregory A. Keoleian and Dan Menerey
9. PERFORMING ORGANIZATION NAME ANO ADDRESS 10, PROGRAM EL.EMENT NO.
National Pollution Prevention Center CBRD1AUniversity of Michigan 11. CONTRACT/GRANT NO.
Ann Arbor, MI 48109-1115 CR817570
12. SPONSORING AGENCY NAME AND ADDRESS 13. TYPE OF REPORT AND PERIOD COVERED
Risk Reduction Engineering Laboratory Final reoort14. SPONSORING AGENCY CODE
Office of Research and DevelopmentU.S. Environmental Protection Agency EPA/600/14r;nr;nn;:,ti nhi,., l1l;?I=.A
1S. SUPPL.EMENTARY NOTES
Project Officer: Mary Ann Curran, 513-569-783716. ABSTRACT
This document seeks to promote the reduction of environmental impacts and healthrisks through a systems approach to design. The approach is based on the product lifecycle, which includes raw materials acquisition and processing, manufacturing,use/service, resource recovery, and disposal. A life cycle design framework wasdeveloped to provide gUidance for more effectively conserving resources and energy,preventing pollution, and reducing the aggregate environmental impacts and healthrisks associated with a product system. This framework addresses the product,process, distribution, and management/information components of each product system.
Concepts such as concurrent design, cross-disciplinary teams,. multi-objectivedecision making, and total cost assessment are essential elements of the framework.
Life cycle design emphasizes integrating environmental requirements into theearliest phases of design and successfully balancing these requirements with all othernecessary performance, cost, cultural, and 1egal criteria. A multi-layer requirementsmatrix is proposed to assist the design team in identifying design requirements and~esolving the conflicts between them. Design strategies for meeting environmentalrequirements are then provided. Finally, environmental analysis tools and life cycleaccounting methods are presented for evaluating design alternatives.
17. KEY WOR'DS AND DOCUMENT ANALYSIS ..
~. DESCRIPTORS b.IDENTIFIERS/OPEN ENDED TERMS C. COSATI field(Group
Design Design for theProduct environment -processSystemLife Cycle
18. DISTRIBUTION STATEMENT 19. SECURITY CL.ASS (Tllis Rt:po,rJ 21. NO. OF PAGES
Unclasc;ified 190Release to Public 20. SECURITY CL.ASS (This pagt:J 22. PRICE
UnclassifiedEPA FOf'" 2220-1 (R.... 4-77) P"EVIOUS EOITION IS OBSOLETE

EPA600/R-92/226January 1993
LIFE CYCLE DESIGNGUIDANCE MANUAL
Environmental Requirements and The Product System
Gregory A. KeoleianDan Menerey
National Pollution Prevention CenterUniversity of Michigan
Ann Arbor, MI 48109-1115
Cooperative Agreement #817570
Project Officer
Mary Ann CurranPollution Prevention Research BranchRisk Reduction Engineering LaboratoryCincinnati, Ohio 45268
RISK REDUCTION ENGINEERING LABORATORYOFFICE OF RESEARCH AND DEVELOPMENTUS ENVIRONMENTAL PROTECTION AGENCYCINCINNATI,OH 45268
@ Printed on Recycled Paper
PROTECTED UNDER INTERNATIONAL COPYRIGHTALL RIGHTS RESERVED.NATIONAL TECHNICAL INFORMATION SERVICEU.S. DEPARTMENT OF COMMERCe
NOTICE
The information in this document was funded wholly by the United States EnvironmentalProtection Agency (EPA) under Cooperative Agreement #817570 to the University of Michigan. Ithas been subjected to the Agency's peer and administrative review and has been approved for publication as an EPA document. This approval does not necessarily signify that the contents reflect theviews and policies of the US EPA. Mention of trade names or commercial products does not constitute endorsement or recommendation for use.
ii
PREFACE
This guidance manual was developed as part of the US Environmental Protection Agency'sPollution Prevention Research Program. Through such research the EPA seeks to facilitate thedevelopment of technologies and products that result in reduced aggregate generation of pollutantsacross all media. The Life Cycle Design project was initiated to reduce environmental impacts andhealth risks through product and process design and development.
For the last two decades the life cycle framework has been used principally for environmentalanalysis of products. Resource use and the generation of residuals or wastes have been quantified byperforming inventory analyses of product life cycle systems. The basic methodology for inventoryanalysis is documented in Product Life-Cycle Assessment: Inventory Guidelines and Principles~PN600/R-92r;.'fSwhich was published by the Risk Reduction Engineering Laboratory of theEPA. Life cycle design is the application of the life cycle framework to product system design. Theproduct system includes product, process, distribution, and management/information components.
This project has been organized into two phases: Phase I - preparation of the first edition of thismanual and Phase II - life cycle design demonstration projects. In Phase I, an investigation of thedesign literature and interviews with design professionals contributed to the development of goals,principles and a framework for life cycle design.
Life cycle design is a proactive approach for integrating pollution prevention and resourceconservation strategies into the development of more ecologically and economically sustainableproduct systems. Cross media pollutant transfer and the shifting of other impacts can be avoided byaddressing the entire life cycle, which includes raw materials acquisition, materials processing,manufacturing and assembly, use and service, retirement, disposal and the ultimate fate ofresiduals.
The goal of life cycle design is to minimize aggregate risks and impacts over this life cycle. Thisgoal can only be attained through the balancing of environmental, performance, cost, cultural, legal,and technical requirements of the product system. Concepts such as concurrent design, total qualitymanagement, cross-disciplinary teams, and multi-attribute decision making are essential elements oflife cycle design that help meet these goals.
The complexity of product system design is a function of the conflict between various classes ofdesign criteria, self-interests of the life cycle participants, and the time-cycles affecting productsystem development and implementation. Consequently, design activities to reduce aggregateenvironmental impacts and risks must be coordinated using a systems-oriented approach.
The framework for life cycle design was developed to be applicable for all product domains.Individual firms are expected to interpret the manual for their own specific applications. The manualwas written to assist not only design professionals but all other constituents who have an importantrole in life cycle design including corporate executives, product managers, production workers,distributors, environmental health and safety staff, purchasers, accountants, marketers, salespersons,legal staff, consumers, and government regulators. A coordinated effort is required to institutechanges needed for successful implementation of life cycle design.
iii
Both AT&T Bell Labs and Allied Signal are participating in Phase II: Life Cycle Design Demonstration Projects. The purpose of these projects is to demonstrate the efficacy of life cycle design,and encourage its use by other fInns.
The University of Michigan research group also welcomes comments and suggestions from otherreaders. Please direct your comments to Dr. Greg Keoleian at the address given below.
National Pollution Prevention CenterUniversity of MichiganDana Building 430 E. UniversityAnn Arbor, Michigan 48109-1115
Greg Keoleian and Dan MenereyDecember 1992
iv
ABSTRACT
This document seeks to promote the reduction of environmental impacts and health risks througha systems approach to design. The approach is based on the product life cycle, which includes rawmaterials acquisition and processing, manufacturing, use/service, resource recovery, and disposal. Alife cycle design framework was developed to provide guidance for more effectively conservingresources and energy, preventing pollution, and reducing the aggregate environmental impacts andhealth risks associated with a product system. This framework addresses the product, process,distribution, and management/information components of each product system.
Concepts such as concurrent design, cross-disciplinary teams, multi-objective decision making,and total cost assessment are essential elements of the framework.
Life cycle design emphasizes integrating environmental requirements into the earliest phases ofdesign and successfully balancing these requirements with all other necessary performance, cost,cultural, and legal criteria. A multi-layer requirements matrix is proposed to assist the design team inidentifying design requirements and resolving the conflicts between them. Design strategies formeeting environmental requirements are then provided. Finally, environmental analysis tools and lifecycle accounting methods are presented for evaluating design alternatives.
This report was submitted in fulfillment of Cooperative Agreement #817570 by the University ofMichigan under the sponsorship of the US Environmental Protection Agency. Research for thisreport covers the period from January 1991 to December 1991. A draft report was submitted in April1992, and the final report was completed in December 1992.
v
CONTENTS
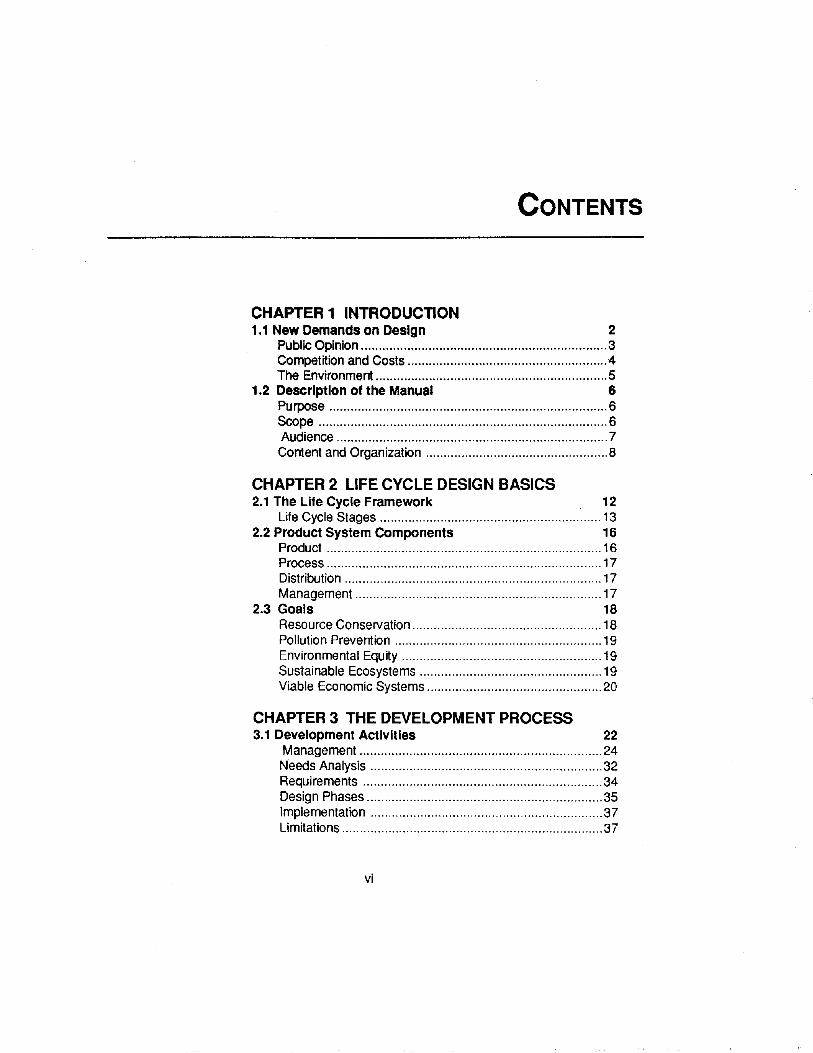
CHAPTER 1 INTRODUCTION1.1 New Demands on Design 2
Public Opinion 3Competition and Costs 4The Environment 5
1.2 Description of the Manual 6Purpose 6SCope 6Audience 7Content and Organization 8
CHAPTER 2 LIFE CYCLE DESIGN BASICS2.1 The Life Cycle Framework 12
Life Cycle Stages 132.2 Product System Components 16
Product 16Process 17Distribution 17Management 17
2.3 Goals 18Resource Conservation 18Pollution Prevention 19Environmental Equity 19Sustainable Ecosystems 19Viable Economic Systems 20
CHAPTER 3 THE DEVELOPMENT PROCESS3.1 Development Activities 22
Management 24Needs Analysis 32Requirements 34Design Phases 35Implementation 37Limitations 37
vi
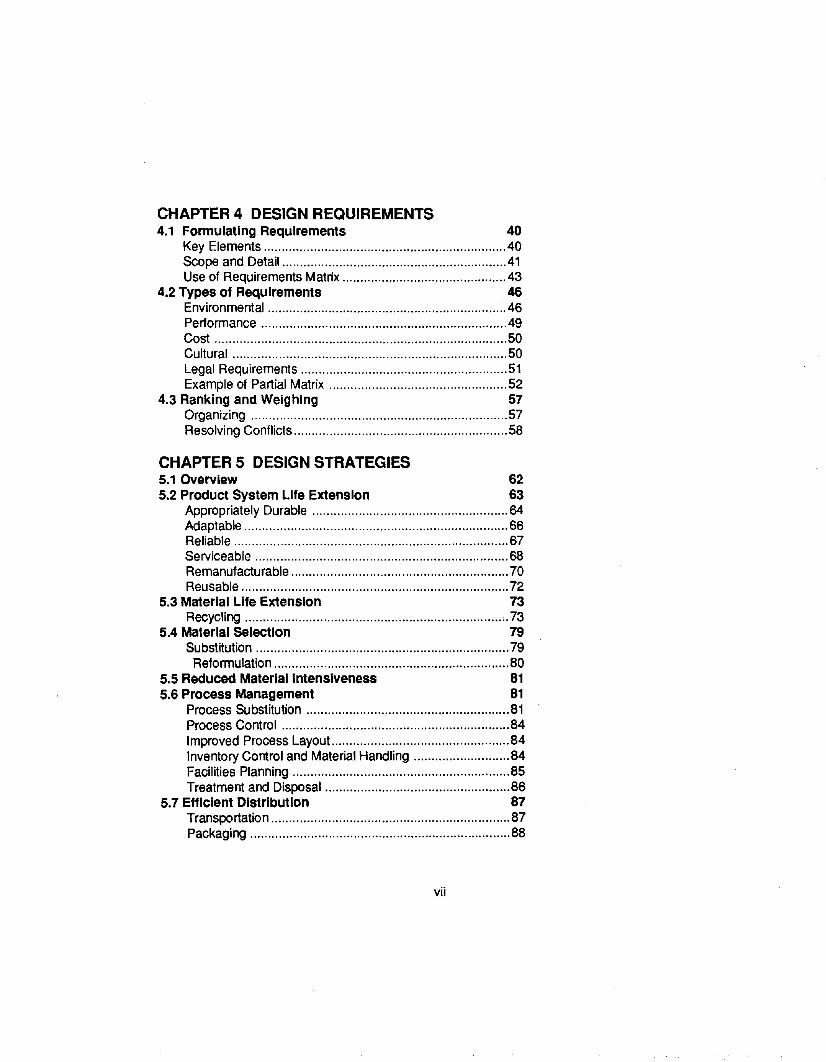
CHAPTER 4 DESIGN REQUIREMENTS4.1 Formulating Requirements 40
Key Elements 40SCope and Detail 41Use of Requirements Matrix 43
4.2 Types of Requirements 46Environmental 46Performance 49Cost 50Cultural 50Legal Requirements 51Example of Partial Matrix 52
4.3 Ranking and Weighing 57Organizing 57Resolving Conflicts 58
CHAPTER 5 DESIGN STRATEGIES5.1 Overview 625.2 Product System Life Extension 63
Appropriately Durable 64Adaptable 66Reliable 67Serviceable 68Remanufacturable 70Reusable 72
5.3 Material Life Extension 73Recycling ;.73
5.4 Material selection 79Substitution 79Reformulation 80
5.5 Reduced Material Intensiveness 815.6 Process Management 81
Process Substitution 81Process Control 84Improved Process Layout 84Inventory Control and Material Handling 84Facilities Planning 85Treatment and Disposal 86
5.7 Efficient Distribution 87Transportation 87Packaging 88
vii
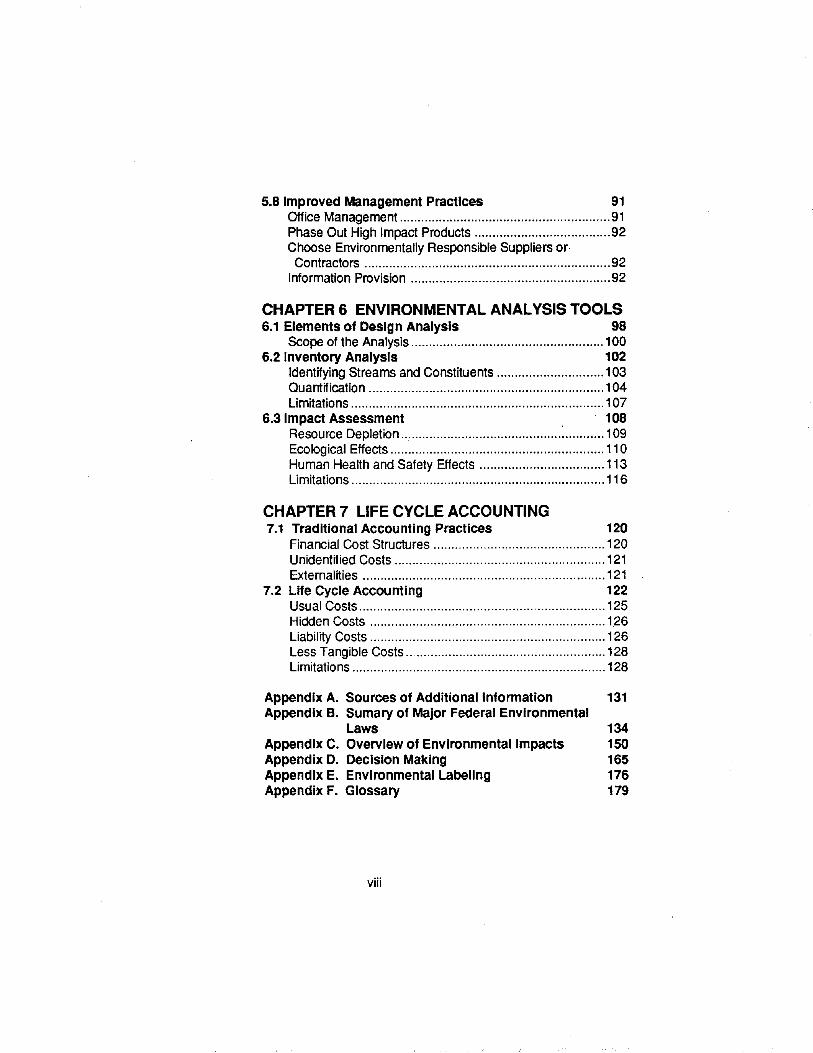
5.8 Improved Management Practices 91Office Management 91Phase Out High Impact Products 92Choose Environmentally Responsible Suppliers or·Contractors 92
Information Provision 92
CHAPTER 6 ENVIRONMENTAL ANALYSIS TOOLS6.1 Elements of Design Analysis 98
Scope of the Analysis 1006.2 Inventory Analysis 102
Identifying Streams and Constituents 103Quantffication 104Limitations 107
6.3 Impact Assessment 108Resource Depletion 109Ecological Effects 110Human Health and Safety Effects 113Limitations 116
CHAPTER 7 LIFE CYCLE ACCOUNTING7.1 Traditional Accounting Practices 120
Financial Cost Structures 120Unidentified Costs 121Externalities 121
7.2 Life Cycle Accounting 122Usual Costs 125Hidden Costs 126Liability Costs 126Less Tangible Costs 128Limitations 128
Appendix A. Sources of Additional Information 131Appendix B. Sumary of Major Federal Environmental
Laws 134Appendix C. Overview of Environmental Impacts 150Appendix D. Decision Making 165Appendix E. Environmental Labeling 176Appendi'x F. Glossary 179
viii
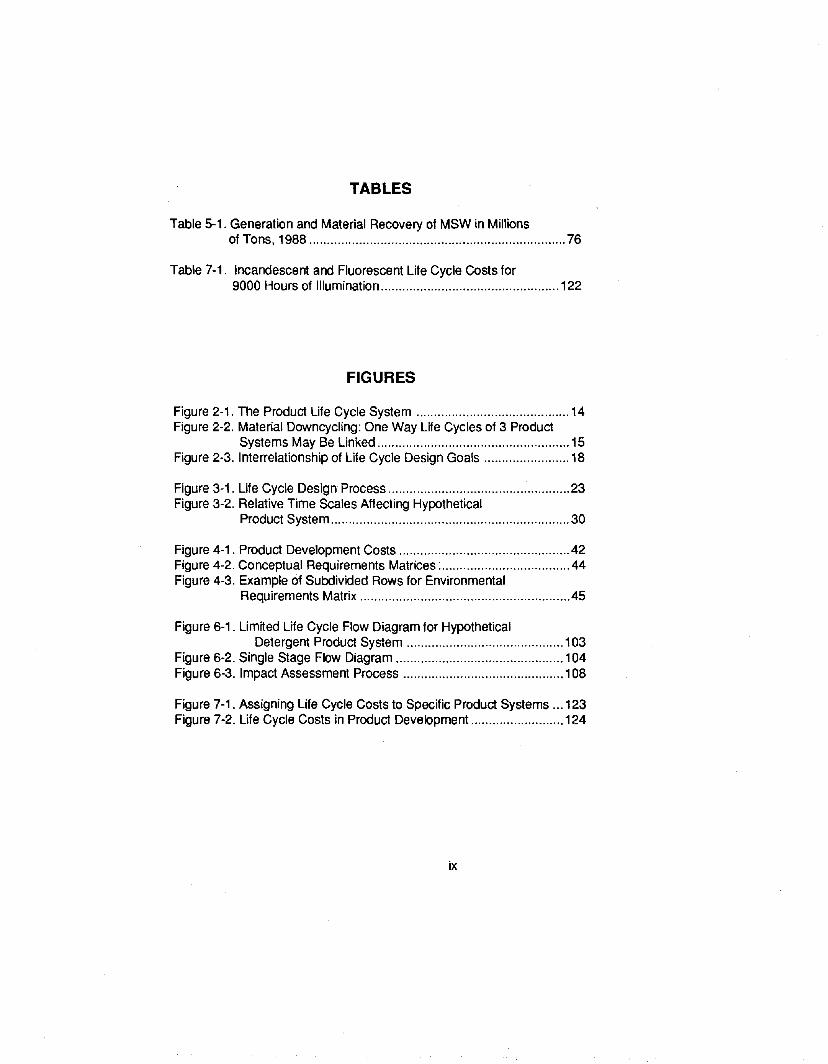
TABLES
Table 5-1. Generation and Material Recovery of MSW in Millionsof Tons, 1988 76
Table 7-1. Incandescent and Fluorescent Life Cycle Costs for9000 Hours of Illumination 122
FIGURES
Figure 2-1. The Product Life Cycle System 14Figure 2-2. Material Downcycling: One Way Life Cycles of 3 Product
Systems May Be Linked 15Figure 2-3. Interrelationship of Life Cycle Design Goals 18
Figure 3-1. Life Cycle Design Process 23Figure 3-2. Relative Time Scales Affecting Hypothetical
Product System 30
Figure 4-1. Product Development Costs 42Figure 4-2. Conceptual Requirements Matrices : .44Figure 4-3. Example of Subdivided Rows for Environmental
Requirements Matrix .45
Figure 6-1. Limited Life Cycle Flow Diagram for HypotheticalDetergent Product System 103
Figure 6-2. Single Stage Flow Diagram 104Figure 6-3. Impact Assessment Process 108
Figure 7-1. Assigning Life Cycle Costs to Specific Product Systems 123Figure 7-2. Life Cycle Costs in Product Development 124
ix
ACKNOWLEDGMENTS
A review of design methodologies and a series of interviews with the following design professionals helped identify current approaches to environmental impact reduction and major barriers toadoption of life cycle design. We also thank Dr. Jonathan W. Bulkley and Doug Moody of theNational Pollution Prevention Center at the University of Michigan and Teresa Harten, Lisa Brown,and Jordan Spooner from the EPA RREL for reviewing the manual. Views contained in this document may not necessarily reflect those of the individuals interviewed or the reviewers.
BradAgryHenry Dreyfuss Associates
Robert BrunnerApple Computer
R. Lee ByersALCOA
Joel B. CharmAllied Signal Inc.
Frank CassidyDigital Equipment Corp.
Lewis T. DixonFord Motor Company
Terry DuncanDuncan Industrial Design
Greg EyringUS Congress, Office ofTechnology Assessment
Harry FatkinPolaroid Corporation
Bob FerroneDigital Equipment Corp.
Dennis FoleyHerman Miller
Werner GlantschnigAT&T Bell Labs
Andy GlickmanChevron Corporation
Charles JonesHaworth Inc.
Greg JonesGeneral Electric Company
Linda Keefe3M Company
Howard KleeAmoco Corporation
Rudolph KroloppMotorola Inc.
John Paul KuszSafety-Kleen Corp.
Eric LarsonDupont
Joseph A. LindslyThe Dow Chemical Company
Don McCloskeyBlack and Decker
Tom NewhouseThomas I. Newhouse Design
Kathleen NicholsonGeneral Motors
Rick NollerFitch RichardsonSmith
Charles OverbyOhio University
Bruce PatonHewlett Packard Co.
x
Marilyn PerchardFord Motor Company
Earl N. PowellDesign Management Inst.
Dennis B. RedingtonMonsanto Company
Barry RopeRope & Associates
T. Michael RothgebProcter & Gamble
V. Wayne RoushShell Oil Company
Allen SamuelsThe University of Michigan
George SimonsSteelcase, Inc.
Budd SteinhilberIndustrial Designers Society ofAmerica
Ted TuescherSmith & Hawken
I.C. van WeenenUniversity of Amsterdam
William W. WaltonUS Consumer Product SafetyCommission
John WesnerAT&T Bell Laboratories
I::~;:~§~ft~~~~~~~~~~~;:,W cultural, and legal criteria.
I~i~~~~f¥~:§:i~i~~t~~~:~&Siiif materials through processing, manufacture,~~~:
:.~..:..r..i~.:it:.:: use, and final disposal of all residuals. This.~.., broad framework helps designers identify
and reduce the environmentalconsequences of their designs.
Chapter 1
Environmental criteria areoften not considered untilthe end of a developmentproject. As a result,companies spend toomuch time fixing problemsinstead of preventing them.
Innovative firms areadopting environmentaldesign policies. Butwithout clear definitions,these policies may nottranslate into successfuldesign programs.
INTRODUCTION
1.1 NEW DEMANDS ON DESIGN
Most environmental impacts result from design decisions madelong before manufacture or use. Yet environmental criteria often arenot considered at the beginning of design when it is easiest to avoid adverse impacts. Waiting until the end of a project to think about environmental matters reflects past practice. Until recently, mostenvironmental impacts were reduced through end-of-pipe controls andprocess design rather product design.
By tolerating poor coordination between product and process design, many companies still spend too much time fixing problems ratherthan preventing them. Critical environmental impacts may be all tooeasy to overlook when design proceeds through a series of isolatedgroups.
One experience at 3M shows the pitfalls of this linear design approach. In the mid-seventies, 3M designed an instant fIre extinguisherfor jet airplane cockpits. The product worked very well, but failed to receive a permit from the EPA because it harmed fish and other aquaticlife. In only a week, 3M scientists identifIed the toxic chemicals in theirfirst design and found substitutes that were one fortieth as harmful. Thenew product was just as effective, and actually cost less to produce [1].If environmental experts had participated in design, regulatory actionmight have been avoided. 3M's noted Pollution Prevention Pays program is founded on the lessons learned from this incident.
In the past fifteen years, many finns have begun to focus more onpollution prevention. Some innovative businesses are already responding to new challenges by adopting ambitious environmental design policies. But translating these policies into action is a major challenge.Without proper support, many "green" design programs can founder.Similar problems develop when environmental design projects lack specific objectives, definitions, or measurements. Unless a developmentteam can clearly define what it is trying to accomplish, and has the support of management, they may find it difficult to reduce the environmental impacts of their designs.
2
Not all new design methods take a broad view. In contrast to theambiguity of "green" design, programs such as design for recyclabilityare specific strategies. A restricted design strategy can be beneficial, butit may not be ideal. The net results of product development can be obscured when design teams focus on a single environmental aspect. Forexample, a product that is easy to recycle may reduce solid waste aftercustomer use, but it may not reduce overall impacts. If the ultimate goalis environmental preservation, such projects may be pointless.
There is thus a need for designs that reduce total environmental impacts while also satisfying other criteria. The life cycle framework provides the most complete environmental profile of goods and services.The life cycle consists of each step in the life of a product from acquisition of raw materials through processing, manufacture, use, and final disposal of all residuals. Designers who use this broad framework helpensure that the environmental impacts of their products are discoveredand reduced, not merely shifted to other places.
A life cycle, or "cradle to grave" approach is systematic. Buildingon this systems base, life cycle design also draws on ideas such as concurrent development and cross-disciplinary teams. Each is needed tosuccessfully balance environmental issues with cost, performance, cultural, and legal criteria.
As emphasis shifts from end-of-pipe controls and remedial actions topollution prevention, design will play an increasingly important role inpreserving our environment.
Public Opinion
Is there a demand for low-impact products? Even though peoplemay behave differently from how they describe themselves in a poll, surveys can still be useful. A nationwide Wall StreetJournal/NBC poll conducted in the summer of 1991 found that 80% of Americans describethemselves as environmentalists. Fifty percent of respondents claimed tobe strong environmentalists [2]. Most people polled said they recognizethe need for substantial changes in their habits and are not waiting for future technological fixes.
Manufacturers can help translate such environmental awareness intodemand for lower-impact products by producing and marketing improveddesigns. Designers who embrace environmental quality will be at thecenter of this activity. Future environmental progress depends on designers' ability to improve the environmental performance of products.
Of course, many other people involved in making and marketingproducts playa vital role in achieving environmental quality. For ex-
3
Introduction
The life cycle frameworkrecognizes each step inproduct developmentfrom extraction of rawmaterials through finaldisposal of all residuals.Life cycle design focuseson discovering andreducing environmentalimpacts, not merelyshuffling them betweenvarious media oractivities.
Chapter 1
Environmental quality canbe critical to productsuccess. Reducingenvironmental "defects·may also lower costs.
ample, education will increasingly be needed to overcome the confusionsurrounding environmentally responsible design. Advertising can helpmeet this need. Rather than misrepresenting products as "environmentally friendly" or "green", the benefits of a design improvement can beclearly described, thus enabling customers to make informed choices.
Competition and Costs
A prudent development program recognizes that environmental factors are increasingly considered part of product quality. In the currentcompetitive climate, all companies know that quality products are critical to success. As Taiichi Ohno, former VP of Toyota said, "Whateveran executive thinks the losses of poor quality are, they are actually sixtimes greater" [3]. Ignoring the environmental dimensions of qualitycould be a major disadvantage to companies in competitive markets.
Best-in-class manufacturers already recognize that there is no "optimal" level of quality in terms of cost; the fewer defects the lower thecosts. Business and industry may also discover that reducing environmental "defects" produces similar benefits.
Total cost assessment can help companies determine developmentcosts with more accuracy [4,5]. This type of accounting adds hidden, liability, and less tangible environmental costs to those costs usually identified by standard methods. Such costs are generally not included indevelopment projects, but they can be substantial.
In addition, some conventional environmental costs, such as thosefor pollution abatement and control, are expanding. In 1989, $91.3 billion was spent in the US for this purpose, and the US EPA estimates thatannual expenditures for abatement and control will rise to $200 billionby 1995 [6]. Chapter 7 contains a more detailed discussion of life cycleaccounting methods useful in product design.
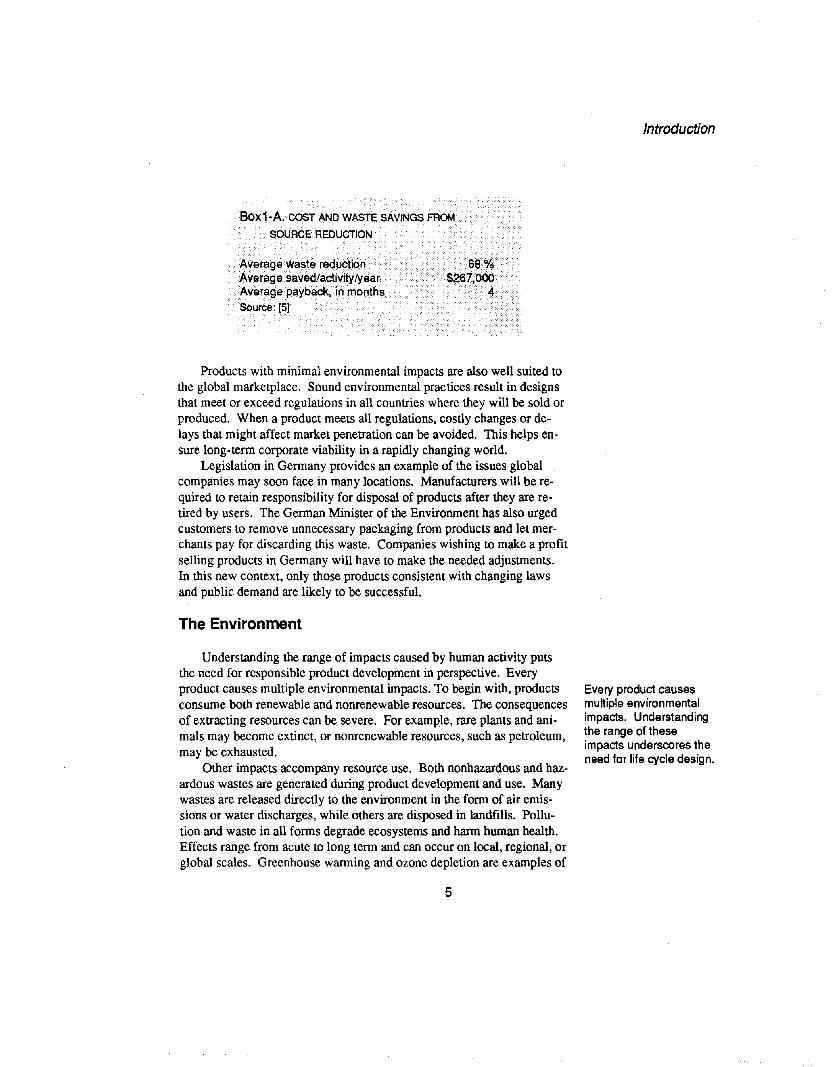
Fortunately, many strategies for preventing damage before it occursare cost effective. INFORM, INC. documented the results from 139source reduction activities at 22 chemical plants [7]. Box I-A showswhat 15 activities at 4 large chemical plants accomplished. Source reductions outlined in the full study include changes in processes, operations, equipment, and products, as well as chemical substitutions.
4
Products with minimal environmental impacts are also well suited tothe global marketplace. Sound environmental practices result in designsthat meet or exceed regulations in all countries where they will be sold orproduced. When a product meets all regulations, costly changes or delays that might affect market penetration can be avoided. This helps ensure long-term corporate viability in a rapidly changing world.
Legislation in Germany provides an example of the issues globalcompanies may soon face in many locations. Manufacturers will be required to retain responsibility for disposal of products after they are retired by users. The German Minister of the Environment has also urgedcustomers to remove unnecessary packaging from products and let merchants pay for discarding this waste. Companies wishing to make a profitselling products in Germany will have to make the needed adjustments.In this new context, only those products consistent with changing lawsand public demand are likely to be successful.
The Environment
Understanding the range of impacts caused by human activity putsthe need for responsible product development in perspective. Everyproduct causes multiple environmental impacts. To begin with, productsconsume both renewable and nonrenewable resources. The consequencesof extracting resources can be severe. For example, rare plants and animals may become extinct, or nonrenewable resources, such as petroleum,may be exhausted.
Other impacts accompany resource use. Both nonhazardous and hazardous wastes are generated during product development and use. Manywastes are released directly to the environment in the form of air emissions or water discharges, while others are disposed in landfills. Pollution and waste in all forms degrade ecosystems and harm human health.Effects range from acute to long term and can occur on local, regional, orglobal scales. Greenhouse warming and ozone depletion are examples of
5
Introduction
Every product causesmultiple environmentalimpacts. Understandingthe range of theseimpacts underscores theneed for life cycle design.
Chapter 1
long-tenn effects with severe global consequences. Environmental issues that designers should understand are discussed further in AppendixC.
Environmental objectives for design that reflect current and futureenvironmental problems help promote sustainable resource management and also ensure environmental quality for future generations.
1.2 DESCRIPTION OF THE MANUAL
Purpose
The main purposes of this manual are to:
• Reduce total environmental impacts and health risks caused byproduct development
• Encourage the inclusion of environmental requirements at theearliest stage of design rather than focusing on end-of-pipe solutions
• Integrate environmental, perfonnance, cost, cultural, and legal requirements in effective designs
Scope
This manual focuses on environmental requirements for productdesign. In life cycle design, products are defined as systems that include the following components:
• the product• processing steps by which products are made, used, and retired• distribution networks (packaging and transportation)• management
The design framework discussed in the manual can be applied to:
• improvements, or minor modifications of existing products orprocesses;
• new features associated with developing the next generation ofan existing product or process; and
• innovations characteristic of new product and process design.
The life cycle framework addresses upstream and downstream consequences of all activities related to a product system, not just those im-
6
pacts resulting from production and use. When design considers eachstage of the life cycle from raw material extraction to final disposal andfate of residuals, full product impacts can be understood and reduced.
No single design method or set of rules applies to all types of products. For that reason, this manual provides general guidelines and toolsrather than prescriptions. Design professionals should use the manual todevelop specific tools best suited to their projects.
Environmental design is complex; there are rarely easy solutions.Ideally, designers could use a database or a simple procedure to selectenvironmentally preferred materials. Unfortunately, no such database exists, and there is no simple procedure for evaluating materials.
Architecture and similar areas of design are not specifically addressed in this manual, although the life cycle approach for reducing environmental impacts and risks applies to many disciplines.
Audience
All partners in product development have an important role to play inachieving impact reduction. The manual is primarily intended for the following decision makers:
• product designers• industrial designers• process design engineers• packaging designers• product development managers• managers and staff in accounting, marketing, distribution, strategy,
environmental, health and safety, legal, purchasing, and service
The manual assumes some familiarity with design, but it may also beread by individuals with no prior knowledge of design. A glossary of important terms is provided in Appendix F.
7
Introduction
When design considers allstages of the life cyclefrom raw materialextraction to final disposaland fate of residuals, thefull consequences ofproducts development canbe understood and actedon.
This manual providesgeneral guidelines ratherthan prescriptions.Design professionalsshould use the manual todevelop tools best suitedto their specific projects.

Chapter 1
Content and Organization
Chapter 1. Introduction
Chapter 2. Life Cycle Design BasicsThree basic elements of life cycle design are introduced. First, the
life cycle system is outlined. Then the product system used for designis defined. Finally, the goals of life cycle design are presented.
Chapter 3. The Development ProcessDiscussion begins by introducing concurrent design and total qual
ity programs as a management function of life cycle design. Management also plays a vital role in project success by setting policies,strategies, and measures of success that are compatible with life cyclegoals. Design projects typically begin with a needs analysis. Requirements, the key element in design, are next set to translate needs intoproducts. Design then proceeds through several interactive phases thatintegrate environmental criteria with traditional cost, performance, cultural, and legal criteria.
Chapter 4. Environmental RequirementsThe most important stage of design is developing requirements.
Construction and use of a multi-layer matrix is recommended for formulating environmental requirements. Other classes of requirementsare briefly discussed as part of integrated design.
Chapter 5. Design StrategiesAfter the design team develops requirements, they choose strate
gies to satisfy those requirements. General life cycle design strategiesdiscussed in this chapter include product life extension, material life extension, material selection, reduced resource use, process management,efficient distribution, and improved management practices.
Chapter 6. Environmental Analysis ToolsThis chapter describes a method for evaluating environmental crite
ria in life cycle design. Key elements of inventory analysis and impactassessment are presented and discussed.
8
Chapter 7. Life Cycle AccountingLife cycle environmental accounting is contrasted with traditional ac
counting practices. Aspects of life cycle accounting are introduced andsuggestions made for assessing the comprehensive costs and benefits ofdevelopment projects.
Appendix A. Sources of Additional Information
Appendix B. Summary of Major Federal Environmental Laws
Appendix C. Overview of Environmental Impacts
Appendix D. Decision MakingTwo major decision-making methods for establishing requirements
and evaluating design alternatives are briefly introduced.
Appendix E. Environmental LabelingSeveral third-party programs are outlined.
AppendiX F. Glossary
9
Introduction
Chapter 1
References
1. Wilson, Edward O. 1984. Biophilia. Cambridge. MA: Harvard UniversityPress.
2. Gutfeld, Rose. 2 August 1991. Shades of Green. The Wall Street Journal,Midwest Edilion. A. 1.
3. Taguchi. Genichi. and Don Clausing. 1990. Robust Quality. HarvardBusiness Review January-February: 65-75.
4. US EPA. 1989. Pollution Prevention Benefits Manual (Draft). US Environmental Protection Agencv. Office of Policy. Planning. and Evaluation &Office of Solid Waste. Washington. DC.
5. White. Allen L., Monica Becker. and James Goldstein. 1992. Total CostAssessment: Accelerating Industrial Pollution Prevention ThroughInnovative Project Financial Analysis, US Environmental ProtectionAgency, Office of Pollution Prevention and Toxics, Washington, DC.
6. Rutledge, Gary L., and Mary L. Leonard. 1991. Pollution Abatement andControl Expenditures. Survey ofCurrent Business 71 (11): 46-50.
7. Dorfman, Mark H., Warren R. Muir, and Catherine G. Miller. 1992.Environmental Dividends: Cutting More Chemical Waste. New York:Inform, Inc.
10
Chapter 2
Fugitive and untreated residuals
Airborne, waterborne. and solid residuals
Material. energy; and labor inputs for Process and Management
Transfer of materials between stages for Produd, includestransportation and packaging (Distribution)
lifeCycleD~signl3asics
Chapfer2
LIFE CYCLE DESIGN BASICS
Life cycle design is rootedin systems analysis.
Life cycle design couplesthe product developmentcycle used in businesswith the physical life cycle.
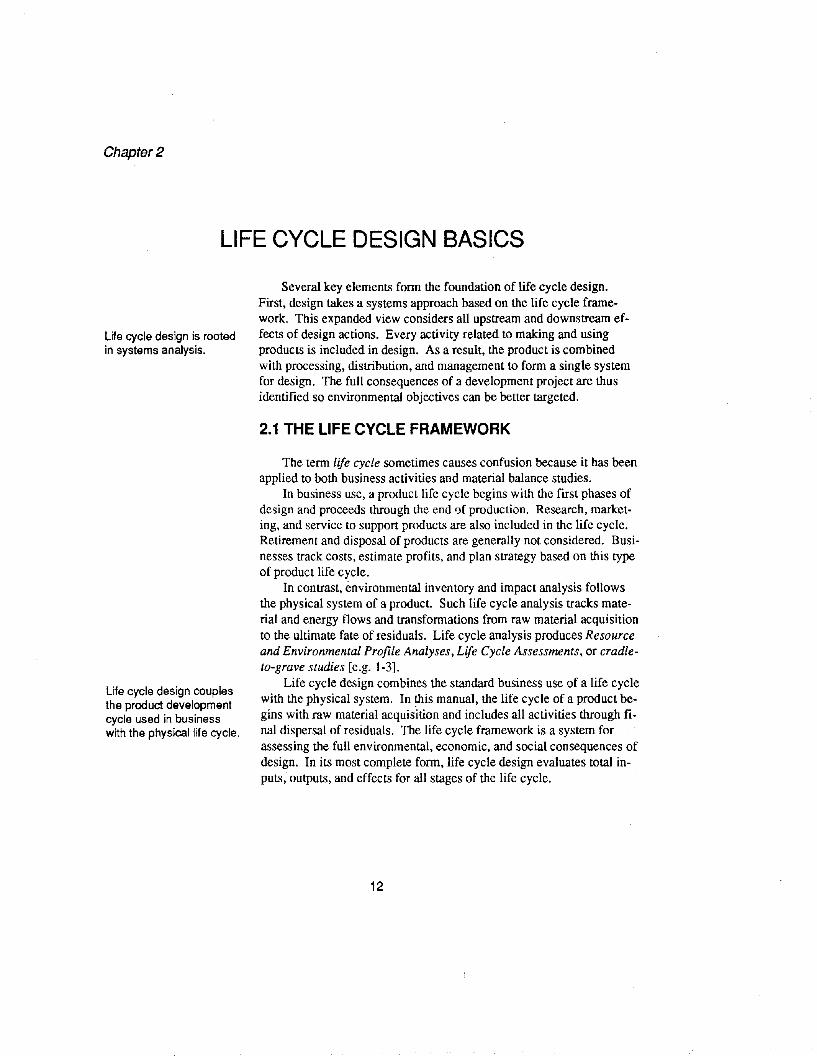
Several key elements form the foundation of life cycle design.First, design takes a systems approach based on the life cycle framework. This expanded view considers all upstream and downstream effects of design actions. Every activity related to making and usingproducts is included in design. As a result, the product is combinedwith processing, distribution, and management to form a single systemfor design. The full consequences of a development project are thusidentified so environmental objectives can be better targeted.
2.1 THE LIFE CYCLE FRAMEWORK
The term life cycle sometimes causes confusion because it has beenapplied to both business activities and material balance studies.
In business use, a product life cycle begins with the first phases ofdesign and proceeds through the end of production. Research, marketing, and service to support products are also included in the life cycle.Retirement and disposal of products are generally not considered. Businesses track costs, estimate profits, and plan strategy based on this typeof product life cycle.
In contrast, environmental inventory and impact analysis followsthe physical system of a product. Such life cycle analysis tracks material and energy flows and transformations from raw material acquisitionto the ultimate fate of residuals. Life cycle analysis produces Resourceand Environmental Profile Analyses, Life Cycle Assessments, or cradleto-grave studies [e.g. 1-3].
Life cycle design combines the standard business use of a life cyclewith the physical system. In this manual, the life cycle of a product begins with raw material acquisition and includes all activities through final dispersal of residuals. The life cycle framework is a system forassessing the full environmental, economic, and social consequences ofdesign. In its most complete form, life cycle design evaluates total inputs; outputs, and effects for all stages of the life cycle.
12
Life Cycle Framework and Principles
Life Cycle Stages
The product life cycle can be organized into the following stages:
• raw material acquisition• bulk material processing• engineered and specialty materials production• manufacturing and assembly• use and service• retirement• disposal
These stages represent one scheme for classifying activities over aproduct life cycle. All stages may not apply to every product system.
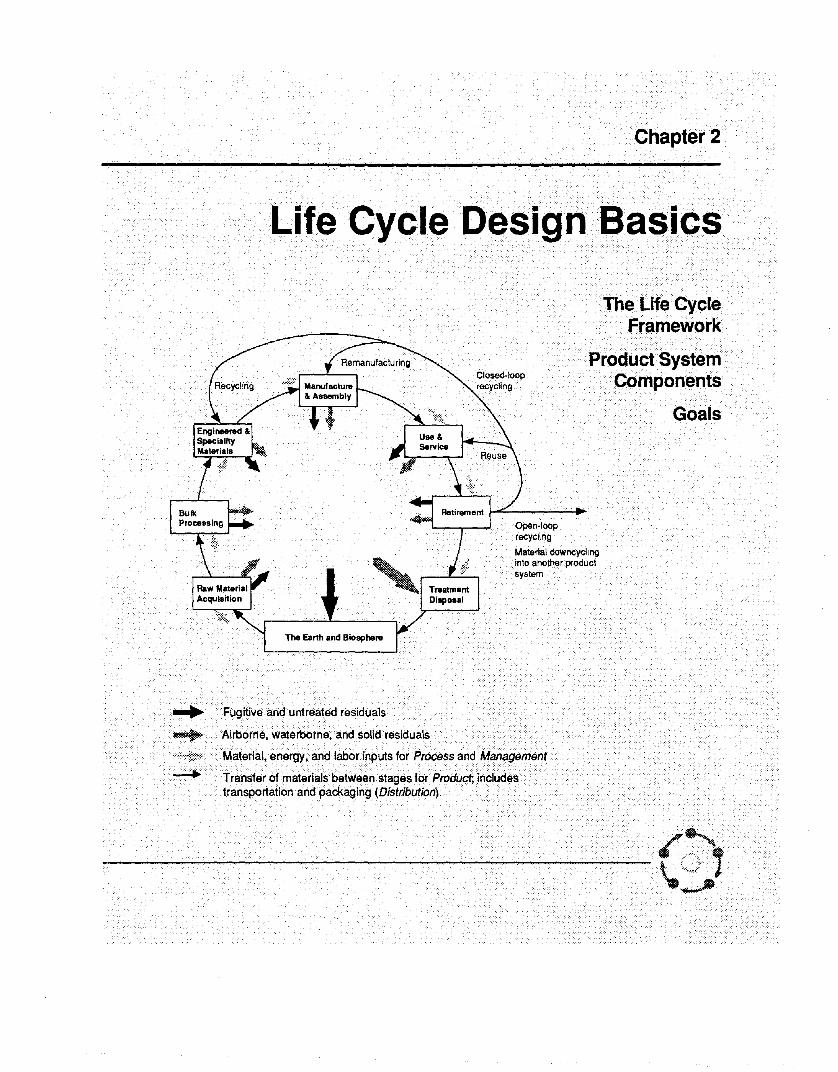
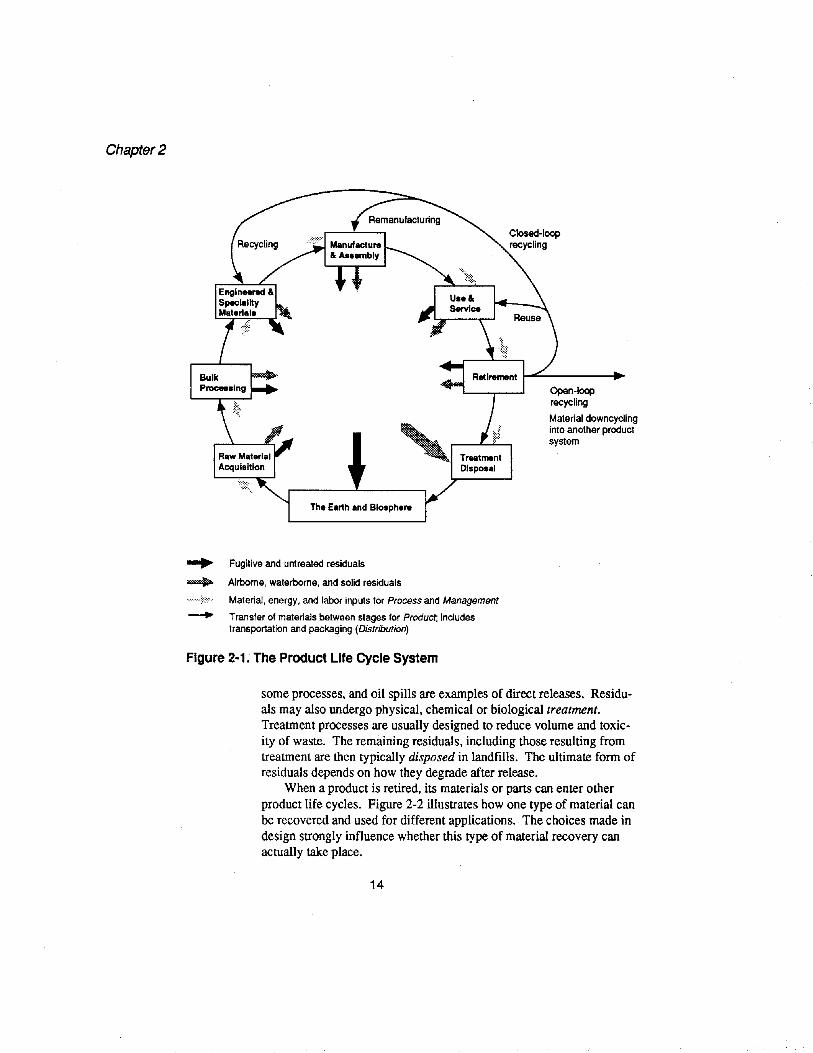
Figure 2-1 is a general flow diagram of the product life cycle. Asthis figure shows, a product life cycle is circular. Designing and usingproducts consumes resources and converts them into residuals that accumulate in the earth and biosphere.
Most products require a wide range of direct and indirect materials.Direct materials are used to make the product; indirect materials in thelife cycle framework are incorporated in facilities and equipment. Either type of material may come from primary (virgin) or secondary (recycled) sources.
Raw materials acquisition includes mining nonrenewable materialand harvesting biomass. These bulk materials are processed into basematerials by separation and purification steps. Examples include flourmilling and converting bauxite to aluminum. Some base materials arecombined through physical and chemical means into engineered andspecialty materials. Examples include polymerization of ethylene intopolyethylene pellets and the production of high-strength steel. Base andengineered materials are then manufactured through various fabricationsteps, and parts are assembled into the final product.
Products sold to customers are consumed or used for one or morefunctions. Throughout their use, products and processing equipmentmay be serviced to repair defects or maintain performance. Users eventually decide to retire a product. After retirement, a product can be reused or remanufactured. Material and energy can also be recoveredthrough recycling, composting, incineration, or pyrolysis. Materialscan be recycled into the same product many times (closed loop) or usedto form other products before eventual discard (open loop).
Some residuals generated in all stages are released directly into theenvironment. Emissions from automobiles, waste water discharges from
13
Product systems consumeresources and convertsthem into residuals thataccumulate in the earthand biosphere.
Chapter 2
The Earth and Biosphere
Open-looprecycling
Material downcyclinginto another producfsystem
... Fugitive and untreated residuals
......... Airborne, waterborne, and solid residuals
:::':'.' Material, energy, and labor inputs for Process and Management
-+ Transfer of materials between stages for Product; includestransportation and packaging (Distribution)
Figure 2-1. The Product Life Cycle System
some processes, and oil spills are examples of direct releases. Residuals may also undergo physical, chemical or biologicallrealmenl.Treatment processes are usually designed to reduce volume and toxicity of waste. The remmning residuals, including those resulting fromtreatment are then typically disposed in landfills. The ultimate form ofresiduals depends on how they degrade after release.
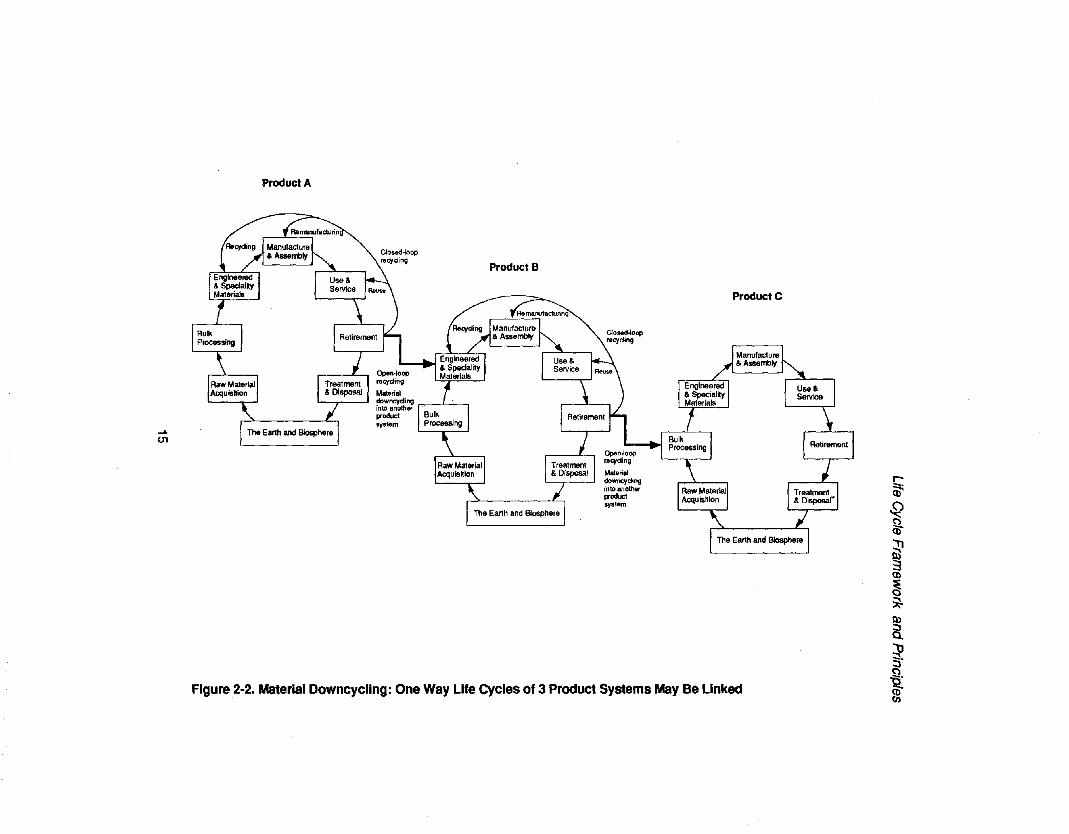
When a product is retired, its materials or parts can enter otherproduct life cycles. Figure 2-2 illustrates how one type of material canbe recovered and used for different applications. The choices made indesign strongly influence whether this type of material recovery canactually take place.
14
~
01
Product A
Figure 2·2. Material Downcycllng: One Way Life Cycles of 3 Product Systems May Be Linked
r-~
~()
CD~
~(l)
~~
lUa~s·()
"§:(l)tI)
Chapter 2
Life cycle design relies onan expanded definition ofa product. All activitiesneeded to make, use, andretire products areconsidered a single unit.Design then addressesthis entire product system.
The product componentconsists of all materials inthe final product.
2.2 PRODUCT SYSTEM COMPONENTS
Life cycle design also relies on an expanded definition of a product.All activities needed to make, use, and retire products are considered asingle unit. Design then addresses the entire product system, not justisolated components. This is the most logical way to reduce total environmental impacts. A short description of each component in the product system follows.
Product
The product component consists of all materials in the final product.Every form of these inputs in each life cycle stage is included. For example, the product component for a simple wooden spoon consists ofthe tree, stumpage, and unused branches from raw material acquisition;lumber and waste wood from milling; the spoon, wood chips, and sawdust from manufacturing; and the discarded spoon in a municipal solidwaste landfill. If this waste is incinerated, gases, water vapor, and ashare produced.
The product component of a complex product such as an automobile consists of a wide range of materials. These may be a mix of primary (virgin) and secondary (recycled) materials. The materials in newor used replacement parts are also included in the product component.Some materials, such as plastics, contain energy that could be recoveredby combustion. This energy is embodied in the material.
The remaining three components of the product system share common categories of subcomponents:
• Facility or plant• Unit operations or process steps• Equipment and tools• Labor• Direct and indirect material inputs• Energy
Labor is not just manual work. It also includes all physical and mentaltasks that earn wages.
16
Life Cycle Framework and Principles
Process
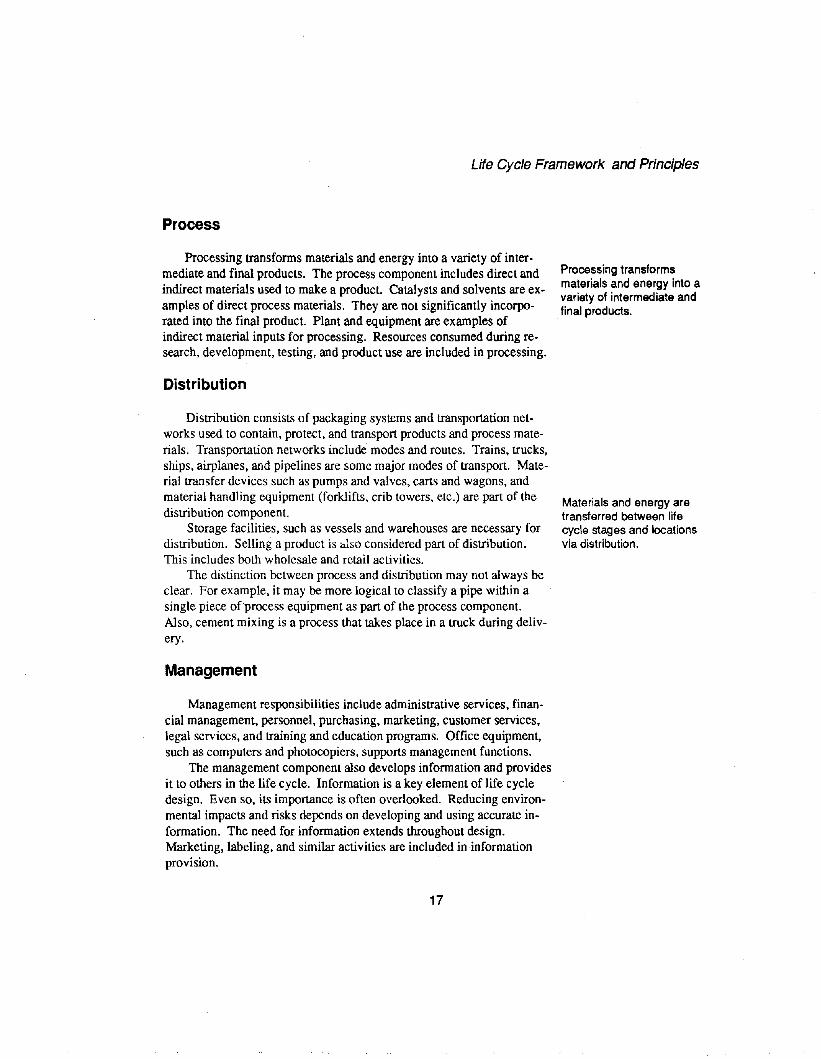
Processing transforms materials and energy into a variety of intermediate and final products. The process component includes direct andindirect materials used to make a product. Catalysts and solvents are examples of direct process materials. They are not significantly incorporated into the final product. Plant and equipment are examples ofindirect material inputs for processing. Resources consumed during research, development, testing, and product use are included in processing.
Distribution
Distribution consists of packaging systems and transportation networks used to contain, protect, and transport products and process materials. Transportation networks include modes and routes. Trains, trucks,ships, airplanes, and pipelines are some major modes of transport. Material transfer devices such as pumps and valves, carts and wagons, andmaterial handling equipment (forklifts, crib towers, etc.) are part of thedistribution component.
Storage facilities, such as vessels and warehouses are necessary fordistribution. Selling a product is &lso considered part of distribution.This includes both wholesale and retail activities.
The distinction between process and distribution may not always beclear. For example, it may be more logical to classify a pipe within asingle piece ofprocess equipment as part of the process component.Also, cement mixing is a process that takes place in a truck during delivery.
Management
Management responsibilities include administrative services, financial management, personnel, purchasing, marketing, customer services,legal services, and training and education programs. Office equipment,such as computers and photocopiers, supports management functions.
The management component also develops infonnation and providesit to others in the life cycle. Information is a key element of life cycledesign. Even so, its importance is often overlooked. Reducing environmental impacts and risks depends on developing and using accurate information. The need for infonnation extends throughout design.Marketing, labeling, and similar activities are included in informationprovision.
17
Processing transformsmaterials and energy into avariety of intermediate andfinal products.
Materials and energy aretransferred between lifecycle stages and locationsvia distribution.

Chapter 2
PollutionPrevention
ResourceConservation
SustainableEcosystems
EnvironmentalEquity
Viable EconomicSystems
Life cycle design seeks toreduce the totalenvironmental burdensassociated with productsystems.
Figure 2-3. Interrelationship of Life Cycle Design Goals
2.3 GOALS
The primary environmental objective of life cycle design is to reduce the total impacts and health risks caused by product developmentand use. This objective can only be achieved in concert with other lifecycle design goals. Life cycle design seeks to:
• Conserve resources• Prevent pollution• Support environmental equity• Preserve diverse, sustainable ecosystems• Maintain long-term, viable economic systems
Figure 2-3 demonstrates how the goals of life cycle design arelinked.
Resource Conservation
There could be no product development or economic activity of anykind without available resources. Except for solar energy, the supply ofresources is finite. Efficient designs conserve resources. In this way,impacts caused by material extraction and related activities throughoutthe life cycle are also reduced.
18
Life Cycle Framework and Principles
Pollution Prevention
Pollution is any by-product or unwanted residual produced by human activity. In contrast to managing pollution after it has been produced, pollution prevention focuses on reducing or preventing pollutionat the source. This is the most direct means of reducing the complex impacts caused by pollution. Pollution prevention is a multi-media meansof reducing impacts. It preserves the quality of air, land, and water simultaneously. Pollution prevention can often be cost effective becauseit minimizes raw material losses, the need for expensive end-of-pipe solutions, and long-term liability. Designing pollution out of product systems also reduces the possibility that impacts will be shifted betweenmedia or life cycle stages.
Environmental Equity
Enormous inequities in the distribution of resources continue to exist between developed and less-developed countries. Inequities also occur within national boundaries. A significant fraction of the world hasonly limited access to the basics needed for survival. This sometimeshappens even when resources are locally abundant.
Pollution and other impacts from production are also unevenly distributed [4]. Studies show that low-income communities in the US areoften exposed to higher health risks from industrial activities than arehigher-income communities [5]. Inconsistent regulations in the US leadto different definitions of acceptable risk levels for workers and consumers [6].
In addition, acceptable levels of environmental impacts and healthrisks vary greatly in different countries. Short-sighted corporations addto inequities when they locate manufacturing operations in less-developed countries to take advantage of inadequate environmental regulations.
Inequities may also develop over time. Wasting resources or heedlessly creating pollution can burden future generations with the impactsof past consumption. Inequities can easily be created between generations when resources and functioning ecosystems are only assignedpresent value.
Sustainable Ecosystems
Resource conservation, pollution prevention, and equitable distribution of risks help preserve diverse, sustainable ecosystems. In general,
19
Pollution is mosteffectively prevented inthe earliest stages ofdesign.
Chapter 2
sustainability measures the ability of a system to maintain itself overtime. Sustainable ecosystems are the planet's life support system. It is amistake to believe that basic human needs can be met without relying onhealthy, functioning ecosystems. Sufficient food, potable water, cleanair, and adequate shelter and clothing are all derived from the biosphere.
Viable Economic Systems
A heavily polluted, resource poor, ecologically degraded world inwhich human health is severely compromised cannot be considered sustainable in any sense. Products should therefore be designed to balancehuman resources, natural resources, and capital in order to achieve pollution prevention, resource conservation, and ecosystem sustainability.Limited-growth economies and stable or declining populations may wellbe a necessary condition for economically sustainable systems [7].From a long-term perspective, increasing the value added to products isfar wiser than promoting increased production and consumption. Material goods and other traditional aspects of wealth may be a poor substitute for the physical and emotional well being of individuals withinsociety.
References
1. Sellers, V. R., and J. D. Sellers. 1989. Comparative Energy and Environmental Impacts for Soft Drink Delivery Systems, Franklin Associates,Prairie Village, KS.
2. Arthur D. Little. 1990. Disposable versus Reusable Diapers: Health, Environmental and Economic Comparisons, Arthur D. Little, Inc., Cambridge,MA.
3. Meke1, O. C. L.. and G. Huppes. 1990. Environmental Effects ofDifferentPackage Systemsfor Fresh Milk, Center for Environmental Studies, University of Leiden. Leiden, The Netherlands.
4. US EPA. 1992. Environmental Equity: Reducing Riskfor All COflU7lunities, Volume 1: Workgroup Report to Administrator, US EnvironmentalProtection Agency, Washington, DC EPA230-R-92-008.
5. US EPA. 1992. Environmental Equity: Reducing Riskfor All COflUnunities, Volume 2: Supporting Document, US Environmental ProtectionAgency, Washington, DC, EPA230-R-92-008A.
6. Rodricks, Joseph V.• and Michael R. Taylor. 1989. Comparison of RiskManagement in US Regulatory Agencies. Journal ofHazardous Materials21: 239-253.
7. Meadows, Donella H. 1992. Beyond Limits: Confronting Global Collapse,Envisioning a Sustainable Future. Mills, VT: Chelsea Green.
20
LIFE CYCLE FRAMEWORKAND GOALS(Chapter 2)
MANAGEMENT(Chapter 3)
• Concurrent design • Team coordination• Life cycle quality • Policy and strategy• Measures of success
TECHNICAL DEVELOPMENTS
Development Activities

ChapterS
THE DEVELOPMENT PROCESS
Life cycle design is aframework, not a set ofrules. Designers areinvited to adapt the ideasand guidelines containedhere to their own styles
Unless life cycle goals areembraced by developmentteams, true life cycledesign is impossible.
Design actions translate life cycle goals into high-quality,low-impact product systems. A seemingly infinite number of design methodshave been proposed [1, 2]. Supporters of formal methods assume thatfollowing a detailed process results in better design, but no one seemsto have actually tested this belief [2]. In practice, each designerchooses comfortable tools and combines various design procedures asthey see fit.
Recognizing that no single method has universal appeal, thismanual offers guidelines rather than prescriptions. Life cycle design isa framework, not a set of rules that everyone must follow in preciselythe same way. Development teams interested in reducing the environmental impacts of their designs are invited to adapt the ideas and guidelines contained here to their own styles.
3.1 DEVELOPMENT ACTIVITIES
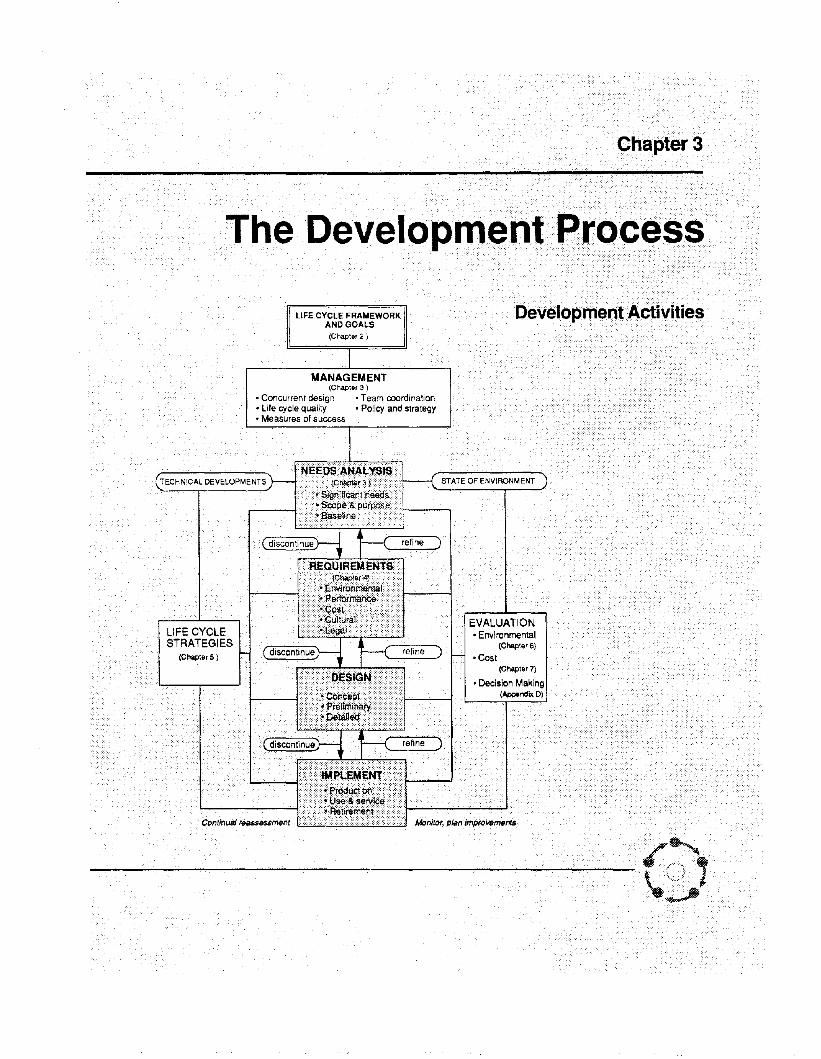
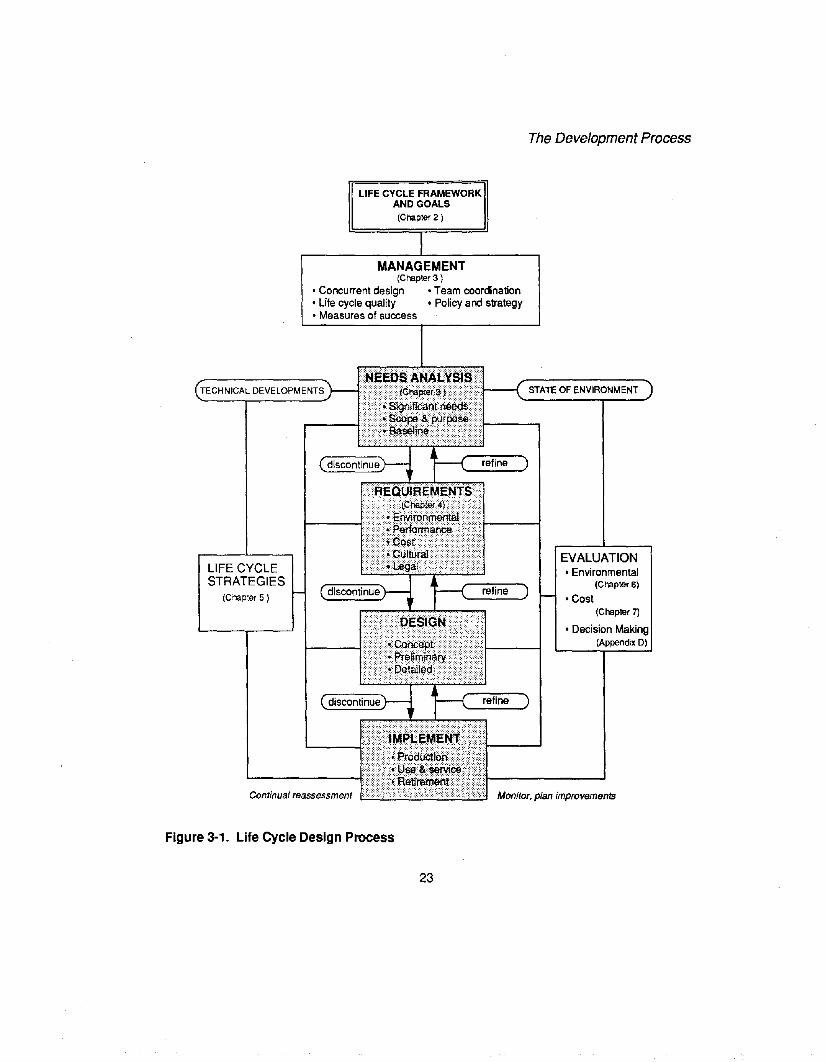
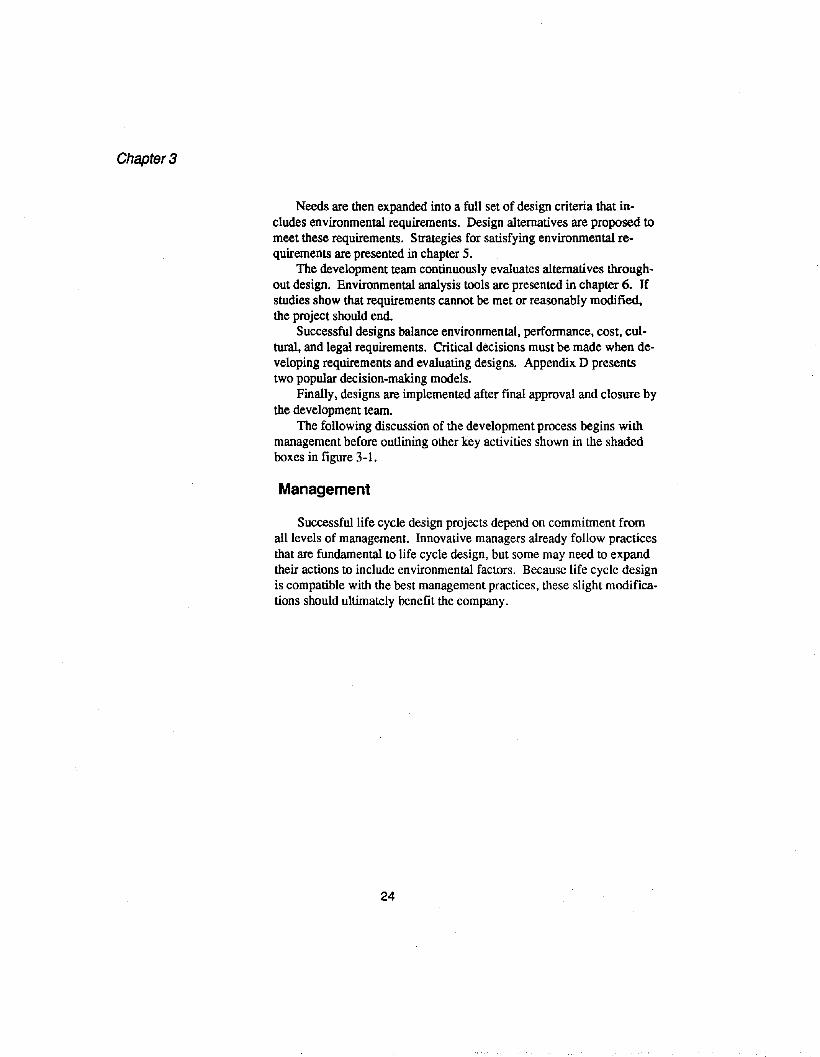
As Figure 3-1 shows, product development is complex. Many elements in the diagram feed back to others. This emphasizes the continual search for improvement.
Life cycle goals are located at the top to indicate their fundamentalimportance. Unless these goals are embraced by the entire development team, true life cycle design is impossible.
Manar:ement exerts a major influence on all phases of development. Both concurrent design and total quality management providemodels for life cycle design. In addition, appropriate corporate policy,strategic planning, and measures of success are needed to support design projects.
Research and development discovers new approaches for reducingenvironmental impacts. The state of the environment provides a context for design. In life cycle design, current and future environmentalneeds are translated into appropriate designs.
A typical design project begins with a needs analysis, then proceeds through formulating requirements, conceptual design, preliminarydesign, detailed design, and implementation. During the needs analysis, the purpose and scope of the project are defined, and customers areclearly identified.
22
The Development Process
LIFE CYCLE FRAMEWORKAND GOALS(Chapter 2)
MANAGEMENT(Chapter 3 )
• Concurrent design • Team coordination• Life cycle quality • Policy and strategy• Measures of success
TECHNICAL DEVELOPMENTS
LIFE CYCLESTRATEGIES
(Chapter 5)
Continual reassessment
Figure 3-1. Life Cycle Design Process
23
STATE OF ENVIRONMENT
EVALUATION• Environmental
(Chapter6)
• Cost(Chapter 7)
• Decision Making(Appendix OJ
Monitor, plan improvements
Chapter 3
Needs are then expanded into a full set of design criteria that includes environmental requirements. Design alternatives are proposed tomeet these requirements. Strategies for satisfying environmental requirements are presented in chapter 5.
The development team continuously evaluates alternatives throughout design. Environmental analysis tools are presented in chapter 6. Ifstudies show that requirements cannot be met or reasonably modified,the project should end.
Successful designs balance environmental, performance, cost, cultural, and legal requirements. Critical decisions must be made when developing requirements and evaluating designs. Appendix D presentstwo popular decision-making models.
Finally, designs are implemented after final approval and closure bythe development team.
The following discussion of the development process begins withmanagement before outlining other key activities shown in the shadedboxes in figure 3-1.
Management
Successful life cycle design projects depend on commitment fromall levels of management. Innovative managers already follow practicesthat are fundamental to life cycle design, but some may need to expandtheir actions to include environmental factors. Because life cycle designis compatible with the best management practices, these slight modifications should ultimately benefit the company.
24
The Development Process
Concurrent DesignLife cycle design is a logical extension of concurrent manufactur
ing, a procedure based on simultaneous design of product features andmanufacturing processes. In contrast to projects that isolate designgroups from each other, concurrent design brings participants togetherin a single team [3]. By having all actors in the life cycle participate ina project from the outset, problems that develop between different disciplines can be reduced. Product quality can be improved through suchcooperation. Efficient teamwork can also reduce development time andlower costs.
Assembling a multi-discipline group at the beginning of a projectmakes it easy to gather information from many sources as early and often as necessary during design. Life cycle design does not require thatall team members keep in daily contact. The participation of individualmembers will vary substantially during the course of a project. Someindividuals may only offer advice or assist with reviews. Even so, insights offered by these team members can be vital to project success.
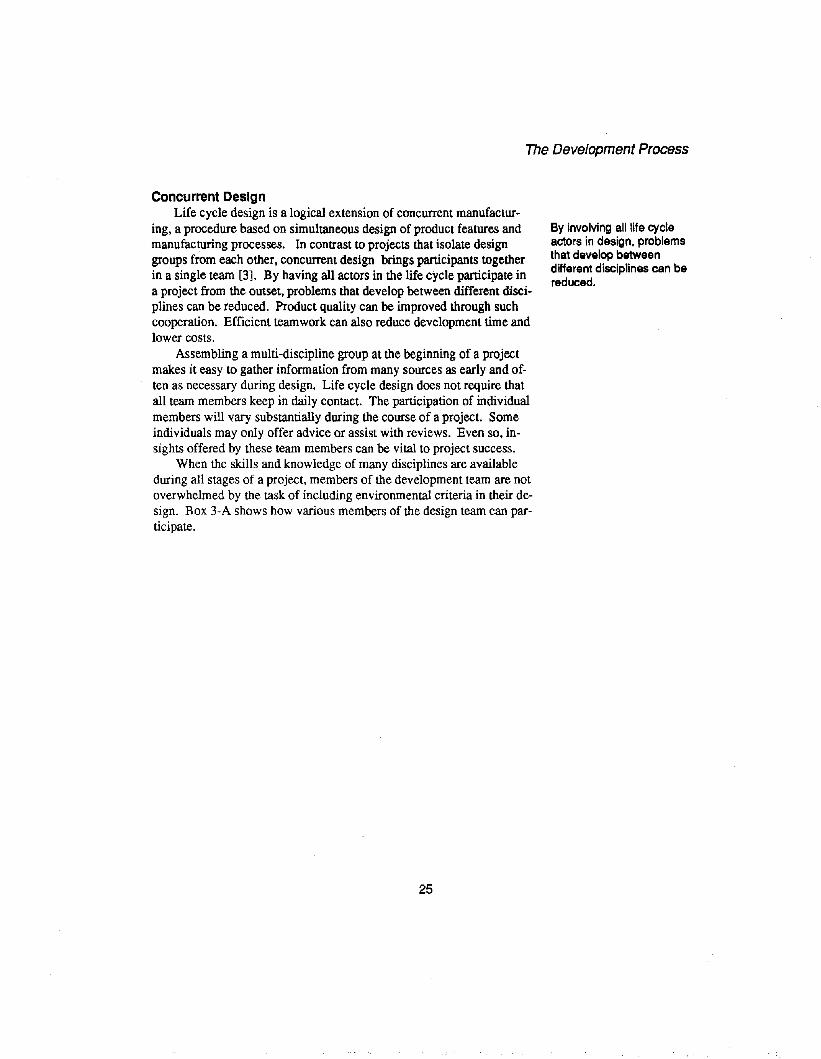
When the skills and knowledge of many disciplines are availableduring all stages of a project, members of the development team are notoverwhelmed by the task of including environmental criteria in their design. Box 3-A shows how various members of the design team can participate.
25
By involving all life cycleactors in design, problemsthat develop betweendifferent disciplines can bereduced.
Chapter 3
Box 3-A. ROLE OF PARTICIPANTS IN UFE CYCLE DESIGN
LIFE CYCLE PARTICIPANTS
Accounting
Advertising
Community
DistributionlPackaging
Environmental, Health andSafety staff
Government regulators,Standards organizations
Industrial designers
Legal
Management
Like TOM, life cycle designfocuses on long-term goals
DUTIEs/RESPONSIBIlITIES
Assign environmental costs to products accurately; calculatehidden, liability, and less tangible costs
Inform customers about environmental attributes of product
Understand potential impacts and benefits; define and approveacceptable plans and operations
Design distribution systems that limit packaging and transportationwhile ensuring protection and containment
Ensure occupational, consumer, and community health and safety;provide environmental information for other participants
Develop policy, regulations, and standards that support life cycledesign goals
Create a design concept that meets environmental criteria whilealso satisfying all other important functions
Interpret statutes and promote pollution prevention to minimize costof regulation and possible future liability
Establish corporate environmental policy and translate intooperational programs; establish measures for success; developcorporate environmental strategy
Life Cycle QualityLife cycle design considers environmental aspects to be closely
linked with quality. Companies who look beyond quick profits to focuson customers, multidisciplinary teamwork, and cooperation with suppliers provide a model for life cycle design. The life cycle framework expands these horizons to include societal and environmental needs. Itmay thus either build on total quality management, or be incorporated ina TQM program.
Because the evolution of total quality management has interestingparallels to environmental design, a brief history may be instructive.Prior to World War II, most industries assured quality through vigorousinspection. Such efforts reduced the number of defective products soldto customers. However, by waiting to find defects until after manufac-
26
The Development Process
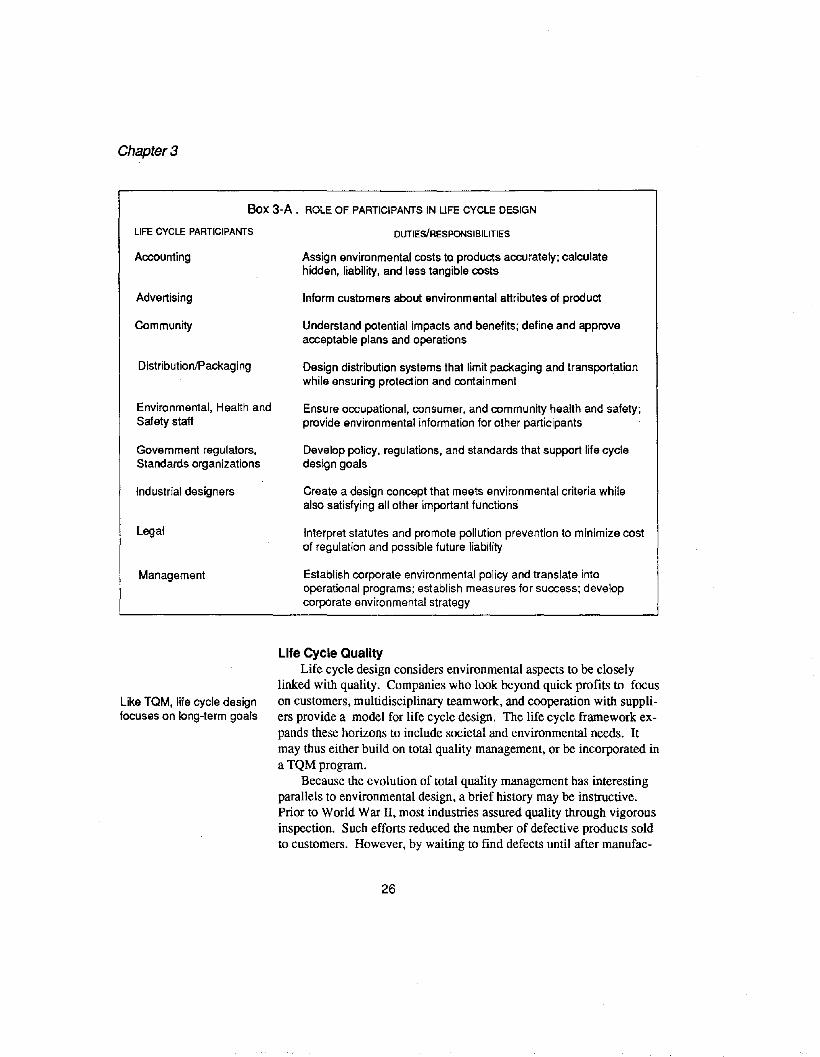
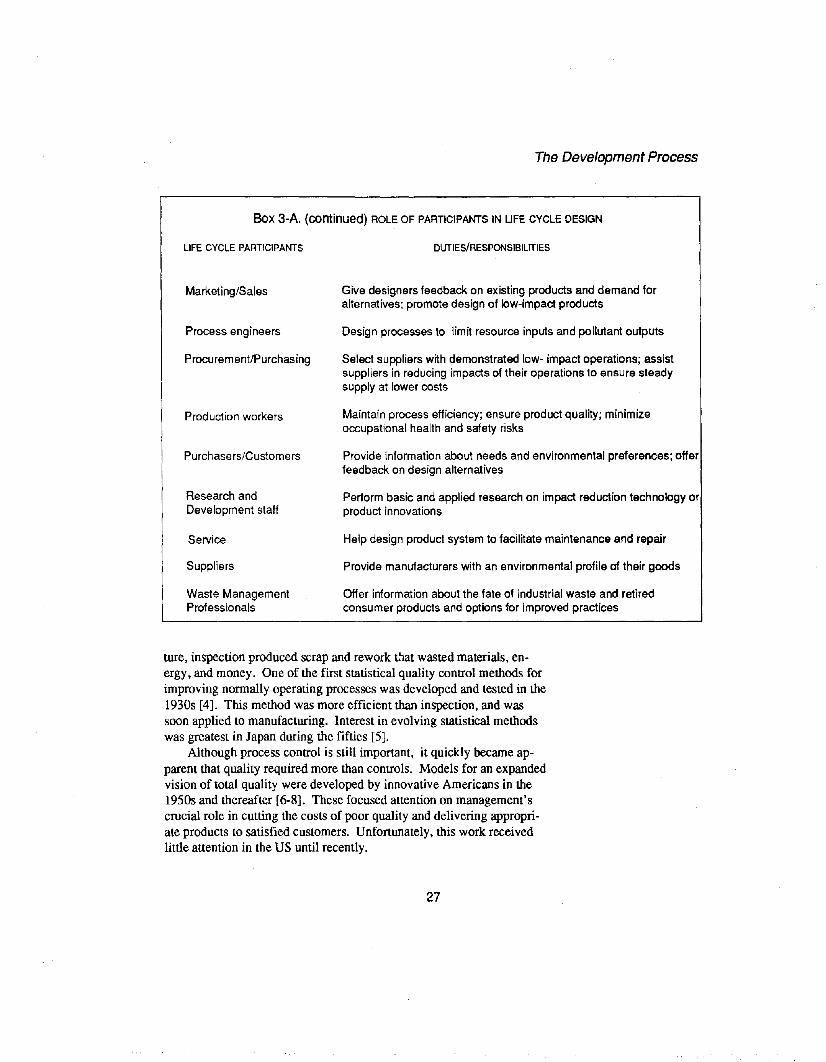
Box 3-A. (continued) ROLE OF PARTICIPANTS IN UFE CYCLE DESIGN
LIFE CYCLE PARTICIPANTS
Marketing/Sales
Process engineers
Procurement/Purchasing
Production workers
Purchasers/Customers
Research andDevelopment staff
Service
Suppliers
Waste ManagementProfessionals
DUTIES/RESPONSIBILITIES
Give designers feedback on existing products and demand foralternatives; promote design of low-impact products
Design processes to limit resource inputs and pollutant outputs
Select suppliers with demonstrated low- impact operations; assistsuppliers in reducing impacts of their operations to ensure steadysupply at lower costs
Maintain process efficiency; ensure product quality; minimizeoccupational health and safety risks
Provide information about needs and environmental preferences; offerfeedback on design alternatives
Perform basic and applied research on impact reduction technology orproduct innovations
Help design product system to facilitate maintenance and repair
Provide manufacturers with an environmental profile of their goods
Offer information about the fate of industrial waste and retiredconsumer products and options for improved practices
ture, inspection produced scrap and rework t.':lat wasted materials, energy, and money. One of the first statistical quality control methods forimproving nonnally operating processes was developed and tested in the1930s [4]. This method was more efficient than inspection, and wassoon applied to manufacturing. Interest in evolving statistical methodswas greatest in Japan during the fifties [5].
Although process control is still important, it quickly became apparent that quality required more than controls. Models for an expandedvision of total quality were developed by innovative Americans in the1950s and thereafter [6-8]. These focused attention on management'scrucial role in cutting the costs of poor quality and delivering appropriate products to satisfied customers. Unfortunately. this work receivedlittle attention in the US until recently.
27
Chapter 3
Designing waste out ofproducts conservesresources and reducescosts and liabilities.
In life cycle design. theenvironment is also seenas a customer.Continuous improvementand satisfaction of allcustomers are keyprinciples of life cycledesign.
A successful designproject draws on the skillsof all team members whilebalancing their diverseinterests.
Methods for creating quality products have been refined over time.Japanese experts added an emphasis on teamwork and continual assessment and improvement. Quality function deployment, which makes thecustomer the prime driver in product development, also contributed tothe total quality movement [9, 10]. TQM increasingly focuses on ensuring quality and value at the earliest stages of design [11,12].
Efforts to protect the environment followed a similar evolution.End-of-pipe controls and clean-up strategies echo the early testing andinspection programs for quality assurance. Statistical quality controlsare much like waste minimization; both concentrate on improved processing rather than product changes. The advent of TQM with its ex·panded interest in other aspects of the business suggests the broad scopeof pollution prevention. Through emphasis on designing quality intoproducts, the latest versions of TQM prepare the way for life cycle design.
In life cycle design, the environment is also seen as a customer.Pollution and other impacts are quality defects that must be reduced. Because the environment supports all life, pursuing harmful actions forshort-term gain threatens a firm's existence. Ultimate success dependson preserving environmental quality while satisfying traditional customers and employees. For this reason, environmental requirements are integrated into life cycle design at the very beginning of a project.
Team Building and CoordinationTeam building may seem beyond the reach of small companies at
first. However, genuine teamwork provides dividends for firms of allsizes. Teams do not have to be large, and organization need not be complex or formal. Unless a company is fortunate enough to have a singleindividual who extracts and refines materials; designs, makes, and assembles all parts and products; and then manages to perform marketingand distribution duties, design requires working with many others. Thiscooperation takes place both within and outside every company, regardless of size. Skillfully managing the diverse talents involved in a designproject is the first step toward achieving excellence.
Beyond ensuring that a design project is well-run, managers also setpolicy, develop measures of success, and plan strategy.
PolicyCompany policies that support pollution prevention, resource con
servation, and other life cycle principles foster life cycle design. Although a step in the right direction, vague environmental policies maynot be much help. To benefit design projects, a firm's environmentalpolicies must be specific and clearly stated. Management should offer
28
The Development Process
objectives and guidelines that are detailed enough to provide a practicalframework for the actions of designers and others in the company.
StrategyStrate~ic planning positions companies for the future. Planners can
support life cycle design through an awareness of programs that helptheir company reach its environmental goals. Government agencies arenow fonning partnerships with companies in several areas that affectcorporate strategy. The US EPA's 33/50 Program and Green LightsProgram are examples of this new approach. There can be many advantages to such voluntary pollution prevention programs. By meetingregulations proactively, firms avoid time consuming and expensivecommand-and-control actions. Life cycle design can be a key elementin improved relations between regulators and companies.
Strategic planning that promotes life cycle design should also:
• Identify and plan reduction of a company's environmental im-pacts
• Include all impacts before and after development in planning• Discontinue/phase out product lines with unacceptable impacts• Invest in research and development of low-impact technology• Invest in improved facilities/equipment• Recommend regulatory policies that assist life cycle design• Educate and train employees in life cycle design
Details of these activities will not be discussed here. Each requiresseveral layers of planning. For example, a decision to cease productioncan also include job placement and retraining programs. Labor shouldhave an active role in such planning. Government and other players inthe life cycle can also ease transitions and help prevent pennanent jobloss.
Beyond the duties mentioned above, strategic planners need to balance current and anticipated demands. For example, planning hazardous waste disposal capacity begins with knowing current generationrates. Estimates of future waste generation require calculating the effectpollution prevention actions will have on reducing waste from anticipated production. Knowledge gained through this process may point thecompany in new directions.
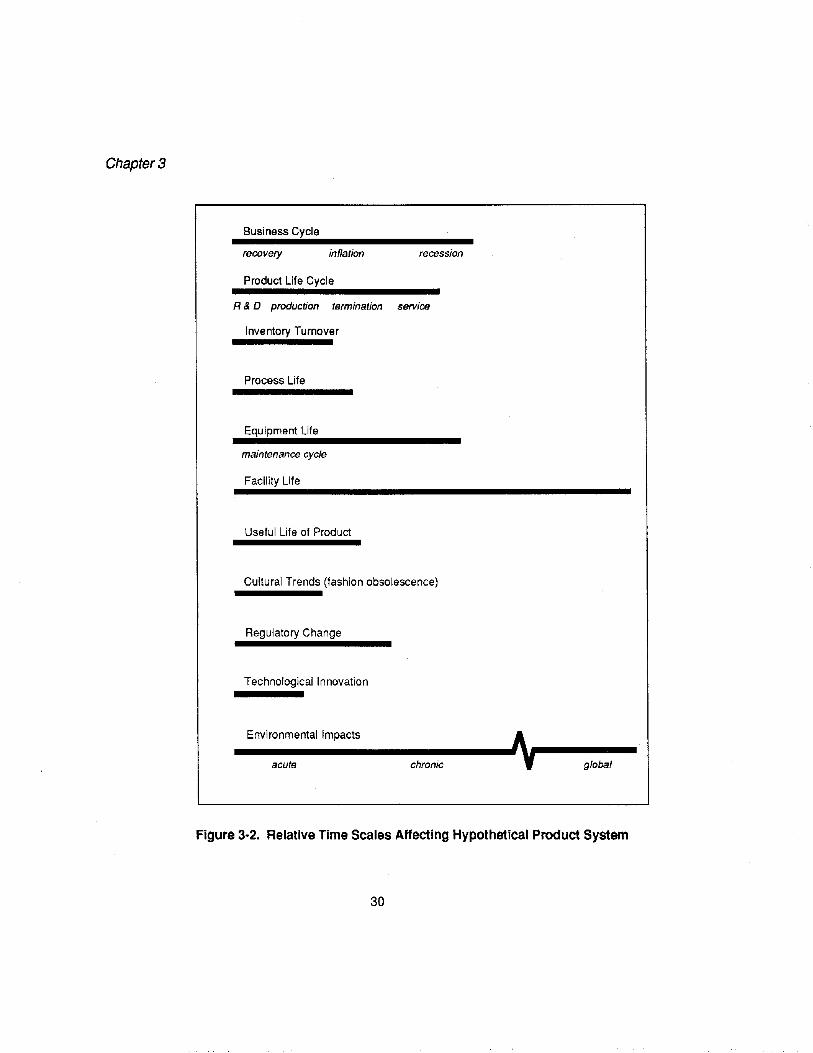
Strategic planning for life cycle design can seem overwhelmingwhen different time cycles affecting product system components areconsidered. The relative frequency and phase of some of these cyclesare shown in Figure 3-2 for a hypothetical case.
29
Environmental policiesshould be clear andspecific. Proper guidelinessupport life cycle designs.
Chapter 3
Business Cycle
recovery inflation
Product Life Cycle
recession
R&D production termination service
Inventory Turnover
Process Life
Equipment Life
maintenance cycle
Facility Life
Useful Life of Product
Cultural Trends (fashion obsolescence)
Regulatory Change
Technological Innovation
Environmental Impacts
acute chronic global
Figure 3·2. Relative Time Scales Affecting Hypothetical Product System
30
The Development Process
Environmental impacts and health effects from pollution occur ondifferent time scales. Acute exposures to toxics generally produce immediate effects within 24 hours, while chronic exposures may not causedemonstrable illness for several years. Similarly, global environmentalconsequences such as ozone depletion and climate change cannot be assessed immediately. In the case of raw material supplies, certain nonrenewable resources may only be available for several decades. Theconsequences of present profligacy may thus be transferred to futuregenerations.
Because times scales are incongruous for different elements of theproduct system, successful design is a complex activity. Although challenging, understanding and coordinating time scales can be a key element in improved design.
More traditional aspects of strategy also affect a life cycle designproject. Effective planning requires correctly assessing companystrengths, capabilities, and resources [13]. Companies must have access, either within or outside the firm, to the required technology andskills before embarking on a project. In addition, successful productsmust fit a firm's management, production, and sales and distributionabilities [14]. Lofty plans for low-impact products will not benefit afirm unless they can actually be implemented.
Many companies are also under pressure to shorten developmenttimes. This is due in part to competition to continuously bring newproducts to market. Strategic planning must balance these factors withthe need to meet life cycle goals.
Measures of SuccessThe progress of design projects should be clearly assessed with ap
propriate measures to help members of the design team pursue environmental goals. To ensure accuracy, measures for life cycle design shouldinclude both environmental and financial indicators.
Consistent measures of impact reduction in all phases of designhelp make analysis more accurate. The key to assessing specific impacts and assigning costs properly is a tracking system that identifiesand quantifies material flows for each product. Such systems for impactanalysis and accounting procedures are discussed in chapters 6 and 7.
Companies may measure progress toward stated goals in severalways. Verbal estimates can qualify results, or results can be calculatedwith numbers. In either case, life cycle design is likely to be more successful when environmental aspects are part of a firm's incentive andreward system. Even though life cycle design can cut costs, increaseperformance, and lead to greater profitability, it may still be necessary
31
Because time scales areincongruous for differentaspects of a product. it isimportant to properlycoordinate time scales indesign.
Measures of successshould include bothenvironmental and financialindicators. Some rewardsand promotions have to bebased on environmentalperformance, or people willfocus on other areas of thebusiness.
Chapter 3
Adding the environment toan exploration of customerneeds helps designersfocus on appropriateactions.
L~e cycle design seeks tosatisfy sign~icant
customer and societalneeds in a sustainablemanner. Avoidingconfusion between trivialdesires and actual needsis a key function of lifecycle design.
to include discrete environmental aspects when measuring anindividual's performance. If companies claim to follow sound environmental policies, but never reward and promote people for reducing impacts, managers and workers will naturally focus on other areas of thebusiness.
Needs Analysis
A development project should fIrst clearly identify customers andtheir needs. Design can then focus on meeting those needs.
Ideas that lead to design projects come from many sources. Insome companies, research and development provide discoveries thatmay prompt a needs analysis. Many successful companies base ideasfor new or improved products on research into customer desires. Whencustomer satisfaction drives design, projects begin in several ways.Marketing clinics or surveys gather vital feedback on current productsthat can be used in new designs. Clinics also offer opportunities to testnew, lower-impact products. In addition, ongoing product reviewswithin a company can help evaluate performance, market share, andother key factors such as fashion changes.
Environmental audits or regulatory reviews are also sources ofideas for design projects. Either process can uncover opportunities forimpact reduction. Environmental audits can range from a full life cycleanalysis to an assessment of a single process. Major impacts identifiedthrough audits can then be targeted for design improvement. Proposedor anticipated regulations may also prompt a design project. However,projects focusing solely on compliance can be inefficient. For this reason, it is wise to balance all needs in a design project.
Identifying significant needsUnless life cycle principles shape the needs analysis, development
projects may not create low-impact products. By including the environment in the set of customers that must be satisfied, designers will bemotivated to focus on appropriate actions. For example, designs basedon continued high levels of consumption and material use are contradictory to life cycle design goals and are best not pursued. Elevating perceived convenience over all other needs also invites environmentalharm.
In addition, improvement of a high-impact products that at best satisfy minor needs is not the most productive use of life cycle design. Instead, a needs analysis may recommend discontinuing such products.
32

The Development Process
After all, environmental impacts can be substantially reduced by endingproduction of questionable product lines.
Life cycle development projects properly focus on filling significantcustomer and societal needs in a sustainable manner. Avoiding confusion between trivial desires and actual needs is a major challenge of lifecycle design.
Define Scope of Design ProjectOnce significant needs and initial ideas for a design project have
been identified, the project's scope can be defined. This entails choosing system boundaries, characterizing analysis methods, and establishing a project time line and budget. Although later discoveries maymodify the original plan, it is useful at this early stage to decide whetherthe project will focus on modifying an existing product, creating thenext generation model, or developing a new product.
In choosing an appropriate system boundary, the development teammust initially consider the full life cycle from raw material acquisitionto the ultimate fate of residuals. More restricted system boundaries maybe justified by the development team. Beginning with the most comprehensive system, design and analysis can focus on the:
• full life cycle,• partial life cycle, or• individual stages or activities.
Choice of the full life cycle system will provide the greatest opportunities for impact reduction.
In some cases, the development team may confine analysis to a partiallife cycle consisting of several stages, or even a single stage. Stagescan be omitted if they are static or not affected by a new design. Aslong as designers working on a more limited scale are aware of potentialupstream and downstream impacts, environmental goals can still bereached. Even so, a more restricted scope will reduce possibilities fordesign improvement.
A decision about the type of environmental analysis needed for theproject should accompany the choice of system boundaries. Regardlessof the life cycle system chosen, analysis can be both quantitative orqualitative. Detailed analysis can proceed through all life cycle stages,or less rigorous methods can be used. Ultimately, the developmentteam's ability to evaluate design alternatives will depend directly on theaccuracy and thoroughness of the environmental analysis. Further details on project scope and environmental analysis are given in chapter 6.
33
Defining the project scopeincludes choosing systemboundaries, characterizinganalysis techniques, andestablishing a projecttimeline and budget.
Design and analysis of thefull life cycle system willprovide the greatestopportunities for impactreduction.
Chapter 3
Requirements may be themost critical aspect ofdesign. They define theexpected outcome andhelp designers translateneeds into effectiveproducts.
Successful developmentteams place requirementsbefore design. Rushinginto design beforeobjectives are fully definedby requirements invitesfailure.
After a project has been well-defined and seems worth pursuing, aproject time line and budget should be proposed. Life cycle design requires funds for environmental analysis of designs. Managers shouldrecognize that budget increases for proper environmental analysis canpay dividends in avoided costs and added benefits that outweigh the initial investment.
Establish Baseline Life Cycle DataComparative analysis, also referred to as benchmarking, shows
whether a design is an improvement over the competition.Benchmarking typically compares cost and performance; in life cycledesign it includes environmental criteria. To be useful, the life cycleframework and type of analysis used for benchmarking should matchthose chosen during the needs analysis. Environmental analysis toolsare discussed in chapter 6.
ReqUirements
Formulating requirements may well be the most critical phase ofdesign. Requirements define the expected outcome. Whenever possible, requirements should be stated in detail to help the design teamtranslate the needs statement into an effective solution. Design usuallyproceeds more efficiently when the solution is clearly bounded by wellconsidered requirements. In later phases of design, alternatives areevaluated on how well they meet requirements.
Although some designers are ready to produce concepts beforefully understanding project objectives or customer needs, successful development teams place requirements before design. It is important tospend enough time to develop proper requirements. Rushing to set requirements before research discloses suitable design functions can easily produce incomplete or vague requirements that lead to productfailure [15].
All requirements do not have to be stated in the same detail at thebeginning. It may be best to develop critical design functions into prototypes before stating final requirements. While work in critical areasproceeds, less vital requirements may remain in written form. This spiral model of development allows more flexibility and can produce betterresults [16].
Similarly, decisions made during the needs analysis can be modified during the more detailed requirements phase. Such feedback anditeration is a necessary element of design.
34
The Development Process
This manual focuses on environmental requirements. Incorporatingenvironmental requirements into the earliest stage of design can reducethe need for later corrective action. This proactive approach enhancesthe likelihood of developing a lower-impact product. Pollution control,liability, and remedial action costs can be greatly reduced by developingenvironmental requirements at the outset of a project.
Life cycle design seeks to integrate environmental requirementswith traditional performance, cost, cultural, and legal requirements. Allrequirements must be properly balanced in a successful product. A lowimpact product that fails in the marketplace benefits no one.
The next chapter discusses requirements in more detail.
Design Phases
The remaining phases of development are familiar to designers.They are not significantly altered by the environmental aspects of lifecycle design. During these phases, the development team synthesizes requirements into a coherent design. Because life cycle design is based onconcurrent practices, these phases are not fully distinct. Activities inseveral phases will be occurring at the same time.
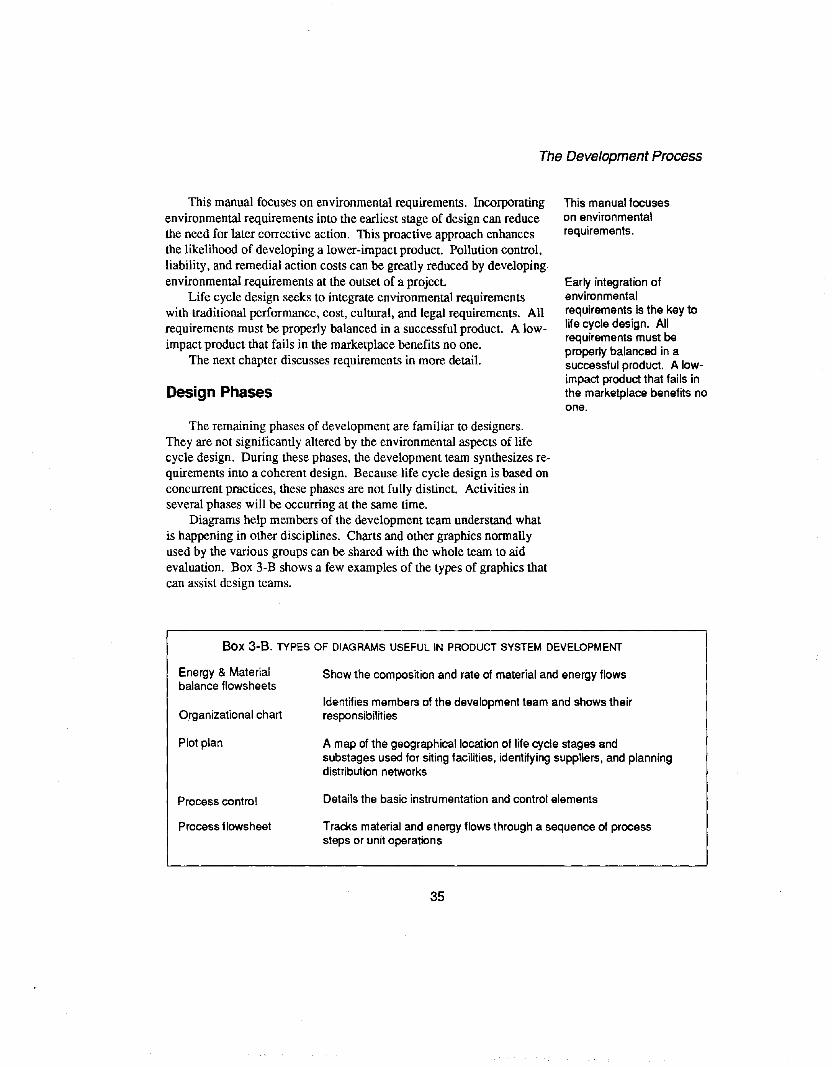
Diagrams help members of the development team understand whatis happening in other disciplines. Charts and other graphics nonnallyused by the various groups can be shared with the whole team to aidevaluation. Box 3-B shows a few examples of the types of graphics thatcan assist design teams.
This manual focuseson environmentalrequirements.
Early integration ofenvironmentalrequirements is the key tolife cycle design. Allrequirements must beproperly balanced in asuccessful product. A lowimpact product that fails inthe marketplace benefits noone.
Box 3-B. TYPES OF DIAGRAMS USEFUL IN PRODUCT SYSTEM DEVELOPMENT
Energy & Materialbalance flowsheets
Organizational chart
Plot plan
Process control
Process flowsheet
Show the composition and rate of material and energy flows
Identifies members of the development team and shows theirresponsibilities
A map of the geographical location of life cycle stages andsubstages used for siting facilities, identifying suppliers, and planningdistribution networks
Details the basic instrumentation and control elements
Tracks material and energy flows through a sequence of processsteps or unit operations
35
Chapter 3
ConceptsIn the concept phase, innovative ways to meet requirements are
proposed. Even in improvement projects, creative insights should beencouraged to avoid basing all design activity on past experience. Concepts generated in this phase are then screened to detennine their feasibility.
PrelIminary DesignMore detailed synthesis and analysis are required to select the best
concepts. During this phase, design is decomposed into product systemcomponents and life cycle substages.
Details of the design can only be fixed with enough certainty tocarry out rigorous analysis after several alternatives have been developed in sufficient detail. At this point, life cycle analysis of competingsolutions can proceed in various depths.
Depending on product complexity, prototypes of either parts or anentire product may be constructed in this phase of design to aid evaluation.
If significant problems develop during preliminary design, backtracking to the concept stage may be necessary. Knowledge gainedduring this phase may also reveal conflicting aspects of the initial requirements that are difficult to resolve. When this occurs, a return tothe requirements phase for additional research or modified rankinghelps clarify issues and increases the chances of a successful outcome.
Detailed DesignThe final details of the best alternative are worked out in this stage.
Detailed drawings, engineering specifications, and final process designare then completed. Advice from manufacturing employees and customers can be particularly useful during detailed design, especiallywhen prototypes are available for examination. Such reviews help ensure that design objectives have been translated correctly or modified tomeet changing conditions.
Before implementation, the design is compared to benchmark products. Final evaluation should clearly identify both strengths and weaknesses that are likely to impact on product success. Minor problemsrevealed at this point can still be corrected. Fonnal closure occurswhen all life cycle participants support and approve a final detailed design.
36
The Development Process
Implementation
After fonnal approval, designs are implemented. Implementationincludes production and distribution along with marketing and labeling.Building or planning infrastructure and recommending policy changesto regulators is also a part of implementation.
As figure 3-1 shows, design actions don't end at this point. Productdevelopment is a continuous process. Existing products, even if newlyimplemented, should be viewed as the starting point for new initiatives.
Limitations
Several factors present barriers to the full pursuit of life cycle design. As discussed in chapter 6, lack of data and models for determininglife cycle impacts make analysis difficult.
In addition, lack of motivation may also limit life cycle design.Public pressure, regulatory requirements, competitive advantage, andavoiding liability provide incentives for reducing impacts within thatportion of the life cycle controlled by individual players, but interest canrapidly dwindle when the scope is broadened to other participants.
Similarly, a design action that reduces total impacts may increaselocal impacts. Under these circumstances, it may be very difficult foran individual participant to justify bearing the consequences while others benefit. This can be particularly true when shareholders, local interests, or regulators are not aware of the design's full life cycle benefits.
37
Chapter 3
References
1. Jones, 1. Christopher. 1980. MaNJging Design Methods. New York: JohnWiley and Sons.
2. Finger, Susan, and John R. Dixon. 1989. A Review of Research in Mechanical Engineering Design. Part I: Descriptive, Prescriptive, and ComputerBased Models of Design Processes. Research in Engineering Design 1:51-67.
3. Whitney, D. E. 1988. Manufacturing by Design. Harvard Business ReviewJul-Aug: 83-91.
4. Shewhart, Walter A. 1986. Statistical Method From the Viewpoint ofQualilyControl. New York: Dover. (originally published 1939 by USDA)
5. Deming, W. Edwards. 1952. Elementary Principles ofthe Statistical ControlofQuality: A Series ofLectures. Tokyo: Nippon Kaguku GijutsuRemmeL
6. _.1982. Quality, Productivity and Competitive Position. Cambridge, MA:MIT Center for Advanced Engineering Study.
7. Juran, 1. M. 1988. Juran on Planning for Quality. New York: McMillan.8. Feigenbaum, A. V. 1991. Total Quality Control. New York: McGraw-Hill.9. Ishikawa, Kaoru . 1986. Guide to Quality Control. Tokyo: Asian Productiv
ity Organization.10. Kogure. Masao. and Yoji Akao. 1983. Quality Function Deployment and
CW~ in Japan. Quality Progress 16 (10): 25-29.11. Akao. Yoji. Akira Harada, and Kazuo Matsumoto. 1990. Quality Function
Deployment and Technology Deployment. Quality Function Deployment: Integrating Customer Requirements Into Product Design, editor,Yoji Akao. 149-179. Cambridge. MA: Productivity Press.
12. Shindo. Hisakazu, Yasuhiko Kubota, and Yuritsuga Toyourni. 1990. Usingthe Demanded Quality Deployment Chart. Quality Function Deployment: Integrating Customer Requirements Into Product Design, editor,Yoji Akao, 27-49. Cambridge, MA: Productivity Press.
13. Oakely. Mark. 1984. MaNJging Product Design. New York: Wiley14. Hollins. Bill. 1989. Successful Product Design: What to Do and When. Bos
ton: Butterworth.15. Gause. Donald G.• and Gerald M. Weinberg. 1989. Requirements: Quality
Before Design. New York: Dorset House.16. Boehm. Barry W. 1988. A Spiral Model of Software Development and En
hancement. Computer 221 (5): 61-72.
38
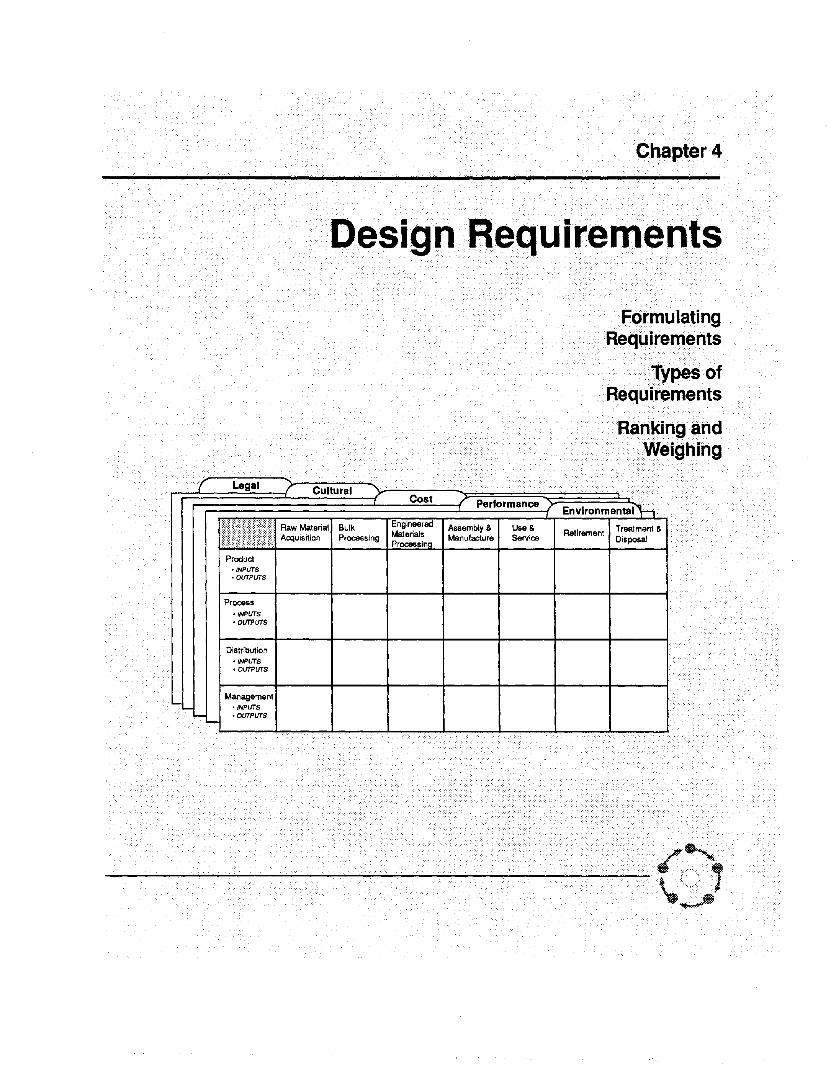
FormulatingRequirements
.Types ofRequirements
Ranking andWeighing
Design Bequirements
Distribution• /NPlITS·OllTPlITS
Product·/NPlITS• OllTPlITS
Process·INPlITS• OllTPlITS
Chapter 4
DESIGN REQUIREMENTS
4.1 FORMULATING REQUIREMENTS
Requirements defineproduct systems thatsatisfy societal needsefficiently and equitably.They are the crucial bridgebetween the needsstatement and later designactions.
Requirements should statewhat a design does, nothow this is accomplished.
People knowledgeableabout each area of theproduct system should aidin developingrequirements. Suchdiversity often results infewer casual assumptions.
In life cycle design, requirements define product systems that satisfy societal needs efficiently and equitably. Requirements are the crucial bridge between the needs statement and later design actions. Awell-conceived set of requirements translates project objectives into asolution space for design. In addition to setting the boundaries for design, requirements are also used to evaluate alternatives.
Environmental aspects are critical to overall product system quality. For this reason, environmental requirements should be developedat the same time as performance, cost, cultural, and legal criteria.
Key Elements
Requirements in life cycle design, as in other forms of design, contain the following elements [1]:
• Functions describe what a successful design does. Functionsshould state what a design does, not how it is accomplished.
• Attributes are descriptions of design functions in more detail.• Constraints are conditions that the design must meet to satisfy
project goals. Constraints are limits that restrict the designsearch to manageable areas.
Proper requirements are the result of considerable research andanalysis. A clear focus on customer and societal needs usually produces better products.
People knowledgeable about each area of the product systemshould aid in developing requirements. Such diversity often results infewer casual assumptions. Teamwork also makes it easier to addressall critical aspects of the product system.
Requirements may be developed more quickly when the designteam splits into groups that concentrate on just one area, such as costor performance. When smaller groups are formed, all team membersshould maintain close communication. Periodic meetings of the entireteam are necessary to review proposed requirements. Customers and
40
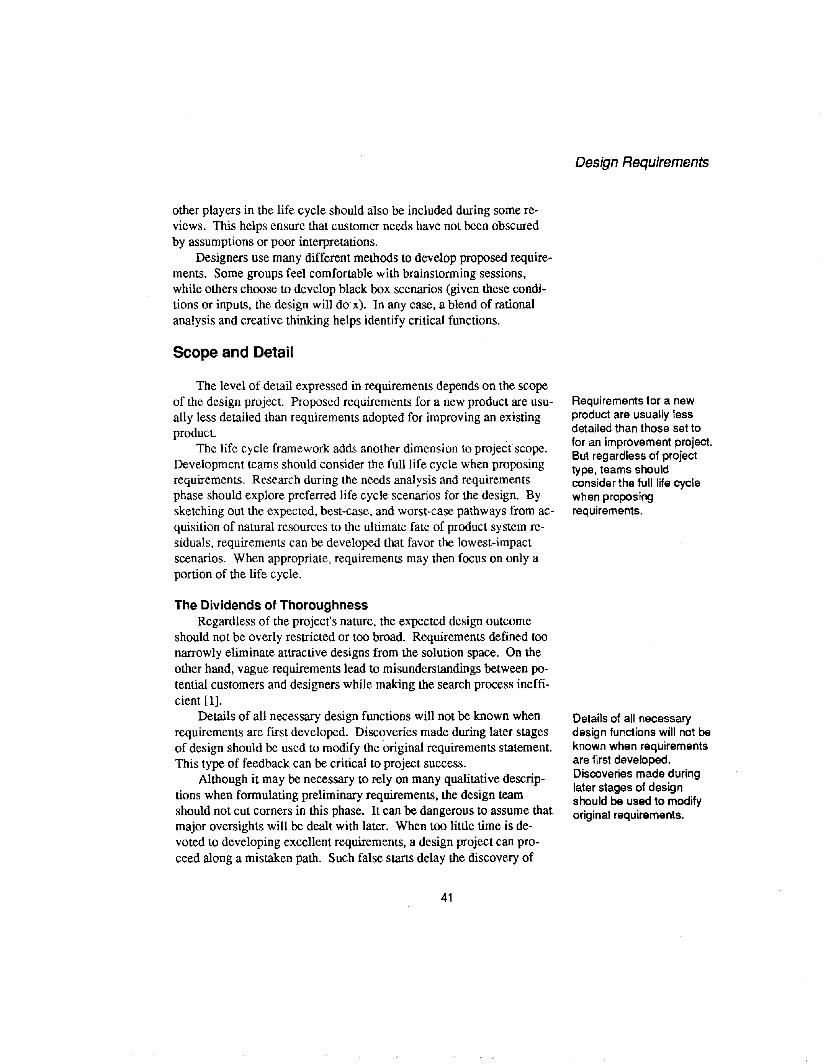
other players in the life cycle should also be included during some reviews. This helps ensure that customer needs have not been obscuredby assumptions or poor interpretations.
Designers use many different methods to develop proposed requirements. Some groups feel comfortable with brainstorming sessions,while others choose to develop black box scenarios (given these conditions or inputs, the design will do x). In any case, a blend of rationalanalysis and creative thinking helps identify critical functions.
Scope and Detail
The level of detail expressed in requirements depends on the scopeof the design project. Proposed requirements for a new product are usually less detailed than requirements adopted for improving an existingproduct.
The life cycle framework adds another dimension to project scope.Development teams should consider the full life cycle when proposingrequirements. Research during the needs analysis and requirementsphase should explore preferred life cycle scenarios for the design. Bysketching out the expected, best-case, and worst-case pathways from acquisition of natural resources to the ultimate fate of product system residuals, requirements can be developed that favor the lowest-impactscenarios. When appropriate, requirements may then focus on only aportion of the life cycle.
The Dividends of ThoroughnessRegardless of the project's nature, the expected design outcome
should not be overly restricted or too broad. Requirements defined toonarrowly eliminate attractive designs from the solution space. On theother hand, vague requirements lead to misunderstandings between potential customers and designers while making the search process inefficient [1].
Details of all necessary design functions will not be known whenrequirements are first developed. Discoveries made during later stagesof design should be used to modify the original requirements statement.This type of feedback can be critical to project success.
Although it may be necessary to rely on many qualitative descriptions when formulating preliminary requirements, the design teamshould not cut corners in this phase. It can be dangerous to assume thatmajor oversights will be dealt with later. When too little time is devoted to developing excellent requirements, a design project can proceed along a mistaken path. Such false starts delay the discovery of
41
Design Requirements
Requirements for a newproduct are usually lessdetailed than those set tofor an improvement project.But regardless of projecttype, teams shouldconsider the full life cyclewhen proposingrequirements.
Details of all necessarydesign functions will not beknown when requirementsare first developed.Discoveries made duringlater stages of designshould be used to modifyoriginal requirements.
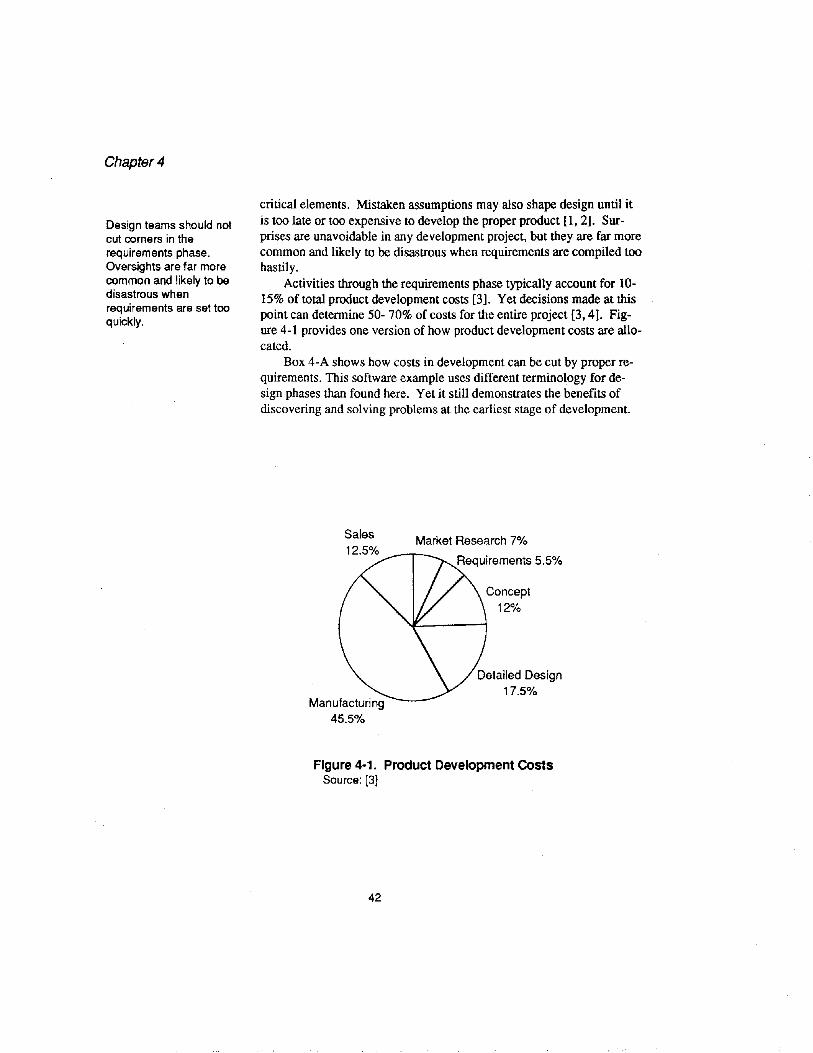
Chapter 4
Design teams should notcut corners in therequirements phase.Oversights are far morecommon and likely to bedisastrous whenrequirements are set tooquickly.
critical elements. Mistaken assumptions may also shape design until itis too late or too expensive to develop the proper product [1, 2]. Surprises are unavoidable in any development project, but they are far morecommon and likely to be disastrous when requirements are compiled toohastily.
Activities through the requirements phase typically account for 1015% of total product development costs [3]. Yet decisions made at thispoint can determine 50- 70% of costs for the entire project [3, 4]. Figure 4-1 provides one version of how product development costs are allocated.
Box 4-A shows how costs in development can be cut by proper requirements. This software example uses different terminology for design phases than found here. Yet it still demonstrates the benefits ofdiscovering and solving problems at the earliest stage of development.
Sales Market Research 7%12.5% .--.-__
Concept12%
Figure 4-1. Product Development COstsSource: [3]
42
Box 4-A. RELATIVE COST TO FIX AN
ERROR AT VARIOUS POINTS
Design Requirements
PHASE
RequirementsDesignCodingDevelopment TestsAcceptance TestsOperation
Source: [5]
Use of Requirements Matrix
COST RATIO
13-610
15-4030-70
40-1000
Matrices allow product development teams to study the interactionsbetween life cycle requirements. Matrices are also an effective meansof organizing data for later analysis and evaluation. Using the sametypes of matrices to develop requirements and later evaluate designsmakes each task simpler. Information presented in a consistent mannermay also seem clearer. This can be a key aid in good design.
Figure 4-2 shows a multi-layer matrix for developing requirements.The matrix for each type of requirement contains columns that representlife cycle stages. Rows of each matrix are formed by the product system components described in Chapter 2: product, process, distribution,and management. Each row is subdivided into inputs and outputs. Elements can then be described and tracked in as much detail as necessary.
The requirements matrices shown in Figure 4-2 are strictly conceptual. Practical matrices can be formed for each class of requirementsby further subdividing the rows and columns of the conceptual matrix.For example, the manufacturing stage could be subdivided into suppliers and the original equipment manufacturer. The distribution component of this stage might also include receiving, shipping, and wholesaleactivities. Retail sale of the final product might best fit in the distribution component of the use phase.
There are no absolute rules for organizing matrices. Developmentteams should choose a format that is appropriate for their project
Figure 4-3 is a further illustration of how categories in the matrixcan be subdivided. This example shows how each row in the environmental matrix can be expanded to provide more detail for developingrequirements.
43
Requirements may focuson only a portion of the lifecycle, when appropriate.
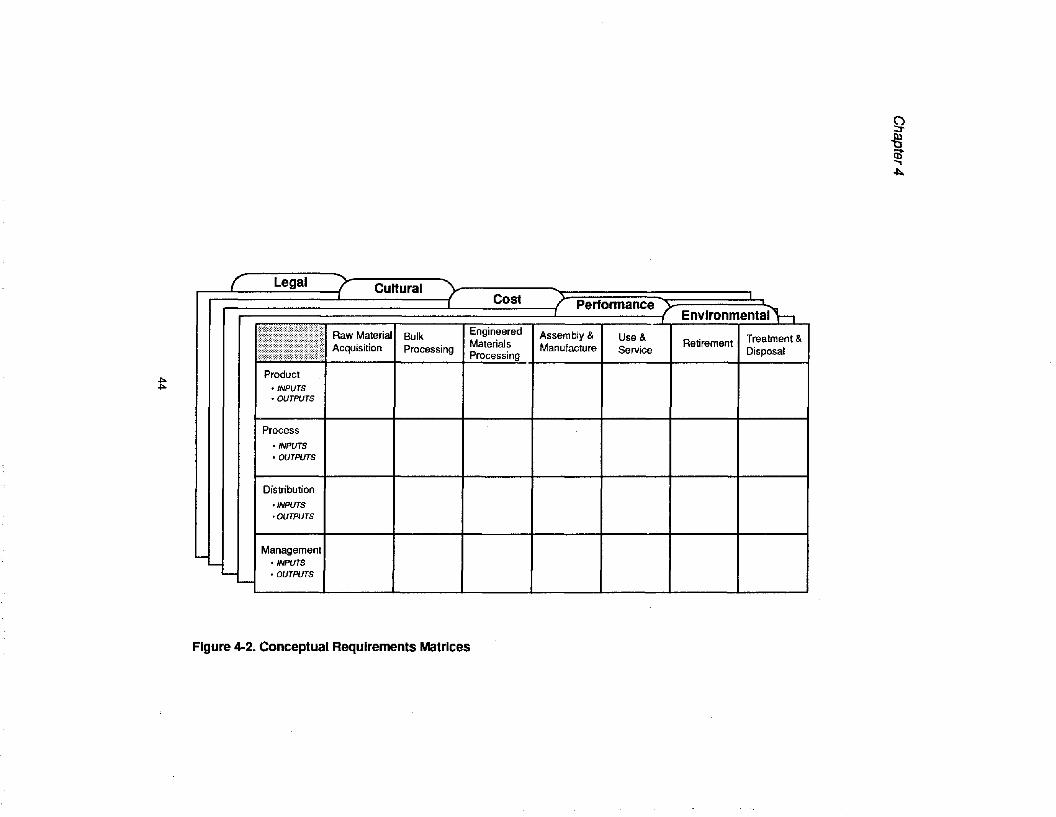
t
-(' Legal .7 CulturalCost
./ Performance .7 Environmental hUse & Retirement Treatment &
Engineered Assembly &
Disposal• Ra•.Materi' Bulk
Materials Manufacture ServiceAcqUisition ProcessingProcessing
Product• INPUTS• OUTPUTS
Process
• INPUTS• OUTPUTS
-Distribution
• INPUTS• OUTPUTS
Management
'--'--'--L..-• INPUTS• OUTPUTS
Figure 4-2. Conceptual Requirements Matrices
9~(j)~
~
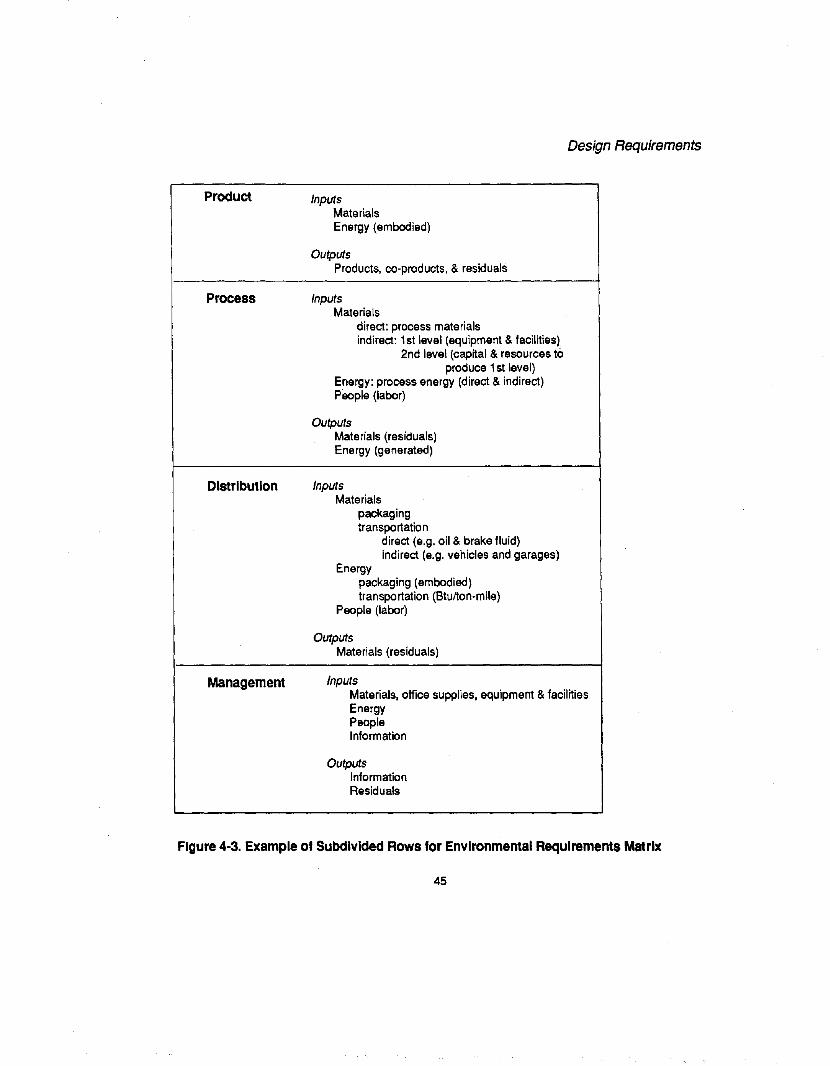
Product
Process
Distribution
Management
Design Requirements
InputsMaterialsEnergy (embodied)
OutputsProducts, co-products, & residuals
InputsMaterials
direct: process materialsindirect: 1st level (equipment & facilities)
2nd level (capital & resources toproduce 1st level)
Energy: process energy (direct & indirect)People (labor)
OutputsMaterials (residuals)Energy (generated)
InputsMaterials
packagingtransportation
direct (e.g. oil & brake fluid)indirect (e.g. vehicles and garages)
Energypackaging (embodied)transportation (Btulton-mile)
People (labor)
OutputsMaterials (residuals)
InputsMaterials, office supplies, equipment & facilitiesEnergyPeopleInformation
OutputsInformationResiduals
Figure 4-3. Example of Subdivided Rows for Environmental ReqUirements Matrix
45
Chapter 4
Environmental goalsshould be translated intoclear requirements thathelp identify and constrainenvironmental impacts.
4.2 TYPES OF REQUIREMENTS
Environmental
Environmental requirements should minimize:
• raw materials consumption• energy consumption• waste generation• health and safety risks• ecological degradation
By translating these goals into clear functions, environmental requirements help identify and constrain environmental impacts andhealth risks. As discussed in chapter 2, environmental requirementsshould also address environmental equity.
Box 4-B lists issues that can help development teams define environmental requirements. This manual cannot provide detailed guidanceon environmental requirements for each business or industry. Althoughthe lists in Box 4-B are not complete, they introduce many importanttopics. Depending on the project, teams may express these requirementsas numbers or verbal descriptions. For example, it might be useful tostate a requirement that limits solid waste generation for the entire product life cycle to a specific quantity or weight.
In addition to criteria discovered in the needs analysis orbenchmarking, government policies can also be used to set requirements. For example, the Integrated Solid Waste Management Plan developed by the EPA in 1989 targets municipal solid waste disposal for a25% reduction by 1995 [6]. Other initiatives, such as the EPA's 33/50program are aimed at reducing toxics. It may benefit companies to develop requirements that match the goals of this program.
It can also be wise to set environmental requirements that exceedgovernment statutes. Designs based on such proactive requirements offer many benefits. Major modifications dictated by regulation can becostly and time consuming. In addition, such changes may not be consistent with a firm's own development cycles, creating even more problems that could have been avoided.
46
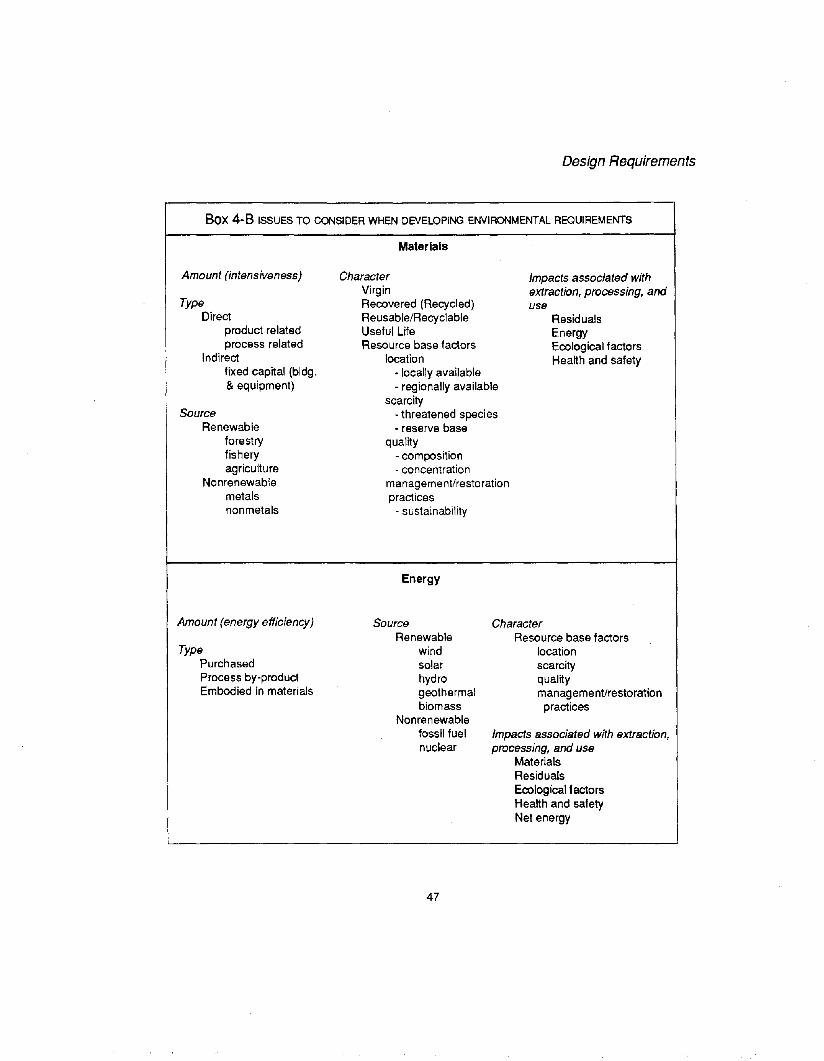
Design Requirements
Box 4-B ISSUES TO CONSIDER WHEN DEVELOPING ENVIRONMENTAL REQUIREMENTS
MaterialS
Amount (intensiveness)
TypeDirect
product relatedprocess related
Indirectfixed capital (bldg.& equipment)
SourceRenewable
forestryfisheryagriculture
Nonrenewablemetalsnonmetals
CharacterVirginRecovered (Recycled)Reusable/RecyclableUseful LifeResource base factors
location- locally available- regionally available
scarcity- threatened species• reserve base
quality- composition- concentration
management/restorationpractices
- sustainability
Energy
Impacts associated withextracffon, processing, anduse
ResidualsEnergyEcological factorsHealth and safety
Amount (energy efficiency)
TypePurchasedProcess by-productEmbodied in materials
SourceRenewable
windsolarhydrogeothermalbiomass
Nonrenewablefossil fuelnuclear
47
CharacterResource base factors
locationscarcityqualitymanagement/restorationpractices
Impacts associated with extraction,processing, and use
MaterialsResidualsEcological factorsHealth and safetyNet energy
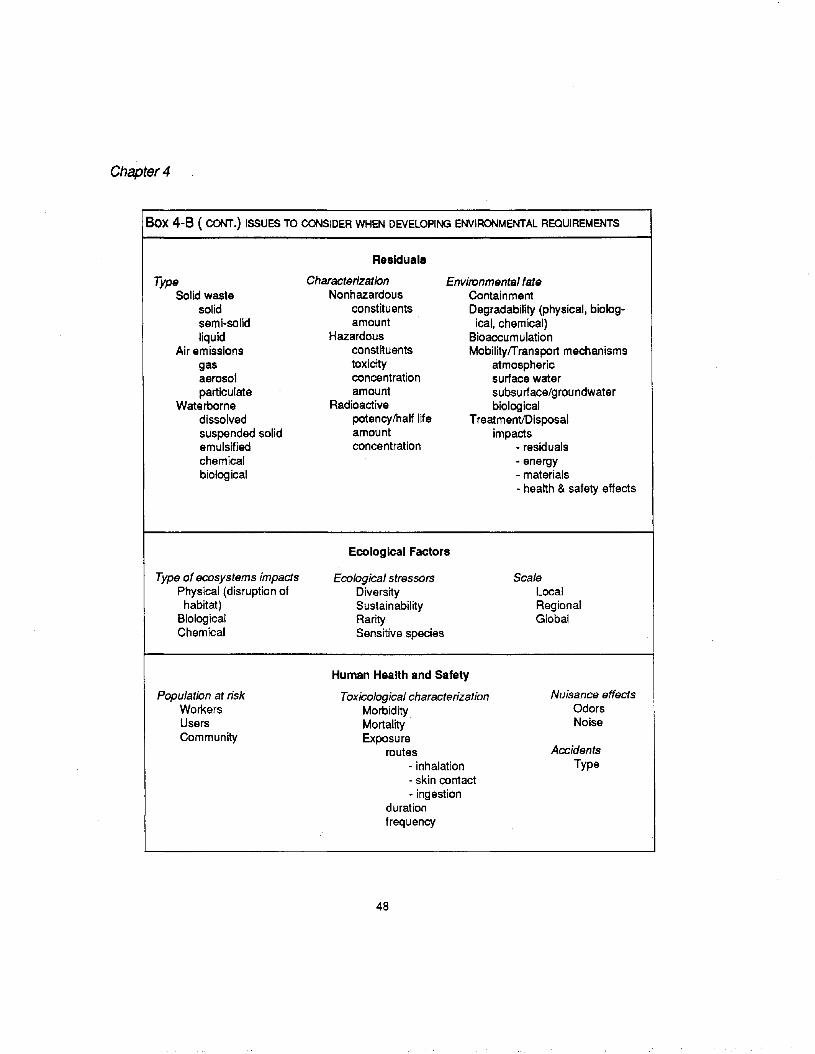
Chapter 4
Box 4-B ( CONT.) ISSUES TO CONSIDER WHEN DEVELOPING ENVIRONMENTAL REOUIREMENTS
TypeSolid waste
solidsemi-solidliquid
Air emissionsgasaerosolparticulate
Waterbornedissolvedsuspended solidemulsifiedchemicalbiological
Residuals
CharacterizationNonhazardous
constituentsamount
Hazardousconstituentstoxicityconcentrationamount
Radioactivepotency!ha~ lifeamountconcentration
Environmental fateContainmentDegradability (physical, biological. chemical)
BioaccumulationMobilityfTransport mechanisms
atmosphericsurface watersubsurface/groundwaterbiological
TreatmentlDisposalimpacts
- residuals- energy- materials- health & safety effects
Type of ecosystems impactsPhysical (disruption ofhabitat)
BiologicalChemical
Population at riskWorkersUsersCommunity
Ecological Factors
Ecological stressorsDiversitySustainabilityRaritySensitive species
Human Health and Safety
Toxicological characterizationMorbidityMortalityEXlX>sure
routes- inhalation- skin contact- ingestion
durationfrequency
48
ScaleLocalRegionalGlobal
Nuisance effectsOdorsNoise
AccidentsType
Performance
Performance requirements define the functions of product systems.Functional requirements range from size tolerances of parts to time andmotion specifications for equipment. Typical performance requirementsfor an automobile include fuel economy, maximum driving range, acceleration and braking capabilities, handling characteristics, passenger andstorage capacity, and ability to protect passengers in a collision.
Compatibility of components should also be addressed in performance. This includes making sure component interfaces fit and do notcause harmful reactions.
Life cycle designs need to offer a high level of performance to satisfy customer needs. However, desired performance is limited by technical factors. Practical performance limits are usually defined by bestavailable technology. Absolute limits that products may strive toachieve are set by thermodynamics or the laws of nature. Noting thetechnical limits on product system performance provides designers witha frame of reference for comparison.
Other limits on performance also need to be understood. In manycases, process design is constrained by existing facilities and equipment.This affects many aspects of process performance. It can also limitproduct performance by restricting possible materials and features.When this occurs, the success of a major design project may depend onupgrading or investing in new technology.
Useful life of product systems is often a key element of performance. In many cases, useful life strongly influences how well productsystems meet life cycle goals. Environmental impacts of a designshould be measured per unit of service or time. When impacts are normalized on this basis, products with widely varying useful lives can beproperly compared.
Designers should also be aware that customer behavior and socialtrends affect product performance. Innovative technology might increase performance and reduce impacts, but possible gains can be erasedby increased consumption. For example, automobile manufacturersdoubled average fleet fuel economy over the last twenty years. However, gasoline consumption in the US remains nearly the same becausemore vehicles are being driven more miles.
Although better performance may not always result in environmental gain, poor performance usually produces more impacts. Inadequateproducts are retired quickly in favor of more capable ones. Development programs that fail to produce products with superior performance
49
Design Requirements
Performance requirementsdefine the functions ofproduct systems.
Useful life is often a keyelement of performance.
Inadequate products areretired quickly for morecapable ones.Development programsthat fail to produceproducts with superiorperformance thereforecontribute to excess wastegeneration and resourceuse.
Chapfer4
Most people will notchoose a low-impactproduct unless it is offeredat an attractive price. Costrequirements shouldtherefore help designersadd value to the productsystem.
Cultural requirementsdefine the shape, form,color, texture, and imagethat a product projects.Successful culturalrequirements enable thedesign itself to promote anawareness of how itreduces impacts.
therefore contribute to excess waste generation and resource use. Thisis true even when environmental criteria are integrated into the earlieststages of development
Cost
Meeting all performance and environmental requirements does notensure project success. Regardless of how environmentally responsiblea product may be, most people will choose another if it cannot be offered at a competitive price. In some cases, a premium can be chargedfor significantly superior environmental or functional performance, butsuch premiums are usually lin:ited.
Modified accounting systems that fully reflect environmental costsand benefits are important to life cycle design. With more complete accounting, many low-impact designs may show financial advantages.Chapter 7 discusses methods of life cycle accounting that can assist indeveloping requirements.
Cost requirements should help designers add value to the productsystem. These requirements can be most useful when they include atime frame (such as total user costs from purchase until final retirement)and clearly state life cycle boundaries. Parties who will accrue thesecosts, such as suppliers, manufacturers, and customers should also beidentified.
Cost requirements need to reflect market possibilities. Value canbe conveyed to customers through estimates of a product's total costover its expected useful life. Total customer costs include purchaseprice, consumables, service, and retirement costs. In this way, qualityproducts are not always judged on least first cost, which addresses onlythe initial purchase price or financing charges.
Cultural
Cultural requirements define the shape, form, color, texture, andimage that a product projects. Low-impact designs must satisfy culturalrequirements to be successful. Material selection, product finish, colors, and size are guided by consumer preferences. These choices havedirect environmental consequences.
However, because customers usually do not know about the environmental consequences of their preferences, creating pleasing, environmentally superior products is a major design challenge. Successfulcultural requirements enable the design itself to promote an awarenessof how it reduces impacts.
50
Cultural requirements may overlap with others. Convenience isusually considered part of performance, but it is strongly influenced byculture. In some cultures, convenience is elevated above many otherfunctions. Cultural factors may thus determine whether demand for perceived convenience and environmental requirements conflict
Legal ReqUirements
Local, state, and federal environmental, health, and safety regulations are mandatory requirements. Violation of these requirements leadsto fines, revoked permits, criminal prosecution, and other penalties.Both companies and individuals within a firm can be held responsiblefor violating statutes. In 1991, people convicted of violating environmental regulations served prison terms totaling 550 months [7]. Firmsmay also be liable for punitive damages.
Federal regulations are administered and enforced by agencies suchas the Environmental Protection Agency (EPA), Food and Drug Administration (FDA), and the Consumer Product Safety Commission (CPSC).Appendix B contains a brief overview of the major federal environmental laws.
The responsibility for enforcing many federal programs has beendelegated to the states; the federal government grants this authority andmaintains oversight. Individual states may also have their own set ofenvironmental statutes that must be met in design.
Environmental professionals, health and safety staff, legal advisors,and government regulators can identify legal issues for life cycle design.Principal local, state, and federal regulations that apply to the productsystem provide a framework for requirements. Specific details can bedefined as other design requirements are fixed.
Legal requirements vary in complexity depending on the type ofproduct system. For example, hazardous materials are subject to manystatutes over a life cycle. To begin with, chemical manufacturers ofhazardous substances must file a Premanufacture Notification (PMN)under the Toxic Substances Control Act (TSCA) as part of the application process for approval of new chemical products. Environmental releases from subsequent manufacturing are mainly regulated under theResource Conservation and Recovery Act (RCRA), Clean Air Act(CAA), Clean Water Act (CWA), and Emergency Planning and Community Right to Know Act (EPCRA). Transporters of hazardous materials must then comply with the Hazardous Materials Transportation Act
51
Design Requirements
RegUlations are mustrequirements.
Chapter 4
Legal requirements mustmeet or exceed allapplicable laws where theproduct will be sold. Theyshould also address bothpending and proposedregulations likely to beenacted.
developed jointly by EPA and the Department of Transportation. Finally, consumer products must meet the Federal Hazardous SubstancesLabeling Act.
In addition to such national programs in the US, political boundaries may also affect regulations. For example, some cities have imposed bans on certain materials and products. Regulations also varydramatically among countries. For this reason, legal requirementsshould meet and exceed all applicable laws where the product will besold.
Although essential, familiarity with the full range of applicableregulations may not be enough to ensure excellent legal requirements.Whenever possible, legal requirements should also take into accountpending and proposed regulations that are likely to be enacted. Suchforward thinking can prevent costly problems during manufacture oruse while providing a competitive advantage.
Example of Partial Matrix
The following example illustrates how part of a requirements matrix might be filled in. Requirements in this hypothetical example areproposed for the next generation of a consumer refrigerator. Only requirements for the use stage of the life cycle are shown in Boxes 4-Cthrough G.
This is just a sample of possible requirements. In this example, requirements are stated generally without numerical constraints. An actual project would likely set more requirements in greater detail.
The requirements outlined here demonstrate some of the conflictsthat arise in design. For example, increasing insulation in the wallsand door reduces energy use, but it can also increase material use andwaste on disposal while reducing usable space. If cultural requiremen~s dictate that refrigerators must fit in existing kitchens and maintain a certain usable space, energy-saving actions that increase wallthickness might be precluded. Also, CFCs are usually more efficientthan alternatives that do not deplete ozone. Replacing CFCs might increase energy use.
52

Design Requirements
Box 4-C. SOME USE/SERVICE REQUIREMENTS FOR REFRIGERATORS
ENVIRONMENTAL MATRIX
ProductMaterial type -based on a materials inventory of components/parts (refrigeratorllreezer
compartments, refrigeration system, compressor, condenser, evaporator, fans, electriccomponents)
• eliminate high impact materials: substitute for CFC-12 with lower ozone depletingpotential and global warming potential alternatives
Material amount• reduce material intensiveness: specify Ibs of material
Residua/s-specified in Retirement stage
ProcessEnergy
• reduce energy use: specify energy consumption for compressor, fans, anti-sweatheaters (average yearly energy use)
People• noise: specify frequency and maximum loudness
Residuals• reduce waste: specify systems for recovering refrigerant during service; specify level of
refrigerant loss during normal use and service; requirements for reuse, remanufacture,recycle of components are stated in Retirement Stage
DistributionMaterial type
• reduce impacts associated with packaging materials: specify low impact materialsMaterial amount
• reduce material intensiveness of packaging: specify Ibs of materialEnergy
• conserve transportation energy: specify constraints on energy associated with deliveryResiduals
• reduce packaging waste; specify reusable, recyclable packaging• reduce product waste: specify maximum amount of damaged products during
distribution
ManagementInformation
• provide consumers with information on energy use: meet DOE labeling requirements forenergy efficiency
53
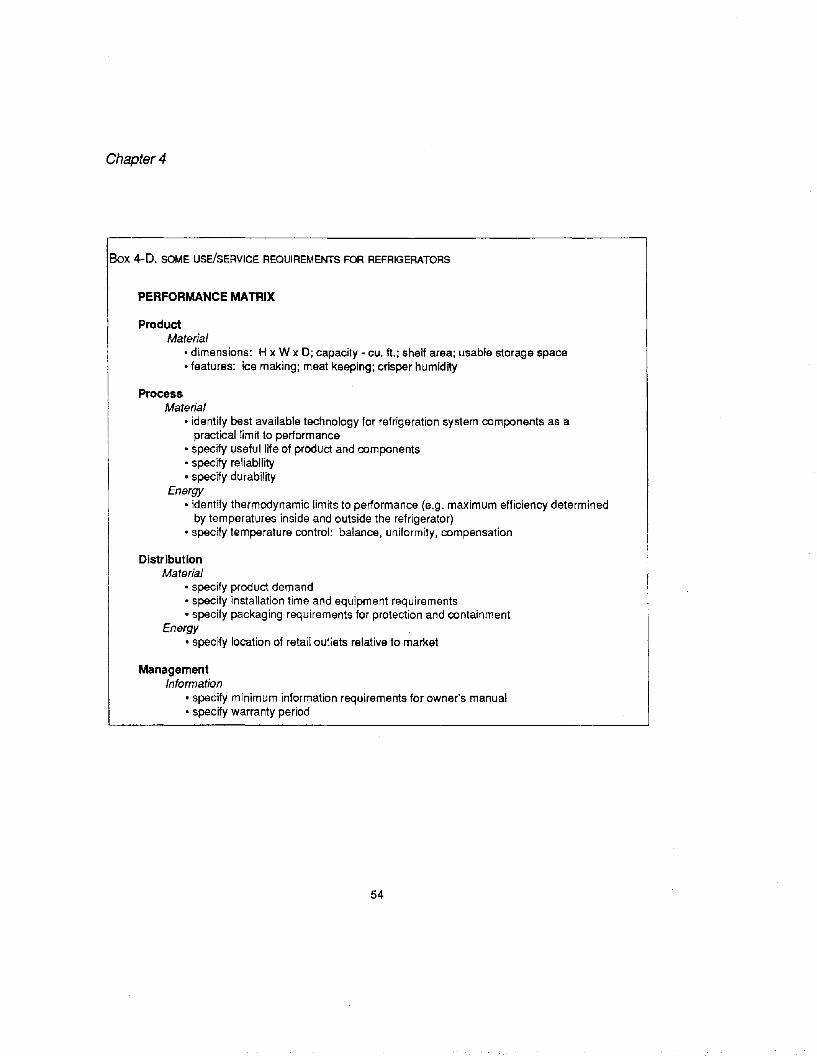
Chapter 4
Box 4-D. SOME USE/SERVICE REQUIREMENTS FOR REFRIGERATORS
PERFORMANCE MATRIX
ProductMaterial
• dimensions: H x W x D; capacity - cu. ft.; shelf area; usable storage space• features: ice making; meat keeping; crisper humidity
ProcessMaterial
• identify best available technology for refrigeration system components as apractical limit to performance
• specify useful life of product and components• specify reliability• specify durability
Energy• identify thermodynamic limits to performance (e.g. maximum efficiency determined
by temperatures inside and outside the refrigerator)• specify temperature control: balance, uniformity, compensation
DistributionMaterial
• specify product demand• specify installation time and equipment requirements• specify packaging requirements for protection and containment
Energy• specify location of retail outiets relative to market
ManagementInformation
• specify minimum information requirements for owner's manual• specify warranty period
54
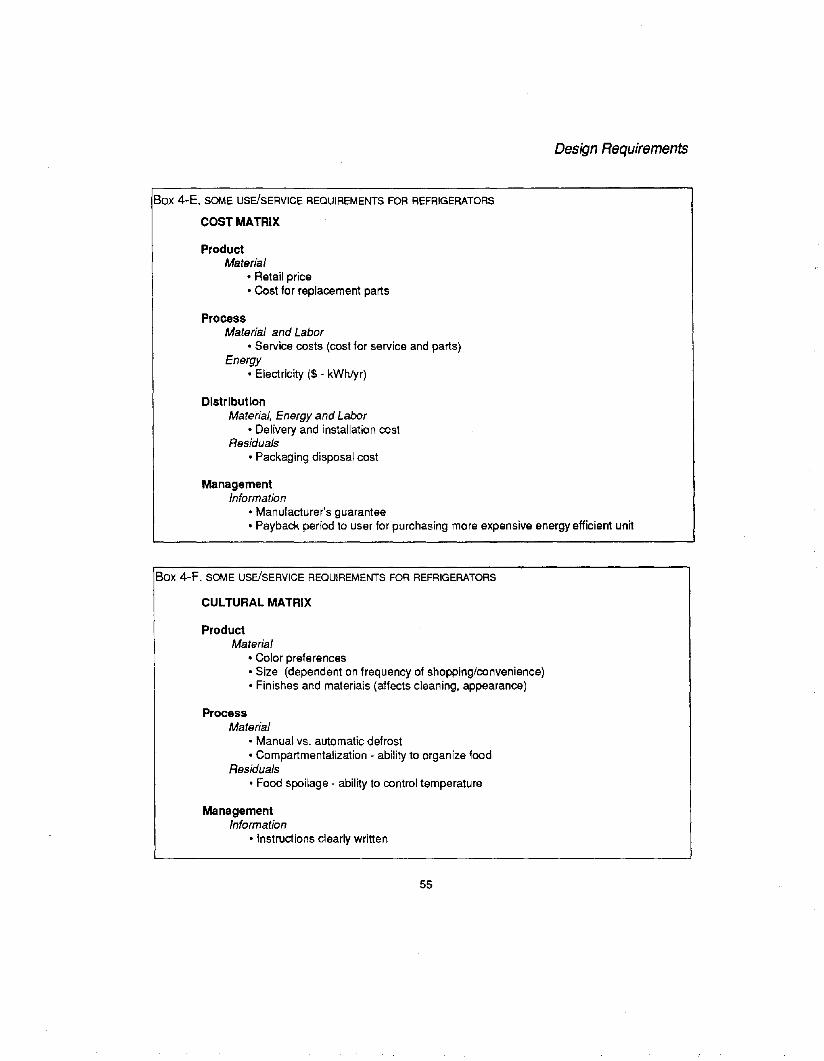
Design Requirements
Box 4-E. SOME USE!SERVICE REQUIREMENTS FOR REFRIGERATORS
COST MATRIX
ProductMaterial
• Retail price• Cost for replacement parts
ProcessMaterial and Labor
• Service costs (cost for service and parts)Energy
• Electricity ($ - kWhlyr)
DistributionMaterial, Energy and Labor
• Delivery and installation costResiduals
• Packaging disposal cost
ManagementInformation
• Manufacturer's guarantee• Payback period to user for purchasing more expensive energy efficient unit
Box 4-F. SOME USE!SERVICE REQUIREMENTS FOR REFRIGERATORS
CULTURAL MATRIX
ProductMaterial
• Color preferences• Size (dependent on frequency of shopping/convenience)• Finishes and materials (affects cleaning, appearance)
ProcessMaterial
• Manual vs. automatic defrost• Compartmentalization - ability to organize food
Residuals• Food spoilage - ability to control temperature
ManagementInformation
• Instructions clearly written
55

Chapter 4
Box 4-G. SOME USE/SERVICE REQUIREMENTS FOR REFRIGERATORS
LEGAL MATRIX
ProductMaterial
• Consumer Product Safety Commission• Montreal Protocol for discontinuing the use of CFCs.• TSCA (Refrigerants meet regulations for use)
ProcessEnergy
• National Appliance Energy Conservation Act-January 1, 1993 (maximum energyconsumption rate = E = 16.0 AV + 355 kWhlyr (AV = adjusted volume of topmounted refrigerator))
DistributionResiduals
• Packaging: German Take Back Legislation; Community recyclingordinance
ManagementInformation
• FTC guidelines on environmental claims• DOE labeling requirements for energy efficiency
56

4.3 RANKING AND WEIGHING
Organizing
When the review process concludes that all necessary functions ofthe design have been described and false assumptions or omissions havebeen avoided, priority should be assigned to the various requirements.Ranking and weighting distinguishes between critical and merely desirable traits. After assigning requirements a weighted value, they shouldbe ranked and separated into several groups. An example of a usefulclassification scheme follows:
• Must requirements are conditions that designs have to meet. Nodesign is acceptable unless it satisfies all must requirements.
• Want requirements are less important, but still desirable traits.Want requirements help designers seek the best solution, not justthe first alternative that satisfies mandatory conditions. Thesecriteria playa critical role in customer acceptance and perceptions of quality.
• Ancillary functions are low-ranked in terms of relative importance. They are relegated to a wish list. Designers should beaware that such desires exist. But ancillary functions should onlybe expressed in design when they do not compromise more critical functions. Customers or clients should not expect designs toreflect many ancillary requirements.
Once must requirements are set, want and ancillary requirementscan be assigned priority. There are no simple rules for weighting requirements. Assigning priority to requirements is always a difficulttask, because different classes of requirements are stated and measuredin different units. Judgements based on the values of the design teammust be used to arrive at priorities.
The process of making trade-offs between types of requirements isfamiliar to every designer. Asking How important is this function to thedesign? or What is this function worth (to society, customers, suppliers,etc.)? is a necessary exercise in every successful development project.
Even when all team members actively help set priorities, there is noguarantee that final requirements will accurately reflect project objectives. As an example, customers or other life cycle players may claimthat virtually everything they want is absolutely necessary. Similarly,
57
Design Requirements
Ranking and weightingdistinguishes betweencritical and merelydesirable traits.
There are no simple rulesfor weighting requirements.Assigning priority torequirements is always adifficult task, becausedifferent classes ofrequirements are statedand measured in differentunits.
Chapter 4
The ranking process helpsdesigners be moreproductive by definingwhere the design effortshould be concentrated.
Development teams canexpect conflicts betweenrequirements. Theabsence of conflictsusually indicates thatrequirements are definedtoo loosely.
some team members might strongly favor requirements in their ownarea of expertise while downgrading others. Cooperation during the requirements phase helps reduce these difficulties.
Systematic methods for decision making can assist the design teamwith vital ranking duties. Two commonly used decision-making methods are briefly presented in Appendix D.
After requirements have been ranked, an assessment of the resultswill reveal how successful the development team has been in properlydefining the expected project outcome. This ranking process helps designers be more productive by defining where the design effort shouldbe concentrated.
Most design projects seek to reduce requirements to minimum. Alimited set of design functions is easier to understand and translate intofinal products. However, this necessary duty should not be carried toexcess. Design may be easier with few requirements, but the resultingproduct is more likely to fail because critical functions have been overlooked.
Resolving Conflicts
Development teams can expect conflicts between requirements. Ifconflicts cannot be resolved between must requirements, there is no solution space for design. When a solution space exists but it is so restricted that little choice is possible, must requirements may have beendefined too narrowly. The absence of conflicts usually indicates that requirements are defined too loosely. This produces cavernous solutionspaces in which virtually any alternative seems desirable. Under suchconditions, there is no practical method of choosing the best design.
In all of these cases, design teams need to redefine or assign newpriorities to requirements. If careful study still reveals no solution spaceor a very restricted one, the project should be abandoned. It is also riskyto proceed with overly broad requirements. Only projects with practical, well-considered requirements should be pursued. Successful requirements usually result from resolving conflicts and developing newpriorities that more accurately reflect customer needs.
58
Design Requirements
CONFLICTS .... .•
Substituting plastics for steel in automobiles may produce conflicts bet~eo . . .requirements for fuel economy, safety, solid waste generation, and durability. This ..example will focus on fuel economy and solid waste. Reduction in vehicl~ size and weight·account for roughly half the improvement inriew ear fuel economy achieved since 1974
. (fuel economy increased from 14 mpg in 1973 to 28 mpg in.1991). A10% weight reductionresu~sin an estimated 7% increase in fuel economy ootne highway and a 4% ..•.. ...• .... .improvement in the city [8}. An increased number ofparts made of plastic ratherthan steel···.helped drive some of this decline in vehicle weight. Reduction in material Intensiveness .and downsizing are also responsible for weight reduction. The curb weight of ari average·.car declined 25% since 1974, from over 4,100 Ibs to about 3100100. [9} Plastics are.estimated to account for 7% of totCilautomobile weight, or abOut 230 pounds. .
Although plastics help reduce vehicle weight, many automotive plastics are notrecovered at present. Plastic use thus contributes to increased solid waste generation ondisposal. The plastic content of automobile shredder residue or ''fluff" has been increasing. .steadily. If plastics cannot be practically recovered before or during shredding, increasedplastic content in automobile hulks could make shredding uneconomical, especially if fluff isclassified as a hazardous waste. Without shredding operations, waste produced from autodisposal will greatly increase. .
59
Chapter 4
References
1. Gause, Donald G., and Gerald M. Weinberg. 1989. Requirem£nts: QualityBefore Design. New York: Dorset House.
2. Oakely, Mark. 1984. Managing Product Design. New York: Wiley3. Hollins, Bill. 1989. Successful Product Design: What to Do and When. Bos
ton: Butterworth.4. Fabrycky, Wolter J. 1987. Designing For the Life Cycle. Mechanical Engi
neering 109 (1): 72-74.5. Boehm, Barry W. 1981. Software Engineering Economics. Englewood
Cliffs, NJ: Prentice-Hall.6. Municipal Solid Waste Task Force. 1989. The Solid Waste Dilemma: An
Agendafor Action, US EPA Office of Solid Waste, Washington, DC.7. Allen, Frank Edward. 9 December 1991. Few Big Finns Get Jail Time for
Polluting. The Wall Street Journal, B, 1.8. Bleviss, Deborah L. 1988. The New Oil Crisis and Fuel Economy Technolo
gies. Westport CT: Quorum Books.9. National Highway Traffic Safety Administration. 1991. Automotive Fuel
Economy Program, Fifteenth Annual Report to Congress, US Departmentof Transportation, Washington, DC.
60
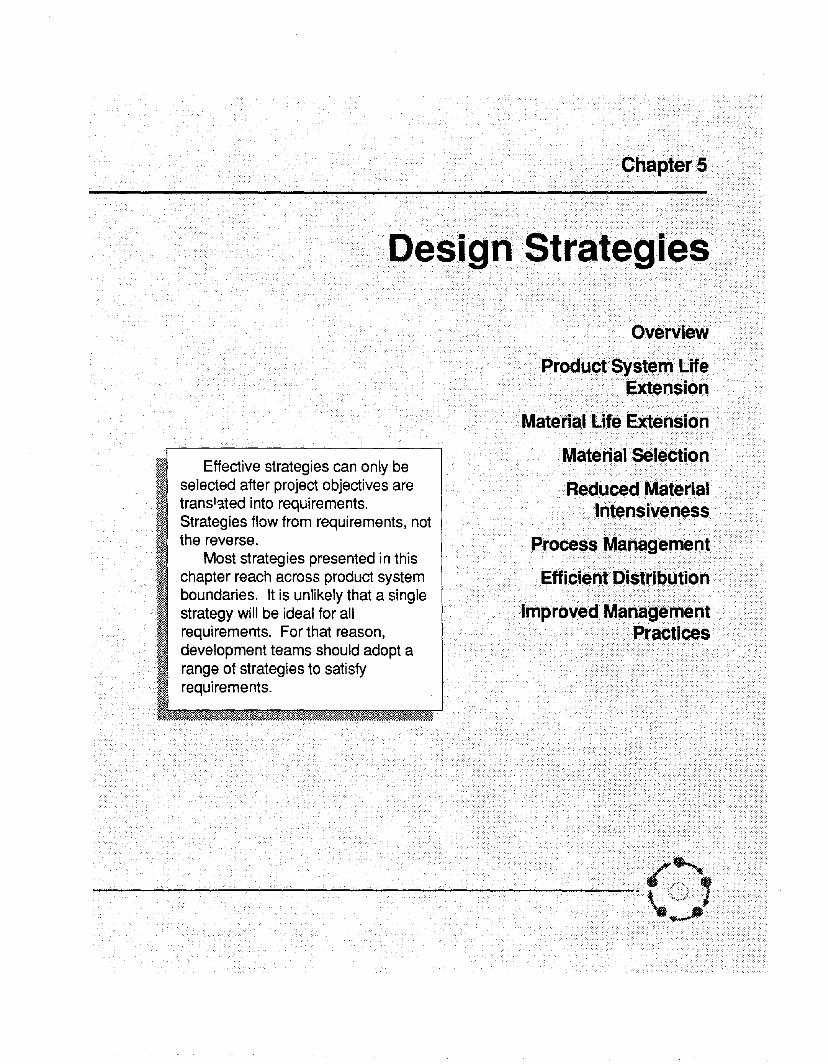
Overview
Chapter 5
.' :'::.:':- ,' ..,,', :,<:: ,":: ....<-', ... -:::-.-: - .
Reduced MaterialIntensiveness
:>,: ....... ::'::,..>:<:::,'::-':./:<:::::..:::
Material selection
':'<:,:-::>-:.::....,::"'>.:' <:....:... :::. ":-:"- :.:::::--:'".", ,- ..
Process Management •.
Efficient DistriblJtion.
:, ,,:::::::::,:.,: ":-'"'' :.:.:.: ... -:. ",';:::'::::,-,:.'.;.. /:
.. Material Life Extension
I
::.:":,":':' ',:" :"'::"'" ,-:-:", '.:-:': >: ,','::::',:-,'-:':::::>:-:'.::::::::>, ,--.'.' ',-.':;:-,".:. ,:-, ':-.':.' ,:,:':,: ,,::, ,':,":.:',: <:<:"',:::::':"-.", ',':"-:.-,.,.
Design Strategies
M Effective strategies can only be
I~~;§:~~~~~E~~~::::enot~: Most strategies presented in thisI chapter reach across product system$.; boundaries. It is unlikely that a single
I:~:~~~\~~~~~~~rr:~son,~! development teams should adopt a~J range of strategies to satisfy
requirements.
.............~.
~~,'----------------~..\.~
ChapterS
Effective strategies canonly be selected afterproject objectives aretranslated intorequirements. Deciding ona course of action beforethe destination is knowncan be an invitation todisaster. Strategies flowfrom requirements, not thereverse.
Shortcuts for low-impactdesigns may focus on afavorite strategy, such asrecycling. In life cycledesign, no correct answeris assumed for all projects.Appropriate strategiessatisfy the entire set ofdesign requirements.
One strategy is not likelyto satisfy the full set ofrequirements. For thatreason, most developmentprojects should adopt arange of strategies.
DESIGN STRATEGIES
5.1 OVERVIEW
Presented by themselves, strategies may seem to define the goals ofa design project. But effective strategies can only be selected afterproject objectives are translated into requirements. Although it may betempting to pursue an intriguing strategy for reducing environmentalimpacts at the outset of a project, deciding on a course of action beforethe destination is known can be an invitation to disaster. Strategies flowfrom requirements, not the reverse.
Shortcuts for low-impact designs may focus on a favorite strategy,such as recycling. In life cycle design, no correct answer is assumedfor all projects.
Appropriate strategies satisfy the entire set of design requirements,thus promoting integration of environmental requirements into design.For example, essential product performance must be preserved when design teams choose a strategy for reducing environmental impacts. Ifperformance is degraded, the benefits of environmentally responsibledesign may only be illusory.
In addition, impacts on the health and safety of workers and customers must also be considered when choosing a strategy. Designteams need to investigate health and safety effects throughout the product life cycle so they can avoid inadvertently increasing these riskswhile pursuing other environmental goals.
The following general strategies may be followed to fulfill environmental requirements:
• Product System Life Extension• Material Life Extension• Material Selection• Reduced Material Intensiveness• Process Management• Efficient Distribution• Improved Management Practices
Most of these strategies reach across product system boundaries.Product life extension strategies can also be applied to equipment used
62
in processing, distribution, and management. Similarly, process designstrategies are not limited to manufacturing operations. They are also useful when product use depends on processes. For example, the drivetrain of an automobile functions like a miniature industrial plant with areactor, storage tanks, electric power generator, and process controlequipment. Process strategies can thus lower environmental impactscaused by automobile use.
The following sections present impact and risk reduction strategies.It is unlikely that a single strategy will be best for meeting all environmental requirements. One strategy is even less likely to satisfy the fullset of requirements. For that reason, most development projects shouldadopt a range of strategies. Examples offered here demonstrate specificstrategies; they do not necessarily illustrate the best life cycle designpractices.
5.2 PRODUCT SYSTEM LIFE EXTENSION
Extending the life of a product can directly reduce environmentalimpacts. In many cases, longer-lived products save resources and generate less waste, because fewer units are needed to satisfy the same needs.Before pursuing this strategy, designers should understand useful life.
Useful life measures how long a system will operate safely and meetperformance standards when maintained properly and not subject tostresses beyond stated limits [I]. Measures of useful life vary with function. Some common measures are:
• number of uses or duty cycles• length of operation (i.e. operating hours, months, years, or miles)• shelf life
The life of products such as clothes washers or switches that perform standard functions during each operation is best described by number of uses. This helps distinguish between two products of ef}ual agethat have experienced different numbers of duty cycles.
Length of operation is a more accurate method of defining usefullife for products that operate continually with little variation, such aswater heaters. Operating time also is the best measure for products withunpredictable duty cycles, such as light bulbs. Similarly, useful life ofautomobiles can be measured in miles driven.
Chemicals, adhesives, and some consumables can degrade beforethey perform any useful function. Shelf life may be the most appropriate measure of useful life for such products.
63
Design Strategies
Examples offered heredemonstrate specificstrategies; they do notnecessarily illustrate thebest life cycle designpractices.
Extending the life of aproduct can directlyreduce environmentalimpacts. In many cases,longer-lived products saveresources and generateless waste, because fewerunits are needed to satisfythe same needs.
ChapterS
A durable productcontinues to satisfycustomer needs over anextended life. Impactscaused by products shouldbe divided by estimateduseful life. Suchnormalized figures allowdesigners to properlycompare competingproducts.
Retirement is the defining event of useful life. Reasons why products are no longer in use include:
• technical obsolescence• fashion obsolescence• degraded performance or structural fatigue caused by normal
wear over repeated uses• environmental or chemical degradation• damage caused by accident or inappropriate use
A product may be retired for fashion or technical reasons, eventhough it continues to perform its design functions well. Clothing andfurniture are often retired prematurely when fashions change. Technicalobsolescence is common for electronic devices.
Users may also be forced to retire a product for functional reasons.Normal wear can degrade performance until the product no longerserves a useful purpose. Repeated use can also cause structural deformation and fatigue that finally result in loss of function.
Some products are exposed to a wide variety of environmental conditions that cause corrosion or other types of degradation. Such biologicalor chemical stresses can reduce performance below a critical level.This type of decay may also cause products to be retired for aestheticreasons, even though they continue to perform adequately.
Accidents or incorrect use also cause premature retirement. Poordesign or failure to consider unlikely operating conditions may lead to
accidents. Some of these events can be avoided through better operatinginstructions or warnings.
Understanding why products are retired helps designers extendproduct system life. To achieve a long service life, designs must successfully address issues beyond simple wear and tear. A discussion ofspecific strategies for product life extension follows.
Appropriately Durable
Durable items can withstand wear, stress, and environmental degradation over a long useful life.
A durable product continues to satisfy customer needs over an extended life. Some design actions may make a product more durablewithout the use of additional resources. However, enhanced durabilitymay depend on increased resource use. When this happens, impacts thatresult from using more resources should be divided by the estimated in-
64
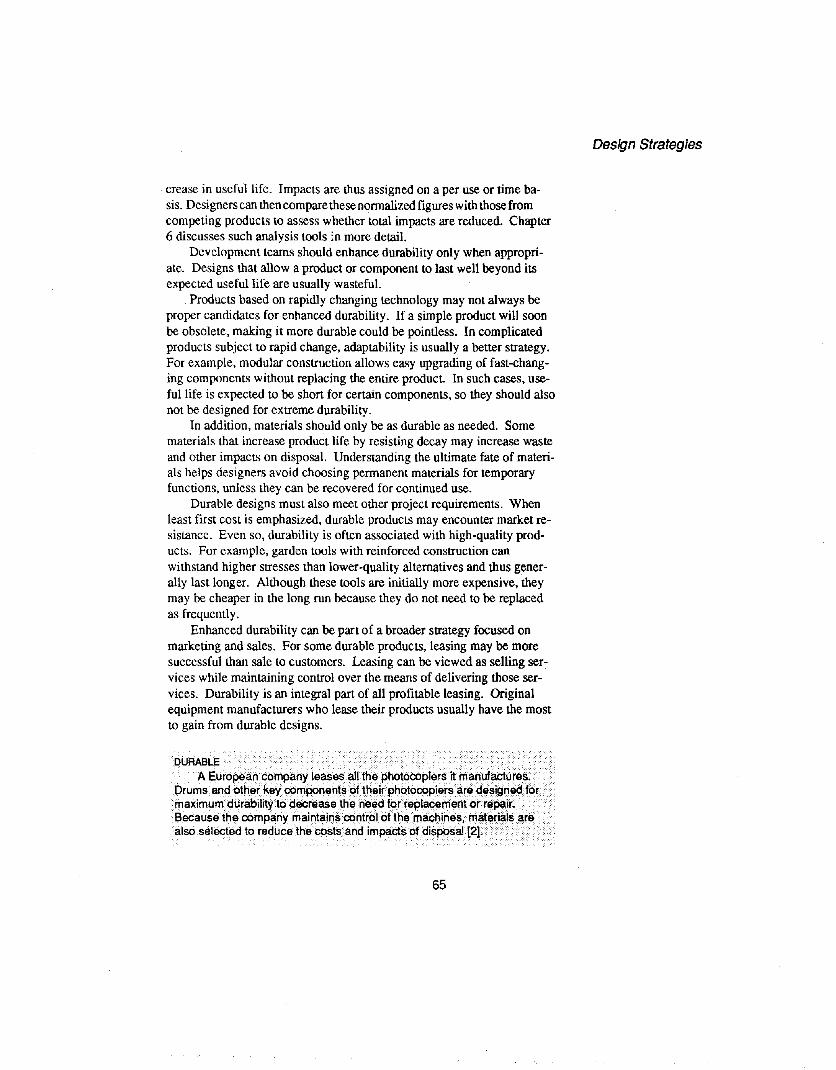
crease in useful life. Impacts are thus assigned on a per use or time basis. Designers can then compare these normalized figures with those fromcompeting products to assess whether total impacts are reduced. Chapter6 discusses such analysis tools ;n more detail.
Development teams should enhance durability only when appropriate. Designs that allow a product or component to last well beyond itsexpected useful life are usually wasteful.
Products based on rapidly changing technology may not always beproper candidates for enhanced durability. If a simple product will soonbe obsolete, making it more durable could be pointless. In complicatedproducts subject to rapid change, adaptability is usually a better strategy.For example, modular construction allows easy upgrading of fast-changing components without replacing the entire product. In such cases, usefullife is expected to be short for certain components, so they should alsonot be designed for extreme durability.
In addition, materials should only be as durable as needed. Somematerials that increase product life by resisting decay may increase wasteand other impacts on disposal. Understanding the ultimate fate of materials helps designers avoid choosing permanent materials for temporaryfunctions, unless they can be recovered for continued use.
Durable designs must also meet other project requirements. Whenleast first cost is emphasized, durable products may encounter market resistance. Even so, durability is often associated with high-quality products. For example, garden tools with reinforced construction canwithstand higher stresses than lower-quality alternatives and thus generally last longer. Although these tools are initially more expensive, theymay be cheaper in the long run because they do not need to be replacedas frequently.
Enhanced durability can be part of a broader strategy focused onmarketing and sales. For some durable products, leasing may be moresuccessful than sale to customers. Leasing can be viewed as selling services while maintaining control over the means of delivering those services. Durability is an integral part of all profitable leasing. Originalequipment manufacturers who lease their products usually have the mostto gain from durable designs.
DURABLE .. .. •. .•.•• .. . .
A European company leases all the photocopiers it manUfactures. .Drums and other key components of their photocopiers are designedJor .•..maximum durability to decrease the need for replacement or repair. ...Because the company maintains control of the machines, materialS are·also selected to reduce the costs and impacts of disposal [2]. .
65
Design Strategies
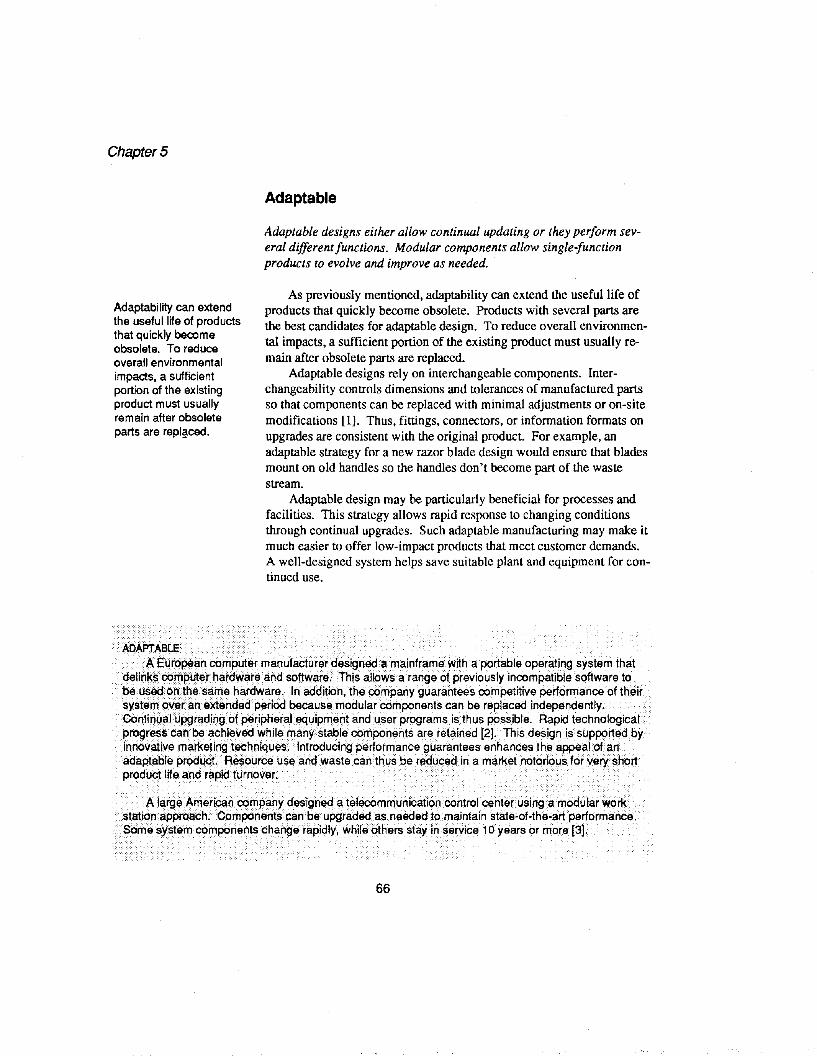
Chapter 5
Adaptable
Adaptable designs either allow continual updating or they perform several different functions. Modular components allow single1unctionproducts to evolve and improve as needed.
Adaptability can extendthe useful life of productsthat quickly becomeobsolete. To reduceoverall environmentalimpacts, a sufficientportion of the existingproduct must usuallyremain after obsoleteparts are repl~ced.
As previously mentioned, adaptability can extend the useful life ofproducts that quickly become obsolete. Products with several parts arethe best candidates for adaptable design. To reduce overall environmental impacts, a sufficient portion of the existing product must usually remain after obsolete parts are replaced.
Adaptable designs rely on interchangeable components. Interchangeability controls dimensions and tolerances of manufactured partsso that components can be replaced with minimal adjustments or on-sitemodifications [1]. Thus, fittings, connectors, or information formats onupgrades are consistent with the original product. For example, anadaptable strategy for a new razor blade design would ensure that bladesmount on old handIes so the handles don't become part of the wastestream.
Adaptable design may be particularly beneficial for processes andfacilities. This strategy allows rapid response to changing conditionsthrough continual upgrades. Such adaptable manufacturing may make itmuch easier to offer low-impact products that meet customer demands.A well-designed system helps save suitable plant and equipment for continued use.
::::<<:»--::-.: ':»::-<>.'.: >,:'.'. '<::-"''-' ..'>:- '::«><'--"-::'::::.,.-:.,': ::, •. ::.:<> ,". - --:' .-":: - :,'.'. ->:'
ADAPTABLE. ... . .... •
A European computer manufacturer designed *mainframe with a portable operating system thatdelinkscomputer hardware and software. This allows a range of previously incompatible software tobe used on the same hardware~ In addition, the company guarantees competitive performance of theirsystem over an extended pertod because modular components can be replaced independently.Continual upgrading ofperipheral equipment and user programs is thus possible. Rapid technological ..progress can be achieved while many stable components are retained [2J. This design is supported byinnovative marketing techniques~ Introducing performance guarantees enhances the appeal of anadaptable product. Resource use and waste can thus be reduced in a market notorious for very shortprodUct life and rapid turnover. .
.',c .. ',', .,' , __ -.-,., '.'.',',.. , .. , ' .. - .. -, , .. '" __ .. , ,',-',', .,' -.' '.',','.'., , ' , '... , .
. " ". , , , "...... . .., .
A large American company designed a telecommunication control center using a modular work. station approach. Components can be upgraded as needed to maintain state-of-the-art performance..
Some system components change rapidly, while others stay in service 10 years or more [3].
66
Design Strategies
Reliable
Reliability is often expressed as a probability. It measures the abilityof a system to accomplish its design mission in the intended environment for a certain period of time.
Reliability is a major aspect of quality. Reliable designs thus havea better chance for market success.
Environmental impacts are also related to reliability. Unreliableproducts or processes, even if they are durable, are often quickly retired.Customers will not tolerate untrustworthy performance, inconvenience,and expense for long. Unreliable designs can also present safety andhealth hazards.
The number of components, the individual reliability of components, and configuration are important aspects of reliability. Parts reduction and simplified design can increase both reliability andmanufacturability. Simpler designs may also be easier to service. Allthese factors can reduce resource use and waste. Aside from environmental benefits, producers and customers can save money with reliableproducts.
Reliability cannot always be achieved by reducing parts or makingdesigns simple. In some cases, redundant systems must be added toprovide needed backup. When a reliable product system requires parallel systems or fail-safe components, costs may rise significantly. As always, reliable designs must meet all other project requirements.
Reliability should be designed into products rather than achievedthrough later inspection. Screening out potentially unreliable productsafter they are made is wasteful because such products must either be repaired or discarded. In both cases, environmental impacts and costs increase.
Reliability is a majoraspect of quality.Unreliable products orprocesses, even if they aredurable, are often quicklyretired.
Reliability should bedesigned into productsrather than achievedthrough later inspection.
RELIABLE . . . . . .•.. ...•.. .•..• •.•. . .
A large American electronics firm disCovered that inanyphJ9"inboards onthedigital scOpeslt.. desigried failed in use. However; when1he bc>ards were returried for testing, 30%; stl<>wedno (f$feCts.
and were sent back customers. Some boards were returned repeatedly; onlytd pa.sstest5evety>time. Finally the cornpanydiscdvered that a bitof insulation on each o{Jhe prohlemboatds'''<
.. capacitorS was missing, producing a short when they were installed inlhe·sco~.. Jhe caul$ was ...•.••..•.•••... insUfficient clearance between the board and the chassis of the scdpe; each timetileboard waS ....•.•.....•.....
•• . installed itsbrapedagainst the side of theinsti'ument..· Fil1dingthe problem·waS difficult and ••• > •...•••.••
...• expensive. Preventing it duringdesiQn by more thoroughly examining fitandclearalice wduldhave ...•.••.•.. been much simpler and less costly [4]. . . ..
67
ChapterS
When designingserviceable products, theteam should first determinewho will provide theservice.
serviceable
A serviceable system can be adjusted for optimum performance undercontrolled conditions. This capacity is retained over a specified life.
Many complex products designed to have a long useful life requireservice and support. When designing serviceable products, the teamshould fIrst determine who will provide the service. Any combinationof original equipment manufacturers, dealers, private business, or customers may service a product. Designers should target service needs tothe appropriate group. Types of tools and the level of expertise neededto perform tasks strongly influences who is capable of providing service.In any case, simple procedures are an advantage.
Design teams should also recognize that equipment and an inventory of parts are a necessary investment for any service network. Service activities may be broken into two major categories: maintainabilityand repairability.
MaintainableThe relative difficulty or time required to maintain a certain level of system performance determines whether that system can be practicallymaintained.
Maintenance includes periodic, preventative, and minor correctiveactions. Proper maintenance helps to conserve resources and preventpollution. For example, tuning an automobile engine improves fueleconomy while reducing toxic tailpipe emissions. On the other hand,delaying or ignoring maintenance can damage a product and shorten itsuseful life.
Designers wishing to create product systems that are easy to maintain should address the following topics:
• downtime, tool availability, personnel skills• complexity of required procedures• potential for error• accessibility to parts, components, or system to be maintained• frequency of design-dictated maintenance
This is not an exhaustive list, but it identifIes some key factors affecting maintenance. Most of these criteria are interrelated. If maintenance is complex, specialized personnel are required, downtime is likely
68
to be long, and the potential for error increases. Speciality tools alsomake maintenance less convenient
Similarly, if parts or components are not readily accessible, complexity and costs can increase. Spatial arrangement is the key to easy access. Critical parts and assemblies within a piece of equipment should beplaced so they Can be reached and the necessary procedures performed.Simpler designs are usually easier to maintain.
Maintenance schedules should balance a variety of requirements.For an automobile, changing motor oil every 500 miles would obviouslybe wasteful, but changing oil every 50,000 miles would damage the engine. Customers usually believe that the less often maintenance is required the better, so designs that preserve peak performance withminimal maintenance are likely to be more popular. In addition, lowmaintenance designs are more likely to stay in service longer than lessrobust designs. Products dependent on continual readjustments for an acceptable level of performance are generally considered low-quality.Such products can be wasteful, and they are not likely to gain much market share.
RepairableRepairability is determined by the feasibility of replacing dysfunc
tional parts and returning a system to operating condition.
A two-step process is usually followed when a product needs repair.First, a diagnosis identifies the defect. Then, several questions critical toresource management should be asked:
• Should the product be repaired or retired?• Are other components near the end of their useful life and likely to
fail soon?• Should the defective component be replaced with anew,
remanufactured, or used part?
Answers to these questions should take into account life cycle consequences.
Factors relating to downtime, complexity, and accessibility are asimportant in repair as they are in maintenance. Easily repaired productsalso rely on interchangeable and standard parts. Interchangeability usually applies to parts produced by one manufacturer. Standardization refers to compatible parts made by different manufacturers.Standardization makes commonly used parts and assemblies conform toaccepted design standards [1].
69
Design Strategies
ChapterS
Industrial equipment orother expensive products.not subject to rapid changeare the best candidates forremanufacture.
Use of standard parts designed to codes established by numerousmanufacturers greatly aids repair. Designs that feature unique dimensions for common parts can confound nonnal repair efforts. Specialityparts usually require expanded inventories and extra training for repairpeople. In the burgeoning global marketplace, following proper standards enables practical repair.
Cost also detennines repairability. If nonnal repair is too expensive, practical repairability does not exist. Labor, which is directly related to complexity and accessibility, is a key factor in repair costs.When labor is costly, only relatively high-value items will be repaired.However, a substantial purchase price is not enough to promote repairability. Designs that impede repair may still be retired prematurely regardless of initial investment. As in maintenance, infrequent need, easeof intervention, and a high probability of success lower operating costs,increase customer satisfaction, and translate directly into perceptions ofhigher quality.
Repairable designs need proper after-sale support. Firms should offer infonnation about trouble-shooting, procedures for repair, tools required, and the expected useful life of components and parts.
Remanufacturable
Remanufacturing is an industrial process that restores worn products tolike-new condition. In afactory. a retired product isftrst completelydisassembled. Its usable parts are then cleaned, refurbished, and putinto inventory. Finally, a new product is reassembled from both old andnew parts, creating a unit equal in performance and expected life to theoriginal or a currently available alternative. In contrast, a repaired orrebuilt product usually retains its identity. and only those parts that havefailed or are badly worn are replaced [5].
Industrial equipment or other expensive products not subject torapid change are the best candidates for remanufacture. Typicalremanufactured products include jet engines, buses, railcars, manufacturing equipment, and office furniture. Viable remanufacturing systemsrely on the following factors [6]:
• a sufficient population of old units (cores)• an available trade-in network• low collection costs• storage and inventory infrastructure
70
Design Strategies
Design teams must first determine if enough old units will exist tosupport remanufacturing. Planning for proper marketing and collectionafter retirement helps ensure a sufficient population of cores. To remaincompetitive with new products, the cost of cores must be low. Costs forcollecting cores includes transport and a trade-in to induce customer return.
Systems for collecting and storing the needed number of cores atcompetitive prices support remanufacturing. But no remanufacturingprogram can succeed without design features and strategies such as:
• ease of disassembly• sufficient wear tolerances on critical parts• avoiding irreparable damage to parts during use• interchangeability of parts and components in a product line
Designs must be easy to take apart if they are to be remanufactured.Adhesives, welding, and some fasteners can make this impossible.Critical parts must also be designed to survive normal wear. Extra material should be present on used parts to allow refinishing. Care in selecting materials and arranging parts also helps avoid excessive damageduring use. Design continuity increases the number of interchangeableparts between different models in the same product line. Common partsmake it easier to remanufacture products.
REMANUFACTURING .. . ... . . ....A Midwestern manufacturer couldn't afford to replace all its 13 aging plastic molding machines
with new models, so it chose to remanufacture 8 molders for one-third the cost of new machines.The company also bought one new machine at the same time. The remanufactured machinesincreased efficiency by 10-20% and decreased scrap output by 9% compared to the old $quipment;performance was equal with the new molder. Even with updated controls, operatorfamiliarltywith ....the remanufactured machines and use Of existing foundations and plumbing funher rllduced cOsts of·.the remanufactured molders [7}. . . .
.", "" ,- ,.- .. " "":':->,' -':,:,':'::'::':::.-:::-'-':'"::--'. -" ,.- ",.
An original equipment manufacturer of jet engines also provides remanufactured engines tocustomers. Remanufactured engines cost $900,000 plus trade-in compared to $1;6 million fora newengine. Fuel efficiency in the remanufactured engine is 4% better than new engine specifications,yielding an annual fuel savings of 92,000 gallons, based on average aircraft use 16]~ ..
. " ,,- " , .. ,. ,-,.
71
Chapter 5
Products only becomereusable when a singleuse alternative exists.
The environmental profileof a reusable product doesnot always depend on thenumber of expected uses.If the major impacts occurbefore reuse, increasingthe number of uses willreduce total environmentalimpacts. However, whenmost impacts occurbetween uses, increasingthe number of duty cyclesmay have little effect onimpacts.
Reusable
Reuse is the additional use ofan item after it is retiredfrom a clearlydefined duty. Reformulation is not reuse. However, repair, cleaning, orrefurbishing to maintain integrity may be done in transition from oneuse to the next. When applied to products, reuse is a purely comparativeterm. Products with no single-use analogs are considered to be in service until discarded.
Products only become reusable when a single-use alternative exists.Before the advent of disposable diapers, cloth diapers were not reused asdefined above. Rather, they were laundered after wearing, like otherclothes. Similarly, cameras were originally in use until disposal. Theyonly became reusable when a camera designed to expose just one roll offilm was marketed. Finally, parts in a product may be reused regardlessof how the entire product is defined. So, although an automobile is notreused each time it is driven or changes owners, its parts may be recovered for reuse when it is finally retired.
Items that will be reused must rust be collected after completingtheir function. They are then returned to the same or less demandingservice without major alterations. Reusable products may undergo someminor processing, such as cleaning, between services. For example,dishware or glass bottles can be washed before reuse.
The environmental profile of a reusable product does not always depend on the number of expected uses. If the major impacts occur inmanufacturing and earlier stages, increasing the number of uses will reduce total environmental impacts. However, when most impacts arecaused by cleaning or other steps between uses, increasing the numberof duty cycles may have little effect on overall impacts.
Convenience is often cited as a major advantage of single-use products. However, customers usually fail to consider the costs and time ofpurchasing, storing, and disposing single-use products. Single-use products often cost more per use than reusable products.
Several environmental comparisons between reusable and singleuse products have been done. These are mostly confined to life cycleinventories, which are discussed in the next chapter. Appendix A alsoprovides references of such life cycle analyses. Results are sometimescontroversial, but these studies can be consulted by designers exploringa reuse strategy.
72
Design Strategies
5.3 MATERIAL LIFE EXTENSION
Recycling
Recycling is the reformation or reprocessing of a recovered material.The EPA defines recycling as, "the series ofactivities, includingcoliection, separation, and processing, by which products or other materialsare recoveredfrom or otherwise diverted from the solid waste streamfor use in the form of raw materials in the manufacture ofnew productsother than fuel" [11] .
Many designers, policy makers, and consumers believe recycling isthe best solution to a wide range of environmental problems. Recyclingdoes divert discarded material from landfills, but it also causes other impacts. Before designers focus on making products easier to recycle, they
Recycling divertsdiscarded material fromlandfills, but it also causesother impacts. Beforedesigners focus on makingproducts easier to recycle,they should understandseveral recycling basics.
. ,- -,- .
REUSABLE OESIGN. ...• . . ... ••••..•••••••••••••.••••••.. • i.. .......>.... . ..... iiA large supplier of industrial solvents designed back-flush filters that could be reusedmanytimes.The new design replaced single-use filters for sOrne of their on-site equipment .Installing baCk- .flush filters caused an immediate reduction in waste generation, but furthe(informationabOl.lt theenvironmental impacts associated with the entire multiple-use filter system. isnecessarytc> propeflycompare it to the impacts of single-usefilters{8}: . . .
THE OPPOSITE STRATEGY: CREATING A NEW SINGLE-USE PROOUCTA large American manufacturer designed.an inexpensivecamefatobe di~cardedafteLit$roll
offilm was exposed.<In .reaction to negative publicity,themanufaeturerslightly m()difieditsfilrndevelopment network to ensure that both camera and filmwerereturnedafteruse.SOm~ofthEl
material in the camera is now recycled or reused (9). Thisi$.animprovern~ntonhe()rjginaldesign
implementation, buUt is not likely to redress the higherenvironmehtalimpaclS thatJ\1l;lyhaveoccurred by .substitutingasingle-use alternative for a I()ng-Iive<:lprc>duct.
REUSEDERA1LEDTHENREVIVED . .....•.. . . •.•....•...•. .•.. ....•............•...AJoreign manufacturer of laserprintersdiscoveredthatathrivingserviCEI business Outside
their aUthorized dealer network hadsprung .uptorefill spentcartridges withtoher.lr\deperidentcompanies offering these low-priced refills extended the life oforiginalcartriclgesto many servicecycles rather than ()ne.• Instead of focusing· of) tonersalesahd a refrllingihftastF®tureofjtsown, ....•the company designed a•new toner for orig inalcartridgesthat wassJightly abrasil/e and trylJS .....destroyed the cartridge drum, precluding reuse [9}. Afterr~eivingnegativepublicityf()rf()r'C:ing
spentcartridges to be disPosed in lahdfillsafterasingle uSe,Jhecompany changed itspoliey. .Inthemeahtime, ••ariyal·companydesignecl ••its.laser.pdnterswlth.refillableC<irtridg~s· •• Their
product.extends.·printElrlif~•.by.c9ating.the••.machine·s·drurrt••withsilicon••and. using.•toner.f()rmul~ted····.·to continuously clean the drum. Printouts costs less than onecsnt pefpagElcompared to threecants for a typica.l laser printer [10}.
73
ChapterS
Preconsumer material isusually high quality.Postconsumer material isoften a much lessdesirable input forsubsequent products.
should understand several recycling basics. Types of recovered material, pathways, and infrastructure provide a framework for understandingrecycling.
TypeS of Recycled MaterialMaterial available for recycling can be grouped into the following
three classes:
• home scrap• preconsumer• postconsumer
Home scrap consists of materials and by-products generated andcommonly recycled within an original manufacturing process [11].Many materials and products contain home scrap that should not be advertised as recycled content. For example, mill broke (wet pulp and fibers) is easily added to later batches of product at paper mills. Thismaterial has historically been used as a pulp substitute in paper makingrather than discarded, so it is misleading to consider it recycled content.
Preconsumer material consists of overruns, rejects, or scrap generated during any stage of production outside the original manufacturingprocess [11]. It is generally clean, well-identified, and suitable for highquality recovery. Preconsumer material is now recycled in many areas.
Postconsumer material has served its intended use and been discarded before recovery. Although many people believe recycling is apostconsumer activity, postconsumer material can be a relatively lowquality source of input for future products.
Recycling PathwaysDevelopment teams choosing recycling as an attractive way to meet
requirements should be aware of the two major pathways recycled material can follow.
• closed loop• open loop
In closed-loop systems, recovered materials and products are suitable substitutes for virgin material. They are thus used to produce thesame part or product again. Some waste is generated during each reprocessing, but in theory a closed-loop model can operate for an extendedperiod of time without virgin material. Of course, energy, and in somecases process materials, are required for each recycling.
74
Solvents and other industrial process ingredients are the most common materials recycled in a closed loop. Postconsumer material is muchmore difficult to recycle in a closed loop, because it is often degraded orcontaminated. Designs that anticipate closed-loop recycling of suchwaste may thus overstate the likely benefits.
Open-loop recycling occurs when recovered material is recycled oneor more times before disposal. Most postconsumer material is recycledin an open loop. The slight variation or unknown composition of suchmaterial usually causes it to be downgraded to less demanding uses.
Some materials also enter a cascade open-loop model in which theyare degraded several times before final discard. For example, used whiteledger paper may be recycled into additional ledger or computer paper.If this product is then dyed or not de-inked, it will be recycled as a mixedgrade after use. In this form, it could be used for paperboard or packing,such as trays in produce boxes. At present, the fiber in these products isnot valuable enough to recover. Ledger paper also enters an open-loopsystem when it is recycled into facial tissue or other products that aredisposed after use.
InfrastructureTypes of recycled materials, and the major routes they follow pro
vide an introduction to recycling. Infrastructure is the key to understanding how recycling actually occurs. Suitable programs must be in placeor planned to ensure the success of any recycling system. Key considerations include:
• recycling programs and participation rates• collection and reprocessing capacity• quality of recovered material• economics and markets
It is not enough to choose materials advertised as recyclable. Suchmaterials may be suitable for theoretical products but little else if recycling programs do not exist. As a first step, people must have access torecycling. When available, recycling programs vary from frequentlyscheduled curbside collection to public drop-off sites. In most cases,convenience leads to greater participation rates. Industrial recycling alsodepends on ease and cost. Recycling may be more likely when it can bedone in-house, rather than through off-site transfers. Information aboutparticipation rates helps designers predict the fate of retired materials.
Collection and reprocessing systems are needed to support recycling.Estimates of present and future capacity should be made in regions
75
Design Strategies
It is not enough to choosematerials advertised asrecyclable. Suchmaterials may be suitablefor theoretical productsbut little else if recyclingprograms do not exist.
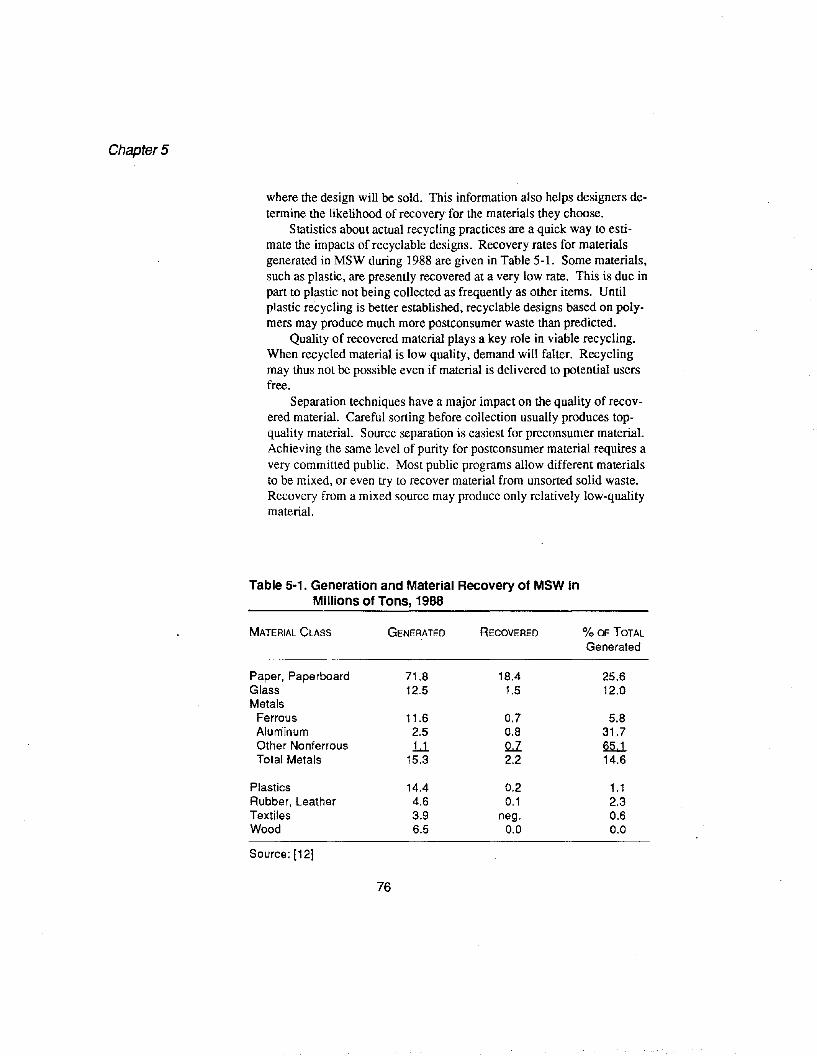
Chapter 5
where the design will be sold. This information also helps designers determine the likelihood of recovery for the materials they choose.
Statistics about actual recycling practices are a quick way to estimate the impacts of recyclable designs. Recovery rates for materialsgenerated in MSW during 1988 are givenin Table 5-1. Some materials,such as plastic, are presently recovered at a very low rate. This is due inpart to plastic not being collected as frequently as other items. Untilplastic recycling is better established, recyclable designs based on polymers may produce much more postconsumer waste than predicted.
Quality of recovered material plays a key role in viable recycling.When recycled material is low quality, demand will falter. Recyclingmay thus not be possible even if material is delivered to potential usersfree.
Separation techniques have a major impact on the quality of recovered material. Careful sorting before collection usually produces topquality material. Source separation is easiest for preconsumer material.Achieving the same level of purity for posteonsumer material requires avery committed public. Most public programs allow different materialsto be mixed, or even try to recover material from unsorted solid waste.Recovery from a mixed source may produce only relatively low-qualitymaterial.
Table 5·1. Generation and Material Recovery of MSW InMillions of Tons, 1988
MATERIAL CLASS GENERATED RECOVERED % OF TOTALGenerated
Paper, Paperboard 71.8 18.4 25.6Glass 12.5 1.5 12.0Metals
Ferrous 11.6 0.7 5.8Aluminum 2.5 0.8 31.7Other Nonferrous 1..1 Q.I 2UTotal Metals 15.3 2.2 14.6
Plastics 14.4 0.2 1.1Rubber, Leather 4.6 0.1 2.3Textiles 3.9 neg. 0.6Wood 6.5 0.0 0.0
Source: [12]
76
In addition, products or components made of several different materials, each practically recyclable by itself, may present problems. Suchproducts can be impossible to recycle unless individual materials are segregated after retirement. The recycling rate of several materials combined in a single item is almost never additive. Because many mixedmaterial products are composites, or joined in a complex manner, theycannot easily be recycled.
Economic and market factors finally determine whether a materialwill be recycled. Markets for some secondary materials may be easilysaturated. Recycling programs and high rates of participation addressonly collection; unless recovered material is actually used, no recyclinghas occurred.
In addition, if a material is not one of the few now targeted for public collection, recovery could be difficult. It may not be possible to create a private collection and reprocessing system that competes withvirgin materials. However, if demand for recovered material increases inthe future, this will greatly aid collection efforts.
DeSign ConsiderationsRecycling can be a very effective resource management tool. Under
ideal circumstances, most materials would be recovered many times untilthey became too degraded for further use. Even so, design forrecyclability is not the ultimate strategy for meeting all environmental requirements. As an example, studies show that refillable glass bottles usemuch less life cycle energy than single-use recycled glass to deliver thesame amount of beverage [13].
When suitable infrastructure appears to be in place, or the development team is capable of planning it, recycling is enhanced by:
• ease of disassembly• material identification• simplification and parts consolidation• material selection and compatibility
Products may have to be taken apanafter retirement to allow recovery of materials for recycling. However, easy disassembly may conflictwith other project needs. As an example, snap-fit latches and otherjoinings that speed assembly can severely impede disassembly. In someproducts, easy disassembly may also lead to theft of valuable components.
Material identification markings greatly aid manual separation andthe use of optical scanners. Standard markings are most effective whenthey are well-placed and easy to read. Symbols have been designed by
77
Design Strategies
Recycling can be a veryeffective resourcemanagement tool. Evenso, design for recyclabilityis not the ultimate strategyfor meeting allenvironmentalrequirements.
ChapterS
Waste exchange can beconsidered a form ofrecycling. Wasteexchange is a computerand catalog network thatreturns waste materials tomanufacturing bymatching companiesgenerating specific wasteswith companies that canuse those wastes asinputs.
the Society of the Plastics Industry (SPI) for commodity plastics. TheSociety of Automotive Engineers (SAE) has developed markings for engineered plastics. Of course, marked material must still be valuable andeasy to recover or it will not be recycled. In addition, labeling may notbe useful in systems that rely on mechanical or chemical separation, although it can be a vital part of collection systems that target certain materials or rely on source separation.
Simplification and parts consolidation can also make productseasier to recycle. This is an attractive strategy for many other reasons.As previously mentioned, simple designs also ease assembly and maylead to more robust, higher-quality products.
In most projects, material selection is not coordinated with environmental strategies. As a result, many designs contain a bewilderingnumber of materials chosen for combined cost and performance attributes. There may be little chance of recovering material from suchcomplex products unless they contain large components made of asingle, practically recyclable material.
When one type of material cannot be isolated in discrete design features, recycling is more likely if all the materials in the feature are compatible. During reprocessing, compatible materials present in moderateamounts do not act as serious contaminants in the final product. Automobile recycling provides a useful example of compatible materials.Steel rolled into thin sheets for auto bodies must be formulated withinrelatively narrow tolerances. If some ingredients change modestly during recycling, secondary steel can only be used for casting or other lessdemanding duties. Because aluminum acts as a flux in steel making, itis compatible for recycling when present in moderate amounts. Recycled steel that contains some aluminum can usually still be used forsheeting. On the other hand, copper and tin produce brittleness in steel.Small amounts of copper or tin in recycled steel make it unsuitable forsheeting. Of course, many other criteria need to be considered beforemaking a design choice based solely on compatibility.
Some polymers and other materials are broadly incompatible. Ifsuch materials are to be recycled for similar use again, they need to bemeticulously separated for high purity.
Even without separation, some mixtures of incompatible or specialty materials can be downcycled. At present, several means are available to form incompatible materials into composites. However, theresulting products, such as plastic lumber, may have limited appeal.
Designers can aid recycling by reducing the number of incompatiblematerials in a product. For example, a component containing parts composed of different materials could be designed with parts made from the
78
same material. This strategy also applies within material types. Formulations of the same material might have such different properties thatthey are incompatible during recycling. Designers will usually have tomake trade-offs when selecting only compatible materials for a product.Making single-material or compatible components may be possible insome cases but not in others.
5.4 MATERIAL SELECTION
Because material selection is a fundamental part of design, it offersmany opportunities for reducing environmental impacts. In life cycledesign, material selection begins by identifying the nature and source ofraw materials. Then environmental impacts caused by material acquisition, processing, use, and retirement are estimated. Depth of analysis,and the number of life cycle stages considered varies with project scope.Finally, proposed materials are compared to determine best choices.
When designing modest improvements of existing products or thenext generation of a line, material choice may be constrained. Designersmay also be restricted to certain materials by the need to use existingplant and equipment. This type of process limitation can even affectnew product design. Substantial investment may then be needed beforea new material can be used. On the other hand, material substitutionsmay fit current operations and actually reduce costs. In either case, material choice must meet all project requirements.
Reformulation is also an option when selecting materials. Most materials or products may be reformulated to reduce impacts, even whenmaterial choice is constrained.
Substitution
For a variety of reasons, a currently used material may have to bereplaced in design. In most cases, substitutes can readily be found thatreduce life cycle impacts but do not conflict with either cost or performance requirements. However, before making a final choice, substitutesmust be analyzed for environmental impacts This helps avoid shiftingimpacts to other life cycle stages. Careful screening can also uncoversignificant new impacts in other areas that might have been overlooked.
Material substitutions can be made for product as well as processmaterials, such as solvents and catalysts. For example, water-based solvents or coatings can sometimes be substituted for high-VOC alternatives during processing. On the other hand, materials that don't require
79
Design Strategies
Because material selectionis a fundamental part ofdesign, it offers manyopportunities for reducingenvironmental impacts. Inlife cycle design, materialselection begins byidentifying the nature andsource of raw materials.Then environmentalimpacts caused bymaterial acquisition,processing, use, andretirement are estimated.
Substitutes can frequentlybe found that reduce lifecycle impacts but do notconflict with either cost orperformance requirements.
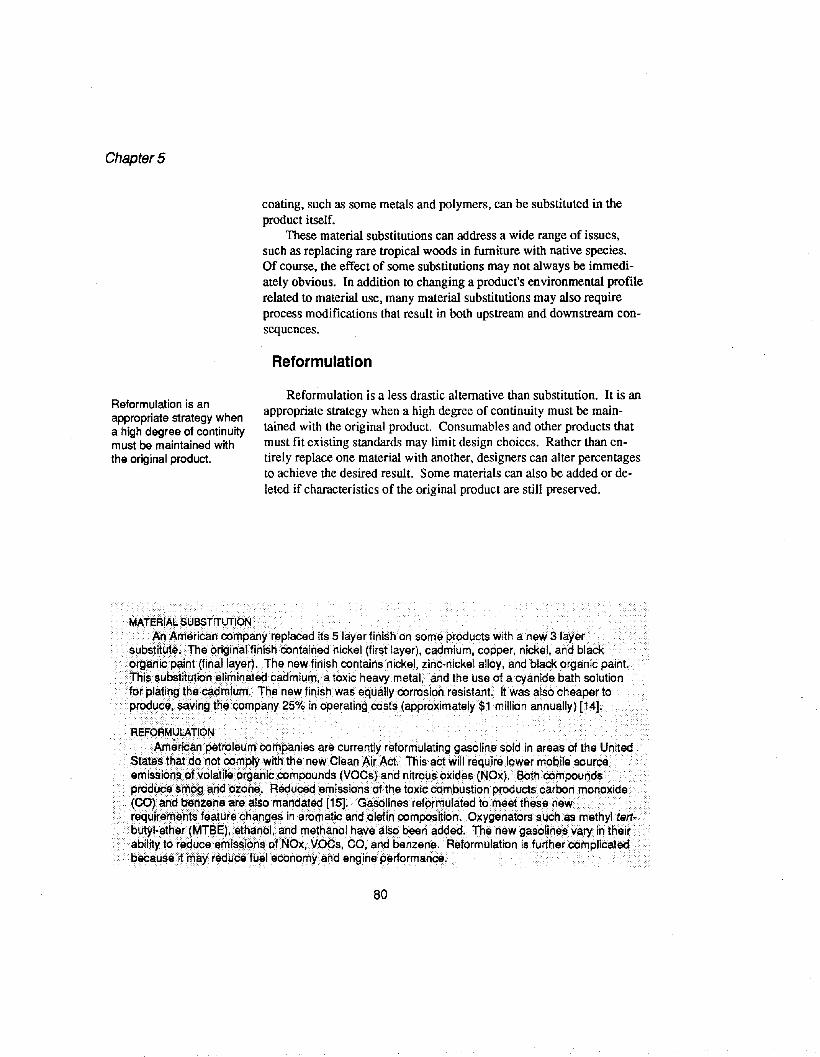
ChapterS
coating, such as some metals and polymers, can be substituted in theproduct itself.
These material substitutions can address a wide range of issues,such as replacing rare tropical woods in furniture with native species.Of course, the effect of some substitutions may not always be immediately obvious. In addition to changing a product's environmental profilerelated to material use, many material substitutions may also requireprocess modifications that result in both upstream and downstream consequences.
Reformulation
Reformulation is anappropriate strategy whena high degree of continuitymust be maintained withthe original product.
Reformulation is a less drastic alternative than substitution. It is anappropriate strategy when a high degree of continuity must be maintained with the original product. Consumables and other products thatmust fit existing standards may limit design choices. Rather than entirely replace one material with another, designers can alter percentagesto achieve the desired result. Some materials can also be added or deleted if characteristics of the original product are still preserved.
MATERIAL.SUBSTlTuTJONAn)\merica.nCX)n'lpany replaced it$ 5 layer finish on Same products with a nevv 3 layer
$ubstit4!~.TheoriginaFfinishcontained nickel. (first layer), cadmium, copper, nfcl<EI', ano blackprganicpClint. (finaIICiyer). The new finishcontains nickel, zinc-nickel alloy, and black organic paint.
. ,.hissubstit~iontlliminateocadmium,atoxic heavy metal,and the use of a cyanide .bath solutionfprplatil'lgthecadll'llurn.The neW finish was •equallycorrosionresistCil'lt. It was.also cheaper toProduqeiScavingthecompaYly25% in operating costs (approximately $1 million annually) [14].
.. _ -- .
REFORMUl.'\TION> / ••.. . .•• •..>/.. ••••.•• ••••••.•.••• .•• . . ..i ... .. . >>5mericanpetroleumcompanies are currently reformulatinggasolinesoldinareas of. the. United
.StatesthCitdqnotcomplywith.thenewCleanAir Act. Thisaet will requirel0'Nermobilesourqeemission~ ••()fvolatire••orga.nic••comp()unds (VOCs)••Cind nitrousoxides••(NQx). ·•• Both.compoundspro9ugesmpg .•and••pz()n~ ••••.RedUcad.~missions ••otthe toxiccombustion.produets •.carbon ••monoXide(9<'lClndpenzene are CilsomandCltEKi [15].... Ga~lines refon"ulated to.meet these newrequirementsfea1urechang~sinaromaticandolefin comp()$~ion. Oxygenatorss\Jchasmethyltert·blltYl-ether(MTBE),ethCinol,and •m.ethanol have a.lso been. added. The new gasolinesYal)' tn thei/'abilityt?fe9uce~rni$$lon$()fNO)(.VOCs, CO, and benzene.•Reformulation is further complicatedtJecause~l'Tlayreducefuel econoffiyandengine performance. .
80
Design Strategies
5.5 REDUCED MATERIAL INTENSIVENESS
Resource conservation can reduce waste and directly lower environmental impacts. A less material-intensive product may also be lighter,thus saving energy in distribution or use. Designing to conserve resources is not always simple. Reduced material use may affect other requirements in complex ways.
In some cases, using less material affects no other requirements andthus clearly lowers impacts. When the reduction is very simple, benefitscan be determined without a rigorous life cycle assessment. However,careful study may be needed to ensure that significant impacts have notbeen created elsewhere in the life cycle. In addition, impacts might havebeen reduced further by using another material, rather than less of thecurrent choice.
5.6 PROCESS MANAGEMENT
A variety of process management strategies can be used to reduceenvironmental impacts. Although process design is an integral part ofproduct development in this manual, process improvements can be pursued outside product development.
Process Substitution
Processes that create major environmental impacts should be replaced with more benign ones. This simple approach to impact reductioncan be very effective. As always, substitutes should be evaluated withinthe life cycle framework to make sure that total impacts are reduced.The effect of process changes on cost and performance must also be assessed.
Resource conservationcan reduce w~ste anddirectly lowerenvironmental impacts.
Although process design isan integral part of productdevelopment in thismanual, processimprovements can bepursued outside productdevelopment.
REDUCED MATERIAL INTENSIVENESS . .Many single-use items have steadily reduced their material content over time, although this·
may not be the most effective method of reducing impacts while meeting societal needs. Evenso, material reduction can be beneficial. . .. . . .. .. .... .•••.. .. ... .
For example, a fast food franchise reduced material inputs and solid waste generation bydecreasing paper napkin weight by 21 %. Two store tests revealed no change in the number ofnew napkins used compared to the old design. Attempts to reduce the gage of plastic straws,however, caused customer complaints. Redesigned straws were found to be too flimsy and didnot draw well with milkshakes [16J.
81
Chapter 5
Processes that createmajor environmentalimpacts should bereplaced with more benignones. As always,substitutes should beevaluated within the lifecycle framework to makesure that total impacts arereduced.
As a first step in reducing impacts, designers should be familiarwith the best available technology and equipment to accomplish a processing step. Engineers and designers should also consider chemical,biological, and mechanical alternatives. For example, it may be possible to replace a chemical process with a mechanical one that reducesimpacts.
Process alternatives should be tested theoretically before they areselected. For chemical processes, this includes detennining the stoichiometric balances of reactions to indicate the minimum ratio of byproduct to desired product. Once this infonnation is known, alternativepathways that reduce waste generation or by-product toxicity can be explored.
The US EPA has published several pollution prevention manualsfor specific industries. Each manual reviews strategies for waste reduction and provides checklists. Many of these strategies focus on processsubstitution. Appendix A contains a list of these resources.
More efficient use of process energy and materials are also part of aprocess substitution strategy.
PROCESS SUBSTITUTION (Note: none of these cases demonstrates proper life cycle designpractices. Substitutes have to be carefully analyzed before the impacts of new and old systems canbe compared.)
Copper sheeting for electronic products was previously cleaned with ammonium persulfate,phosphoric acid, and sulfuric acid at one large American company's facility. Hazardous waste fromthis process required special handling and disposal. The solvent system was replacedby amechanical process that cleaned sheeting with rotating brushes and pumice. The new processproduces a nonhazardous residue that is disposed in a municipal solid wastelandfiU. This processsubstitution reduced hazardous waste generation by 40,000 pounds per year and saved $15,000annually in raw material and disposal costs [17].
Several American electronics manufacturers have eliminated the use of ozone-depletingby substituting semi-aqueous terpene solvents to remove liquid flux and solder paste residues.Some of thElse manufacturers have surpassed the CFC elimination goals of the amended MontrealProtocol [18,19J.
AlargeAmerican chemical and consumer products company switched from an organic-solventbased system for coating pharmaceutical pills to a water-based system. The substitution wasmotivated by the need to comply with regulations limiting emissions 01 volatile organic compounds.To prevent the pills from becoming soggy, a new sprayer system was designed to precisely controlthearnount of coating dispensed. A dryer was also installed as an additional process step. Heatirigrequirements increased when water-based coatings were used. For a total cost 01$60,000, thenew system saved $15,000 in solvent costs annually andavoided $180,000 inend-of-pipe airemission controls that would have been required if the old solvent system had been retained [20].
82
Design Strategies
Process Energy EfficiencyProcess designers should always consider energy conservation. For
example, waste heat can be used to preheat process streams or do otheruseful work. In addition, energy requirements for pumping may be reduced by using larger diameter pipes to cut down frictional losses.
Energy use in buildings may also be reduced through more efficientheating, cooling, ventilation, and lighting systems. Architects shoulddesign these improvements into new buildings or add them during renovation. Building design is briefly discussed later in this section, underfacilities planning.
In addition, significant amounts of energy can be saved by efficientprocess equipment. Both electric motors and refrigeration systems areprime candidates for improvement. Electric motors alone consume 65 to70 percent of industrial electricity and more than half the electricity generated in the US [21]. Operating a typical motor usually costs from 10to 20 times the total capital costs of the motor per year.
Equipment choices have a major influence on energy use. High-efficiency motors and adjustable-speed drives for pumps and fans are twomeans of reducing energy consumption. Maintenance and proper sizingof motors can also greatly reduce energy use.
Process Material EfficiencyProcesses designed to use materials in the most efficient manner re
duce both material inputs and waste outputs. The same actions that reduce material use in products can also produce similar results in processdesign.
PROCESS MATERIAL EFFICIENCYA large American electronics company designed a flux dispensing machine for use on printed
circuit boards. This low solids fluxer (LSF) produces virtually no excess residue when applying .fluxes, thus eliminating a cleaning step with CFCs and simplifying operations. Performanc$ oftheb9ards produced with the new LSF was. maintained and the LSFhelped this manufacturerredLiceCFC emissions by over 50% [22]. .
A large American consumer produetsfirm operated a resin spraybOoth that produc$d500,OOO ....tons of oversprayper year atone cif its manufacturing facilities The oversprayconsistedof volatile .
. organic compounds which required special inCineration to meet emission requirements. New paintequipment was installed to reduce this overspray. Total savings, consisting largely of reduced resin
. needs, totalled $125,000 annually for an investment of $45,000 [23]. .
83
Chapter 5
Well-designed processcontrols can preventpollution and conserveresources.
Process Control
Control systems are an integral part of process design. Well-designed process controls can prevent pollution and conserve resources.Three basic requirements of a control system are:
• suppressing the influence of external disturbances• ensuring process stability• keeping process performance within environmental constraints
Mathematical models for control can be developed on any scalefrom the entire life cycle to a single piece of equipment. These modelscan then be adjusted to meet environmental needs.
Processing can generate a significant amount of waste when products do not fit specifications. Setting appropriate tolerances improvesaccuracy, thus directly reducing environmental impacts and costs. Several methods can help keep processing defects and waste to a minimum[24,251. These statistical experiments reveal proper tolerances and allow much more effective process control.
Other much less complex actions can also reduce impacts. Installing control devices that switch off equipment not in use is one simplemethod of conserving resources.
Improved Process Layout
Planning the best arrangement of processes within a facility is acomplicated task. Layout is the key to achieving efficient operationsand reducing risks from accidents. The spacing of processing units determines material and energy transfer distances and thus affects efficiency. Layout also influences the success of loss prevention programsby atfecting worker health and safety risks. The extent of damage fromindustrial fires, explosions, and chemical releases also depends on spatial arrangement. Layout also influences the nature and effectiveness ofemergency response.
Pollution prevention activities do not eliminate the need for contingency plans related to industrial accidents. Emergency response is acritical factor in plant layout and procesS design.
Inventory Control and Material Handling
Improved inventory control and material handling reduces wastefrom oversupply, spills, or deterioration of old stocks. This increases ef-
84
Design Strategies
ficiency and prevents pollution. Proper inventory controls also ensurethat materials with limited shelf lives have not degraded. Processes canthus run at peak efficiency while directly reducing waste caused by reprocessing.
On-demand generation of hazardous materials needed for certainprocesses is an example of innovative material handling that can reduceimpacts.
Storage facilities are also an important element of inventory andhandling systems. These facilities must be properly designed to ensuresafe containment of materials. They should also provide adequate capacity for current and projected needs.
Facilities Planning
Environmental strategies for product design can also be applied tofacilities and equipment. Extending the useful life of facilities and processes by making them appropriately durable or adaptable is one example. Flexible manufacturing can be a very effective life extensionstrategy for facilities and equipment. Resource conservation in facilitydesign can also help reduce impacts.
Several sources of information are available on the environmentalaspects of building and lighting design. The American Institute of Architects offers the Environmental Resource Guide Subscription [27].
. ' .. ', ,. , . -".-_ ,.
INVENTORY CONTROL AND MATERIALHANDLING / ••••.••••••••••••••.••••······.i>A large· American· electronics fi rm developed all ()n-demandgeneration system for prodLlcing
essential toxic chemicals for which no sUbstituteexists.LessharmMprecursorsar~treaetedtoforillthe toxic chemical for immediate consumption.Thec6mpal1YhoWptodUCElsarsihe,ah~cytelytoxiC··chemical essential for semi-conductor production, as itisneeded. Thisavoidsthe transport of ..arsineto manufacturing sites in compressed cylindersandtheuseofspeciallyd~~igl'led
col'ltainment facilities to store the arsine.•Thecornpanynolorlgermustown.3specIalst(jragefacilitieswhich cost$lmiHion each to build and maintain [26]. .
:. ", ',:::":,' ,:': .. ."::",""':":"."",:- ",'::<', .:<:.' '-,' .";> ., ..:. -::<:·::':',i'·':-.':i ..::,\::"::::···;:::,:i:':'· ,<::':::r:
Ordering the proper amount of materials required for a taSK or process stepcan significantlyreduce waste. In 1985, a National Laboratory instituted a program that requires ordering only theamount of solvent reqUired for a job. PreViously, solvents could only be allocated in 55gallohdrums. Now. smaller quantities are available resulting in reduced use, spillage. and evaporativeloss. Approximately 60,000 gallons of solvent were saved at the lab through thIS method In198~{14]. . . . .. ..
More than a ton of PBB fire retardant was accidentally substituted for magnesiumt>xide ~imal •..feed supplement in Michigan as a result of improper material handling and inventory control.·· ..Thousands of animals were contaminated and either died or had to be destroyed, causing significanteconomic losses. Contaminated carcasses also required speciallahdfillsforburial. .. .
85
Chapter 5
This quarterly publication covers energy efficiency, indoor air quality,and natural resource issues. The Environmental Resource Guide alsoanalyses common construction materials. When possible, findings arebased on life cycle assessments. The focus is on energy use, toxic emissions, resource management after retirement, and waste.
Government can also aid in facilities planning. For example,through its Green Lights program, the EPA helps companies conserveenergy. Participants are recruited and educated about new lighting techniques that save money and reduce impacts by increasing efficiency.
In addition to saving resources, buildings should be designed to reduce health and safety risks. Such factors as structural integrity, explosion venting, adequate normal ventilation, fire walls, emergency exits,and proper drainage help reduce risks to human health and safety. At aminimum, a building must satisfy the National Building Code and National Electrical Code.
Geographic location is also an issue in facilities planning. When siting a new building, it is important to determine whether adequate utilities, transportation, infrastructure, and emergency response are available.The possibility of natural disturbances such as earthquake and floodsshould also be considered. These events can damage facilities and causereleases that are a risk to nearby residents. In addition, location is thekey to determining community risks from accidents or other human errors within the facility.
Finally, available resources and the impacts of using them help determine facility location. For example, industries requiring large quantities of process water should not be sited in drought-stricken regions.
Treatment and Disposal
After strategies for pollution prevention and waste minimizationhave been exhausted, process residuals must be treated and disposed.Environmental impacts and health risks can still be reduced at this stage.
Treatment and disposal will not be discussed here. Developmentteams exploring this vital topic can consult a variety of readily availabletextbooks.
86
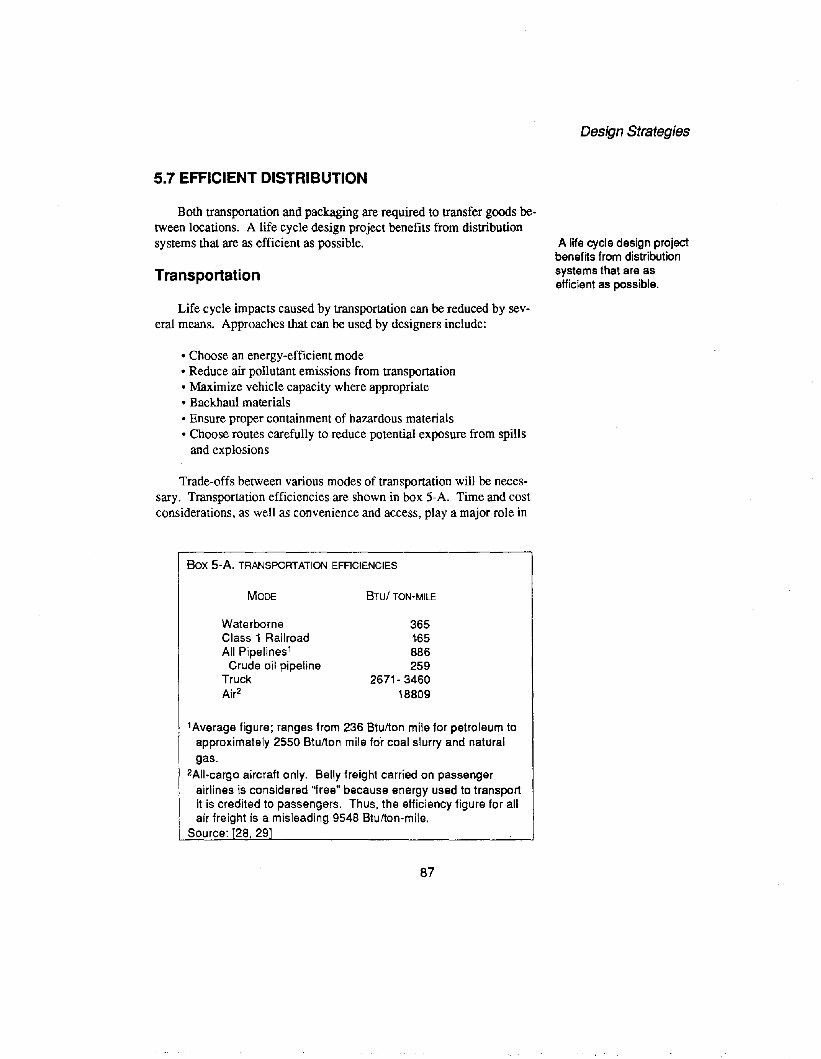
5.7 EFFICIENT DISTRIBUTION
Both transportation and packaging are required to transfer goods between locations. A life cycle design project benefits from distributionsystems that are as efficient as possible.
Transportation
Life cycle impacts caused by transportation can be reduced by several means. Approaches that can be used by designers include:
• Choose an energy-efficient mode• Reduce air pollutant emissions from transportation• Maximize vehicle capacity where appropriate• Backhaul materials• Ensure proper containment of hazardous materials• Choose routes carefully to reduce potential exposure from spills
and explosions
Trade-offs between various modes of transportation will be necessary. Transportation efficiencies are shown in box 5-A. Time and costconsiderations, as well as convenience and access, playa major role in
Box 5-A. TRANSPORTATION EFFICIENCIES
Design Strategies
A life cycle design projectbenefits from distributionsystems that are asefficient as possible.
MODE
WaterborneClass 1 RailroadAll Pipelines'
Crude oil pipelineTruckAir2
BTU! TON-MILE
365165886259
2671-346018809
'Average figure; ranges from 236 Btu/ton mile for petroleum toapproximately 2550 Btu/ton mile for coal slurry and naturalgas.
2AII-cargo aircraft only. Belly freight carried on passengerairlines is considered "free" because energy used to transportit is credited to passengers. Thus, the efficiency figure for allair freight is a misleading 9548 Btu/ton-mile.
Source: [28, 291
87
Chapter 5
To avoid unnecessaryimpacts. products andpackaging should bedesigned to complimenteach other.
choosing the best transportation. When selecting a transportation system, designers should also consider infrastructure requirements and theirpotential impacts.
Packaging
Packaging must contain and protect goods during transport and handling to prevent damage. Regardless of how well-designed an itemmight be, damage during distribution and handling may cause it to bediscarded before use. To avoid such waste, products and packagingshould be designed to compliment each other.
The concurrent practices of life cycle design are particularly effective in reducing impacts from packaging. As a ftrst step, productsshould be designed to withstand both shock and vibration. When cushioned packaging is required, members of the development team need tocollaborate to ensure that cushioning does not amplify vibrations andthus damage critical parts [30]. Cooperation between design specialitiescan greatly reduce such product damage.
The following strategies may be used to design packaging withinthe life cycle framework. Most of these strategies also result in significant cost savings.
Packaging Reduction• elimination: distribute appropriate products unpackaged• reusable packaging• product modifications• material reduction
Material Substitution• recycled materials• degradable materials
Packaging ReductionShipping items without packaging is the simplest approach to im
pact reduction. In the past, many consumer products such as screwdrivers, fasteners, and other items were offered unpackaged. They can stillbe hung on hooks or placed in bins that provide proper containmentwhile allowing customer access. This method of merchandising avoidsunnecessary plastic wrapping, paperboard, and composite materials.Wholesale packaging can also be eliminated. For example, furnituremanufacturers commonly ship furniture uncartoned. Uncartoned furniture is protected with blankets that are returned after delivery to the distribution center.
88
Reusable packaging systems are also an attractive design option.Wholesale items that require packaging are commonly shipped in reusable containers. Tanks of all sizes, wire baskets, wooden shooks, andplastic boxes are frequently used for this purpose.
Necessary design elements for most reusable packaging systems include:
• collection or return infrastructure• procedures for inspecting items for defects or contamination• repair. cleaning and refurbishing capabilities• storage and handling systems
Unless such measures are in place or planned, packaging may bediscarded rather than reused. Manufacturers and distributors cannot reuse packaging unless infrastructure is in place to collect, return, inspect,and restore packaging for another service. Producers can reduce theseinfrastructure needs by offering their product in bulk. Some system willstill be required for reusable wholesale packaging, but it should be muchless complex than that needed to handle consumer packaging. Whenproducts are sold in bulk, customers control all phases of reuse for theirown packaging.
Even so, waste generation and other environmental impacts are onlyreduced when customers reuse their container several times. Customerswho use new packaging for each bulk purchase generally consume morepackaging than customers who buy prepackaged products. This is particularly true of items distributed in single-use bulk packaging [31].
Product modification is another approach to packaging reduction.Sturdy products require less packaging and may also prove more robustin service. Depending on the delivery system, some products may safelybe shipped without packaging of any kind. Even when products requireprimary and secondary packaging to ensure their integrity during delivery, product modifications may decrease packaging needs. Designerscan further reduce the amount of packaging used by avoiding unusualproduct features or shapes that are difficult to protect.
Reformulation is another type of product modification that may bepossible for certain items. Products that contain ingredients in dilutedform may be distributed as concentrates. In some cases, customers cansimply use concentrates in reduced quantities. A larger, reusable container may also be sold in conjunction with concentrates. This allowscustomers to dilute the product as appropriate. Examples of productconcentrates include frozen juice concentrates, and concentrated versions of liquid and powderecidetergent.
89
Design Strategies
Product modification isone approach topackaging recluction.Sturdy products requireless packaging and mayalso prove more robust inservice.
ChapterS
Material reduction may also be pursued in packaging design. Manypackaging designers have already managed to reduce material use whilemaintaining performance. Reduced thickness of corrugated containers(board grade reduction) provides one example. In addition, aluminum,glass, plastic, and steel containers have continually been redesigned torequire less material for delivering the same volume of product
Material SubstitutionAs discussed, material substitution can reduce impacts in other ar
eas of design. One common example of this strategy in packaging is thesubstitution of more benign printing inks and pigments for those containing toxic heavy metals or solvents. The less harmful inks are usuallyjust as effective for labels and graphic designs. When some propertiesdepend on toxic constituents, designers can develop new images that arecompatible with sounder pigments, inks, and solvents.
Whenever possible, designers can create packaging with a high recycled content. Many public and private recycling programs currentlyfocus on collecting packaging. As a direct consequence, firms are beingencouraged to increase the recycled content of their packaging.
However, using recycled material in packaging design cannot bethought of as a complete strategy in itself. Opportunities for material reduction and packaging reduction or elimination should still be investigated. Recycling and recycled materials were discussed in more detailearlier in this chapter.
Degradable materials are capable of being broken down by biological or chemical processes, or exposure to sunlight. At first glance, package designs based on degradable material appear to be an attractivesolution to the mounting problem of waste disposal. But the lack ofsunlight, oxygen, and water in modem landfills severely inhibits degradation.
Degradable materials thus provide only limited benefits in packaging that will be properly disposed. This may change if composting ofmunicipal waste becomes more widespread.
In any event, degradability is a desirable trait for litter deposited inaesthetically pleasing natural areas. In particular, polymers or other materials that are normally resistant to decay are less of a nuisance if theycan be formulated to quickly break down. Degradable materials mayalso benefit some aquatic species that encounter litter. Various mammals, birds, and fish can die from entrapment in such items as six-packrings and plastic sacks. Even so, it may be difficult to determinewhether degradable packaging is an asset, or just encourages irresponsible behavior.
90
Previously resistant materials that are now designed to decay mayalso cause unanticipated problems. Degradable polymers can impede recycling efforts by acting as a contaminant in recovered materials. Questions have also been raised about the environmental impacts of degradedpolymers. Degradation can liberate dyes, fillers, and other potentiallytoxic constituents from a material that was previously inert.
5.8 IMPROVED MANAGEMENT PRACTICES
Most product and process design strategies apply to managementactivities. For example, life extension should be considered when purchasing business equipment. Some additional strategies related to management and information provision follow.
Office Management
Designing new business procedures and improving existing methodsalso plays a role in reducing environmental impacts. Business management strategies apply to both manufacturing and service activities. Examples of strategies for impact reduction in this area include:
• Specify double-sided 'photocopying• Use single spacing for final copies• Reduce paper requirements by circulating memos and articles
with a routing list• Use backs of single-sided copies for note and memo pads.• Order envelopes without cellophane or plastic window panes• Use FAX stickers rather than full transmission cover sheets• Recycle office paper, containers, and all other suitable materials• Purchase products made with recycled materials• Reuse toner and ribbon cartridges for printers• Use electronic and voice mail• Use computer networks for sending documents• Tum off electronic equipment when not in use• Keep confidential materials in networks, or shred old hard copies
for recycling• Retrofit buildings with high-efficiency climate control and light
ing systems• Illuminate only that space currently in use
91
Design Strategies
Several brands of laserprinters print a title sheetby default every time themachine is turned on.Such systems wastepaper and encourageowners to leave machineson for extended periods oftime, consuming excesselectricity. Default printingcan be permanently turnedoff via a software switch,thus substantially reducingpaper waste.
Chapter 5
A large Americanelectronics company hasdeveloped a SupplierEnvironmental EvaluationQuestionnaire to ensurethat suppliers comply withlaws and regulations andmanage their businessesin an environmentallysound manner.
Phase Out High Impact Products
Discontinuing the manufacture and sale of wasteful or harmfulproducts is the most direct action a corporation can take to eliminate lifecycle impacts. Products may be discontinued through recall, gradualphase out (sunsetting), or ceasing production immediately.
Choose Environmentally Responsible Suppliers orContractors
Suppliers and contractors should be carefully selected to reduce upstream environmental consequences. This requires life cycle impactdata on raw materials and parts. However, critical data is usually notreadily available. So decisions must be based on material safety datasheets, TRI data, and other environmental records requested from thesupplier or contractor.
Information Provision
Information transfer accompanies the flow of materials and energythroughout the life cycle of a product. Proper information encouragesthe use of materials and products with reduced environmental impactsand health risks.
LabelingIdentify Ingredients
Materials flowing through the product system change significantlythrough life cycle stages. Complex mixing, chemical reactions, andother processes change material composition and form. Labels thatidentify materials and provide concentrations of each constituent in aproduct are important for health and safety reasons.
Instructions and WarningsUsers of goods and services, and processes operators need clear and
detailed guidance about proper procedures. Clear instructions can increase performance and help reduce resource use through greater efficiency. Products that are used properly can last longer and providemore satisfaction to the user. Well-operated processes and products canalso reduce the likelihood of accidents. Significant environmental impacts may result from accidental releases or misuse.
92
General InformationLabels can be a primary means of informing customers about the
environmental attributes of a product. Some third party environmentallabel programs are outlined in Appendix E. Federal Trade Commissionguidelines and other issues that affect this aspect of labeling are discussed next.
AdvertisingEnvironmental Claims
Many manufacturers take advantage of public concern about environmental issues by launching advertising campaigns that confuse ormislead. Environmental claims should not be made unless they are specific, substantive, and supported by reliable scientific evidence [32].
For example, many products are labeled "recyclable", even thoughsuitable collection and processing systems are not widely available, andno substantial markets exist for the recovered material.
The FTC issued guidelines in 1992 for environmental advertisingand labeling. These guidelines can help reduce consumer confusion andprevent the false and misleading use of terms such as recyclable. degradable. and environmentally friendly [33].
Advertisers must also be cautious about comparative claims. Someof these claims are based on life cycle analyses done by consultingfirms. Results from these studies may be difficult to interpret becausemethods vary and details are rarely pUblicly disclosed. In addition, moststudies seem to favor the client, so questions may be raised about objectivity.
93
Design Strategies

ChapterS
In 1991, cln.AmEJrlcan cosmetics company settled FTC charges thatlt made falseal1dunsubstantiated C1aims!:>y marketing cosmetics as "ozone safe" and "ozone friendly" whenproouctscontaineda Class lozone-depleting substance.
FTCACtiorlS ... . . . . . . . .JI11992, an international company settled FTC claims that it made unsubstantiated claims abOut
its disposable diapers. The diapers were claimed to be biodegradable and offer significantenvironmentalbenefitc:ornpared to similar products when disposed in a landfilL
ADVERTISING CLAIMS • .. . .. . • •. .. .•..... .
The follc>wing examples are quoted from the FTC's Guides for the Use of Environmental Marketing .... Claims[33]. . . . . . ..
.•. ... General~~viro~mentaJ daimsare dHfk:ultto interpret. In many cases, such claims ~ay convey that .....•....
. the produetor package has specHtc and far-reaching environmental benef~s. •• • ... •. ......• .•...•..•....•••.•.•.•..••...•.. Example: A pump spray product is labeled "environmentally safe". Most of its ingredients are .•.•••.••.•···volatileorganiccomp6unds(VOCs) that may cause smog and form low-level ozone. This claim is ..••.•.••.••·.deceptive, becausewfthoUt further explanation, consumers are likely to believe that makirigarid .... / .... usingthe product will nc>t cause pollution or other harm to the environment.· .. .
. Comparativemarketingdaims should make the basis forcompar~on clear. Advertisers should beable to substantiate the comparison. . .. ... .. ... .... ... ... .... .. . .•.. . •..
Example: A manufacturer claims "our plastic diaper Hner has the most recycled cOntent". The .diaper does have more recycled content,calculated as a percentage of weight, than any other on the··market. Provided this content is significant, and the difference between the product and those of. .competitors ~ also significant and can be verified, the claim is not deceptive. .
Other EXclfiiples: .. . . ..A product label claims, "This product is 95% less damaging to the ozone layer than past .
formulations that contained CFCs". The manufacturer substituted HCFCs for CFC-12, and has validscientific evidence that this will result in 95% less ozone depletion, This claim is not likely to bedeceptive;
Acontainer states "refillable x times", The manufacturer is capable of refilling containers and .can show that they will withstand refill at least x times. However, this claim is deceptive becausethere is no means of collecting and returning containers to the manufacturer. . .
94
References
1. Moss, Marvin A. 1985. Designing For Minimal Maintenance Expense. NewYork: Marcel Dekker.
2. B6r1in, M. 1989. Swiss Case-Studies of Product Durability Strategy. Verslagvanhet VVM/KIRVIT/RMNO Symposium, 7 September, 42-50.
3. Motorola 1991. Centracom Series. Schaumberg, IL: Motorola Inc. RC-13-9.4. Wheeler, Roy. 1991. Design For Reliability Reshapes Designing. Electronic
Design 39 (2): 121-132.5. Lund, Robert T. 1984. Remanufacturing. TechTUJlogy Review 87: 18-23+.6. Haynsworth, H. C., and R. Tim Lyons. 1987. Remanufacturing by Design,
the Missing Link. Productivity and Inventory Management 28: 24-29.7. Kirkland, Carl. 1986. Remanufacturing vs Buying New: One Molder's Com
parison. Plastics TechTUJlogy 32 (10): 91-93.8. Kusz, John Paul. 1990. Environmental Integrity and Economic Viability.
Journal ofIndustrial Design Society ofAmerica Summer: 25-27.9. Bell, Carole 0., and Erica Guttman. 1990. Design For Disposal. Journal of
Industrial Design Society ofAmerica Summer: 8-10.10. Popular Science. 1992. Best of What's New. Popular Science 241(6): 65-88.11. US EPA. 1991. Guidance For the Use of the Terms "Recycled" and "Recy
clable" and the Recycling Emblem in Environmental Marketing Claims.Federal Register 56 (191): 49992-50000.
12. _.1990. Characterization ofSolid Waste in the United States: 1990 Update, US Environmental Protection Agency, Office of Solid Waste, Washington, DC EPA 530-SW-90-042A.
13. Sellers, V. R., and 1. D. Sellers. 1989. Comparative Energy and Environmental Impacts For Soft Drink Delivery Systems, Franklin Associates,Prairie Village, KS.
14. US EPA. 1991. Pollution Prevention 1991: Progress on Reducing IndustrialPollutants, US Environmental Protection Agency, Office of Pollution Prevention, Washington, DC EPA 21P-3003.
15. 1990. Tough Air-Quality Goals Spur Quest For Transportation FuelChanges. Oil and Gas Journal 88 (23): 33-34+.
16. Waste Reduction Task Force. 1991. Final Report, Environmental DefenseFund and McDonald's Corporation.
17. Hunter, J. S., and D. M. Benforado. 1987. Life Cycle Approach to EffectiveWaste Minimization. Journal ofthe Air Pollution Control Association 37(10): 1206-1210.
18. Suppelsa, A. B., and H. F. Liebman. 1991. Successful Implementation ofClosed Loop Semi-Aqueous Cleaning, Motorola, Inc., Plantation, FL.
19. Humblett, Gregory W., and Glenn W. Larsson. 1989. Terpene/AqueousCleaning, CalComp, Hudson, NH.
20. Binger, Robert P. 1988. Pollution Prevention Plus. Pollution Engineering 20:84-89.
21. Fickett, Amold P., Clark W. Gellings, and Amory B. Lovins. 1990. EfficientUse of Electricity. Scientific American 263 (3): 65-74.
95
Design Strategies
Chapter 5
22.
23.
24.
25.
26.
27.
28.
29.
30.
31.
32.
33.
Guth, Leslie A. 1990. Applicability ofLow Solids Flux, AT&T Bell Labs,Princeton, NJ.
Zosel, Thomas W. 1990. How 3M Makes Pollution Prevention Pay Big Dividends. Pollution Prevention Review Winter: 67-72.
Bhote, Keki R. 1991. World Class Quality: Using Experiments to Make itHappen. New York: American Management Association.
Taguchi, Genichi. 1987. Systems ofExperimental Design: EngineeringMethods to Optimize Quality and Minimize Cost. Dearborn, MI: AmericanSupplier Institute.
Ember, Lois R. 1991. Strategies For Reducing Pollution at the Source AreGaining Ground. Chemical and Engineering News 69 (27): 7-16.
AIA. 1992. Environmental Resources Guide Subscription, American Institute of Architects, Washington, DC. (available by subscription, publishedquarterly)
Davis, Stacy C., and Patricia S. Hu. 1991. Transportation Energy DataBook: Edition II, Oak Ridge National Laboratory, Oak Ridge, TNORNL-6649.
Minz, M. M., and A. D. Vyas. 1991. Forecast ofTransportation Energy Demand Through the Year 2010, Argonne National Laboratory, Argonne, IL.
Bresk, Frank C. 1992. Using a Transport Laboratory to Design IntelligentPackaging for Distribution. World Packaging Conference, Sevilla., Espana.,27 January 1992, Lansmont Corporation, Monterey, CA.
Keo1eian, Gregory, and Dan Menerey. 1992. Packaging and Process Improvements: Three Source Reduction Case Studies. Journal ofEnvironmental Systems 21 (1): 21-37.
Attorneys General Task Force. 1991. The Green Report: Findings and Preliminary Recommendations for Responsible Environmental Advertising, St.Paul,MN.
FTC. 1992. Guidesfor the Use ofEnvironmental Marketing Claims, FederalTrade Commission, Washington, DC.
96
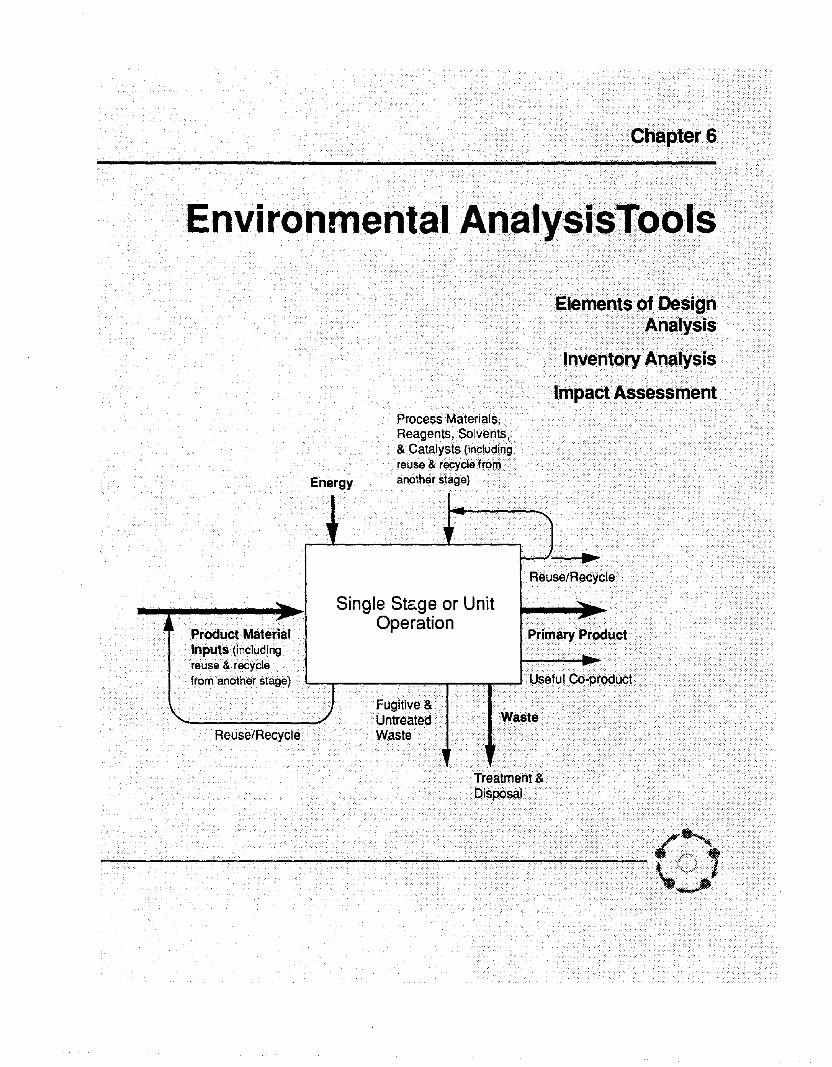
Chapter 6
ENVIRONMENTAL ANALYSIS TOOLS
Infonnation must be gathered and analyzed from the beginning of adevelopment project Proper tools for both these tasks allow effectiveevaluation of design choices.
Only a brief outline of environmental analysis tools is presentedhere. More detailed guidance can be found in the references at the endof this chapter [1- 7] and in Appendix A.
6.1 ELEMENTS OF DESIGN ANALYSIS
Environmental analysis plays a key role in:
• needs analysis• benchmarking• design evaluation
Strategic planning and product labeling also benefit from environmentalanalysis.
Before selecting the proper tools and beginning analysis, objectivesshould be clearly defined. As part of this process, development teamsmust also decide who will participate in the analysis and whether outside experts are needed.
Once these basic decisions have been made, analysis tools are applied to the first task of a design project, which is exploring customerneeds. During this phase, preliminary environmental analysis may identify potential problem areas that warrant further attention or uncoverconflicts between perceived need and environmental impacts. If theseconflicts are severe, the design team may decide to redefine or abandonthe project.
As a design project progresses, increasingly detailed infonnationmust be developed for benchmarking. Analysis tools are then used toevaluate design alternatives based on stated requirements. Finally, during implementation, analysis tools help assess environmental performance and target needed improvements.
To receive full benefits from environmental analysis, businessesshould develop tools suited to their own needs. This does not necessarily require major investment. Firms can realize both cost and decision-
98
Environmental Analysis Tools
making benefits from constructing a single data collection system forboth internal analysis and external reporting.
Environmental analysis methods discussed in this chapter are basedon life cycle analysis. A Society of Environmental Toxicology andChemistry (SETAC) workshop held on 18 August 1990, ascribed threeelements to life cycle assessment: inventory analysis, impact assessment,and improvement analysis [4].
Unfortunately, many aspects of life cycle assessment are still in theirinfancy. Life cycle inventories have been performed for over twentyyears, but full impact analyses have not yet been done.
Improvement analyses recommend specific actions that target priority impacts. Improvements take place within the life cycle framework,so upstream and downstream consequences are addressed. However, theeffect of these actions on other design requirements is usually not emphasized in improvement analysis. Because improvement analyses depend on both inventory and impact assessments, this aspect of life cycleassessment has also not been fully explored.
Continuous improvement is an integral part of life cycle design, soenvironmental analysis in this manual includes only the following twocomponents:
• Inventory analysis• Impact analysis
An inventory analysis identifies and quantifies inputs and outputs.In life cycle design, this inventory tracks materials, energy, and wastethrough each product system.
Without further assessment, data gathered during the inventoryanalysis may be misunderstood. For this reason, an impact analysis is required to interpret inventory data. Impact analyses identify the main impacts associated with a product. Whenever possible, impacts are thencharacterized so different designs can be compared. To fully understandan impact, the pathways, fate, and effects of residuals must be tracked;the environmental mobility of residuals in various media, theirbioaccumulation potential, and their toxicity are all used to determineimpact.
Life cycle design should not be confused with life cycle assessment.Rather than concentrating on only analytical tasks, life cycle design provides a framework and guidelines for integrating environmental requirements into product development. Life cycle assessment may improveenvironmental evaluation, but all environmental, performance, cost, cultural, and legal requirements must still be balanced in successful products.
99
The two majorenvironmental analysistools used in Ine cycledesign are:• inventory analysis• impact assessment
Product system inputs andoutputs are trackedthrough an inventoryanalysis. Interpreting thisinventory requires animpact analysis
Lne cycle design shouldnot be confused with Inecycle assessment.Analysis is only onefunction of design.
Chapter 6
A full life cycle assessmentmay not be essential for alldesign activities. Scopecan vary from completequantification of all inputs,outputs, and their impactsto a qualitative descriptionof inventories and impacts.
The development team willideally base design andanalysis on the full lifecycle. Choice of morelimited system boundariesshould be justified.
In some cases, items thataccount for less than 1% oftotal inputs or outputs canbe ignored. However, this1% rule can lead to aninaccurate impact analysiswhen applied to highlytoxic trace releases.
Scope of the Analysis
Before development teams begin gathering data for an environmental analysis, the scope of analysis should be agreed on. As previouslydiscussed, the scope of environmental analysis varies for different design applications. A full life cycle assessment is not essential for all design activities; analysis can vary from complete quantification of allinputs, outputs, and their impacts to a simple verbal description of inventories and impacts. Scope for a particular purpose is determined bychoice of system boundaries and depth of analysis.
System BoundariesBoundaries for environmental analysis are provisionally set during
the needs analysis when project objectives are defined. Boundaries usedin environmental analysis should be consistent with those chosen for design. Ideally the development team will base design and analysis on thefull life cycle system.
The development team may in some cases decide to restrict systemboundaries. Instead of a full life cycle system, boundaries may be restricted to a partial life cycle or even an individual life cycle stage. Inaddition, boundaries may be further narrowed by limiting the number ofproduct system components (product, process, distribution, management). System boundaries, however, should not be arbitrarily reducedwithout justification or proper testing of assumptions.
System boundaries can be narrowed to streamline analysis. For example, if the premanufacturing impacts for two competing designs arethe same, the design team may decide to restrict the analyses to lifecycle stages from manufacturing and use to the ultimate fate of the residuals.
Care must be exercised when basing a project on narrow analysis.An analysis limited to a single stage does not account for impacts thatare produced upstream or downstream from the stage. This analysismay show a reduction in impacts for the stage under investigation, butthe total life cycle impacts associated with the product system may haveincreased. Opportunities for improvement are also limited by the scopeof the analysis.
Rules for testing which activities to include within system boundaries have been proposed, but there are many exceptions to these rules.One rule of thumb suggests neglecting items that account for less than1% of total inputs or outputs. This is reasonable in most cases. How-
100
Environmental Analysis Tools
ever, blindly following the 1% rule can create later problems. Ignoringhighly toxic trace releases leads to an inaccurate impact analysis.
Depth of AnalysisAfter life cycle endpoints are decided, the project team should de
fine how analysis will proceed. Depth of analysis determines how farback indirect inputs and outputs will be traced. Facility and equipmentform the first level of indirect inputs for analysis. Materials, energy, andlabor required for their production are included in this first level. Facilities and equipment have traditionally been neglected in life cycle assessments, because they often make up less than 5% of all process inputsand outputs [8]. Under these circumstances, inventories from capitalplant can be less than 1% of life cycle totals. However exceptions canoccur. Drill bits used for extracting oil can account for 25% of total energy use in this stage [8].
Analysis may also proceed to the next level. This second level accounts for the facilities and equipment needed to produce items on thefirst level. A second level analysis would include inputs and outputs associated with machine tools and facilities for manufacturing such itemsas process pumps. Under normal circumstances, these effects are evenless significant than first level items. Contributions from successive layers quickly become negligible. For this reason, proceeding to the secondlevel or beyond in analysis is of more theoretical than practical interest.
The following factors should also be considered when determiningscope:
• Basis• Temporal Boundaries (Time scale)• Spatial Boundaries (Geographic)
BasisSelecting the proper basis for analysis allows accurate comparison
of alternative designs. In general, the basis for analysis should beequivalent use, defined as the delivery of equal amounts of product orservice. Equal use estimates can be based on number, volume, weight,or distance. For example, a worthwhile comparison of single-use andreusable diapers should be based on the number of diapers needed tocare for an infant over a certain time period. Similarly, toothpaste containers can best be compared on the basis of an equal number ofbrushings. Because delivery efficiencies or amounts used may vary between two competing containers such as tubes and pumps, total volumeof the dispenser may not be a useful basis for analysis.
101
Facilities and equipmenthave traditionally beenneglected in life cycleassessments, becausethey often make up lessthan 5% of all processinputs and outputs.However exceptions canoccur. Drill bits used forextracting oil can accountfor 25% of total energy usein this stage
In general, the basis foranalysis should beequivalent use. Thedelivery of equal amountsof product or service is thebest basis for comparingdesigns.
ChapterS
The time frame orconditions under whichdata were gathered shouldbe clearly identified.
The same activity canhave quite differentimpacts in different places.For example, water use inarid regions has a greaterresource depletion impactthan in areas where wateris abundant.
It may not always be obvious how patterns of use can be normalized between several alternatives. so some investigation may be required. For example. basing a comparison of liquid and powderedlaundry detergent on weight or volume would be pointless. Analysis inthis case should be based on how much of each type of detergent is required to wash an equivalent number of identical loads.
Temporal BoundariesThe time frame or conditions under which data were gathered
should be clearly identified. Past statistics may not reflect current practice. so it is best to base analysis on the most recent information. In addition. results from the start-up or shut-down of an industrial processusually vary from those under normal operation. For this reason, the design team may choose to collect data that reflects average system performance. However. impacts such as accidental releases or residuals fromabnormal operating conditions also affect analysis and should not be excluded simply because they are irregular. Whenever possible, it is useful to report worst- and best-case scenarios.
Spatial BoundariesThe same activity can have quite different impacts in different
places. For example. water use in arid regions has a greater resourcedepletion impact than in areas where water is abundant. The location oflife cycle stages affects environmental impacts in other ways. Energyuse and related impacts for distribution will be lower for local systemsthan widely separated ones.
Once scope has been clearly defined, both inventory and impactanalysis can then proceed.
6.2 INVENTORY ANALYSIS
A full inventory analysis consists of two main tasks:
• Identifying the elements in each material and energy input andoutput stream
• Quantifying these inputs and outputs
In this section. procedures for an inventory analysis are outlined. Formore detailed guidance, see Life Cycle Assessment: Inventory Guidelines and Principles [7].
102
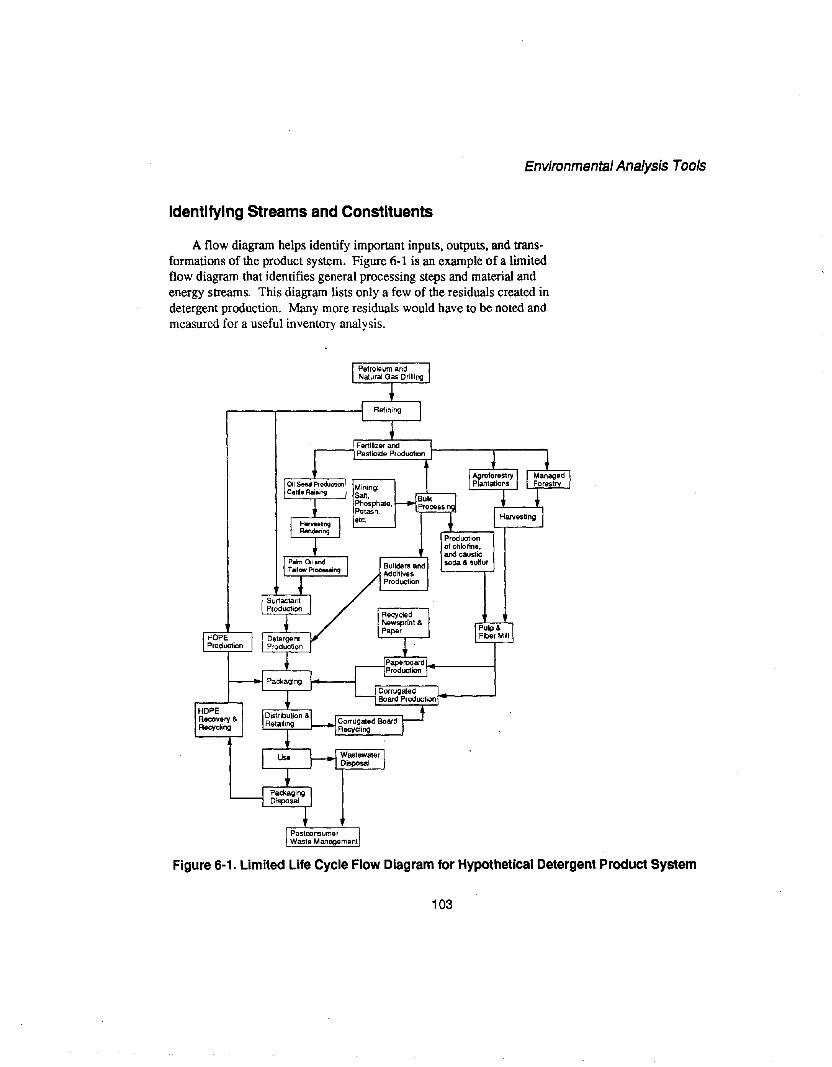
Environmental Analysis Tools
Identifying Streams and Constituents
A flow diagram helps identify important inputs, outputs, and transformations of the product system. Figure 6-1 is an example of a limitedflow diagram that identifies general processing steps and material andenergy streams. This diagram lists only a few of the residuals created indetergent production. Many more residuals would have to be noted andmeasured for a useful inventory analysis.
Productionof chlorine.andeausticsoda & suKur
Figure 6-1. Limited Life Cycle Flow Diagram for Hypothetical Detergent Product System
103
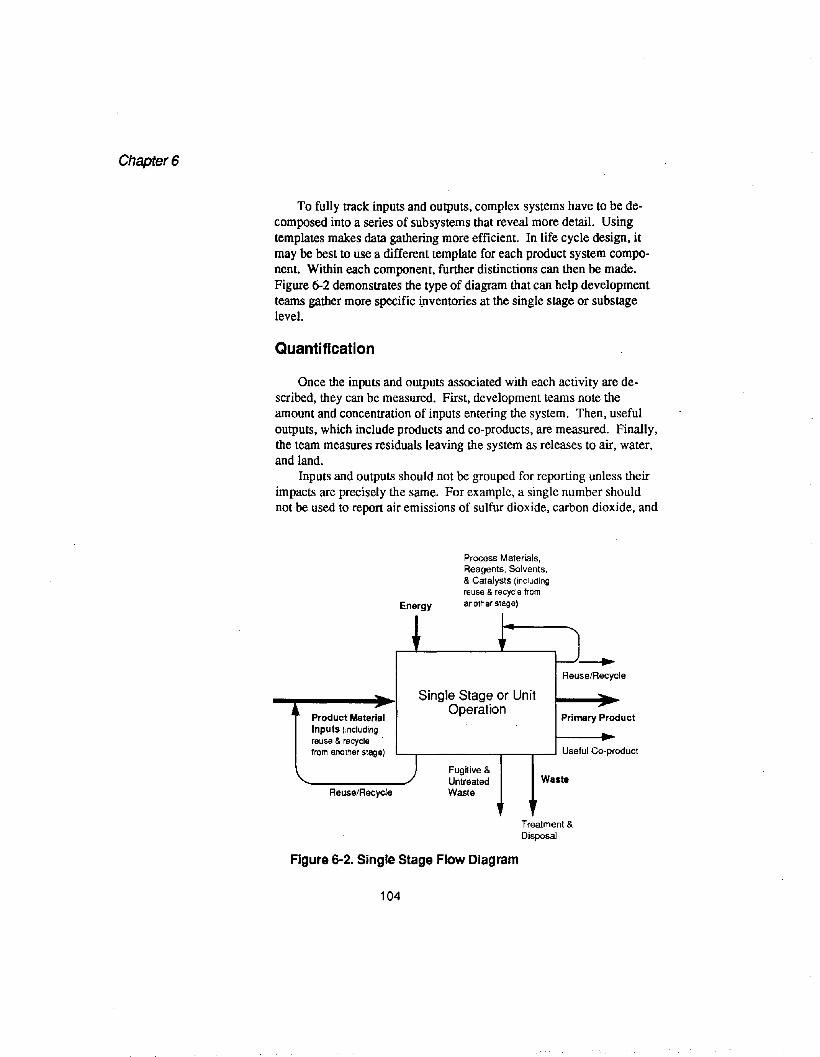
Chapter 6
To fully track inputs and outputs, complex systems have to be decomposed into a series of subsystems that reveal more detail. Usingtemplates makes data gathering more efficient. In life cycle design, itmay be best to use a different template for each product system component. Within each component, further distinctions can then be made.Figure 6-2 demonstrates the type of diagram that can help developmentteams gather more specific i_nventories at the single stage or substagelevel.
Quantification
Once the inputs and outputs associated with each activity are described, they can be measured. First, development teams note theamount and concentration of inputs entering the system. Then, usefuloutputs, which include products and co-products, are measured. Finally,the team measures residuals leaving the system as releases to air, water,and land.
Inputs and outputs should not be grouped for reporting unless theirimpacts are precisely the same. For example, a single number shouldnot be used to report air emissions of sulfur dioxide, carbon dioxide, and
Energy
Process Materials,Reagents, Solvents.& Catalysts (inclUdingreuse & recycle fromanother stage)
L--r-------r---r---l Useful Co-product
Product MaterialInputs (includingreuse & recyclefrom another stage)
Single Stage or UnitOperation
Primary Product
ReusefRecycle
Fug~ive &UntreatedWaste
Waste
Treatment &Disposal
Figure 6-2. Single Stage Flow Diagram
104
Environmental Analysis Tools
benzene. Each of these three gases produces a very different impact.Reporting that an activity produced x pounds of all three lumped together would be meaningless. However, outputs that have the same general effect can be grouped. Emissions of greenhouse gases can bereported as a single figure in pounds of carbon dioxide equivalents.
Other types of information that assist an impact analysis should alsobe compiled during the inventory analysis. Items that may be requiredfor an impact analysis include physical properties such as temperature,pressure, and density. For example, the effect of an effluent stream discharged to surface water may depend on temperature. Also, the extentof physical disturbance helps determine the impact of raw material acquisition.
AssumptionsAssumptions used in analysis should be clearly documented. The
significance of these assumptions should also be tested. Sensitivityanalyses can reveal how changing assumptions affect results. This allows development teams to identify critical assumptions, and make surethey reflect reality.
Allocation of Inputs and OutputsProduct systems do not exist in isolation. Many complex processes
cut across multiple product system boundaries. Allocation problemsusually occur in processes with multiple useful outputs. In such cases,design teams should follow logical procedures for assigning inventoriesto individual products. When a process produces several outputs witheconomic value, allocation may be based on [2]:
• The total weight of the main product relative to the co-propucts• The total economic value of the main product relative to the co
products• The total energy value of the main product relative to the co-prod
ucts
The EPA recommends apportioning multiple outputs by weight in mostinstances [7]. As an example, if a certain processing step yields 40% byweight of a material used to fabricate product A and 60% other materialsthat are then converted to additional products, 40% by weight of all thematerials, energy, and residuals associated with this activity are allocated to product A.
105
Inputs and outputs shouldnot be grouped forreporting unless theirimpacts are precisely thesame. For example.emissions of carbondioxide and sunur dioxideshould not be lumpedtogether in a single figurebecause they causedifferent impacts.
Assumptions used inanalysis should be clearlydocumented. Criticalassumptions can then betested to make sure theyreflect reality.
Chapter 6
Data should be qualifiedwith methods ofmeasurement,uncertainties, limits ofdetection, and sources.This helps other membersof the development teammake better evaluations.
Data SourcesData for a process at a specific facility are often the most useful for
analysis. However, when materials or parts come from differentsources, compiling specific data for each can be time consuming. Inmany cases, the only data available may be averages for an entire industry.
Another issue for the design team is method of measurement. Inventory data may either be compiled directly or indirectly. Indirectmeans include modeling and other theoretical methods. In any event,data should be qualified with methods of measurement, uncertainties,limits of detection, and sources. This helps other members of the development team make better evaluations.
Development teams may be able to generate their own data for inhouse activities. But detailed information from outside sources will benecessary for other life cycle stages. Sources of data for an inventoryanalysis include:
Predominantly In-House• purchasing records• utility bills• regulatory record keeping• accident reports• test data and material or product specifications
Public Data• industry statistics• government reports
statistical summariesregulatory reports and summaries
• material, product, or industry studies• publicly available life cycle analyses• material and product specifications• test data from public laboratories
Suppliers and customers are usually the most accessible outsidesources of data, particularly when they are part of the development process. For a full life cycle analysis, data will have to be gathered fromother outside sources. Firms that do not have a stake in the project canbe approached, but they may not be cooperative.
Government reports and statistical summaries present an alternativesource. However, the data they contain might be outdated. In addition,data in such reports are often presented as an average. Broad averagesmay not be suitable for accurate analysis. Journal articles, textbooks,
106
Environmental Analysis Tools
and proceedings from technical conferences are other sources of information for an inventory analysis, but again they may be too general ordated. Other useful sources include trade associations and testing laboratories. Many public laboratories publish their results. These reportscover such issues as consumer product safety, occupational health issues, or aspects of material performance and specifications.
Design teams may also look for conclusions rather than raw data.When a life cycle study of an appropriate process or product exists, itcan greatly simplify analysis. Most existing life cycle analyses havebeen conducted by private research organizations for specific clients.Many of these studies are for internal use and are unavailable to the public. Others may be obtained by contacting either the sponsor or researchcompany. Even when available, these studies are unlikely to cover allnecessary aspects of a design project. Private life cycle studies may alsonot be ideal because their sources can be difficult to verify. This canlead to questions about the reliability of data and conclusions. In addition, results from different studies often conflict because of differentmethodologies.
Limitations
As just discussed, data quality is an ongoing concern in life cycleanalysis. This problem may be due in part to the newness of the fieldand the limited number of studies completed to date. Additional difficulties include:
• Lack of data or inaccessible data• Time and costs constraints for compiling data
There are considerable gaps in data either because it has not beenmeasured or it is inaccessible. Very few data bases similar to those forindustry standards or materials specifications exist for life cycle information. Preliminary attempts in this area can be incomplete.
The level of detail required for an inventory analysis can createother problems. Existing data from outside firms may be withheld forproprietary reasons. The design team may thus not have access to engineering and regulatory reports or detailed specifications for critical design elements.
Given the current nature of life cycle data, compiling a full profileof baseline data and conducting an inventory of design alternatives canbe costly and time consuming. As a result, benchmarking and life cycle
107
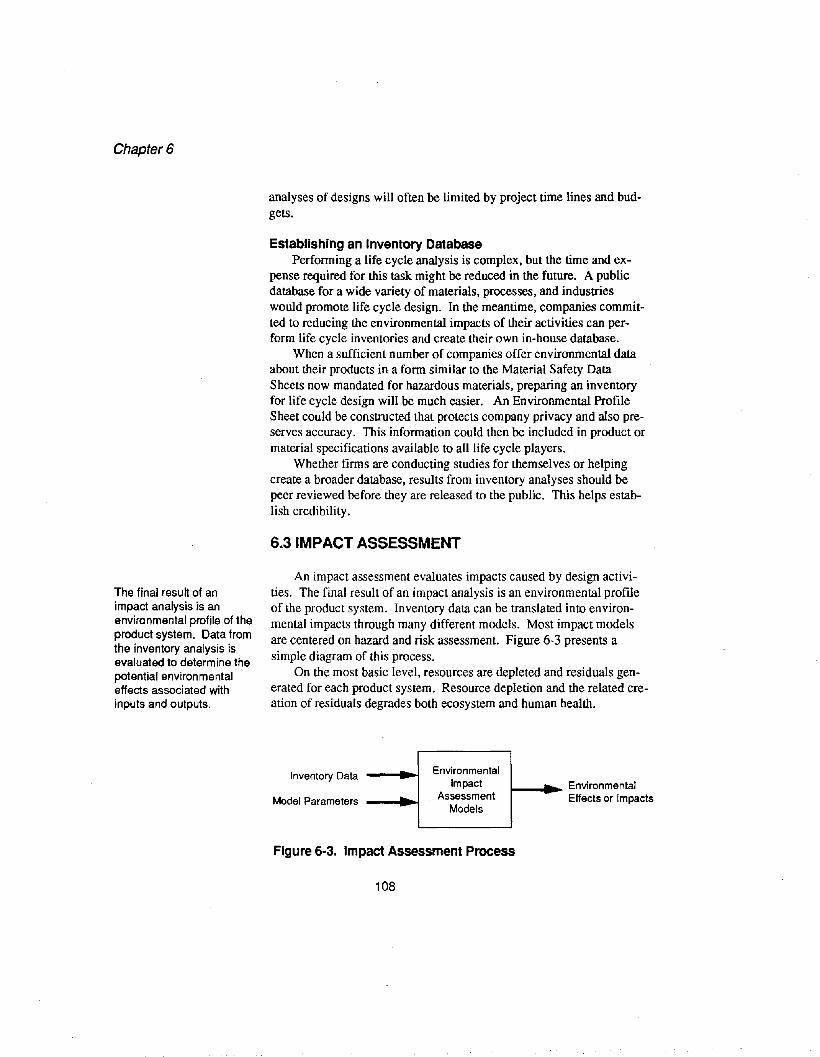
Chapter 6
The final result of animpact analysis is anenvironmental profile of theproduct system. Data fromthe inventory analysis isevaluated to determine thepotential environmentaleffects associated withinputs and outputs.
analyses of designs will often be limited by project time lines and budgets.
Establishing an Inventory DatabasePerforming a life cycle analysis is complex, but the time and ex
pense required for this task might be reduced in the future. A publicdatabase for a wide variety of materials, processes, and industrieswould promote life cycle design. In the meantime, companies committed to reducing the environmental impacts of their activities can perform life cycle inventories and create their own in-house database.
When a sufficient number of companies offer environmental dataabout their products in a form similar to the Material Safety DataSheets now mandated for hazardous materials, preparing an inventoryfor life cycle design will be much easier. An Environmental ProfileSheet could be constructed that protects company privacy and also preserves accuracy. This information could then be included in product ormaterial specifications available to all life cycle players.
Whether firms are conducting studies for themselves or helpingcreate a broader database, results from inventory analyses should bepeer reviewed before they are released to the public. This helps establish credibility.
6.3 IMPACT ASSESSMENT
An impact assessment evaluates impacts caused by design activities. The final result of an impact analysis is an environmental profileof the product system. Inventory data can be translated into environmental impacts through many different models. Most impact modelsare centered on hazard and risk assessment. Figure 6-3 presents asimple diagram of this process.
On the most basic level, resources are depleted and residuals generated for each product system. Resource depletion and the related creation of residuals degrades both ecosystem and human health.
Inventory Data
Model Parameters ...Environmental
ImpactAssessment
Models
1-_....... EnvironmentalEffects or Impacts
Figure 6·3. Impact Assessment Process
108
Environmental Analysis Tools
Environmental impacts can be organized into the following categories:
• resource depletion• ecological degradation• human health effects• other human welfare effects
Other human welfare effects includes such issues as loss of recreational value or scenic beauty. These issues can have a major impact onquality of life. Although other human welfare effects can be a vitaltopic in impact analysis, they are not discussed here.
The type of models needed to evaluate impacts depends on the finalgoal of the analysis. For example, releases of CFCs deplete stratospheric ozone, which can lead to increased levels of ultraviolet radiationreaching the earth's surface. Such increases can cause skin cancer andcataracts in humans, disrupt agriculture, and affect the growth of phytoplankton in the oceans. Complex models are needed to evaluate theozone-depleting potential of CFCs. Equally complex models must beemployed to predict the related human health effects. In many projects,a simple estimate of the ozone-depleting potential of a chemical may beenough to compare competing designs.
Impact analysis is one of the most challenging aspects of life cycledesign. Current methods for evaluating environmental impacts are incomplete. Even when models exist, they can be based on many assumptions or require considerable data.
Despite these problems, some form of impact assessment helps designers and planners understand the environmental consequences of adesign more fully. The following sections describe several aspects ofimpact assessment and their limitations.
Resource Depletion
The quantity of resources extracted and eventually consumed can bemeasured relatively accurately. The environmental and social costs ofresource depletion are much more difficult to assess.
In the end, the availability of resources depends on the resourcebase and extraction technology. Current and projected global demanddetermines when resources will be exhausted. One method for evaluating the potential for depletion expresses product system resource use asa fraction of global demand.
109
Impact analysis is one ofthe most challengingaspects of life cycledesign. Current methodsfor evaluatingenvironmental impacts areincomplete.
Chapter 6
The environmental andsocial costs of resourcedepletion are difficult toassess. Depletion ofnonrenewable resourceslimits their availability tofuture generations.Renewable resources usedfaster than they can bereplaced are actuallynonrenewable.
The amount andavailability of resourcesare ultimately determinedby geological andenergetic constraints, nothuman ingenuity.
Resources and reserves are defined as:
• Resource - A solid, liquid, or gas in the biosphere that is in theproper form or sufficient amount for practical extraction now orin the future.
• Reserve Base - The part of a resource that meets minimal criteriafor current mining and production practices.
• Actual Reserves - The part of a reserve base that can be economically, technically, and legally extracted at present.
Depletion of a nonrenewable resource limits its availability to future generations, but because future generations are unable to bid on theprice of current resources, exploitation may proceed beyond human ability to supply alternatives. Renewable resources used faster than theycan be replaced are actually nonrenewable.
Given recent history, this may not seem very important. In the pasttwo hundred years, human activity has exhausted actual reserves ofsome natural resources that were vital at the time. When this happened,replacements were quickly found. Most of these new resources wereboth cheaper and more suitable for advancing industry. However, itwould be unwise to assume that infinite abundance will be characteristicof the future. It may be true that no critical shortages have yet developed in the very brief history of intensive human resource use, but theamount and availability of resources are ultimately determined by geological and energetic constraints, not human ingenuity.
Another aspect of resource depletion important for impact assessments is resource quality. Resource quality is a measurement of theconcentration of primary material in a resource. In general, as resourcesbecome depleted their quality declines. Using low-quality resourcesmay require more energy and other inputs while producing more waste.
Ecological Effects
Impact and risk reduction activities have largely focused on humanhealth and welfare rather than on ecosystems. This position may beslowly changing as decision makers recognize the strong links betweenhuman health and the health of forests, wetlands, estuaries, and oceans.These four main types of ecosystems have a limited capacity to assimilate waste created by humans. If they are degraded by further intrusions, this will eventually impact human health and welfare.
110
Environmental Analysis Tools
Ecological risk assessment is patterned after human health risk assessment but is more complex. As a first step in analysis, ecologicalstressors are identified; then the ecosystem potentially impacted is determined. Ecological stress agents can be categorized as chemical (e.g.,toxic chemicals released to the environment), physical (e.g., habitat destruction through logging), and biological (e.g., introduction of an exoticspecies).
The Ecology and Welfare Subcommittee of the US EPA ScienceAdvisory Board developed a method for ranking ecological problems[9]. Their report provides a valuable discussion of ecological risk assessment. The Subcommittee's approach was based on a matrix of ecological stress and ecosystem types [10]. Risks were classified accordingto:
• type of ecological response• intensity of the potential effect• time scale for recovery following stress removal• spatial scale (local, regional, biosphere)• transport media (air, water, terrestrial).
The rate of recovery of an ecosystem to a stress agent is a criticalpart of risk assessment. In the extreme case, an ecological stress leadsto permanent changes in community structure or species extinction.The subcommittee classified ecosystem responses to stressors bychanges in:
• biotic community structure (alterations in the food chain and species diversity)
• ecosystem function (changes in rates of production and nutrientcycling)
• species population of particular aesthetic or economic value• potential for the ecosystem to act as a route of exposure to humans
(bioaccumulation)
Determining potential risks and their likely effects is the first step inecological impact assessment. Many stressors can be cumulative, finallyresulting in large-scale problems. Both habitat degradation and atmospheric change are examples of the types of ecological impacts that gainwide attention.
111
Human and ecosystemhealth are strongly linked.Ecosystems have a limitedcapacity to assimilatewaste created byhumans. If they aredegraded by furtherintrusions, this willeventually impact humanhealth and we~are.
Chapter 6
Human activities affectmany ecosystems bydestroying habitat. Whenhabitat is degraded, thesurvival of interrelatedspecies is threatened.
Regional and local effectsof pollution on theatmosphere include acidrain, and smog. Largescale effects include globalclimate change caused byreleases of greenhousegases and increasedultraviolet radiation fromozone-depleting gases.
Habitat DegradationHuman activities affect many ecosystems by destroying habitat.
When habitat is degraded, the survival of many interrelated species isthreatened. The most drastic effect is species extinction. Habitat degradation can be measured by losses in biodiversity, decreased populationsize and range, and decreased productivity and biomass accumulation.
Standard methods of assessing habitat degradation focus on speciesof direct human interest: game fish and animals, songbirds, or valuablecrops [11]. Insects or soil organisms may be a more accurate ecologicalindicator in many systems, but the rapid decline or even extinction ofthese species generates little public interest. For this reason, impact assessments generally rely on popular species.
Ecological degradation does not result from industrial activityalone. Although beyond the scope or control of design, rapid humanpopulation growth creates residential sprawl and can convert natural areas to agriculture. Both are a major source of habitat degradation. Asin other aspects of product development, improved design practicesmust be coupled with changes in societal values and individual behaviorto achieve life cycle goals.
Atmospheric ChangeA full impact assessment includes all scales of ecological impacts.
Impacts can occur on local, regional, or global scales. Regional and local effects of pollution on the atmosphere include acid rain and smog.Large-scale effects include global climate change caused by releases ofgreenhouse gases and increased ultraviolet radiation from ozone-depleting gases.
A relative scale is a useful method for characterizing the impact ofemissions that deplete ozone or lead to global warming. For example,the heat-trapping ability of many gases can be compared to carbon dioxide. This is a logical frame of comparison because carbon dioxide is themain greenhouse gas. Similarly, the ozone depleting effects of emissions can be compared to CFC-12 [12]. Using this common scale makesit easier for others to interpret results. An example of how such scalescan be used is in Appp.i1dix C.
Environmental Fate ModelingSpecific ecological impacts caused by pollution depend on toxicity,
degradation rates, and mobility in air, water, or land. Atmospherictransport, surface water, and groundwater transport models help predictthe fate of chemical releases, but they can be extremely complex. Although crude, equilibrium partitioning models offer one relatively
112
Environmental Analysis Tools
simple approach for predicting the environmental fate of releases. Fac"tors useful for predicting environmental fate include:
• BCF (bioconcentration factor) - chemical concentration in fish/chemical concentration in water
• Vapor pressure• Water solubility• Octanol!water partition coefficient - equilibrium chemical concentra
tion in octanol phase/equilibrium chemical concentration in aqueousphase
• Soil/water partition coefficients - chemical concentration in soil/chemical concentration in aqueous phase
Once pathways through the environment and final fate are determined, impact assessment focuses on effects. For example, impacts depend on the persistence of releases and whether they degrade into furtherhazardous by-products.
Human Health and Safety Effects
In addition to resource depletion and ecological degradation, product development can impact human health and safety in many ways. Impacts can be assessed for individuals and small populations, or risks canbe determined for whole systems. In any event, impacts on humanhealth and safety are usually determined by following these steps:
• Hazard identification - identify the hazardous agent, its chemicaland physical characteristics, and harmful effects
• Risk assessment - establish the dose-response relationship (whatdose of the agent is needed to produce a certain health effect)
• Exposure assessment - determine the route (ingestion, inhalation,skin contact, parenteral administration), frequency, and durationof the exposure
• Risk characterization - estimate the risk from exposure to a particular agent
Determining health risks from many design activities can be verydifficult. Experts, including toxicologists, industrial hygienists, andphysicians, should be consulted in this process. Data sources for healthrisk assessment include biological monitoring reports, epidemiologicalstudies, and bioassays. Morbidity and mortality data are available from
113
Atmospheric transport,surface water, andgroundwater transportmodels help predict thefate of chemical releases,but they can be extremelycomplex.
Chapter 6
Impacts on humans alsoinclude safety. Unsafeactivities cause particulartypes of health problems.Safety generally refers tophysical injury caused by achemical or mechanicalforce.
sources such as the National Institute of Health, the Center for DiseaseControl, and the National Institute of Occupational Safety and Health.
The following list describes a few ways to assess health impacts:
• TI..V-TWA (threshold limit value-time-weighted average): Thisis the time-weighted average concentration for a normal 8-hourworkday and 40-hour workweek to which nearly all workers maybe repeatedly exposed, day after day, without adverse effect [13].
• LDso (median lethal dose): The quantity of a chemical estimatedto be fatal to 50% of test organisms when applied directly [13].
• LCso (median lethal concentration): The concentration of achemical estimated to be fatal to 50% of test organisms whenpresent in their environment. LCso is used to estimate acute lethality of chemicals to aquatic organisms and air-borne chemicalsto terrestrial organisms [13].
• NOEL (no observed effect level)• NOAEL (no observed adverse effect level)
Other methods can be used to compare health impacts of residuals.One approach divides emissions by regulatory standards to arrive at asimple index [2]. These normalized values could be added or comparedif the emission standard for each pollutant was based on the same levelof risk. However, this is usually not true. In addition, such an indexreveals neither severity nor whether effects are acute or chronic. Properly assessing the impact of various releases on human health usually requires more sophistication than such a simple index.
Impacts on humans also include safety. Unsafe activities cause particular types of health problems. Safety generally refers to physical injury caused by a chemical or mechanical force. Sources ofsafety-related accidents include malfunctioning equipment or products,explosions, fires, and spills. Safety statistics are compiled on incidencesof accidents, including hours of lost work and types of injuries. Accident data are available from industry and insurance companies.
In addition, health and safety risks to workers and users depend onergonomic factors. In the case of tools and similar products, biomechanical features, such as grip, weight, and field of movement influenceuser safety and health.
Assessing System RiskHuman error, poor maintenance, and interactions of products or
systems with the environment produce consequences that should not beoverlooked. Although useful for determining human health and safety
114
Environmental Analysis Tools
effects, system risk assessments apply to all other categories of impacts.For example, breakdowns or accidents waste resources and produce pollution that can lead to ecological damage. Large, catastrophic releasesmay have different impacts than continual, smaller releases of pollutants.
When assessing risk, predicting how something can be misused isoften as important as determining how it is supposed to function. Methods of risk assessment can either be relatively simple or quite complex.The most rigorous methods are usually employed to predict the potentialfor high-risk events in complex systems. Risk assessment models can beused in design to achieve inherently safe products. Inherently safe designs result from identifying and removing potential dangers rather thanjust reducing possible risks [14]. A very brief outline of popular risk assessment methods follows.
Simple Risk Assessment Procedures• Preliminary Hazard Analysis• Checklists• WHAT-IF Analysis
A Preliminary Hazard Analysis is well-suited for the earliest phasesof design. This procedure identifies possible hazardous processes orsubstances during the conceptual stage of design and seeks to eliminatethem, thereby avoiding costly and time-consuming delays caused bylater design changes [15].
Checklists ensure that requirements addressing risks have not beenoverlooked or neglected. Design verification is best undertaken by amulti-disciplinary team with expertise in the appropriate areas [16]. AWHAT-IF analysis predicts the likelihood of possible events and determines their consequences through simple, qualitative means. Membersof the development team prepare a list of questions that are then answered and summarized in a table [17].
Mid-Level Risk Assessment Procedures• Failure Mode and Effects Analysis (FMEA)• Hazard and Operability Study (HAZOP)
The Failure Mode and Effects Analysis is also a qualitative method.It is usually applied to individual components to assess the effect of theirfailure on the system. The level of detail is greater than in a WHAT-IFanalysis [18]. Hazard and Operability Studies systematically examine
115
Human error, poormaintenance, andinteractions of products orsystems with theenvironment produce
. consequences that shouldnot be overlooked.

Chapter 6
designs to determine where potential hazards exist and assign priorities.HAZOPS usually focus on process design [19].
Relatively Complex Risk Assessment Procedures• Fault Tree Analysis (FfA)• Event Tree Analysis (ETA)
Fault Tree Analysis is a structured. logical modeling tool that examines risks and hazards to precisely determine undesirable consequences.FfA graphically represents the web of actions leading to each event.Analysis is generally confined to a single system and used to produce asingle number representing the probability of that system's failure. FfAdoes not have to be used to generate numbers; it can also be done qualitatively to improve understanding of how a system works and may fail[21]. Event Tree Analysis studies the interaction of multiple systems ormultiple events. It provides a spectrum of possible outcomes for a sequence of events. ETA is frequently used with FfA to provide quantitative risk assessments [20]. Event trees are also employed to assess theprobability of human errors occurring in a system. Human ReliabilityAnalysis (HRA) can be a key factor in determining risks and hazards.and also in evaluating the ergonomics of a design. HRA can take a variety of forms to provide proactive design recommendations [21].
Limitations
Impact assessment inherits all the problems of inventory analysis.These include lack of data and time and cost constraints. Althoughthere are many impact assessment models. their ability to predict environmental effects varies greatly. Fundamental knowledge in some areasof this field is still lacking.
In addition to basic inventory data, impact analysis requires muchmore information. The often complex and time-consuming task of making further measurements also creates barriers for impact analysis.
Even so, impact analysis is an important part of life cycle design.For now, development teams will have to rely on simplified methods.Analysts should keep abreast of developments in impact analysis so theycan apply the best available tools that meet time and cost constraints.
116
Environmental Analysis Tools
References
1. HlUlt, Robert G., Jere D. Sellers, and William E. Franklin. 1992. Resourceand Environmental Prome Analysis: A Life Cycle Environmental Assessment for Products and Procedures. EnvironmenlaJ Impact Assessmenl Review Spring.
2. Assies, Jan A. 1991. Inlroduction Paper. SET'AC-Europe Workshop on Environmental Life Cycle Analysis of Products, Leiden, Netherlands, 2 December 1991, Leiden, Netherlands: Centre of Environmental Science(CML).
3. Heijungs, R., J. B. Guinee, G. Huppes, R. M. Lankreijer, A. M. M. Ansems,P. G. Eggels, R. van Duin, and H. P. deGoede. 1991. Manual For the Environmenlal Life Cycle Assessmenl ofProducts, Centre of EnvironmentalScience (CML, Leiden), Dutch Organization for Applied Scientific Research (TNO, Ape1doorn), and Fuels and Raw Materials Bureau (B&G,Rotterdam), Netherlands.
4. SET'AC.1991.ATechnicaIFrameworkforLife-CycieAssessmenl. Workshop of the Society of Environmental Toxicologists and Chemists, Smugglers Notch. VT, 18 August 1990, SETAC FOlUldation for EnvironmentalEducation, Washington, DC.
5. Boustead, Ian. 1991. Ecobalances. Automotive Materials and the Environment, Stein am Rhein, Germany, 12 November 1991.
6. World Wildlife FlUld. 1990. Product Life Assessmenls: Policy Issues andImplications, Summary of Forum, Washington, DC, 14 May 1990, Washington, DC: World Wildlife Fund and The Conservation Foundation.
7. Battelle and Franklin Associates. 1992. Life Cycle Assessmenl: InvenloryGuidelines and Principles, US Environmental Protection Agency, RiskReduction Engineering Laboratory, Office of Research and Development,Cincinnati, OH EPN600fR-92/086.
8. Boustead, Ian, and G. F. Hancock. 1979. Handbook ofIndustrial EnergyAnalysis. New York: Wiley.
9. Science Advisory Board. 1990. The Report ofthe Ecology and Welfare Subcommittee, Relative Risk Reduction Project, Environmental ProtectionAgency, Washington, DC SAB-EC-9O-021A.
10. Harwell, M. A., and J. R. Kelly. 1986. Workshop on Ecological EffectsfromEnvironmenlal Stresses, Ecosystems Research Center, Cornell University,Ithaca, NY.
11. Suter, Glenn W. II. 1990. Endpoints for Regional Ecological Risk Assessment. EnvironmenlaJ Managemenl14 (1): 9-23.
12. Assessment Chairs for the Parties to the Montreal Protocol. 1991. Synlhesisof the Reports of the Ozone Scienlific, Environmenlal Effects, and Technology and Economic Assessmenl Panels, UNEP, New York.
13. Hodgson, Ernest, Richard B. Maihnan, and Janice E. Chambers. 1988.McMillan Dietionary ofToxicology. New York: VanNostrand Reinhold.
117
Chapter 6
14. Greenberg, Harris R., and Joseph J. Cramer. 1991. Risk Assessment and RiskManagementfor the Chemical Process Industry. New York: Van NostrandReinhold.
15. Hessian. Robert T. Jr., and Jack N. Rubin. 1991. Preliminary Hazards Analysis. RiskAssessment and Risk Management for the Chemical Process Industry, editors, Harris R. Greenberg, and Joseph J. Cramer, 48-56. NewYork: VanNostrand Reinhold.
16. _. 1991. Checklist Reviews. Risk Assessment and Risk Management forthe Chemical Process Industry, editors, Harris R. Greenberg, and Joseph J.Cramer, 3047. New York: VanNostrand Reinhold.
17. Doerr, William W. 1991. WHAT-IF Analysis. Risk Assessment and RiskManagementfor the Chemical Process Industry, editors, Harris R.Greenberg, and Joseph J. Cramer, 75-90. New York: VanNostrandReinhold.
18. O'Mara, Robert L. 1991. Failure Modes and Effects Analysis. Risk Assessment and Risk Management for the Chemical Process Industry, editors,Harris R. Greenberg, and Joseph J. Cramer, 91-100. New York: VanNostrand Reinhold.
19. Sherrod, Robert M., and William F. Early. 1991. Hazard and OperabilityStudies. Risk Assessment and Risk Management for the Chemical ProcessIndustry, editors, Harris R. Greenberg, and Joseph J. Cramer, 101-126.New York: VanNostrand Reinhold.
20. Greenberg, Harris R., and Barbara B. Salter. 1991. Fault Tree and EventTree Analysis. Risk Assessment and Risk Management for the ChemicalProcess Industry, editors, Harris R. Greenberg, and Cramer Joseph J., 127166. New York: Van Nostrand Reinhold.
21. Stoop, J. 1990. Scenarios in the Design Process. Applied Ergonomics 21 (4):304-310.
118
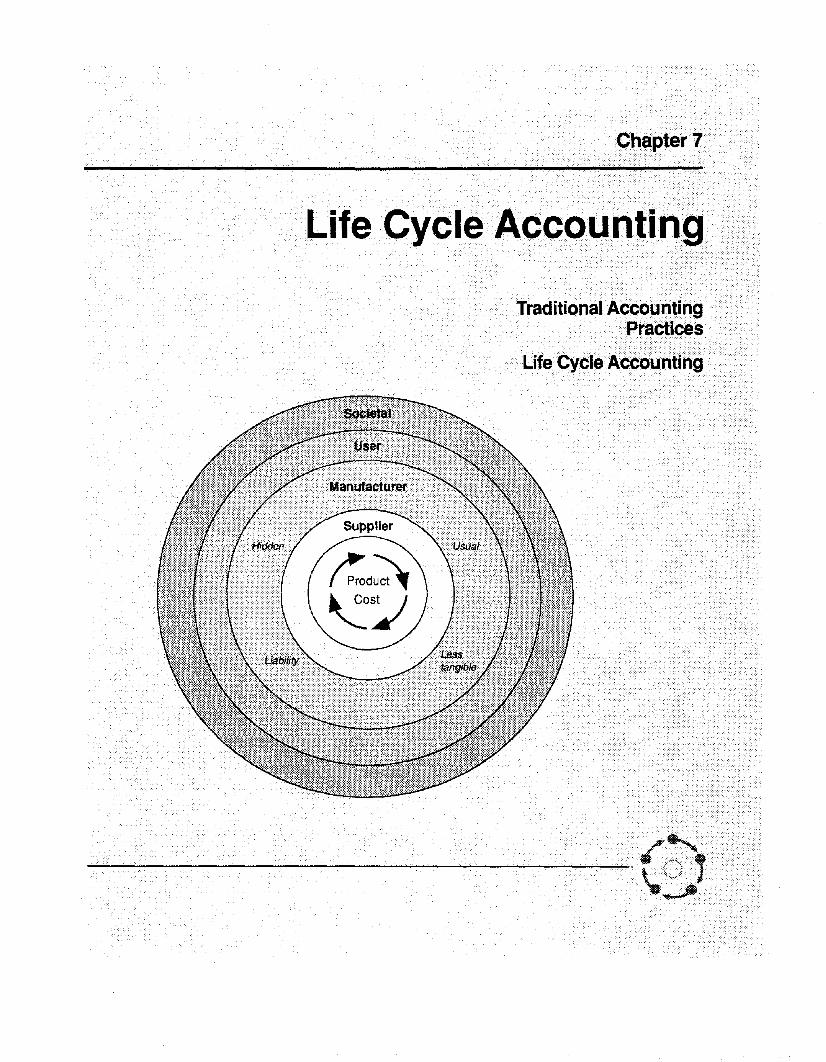
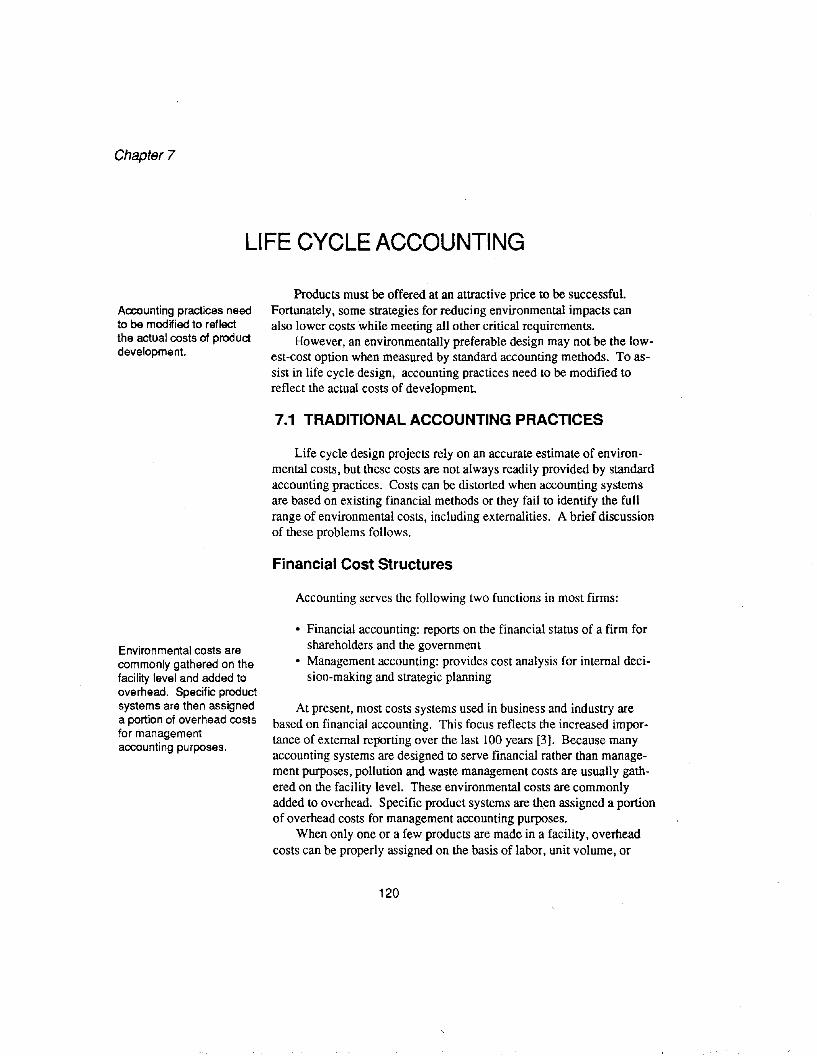
Chapter 7
LIFE CYCLE ACCOUNTING
Accounting practices needto be modified to reflectthe actual costs of productdevelopment.
Environmental costs arecommonly gathered on thefacility level and added tooverhead. Specific productsystems are then assigneda portion of overhead costsfor managementaccounting purposes.
Products must be offered at an attractive price to be successful.Fortunately, some strategies for reducing environmental impacts canalso lower costs while meeting all other critical requirements.
However, an environmentally preferable design may not be the lowest-cost option when measured by standard accounting methods. To assist in life cycle design, accounting practices need to be modified toreflect the actual costs of development.
7.1 TRADITIONAL ACCOUNTING PRACTICES
Life cycle design projects rely on an accurate estimate of environmental costs, but these costs are not always readily provided by standardaccounting practices. Costs can be distorted when accounting systemsare based on existing financial methods or they fail to identify the fullrange of environmental costs, including externalities. A brief discussionof these problems follows.
Financial Cost Structures
Accounting serves the following two functions in most rums:
• Financial accounting: reports on the financial status of a firm forshareholders and the government
• Management accounting: provides cost analysis for internal decision-making and strategic planning
At present, most costs systems used in business and industry arebased on financial accounting. This focus reflects the increased importance of external reporting over the last 100 years [3]. Because manyaccounting systems are designed to serve financial rather than management purposes, pollution and waste management costs are usually gathered on the facility level. These environmental costs are commonlyadded to overhead. Specific product systems are then assigned a portionof overhead costs for management accounting purposes.
When only one or a few products are made in a facility, overheadcosts can be properly assigned on the basis of labor, unit volume, or
120
floor space [3). However, such simple allocation schemes are less accurate in complex facilities. Poor decisions can result from methods thatconceal or distort product costs [4).
Many companies are now adopting activity-based costing (ABC) toimprove their decisions. ABC offers a more accurate method of derivingproduct costs in complex situations [5,6]. But the choice of cost driversand assumptions in ABC must reflect actual costs to be more effectivethan standard accounting methods [7,8).
Rather than attempting to improve allocation methods, future accounting may take advantage of advances in hardware and software togather product-specific costs. Going to the source avoids the need forcomplex disaggregation schemes. Yet trade-offs may continue to existbetween costing methods. It may still be cheaper to allocate generalcosts. The time and expense required for any accounting system shouldalways be weighed against its ability to improve decisions and increaseprofits.
Unidentified Costs
Many environmental costs are not considered in design, regardlessof the management accounting tools used. These include hidden costs,liabilities, and less tangible costs [1]. In some cases, low-impact designsare not pursued because full costs and benefits remain unknown.
Customer awareness of unidentified costs also plays an importantrole in life cycle design. Retail price often drives purchasing decisions,but customers can benefit from a more complete analysis. Life cyclecosting is a useful model for estimating user costs. Equipment purchasesin many firms are already evaluated on the basis of life cycle costingmethods [9]. Direct life cycle costs beyond purchase price include service costs not covered under warranty, cost of consumables such as fuelor electricity, and possible disposal costs. Table 7-1 shows the difference that can exist between initial price and life cycle costs.
Many additional costs are borne by consumers in the form of externalities.
Externalities
The current economic system often does not reflect full environmental costs. Many such costs remain externalities. Externalities are costsborne by society rather than those involved in a transaction. The cost ofdisposal for many products is not included in the initial purchase price.
121
Life Cycle Accounting
Simple allocation methodscan be inaccurate. Ratherthan attempting to improveallocation methods, futureaccounting may takeadvantage of advances inhardware and software togather product-specniccosts.
Many environmental costsare not considered indesign. In some cases,low-impact designs arenot pursued because fullcosts and benefits remainunknown.
Externalities are costs notborne by those involved ina transaction.
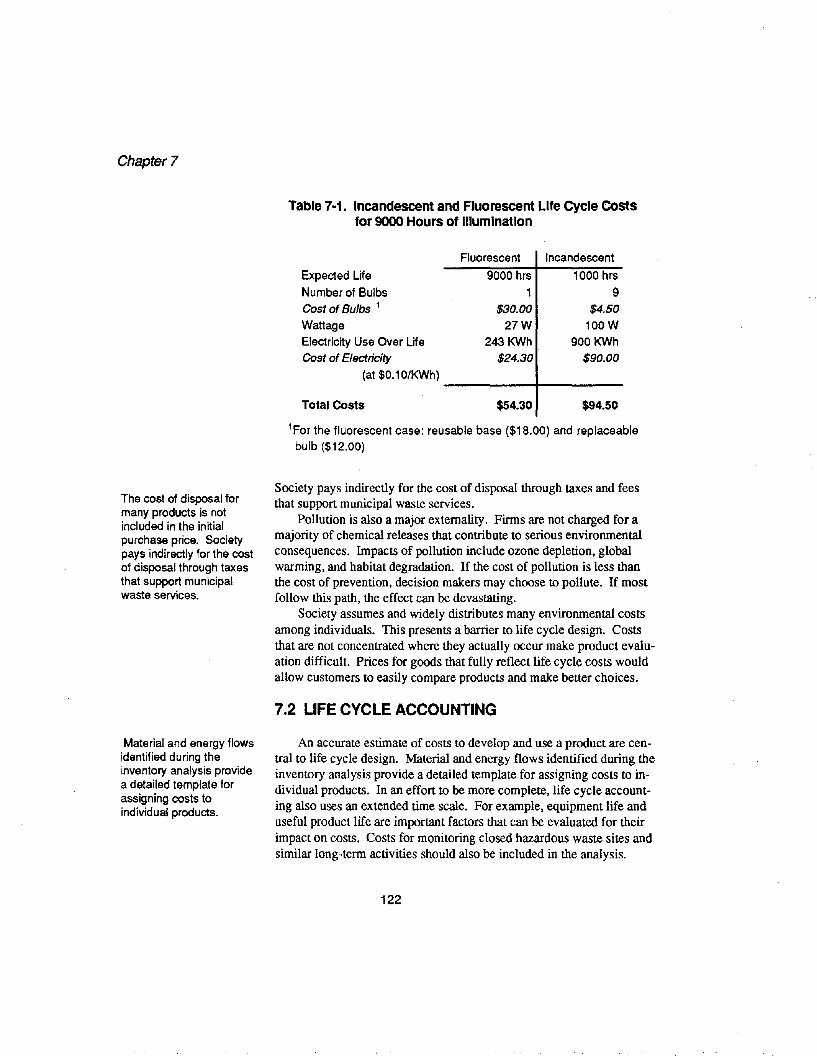
Chapter 7
Table 7·1. Incandescent and Fluorescent Life Cycle COstsfor 9000 Hours of illumination
Fluorescent Incandescent
1000 hrs
9$4.50
100W
900 KWh
$90.00
9000 hrs
1$30.00
27W
243 KWh
$24.30
Expected Life
Number of BulbsCost of Bulbs 1
Wattage
Electricity Use Over Life
Cost of Electricity
(at $0.10/KWh) ------t------Total Costs $54.30 $94.50
lFor the fluorescent case: reusable base ($18.00) and replaceablebulb ($12.00)
The cost of disposal formany products is notincluded in the initialpurchase price. Societypays indirectly for the costof disposal through taxesthat support municipalwaste services.
Society pays indirectly for the cost of disposal through taxes and feesthat support municipal waste services.
Pollution is also a major externality. Firms are not charged for amajority of chemical releases that contribute to serious environmentalconsequences. Impacts of pollution include ozone depletion, globalwarming, and habitat degradation. If the cost of pollution is less thanthe cost of prevention, decision makers may choose to pollute. If mostfollow this path, the effect can be devastating.
Society assumes and widely distributes many environmental costsamong individuals. This presents a barrier to life cycle design. Coststhat are not concentrated where they actually occur make product evaluation difficult. Prices for goods that fully reflect life cycle costs wouldallow customers to easily compare products and make better choices.
7.2 LIFE CYCLE ACCOUNTING
Material and energy flowsidentified during theinventory analysis providea detailed template forassigning costs toindividual products.
An accurate estimate of costs to develop and use a product are central to life cycle design. Material and energy flows identified during theinventory analysis provide a detailed template for assigning costs to individual products. In an effort to be more complete, life cycle accounting also uses an extended time scale. For example, equipment life anduseful product life are important factors that can be evaluated for theirimpact on costs. Costs for monitoring closed hazardous waste sites andsimilar long-term activities should also be included in the analysis.
122
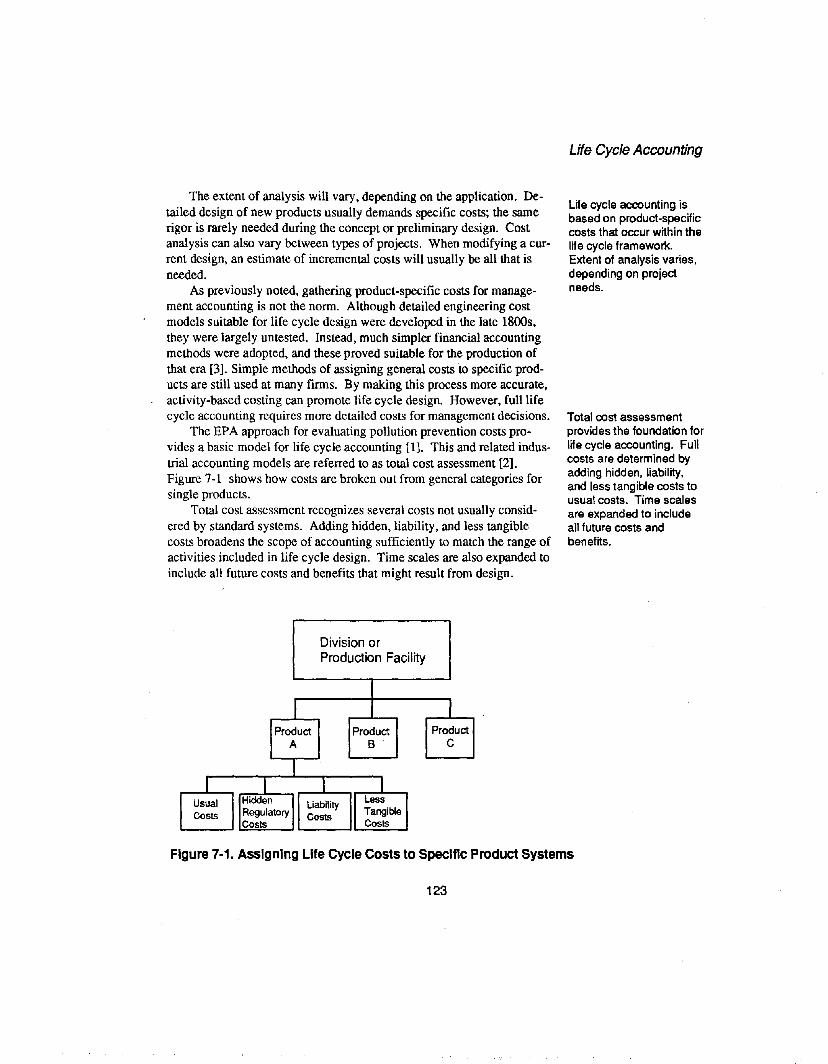
The extent of analysis will vary, depending on the application. Detailed design of new products usually demands specific costs; the samerigor is rarely needed during the concept or preliminary design. Costanalysis can also vary between types of projects. When modifying a current design, an estimate of incremental costs will usually be all that isneeded.
As previously noted, gathering product-specific costs for management accounting is not the norm. Although detailed engineering costmodels suitable for life cycle design were developed in the late 1800s,they were largely untested. Instead, much simpler financial accountingmethods were adopted, and these proved suitable for the production ofthat era [3]. Simple methods of assigning general costs to specific products are still used at many firms. By making this process more accurate,activity-based costing can promote life cycle design. However, full lifecycle accounting requires more detailed costs for management decisions.
The EPA approach for evaluating pollution prevention costs provides a basic model for life cycle accounting [I]. This and related industrial accounting models are referred to as total cost assessment [2].Figure 7-1 shows how costs are broken out from general categories forsingle products.
Total cost assessment recognizes several costs not usually considered by standard systems. Adding hidden, liability, and less tangiblecosts broadens the scope of accounting sufficiently to match the range ofactivities included in life cycle design. Time scales are also expanded toinclude all future costs and benefits that might result from design.
Division orProduction Facility
Life Cycle Accounting
Life cycle accounting isbased on product-specificcosts that occur within thelife cycle framework.Extent of analysis varies,depending on projectneeds.
Total cost assessmentprovides the foundation forlife cycle accounting. Fullcosts are determined byadding hidden, liability,and less tangible costs tousual costs. Time scalesare expanded to includeall future costs andbenefits.
ProductA
ProductB
ProductC
Figure 7·1. Assigning Life Cycle Costs to Specific Product Systems
123
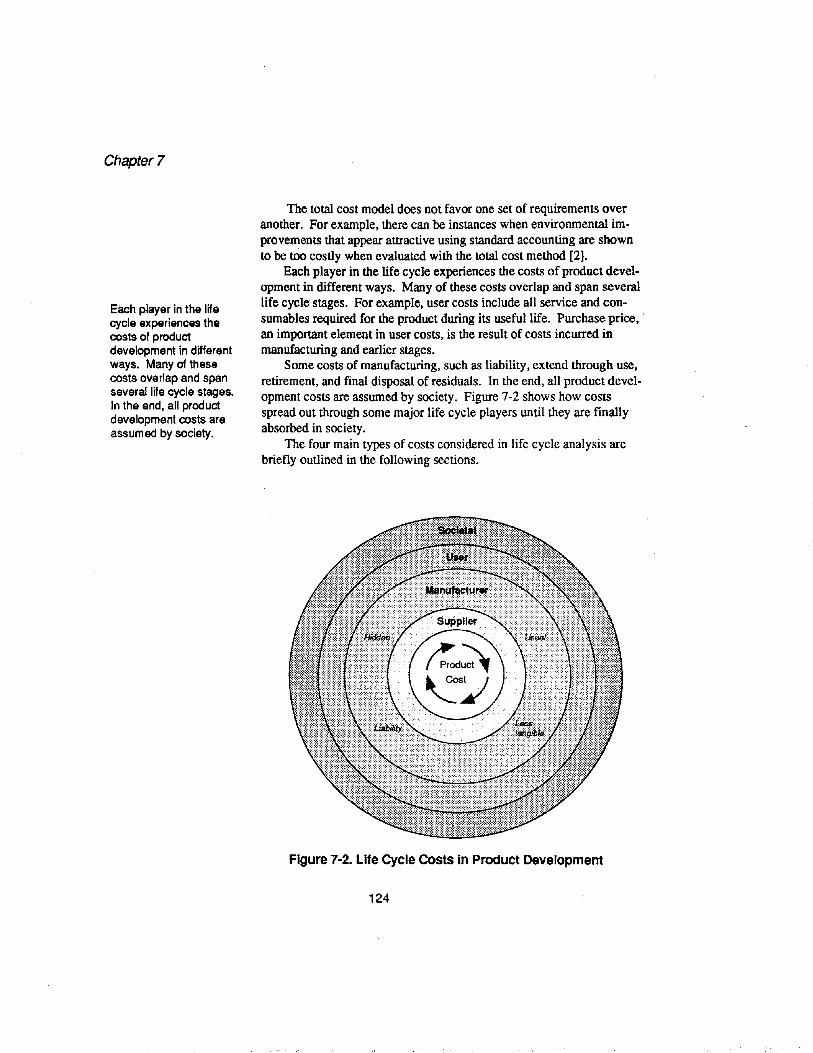
Chapter 7
Each player in the lifecycle experiences thecosts of productdevelopment in differentways. Many of thesecosts overlap and spanseveral life cycle stages.In the end, all productdevelopment costs areassumed by society.
The total cost model does not favor one set of requirements overanother. For example, there can be instances when environmental improvements that appear attractive using standard accounting are shownto be too costly when evaluated with the total cost method [2].
Each player in the life cycle experiences the costs of product development in different ways. Many of these costs overlap and span severallife cycle stages. For example, user costs include all service and consumables required for the product during its useful life. Purchase price, .an important element in user costs. is the result of costs incurred inmanufacturing and earlier stages.
Some costs of manufacturing. such as liability. extend through use,retirement. and final disposal of residuals. In the end. all product development costs are assumed by society. Figure 7-2 shows how costsspread out through some major life cycle players until they are finallyabsorbed in society.
The four main types of costs considered in life cycle analysis arebriefly outlined in the following sections.
Figure 7·2. Life Cycle Costs in Product Development
124
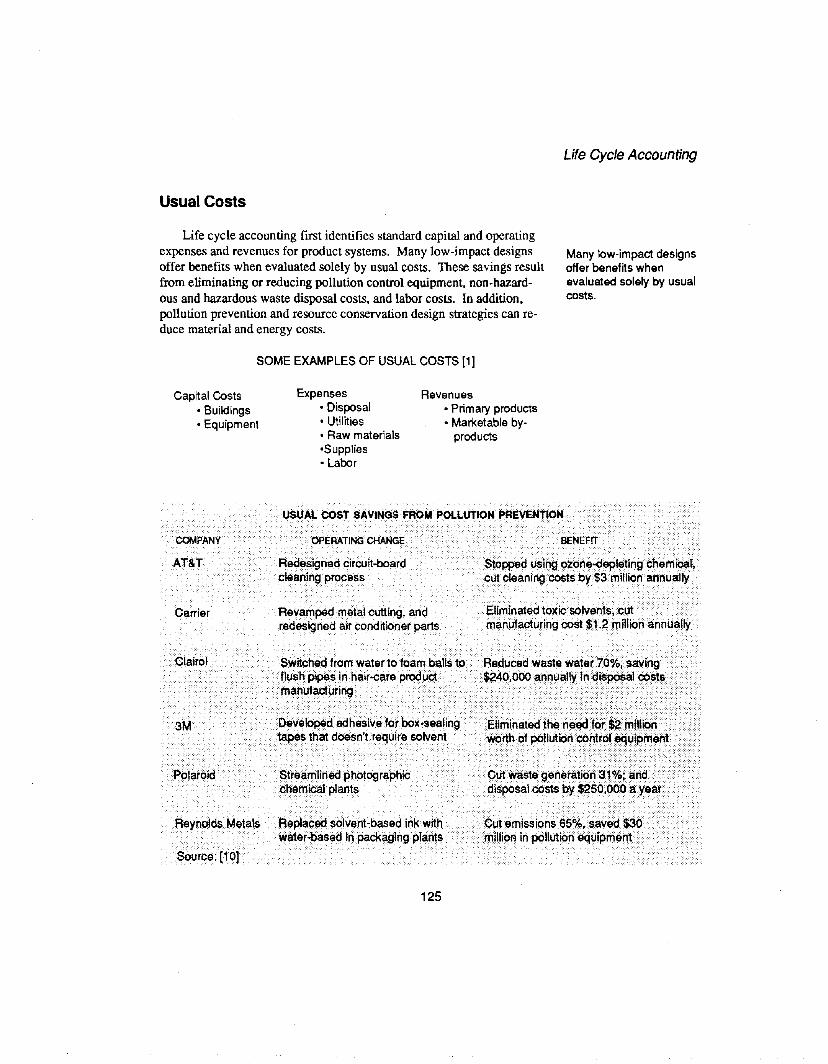
Life Cycle Accounting
Usual Costs
Life cycle accounting first identifies standard capital and operatingexpenses and revenues for product systems. Many low-impact designsoffer benefits when evaluated solely by usual costs. These savings resultfrom eliminating or reducing pollution control equipment, non-hazardous and hazardous waste disposal costs, and labor costs. In addition,pollution prevention and resource conservation design strategies can reduce material and energy costs.
SOME EXAMPLES OF USUAL COSTS [1]
Many low-impact designsoffer benefits whenevaluated solely by usualcosts.
Capital Costs• Buildings• Equipment
Expenses• Disposal• Utilities• Raw materials·Supplies• Labor
Revenues• Primary products• Marketable by
products
USUAL COST SAVINGS FROM POLLUTION PREVENTION
Revamped metal cutting, andredesigned air conditioner parts
BENEfIT
. Eliminated toxic solvents, cutmanufacturing cost $1.2million annually
Clairel:". ',','.,"'- :,':--', '.' " ...-:' -'»,'"',',.-' '<.. _. -" ..
. SwitchfKi from water to foam balls to·. Reduced waste water 70%, saving .f1ushpipesin hair-eare product. .. $240.000 annually in diSp<)sal costs •.....
...• manufacturing . .. .•... . • . .. ..•.. .••.•.. .
Developed adhesive for box-sealing ······~liminatedthe needfor~2~inion•tapes that doesn't require solvent worth of pollution c:O(ltrol~lJipment .
Reynolds ¥etals
Source: {1gr
Streamlined photographicchemical plants
Replaced solvent-based ink withwater'-based in packaging plants
125
::::\>:': :':" :" -: >.:: :': """":<::::::'::::::::::::":.:::-:::'.:::::/:::::::::<:::\.:-::::<:.",:..::,:::::;::<,::'
Cutwast~ gene~ation 310/0; and ••..•.•..•
disposal costs by $250,000 a yesr
'," '." ',.-"'- ,,'.. ,'-.'."
Cut emissions 65%, saved $30.rnillioA in pollution equipment
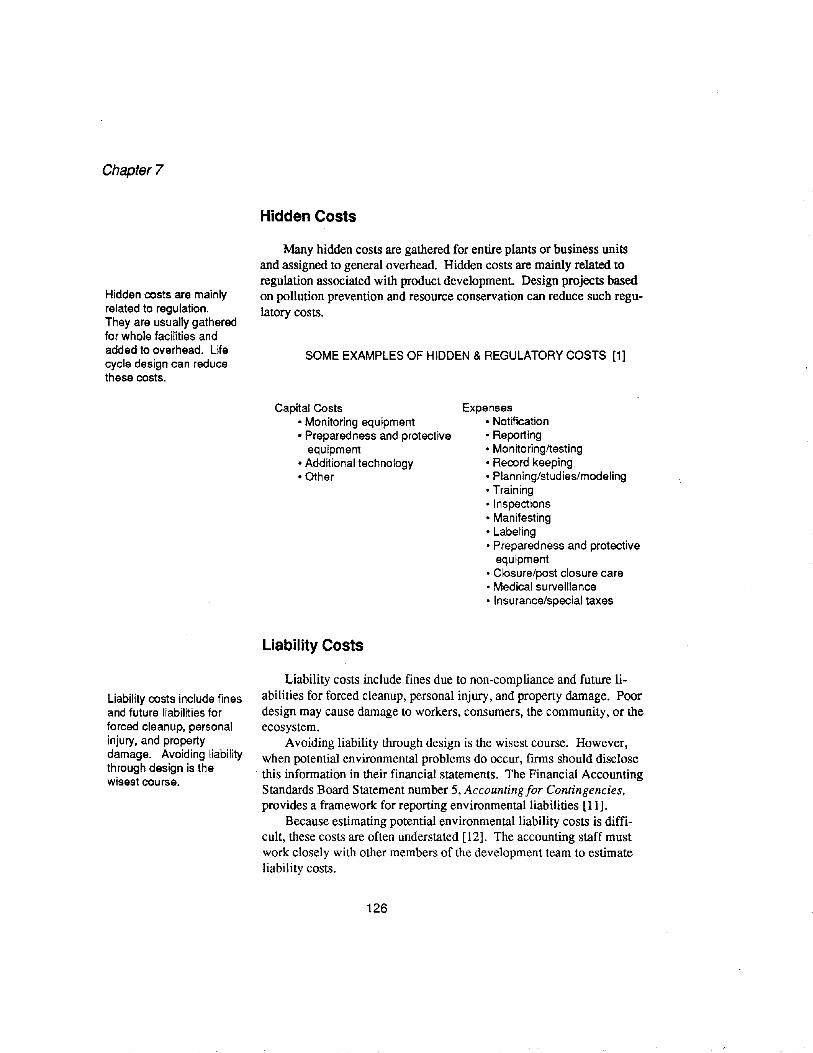
Chapter 7
Hidden costs are mainlyrelated to regulation.They are usually gatheredfor whole facilities andadded to overhead. Lifecycle design can reducethese costs.
Hidden Costs
Many hidden costs are gathered for entire plants or business unitsand assigned to general overhead. Hidden costs are mainly related toregulation associated with product development. Design projects basedon pollution prevention and resource conservation can reduce such regulatory costs.
SOME EXAMPLES OF HIDDEN & REGULATORY COSTS [1J
Capital Costs• Monitoring equipment• Preparedness and protective
equipment• Additional technology• Other
Liability Costs
Expenses• Notification• Reporting• Monitoring/testing• Record keeping• Planning/studies/modeling• Training• Inspections• Manifesting• Labeling• Preparedness and protective
equipment• Closure/post closure care• Medical surveillance• Insurance/special taxes
Liability costs include finesand future liabilities forforced cleanup, personalinjury, and propertydamage. Avoiding liabilitythrough design is thewisest course.
Liability costs include fines due to non-compliance and future liabilities for forced cleanup, personal injury, and property damage. Poordesign may cause damage to workers, consumers, the community, or theecosystem.
Avoiding liability through design is the wisest course. However,when potential environmental problems do occur, firms should disclosethis information in their financial statements. The Financial AccountingStandards Board Statement number 5, Accounting for Contingencies.provides a framework for reporting environmental liabilities [11].
Because estimating potential environmental liability costs is difficult, these costs are often understated [12]. The accounting staff mustwork closely with other members of the development team to estimateliability costs.
126
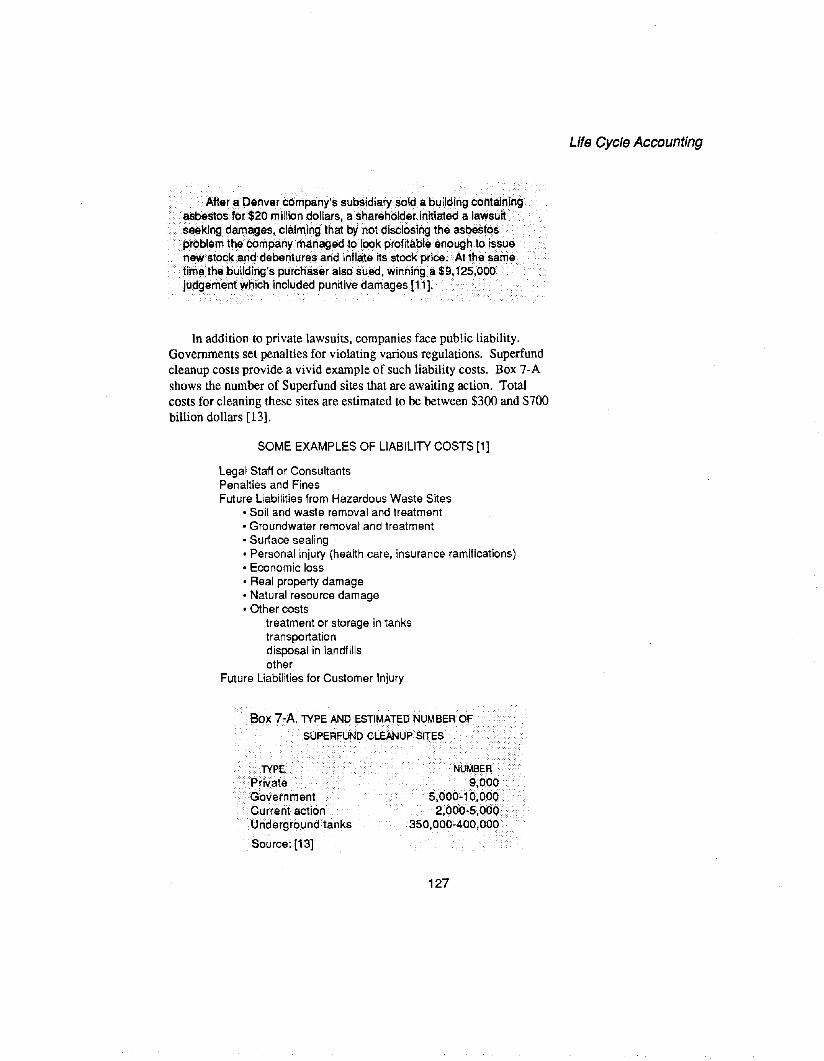
After a DenVerC()ffipany's subsidiary sold a builcjing containingasbestos for $20 miIIiondollars, a shareholderiinitiated a laWsuitseeking damages, claiming that by not disclosing theasbest()spr()blem tMcompanymanagedtokiok profitable enoughtoiss(jenew stock an<:ldebentures and inflate its stock price. Atthesametih'lethebuilding's purchaser also sUed, winning a $9,125,000Ju~emenfwhich included punitivedamagesll1].
In addition to private lawsuits, companies face public liability.Governments set penalties for violating various regulations. Superfundcleanup costs provide a vivid example of such liability costs. Box 7-Ashows the number of Superfund sites that are awaiting action. Totalcosts for cleaning these sites are estimated to be between $300 and $700billion dollars [13].
SOME EXAMPLES OF LIABILITY COSTS [1]
Legal Staff or ConsultantsPenalties and FinesFuture Liabilities from Hazardous Waste Sites
• Soil and waste removal and treatment• Groundwater removal and treatment• Surface sealing• Personal injury (health care, insurance ramifications)• Economic loss• Real property damage• Natural resource damage• Other costs
treatment or storage in tankstransportationdisposal in landfillsother
Future Liabilities for Customer Injury
Box 7-A.TYPE AND ESTIMATED NUMBER OF
SUPERFl.JNOCLEANUP SITES
Life Cycle Accounting
TYPEPrivateGovernmentCurrenfactionUl'ldergrouncftanks
Source: [13]
NUMBER9,O()0
.. 5,000-10,0002,000-5,000
350,000-400,000
127
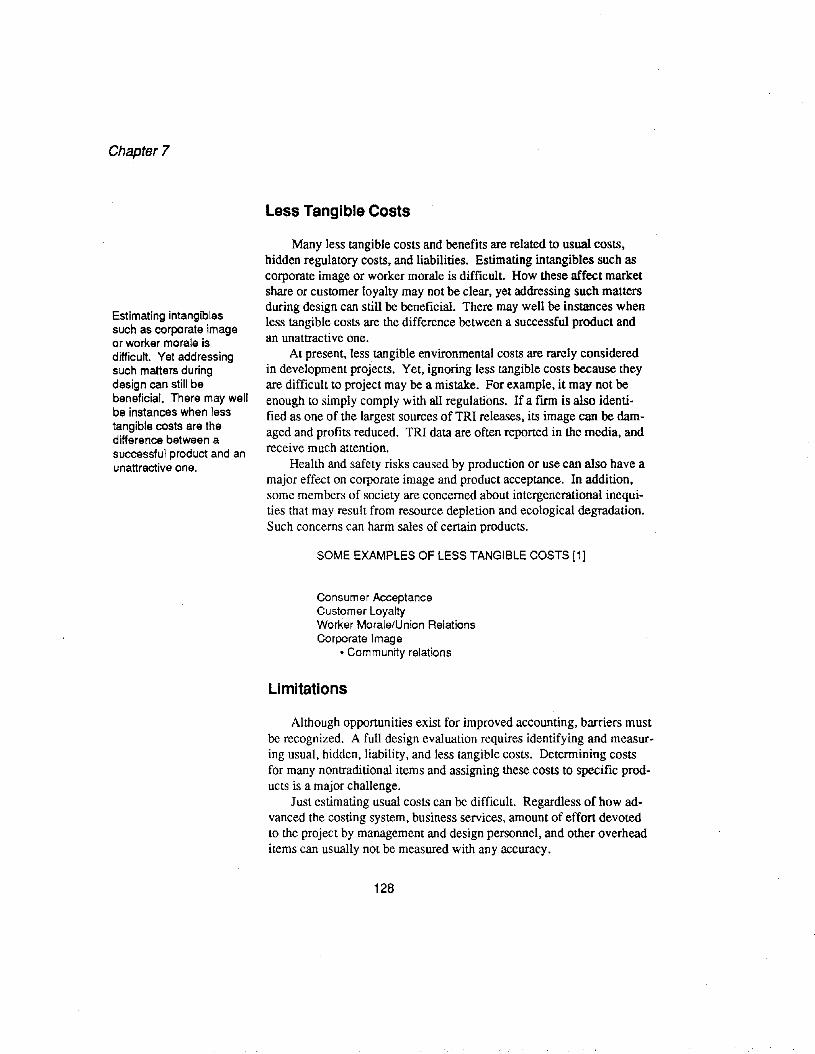
Chapter 7
Estimating intangiblessuch as corporate imageor worker morale isdifficult. Yet addressingsuch matters duringdesign can still bebeneficial. There may wellbe instances when lesstangible costs are thedifference between asuccessful product and anunattractive one.
Less Tangible Costs
Many less tangible costs and benefits are related to usual costs,hidden regulatory costs, and liabilities. Estimating intangibles such ascorporate image or worker morale is difficult. How these affect marketshare or customer loyalty may not be clear, yet addressing such mattersduring design can still be beneficial. There may well be instances whenless tangible costs are the difference between a successful product andan unattractive one.
At present, less tangible environmental costs are rarely consideredin development projects. Yet, ignoring less tangible costs because theyare difficult to project may be a mistake. For example, it may not beenough to simply comply with all regulations. If a finn is also identified as one of the largest sources of TRI releases, its image can be damaged and profits reduced. TRI data are often reported in the media, andreceive much attention.
Health and safety risks caused by production or use can also have amajor effect on corporate image and product acceptance. In addition,some members of society are concerned about intergenerational inequities that may result from resource depletion and ecological degradation.Such concerns can harm sales of certain products.
SOME EXAMPLES OF LESS TANGIBLE COSTS [1]
Consumer AcceptanceCustomer LoyaltyWorker Morale/Union RelationsCorporate Image
• Community relations
Limitations
Although opportunities exist for improved accounting, barriers mustbe recognized. A full design evaluation requires identifying and measuring usual, hidden, liability, and less tangible costs. Detennining costsfor many nontraditional items and assigning these costs to specific products is a major challenge.
Just estimating usual costs can be difficult. Regardless of how advanced the costing system, business services, amount of effort devotedto the project by management and design personnel, and other overheaditems can usually not be measured with any accuracy.
128
In addition, externalities are beyond the scope of most accountingmethods. As long as the costs for pollution, resource depletion, andother externalities do not accrue to firms, accounting systems will notreflect these costs. Cost analysis will only be complete when all environmental costs and benefits are routinely gathered for management andfinancial accounting.
References
1. US EPA. 1989. Pollution Prevention Benefits Manual, US EnvironmentalProtection Agency, Office of Policy, Planning, and Evaluation & Officeof Solid Waste, Washington, DC.
2. White, Allen L., Monica Becker, and James Goldstein. 1992. Total CostAssessment: Accelerating Industrial Pollution Prevention Through Innovative Project Financial Analysis. US Environmental Protection Agency,Office of Pollution Prevention and Toxics, WashingtOTI, DC.
3. Johnson, H. Thomas, and Robert S. Kaplan. 1987. Relevance Lost: The Riseand Fall ofManagement Accounting. Boston, MA: Harvard BusinessSchool Press.
4. Kaplan, Robert S. 1989. Management Accounting for Advanced Technological Environments. Science 245: 819-823.
5. Cooper, Robin, and Robert S. Kaplan. 1988. Measure Costs Right: Makethe Right Decision. Harvard Business Review Sep-Oct: 96-103.
6. _.1991. Profit Priorities from Activity-Based Accounting. HarvardBusiness Review May-Jun: 130-135.
7. Roth, Harold P., and A. Faye Borthick. 1991. Are You Distorting Costs byViolating ABc Assumptions? Management Accounting 73 (5): 39-42.
8. Noreen, Eric. 1991. Conditions Under Which Activity-Based Cost SystemsProvide Relevant Costs. Journal ofManagement Accounting Research 3:159-168.
9. Wilkinson, John. 1986. Life Cycle Costing. Process Engineering 67 (2):42+.
10. Naj, Amal Kumar~ 24 December 1990. Some Companies Cut Pollution byAltering Production Methods. The Wall Street Journal, A, 1+.
11. Zuber, George R., and Charles G. Berry. 1992. Assessing EnvironmentalRisk. Journal ofAccountancy 173 (3): 43-48.
12. Surma, John P., and Albert A. Vondra. 1992. Accounting For Environmental Costs: A Hazardous Subject. Journal ofAccountancy 173 (3): 51-55.
13. Passel, Peter. 1 September 1991. Experts Question Staggering Costs ofToxic Cleanups. The New York Times, A, 1.
129
Life Cycle Accounting

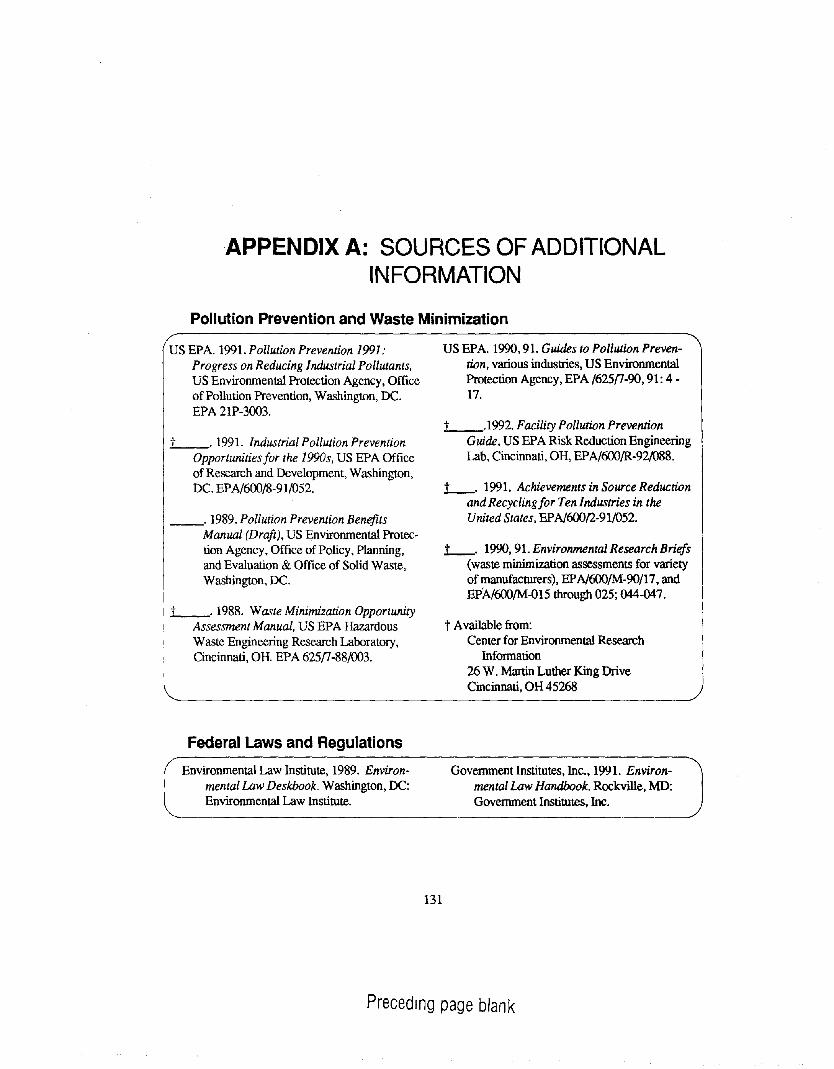
APPENDIX A: SOURCES OF ADDITIONALINFORMATION
Pollution Prevention and Waste Minimization
US EPA. 1991. Pollution Prevention 1991:Progress on Reducing Industrial Pollutants.US Environmental Protection Agency, Officeof Pollution Prevention, Washington, DC.EPA 21P-3003.
L-. 1991. Industrial Pollution PreventionOpportunities for the 199Os. US EPA Officeof Research and Development, Washington,DC. EPN600/8-91/052.
__. 1989. Pollution Prevention BenefitsManual (Draft), US Environmental Protection Agency, Office of Policy, Planning,and Evaluation & Office of Solid Waste,Washington, DC.
L-.1988. Waste Minimization OpportunityAssessment Manual. US EPA HazardousWaste Engineering Research Laboratory,Cincinnati, OH. EPA 625n-88/003.
Federal Laws and Regulations
Environmental Law Institute, 1989. Environmental Law Deskbook. Washington, DC:Environmental Law Institute.
US EPA. 1990,91. Guides to Pollution Prevention. various industries, US EnvironmentalProtection Agency, EPA /625n-CXJ, 91: 417.
L-.1992. Facility Pollution PreventionGuide. US EPA Risk Reduction EngineeringLab, Cincinnati, OH, EPN600IR-92/088.
1--. 1991. Achievements in Source Reductionand Recyclingfor Ten Industries in theUnited States. EPN600{2-91/052.
1--. 1990,91. Environmental Research Briefs(waste minimization assessments for varietyof manufacturers), EPN600/M-CXJ/17, andEPA,l600/M-015 through 025; 044-047.
t Available from:Center for Environmental Research
Information26 W. Martin Luther King DriveCincinnati, OH 45268
Government Institutes, Inc., 1991. Environmental Law Handbook. Rockville, MD:Government Institutes, Inc.
131
Preceding page blank
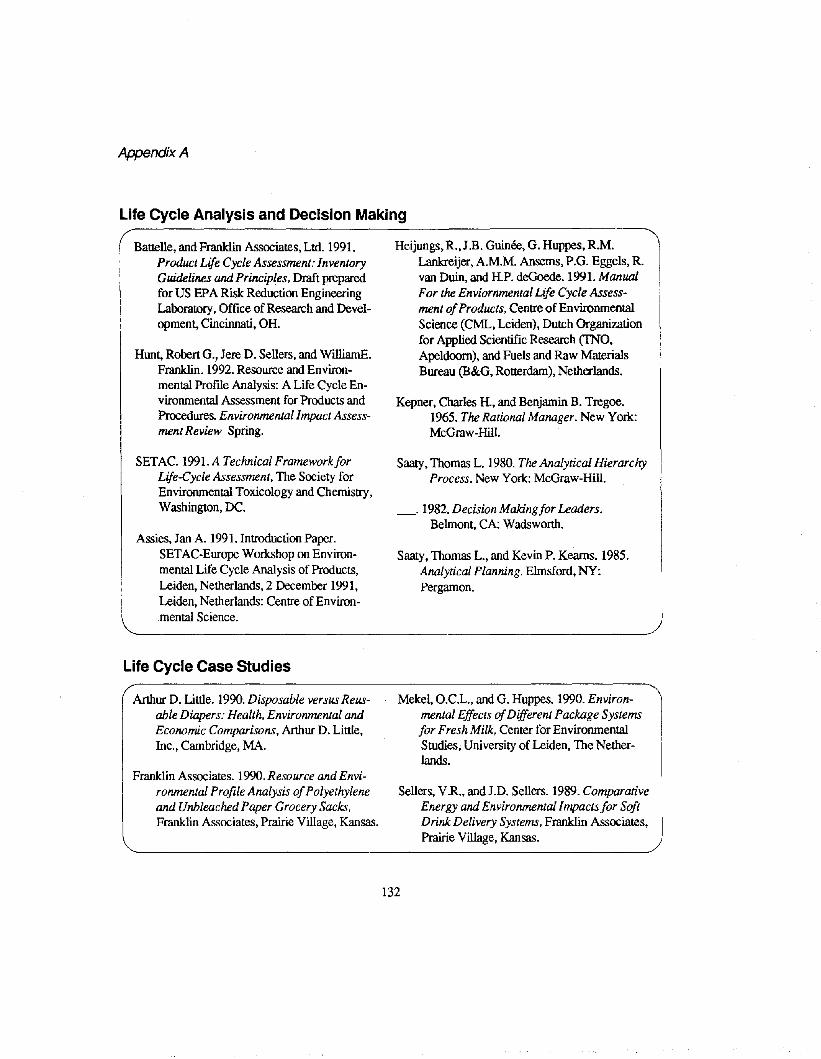
Appendix A
Life Cycle Analysis and Decision Making
Battelle, and Franklin Associates, Ltd. 1991.Product Life Cycle Assessment: InventoryGuidelines and Principles. Draft preparedfor US EPA Risk Reduction EngineeringLaboratory, Office of Research and Development, Cincinnati, OH.
Hunt, Robert G., Jere D. Sellers, and WilliamE.Franklin. 1992. Resource and Environmental ProfJle Analysis: A Life Cycle Environmental Assessment for Products andProcedures. Environmental Impact Assessment Review Spring.
SETAe. 1991. A Technical FrameworkforLife-Cycle Assessment, The Society forEnvironmental Toxicology and Chemistry,Washington, DC.
Assies, Jan A. 1991. Introduction Paper.SETAC-Europe Workshop on Environmental Life Cycle Analysis of Products,Leiden, Netherlands, 2 December 1991,Leiden, Netherlands: Centre of Environmental Science.
Life Cycle Case Studies
Arthur D. Little. 1990. Disposable versus Reusable Diapers: Health, Environmental andEconomic Comparisons, Arthur D. Little,Inc., Cambridge, MA.
Franklin Associates. 1990. Resource and Environmental Profile Analysis ofPolyethyleneand Unbleached Paper Grocery Sacks.Franklin Associates, Prairie Village, Kansas.
Heijungs, R., J.B. Guinee, G. Huppes, R.M.Lankreijer, A.M.M. Ansems, P.G. Eggels, R.van Duin, and H.P. deGoede.l99l. ManualFor the Enviornmental Life Cycle Assessment ofProducts, Centre of EnvironmentalScience (CML, Leiden), Dutch Organizationfor Applied Scientific Research (1NO,Apeldoom), and Fuels and Raw MaterialsBureau (B&G, Rotterdam), Netherlands.
Kepner, Charles H., and Benjamin B. Tregoe.1965. The Rational Manager. New York:McGraw-Hill.
Saaty, Thomas L. 1980. The Analytical HierarchyProcess. New York: McGraw-Hill.
_.1982. Decision Makingfor Leaders.Belmont, CA: Wadsworth.
Saaty, Thomas L., and Kevin P. Keams. 1985.Analytical Planning. Elmsford, NY:Pergamon.
Mekel, O.e.L., and G. Huppes. 1990. Environmental Effects ofDifferent Package Systemsfor Fresh Milk. Center for EnvironmentalStudies, University of Leiden, The Netherlands.
Sellers, VR., and J.D. Sellers. 1989. ComparativeEnergy and Environmental Impacts for SoftDrink Delivery Systems, Franklin Associates,Prairie Village, Kansas.
132
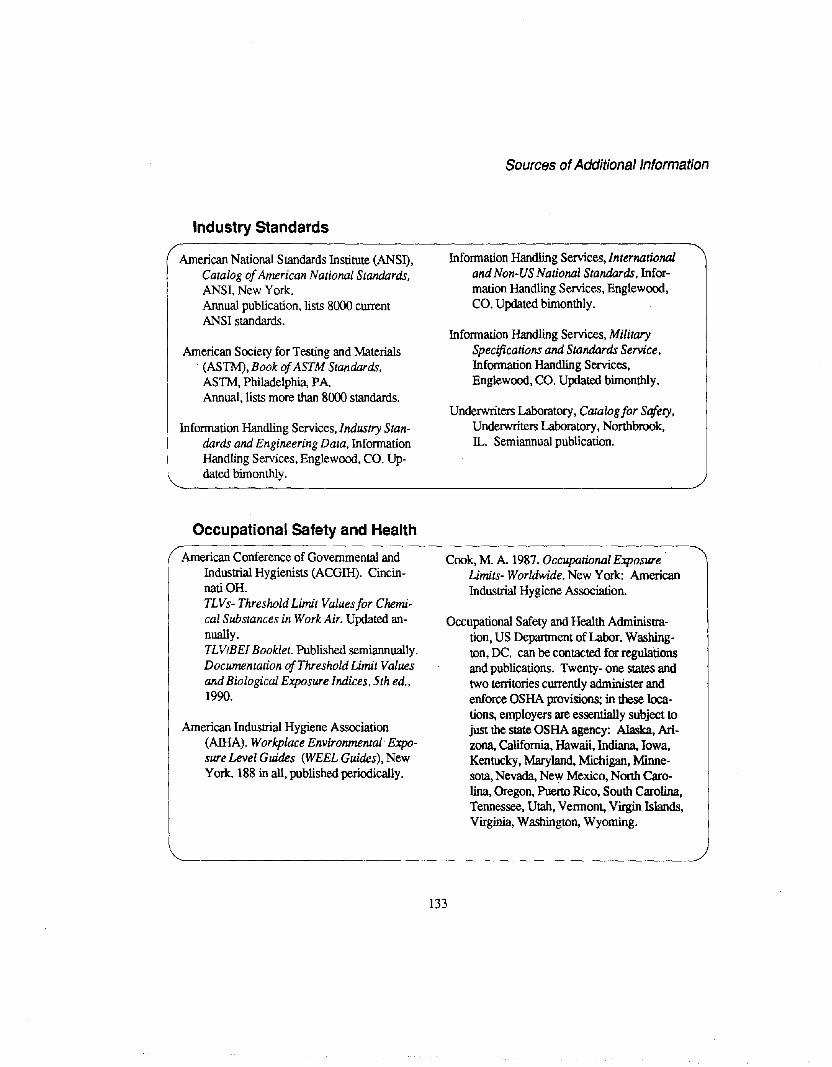
Industry Standards
American National Standards Institute (ANSI),Catalog ofAmerican National Standards.ANSI, New York.Annual publication, lists 8000 currentANSI standards.
American Society for Testing and Materials. (ASTM), Book ofASTM Standards,
ASTM, Philadelphia, PA.Annual, lists more than 8000 standards.
Information Handling Services, Industry Standards and Engineering Data, InformationHandling Services, Englewood, CO. Updated bimonthly.
Occupational safety and Health
American Conference of Governmental andIndustrial Hygienists (ACGIH). CincinnatiOH.TLVs- ThresholdLimit Valuesfor Chemical Substances in Work Air. Updated annually.TLVIBEI Booklet. Published semiannually.Documentation ofThreshold Limit Valuesand Biological Exposure Indices, 5th ed..1990.
American Industrial Hygiene Association(AIHA). Workplace Environmental· Exposure Level Guides (WEEL Guides), NewYork. 188 in all, published periodically.
Sources ofAdditional Information
Information Handling Services, Internationaland Non-US National Standards, Information Handling Services, Englewood,CO. Updated bimonthly.
Information Handling Services, MilitarySpecifications and Standards Service,Information Handling Services,Englewood,CO. Updated bimonthly.
Underwriters Laboratory, Catalogfor Safety,Underwriters Laboratory, Northbrook,n... Semiannual publication.
Cook, M. A. 1987. Occupational ExposureLimits- Worldwide. New York: AmericanIndustrial Hygiene Association.
Occupational Safety and Health Administration, US Department of Labor. Washington, DC. can be contacted for regulationsand publications. Twenty- one states andtwo territories currently administer andenforce OSHA provisions; in these locations, employers are essentially subject tojust the state OSHA agency: Alaska, Arizona, California, Hawaii, Indiana, Iowa,Kentucky, Maryland, Michigan, Minnesota, Nevada, New Mexico, North Carolina, Oregon, Puerto Rico, South Carolina,Tennessee, Utah, Vermont, Virgin Islands,Virginia, Washington, Wyoming.
133
APPENDIX B: SUMMARY OF MAJOR FEDERALENVIRONMENTAL LAWS
ACTS
REGULATIONS
CLEAN AIRACT
Administered by theUS EPA
o Legislation established by Congress describing a policy or program.o The Act generally designates an agency, department or commission
which has more expertise than Congress to develop specific details ofthe program.
o Some provisions of the Act apply directly to the public.o Laws are generally implemented through regulations, guidance
documents, policy statements, and enforcement.
Regulations are published in the Federal Register. Each year, they arecompiled and placed in the Code ofFederal Register.
BackgroundThe Federal Clean Air Act was enacted in 1970, substantially amended
in 1977, and significantly expanded in 1990. The 1970 act contained threetitles: Title I dealt with stationary sources, Title II dealt with mobilesources such as cars, and Title III provided definitions and standards forjudicial review and citizen suits. The 1977 amendments retained thisstructure, adding special provisions for areas with cleaner air in subtitle Cof Title I, and nonattainment areas in subtitle D. The 1990 amendmentsoverhauled the nonattainment provisions in subtitle D of Title I, addedcomprehensive technology-based regulations of toxic air pollutants in arewritten section 112, added Title IV to deal with acid rain (focused on thepower plants thought to be the primary source of these emissions), andadded Title V to greatly strengthen enforcement provisions and set muchstricter requirements for nonattainment areas and emissions from mobilesources. Title VI was also include to mandate the phase-out of chlorofluorocarbons (CFCs).
134
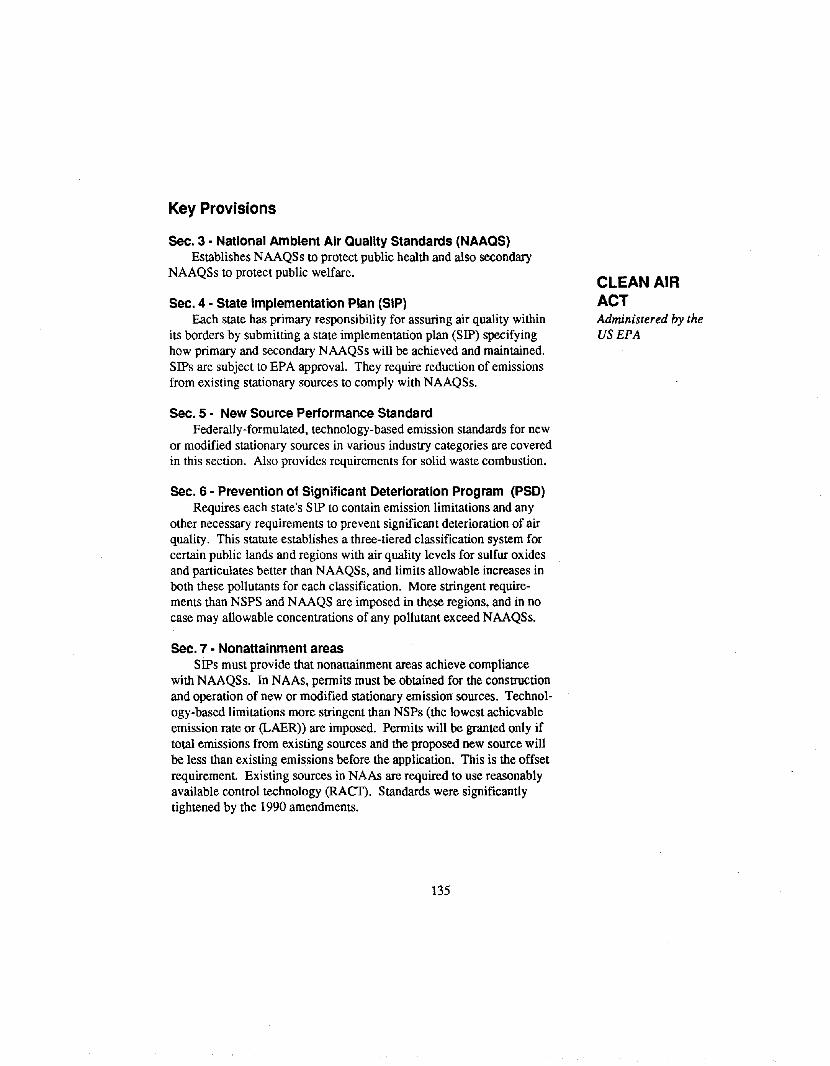
Key Provisions
Sec. 3 • National Ambient Air Quality Standards (NAAQS)Establishes NAAQSs to protect public health and also secondary
NAAQSs to protect public welfare.
Sec. 4 • State Implementation Plan (SIP)Each state has primary responsibility for assuring air quality within
its borders by submitting a state implementation plan (SIP) specifyinghow primary and secondary NAAQSs will be achieved and maintained.SIPs are subject to EPA approval. They require reduction of emissionsfrom existing stationary sources to comply with NAAQSs.
Sec. 5 - New Source Performance StandardFederally-formulated, technology-based emission standards for new
or modified stationary sources in various industry categories are coveredin this section. Also provides requirements for solid waste combustion.
Sec. 6 - Prevention of Significant Deterioration Program (PSD)Requires each state's SIP to contain emission limitations and any
other necessary requirements to prevent significant deterioration of airquality. This statute establishes a three-tiered classification system forcertain public lands and regions with air quality levels for sulfur oxidesand particulates better than NAAQSs, and limits allowable increases inboth these pollutants for each classification. More stringent requirements than NSPS and NAAQS are imposed in these regions, and in nocase may allowable concentrations of any pollutant exceed NAAQSs.
Sec. 7 • Nonattainment areasSIPs must provide that nonattainment areas achieve compliance
with NAAQSs. In NAAs, permits must be obtained for the constructionand operation of new or modified stationary emission sources. Technology-based limitations more stringent than NSPs (the lowest achievableemission rate or (LAER)) are imposed. Permits will be granted only iftotal emissions from existing sources and the proposed new source willbe less than existing emissions before the application. This is the offsetrequirement. Existing sources in NAAs are required to use reasonablyavailable control technology (RACT). Standards were significantlytightened by the 1990 amendments.
135
CLEAN AIRACTAdministered by theUS EPA

Appendix B
CLEAN AIRACTAdministered by theUS EPA
Section 8· National Emission Standards for Hazardous AirPollutants (NESHAPs)
Addresses particularly hazardous air pollutants that may not becovered by NAAQSs. Pollutants covered in this section "may reasonably be anticipated to result in an increase in mortality, or an increase inserious irreversible, or incapacitating reversible illness." Standards areimposed on both new and existing sources for 189 listed hazardous airpollutants or categories of pollutants.
section 9 • Acid rain provisionsAddresses the Title IV acid rain program and imposes regulations
on fossil-fueled power plants.
section 10· New permitting requirementsExplains Title V's new permit program for stationary sources and
new regulations imposed on those sources.
section 11· Mobile source and fuel requirementsAddresses the mobile source and fuel requirements of the 1990
amendments of Title II.
Section 12· Ozone protectionRequires the phase-out of CFCs and other substances thought to
destroy the ozone layer.
CLEAN WATERACT
Administered by theUS EPA
BackgroundIn 1972 Congress passed the Federal Water Pollution Control Act;
the act was amended and renamed the Clean Water Act in 1977 and itsregulatory focus changed to control of toxic pollutants. In 1987,extensive amendments were added to the act to improve water quality inareas where existing minimum discharge standards were insufficient toassure attainment of stated water quality goals. The objective of theCWA is to restore and maintain the chemical, physical, and biologicalintegrity of the nation's waters.
136
Summary of Major Federal Environmental Laws
Key Provisions
Grants for construction of treatment worksProvides for the application of the best practicable technology, and
states that waste treatment management should be on an areawide basis,addressing both point and nonpoint sources.
National Pollutant Discharge Elimination System (NPDES)This is the primary mechanism for imposing limitations on pollut
ant discharges. Under the NPDES program, discharge of any pollutantfrom public or private point sources requires a permit. In addition, theNational Pollution Discharge Elimination System requires all dischargers to disclose the volume and nature of their discharges and report oncompliance with mandated limitations.
Effluent standards are derived through two methods:• Technology -based effluent limitations require that point sources
of toxic, nonconventional, and conventional pollutants must complywith effluent limitations based on the best available technology economically achievable (BAT) for toxic and nonconventional sources, andbest conventional pollution control technology (BCT) for conventionalsources.
• Water quality-related effluent limitations. If, after application oftechnology-based limits, effluent discharges interfere with attainment ormaintenance of water quality, additional effluent limitations may beestablished.
Water quality standards and implementation plansEstablishes procedures for reviewing and modifying existing state
water q~ality standards and issuing new standards. Each state isrequired to have a continuing planning process that incorporatesareawide waste treatment management and total maximum daily loadsto maintain water quality.
New source performance standards (NSPS)Creates and regulates new source performance standards.
Toxic and pretreatment effluent standardsProvides for additional requirements on discharges of toxic chemi
cals and provides for special situations such as oil spills.
137
CLEAN WATERACT
Administered by theUS EPA
Appendix B
CERCLAANDSUPERFUNDAMENDMENTAND~1D"
ACT (SARA)
Administered by theUS EPA
BackgroundThe Comprehensive Emergency Response, Compensation and
Liability Act (CERCLA) was enacted 1980, Significant revisions toCERCLA were made through SARA in 1986, SARA substantiallyexpanded the scope and complexity of CERCLA, but it is part of theoriginal act, not a replacement
The goal of this legislation is to provide funding and enforcementauthority for cleaning up thousands of hazardous waste sites in the USand responding to hazardous substances spills, Funding for theseactivities is derived from special taxes on the petrochemical andchemical industry, domestic and imported crude oil, and other basicindustries such as automobile, aircraft, and electronics manufacturers.The act covers all environmental media (air, water, land). Federallypermitted releases under the Clean Air Act and Clean Water Act areexempt from emergency response. Other than these exemptions,CERCLA response or liability is broadly triggered by the release orthreat of release of a hazardous substance or pollutant or contaminant
Definition of hazardous substance
• Any substance designated as hazardous under the Clean Air Act,Clean Water Act, Toxic Substances Control Act, or any RCRA hazardous waste. By 1990, there were about 720 hazardous substances and1500 radionuclides on the list
• Actions can be triggered by any concentration of a listed substance, and this substance does not have to be a waste; it can be aproduct or classified in some other manner. Thus, waste that is judgedto be RCRA nonhazardous may come under CERCLA jurisdiction.
Key Provisions
National Contingency Plan (NCP)States that a NCP shall be published.by the President to provide forefficient and coordinated action and establish priorities for variousreleases.
138
Summary of Major Federal Environmental Laws
Liability of responsible parties and financing options forremedial actions
• Parties who may be responsible- past owners or operators of the site
CERCLAANDSUPERFUNDAMENDMENTANDfI:AlJ11-[JIZAlD'ACT (SARA)
Administered by theUS EPA
BackgroundThis legislation was enacted as a freestanding provision of the
Superfund Amendments and Reauthorization Act (SARA) of 1986. TheDecember 1984 release of methyl isocyanate in Bhopal, India whichkilled thousands of people was the major impetus for this act.
Key Provisions
Subtitle A -Emergency response and notification for extremelyhazardous substances
Section 302 and 304• Compels state and local governments to develop plans for
responding to unanticipated environmental releases of a number ofchemical substances identified as extremely hazardous. When the lawwas written, 402 extremely hazardous substances (EHSs) were listed.Mandates creation of State Emergency Response Commissions(SERCs) and Local Emergency Planning Committees (LEPCs).
• Requires facilities containing EHSs in excess of specifiedthreshold planning quantities (TPQs) to notify state and local emergency planning entities of the presence of those substances and to reporton the inventory and environmental releases (planned and unplanned) inexcess of specified reportable quantities (RQs) of those substances.Releases of certain substances requires emergency notification to stateand local commissions and the EPA.
139
EMERGENCYPLANNING ANDCOMMUNITYRIGHT TOKNOW ACT(EPCRA)(SARA TITLE III)
Administered by theUS EPA
Appendix B
EMERGENCYPLANNING ANDCOMMUNITYRIGHT TOKNOW ACT(EPCRA)(SARA TITLE III)
Administered by theUS EPA
Subtitle B • Reporting and notification requirements for toxicand hazardous substances
Section 311 and 312 - Hazardous chemical provisionsInventories and site-specific infonnation on chemicals considered
physical or health hazards under OSHA's Hazard CommunicationStandard must be provided through material safety data sheets (MSDS)to state and local authorities, including fire departments.
Section 313 - Toxic chemical release reporting• Applies to certain manufacturing facilities or operators with 10 or
more employees in SIC codes 20 - 39 manufacturing or using listedchemicals in excess of specified threshold quantities.
• The purpose of section 313 reporting is to infonn governmentofficials and the public about releases of toxic chemicals in the environment.
• Facilities must compile a toxic chemical release inventory (TRI)which identifies how many pounds of chemicals identified as a concernwere released to air, water, or land or transferred off site (chemicalsshipped off site may be sent to RCRA-regulated treatment, storage, anddisposal facilities, to public sewage treatment plants, or to otherdisposal sites).
• In 1989,22,569 facilities reported releases of 5.7 billion poundsof the 322 listed chemicals/chemical categories. 74% of this total wasreleased on site to air, water, and land; 26% was transferred off site. 25chemicals accounted for 83% of TRI releases in 1989. The chemicalindustry accounted for 48% of total releases.
• Threshold reporting limit was lowered from 75,000 lbs in 1987to 25,000 lbs in 1989 for facilities manufacturing or processing listedchemicals. Facilities otherwise using listed chemicals in excess of10,000 lbs per year are also required to submit TRI fonns.
140
Summary of Major Federal Environmental Laws
This act requires that all pesticides, fungicides, and rodenticides beregistered with the EPA. Manufacturers must follow proper labelingprocedures and provide infonnation demonstrating the absence ofunreasonable adverse effects on the environment when the substance isused. As part of the registration process, EPA classifies each substanceas being for general use, restricted use, or both.
FEDERALINSECTICIDE,FUNGICIDE,ANDRODENTICIDEACT (FIFRA)
Administered by theUS EPA
Also includes the Forest and Rangeland Renewable ResourcePlanning Act
Key Provision
• Establishes procedures for the sale of forest timber.• Mandates Department of Agriculture to maintain a Renewable
Resource Program to protect the quality of soil, air, and water in theNational Forest System while managing and developing forest resources. Management plans provide for multiple use, sustained yield ofproducts and services that ensure consideration of environmentalconsequences and restrict intensive management systems and clearcutting.
• Sale of timber from each national forest is limited to a quantitythat can be removed annually in perpetuity on a sustained-yield basis.
NATIONALFORESTMANAGEMENTACT
Administered byDepartment ofAgriculture
BackgroundAdopted in 1970, theOccupational Health and Safety Act seeks
to ensure that "no employee will suffer material impairment ofhealth or functional capacity" from a lifetime of occupational exposure to workplace conditions. The act Covers health hazards whichare largely chemical in nature (noise is also included in this category)and safety hazards which are largely electrical and mechanical innature. In 1990, the only amendment to the law was adopted. Thisprovision increases penalties for certain classes of violations.
Conflicts between the Occupational Health and Safety Administration (OSHA) and EPA over commonly regulated substances are not
141
OCCUPATIONALHEALTH ANDSAFETY ACT(OSHA)
Administered byOccupational Healthand Safety Administration (Dept. ofLabor)
Appendix B
OCCUPATlONALHEALTH ANDSAFETY ACT(OSHA)
Administered byOccupational Healthand Safety Administration (DepartmentofLabor)
common because EPA's mandate extends over land, water, and air,while OSHA's jurisdiction is limited to conditions existing in theworkplace. OSHA is enforcement oriented and its roles include:
• Setting safety and health standards.• Enforcing standards through federal and state inspectors• Providing public education and consultation.
Adoption of StandardsStandards may be adopted in the following three ways:
Section 6(a)Allowed OSHA to adopt "national consensus standards" to get
start-up provisions on the books expeditiously. Although this authorityexpired on April 28, 1973, considerable use of this provision was madewhile it was in effect. As a result, the vast majority of current OSHAstandards were adopted under Section 6(a).
section 6(b)• Applies to all permanent standards (to remain in effect more than
six months).• Regulatory actions may be instigated by reports, studies, and
other publications; trade association standards; National Institute ofOccupational Safety and Health bulletins; or standards from independent safety and health organizations.
• Requires advanced notification of OSHA intent to promulgate aregulation and allows for public comment, which may include hearings.Cost and technological feasibility are examined before regulations areissued.
section 6(c)• Permits the adoption of "emergency temporary standards" where
a grave danger exists and emergency action is necessary to protectemployees from harm.
• Section 6(c) standards expire 6 months after adoption. Thisauthority is very limited and rarely used.
Employer Duties
OSHA Standards, rules, regulations and ordersEmployers must comply with all health and safety standards
promuigated under the OSHA, including rules, regulations, and orders
142
Summary of Major Federal Environmental Laws
pursuant to the act. Penalties can be imposed by the government onemployers but not employees. Both record keeping and adherence tospecific standards is covered.
General Duty ClauseIncluded in the act to fill gaps that might exist in standards, and
intended to cover only hazardous conditions that are obvious andadmitted by all concerned.
Inspection and Enforcement
o Approximately 2,500 federal and state OSHA inspectors stationed at 100 locations nationwide conduct over 50,000 inspectionsannually.
o All employees are covered by the act, except those covered underexisting occupational health and safety laws at the time of the act'sadoption, and federal and state employees. Governments may adoptmeasures similar to OSHA.
o If the employer does not consent to an inspection voluntarily,OSHA must obtain a warrant.
o Employers in noncompliance are issued a written citationdescribing the exact nature of the violation. If the violation is notcorrected within a fixed time, a penalty is proposed.
Key Standard
Hazard Communication Standard (HCS) • Worker Right toKnow Rule
o OSHA's HCS went into effect in 1985 for manufacturers. In1987 it was applied to all employers. The HCS alerts employees to theexistence of possibly dangerous substances in the workplace and theproper means of protection. Unlike most OSHA standards, it does notimpose mandatory limitations or requirements on conditions, but ratherfocuses on information.
o List of all hazardous chemicals on the premises must be prepared.
o A material safety data sheet (MSDS) must be on hand orprepared for each hazardous material. This includes information aboutchemical composition of a substance, physical characteristics, healthand safety hazards, and precautions for safe handling and use.
143
OCCUPATlONALHEALTH ANDSAFETY ACT(OSHA)
Administered byOccupational Healthand Safety Administration (DepartmentofLabor)
Appendix B
OCCUPATIONALHEALTH ANDSAFETY ACT(OSHA)
• Each container of hazardous material must be properly labeledwith hazard identification and warning along with the name and addressof the manufacturer or responsible party.
• Workers must be trained and educated about chemical risks.• A written program for observing the HCS must be prepared and
maintained for each worksite.
POLLUTIONPREVENTIONACT OF 1990
Administered by theUS EPA
BackgroundThis act greatly expands the EPA's role in encouraging pollution
prevention (source reduction) in all its programs and activities. The actaddresses the historic lack of attention to source reduction and statesthat "source reduction is fundamentally different and more desirablethan waste management and pollution control". As a matter of USpolicy, the act establishes the following hierarchy: pollution prevention, recycling, treatment, and finally disposal or release, all to be accomplished in an environmentally safe manner.
Key Provisions
Section 6604Creates an office within EPA (as of 1992 the Office of Pollution
Prevention and Toxics) to coordinate all agency pollution preventionactivities. Mandates adoption of a strategy to adopt multi-media prevention approach in all programs, offices, and activities. As a result ofthis provision, the EPA established the 33/50 program. This programtargets 17 chemicals reportable under TRI for a 33% reduction in releases and transfers by 1992, and a 50% reduction by the end of 1995,compared to 1988. This is a voluntary program aimed at industries reporting the largest releases and transfers of the 17 high-priority chemicals.
Section 6605Establishes a grants program to the states so technical assistance
and training in pollution prevention can be made available to businessand industry. Grants in this program are limited to 50% of total costs;states must provide the remainder.
144
Summary of Major Federal Environmental Laws
section 6606Requires the establishment of a source reduction clearinghouse to
compile and actively disseminate information on source reduction andserve as a technology transfer resource. The Pollution Prevention Information Clearinghouse (PPIC) now serves this function. The EPA alsoestablished the Pollution Prevention Information Exchange System(pIES), a computerized information database available to the publicwhich permits entry and retrieval of material on industrial source reduction, technology transfer, and education.
section 6607Mandates that EPA collect data on source reduction, recycling, and
treatment of all chemicals listed on lRI reporting forms. In 1991, facilities are required to report the following information on lRI forms:
• the amount of reported chemicals entering any waste stream priorto recycling, treatment, or disposal; the percentage change from the previous year; and estimates for the next 2 years.
• The amount of reported chemical recycled on or off site, the process used, and percentage change from the previous year.
• The quantified results of source reduction practices by variouscategories, and the techniques used to identify source reduction oppor"tunities.
145
POLLUTIONPREVENTIONACT OF 1990
Administered by theUS EPA
Appendix B
RESOURCECONSERVAll0NANDRECOVERYACT (RCRA)
Administered by theUS EPA
BackgroundIn 1965, the Solid Waste Disposal Act (SWDA) was enacted to
ensure the environmentally sound management of solid wastes. RCRAwas enacted in 1976, and the Hazardous and Solid Waste Amendmentsof 1984 expanded the act.
The goals of RCRA are to protect human health and the environment, reduce waste and conserve energy and natural resources, andreduce or eliminate the generation of hazardous waste as expeditiouslyas possible. All hazardous waste produced is to be treated, stored, anddisposed of so as to minimize the present and future threat to humanhealth and the environment. P.CRA imposes full life cycle managementcontrols on hazardous waste by addressing generators, transporters, andoperators of treatment, storage, and disposal (TSD) facilities.
Key Provisions
Subtitle C· Hazardous Waste Program
Section 3001-ldentification and listing• Lists particularly hazardous wastes subject to regulation and
standards applicable to generators, transporters, and owners andoperators of hazardous waste treatment, storage, and disposal (TSD)facilities. Hazardous waste identified as ignitable, corrosive, reactive,or toxic is listed one of three ways: non-specific source wastes, specificsource wastes, and commercial chemical products. Action is based onthreshold concentrations of listed wastes.
• Provides that all those generating or handling listed hazardouswastes notify the EPA of the nature and location of their activities.
Section 3002 , 3003 - Generator and transporter provisions• Establishes record keeping, labeling and manifest systems, and
proper handling methods for generators and transporters. Transportersmust also comply with regulations regarding the delivery of substancesto designated TSD facilities, as well as Department of Transportationrequirements. The amendments of 1984 significantly expanded coverage to include more than 200,000 companies which produce less than1,000 kg of hazardous waste per month.
• Over 500,000 companies and individuals who generate hazardouswaste must comply with RCRA regulations.
146
Summary of Major Federal Environmental Laws
Section 3004, 3005 - TSD facilities requirementsRequires permits to be granted for treating, storing, or disposing
listed hazardous wastes. Also imposes standards applying to financialaspects, groundwater monitoring, minimum technology usage,andclosure procedures. Disposal of untreated hazardous waste is subject toa phased-in ban. Establishes interim status provisions for existing TSDfacilities.
Sections 3007, 3008 - Site inspection and enforcementAuthorizes site inspections and provides enforcement capabilities
through both administrative and civil actions. Criminal actions may bebrought which carry a penalty of up to $50,000 per day or from 2 to 5years in jail.
Section 3012,3006 - State inventories and state authorityEach state must compile an inventory describing the hazardous
waste storage and disposal sites within the state. RCRA encouragesStates to take over the responsibility for program implementation andenforcement from the Federal Government.
Subtitle 0 • Solid Waste ProgramEstablishes guidelines and minimum requirements for state solid
waste plans as well as procedures for developing and implementingsuch plans. Prohibits open dumping.
Subtitle I· Underground Storage Tanks Program• Regulates underground storage tanks and mandates each owner of
such a tank for regulated substances to notify the appropriate state orfederal agency of the tank's existence and describe its function.
• Amendments of 1984 include tanks containing hazardous waste orpetroleum, affecting hundreds of thousands of facilities.
147
RESOURCECONSERVAllONANDRECOVERYACT (RCRA)Administered by theUS EPA
AppendixB
SURFACEMININGCONTROL ANDRECLAMATIONACT
Administered by theDepartment of theInterior
Key Provisions
Abandoned mine reclamationEstablishes the abandoned mine fund with fees paid by coal mine
operators and user charges to reclaim and restore land and waterresources adversely affected by past mining and to prevent and controlother impacts associated with mining. Coal mine operators are requiredto pay a quarterly reclamation fee and submit statements about theirmining operations.
Regulation of surface coal mining's environmental Impacts• Performance standards are set for surface coal mining and
reclamation activities.• Permits for surface and underground coal mining operations
require operators to implement measures to restore land, managewastes, and prevent subsidence.
TOXICSUBSTANCESCONTROL ACT(TSCA)
Administered by theUS EPA
BackgroundEnacted in 1976, TSCA allows EPA to acquire sufficient informa
tion to identify and evaluate potential hazards from chemical substancesand to regulate the production, use, distribution, and disposal of suchsubstances where necessary. The act may also be used to regulatebiotechnology and genetic engineering.
Key Provisions
TestingManufacturers and processors are required to test certain substances
to determine whether they present an unreasonable risk of injury tohealth or the environment. Based on these tests, EPA may requiremanufacturing notices, develop regulations regarding distribution andhandling, or initiate civil action to address an imminent hazard.
Manufacture and processing notification for new substances• Manufacturers must notify EPA 90 days before producing a new
chemical substance and submit any required test data. This is referredto as a premanufacturing notice (PMN).
148
Summary of Major Federal Environmental Laws
• When no testing is required, manufacturers must submit information such as molecular structure, categories of use, amounts of production, description of by-products, disposal methods and all existing dataconcerning the environmental and industrial health effects of eachsubstance to demonstrate that the substance will not present an unreasonable risk.
• If information is insufficient, EPA may issue a proposed orderrestricting manufacture until further information is developed.
RegulationFor substances that present an unreasonable risk, rules may be
issued prohibiting or limiting manufacture, or regulating use anddisposal.
Imminent hazardsSubstances identified as imminent hazards by EPA may be seized
through civil action. Other actions such as mandatory notification andrecall by manufacturers and processors may be required.
ReportingRegulations apply to record keeping procedures and reporting
requirements. Manufacturers and processors are mandated to keepinventories and maintain records of significant adverse reactions causedby their substances. The EPA compiles a list of each chemical substance produced in the US from these records.
References
Government Institutes, Inc., 1991. Environmental Law Handbook. Rockville,MD: Government Institutes, Inc.
Environmental Law Institute, 1989. Environmental Law Deskbook. Washington, DC: Environmental Law Institute.
149
TOXICSUBSTANCESCONTROL ACT(TSCA)
Administered by theUS EPA
APPENDIX C: OVERVIEW OF ENVIRONMENTALIMPACTS
Before development teams begin a life cycle design project, theyshould understand the range of impacts caused by human activity. Such
an understanding underlines the need for life cycle design.
Environmental, health, and safety impacts include:
• habitat and species destruction• potential health risks to present and future generations• availability of resources for future generations• distribution of resources among populations• distribution of risks among affected populations
Every product and service contributes to multiple environmentalimpacts. For example, use of agricultural pesticides results in hazardouswaste generation from manufacture, health risks to production workersand applicators, groundwater contamination, ecological degradationthrough bioaccumulation, and human health risks from pesticide residuein food.
There are many ways to set environmental design priorities. Emphasis will vary among product groups and companies. Because impacts occur on a local, regional, and global scale, priorities must alsoaddress scop<.;. Local and regional concerns may appear more importantto some development teams than global impacts, but a broader focusmay be indicated in many life cycle design projects.
Priorities based on a global view of environmental impacts may differ from those addressing strictly local issues. Priorities for environmental impacts set by the Ecology and Welfare Subcommittee of theScience Advisory Board of the US EPA [1] provide an example of ranking with a global perspective:
150
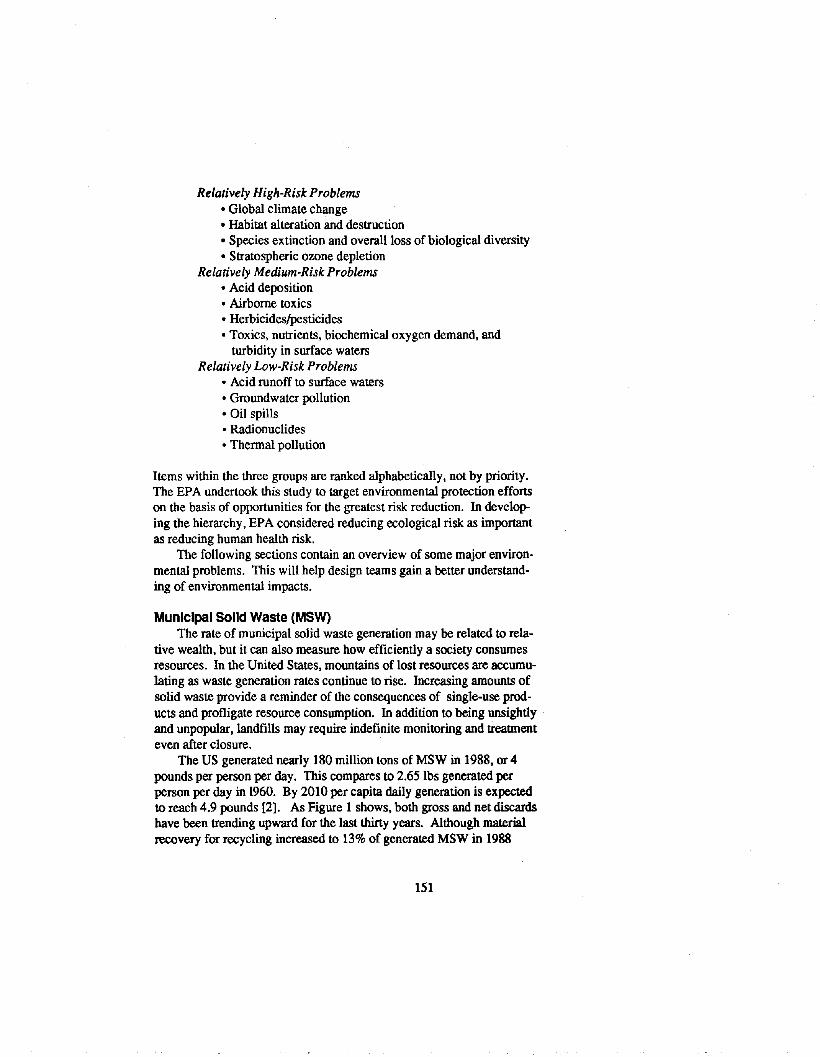
Relatively High-Risk Problems• Global climate change• Habitat alteration and destruction• Species extinction and overall loss of biological diversity• Stratospheric ozone depletion
Relatively Medium-Risk Problems• Acid deposition• Airborne toxics• Herbicides/pesticides• Toxics, nutrients, biochemical oxygen demand, and
turbidity in surface watersRelatively Low-Risk Problems
• Acid runoff to surface waters• Groundwater pollution• Oil spills• Radionuclides• Thermal pollution
Items within the three groups are ranked alphabetically, not by priority.The EPA undertook this study to target environmental protection effortson the basis of opportunities for the greatest risk reduction. In developing the hierarchy, EPA considered reducing ecological risk as importantas reducing human health risk.
The following sections contain an overview of some major environmental problems. This will help design teams gain a better understanding of environmental impacts.
Municipal Solid Waste (MSW)The rate of municipal solid waste generation may be related to rela
tive wealth, but it can also measure how efficiently a society consumesresources. In the United States, mountains of lost resources are accumulating as waste generation rates continue to rise. Increasing amounts ofsolid waste provide a reminder of the consequences of single-use products and profligate resource consumption. In addition to being unsightlyand unpopular, landfills may require indefinite monitoring and treattnenteven after closure. .
The US generated nearly 180 million tons of MSW in 1988, or 4pounds per person per day. This compares to 2.65 Ibs generated perperson per day in 1960. By 2010 per capita daily generation is expectedto reach 4.9 pounds [2]. As Figure 1 shows, both gross and net discardshave been trending upward for the last thirty years. Although materialrecovery for recycling increased to 13% of generated MSW in 1988
151
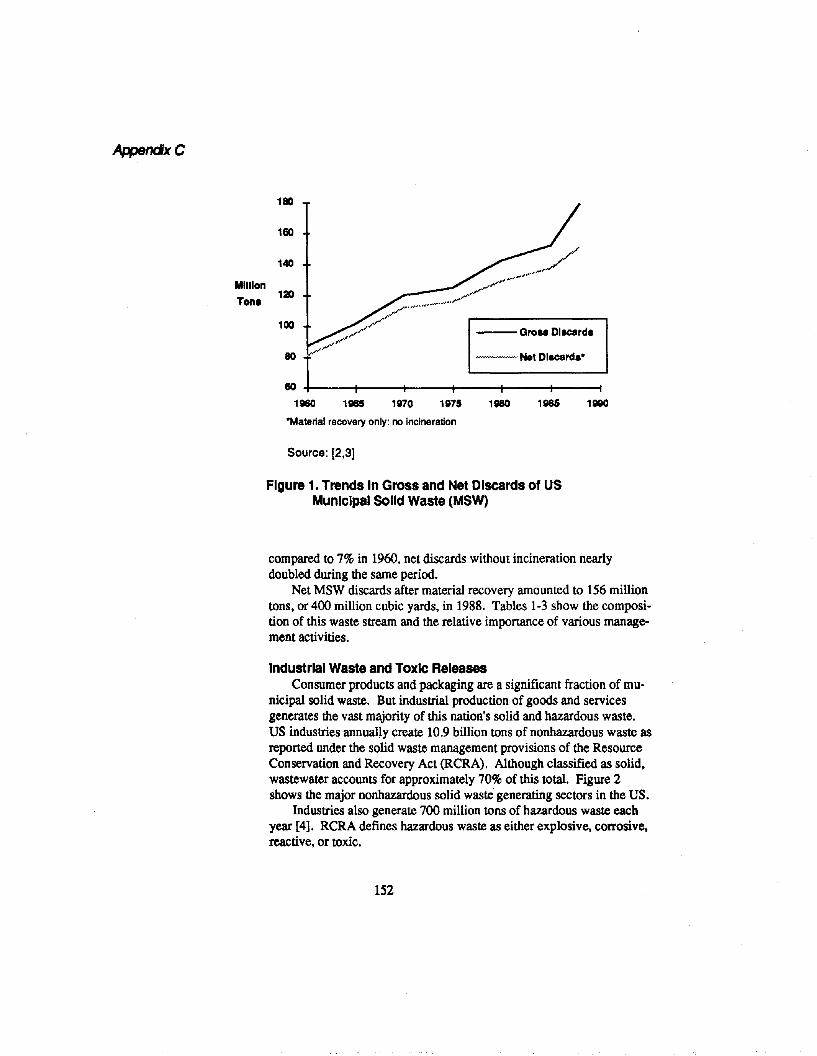
----Net Discard.·
---Gro.. Dlacard.
AppenclxC
MIllion
Ton.
180
160
140
120
100
11165 1G70 1G75 1G80 1lMJ5
"Material recovery only: no incineration
Source: [2,3]
Figure 1. Trends In Gross and Net Discards of USMunicipal Solid Waste (MSW)
compared to 7% in 1960, net discards without incineration nearlydoubled during the same period.
Net MSW discards after material recovery amounted to 156 milliontons, or 400 million cubic yards, in 1988. Tables 1-3 show the composition of this waste stream and the relative importance of various management activities.
Industrial Waste and Toxic ReleasesConsumer products and packaging are a significant fraction of mu
nicipal solid waste. But industrial production of goods and servicesgenerates the vast majority of this nation's solid and hazardous waste.US industries annually create 10.9 billion tons of nonhazardous waste asreported under the solid waste management provisions of the ResourceConservation and Recovery Act (RCRA). Although classified as solid,wastewater accounts for approximately 70% of this total. Figure 2shows the major nonhazardous solid waste generating sectors in the US.
Industries also generate 700 million tons of hazardous waste eachyear [4]. RCRA defines hazardous waste as either explosive, corrosive,reactive, or toxic.
152
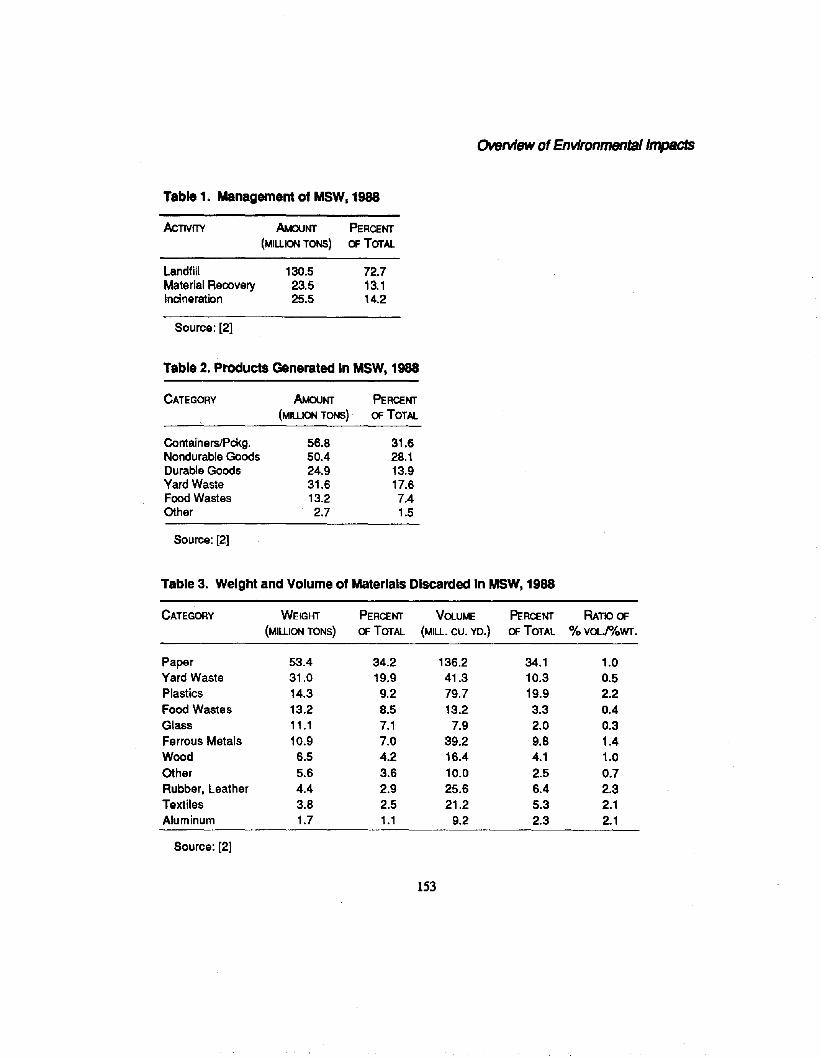
Table 1. Management of MSW, 1988
Overview of Environmentallmpaets
AcTIVITY
LandfillMaterial RecoveryIncineration
Source: [2]
AMouNT(MILLION TONS)
130.523.525.5
PERCENTOF TOTAl
72.713.114.2
Table 2. Products Generated In MSW, 1988
CATEGORY AMouNT(MILLION TONS)
Containers/Pckg. 56.8Nondurable Goods 50.4Durable Goods 24.9Yard Waste 31.6Food Wastes 13.2Other 2.7
Source: [2]
PERCENTOF TOTAl
31.628.113.917.67.41.5
Table 3. Weight and Volume of Materials Discarded In MSW, 1988
CATEGORY WEIGHT PERCENT VOlUME PERCENT RATIO OF(MILLION TONS) OF TOTAL (MILL. CU. YD.) OF TOTAL %VOl./%wr.
Paper 53.4 34.2 136.2 34.1 1.0Yard Waste 31.0 19.9 41.3 10.3 0.5Plastics 14.3 9.2 79.7 19.9 2.2Food Wastes 13.2 8.5 13.2 3.3 0.4Glass 11.1 7.1 7.9 2.0 0.3Ferrous Metals 10.9 7.0 39.2 9.8 1.4Wood 6.5 4.2 16.4 4.1 1.0Other 5.6 3.6 10.0 2.5 0.7Rubber. Leather 4.4 2.9 25.6 6.4 2.3Textiles 3.8 2.5 21.2 5.3 2.1Aluminum 1.7 1.1 9.2 2.3 2.1
Source: [2]
153
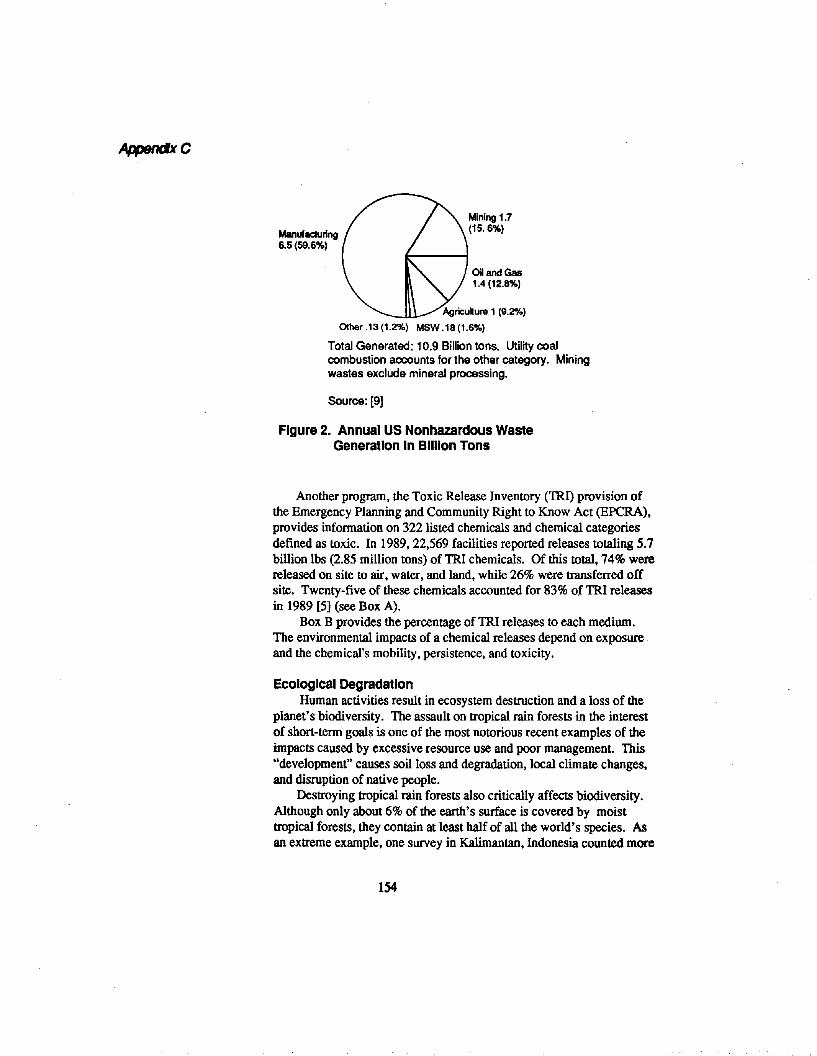
AppendxC
Oil and Gas1.4(12.8%)
Mining 1.7(15.6%)
Manufacturing6.5(59.6%)
Agricukure 1 (9.20/.)
Olher.13 (1.2%) MSW.18 (1.6%)
Total Generated: 10.9 Billion tons. Utility coalcombustion acx:ounts for the other category. Miningwastes exclude mineral processing.
Source: [9]
Figure 2. Annual US Nonhazardous WasteGeneration In Billion Tons
Another program, the Toxic Release Inventory (TRI) provision ofthe Emergency Planning and Community Right to Know Act (EPCRA),provides information on 322 listed chemicals and chemical categoriesdefined as toxic. In 1989,22,569 facilities reported releases totaling 5.7billion Ibs (2.85 million tons) of TRI chemicals. Of this total, 74% werereleased on site to air, water, and land, while 26% were transferred offsite. Twenty-five of these chemicals accounted for 83% of TRI releasesin 1989 [5] (see Box A).
Box B provides the percentage of TRI releases to each medium.The environmental impacts of a chemical releases depend on exposureand the chemical's mobility, persistence, and toxicity.
Ecological DegradationHuman activities result in ecosystem destruction and a loss of the
planet's biodiversity. The assault on tropical rain forests in the interestof short-term goals is one of the most notorious recent examples of theimpacts caused by excessive resource use and poor management. This"development" causes soil loss and degradation, local climate changes,and disruption of native people.
Destroying tropical rain forests also critically affects biodiversity.Although only about 6% of the earth's surface is covered by moisttropical forests, they contain at least half of all the world's species. Asan extreme example, one survey in Kalimantan, Indonesia counted more
154
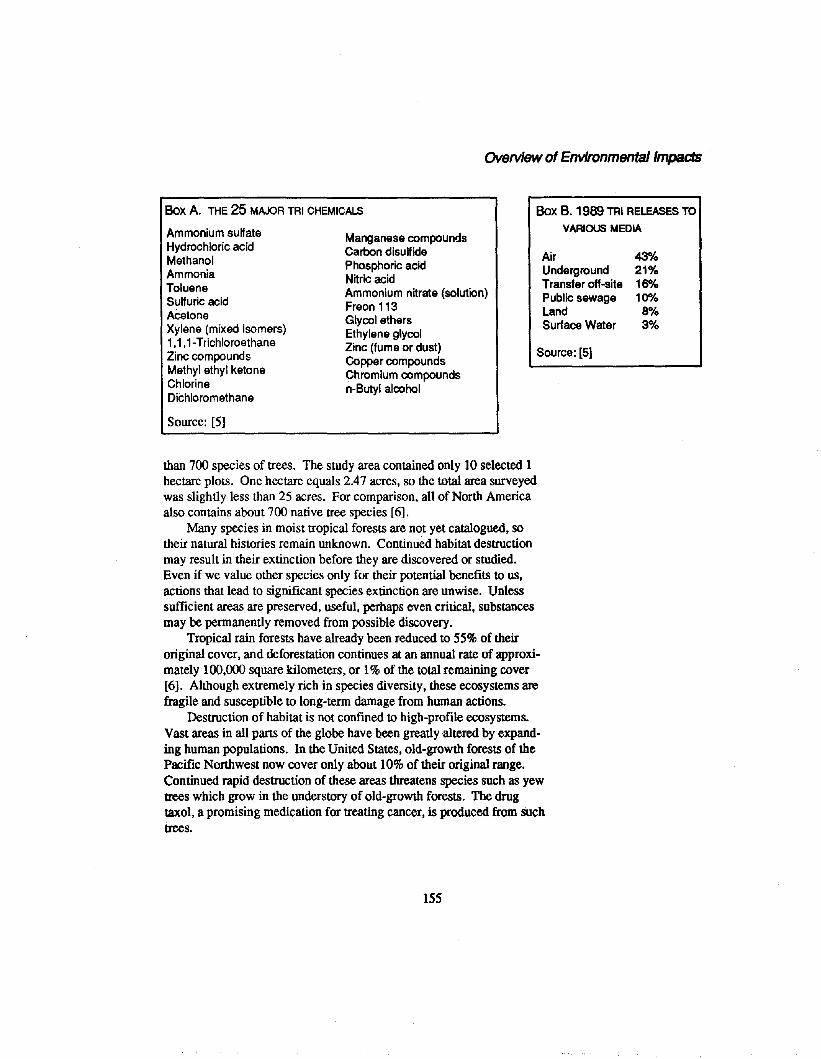
Overview of Environmentallmpacls
Box A. THE 25 MAJOR TRI CHEMICALS
Ammonium sulfateHydrochloric acidMethanolAmmoniaTolueneSulfuric acidACetoneXylene (mixed isomers)1,1,1-TrichloroethaneZinc compoundsMethyl ethyl ketoneChlorineDichloromethane
Source: [5]
Manganese compoundsCarbon disulfidePhosphoric acidNitric acidAmmonium nitrate (solution)Freon 113Glycol ethersEthylene glycolZinc (fume or dust)Copper compoundsChromium compoundsn-Butyl alcohol
Box B. 1989 TRI RELEASES TO
VARIOUS MEDIA
Air 43004Underground 21%Transfer off-site 16%Public sewage 10%Land 8%Surface Water 3%
Source: [5]
than 700 species of trees. The study area contained only 10 selected 1hectare plots. One hectare equals 2.47 acres, so the total area surveyedwas slightly less than 25 acres. For comparison, all of North Americaalso contains about 700 native tree species [6].
Many species in moist tropical forests are not yet catalogued, sotheir natural histories remain unknown. Continued habitat destructionmay result in their extinction before they are discovered or studied.Even if we value other species only for their potential benefits to us,actions that lead to significant species extinction are unwise. Unlesssufficient areas are preserved, useful, perhaps even critical, substancesmay be permanently removed from possible discovery.
Tropical rain forests have already been reduced to 55% of theiroriginal cover, and deforestation continues at an annual rate of approximately 100,000 square kilometers, or 1% of the total remaining cover[6]. Although extremely rich in species diversity, these ecosystems arefragile and susceptible to long-term damage from human actions.
Destruction of habitat is not confined to high-profile ecosystems.Vast areas in all parts of the globe have been greatly -altered by expanding human populations. In the United States, old-growth forests of thePacific Northwest now cover only about 10% of their original range.Continued rapid destruction of these areas threatens species such as yewtrees which grow in the understory of old-growth forests. The drugtaxol, a promising medication for treating cancer, is produced from suchtrees.
155
AppendxC
exploitation of Nonsustalnable ResourcesProducts should not depend on materials derived from rare plant
and animal species or scarce minerals. In addition to causing degradation of natural habitats, exploitation of many potentially renewable resources is proceeding at rates well in excess of their regenerativecapacity. Use of these valuable resources at the current pace cannotcontinue indefinitely.
Energy UseEnergy consumption is the most obvious example of human reli
ance on nonrenewable resources. Product systems consume energy inall life cycle stages. Energy also becomes embodied in some materials.For example, energy contained in plastics could be released by combustion. In this way, the energy content of the petroleum used as a feedstock might not be lost. However, if the material is disposed in alandfill, its energy content will be a form of waste.
At present, the world depends on fossil fuels for 88% of all purchased energy. Each year, 500 million road vehicles consume half theworld's oil, or 19% of total energy demand [7]. Industrial processesconsume another 40% of world energy demand each year [8]. Table 4shows how energy supplies are exploited.
Population increased 3.5 times and total world power use increased13 times during the last 100 years [9]. Figure 3 demonstrates thesetrends. Calculations are based on total power use (energy per unit time).Traditional biomass fuels such as wood, crop wastes, and dung are included in Figure 3. Fossil fuel use rose by a factor of 20 during this period.
Although citizens of the developed countries are only about 23% ofworld population, they use two-thirds of the world's total energy. Theproportion is higher when purchased fuels alone are considered. Byconsuming 6.8 times more power per capita than people in less developed countries (7.5 kW vs. 1.1 kW), each citizen of the developed worldannually uses the equivalent of about 35 barrels of oil [9].
Climate ChangeCombustion of fossil fuels for energy produces carbon dioxide, a
greenhouse gas that traps heat and can lead to global warming. Humanactivity in the last two hundred years has dramatically increased atmospheric concentrations of the greenhouse gases carbon dioxide, methane,nitrous oxide, and halocarbons. Human activity causes methane releasefrom rice fields, cattle,landfills, and fuel production. Nitrous oxideemissions result from fertilizer use and soil dynamics in agricultural and
156
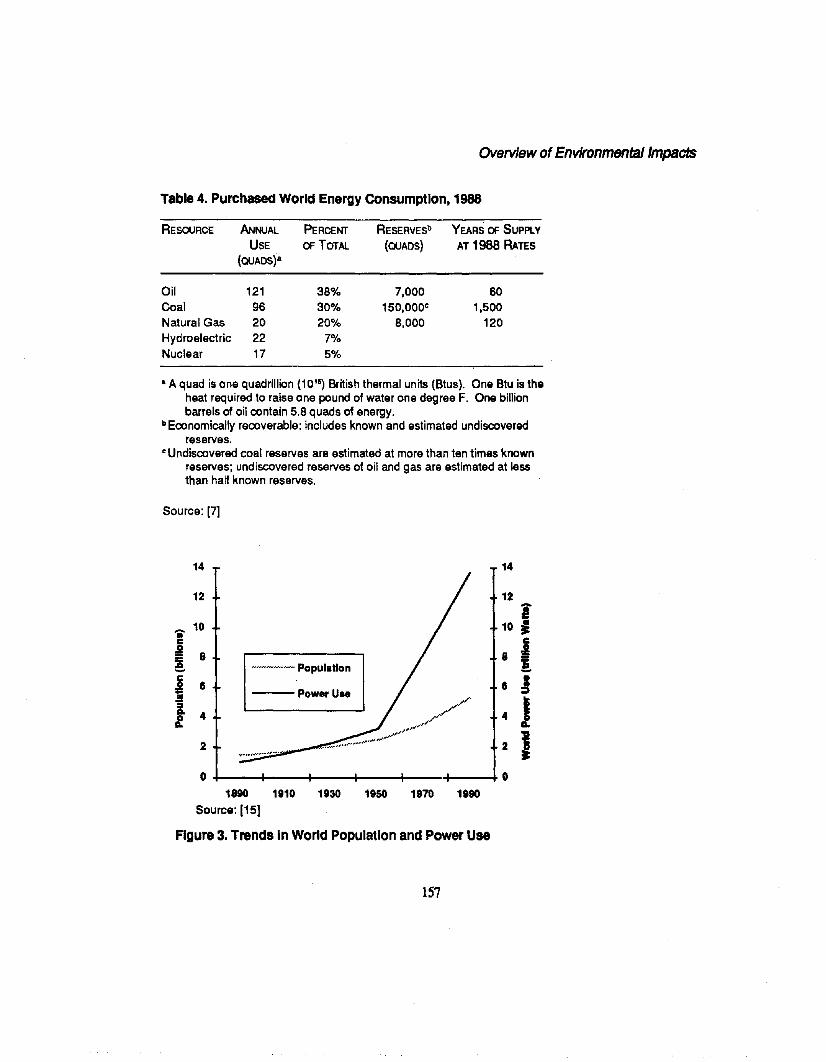
Overview of Environmental Impacts
Table 4. Purchased World Energy COnsumption, 1988
RESOURCE ANNUAL
USE
(OUADS)a
PERCENT
OF TOTAL
RESERVESb
(OUADS)
YEARS OF SUPPLY
AT 1988 RATES
Oil 121 38% 7,000 60Coal 96 30% 150,OOOc 1,500Natural Gas 20 20% 8,000 120Hydroelectric 22 7%Nuclear 17 5%
• A quad is one quadrillion (10 15) British thermal units (Btus). One Btu is the
heat required to raise one pound of water one degree F. One billionbarrels of oil contain 5.8 quads of energy.
b Economically recoverable: includes known and estimated undiscoveredreserves.
•Undiscovered coal reserves are estimated at more than ten times knownreserves; undiscovered reserves of oil and gas are estimated at lessthan half known reserves.
Source: [7]
14 14
12 12
i.. 10 10 Ic
I:i 8 8!. --~--_. PopUlationc :!oj 6
Pow.rU..6
oS ,./' Ii:. 4 4Do
2#'.. ..,.."""._~"'"
2 I......... ..,..
0 01890 1910 1930 1950 1970 1990
Source: [15]
Figure 3. Trends In World Population and Power Use
157
AppendixC
disturbed areas, with some contribution from combustion. Halocarbonscontaining chlorine and bromine serve as propellants, refrigerants,blowing agents, and solvents (chlorofluorocarbons). Bromine-containing halons are used as fIre retardants [11].
Clouds and various aerosols in the earth's atmosphere reflect aboutone third of incoming solar radiation. Greenhouse gases allow the remaining short-wave solar radiation to pass through the atmosphere, butthey partially absorb outgoing long-wave radiation emitted by warmearth surfaces. Absorbed radiation is then re~emitted back to the surface, causing warming.
Table 5 shows some characteristics and concentrations of variousgreenhouse gases capable of causing global warming.
Ozone is also an effective greenhouse gas, especial,ly in the troposphere (the lower 10-15 km of the atmosphere). Because of its shortlifetime in the troposphere and chlorine-induced destruction in thestratosphere (the atmosphere above 15 kID), its global warming effectsare not well known.
Other processes caused by pollution influence global warming.Sulfur aerosols reflect incoming solar radiation from the earth, resultingin cooling. The effect of such aerosols on possible climate change islargely unknown. However, the atmospheric residence time of sulfuraerosols is much shorter than greenhouse gases, ranging from days inthe troposphere to several years in the stratosphere. Decreases in sulfur
Table 5. Characteristics of Major Greenhouse Gases
GAs
Carbon DioxideMethaneNitrous OxideHalocarbons
TOTAL HUMAN AVERAGE CONCEN- CONCEN- CONTRI- RADIATIVEEMISSIONslYR. RESIDENCE TRATION TRATION BUTION TO FORCING(MILLION TONS) TIME 1765 1990 WARMING1 EFFICIENCy2
6000 50-200 yrs. 280 ppm 350 ppm 56% 1300-400 10 yrs. .8 ppm 1.7 ppm 11% 58
4-6 150 yrs. .285 ppm .31 ppm 6% 2061 65-130 yrs. 0 .38 ppb3 24% 4860
1Estimated contributions from 1980-1990. Since preindustrial times, CO2has contributed an estimated
61 % to potential global warming, methane 17%, nitrous oxide 4%, and CFCs 12%.2Qn a per unit mass basis relative to CO2 (Le. 1 kg of each gas, not an equal number of molecules).
Radiative forcing here is positive; long-wave radiation reflected back to earth results in warming.3As average of CFC 11 & 12; also cause depletion of stratospheric ozone layer.
Source: [11-13]
158
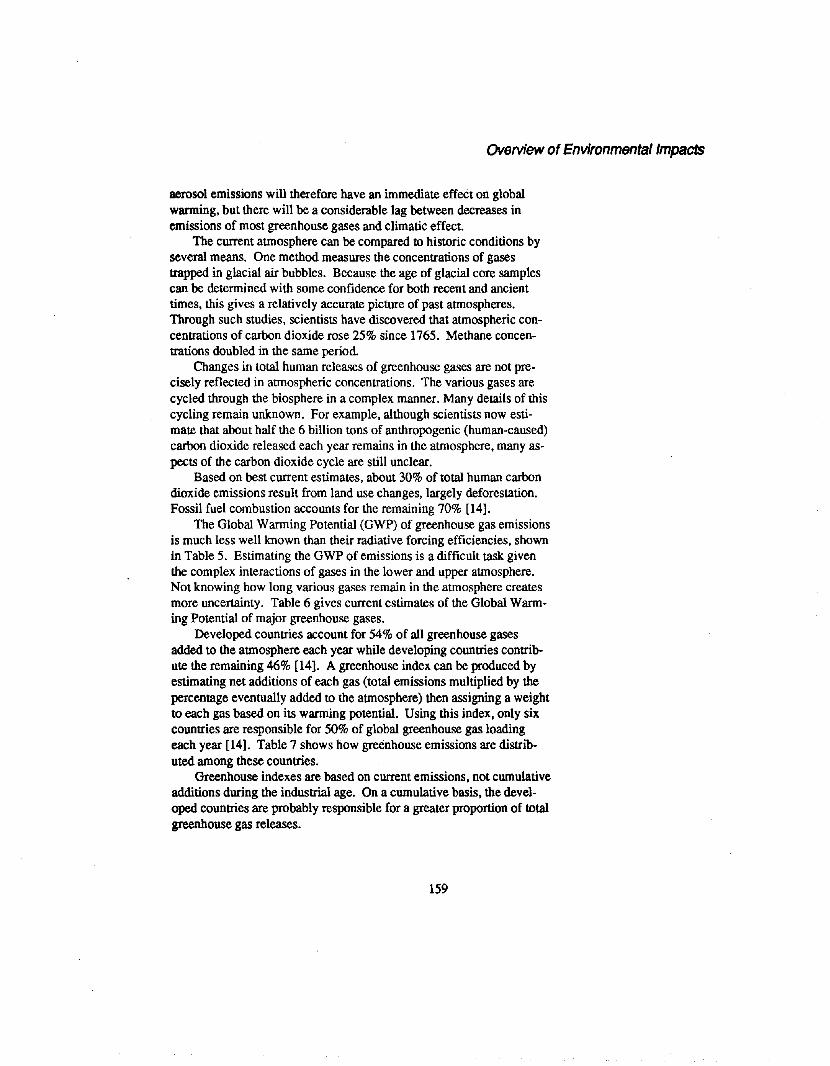
Overview of Environmental Impacts
aerosol emissions will therefore have an immediate effect on globalwarming, but there will be a considerable lag between decreases inemissions of most greenhouse gases and climatic effect.
The current atmosphere can be compared to historic conditions byseveral means. One method measures the concentrations of gasestrapped in glacial air bubbles. Because the age of glacial core samplescan be detennined with some confidence for both recent and ancienttimes, this gives a relatively accurate picture of past atmospheres.Through such studies, scientists have discovered that atmospheric concentrations of carbon dioxide rose 25% since 1765. Methane concentrations doubled in the same period.
Changes in total human releases of greenhouse gases are not precisely reflected in atmospheric concentrations. The various gases arecycled through the biosphere in a complex manner. Many details of thiscycling remain unknown. For example, although scientists now estimate that about half the 6 billion tons of anthropogenic (human-caused)carbon dioxide released each year remains in the atmosphere, many aspects of the carbon dioxide cycle are still unclear.
Based on best current estimates, about 30% of total human carbondioxide emissions result from land use changes, largely deforestation.Fossil fuel combustion accounts for the remaining 70% [14].
The Global Warming Potential (GWP) of greenhouse gas emissionsis much less well known than their radiative forcing efficiencies, shownin Table 5. Estimating the GWP of emissions is a difficult task giventhe complex interactions of gases in the lower and upper atmosphere.Not knowing how long various gases remain in the atmosphere createsmore uncertainty. Table 6 gives current estimates of the Global Warming Potential of major greenhouse gases.
Developed countries account for 54% of all greenhouse gasesadded to the atmosphere each year while developing countries contribute the remaining 46% [14]. A greenhouse index can be produced byestimating net additions of each gas (total emissions multiplied by thepercentage eventually added to the atmosphere) then assigning a weightto each gas based on its warming potential. Using this index, only sixcountries are responsible for 50% of global greenhouse gas loadingeach year [14]. Table 7 shows how greenhouse emissions are distributed among these countries.
Greenhouse indexes are based on current emissions, not cumulativeadditions during the industrial age. On a cumulative basis, the developed countries are probably responsible for a greater proportion of totalgreenhouse gas releases.
159
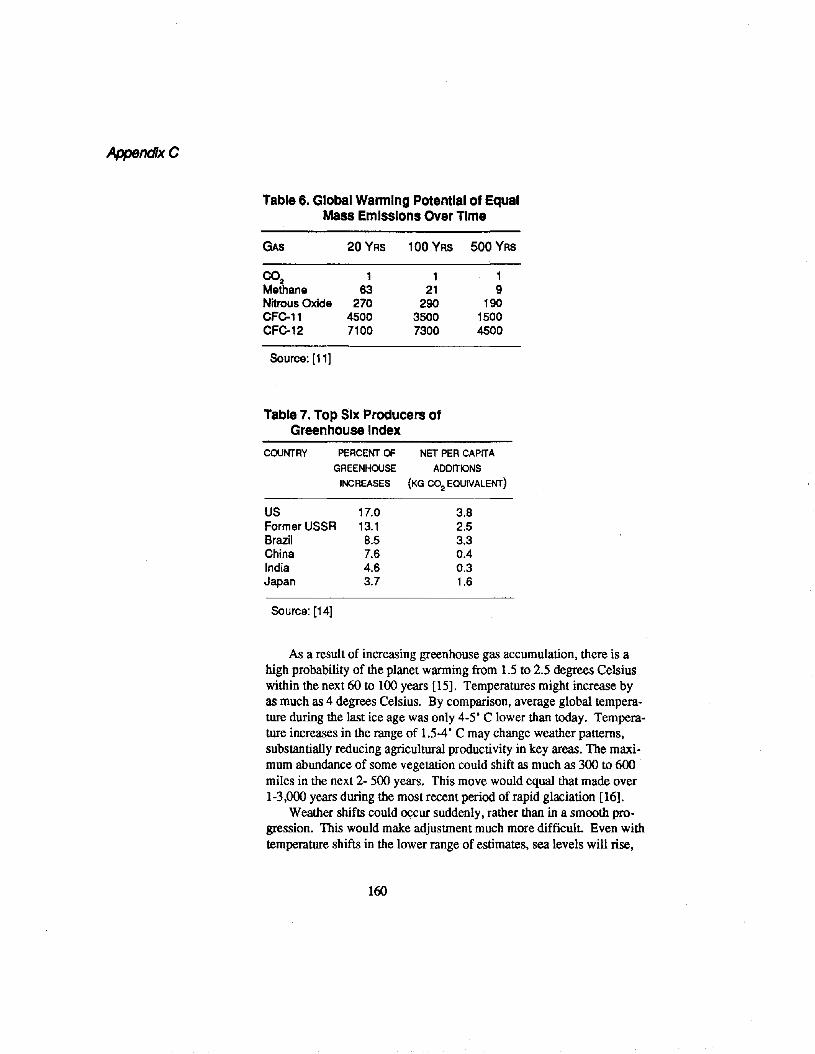
Append/xC
Table 6. Global Wannlng Potential of EqualMass Emissions Over Time
GAs
CO2MethaneNitrous OxideCFe-11CFe-12
Source: [11]
20YRS
163
27045007100
100 YRS
121
29035007300
500 YRS
19
19015004500
Table 7. Top Six Producers ofGreenhouse Index
COUtfrRY PERCEtfr OF
GREENHOUSE
INCREASES
NET PER CAPITA
ADDITIONS
(KG CO2
EQUIVAlEtfr)
US 17.0 3.8Former USSR 13.1 2.5Brazil 8.5 3.3China 7.6 0.4India 4.6 0.3Japan 3.7 1.6
Source: [14]
As a result of increasing greenhouse gas accumulation, there is ahigh probability of the planet warming from 1.5 to 2.5 degrees Celsiuswithin the next 60 to 100 years [15]. Temperatures might increase byas much as 4 degrees Celsius. By comparison, average global temperature during the last ice age was only 4-5' C lower than today. Temperature increases in the range of 1.5-4' C may change weather patterns,substantially reducing agricultural productivity in key areas. The maximum abundance of some vegetation could shift as much as 300 to 600miles in the next 2- 500 years. This move would equal that made over1-3,000 years during the most recent period of rapid glaciation [16].
Weather shifts could occur suddenly, rather than in a smooth progression. This would make adjustment much more difficult. Even withtemperature shifts in the lower range of estimates, sea levels will rise,
160
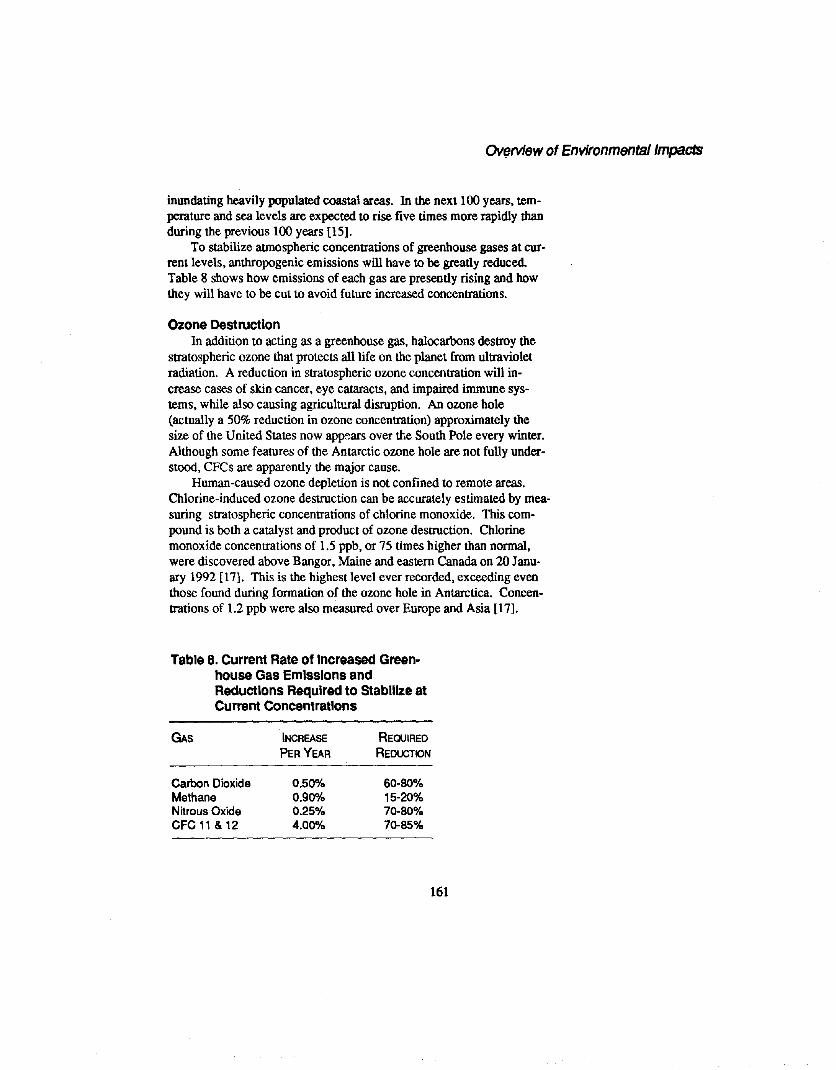
Ov(1rview of Environmentallmpacls
inundating heavily populated coastal areas. In the next 100 years, temperature and sea levels are expected to rise five times more rapidly thanduring the previous 100 years [15].
To stabilize atmospheric concentrations of greenhouse gases at current levels, anthropogenic emissions will have to be greatly reduced.Table 8 shows how emissions of each gas are presently rising and howthey will have to be cut to avoid future increased concentrations.
Ozone DestructionIn addition to acting as a greenhouse gas, halocarbons destroy the
stratospheric ozone that protects all life on the planet from ultravioletradiation. A reduction in stratospheric ozone concentration will increase cases of skin cancer, eye cataracts, and impaired immune systems, while also causing agricultural disruption. An ozone hole(actually a 50% reduction in ozone concentration) approximately thesize of the United States now apIY."-8fs over the South Pole every winter.Although some features of the Antarctic owne hole are not fully understood, CFCs are apparently the major cause.
Human-caused ozone depletion is not confined to remote areas.Chlorine-induced ozone destruction can be accurately estimated by measuring stratospheric concentrations of chlorine monoxide. This compound is both a catalyst and product of ozone destruction. Chlorinemonoxide concentrations of 1.5 ppb, or 75 times higher than normal,were discovered above Bangor, Maine and eastern Canada on 20 January 1992 [17]. This is the highest level ever recorded, exceeding eventhose found during formation of the ozone hole in Antarctica. Concentrations of 1.2 ppb were also measured over Europe and Asia [17].
Table 8. Current Rate of Increased Greenhouse Gas Emissions andReductions Required to Stabilize atCurrent Concentrations
GAs INCREASE REQUIRED
PER YEAR REDUCTION
Carbon Dioxide 0.50% 60-80%Methane 0.90% 15-20%Nitrous Oxide 0.25% 70-80%CFC 11 & 12 4.00% 70-85%
161

AppendxC
Scientists believe that a 20-30% reduction in stratospheric ozoneconcentrations will almost certainly develop over some populated regions of the northern hemisphere in the next 10 years [17]. These northern "holes" are expected to be less severe than in Antarctica as a resultof different weather patterns.
The consequences of increased ultraviolet radiation reaching theearth may be far reaching. However. little can be done to improve thesituation in the near term. because ozone-destroying compounds are sopersistent in the stratosphere.
Table 9 shows selected characteristics of various halocarbons.In 1987. developed countries signing the Montreal Protocol on Sub
stances That Deplete the Ozone Layer agreed to reduce their productionand consumption of CFC-ll. -12. -113. -114. and -115 to 50% of 1986levels by 1998. The effectiveness of the Montreal Protocol is somewhatlimited because India and China have not agreed to its terms.
162
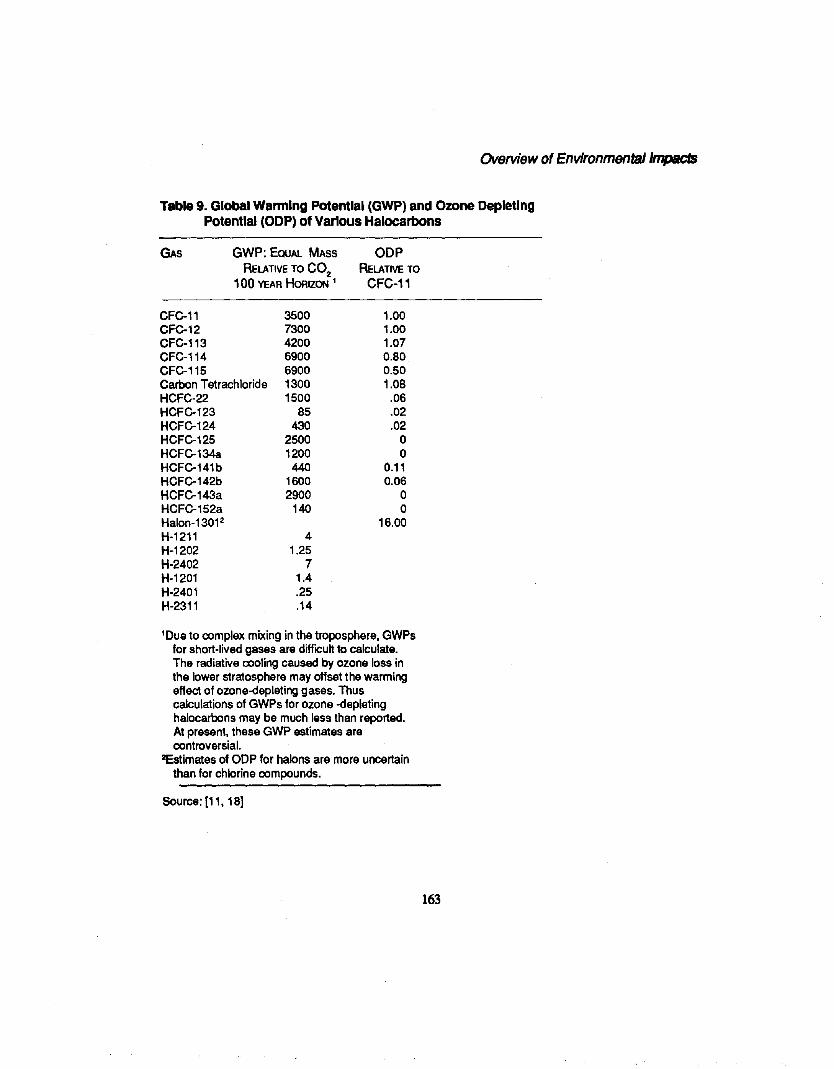
Overview of Environmentallmpacls
Table 9. Global Wannlng Potential (GWP) and Ozone DepletingPotential (ODP) of Various Halocarbons
GAs GWP: EQUAl MASS
RELATIVE TO CO2
100 YEAR HoRIZON 1
ODPRELATIVE TO
CFC-11
CFe-11 3500 1.00CFe-12 7300 1.00CFC-113 4200 1.07CFC-114 6900 0.80CFC-115 6900 0.50Carbon Tetrachloride 1300 1.08HCFC-22 1500 .06HCFe-123 85 .02HCFe-124 430 .02HCFe-125 2500 0HCFe-134a 1200 0HCFe-141b 440 0.11HCFe-142b 1600 0.06HCFe-143a 2900 0HCFe-152a 140 0Halon-1301 2 16.00H-1211 4H-1202 1.25H-2402 7H-1201 1.4H-2401 .25H-2311 .14
lOue to complex mixing in the troposphere, GWPsfor short-lived gases are difficult to calculate.The radiative cooling caused by ozone loss inthe lower stratosphere may offset the warmingeffect of ozone-depleting gases. Thuscalculations of GWPs for ozone -depletinghalocarbons may be much less than reported.At present, these GWP estimates arecontroversial.
2Estimates of OOP for halons are more uncertainthan for chlorine compounds.
Source: [11, 18]
163
AppendxC
References
1. Science Advisory Board. 1990. Reducing Risle: Setting Priorities and Strategiesfor Environmental Protection, US Environmental Protection Agency,Washington, DC EPA SAB- EC90-021.
2 U. S. EPA 1990. Chmacterization ofSolid Waste in the United States: 1990Update, US Environmental Protection Agency, Office of Solid Waste,Washington, OC EPA 530-SW-90-042A
3. Franklin Associates. 1988. Chmacterization ofMunicipal Solid Waste in theUnited States 1960-2000: 1988 Update, US E.PA Office of Solid Wasteand Emergency Response, Washington, DC WH-565E.
4. US Congress, Office of Teclmology Assessment. 1992. Managing IndslstrialSolid Waste From Manufacturing, Mining, Oil and Gas Production, andUtility Coal Combustion - BaclegrolUld Paper, US Government PrintingOffice, Washington, DC afA-BP-O-82.
5. US EPA. 1991. Toxics in the Community: National and Local Perspectives;US Environmental Protection Agency, Office of Toxic Substances, Washington, DC EPA 560/4-91-014.
6. Wilson, Edward O. 1989. Threats to Biodiversity. Scientific American 261(3): 108-116.
7. Fulkerson, William, Roddie R. Judkins, and Manoj K. Sanghvi. 1990. Energy From Fossil Fuels. Scientific American 263 (3): 129-135.
8. Bleviss, Deborah L., and Peter Walzer. 1990. Energy For Motor Vehicles.Scientific American 263 (3): 103-109.
9. Ross, Marc H., and Daniel Steinmeyer. 1990. Energy For Industry. ScientificAmerican 263 (3): 89-98.
10. Holdren, Jolm P. 1990. Energy in Transition. Scientific American 263 (3):157-163.
11. Houghton, J.T., GJ. Jenkins, and J.J. Ephraums, editors. 1990. ClimateChange. The IPPC Scientific Assessment. Cambridge: Cambridge University Press.
12. Ramanathan, V.1988. The Greenhouse Theory of Climate Change: A Testby an Inadvertent Global Experiment Science 240: 293-299.
13. Lashof, Daniel A., and Dilip R. Ahuja. 1990. Relative Contributions ofGreenhouse Gas Emissions to Global Warming. Nature 344: 529-521.
14. Hammond, Allen L., Eric Rodenburg, and William Moomaw. 1990. Accountability in the Greenhouse. Nature 347:705-706.
15. Wigley, T.M.L., and S.C.B. Raper. 1992. Implications for Climate and SeaLevel of Revised.IPCC Emissions Scenarios. Nature 357(6376): 293-300.
16. Overpeck, Jonathan T., PatrickJ. Bartlein, and Thompson Webb ill. 1991.Potential Magnitude of Future Vegetation Change in Eastern N. America.Science 254: 692-694.
17. Leary, Warren E. 4 February 1992. Record Rise in Ozone-DestroyingChemicals Found in North. The New YO7'le Times, National Edition, B, 7.
18. Asessment Chairs for the Parties to the Montreal Protocol. 1991. Synthesisofthe Reports ofthe Ozone Scientific, Environmental Effects, and Technology and Economic Assessment Panels, UNEP, New York.
164
APPENDIX D: DECISION MAKING
Decision making is a fundamental design activity. Exploring needs,setting requirements, and evaluating designs all depend on translatingcomplex information into successful decisions. Decision-making modelshave been applied to subjects as diverse as politicalpolicy and choosing thebest home. Discussion in this appendix will focus only on design.
Key Elements
Many decision-making models have the following elements in common:
• Precisely defined objectives that draw boundaries around theproblem
• Systematic procedures that exclude casual or broad assumptions• Rank and weigh objectives according to priority• Complex problems broken into clear parts based on known func
tions• Evaluation based on analysis of similar elements
To avoid confusion at a later stage, overall project goals have to benegotiated and agreed on by the development team at the beginning of aproject. Precise defmition is vital when important decisions must bemade quickly, because it helps focus efforts on critical areas and greatlyincreases efficiency.
Assumptions often drive decisions. Systematic procedures can helpidentify and eliminate casual assumptions that lead to poor decisions. Asystematic method greatly aids development teams as they develop andassign priority to requirements. Breaking complex design problems intodiscrete units based on similar function is a key activity in successfuldecision making. The best decisions result from focusing on vital elements and analyzing their relationships in as logical a fashion as possible.
Because all necessary facts will often not be known, judgementsand interpretations based on incomplete information will be a centralpart of many decisions. This mixture of known and ~certain data is acommon element in all complex problems. Decision-making systems
165
AppenclxD
must therefore be able to compare both facts and mere estimates arisingfrom many different types of research.
Development teams can rely on purely intuitive methods, but apractical system for organizing the diverse elements in a multi-objectivedesign problem may be a better choice. All formal decision-makingsystems were developed to improve results, but each development teamshould choose a method that seems compatible with its own dynamics.As in other aspects of life cycle design, meeting customer needs whilereducing environmental impacts remains the overall goal; methods ofachieving this end can vary across a broad spectrum.
Decision mliking is a large and varied field. A full exploration of itis beyond the scope of this manual. However, given the importance ofmany decisions to project success, a review of two popular models fordecision making may be beneficial. References at the end of this appendix can be used for further guidance. Readers should know that manyother models exist beyond these few examples.
Rational Analysis with Uncertain Data
Kepner and Tregoe [1] offer one popular, systematic approach. After an overall project objective is established, requirements are proposedto meet that objective. Requirements are weighed and assigned priorities based on how important they are to project goals. These prioritiesare negotiated with the best available data. Either quantitative or qualitative information can be used.
Assigning Priority to RequirementsAs a first step in assigning priority, must requirements are distin
guished from other requirements. The remaining requirements are thenweighed and assigned priority. These priorities reflect direct judgements of team members.
Priorities can be assigned verbally, or they may be in numericalform. Although preferences vary, the process of translating verbaljudgements into numbers can lead to more thorough and accurate representations of team judgements.
A variety of scales may be chosen for numerical values. Rangesfrom 1 to 10 or 0 to 1 may be convenient for many development teams.As an example, on a scale from 0 to I, the following verbal and numerical representations could be used to depict group judgements:
166
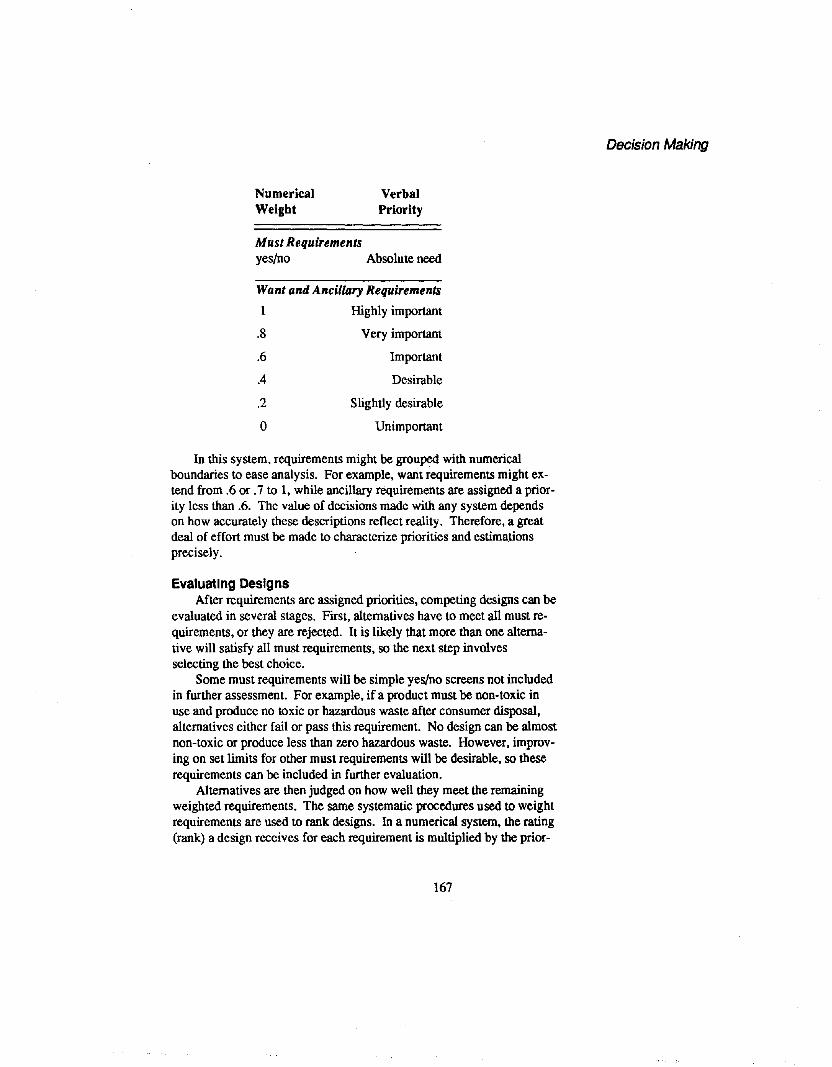
NumericalWeight
VerbalPriority
Decision Making
Must Requirementsyeslno Absolute need
Want and Ancillary Requirements
1 Highly important
.8
.6
.4
.2
o
Very important
Important
Desirable
Slightly desirable
Unimportant
In this system, requirements might be grouped with numericalboundaries to ease analysis. For example, want requirements might extend from.6 or .7 to 1. while ancillary requirements are assigned a priority less than .6. The value of decisions made with any system dependson how accurately these descriptions reflect reality. Therefore, a greatdeal of effort must be made to characterize priorities and estimationsprecisely.
Evaluating DesignsAfter requirements are assigned priorities. competing designs can be
evaluated in several stages. First. alternatives have to meet all must requirements. or they are rejected. It is likely that more than one alternative will satisfy all must requirements. so the next step involvesselecting the best choice.
Some must requirements will be simple yes/no screens not includedin further assessment. For example. if a product must be non-toxic inuse and produce no toxic or hazardous waste after consumer disposal,alternatives either fail or pass this requirement. No design can be almostnon-toxic or produce less than zero hazardous waste. However, improving on set limits for other must requirements will be desirable, so theserequirements can be included in further evaluation.
Alternatives are then judged on how well they meet the remainingweighted requirements. The same systematic procedures used to weightrequirements are used to rank designs. In a numerical system, the rating(rank) a design receives for each requirement is multiplied by the prior-
167

Appendix 0
Design Alternatives
Sodium-sulfur Lead-acid
Want wt. Ranking Score Ranking Score
Criteria: (0-1) (0-1) (wt*rank) (0-1) (wt*rank)
Env 1 .7 .9 .63 .4 .28
Env2 .9 .8 .72 .4 .36
Env3 .4 .3 .12 .8 .32
Total: 1.47 .96
Figure E-1. Two Designs Evaluated Against Limited Criteria WithRational Management Method
ity (weight) given to that requirement. These scores are added to arriveat an overall score.
Figure E-I presents a very simple example of two hypothetical battery designs for an electric automobile. Both batteries are evaluatedagainst three environmental want criteria (Bnv 1,2, and 3). For the purposes of illustration, the sodium-sulfur design satisfies both high-priority environmental requirements significantly better than the lead-acidalternative. Although the lead-acid design is a superior choice with regard to the lowest-priority requirement, the overall weighted score obviously favors the design that performed best in the more importantcriteria. Because it is unlikely that a single design alternative will be theclear choice for all high-priority requirements, evaluation in actual design projects will be much more complex.
Development tean1S need to evaluate designs based on requirementsfrom all classes. The simplest way to accomplish this task is by forminga single multi-discipline group that proposes and evaluates all requirements. For complex products, this type of group is likely to be unwieldy.
As an alternative, expert groups for each broad class of requirements may be formed. If this option is selected, requirements are firstproposed and prioritized within a class by an expert group, then pre-
168

sented to the entire development team for consideration. A thoroughreview of proposed requirements and priorities before approval ensuresthat possible conflicts are identified and resolved. Finally, the samegroups evaluate designs and present their recommendations to the fullteam for a final judgement.
Some design teams may wish to add uncertainty factors to judgements based on incomplete information. As an example, if two alternatives appear equally preferable with regard to a requirement, but oneseems more likely to satisfy this function in actual situations, a higherevaluation could be given to the more certain choice.
Caution must be exercised when interpreting numerical judgementsbased on verbal translations of incomplete data. In addition, summingvarious factors inserts another potential for inaccuracy into the process,because evaluations based on hard data must necessarily be combinedwith others that are much less well-defined.
Even when such problems are recognized and reduced, the development team must decide on a level of significance for interpreting resultsthat corresponds with actual results. It may be tempting to analyze numerical scores to many decimal places, but if this does not reflect eitherthe actual data or the verbal translation process, it can lead to inappropriate judgements. The development team should be aware that makingfine distinctions between values based on best guesses invites distortedjudgement.
As the final step in the Kepner Tregoe method, the best alternativesare further analyzed for their potential adverse consequences. Anticipating potential problems and including these assessments in the finalevaluation adds another dimension to decision making.
The Analytical Hierarchy Process
The Analytical Hierarchy Process attempts to streamline and improve simple, intuitive problem solving. To do so, feelings, judgements, and logic are organized in a structured process capable ofhandling complex situations [2,3]. Both quantitative and qualitativeelements are considered. This more accurately reflects the way peopledefine and attempt to solve problems. As long as such criteria areclearly defined and agreed on, both methods of analysis can contributeto effective decisions.
As a first step in properly defining a problem, a hierarchy of decision elements is formed. The top level of the hierarchy is a single element representing the project goal; there can be as many subsequentlevels as needed. Elements on the same level must be similar and logi-
169
Decision Making
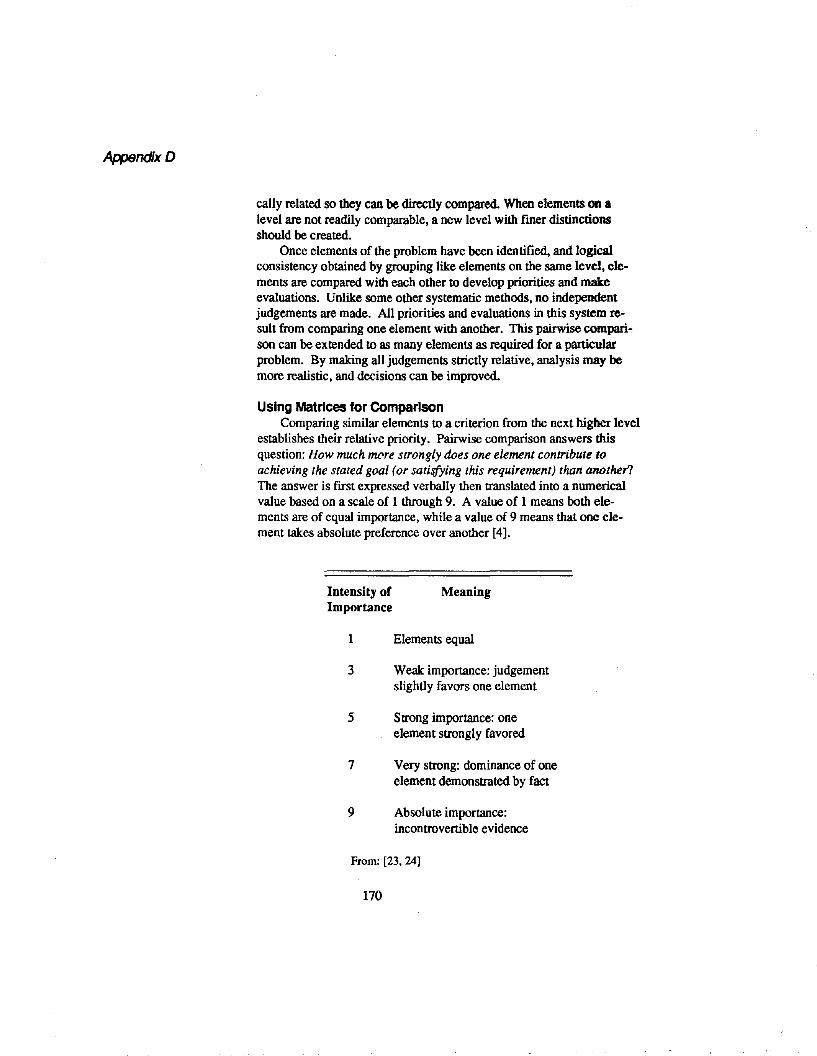
Appendix 0
cally related so they can be directly compared. When elements OIl alevel are not readily comparable, a new level with fmer distinctionsshould be created.
Once elements of the problem have been identified, and logicalconsistency obtained by grouping like elements on the same level, elements are compared with each other to develop priorities and makeevaluations. Unlike some other systematic methods, no independentjudgements are made. All priorities and evaluations in this system result from comparing one element with another. This pairwise comparison can be extended to as many elements as required for a particularproblem. By making all judgements strictly relative, analysis may bemore realistic, and decisions can be improved.
Using Matrices for ComparisonComparing similar elements to a criterion from the next higher level
establishes their relative priority. Pairwise comparison answers thisquestion: How much fn{lre strongly does one element contribute toachieving the stated goal (or satisfying this requirement) than another?The answer is first expressed verbally then translated into a numericalvalue based on a scale of 1 through 9. A value of 1 means both elements are of equal importance, while a value of 9 means that one element takes absolute preference over another [4].
Intensity of MeaningImportance
I Elements equal
3 Weak importance: judgementslightly favors one element
5 Strong importance: oneelement strongly favored
7 Very strong: dominance of oneelement demonstrated by fact
9 Absolute importance:incontrovertible evidence
From: [23, 24]
170
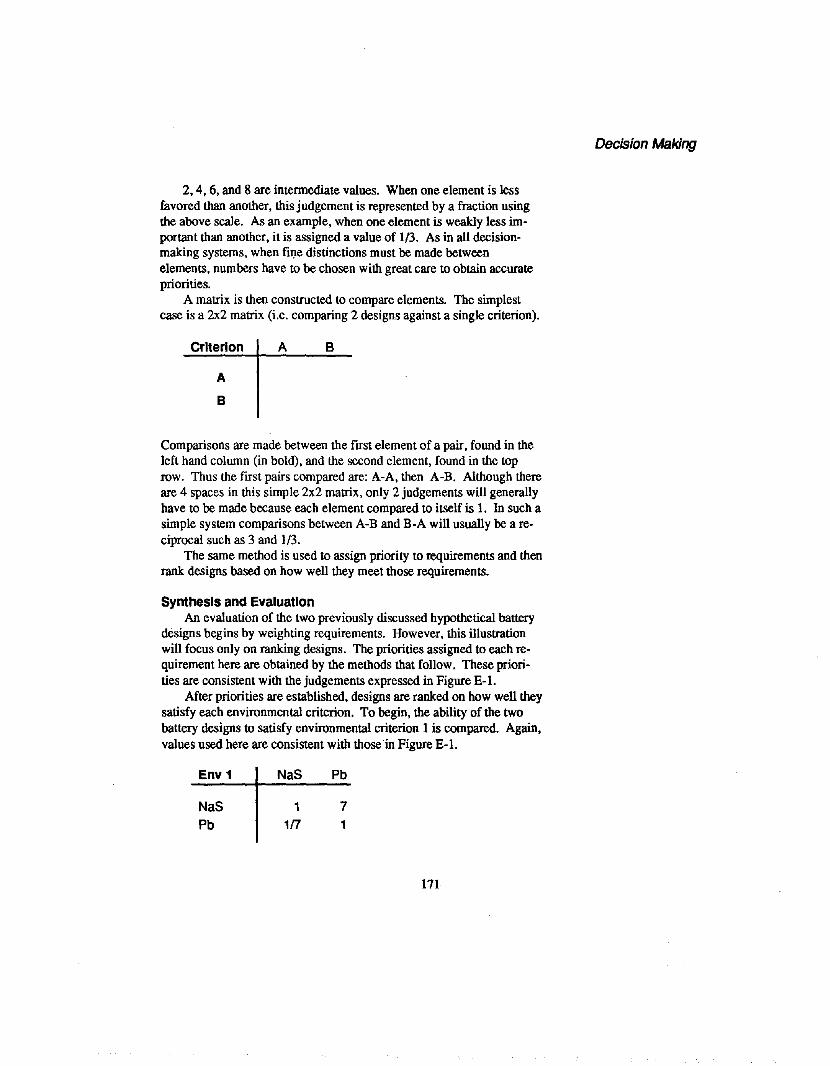
2,4,6, and 8 are intermediate values. When one element is lessfavored than another, this judgement is represented by a fraction usingthe above scale. As an example, when one element is weakly less important than another, it is assigned a value of 1/3. As in all decisionmaking systems, when fil)e distinctions must be made betweenelements, numbers have to be chosen with great care to obtain accuratepriorities.
A matrix is then constructed to compare elements. The simplestcase is a 2x2 matrix (i.e. comparing 2 designs against a single criterion).
Decision Making
Criterion
A
B
A B
Comparisons are made between the first element of a pair, found in theleft hand column (in bold), and the second element, found in the toprow. Thus the first pairs compared are: A-A, then A-B. Although thereare 4 spaces in this simple 2x2 matrix, only 2 judgements will generallyhave to be made because each element compared to itself is 1. In such asimple system comparisons between A-B and B-A will usually be a reciprocal such as 3 and 1/3.
The same method is used to assign priority to requirements and thenrank designs based on how well they meet those requirements.
Synthesis and EvaluationAn evaluation of the two previously discussed hypothetical battery
designs begins by weighting requirements. However, this illustrationwill focus only on ranking designs. The priorities assigned to each requirement here are obtained by the methods that follow. These priorities are consistent with the judgements expressed in Figure E-l.
After priorities are established, designs are ranked on how well theysatisfy each environmental criterion. To begin, the ability of the twobattery designs to satisfy environmental criterion 1 is compared. Again,values used here are consistent with those in Figure E-l.
Env 1
NaSPb
NaS Pb
71
171
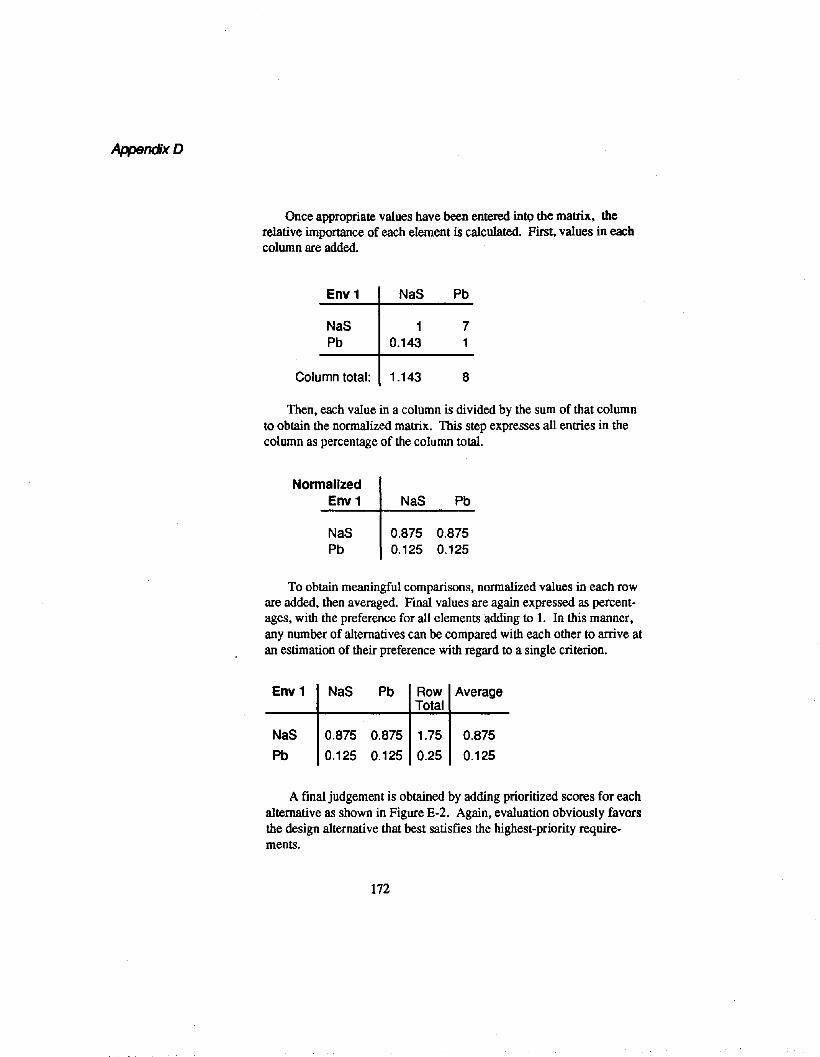
AppendxD
Once appropriate values have been entered into the matrix, therelative importance of each element is calculated. First, values in eachcolumn are added.
Env 1 NaS Pb
NaS 1 7Pb 0.143 1
Column total: 1.143 8
Then, each value in a column is divided by the sum of that columnto obtain the normalized matrix. This step expresses all entries in thecolumn as percentage of the column total.
NormalizedEnv 1 NaS Pb
NaS 0.875 0.875Pb 0.125 0.125
To obtain meaningful comparisons, normalized values in each roware added, then averaged. Final values are again expressed as percentages, with the preference for all elements adding to 1. In this manner,any number of alternatives can be compared with each other to arrive atan estimation of their preference with regard to a single criterion.
Env1 NaS Pb Row AverageTotal
NaS
Pb
0.875 0.875 1.75
0.125 0.125 0.25
0.875
0.125
A final judgement is obtained by adding prioritized scores for eachalternative as shown in Figure E-2. Again, evaluation obviously favorsthe design alternative that best satisfies the highest-priority requirements.
172

Design AhernatlvesSodium-sulfur Lead-acid
Want Wt. Ranking Score Ranking Score
Criteria: (wt*rank) (wt*rank)
Env 1 0.283 0.875 0.247 0.125 0.035
Env2 0.643 0.857 0.551 0.143 0.092
Env3 0.074 0.125 0.009 0.875 0.065
Total: 0.808 0.192
Figure 5-5. Two Designs Evaluated Against Llmhed Crherla WhhAnalytical Hierarchy Method
Even in simple problems with few elements, perfect consistency(that is if A-B is 3, then B-A must be 1/3) is unlikely. Inconsistency isparticularly likely when complex and subtle interconnections exist between various elements. Means have been developed to address thisproblem. Final results from any matrix can be compared with valuesexpected from random judgements [2,3]. Additional computations canalso be performed to reflect the various types of interdependence thatarise among the elements being compared.
Conclusions from the Analytical Hierarchy Process should alwaysbe examined for simple logic and common sense. Even when no obvious problems arise, design teams must select the proper scale of significance for distinguishing between alternatives to avoid error.
The AHP has been criticized for various technical reasons [5]. Inaddition, the 1-9 judgement scale and its numerical translation can seeminappropriate and illogical to many. For this reason, interpreting resultscan present special problems. Translation from numbers back into language should follow the original scale [5]. That is, if one choice earns ascore that is 3 times higher than another, it should be judged as onlyslightly more favorable. To be clearly preferable, the overall score for adesign would have to be fives times that of its alternative.
173
Decision Making
AppendixD
Decision Making Umltatlons
IncommensurablesElements from different classes of requirements sometimes defy
easy comparison. For example, it can be very difficult to weigh estimated levels of resource depletion against an aspect of performance.This problem also exists within the class of environmental requirements.How can energy use be compared with human health or ecological degradation? Furthermore, what priority should one assign to different elements of ecological degradation or human health impacts? Referencessuch as Setting Priorities and Strategies for Environmental Protection[6] can help in this process, but development teams will still be facedwith many difficult choices in weighing items that are measured withdifferent scales.
DataInformation used to develop environmental requirements and evalu
ate design alternatives may be much more incomplete or uncertain thandata on cost or performance. Developing priorities and evaluating design alternatives can therefore be a proportionally more difficult task forenvironmental requirements than for other classes of requirements.There may also be no way to even estimate some important information.Such gaps present problems regardless of how skilled a developmentteam is at making appropriate decisions.
JudgementDecision-making systems can assist development teams in organiz
ing and accurately translating their judgements. Yet the ultimate qualityof many decisions depends on the skill and experience of the team members. A perfectly efficient method of organizing opinions cannot improve on the quality of those opinions.
174
References
1. Kepner, Charles H., and Benjamin B. Tregoe. 1965. The Rational Manager.New York: McGraw-Hill.
2. Saaty. Thomas L. 1982. Decision Making for Leoders. Belmont, CA:Wadsworth.
3. _. 1980. The Analytical Hie.·archy Process. New York: McGraw-Hill.4. _. 1977. A Scaling Method for Priorities in Hierarchical Structures. Jour
nal ofMathernatical Psychology 15 (3): 234-281.5. Holder, R. D. 1990. Some Comments on the Analytic Hierarchy Process.
Journal ofthe Operational Research Society. 41 (11): 1073-1076.6. Science Advisory Board. 1990. Reducing Risk: Setting Priorities and Strate
giesfor Environmental Protection, US Environmental Protection Agency,Washington, DC EPA SAB- EC 90-021.
175
Decision Making
APPENDIX E. ENVIRONMENTAL LABELING
A range of third-party programs offer environmental labelingservices to companies. These labels are intended to identify the leastdamaging products in equivalent groups. Consumers can then use thelabels to select environmentally sound products that meet their needs.
Labels are awarded on the basis of standards developed by variousorganizations. In all programs to date, participation by manufacturers isvoluntary. Those wishing to display a label must frrst pay a fee.Labeling rights cover a set amount of time, usually ranging from one tothree years. .
Virtually all programs claim to follow a life cycle approach toensure reduction of total impacts. But standard setting and productevaluation is actually based on a few "key" factors that mayor may notaccurately reflect life cycle impacts. Criteria used to judge productshave included:
• recycled content• recyclability or reusability• degradability• hazardous/toxic material content• pollution impacts• minimal use of resources/avoidance of nonrenewable or nonsus
tainable resources
The fIrst three categories are particularly popular [1]. Unfortunately, evaluating products on this basis may not result in reduction oflife cycle impacts. Criteria used to target product groups for labelinginclude some or all of the following:
• Major constituent of the waste stream by volume or weight• Produces substantial impacts through toxicity, hazardousness, or
difficulty of disposal• Easy to evaluate; can be differentiated based on a few, agreed
upon criteria• Commonly used, high-proflle among consumers• Offers opportunity for significant environmental impact reduction
176
The German Blue Angel program, established in 1978, was thepioneer in this field. As in most other programs, evaluation of productsis claimed to be based on a life cycle approach which follows theproduct from raw materials acquisition to disposal. In practice, many ,products are awarded the label based on a single criterion. Although thisgreatly simplifies evaluation, it cannot reflect life cycle results. Narrowfocus is encouraged by the label design, which states in one very briefphrase why each product has received the Blue Angel. The CanadianEnvironmental Choice and Japanese Ecomark programs, both begun in1989, are based on the Blue Angel. Neither uses any recognized lifecycle analysis despite claims of a cradle-to-grave approach [1,2).
Other government environmental labeling programs include theNordic countries' Nordic Environmental Label and the Australian GreenSpot. The European Community will also introduce an environmentallabel after formation of the Single European Market in 1993. All theseprograms award labels based on just one or several criteria [2, 3).
In the United States, private companies, rather than government, aredeveloping environmental labels. Both Green Seal, Inc. and the GreenCross Certification Company are active in this area. Each developsstandards that are supposed to be based on reducing life cycle impacts.These criteria are set on a category by category basis and are meant toreflect current state-of-the-art practices that are technically and economically feasible [4, 5).
As most labeling programs state, identifying key impacts forconcentrated evaluation is a vital step in producing an accurate label.Effective use of the life cycle framework for environmental labelingdepends on narrowing the scope of analysis. However, identifying keyimpacts may be difficult because life cycle data is lacking for manyproducts. Labeling programs could generate their own data, but lifecycle analyses require significant costs and time, and must addresscomplex issues such as assigning priority to various incommensurablecriteria. Results may be too detailed for a small label.
Until sufficient data are developed, labeling programs may have torely on limited criteria and uncertain information. There are severaladvantages to basing labels on restricted criteria:
• Standards can be promulgated relatively quickly• Evaluation costs are substantially lower• Consumer attention is focused on a few easily-understood choices
However, labeling initiatives should not promise or imply more thanthey can deliver. A simple environmental labeling system based on
177
AppencfxE
restricted criteria can facilitate consumer use, but it may also undermineconsumer confidence if such evaluations are found to be inadequate.
Customer participation and interest remain the key to effectiveenvironmental labeling programs. Users of any product should understand that an environmental label is only a snapshot of a complex set ofissues.
References
1. Sauer, Beverly 1., Robert G. Hunt, and Marjorie A. Franklin. 1990. BQ£kground Document on Clean Products Research and Implementation, USEPA Risk Reduction Engineering Laboratory, Cincinnati, OH EPN600/l.90/048.
2. Hirsbak, Stig, Birgitte B. Nielsen, and Thomas Lindhqvist 1990. ECO-Products, Proposal For an European Community Environmental Label, DanishTeclmological Institute, Department of Environmental Teclmology,Copenhagen, Denmark.
3. 1992. Amended Proposal for a Council Regulation (EEC) Concerning a Community Award Scheme for an Ecolabel. Official Journal o/the EuropeanCommunities NO C 12 (18.1.92): 16-30.
4. Green Seal. 1992. Environml!ntal Standards, Green Seal, Washington, DC.5. Green Cross Certification Company. 1991. Green Cross Environmental Seal
ofApproval: Draft CertijU:ation Criteria, Green Cross Certification Company, Oakland, CA.
178
APPENDIX F: GLOSSARY
Biodegradable Capable of being brokendown by natural, biological processes. Thelack of light, oxygen, and water in modemlandfills severely inhibits degradation.
Compatible Material When combined, compatible materials do not cause unacceptableimpacts or risks. For example, materialsshould not be combined that result in deleterious chemical reactions. Compatible materials do not act as contaminants whenrecycled in moderate amounts with others.
Cross-Disciplinary Team A design teamthat includes representatives from all the major players in the product life cycle.
Concurrent Design Simultaneous design ofall components of the product system including processes and distribution networks.Concurrent design requires an integratedteam of specialists from various areas.
Downcycle To recycle for a less-demandinguse. Degraded materials are downcycled.
Embodied Energy Energy contained in a material that can be recovered for useful purposes through combustion or other means.
Equivalent Use Delivery of an equal amountof product or service. Usually stated interms of distance, number. volume. weight.or time. For example. the amount of detergent required to wash a certain number ofidentical loads.
Externalities Costs borne by society ratherthan those involved in a transaction.
Home Scrap Materials and by-products commonly recycled within an original manufacturing process [1].
Impact Analysis Assesses the environmentalimpacts and risks associated with variousactivities. An impact analysis interprets datafrom a life cycle inventory by identifyingthe main impacts associated with inputs andoutputs.
Inventory Analysis Identifies and quantifiesall inputs and outputs associated with aproduct system including materials, energy.and residuals.
Life Cycle Accounting A system for assigning specific costs to product systems withina physical life cycle framework. Based ontotal cost assessment.
Life Cycle Design A systems-oriented approach for designing more ecologically andeconomically sustainable product systems.It couples the product development cycleused in business with the physical life cycleof a product. Life cycle design integratesenvironmental requirements into the earlieststages of design so total impacts caused byproduct systems can be reduced. In lifecycle design. environmental, performance,cost. cultural. and legal requirements arebalanced. Concepts such as concurrent de-
179
AppendixF
sign, total quality management, cross-disciplinary teams, and multi-attribute decisionmaking are essential elements of life cycledesign.
Needs Analysis The process of definingsocietal needs that will be fulfilled by aproposed development project.
Physical Life Cycle The series of physicalactivities that form the framework formaterial and energy flows in a product lifecycle. The physical life cycle consists of thematerial and energy flows in a product lifecycle. See product life cycle.
Pollution Any by-product or unwanted residualproduced by human activity. Residuals include all hazardous and nonhazardous substances generated or released to the air, water,or land.
Pollution Prevention Any practice that reduces the amount or environmental andhealth impacts of any pollutant released intothe environment prior to recycling, treatment,or disposal. Pollution prevention includesmodifications of equipment and processes;reformulation or redesign of products andprocesses; substitution of raw materials; andimprovements in housekeeping, maintenance,training, or inventory control. It does notinclude activities that are not integral to producing a good or providing a service [2].
Postconsumer Material In recycling, material that has served its intended use and beendiscarded before recovery.
Preconsumer Material In recycling, overruns,rejects, or scrap generated during any stage ofproduction outside the original manufacturingprocess [1].
Product Life Cycle The life cycle of a product system begins with the acquisition ofraw materials and includes bulk materialprocessing, engineered materials production,manufacture and assembly, use, retirement,and disposal of residuals produced in eachstage.
Product System Consists of the product, process, distribution network, and management.The product includes all materials in the final product and all forms of those materialsin each stage of the life cycle. Processestransform materials and energy. Distributionincludes packaging and transportation networks used to contain, protect, and transportproducts and process materials. Wholesaling and retailing are part of distribution.Management consist of equipment and administrative services related to managingactivities. It also includes developing andconveying information.
Recycling The reformation, reprocessing, orin-process reuse of a waste material. TheEPA defines recycling as: ....the series ofactivities, including collection, separation,and processing, by which products or othermaterials are recovered from or otherwisediverted from the solid waste stream for usein the form of raw materials in the manufacture of new products other than fuel [1].
Renewable Capable of being replenishedquickly enough to meet present or near-termdemand. Time and quantity are the criticalelements in measures of renewability. SeeSustainable.
Requirements The functions, attributes, andconstraints used to define and bound the solution space for design. General categoriesof requirements include environmental, per-
180

formance, cost, cultural, and legal.Requirements can be classified as fol
lows:Must requirements Conditions that designs
have to meet. Arrived at by ranking allproposed functions and choosing only themost important.
Want requirements Desirable traits used toselect the best alternative from possiblesolutions that meet must requirements.Want requirements are also ranked andused to evaluate designs.
Ancillary requirements Desired functionsjudged to be relatively unimportant andthus relegated to a "wish list". Includedin the final product only if they do notconflict with other criteria.
Residual The remainder. In the life cycleframework, those wastes remaining after allusable materials have been recovered.
Retirement The transitional life cycle stagebetween use and disposal. Resource recovery options are decided in this stage. Products and materials may be reused,remanufactured, or recycled after retirement.
Reuse The additional use of a component,part, or product after it has been removedfrom a clearly defined service cycle. Reusedoes not include reformation. However,cleaning, repair, or refurbishing may bedone between uses.
When applied to products I reuse is apurely comparative term. Products with nosingle-use analogs are considered to be inservice until retired.
Sustainable Able to be maintained throughtime. Over use of resources may decreasefuture productivity, thereby lowering sustainable yields. An additional factor defin-
• u.s. cbVERNMOO PIUNTtNC oma 1993 '750 • 0 0 2/ 60166
Glossary
ing natural resources sustainability is theamount and kind of pollution caused by theiruse. Systems that rely on abundant resources may not be sustainable if this resource use results in major impacts.
System Boundaries Derme the extent ofsystems or activities. Boundaries delineateareas for design or analysis.
Useful Life Measures how long a system willoperate safely and meet perfornance standards when maintained properly and notsubject to stresses beyond stated limits [4].
Total Cost Assessment A comprehensivemethod of analyzing costs and benefits of apollution prevention or design project. TCAincludes [3]:
• full cost accounting I a managerialaccounting method that assigns both directand indirect costs to specific products
• estimates of both short and long- termdirect, indirect or hidden, liability, andless tangible costs
• costs projected over a long horizon, suchas 10-15 years
References
1. US EPA. 1991. Guidance For the Use of the Terms"Recycled" and "Recyclable" and the RecyclingEmblem in Enviromnental Marketing Claims.Federal Register 56 (191): 49992-SOOOO.
2. United States Code. Public Law 101-508: TM Pol·IwtionPreventionActofl990. (42): 1310113109.
3. White, Allen L, MonicaBecker, and JamesGoldstein. 1992. Total CostAssessmenl, US Enviromnental Protection Agency, Office of Pollution Prevention and Toxies, Washington, DC.
4. Moss,MarvinA.1985.DesigningforMinimalMaintenance Expense. New York: MarcelDekker.
181


![ENVIRONMENTAL PRODUCT DECLARATION... · [2] NS-EN ISO 14044:2006, Environmental management - Life cycle assessment - Requirements and guidelines [3] EN 15804:2012 + A1:2013 Sustainability](https://img.pdfslide.us/doc/110x75/5f6c6ceb7fb4aa548a37e8b8/environmental-product-declaration-2-ns-en-iso-140442006-environmental.jpg)