Embed Size (px)
Citation preview

ENVIRONMENTAL REPORT
ISSUED BY STADTENTWÄSSERUNG MANNHEIM

2
FOREWORD BY THE HEAD OF DEPARTMENT AND PLANT MANAGEMENT 3
EIGENBETRIEB STADTENTWÄSSERUNG 4Assignments and organisation 4Environmental guidelines 4Environmental goals and measures 5Split rainwater charge 5
WASTEWATER DISCHARGE 6The sewer system 6Maintenance and inspection 6Customer services and complaints management 7Sewer rehabilitation 7Private property drainage 8Rainwater percolation 8Pump houses and storage capacities 9Flood protection 9
WASTEWATER TREATMENT 10 The clarification plant 10Wastewater and sludge treatment 10Environmental performance 11EBS in the DWA performance comparison 12Elimination of trace quantities with activated carbon powder 12
RENEWABLE ENERGIES 14Sewage gas generation and utilisation 14Cofermentation 14Sewage sludge gasification 14Photovoltaics and hydropower 15Heat from wastewater 15
LIFECYCLE ASSESSMENT 16Consumption of resources 16Water 16Energy – electricity and natural gas 17Resources 18Waste 19
ENVIRONMENTAL PROTECTION IN EVERYDAY OPERATIONS 20En route for the benefit of the climate 20Biotope in the clarification plant 20
EBS IN FIGURES – 2013 21Sewer plan of Mannheim 22Site plan of the clarification plant 23
DISCLAIMER 24
CONTENTS

Over the last few decades, the quality of water in Germany’s lakes
and rivers has undergone sustainable improvement thanks to the
joint endeavours of the federal and state governments and the munici-
palities. One key contribution to these findings is due to Eigenbetrieb
Stadtentwässerung Mannheim (EBS), which is pursuing a consistently
ecological strategy. Whether for sustainable energy recovery or re-
source protection, the Mannheim municipal services is a pioneer in
these fields and relies on new processes that may point the way to
the future for other wastewater companies as well.
By recovering energy from sewage sludge, utilising heat from waste-
water, and even employing renewable energies for specific purposes,
the clarification plant can operate with considerably fewer CO2 emis-
sions. EBS therefore helps to keep Mannheim on course to a better
climate and achieve the ambitious CO2 reduction goals set down in
the municipality’s climate protection concept. At the same time, the
onsite generation of electricity and heat helps to cut costs – in view
of rising energy prices a sensible move that protects the climate and
limits the charges that citizens have to pay for their use of the sewer
system.
By expanding its fourth treatment stage with activated carbon powder
for eliminating trace quantities, EBS is embarking on innovative roads
to safeguard the high quality of clarified wastewater.
After all, this owner-operated company is also integrated in flood
protection, which is especially important for a city like Mannheim
that lies on two rivers. In particular, the priority here is given to
measures for rainwater percolation because these contribute to the
maintenance of the natural water cycle.
This environmental report documents a large number of activities
and measures serving to protect waters, resources, and the environ-
ment and presents the ongoing and future projects in the environ-
mental and quality programme pursued by the Mannheim municipal
services.
3
FOREWORD
Felicitas Kubala Head of the Citizens Service,
Environmental, and Technical
Services Department
Alexander Mauritz Director of EBS

4
Assignments and organisation
EBS has many assignments, and the most important is the collection
and treatment of household and industrial wastewater as well as rain-
water from the whole city area before discharging it into the natural
water cycle, the waters entering the Rhine. EBS therefore fulfils its
sewage disposal obligations for the city of Mannheim. This is aligned
to the healthcare principles for the population and the greatest pos-
sible protection for people and the environment.
As an owner-operated municipal service provider integrated in the
city authorities, EBS is assigned to the Citizens Service, Environmental,
and Technical Services Department. The supervisory board is the
Technical Services subcommittee consisting of local councillors.
The regulatory authorities are the Regional Council Karlsruhe as the
Higher Water Authority and the Green Areas and Environmental
Protection Department of the city of Mannheim as the Lower Water
Authority. These inspect and promote adherence to the legal require-
ments. Some of these monitoring functions, e.g. quality assured
inhouse inspections for adherence to clarification plant thresholds,
are undertaken by the Wastewater Chemistry Division as an expert
body.
EBS is based at two locations. The new office and service building in
front of the sewer maintenance yard at Käfertaler Straße 265 is home
to Plant Management, the Commercial Department, and the Waste-
water Collection Department. The Wastewater Treatment Department
can be found in the clarification plant north of Sandhoven.
Environmental guidelines
Since 2003, EBS has been certified under the environmental and
quality standards ISO 9001 and ISO 14001. One integrated constituent
of the environmental and quality management system is the health
and safety of personnel. As a municipal environmental company, EBS
has set down a series of environmental guidelines. These include the
use of environmentally friendly procedures and equipment for the
protection of natural resources and waters, the reduction of CO2emissions and waste, the construction of rainwater percolation facil-
ities for the protection of groundwater, and advice to customers on
properly maintained private property drains and backflow prevention.
Of course, EBS acts according to the principle of legal certainty and
observes the current laws and regulations.
EIGENBETRIEB STADTENTWÄSSERUNG
New office building and sewer maintenance yard on Käfertaler Straße

5
Split rainwater charge
In addition to the wastewater charge based on freshwater consump-
tion, Mannheim has been levying as early as 1971 a rainwater charge
for the discharge of rainwater into the sewers – in accordance with
the public sewage disposal statute (Wastewater Statute). Mannheim
was therefore the pioneer of the split sewage charge, which is now
mandatory following a court ruling.
On 1 January 2009, the rainwater charge was calculated no longer as a
surcharge for fresh water consumption, but exclusively as a function
of area. Previously, rainwater drainage had been added to the waste-
water charge for private property whose drained area was under
1,000 m2. Above 1,000 m2, rainwater drainage had been charged per
square meter of drained area. Since 2009, this calculation system had
applied to all buildings connected to the sewer system, irrespectively
of their drained area.
The new system makes the charges fairer and creates financial incen-
tives for owners to deseal their property and to utilise and percolate
rainwater on site.
Environmental goals and measures
In line with its quality and environmental management system, EBS
draws up every year a programme listing the environmental and
quality goals and their measures. These environmental and quality
goals were also incorporated in the impact targets introduced in 2012
for all Mannheim departments. EBS regularly analyses the KPIs and
the implemented measures to assess the progress of accomplished
goals.
One of the most important long term projects is the “Enhancement
of cost efficiency through reduction of external energy purchasing”
with the goal of operating the clarification plant as a “self supplying”
unit. The increased use of internally generated biogas for heating
purposes and the production of electricity goes hand in hand with the
reduction of CO2 emissions. In 2013, biogas generation, heat utilisation,
energy saving measures, and the operation of a photovoltaic instal-
lation and water wheel helped to save about 35,000 tonnes of CO2emissions.
A further environmental goal that EBS has been pursuing since 2010
targets improvements to the protection of waters. This involves the
additional use of activated carbon powder (ACP) for the elimination
of trace quantities in wastewater. Following a successful two-year trial
run on a split wastewater flow, the ACP system is now being expanded
for the full flow. The goal of removing micropollutants from the waters
entering the Rhine constitutes at the same time a contribution towards
implementing the EU Water Framework Directive.
EBS expects process improvements and greater cost effectiveness
from benchmarking. At two year intervals, the owner-operated com-
pany takes part in benchmark events for sewer construction, sewer
maintenance, pump houses, analytics, indirect discharger inspec-
tions, and KPI comparisons between wastwater and water supply in
Baden-Württemberg. By analysing KPIs for the systematic and con-
tinuous comparisons between operating parameters and those from
other municipal service providers, EBS aims to refine specifically its
own services.
2.00
1.50
1.00
0.50
0.00
Development of fees 2000–2014
Euros
1.46
0.77
Sewage charge Rainwater charge based on area
2000
1.46
0.77
2001
1.46
0.77
2002
1.46
0.77
2003
1.46
0.77
2004
1.46
0.77
2005
1.58
0.79
2006
1.58
0.79
2007
1.58
0.79
2008
1.58
0.79
2009
1.58
0.79
2010
1.68
0.81
2011
1.68
0.81
2012
1.68
0.81
2013
1.68
0.81
2014

The sewer system
The sewer system under the city of Mannheim today consists of 891 km
of waste- and rainwater lines in public space. This does not include
the service lines. Under the Wastewater Statute, the whole length of
these lines up to the municipal sewer is the property of the land
owner. The system carries predominantly combined sewage, i.e. it
collects both waste- and rainwater.
The sewer system owned by EBS extends over 824 km. The sewer
pipes range in cross section from 250 mm to 3400 mm. After growing
for over 135 years, the sewer system includes sections whose ages
vary greatly. The oldest sewers in the inner city were built in 1877,
mostly of clinker brick. About half of the sewers were built within the
last fifty years.
The sewer system consists of a wide range of materials. Vitrified clay
is used for sewers ranging from DN 250 to DN 800. This material has
been used for decades, so vitrified clay pipes represent the largest
proportion of the sewers, covering a length of 423 km. Concrete and
in-situ concrete are used for larger and main collectors over DN 1000.
Their present length is 276 km. Sewers made of other materials like
plastic or cast pipes range from DN 250 to DN 500 and currently
represent a length of 23 km.
WASTEWATER DISCHARGE
6
Materials used for the sewers
3%
12%
34%51%
Plastic
Masonry
Concrete
Vitrified clay
100
90
80
70
60
50
40
30
20
10
0
%
Sewers inspected in 2013
Totalinspections
Travelling digitalcamera
Accesspersonnel
100.0 %
88.2 %
11.8 %
Sewer inspections
Maintenance and inspection
If the sewers are to maintain their operative state, they must be
cleaned at regular intervals. Sewer Maintenance has six high pressure
flushing vehicles and one suction vehicle. These combined vehicles
are fitted with a high pressure flusher that cleans the sewage pipes at
pressures up to 180 bar. Three vehicles use fresh washer for flushing.
Three flushing vehicles with water recovery clean with filtered sewage.
This saves not only drinking water, but also lengthy trips to the sewer
maintenance yard or the nearest hydrant. After flushing, the detached
deposits and the flushing water are taken back up in the combined
vehicle through a suction device and disposed of in the clarification
plant.
Under the Baden-Württemberg inhouse inspection ordinance EKVO,
EBS is obliged to inspect the state of its sewage installations and
sewer system at regular intervals. The sewer system can operate
reliably only when its condition is inspected by access personnel or
recorded by travelling cameras. The data collected from these inspec-
tions are immediately stored in digitised form in the TV vehicle and
exported to the sewer database “Strakat”.
In 2013, the inspected sewers amounted to 100%. Of these, 697
kilometres (88.2%) were inspected with the TV camera, and 127 km
(11.8%) by personnel who could access the larger diameters.
7
450
400
350
300
250
200
150
100
50
0
Sewer notifications 2010–2013
2010
2011
2012
2013
Totaldeployments
Chemicalaccident
Unpleasantodours
Sewer Manholecover
Domesticservices
Rats Rain inlets Other
444
305292
274
1 2 1 113
23 2914 10 3 0 2
4424 27 20
92
38
22 3035
69 6638
192
107 98
136
48 38 4629
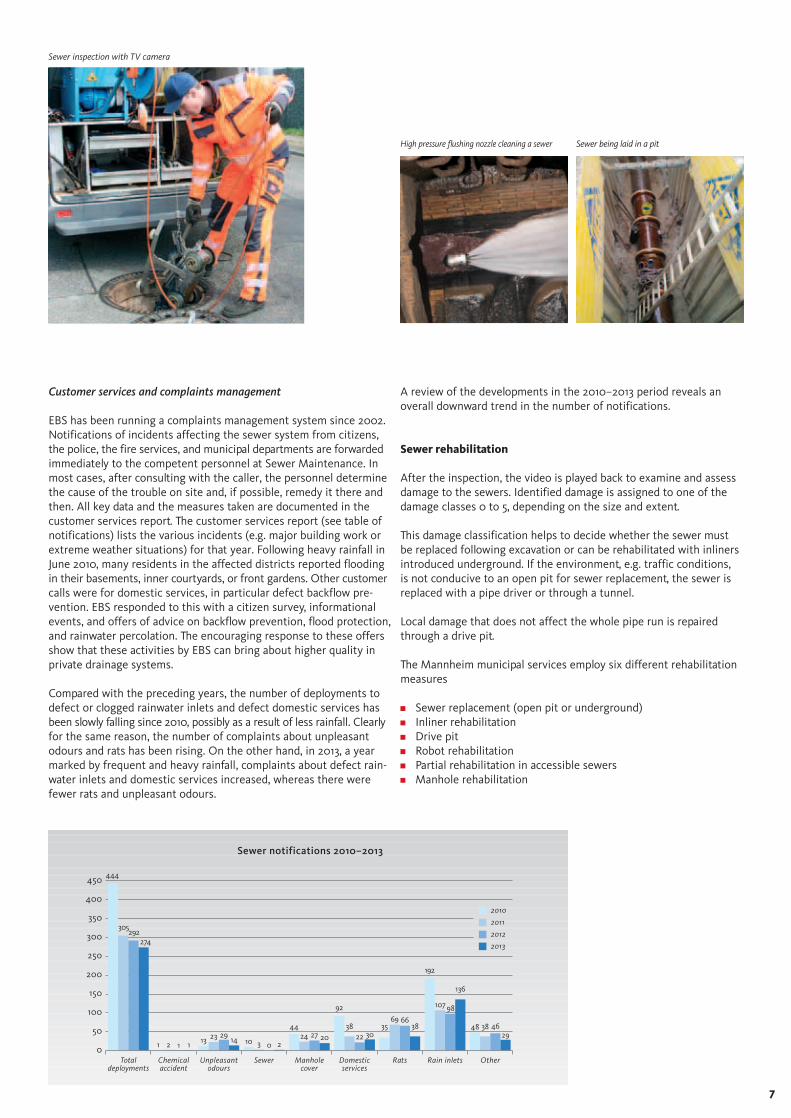
Customer services and complaints management
EBS has been running a complaints management system since 2002.
Notifications of incidents affecting the sewer system from citizens,
the police, the fire services, and municipal departments are forwarded
immediately to the competent personnel at Sewer Maintenance. In
most cases, after consulting with the caller, the personnel determine
the cause of the trouble on site and, if possible, remedy it there and
then. All key data and the measures taken are documented in the
customer services report. The customer services report (see table of
notifications) lists the various incidents (e.g. major building work or
extreme weather situations) for that year. Following heavy rainfall in
June 2010, many residents in the affected districts reported flooding
in their basements, inner courtyards, or front gardens. Other customer
calls were for domestic services, in particular defect backflow pre-
vention. EBS responded to this with a citizen survey, informational
events, and offers of advice on backflow prevention, flood protection,
and rainwater percolation. The encouraging response to these offers
show that these activities by EBS can bring about higher quality in
private drainage systems.
Compared with the preceding years, the number of deployments to
defect or clogged rainwater inlets and defect domestic services has
been slowly falling since 2010, possibly as a result of less rainfall. Clearly
for the same reason, the number of complaints about unpleasant
odours and rats has been rising. On the other hand, in 2013, a year
marked by frequent and heavy rainfall, complaints about defect rain-
water inlets and domestic services increased, whereas there were
fewer rats and unpleasant odours.
A review of the developments in the 2010–2013 period reveals an
overall downward trend in the number of notifications.
Sewer rehabilitation
After the inspection, the video is played back to examine and assess
damage to the sewers. Identified damage is assigned to one of the
damage classes 0 to 5, depending on the size and extent.
This damage classification helps to decide whether the sewer must
be replaced following excavation or can be rehabilitated with inliners
introduced underground. If the environment, e.g. traffic conditions,
is not conducive to an open pit for sewer replacement, the sewer is
replaced with a pipe driver or through a tunnel.
Local damage that does not affect the whole pipe run is repaired
through a drive pit.
The Mannheim municipal services employ six different rehabilitation
measures
Sewer replacement (open pit or underground)
Inliner rehabilitation
Drive pit
Robot rehabilitation
Partial rehabilitation in accessible sewers
Manhole rehabilitation
Sewer inspection with TV camera
High pressure flushing nozzle cleaning a sewer Sewer being laid in a pit

Private property drainage
The care and maintenance of private service connections and sewers
are the responsibility of the land owner. According to the Wastewater
Statute of the city of Mannheim, this responsibility for private sewage
systems extends beyond the borders of the private property and up
to their connection to the public sewer. When wastewater leaks from
damaged sewers, this can not only pollute the groundwater, but also
hollow out sections of pavements and roads, causing them to collapse.
On 1 January 2014, a new law reforming the water laws came into
force in Baden-Württemberg. § 51 regulates the changes affecting the
inspection of private property drainage systems. Even though details
on the type and scope of these investigations and their intervals have
still to be specified, the principle still applies that pollution to the
groundwater must be prevented. This, however, is possible only when
the entire sewer system – public sewers and private property lines –
are tight. Whereas the public sewers are cleaned, examined, and
rehabilitated at regular intervals, this is not always the case for private
sewers. The advice and information that the experts at EBS can offer
citizens, companies, and business people not only affect the rehabili-
tation and tightness of private property sewers, but also backflow
prevention, flood protection, and the legal regulations.
Rainwater percolation
Owing to the heavy level of sealing in the cities, rainwater discharges
predominantly into the sewers. As a consequence, the groundwater
table has been sinking constantly, and more so in the dry years. The
European Water Framework Directive (WFD) demands percolation as
the preferred system of rainwater drainage. Accordingly, § 55 (2) of
the Baden-Württemberg Water Ecology Act prescribes that projects for
new buildings include a rainwater percolation facility on the property.
The aim of rainwater percolation is to reinstate the natural balance of
the water cycle and to promote the replenishment of groundwater.
An additional problem is posed by the frequent bouts of heavy rain
caused by the emerging climate change. The sewer system cannot
collect these large quantities of rainwater in such a short time, and
there is temporary flooding on roads and squares as a result. Public
areas must be provided with retention capacities (e.g. roads or squares)
that can be dammed without damage. Consequently, the only ap-
proach to a solution that experts can see involves cooperation between
municipal services, city planning, and road planning. These plans are
then no longer based on theoretical calculations for the sewer system,
but on fundamental risk analyses that concentrate on institutions
(e.g. hospitals) in need of special protection before this background.
EBS has realised various projects for local rainwater percolation in
the public space. Development measures on Beim Hochwald and
Krautgartenweg included the construction of percolation troughs in
public green spaces. The land owners can discharge rainwater through
lines into the percolation trough or percolate it on their property.
The positive effects are less load on the sewer system during heavy
rainfall, and there is less flooding and backflow in the roadside envi-
ronment. On the other hand, there are no longer any flushing effects
in the sewers, but improved pipe materials are intended to compen-
sate for this in areas of new buildings. In contrast to the old bricked
or concreted sewers with rough surfaces, the new sewers of HDPE
(high density polyethylene) exhibit only minimal surface roughness,
and there are scarcely any deposits.
8
2010 2011 2012 2013
Inliner rehabilitation 791 m 450 m 1067 m 1512 m
Drive pit 80 x 75 x 63 x 94 x
Sewer replacement 717 m 569 m 237 m 455 m
Hydraulic measures 911 m 444 m 528 m 734 m
New sewer construction / 0 m 0 m 695 m 67 m
development
Scope of rehabilitation types
Percolation trough in the public roadside environment

9
Pump houses and storage capacities
Owing to the flat Mannheim topography, a larger number of pump
houses are needed for the fast discharge of sewage to the clarification
plant. At present, EBS has been assigned by the planning authority
to operate 38 pump houses and service 32 pump stations.
During periods of heavy rain, 21 retention basins and drain channels
and nine rain overflow tanks with a total storage capacity of 185,000 m3
prevent flooding in the city. This storage capacity retains the rainwater
after heavy rainfalls and later introduces it back into the sewers. If, in
rare cases, the quantities of water exceed the limits of the available
storage capacities, then the rainwater is directed into the rain over-
flow tank after it has been clarified mechanically, and from there
through the rain outlets into the waters feeding the Rhine and Neckar.
The various storage capacities are spread over a large area of the city.
The largest above-ground interconnected complexes of retention
basins and rain overflow tanks can be found in the modified rain
overflow tank in Sandhofen (19,000 m3) and in the clarification plant
(39,500 m3). The largest underground rainwater retention basin can
be found in the Vogelsang district, with a capacity of 16,000 m3.
Recent calculations have verified that EBS operates storage capacity
that is more than adequate. This offers the optimal conditions for the
planned conversion of eight rain overflow tanks in the clarification
plant for the expansion of the activated carbon powder system. And
the remaining retention capacity of 171,000 m3 still complies with the
legal stipulations for preventing the discharge of dirt components
into the Rhine.
Flood protection
Also Mannheim keeps a close eye on climate change and the resulting
increase in extreme rainfalls. Primarily responsible for flood protection
are the fire services, which coordinate the municipal management
unit for disaster control. EBS is represented by executives and experts
on this committee and provides the technical preparations for flood
simulations. The task “Protective measures for the sewer system
following a dyke break” utilises computer simulations to develop
measures for the protection of the population and buildings in par-
ticular scenarios.
Rain overflow tanks in the clarification plant
Flooding of the Neckar in 2013

The clarification plant
Situated north of Sandhofen, the central clarification plant treats
every day an average 96,000 m3 of domestic, industrial, and trade
sewage from the whole city area. It has been designed for a population
equivalent of 725,000.
Wastewater and sludge treatment
In the clarification plant, the wastewater needs just 24 hours to pass
through three stages before it is discharged, clarified and filtered,
into the waters entering the Rhine.
Mechanical wastewater treatment with coarse and fine screens,
grit trap, aerated grease trap, and primary settling tank
Biological wastewater treatment with nitrification, denitrification,
and biological phosphorus elimination, and final settling tank
Chemical phosphorus elimination (only as a supplement) through
addition of iron salts
Flocculation filtration in three layers with gravel, sand, expanded
shale
WASTEWATER TREATMENT
10
35
30
25
20
15
10
5
0
Influent wastewater in the Mannheim clarification plant
Million m3/year
2010 2011 2012
33.1
19.9
12.9
28.9
19.8
8.1
30.3
17.6
12.7
WastewaterSewage Rainwater
2013
35.1
18.75
13.96
In the near future, 90% of the annual wastewater quantity will pass
through the activated carbon powder (ACP) system as the fourth
treatment stage for the elimination of trace quantities.
The following processing steps reduce the volume of the sewage
sludge accruing from the wastewater treatment:
preliminary sludge thickening, i.e. the separation of a large
part of the water content
sludge digestion in three anaerobic tanks at a constant
temperature of 37 °C for a retention time of up to forty days
digested sludge dewatering, reducing the water content from
94% to 70%
thermal drying at temperatures up to 500°C until the residual
moisture is reduced to 5%
About 10,000 tonnes of dried sludge granulate, or so called biosolid
pellets, are produced every year, mostly serving as fuel or raw materials
for the cement industry. From the spring of 2014, it is planned to
recycle about 50% of the dried sludge in a sewage sludge gasifier on
the clarification plant grounds.

11
1,000
900
800
700
600
500
400
300
200
100
0
Concentration and performance for the parameter COD
mg/l
100
90
80
70
60
50
40
30
20
10
0
%
2010 2011 2012 2013
DischargeInfluent
663
29
827
26
733 724
25 24
Degradation
96 97 97 97
70
60
50
40
30
20
10
0
Concentration and performance for the parameter
total nitrogen (inorganic)
mg/l
100
90
80
70
60
50
40
30
20
10
0
%
2010 2011 2012 2013
DischargeInfluent
58.7
6.4
63.4
6.1
62
56.1
Degradation
89 90 89 90
7.1 5.8
14
12
10
8
6
4
2
0
Concentration and performance for the parameter
total phosphorus
mg/l
100
90
80
70
60
50
40
30
20
10
0
%
2010 2011 2012 2013
DischargeInfluent
10.84
0.26
12.3
0.24
9.47
8.04
0.19
Degradation
98 98 98 98
0.21
Aerial photograph of the clarification plant (2013)
Environmental performance
According to the environmental standard EN ISO 14001, environmental
performance is defined as the “[m]easurable results of the environ-
mental management system, related to an organisation’s control of
its environmental aspects”. Environmental aspects are constituents
of an organisation’s activities, products, or services that affect the
environment.
At EBS, the measurable results of its activities mainly refer to the
clarification plant performance (degree of degradation) based on the
parameters COD (chemical oxygen demand), total nitrogen (inor-
ganic), and total phosphorus relevant to the environment and permits.
The degree of degradation is the most important indicator for the
effective protection of waters.

12
Minimum
requirements
under WHG
COD mg/l 75
COD degradation %
NH4-N mg/l 10
Oxygen demand level
Ntot mg/l 13
Degradation Ntot %
Ptot mg/l 1
Degradation Ptot %
Nutrient load level
Infiltration water content %
20 1 0
EBS Land Declared
B-W values
State EBS
29 21 60
95.7 95
0.2 0.8 3
1
6.4 9.4 9
89.2 76
0.26 0.7 0.6
97.6 89
1
1.4 45
20 1 1
EBS Land Declared
B-W values
State EBS
26 22 60
96.9 95
0.2 0.8 3
1
6.1 10 9
90.3 78
0.24 0.7 0.6
98 90
1
0.8 40
20 1 2
EBS Land Declared
B-W values
State EBS
25 21 60
96.9 90
0.39 0.8 3
1
7.1 9.6 9
88.6 78
0.21 0.6 0.6
97.9 90
1
6 39
20 13
EBS Land Declared
B-W values
State EBS
24 20 60
96.7
0.22 0.6 3
1
5.8 9.2 9
89.7 75
0.19 0.6 0.6
97.6 90
1
11.3 47
Clarification plant performance in DWA comparison
EBS in the DWA performance comparison
Since 1974, the Baden-Württemberg branch of the German water
management, sewage, and waste association DWA has been publishing
annual comparisons of clarification plant performance throughout
the state.
These comparisons are based on values that operating personnel had
measured during inhouse inspections. The effectiveness of a system
is assessed on the basis of the degree of degradation for several
parameters.
Since the outset, EBS has been included in the DWA performance
comparisons. The quality assurance and the continuous improvement
of the technology and processes are reflected in the findings. For
years, EBS has been assessed with the best degrees of degradation
for the dirt component parameters, and heads the list of 38 large scale
clarification plants in Baden-Württemberg.
The table presents the EBS performance next to the minimum requi-
rements under the German Water Ecology Act WHG, the average
values obtained from the clarification plants in Baden-Württemberg,
and the self declared thresholds at EBS.

13
Elimination of trace quantities with activated carbon powder
Despite what appears to be improved water quality to the naked eye,
our waters are not without pollutants. In addition to a great many
chemical micropollutants like e.g. additives in household chemicals,
care products, and cosmetics, also large quantities of drug residue
like painkillers, antibiotics, hormones, and contrast media are carried
every year into the rivers, and from there into the water cycle. They
can promote multiresistant pathogens and deformities in fish. To date,
conventional sewage treatment in clarification plant could extract
only a very small portion of these trace quantities.
Since 2010, EBS has been operating in the clarification plant a pilot
installation intended to remove trace quantities from wastewater.
The use of activated carbon powder for eliminating trace quantities is
a new technology. The first project to apply this on an industrial scale
was led by scientists from Biberach University of Applied Sciences
investigating the effects on a split sewage flow. The effectiveness of
this method has been verified in a number of measurement tests.
Indisputable findings were also returned by the Bavarian state environ-
mental agency LfU that monitored a fish population in the Mannheim
clarification plant. After four weeks, the blood of male rainbow trout
kept in biologically clarified wastewater was discovered to contain
levels of vitellogenin, a parameter for the oestrogenic effects of
hormonal substances, that was about 350 times greater (VG-F = 373)
than the fish population kept in biologically treated and filtered
wastewater that had been additionally clarified with ACP. This showed
that ACP treatment can remove over 80% of these trace quantities
in wastewater.
Following these encouraging findings, the ACP system was expanded
for the full flow from 2014. In future, the activated carbon powder
system will be able to treat 1,500 litres of clarified wastewater every
second.
Activated carbon powder system for eliminating trace quantities
10,000
1,000
100
10
0
Findings of fish monitoring
[μg/l
Pre-expFSD
Post-expFSD
Pre-expFD
Post-expFD
Pre-expFD incl ACP
Post-expFD incl ACP
FSD final settling discharge
FD filtration discharge
ACP activated carbon powder
VG-F vitellogenin increase factor
Source: Dr. Julia Schweiger, LFU Bayern
Rise in blood vitellogenin concentration after four weeks
VG-F= 373
VG-F= 20.2
VG-F= 1.8

A clarification plant needs huge amounts of energy to operate. About
20% of the city’s electricity consumption goes into feeding it. Every
year, the Mannheim clarification plant consumes about 23 million
kilowatt hours of electrical energy and about 29 million kilowatt hours
of energy supplied by sewage and natural gas.
By introducing a large number of measures, EBS is gradually approach-
ing its goal of operating the clarification plant as a self supplying
system.
Sewage gas generation and utilisation
In order to reduce the rising energy costs, EBS is increasingly turning
to the onsite generation of regenerative energies. At present, the
digesting tanks are producing about nine million cubic metres of
sewage gas every year. This is used completely for the generation of
energy in the clarification plant. About one third of the gas quantity
is fired in the hot gas generators for the sludge drying section. The rest
is converted into heat and energy by four-stroke internal combustion
gas engines. In turn, the heat emitted by the gas engines and the
thermal energy gained from the sludge drying section cover all of the
clarification plant’s needs to heat up the digestion tanks, the build-
ings, and the hot water supply. At the same time, the gas engines in
the combined heat and power (CHP) station serve as a backup power
supply to parts of the clarification plant, maintaining the flow of
wastewater during prolonged power outages.
In the space of just a few years, EBS is now paying nearly double the
costs for electricity purchased from outside, from 10.48 ¢ per kWH in
2006 to 20.1 ¢ per kWh in 2014. This has resulted in the sharp increase
to energy costs overall. Compared with electricity, natural gas prices
have risen only by a little, so sewage gas is used to generate electricity
for specific purposes. Accordingly, there is increasing use of natural
gas in the sludge drying section.
Cofermentation
Since 2006, EBS has been utilising cofermentation to increase the
generation of sewage gas. This involves collecting product residue from
the foodstuffs industry or readily degradable organic substances
together with the sewage sludge in the digesting tanks. The increased
fermentation processes raised the sewage gas production by 80–100%.
Since 2012, the market for cosubstrates has been developing to the
detriment of EBS. The cosubstrates are no longer available to the
extent or with the consistency they had in the last few years. The
search has therefore started for other suitable substrates. At present,
EBS is in talks with the Regional Council (RP) Karsruhe about the
acceptance and pasteurisation of waste food. A system is already
under construction. The company has applied to RP Karlsruhe for a
permit to pasteurise Category 3 materials (including slaughterhouse
waste and waste food from large kitchens) on the clarification plant
grounds.
For EBS, cofermentation is an integral constituent of energy manage-
ment because it increases the production of electricity and heat.
Sewage sludge gasification
The first construction stage for an external operator’s sewage sludge
gasifier is now running in test mode on the clarification plant grounds.
The system has been designed to process 5,000 tonnes of sewage
sludge and 800 tonnes of screenings every year.
The sewage sludge gasifier is a fluidised bed gasifier that extracts
organic residue from the biosolid pellets at about 850°C, giving rise
to synthesis gas. This is a lean gas that can be used to dry sludge and
fuel gas engines. The remaining material is landfilled or used as recy-
cled material in the building industry. The use of the phosphorus it
contains could be an issue for the future.
RENEWABLE ENERGIES
14
Natural gas Electricit Total energy purchases
3,000,000
2,500,000
2,000,000
1,500,000
1,000,000
500,000
0
Development of external energy costs for the clarification plant
Euros
1992
1993
1994
1995
1996
1997
1998
1999
20002001
20022003
20042005
20062007
2008
20092010
20112012
20132014
15
Heat from wastewater
At present, EBS is managing two showpiece projects for heating
buildings with thermal energy gained from the sewer. The first project
was realised in the listed Ochsenpferch pump house. A heat exchanger
was installed over a length of 42 metres in a sewer measuring 2.20 m
across. The system started operations in 2011. Two years of operations
helped to save about 10,000 litres of fuel oil a year, equalling CO2
savings of about 28 tonnes a year.
The second project is running in the new EBS office building on
Käfertaler Straße. Here, in the summer of 2013, a wastewater heat
pumping system was installed that is used for heating and cooling
purposes. For peak load periods, the building was fitted with a con-
nection to the district heating system as well as an additional cooling
system on the roof. Thanks to its innovative installations, the new
building consumes 33% less than the requirements under the German
energy savings act EnEV 2009 and was awarded the EU Green Build-
ing Label.
Heat exchanger in the sewer
Digestion tank
Sewage sludge gasifier Water wheel in the discharge to the Rhine
Photovoltaic installation on the filtration section
On completion of the two successive construction stages, the sewage
sludge gasifier will generate a total of 15.2 million cubic metres of
synthesis gas every year. Together with the measures already imple-
mented, these measures might be enough to cover far more than
90% of the clarification plant’s energy needs. And the onsite utilisa-
tion of sewage sludge additionally saves transport routes and fuel.
CO2 emissions will then be reduced by about 40,000 tonnes per
year.
Photovoltaics and hydropower
Since 2006, a photovoltaic (PV) installation fitted with solar modules
covering an area of 2,300 m2 has been producing electricity from
solar energy on the filtering tank. In its first year of operation, the PV
installation delivered about 238,000 kWh of solar electricity that is
fed into the grid of the local utility at the subsidised prices. The elec-
tricity generated varies between 230,000 and 250,000 kWh per year.
Electrical energy is generated from hydropower by a water wheel in
the clarification plant’s discharger to the Rhine. Unlike the turbine,
this so called Zuppinger wheel with curved blades is better suited to
varying water levels. Its efficiency exceeds 80%.

It is inevitable that the environment suffers under the activities and
procedures involved in the collection and treatment of wastewater.
On the one hand, the plant must consume water, energy, and resources.
On the other, there is an accumulation of waste and other residue.
The analysis of materials streams and their flow rates provides a basis
for measures serving to lessen the impact on the environment.
EBS endeavours to keep the consumption of resources to the absolute
minimum, for instance when drawing groundwater or purchasing
external electricity. The waste quantities accruing from wastewater
treatment, sewer cleaning, and sewer rehabilitation are reduced when-
ever possible and introduced to a recycling process. Some examples
include the generation of synthesis gas from biosolid pellets and the
use of clarified wastewater as process water.
However, when seen overall, the environmental impact of wastewater
collection and treatment appears relatively small when they are off-
set by the benefits the sewer system and the clarification plant have
for the health of the population and for the environment.
The lifecycle assessment also takes economic aspects into account.
Here it can be seen from a series of measures that investments in
environmental and climate protection pay off over the long term, e.g.
energy optimisation measures targeting the “self supplying” clarifi-
cation plant.
Consumption of resources
Water
Sewer Maintenance draws the largest quantities of drinking water for
flushing the sewer pipes. The three high pressure flushing vehicles
fitted with water recovery help to reduce the consumption of drinking
water. However, this resource saving technology can be used only on
sewer pipes with diameters greater than 1 m that carry adequate
quantities of influent.
The clarification plant covers its water needs primarily from ground-
water drawn by five pumps from two wells and from clarified waste-
water.
The clarification plant uses part of the clarified wastewater as internal
process water in the following systems:
as cooling water in the sludge drying section BW 21
for flushing the filters in BW 37
in the grit washer (replacing well water)
for flushing the rain overflow tanks
The sharp rise in drinking water consumption in 2011 and 2013 was
partly due to rehabilitation work on the digesting tanks and concrete
repair on the stacked sludge containers. The high pressure jets used
to blast the facades could be supplied only with drinking water.
LIFECYCLE ASSESSMENT
16
5,000
4,500
4,000
3,500
3,000
2,500
2,000
1,500
1,000
500
0
Water consumption in the clarification plant
Thousand m3/year
2010 2011 2012
Clarified wastewaterWell water
2013
326
4,167
324
4,148
473
4,211
411
4,175
16,000
14,000
12,000
10,000
8,000
6,000
4,000
2,000
0
Drinking water consumption in the clarification plant
Thousand m3/year
6,596
14,485
7,042
11,561
2010 2011 2012
Drinking water consumption
2013

17
4,000
3,500
3,000
2,500
2,000
1,500
1,000
500
0
Use of clarified wastewater in the clarification tank
Thousand m3/year
2010 2011 2012 2013
Cooling water BW21 Grit washer + rain overflow
2,190
1,533
444
2,190
1,533
426
1,533
488
2,190
459
2,190
1,526
Flushing water BW37
Plans to build a closed cooling circuit with adsorption refrigeration
machines (cold generated from heat emissions) are to save in future
about 90,000 m3 of well water a year.
Energy – electricity and natural gas
The trend of energy consumption in the clarification plant must be
interpreted in conjunction with the measures for the inhouse generation
of power. Until 2007, the production of sewage gas had helped to cut
the costs of external electricity every year and had increased to such
an extent that it replaced completely the natural gas purchased from
outside suppliers.
Further savings in electrical energy could also be achieved in 2005
with the turbo compressor fuelled by sewage gas, in 2006 with the
photovoltaic installation, and in 2012 with the water wheel. The slight
rise in electricity and natural gas purchases from 2007 resulted from
the declining production of sewage gas following shortfalls in cofer-
mentation substrates.
In spite of the new additions to its installations, the clarification plant
shows a slight drop in its energy needs. However, the development of
the cosubstrates market has taken a turn to the detrimental of sewage
gas production, so the energy this should have delivered had to be
replaced with purchased electricity. From 2011 to 2012 there was a
slight increase in electricity needs when new systems and installations
started operations. Following energy optimisation measures, the elec-
tricity consumption in the clarification plant dropped from 23,746 MWh
in 2012 to 22,962 MWh in 2013.
25,000
20,000
15,000
10,000
5,000
0
MWh
20002001
20022003
20042005
20062007
2008
20092010
20112012
20132014
Generation of electricity and development of
its consumption in the clarification plant
CHP station Electricity Energy needs Turbo compressor PV installation
Natural gas Electricity Total energy purchases
35,000
30,000
25,000
20,000
15,000
10,000
5,000
0
Development of purchased energy consumption
in the clarification plant
MWh
1992
1993
1994
1995
1996
1997
1998
1999
20002001
20022003
20042005
20062007
2008
20092010
20112012
20132014
Combined heat and power station in a containerGas tank

Resources
Fuels
The Sewer Maintenance vehicles take the lion’s share of the total fuel
consumption (petrol, diesel). The high pressure flushing and suction
vehicles are fitted with powerful diesel engines, so their fuel con-
sumption is relatively high. The other fuels – petrol and four-star – are
consumed by the daily business trips by car. Petrol consumption could
be reduced after EBS had purchased cars of greater fuel economy
and concentrated its operations at two locations (fewer trips).
Precipitation and flocculation aids
Precipitation and flocculation aids serve to eliminate phosphates and
improve the processes involved in the treatment of wastewater and
sludge.
In the summer months when the wastewater temperatures are higher,
the biological elimination of phosphorus is perfectly adequate, and
less precipitation aids are used as a result. In winter, on the other
hand, iron sulphate must be added if all of the carried phosphates are
to precipitate out and the stipulated thresholds observed. The quan-
tities consumed annually therefore depend greatly on the weather
conditions.
Flocculation aids are added to the sludge treatment processes in
equal quantities over the whole year. Flocculation aids are used to
thicken and dewater the sewage sludge by increasing the volume of
the sludge floc to an extent suitable for dewatering. The quantities
used vary depending on the extent and consistency of the influent
sludge. The growing trend can be put down to the increasing quan-
tities of sewage sludge generated by cofermentation.
18
140,000
120,000
100,000
80,000
60,000
40,000
20,000
0
Fuel consumption EBS
Litres/year
2010 2011 2012
DieselFour star + petrol
14,466
109,349
14,352
114,381
13,843
114,205
12,814
109,315
2013
2,000
1,800
1,600
1,400
1,200
1,000
800
600
400
200
0
Consumption of precipitation and flocculation aids
in the clarification plant
Tonnes/year
2010 2011 2012
Flocculation aidsPrecipitants
1,430
176.75
1,365
224.50
1,427
178.05
2013
1,327
205.88

19
Waste
Sewage sludge and screenings
Since 2005, the dried sewage sludge has been used primarily as a fuel
in the cement industry. As a consequence of cofermentation, the total
quantity of sewage sludge had risen slightly, ultimately maintaining a
relatively stable level of about 10,000 tonnes a year. In 2012, the
cosubstrates market started on a course to the detriment of EBS. The
quantity of screenings started to increase after the grit washer had
been fitted with an organic filter. The collected organic solids had
first been disposed of together with the screenings in the MVV waste
incineration plant. The procedure has been changed, and now the
collected organic matter joins the influent to the primary settling
tanks and ultimately to the digesting tanks where they are converted
together with the primary sludge into sewage gas and water.
Treated and sewage grit
Huge amounts of grit are produced when the clarification plant treats
wastewater and the sewer pipes are flushed. Both the sewage grit
entering the clarification plant and the contents of the grit trap are
routed to the grit washer. This removes the organic constituents. The
washed grit is transported to the landfill operated by AGB Mannheim
and there used as a cover soil.
12,000
10,000
8,000
6,000
4,000
2,000
0
Annual quantities of residue in the clarification plant
Tonnes/year Screenings Grit from trapsand sewers
Total quantity ofsewage sludge
2010
1o,372
488444
2011
10,886
7431,432
2012
9,950
1,023655
2013
9,461
523 605
Dewatered sewage sludge Organic residue washed out of grit

20
En route for the benefit of the climate
The field of mobility has the potential to save fossil energy and hence
CO2 emissions that should not be underestimated. The use of bicycles
and electric vehicles pays off for business trips, service trips, and ulti-
mately the trips to and from work.
A total of 92 company bicycles have been provided for personnel to
reach their assigned areas quickly on the expansive clarification plant
grounds. They are serviced by an employee in addition to his work as
a sewage technician. In 2010, two city bikes were bought for short
distance business trips by the administration on Käfertaler Straße.
At present, there are five electric vehicles in use on the clarification
plant grounds. The first electric car was acquired in 2001 (then without
a cab), and the second in 2011. Both vehicles are used round the clock
by shift personnel at the Processes Division. Two electric cars are sta-
tioned in the fitter’s shop and transport tools and heavy replacement
parts like pumps, units, etc. One electric car is used daily for cleaning
various buildings and pump houses and for transporting cleaning
agents, paper, and waste. This year, the fleet will be augmented with
two new electric cars.
The reach of these electric cars depends on the temperature, terrain,
driving style, and payload and is about 65 km. The top speed is 29 km/h
when the maximum noise levels reach 62 dB. The refuelling point is
any electric socket delivering 230 volts. The cars are “filled up” regularly
at night. Under normal conditions, a single charge lasts for three days.
Biotope in the clarification plant
The Mannheim clarification plant lies in the heart of a nature reserve.
By making every effort to treat this natural environment with all due
care and attention, EBS fulfils the requirements stipulated for this
location. Lined with trees and shrubs and featuring meadow orchards
and ponds, the clarification plant grounds promote a healthy environ-
ment for a wide range of flora and fauna that are a rare sight else-
where in the intensively farmed areas along the Upper Rhine. The green
areas that must be retained as free spaces for further expansions are
home to a flock of grazing sheep. Meadows with a variety of wild
herbs promote biodiversity.
ENVIRONMENTAL PROTECTION IN EVERYDAY OPERATIONS
Electric car in front of the digestion towers Sheep grazing on the meadow orchard

21
EBS IN FIGURES – 2013
General data
Catchment area city of Mannheim
Area: approx 145 km2
Population approx 327,000 inhabitants
Percentage of Mannheim households connected to the sewers 99.9%
Number of employees 244 (as of 12/2013)
Trainees 6
Wastewater charges
Sewage charge ¤1.68/m3
Rainwater charge ¤0.81/m2 per year
Wastewater discharge
Drained areas approx 7,100 ha
Length of the sewer system (combined sewage) 891 km
Company vehicles
– Cleaning vehicles (flushing vehicles, of which three with water recovery) 6
– Suction vehicle 1
– TV vehicles 2
Pump houses and rainwater overflow structures
Rain overflow tanks 8
Rainwater retention basins 7
Rainwater retention sewers 4
Sewage storage capacities 10
Total retention capacity approx 185,000 m3
Pump houses 38
Pump stations 32
Wastewater treatment, clarification plant
Population equivalent 725,000 (PE)
Quantity of influent wastewater for biological treatment
– Dry weather, max 1,250 l/s
– Rainy weather 4,000 l/s
– Max influent quantity incl clarification plant’s rain overflow tank 10,000 l/s
Sewer plan of Mannheim
22

23
Site plan of the clarification plant
Legend
2 Influent pump house, exhaust air scrubber
2 a Wastewater treatment facility
3 Screening chamber and container system
3 a Influent, measurement, permanent sampler
4 Grit trap with washer
4 a Grit storage area
5 Grease trap
6 Circular distributor to the primary settling
tanks
7 Primary settling tank
8 Raw sludge pump house
11 High water pump house
15 Control station for rain overflow tanks
16 Stacked containers for raw sludge, excess
sludge
16 a Preliminary centrifuge
16 b Cosubstrate system
17 Sludge pump house
18 Digestion tank
19 Stacked containers for digested sludge
20 Excess sludge thickener
20 a Flocculants and central pump house
21 Sludge dewatering and drying systems
21 a Overseer’s office
22 Sewage sludge gasification
23 CHP station 4
24 Gas tanks
24 a Switch room for gas tanks / flare
25 Central control room, administration, truck
scales
26 Conference room, canteen, personnel rooms
26 a Laboratory
27 Power centre (CHP station)
28 Garages
28 a Workshops, electrical, measuring, and control
installations
28 b Fitter’s shop / storeroom
35 Booster pumping station, filtration
36 Centre column, filtration
37 Filtering tanks / photovoltaic installation
38 Induction flowmeter
39 Water wheel
39 a Precipitant dosing outstation
40 Booster pumping station for biological stage
41 Circular distributor to the biological stage
42 Aerated sludge tanks
43 Distribution structure to final settling tanks
44 Final settling tanks
45 Return sludge pump house
46 Blower station, electric station
47 Precipitant dosing station
55 Rain overflow tank
70 Activated carbon powder system

Disclaimer
Published, designed, and edited by:
Eigenbetrieb Stadtentwässerung Mannheim
Käfertaler Str. 265
68167 Mannheim
Tel.: 0621/293-5210
Fax: 0621/293-5211
Email: [email protected]
www.mannheim.de/stadtentwaesserung
Layout
ID-Kommunikation, Mannheim
Photo credits
Kay Sommer (title image), EBS, Thomas Kilian, Netzwerk Schwamborn,
Harald Priem trans-ponder, Stadt Mannheim, Hartmut Stark
Paper
Printed on paper from sustainable forest
management (9lives Silk)
Printed by
ColorDruck Solutions GmbH
Gutenbergstr. 4
69181 Leimen-St.Ilgen
www.colordruck.com
April 2014
Side arm of the Rhine in Ballauf-Wilhelmswörth (Mannheim-Sandhofen)