Embed Size (px)
Citation preview

Institute of the Environment and
Sustainability
CONTRIBUTING AUTHORS Anuradha Singh
Olivia JenkinsFlora Zepeda Torres
Samuel Hirsch Jeffrey Wolf
Alycia Cheng
AUTHORS | EDITORSMark Gold
Stephanie Pincetl Felicia Federico
EnvironmentalReport Card
FOR LOS ANGELES COUNTY
2015
Funded by the Goldhirsh Foundation

M E T R I C S 6
AIR

U C L A I N S T I T U T E O F T H E E N V I R O N M E N T A N D S U S TA I N A B I L I T Y 2 0 1 5 E N V I R O N M E N TA L R E P O RT C A R D F O R LO S A N G E L E S C O U N T Y32
A I R
The improvement of air quality in the Los Angeles region is one of the great environmental success stories in our nation’s history. The days of public schools frequently cancelling outdoor physical education and athletics because of extremely poor air quality are long gone.
Overview
The success story is testament to effective regulation by EPA, the California Air Resources Board and the South Coast Air Quality Management District under the Clean Air Act and state laws. Los Angeles was one of the first regions in the country to develop an air quality district before the Clean Air Act was even passed. The environmental and research communities also have contributed greatly to this effort. However, despite the success story, the Los Angeles region still has
some of the worst air quality in the nation because of our climate and topography, mobile sources like cars and trucks, a large industrial sector, and the two major ports. Days exceeding state and federal air quality standards (“non-attainment days”) for ozone and particulate matter occur frequently, and air toxics continue to pose a major health risk, especially in low income communities. Climate change induced heat will create conditions for higher ozone concentrations, a criteria pollutant
the region is still combating. Other major factors affecting air quality include the vehicle fleet mix and energy source, as well as energy use by buildings.

U C L A I N S T I T U T E O F T H E E N V I R O N M E N T A N D S U S TA I N A B I L I T Y 2 0 1 5 E N V I R O N M E N TA L R E P O RT C A R D F O R LO S A N G E L E S C O U N T Y33
A I R
Air pollution can cause or contribute to a range of health impacts, from watery eyes and fatigue to respiratory disease, lung damage, cancer, birth defects, heart attacks, and premature death. The American Lung Association State of the Air 2014 Report12 puts Los Angeles County among the top 5 polluted areas in the country for ozone and PM2.5.
Ambient Air Quality
Air pollution in the County is primarily monitored by the South Coast Air Quality Management District (SCAQMD), which oversees all of the urban portions of LA, Riverside and San Bernardino counties, and all of Orange County. A small area in Northwest LA County is under the Antelope Valley AQMD (AVAQMD).
We base this discussion on criteria set by the Clean Air Act and the state implementation plan. USEPA designates areas of the country where air pollution
levels persistently exceed the national ambient air quality standards as “nonattainment.” Portions of the South Coast Air Basin are listed as ‘extreme non-attainment’ for ozone (8hr), and ‘moderate non-attainment’ for PM2.5 (particulate matter with diameter equal to or less than 2.5 microns). State and federal law requires these areas to meet clean air standards by the year 2015 for PM2.5, and by 2023 for ozone. EPA lowered the annual standard for PM2.5 in 2012 (from 15 to 12 ug/m3), and
with the likely toughening of the Federal ozone standard this year due to extensive research demonstrating human health risks at lower ambient ozone concentrations, even more of the region will be in non-attainment soon. LA County also is designated as “partial non-attainment” for lead based on two source-specific monitors in the Los Angeles County Cities of Vernon and Industry; all other areas are in attainment.
U C L A I N S T I T U T E O F T H E E N V I R O N M E N T A N D S U S TA I N A B I L I T Y 2 0 1 5 E N V I R O N M E N TA L R E P O RT C A R D F O R LO S A N G E L E S C O U N T Y34
A I R
Data
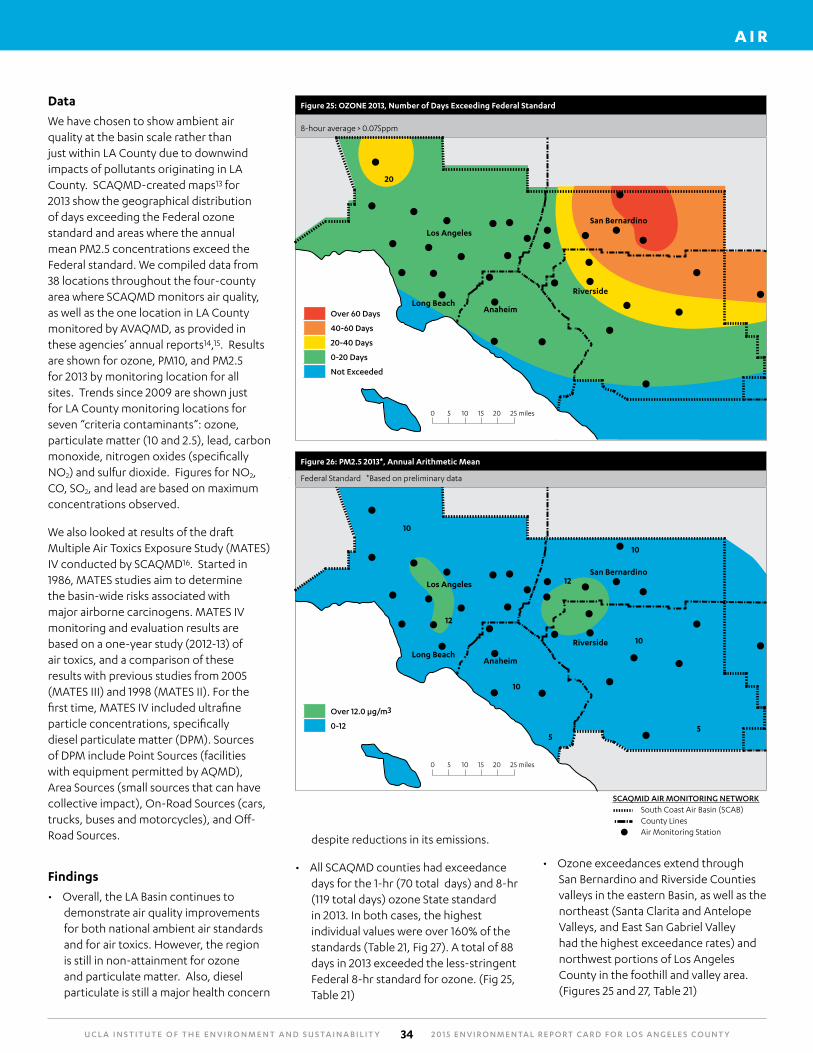
We have chosen to show ambient air quality at the basin scale rather than just within LA County due to downwind impacts of pollutants originating in LA County. SCAQMD-created maps13 for 2013 show the geographical distribution of days exceeding the Federal ozone standard and areas where the annual mean PM2.5 concentrations exceed the Federal standard. We compiled data from 38 locations throughout the four-county area where SCAQMD monitors air quality, as well as the one location in LA County monitored by AVAQMD, as provided in these agencies’ annual reports14,15. Results are shown for ozone, PM10, and PM2.5 for 2013 by monitoring location for all sites. Trends since 2009 are shown just for LA County monitoring locations for seven “criteria contaminants”: ozone, particulate matter (10 and 2.5), lead, carbon monoxide, nitrogen oxides (specifically NO2) and sulfur dioxide. Figures for NO2, CO, SO2, and lead are based on maximum concentrations observed.
We also looked at results of the draft Multiple Air Toxics Exposure Study (MATES) IV conducted by SCAQMD16. Started in 1986, MATES studies aim to determine the basin-wide risks associated with major airborne carcinogens. MATES IV monitoring and evaluation results are based on a one-year study (2012-13) of air toxics, and a comparison of these results with previous studies from 2005 (MATES III) and 1998 (MATES II). For the first time, MATES IV included ultrafine particle concentrations, specifically diesel particulate matter (DPM). Sources of DPM include Point Sources (facilities with equipment permitted by AQMD), Area Sources (small sources that can have collective impact), On-Road Sources (cars, trucks, buses and motorcycles), and Off-Road Sources.
Findings
• Overall, the LA Basin continues to demonstrate air quality improvements for both national ambient air standards and for air toxics. However, the region is still in non-attainment for ozone and particulate matter. Also, diesel particulate is still a major health concern
despite reductions in its emissions.
• All SCAQMD counties had exceedance days for the 1-hr (70 total days) and 8-hr (119 total days) ozone State standard in 2013. In both cases, the highest individual values were over 160% of the standards (Table 21, Fig 27). A total of 88 days in 2013 exceeded the less-stringent Federal 8-hr standard for ozone. (Fig 25, Table 21)
• Ozone exceedances extend through San Bernardino and Riverside Counties valleys in the eastern Basin, as well as the northeast (Santa Clarita and Antelope Valleys, and East San Gabriel Valley had the highest exceedance rates) and northwest portions of Los Angeles County in the foothill and valley area. (Figures 25 and 27, Table 21)
Figure 25: OZONE 2013, Number of Days Exceeding Federal Standard
8-hour average > 0.075ppm
San Bernardino
Riverside
Los Angeles
Long BeachAnaheimOver 60 Days
40-60 Days
20-40 Days
0-20 Days
Not Exceeded
0 5 10 15 20 25 miles
20
0 5 10 15 20 25 miles
San Bernardino
Riverside
Los Angeles
Long BeachAnaheim
55
10
10
10
12
12
10
Figure 26: PM2.5 2013*, Annual Arithmetic Mean
Federal Standard *Based on preliminary data
SCAQMID AIR MONITORING NETWORK South Coast Air Basin (SCAB) County Lines Air Monitoring Station
Over 12.0 μg/m3
0-12

U C L A I N S T I T U T E O F T H E E N V I R O N M E N T A N D S U S TA I N A B I L I T Y 2 0 1 5 E N V I R O N M E N TA L R E P O RT C A R D F O R LO S A N G E L E S C O U N T Y35
A I R
• All counties had exceedance days for the 24-hr PM10 State standard (East San Gabriel Valley was the highest in the County) (Table 21, Fig 28, but there were no exceedances for the much less stringent Federal PM10 standard in 2013.
• All counties had exceedance days for the 24-hr PM2.5 Federal standard in 2013 (13 total days). The highest 24-hr concentration was 172% of the standard. Exceedances are focused in areas around downtown Los Angeles and the San Fernando Valley, as well as in San Bernardino and Riverside Counties (Figures 26 and 29, Table 21).
• NO2, CO, SO2, and lead concentrations have been well within Federal and State standards since 2009. PM10 and PM2.5 show generally declining trends, although with some increases over the last few years. Ozone levels have shown small decreases in 2013 compared to 2009, although with variations in the intervening years. (Figures 30-33)
• The carcinogenic risk from air toxics in the Basin is estimated at 418 cancer cases per million in 2012, which is 65% lower than the monitored average in 2005. This risk refers to the expected number of additional cancers in a population of one million individuals if they were exposed to these levels over a 70-year lifetime. (Figure 34)
• About 90% of the risk in 2012 is attributed to emissions associated with mobile sources, with the remainder attributed to toxics emitted from stationary sources, which include large industrial operations such as refineries and metal processing facilities, as well as smaller businesses such as gas stations and chrome plating. (Fig 35)
• While diesel PM exposure decreased by ~70% over the last seven years, it still dominates the overall cancer risk from air toxics. (Fig 34) Highest risk areas are near ports and transportation corridors. Risk from other air toxics continue to decline, with limited exceptions. Ultrafine Particle measurements show higher levels in areas with higher
population and traffic density. (Fig 36)
Table 21: Number of exceedances of non-attainment pollutants. Source: SCAQMD 2013 Annual Report
% Days Ozone Exceedance - Federal 8 hr (>0.075ppm)
% Days Ozone Exceedence
State 8 hr (>0.070 ppm)
% Samples PM10
ExceedencesState 24 hr (>50
μg/m3)
% Samples PM2.5
ExceedencesFederal 24 hr (>35
μg/m3)
LOS ANGELES COUNTY
1 Central LA 0.0 0.0 2.0 0.3
2 Northwest Coastal LA County 0.0 0.3 - -
3 Southwest Coastal LA County 0.3 0.3 0.0 -
4
South Coastal LA County 1 0.0 0.4 0.0 0.6
South Coastal LA County 2 - - 2.0 0.3
South Coastal LA County 3 0.0 0.0 - -
6 West San Fernando Valley 3.5 5.8 - 0.8
7 East San Fernando Valley 1.7 4.7 2.0 1.2
8 West San Gabriel Valley 0.0 0.8 - 0.0
9East San Gabriel Valley 1 1.7 4.1 10.0 0.0
East San Gabriel Valley 2 7.5 11.8 - -
10 Pomona/Walnut Valley 4.4 6.2 - -
11 South San Gabriel Valley 0.0 0.8 - 0.0
12 South Central LA County 0.4 0.3 - 0.9
13 Santa Clarita Valley 11.0 16.8 0.0 -
14 Antelope Valley 0.4 1.4 4.3 0.0
ORANGE COUNTY
16 North Orange County 0.3 0.5 - -
17 Central Orange County 0.0 0.0 2.0 0.3
18 North Coastal Orange County 0.3 0.6 - -
19 Saddleback Valley 0.6 1.4 2.0 0.0
RIVERSIDE COUNTY
22 Norco/Corona - - 4.0 -
23
Metropolitan Riverside County 1 7.8 10.4 8.0 1.7
Metropolitan Riverside County 2 - - - 0.9
Mira Loma 6.0 9.4 24.0 2.5
24 Perris Valley 10.0 16.6 18.0 -
25 Lake Elsinore 3.5 6.8 - -
26 Temecula 0.9 3.4 - -
29 Banning Airport 17.0 18.1 2.0 -
30Coachella Valley 1 12.9 22.5 5.0 0.0
Coachella Valley 2 4.9 10.4 19.0 0.0
SAN BERNARDINO COUNTY
32 Northwest San Bernardino Valley 7.8 12.1 - -
33 Southwest San Bernardino Valley - - 5.0 0.9
34Central San Bernardino Valley 1 12.2 18.6 31.0 0.8
Central San Bernardino Valley 2 10.7 14.5 5.0 0.9
35 East San Bernardino Valley 17.9 25.5 3.0 -
37 Central San Bernardino Mountains 19.8 27.9 0.0 -
38 East San Bernardino Mountains - - - 1.7
Data Limitations
• Monitoring locations differ widely in terms of monitoring frequency, pollutants and sampling techniques; this is apparent in the differences in data available in Figures 27-33.
• The MATES IV report is based on the results of only 10 fixed sites designed to represent varying land-use types and geography across the Basin.

U C L A I N S T I T U T E O F T H E E N V I R O N M E N T A N D S U S TA I N A B I L I T Y 2 0 1 5 E N V I R O N M E N TA L R E P O RT C A R D F O R LO S A N G E L E S C O U N T Y36
A I R
Figure 30: NO2 Concentration as % of 1-Hour State Standard
PERC
ENT
OF
STA
ND
ARD
70
60
50
40
30
20
10
02009 2010 2011 2012 2013
Central LA NW Coastal LA Co. SW Coastal LA Co. Antelope Valley
S. Coastal LA Co. 1 S. Coastal LA Co. 3 W. San Fern. Valley E. San Fern. Valley
W. San Gab. Valley E. San Gab. Valley 1 E. San Gab. Valley 2 Pomona/Walnut Valley
S. San Gabriel Valley S. Central LA County Santa Clarita Valley
Figure 31: CO Concentration as % of 8-Hour State Standard
PERC
ENT
OF
STA
ND
ARD
50
40
30
20
10
02009 2010 2011 2012 2013
Central LA NW Coastal LA Co. SW Coastal LA Co. Antelope Valley
S. Coastal LA Co. 1 S. Coastal LA Co. 2 S. Coastal LA Co. 3 W. San Fern. Valley
E. San Fern. Valley W. San Gab. Valley E. San Gab. Valley 1 E. San Gab. Valley 2
Pomona/Walnut Valley S. San Gabriel Valley S. Central LA County Santa Clarita Valley
Figure 33: SO2 Concentration as % of 1-Hour Federal Standard
PERC
ENT
OF
STA
ND
ARD
60
50
40
30
20
10
02009 2010 2011 2012 2013
Central LA Southwest Coastal LA County
South Coastal LA County 1 South Coastal LA County 3
East San Fernando Valley
Figure 27: % of Days Exceeding State 8-Hour Standard for Ozone
PERC
ENT
OF
DA
YS
20
15
10
5
02009 2010 2011 2012 2013
Central LA NW Coastal LA Co. SW Coastal LA Co. Antelope Valley
S. Coastal LA Co. 1 S. Coastal LA Co. 2 S. Coastal LA Co. 3 W. San Fern. Valley
E. San Fern. Valley W. San Gab. Valley E. San Gab. Valley 1 E. San Gab. Valley 2
Pomona/Walnut Valley S. San Gabriel Valley
Figure 28: % of Samples Exceeding State 24-Hour Standard for PM10
PERC
ENT
OF
SAM
PLES
20
15
10
5
02009 2010 2011 2012 2013
Central LA NW Coastal LA Co. SW Coastal LA Co. Antelope Valley
S. Coastal LA Co. 1 S. Coastal LA Co. 2 S. Coastal LA Co. 3 W. San Fern. Valley
E. San Fern. Valley W. San Gab. Valley E. San Gab. Valley 1 E. San Gab. Valley 2
Pomona/Walnut Valley S. San Gabriel Valley
Figure 29: % of Samples Exceeding Federal 24-Hour Standard for PM2.5
PERC
ENT
OF
SAM
PLES
5
4
3
2
1
02009 2010 2011 2012 2013
Central LA NW Coastal LA Co. SW Coastal LA Co.
Antelope Valley S. Coastal LA Co. 1 S. Coastal LA Co. 2
S. Coastal LA Co. 3 W. San Fern. Valley E. San Fern. Valley
W. San Gabriel Valley E. San Gabriel Valley 1 E. San Gabriel Valley 2
Figure 32: Lead Concentration as % of Monthly Average State Standard
PERC
ENT
OF
STA
ND
ARD
5
4
3
2
1
02009 2010 2011 2012 2013
Central LA SW Coastal LA Co.
S. Coastal LA Co. 1 S. Coastal LA Co. 2
E. San Fern. Valley E. San Gabriel Valley 1
S. San Gabriel Valley South Central LA Co.

U C L A I N S T I T U T E O F T H E E N V I R O N M E N T A N D S U S TA I N A B I L I T Y 2 0 1 5 E N V I R O N M E N TA L R E P O RT C A R D F O R LO S A N G E L E S C O U N T Y37
A I R
Figure 36: Comparison of Estimated Risk for MATES IV and MATES III
2012 MATES IV Model Estimated Risk 2005 MATES III CAMx RTRAC Simulated Air Toxic Cancer Risk
Diesel PM
Benzene
1,3 Butadiene
Carbonyls
Other
Risk (per million) 400-500
<100 500-800
100-200 800-1000
200-300 1000-1200
300-400 > 1200
CategoryChange from MATES III (%)
Change from MATES II (%)
Area -77.5 -87.0
Point -20.8 -72.8
Off-Road -73.5 -73.2
On-Road -49.4 -55.7
Figure 35: Cancer Potency Weighted Emission Comparison of MATES II, MATES III and MATES IV
EMIS
SIO
NS
AS
DPM
(LB
S/D
AY
)
MATES II (1998)
MATES III (2005)
MATES IV (2012)
80,000
60,000
40,000
20,000
0
Figure 34: Comparison of Estimated 70-Year Risk from MATES III & IV Monitoring Data
RISK
PER
MIL
LIO
N
1400
1200
1000
800
600
400
200
0III IV III IV III IV III IV III IV III IV III IV III IV III IV III IV III IV
Anaheim Burbank Central L.A. Compton Inland Valley SB Huntington Pk N. Long Beach Pico Rivera Rubidoux W. Long Beach Average

U C L A I N S T I T U T E O F T H E E N V I R O N M E N T A N D S U S TA I N A B I L I T Y 2 0 1 5 E N V I R O N M E N TA L R E P O RT C A R D F O R LO S A N G E L E S C O U N T Y38
A I R
Stationary Source Toxic EmissionsToxic air emissions from stationary sources are a leading indicator for air quality, and provide additional details on the spatial distributions, sources, and mass emissions of a variety of toxic chemical constituents.Los Angeles County remains the largest industrial manufacturing center in the United States with the most employment in this sector. This raises questions into the future about the role of this sector in the economy and its impacts.
Table 22: Total Releases of Toxic Air Contaminants in Pounds by TRI-Reporting Facilities (2009-2013)
Pollutant 2009 2010 2011 2012 2013
Methanol 9,628 7,374 223,857 228,104 141,199
Methylene chloride 4 4 1,268 20,932 138,075
Styrene 1,490 2,052 162,252 162,433 136,517
Toluene 27,437 34,262 117,570 109,587 92,351
Benzene 200 220 21195 18,013 10,860
Vinyl Acetate 0 0 6057 5,581 3,354
Lead and Lead Compounds 638 634 781 830 1405
Nickel and Nickel Compounds 19 14 890 756 983
1 3-butadiene 0 0 1962 1,895 738
Formaldehyde 2,327 2,103 1,813 2,091 716
Ethylene Oxide 0 0 384 679 530
Chromium 6 6 364 105 435
Perchloroethylene 1 1 906 472 287
Trichloroethylene 0 0 283 250 250
Chloroform 0 0 0 0 73
Arsenic and Arsenic Compounds 3 4 1,207 199 9
Cadmium 421 7 5 3 2
Dibenzo - p-dioxins and Dibenzofurans <1 <1 2 2 1
Hexavalent chromium (Cr (VI)) 0 0 0 0 0
Chromium compounds 0 0 95 111 0
Asbestos 0 0 0 0 0
Table 23: Top 3 Emitting Facilities for the Eight Most Emitted Contaminants, 2013.
Pollutant Facility Pounds Facility Pounds Facility Pounds
Methanol Phillips 66 LA Refinery Carson Plant 40,000 ExxonMobil Oil CorporationTorrance Refinery 25,000 Air Products & Chemicals Inc 16,622
Methylene Chloride Polypeptide Group 137,049 IPS Corporation** 750 IPS Corporation 250
Styrene Custom Fibreglass Manufacturing Co 51,870 GB Manufacturing Inc. California Acrylic Industries Inc (DBA Cal Spas) 14,291 Americh Corporation 13,624
Vinyl Acetate Arkema Coating Resins Plant 2,450 Engineered Polymer Solutions Inc. 904
Benzene ExxonMobil Oil CorporationTorrance Refinery 3,700 Chevron Products Company
Division of Chevron USA 790 Equilon Carson Terminal 750
Lead and Lead Compounds Valley Processing* 637 Exide Technologies* 283 Tesoro Los Angeles Refinery
Calciner Operations* 80
Toluene Fabri Cote 27,174 Johnson Laminating & Coating Inc 12,451 ExxonMobil Oil CorporationTorrance Refinery 7,400
Nickel and Nickel Compounds Alcoa Global Fasteners Inc 400 ExxonMobil Oil Corporation
Torrance Refinery* 170 Chevron Products Company Division of Chevron USA* 120
**IPS Corp was listed two times for Methylene Chloride, though there is no difference in address, facility id, type of emission etc. *For compounds
Data
We used the Toxic Release Inventory (TRI)17 data submitted to EPA on an annual basis by facilities which come under this regulation18. We included data from the TRI reports for Toxic Air Contaminants (TACs) as defined by the CA Health and Safety Code19, as well as for Federally-defined Hazardous Air Pollutants (HAPs)20 released in significant amounts within the County. The top three emitting facilities were identified for each of the eight most emitted contaminants in Los Angeles County in 2013.
Findings
• Reported air emissions of many pollutants have increased significantly since 2009, including methanol, methylene chloride, styrene, and vinyl acetate. (Table 22)
• The five chemicals with mass emissions greater than 10,000 pounds per year in 2013 in descending order are: methanol, methylene chloride, styrene, toluene and benzene. (Table 22)

U C L A I N S T I T U T E O F T H E E N V I R O N M E N T A N D S U S TA I N A B I L I T Y 2 0 1 5 E N V I R O N M E N TA L R E P O RT C A R D F O R LO S A N G E L E S C O U N T Y39
A I R M E T R I C S A I R
Figure 37: Quemetco, Inc., Self-Reported Toxic Air Contaminant Releases (2003-2013)
Ann
ual E
mis
sio
ns in
Po
unds
800
500
02003 2004 2005 2006 2007 2008 2009 2010 2011 2012 2013
Lead Compounds Arsenic Compounds Copper Compounds Antimony and Compounds
Fig. 38: Exide Technologies, Self-Reported Toxic Air Contaminant Releases (2003-2013)
Ann
ual E
mis
sio
ns in
Po
unds
3500
3000
2500
2000
1500
1000
500
02003 2004 2005 2006 2007 2008 2009 2010 2011 2012 2013
Lead Compounds Antimoney Selenium Chromium Zinc Compounds Arsenic Cadmium
• Reported air emissions of a few pollutants have decreased since 2009, including formaldehyde and cadmium. (Table 22)
• The top three emitters comprise over half of the annual emissions for nearly all of the top eight chemicals discharged. (Table 23)
• Changes from year to year in calculation methods, global economic conditions, facility operations and clean-up activities may all influence the reported values, making it challenging to identify trends.
• Quemetco and Exide, two large battery recyclers, have historically been two of the largest emitters of metals (lead and arsenic in particular) (Fig 37 and 38), but enforcement actions and changes to facility operations have reduced emissions over the last several years. (Exide is now permanently closed due to chronic air quality and hazardous materials regulatory compliance issues. The enormous potential liability led Exide to acknowledge criminal conduct and commit to demolishing and cleaning up the facility in exchange for avoiding criminal prosecution from the US Department of Justice)
Data Limitations
• TRI data are based on facility self-reporting, and therefore represents a non-standardized methodology. Furthermore, TRI regulations do not require facilities to conduct any additional monitoring beyond what is required by other regulations.
• While emissions from mobile sources pose a higher overall risk compared to stationary source emissions, we do not have comparable data on mobile source emissions.

U C L A I N S T I T U T E O F T H E E N V I R O N M E N T A N D S U S TA I N A B I L I T Y 2 0 1 5 E N V I R O N M E N TA L R E P O RT C A R D F O R LO S A N G E L E S C O U N T Y40
A I R
Grade for Air = C+We acknowledge and applaud the undisputable progress that has occurred over the past 40 years on smog, lead, other air toxics, and diesel particulates. The positive results of these improvements are exemplified by a recent long term study by researchers at USC that demonstrated that lung performance of adolescents improved with improved air quality in the Los Angeles basin21.
However, air quality continues to be frequently dangerous in some parts of the region, and has negative impacts on surrounding natural areas as well. Achieving attainment with air quality standards is also becoming more difficult due to tougher new, health-based standards and the contribution of overseas pollution, such as from China22.
We are especially concerned about the prospective impacts on air quality of increased heat incidences due to climate change; warmer temperatures have been shown to increase surface ozone and future
increases are expected to be greatest in urban areas23. Regional prevailing winds push air pollution inland where there are more lower income residents, and health impacts are likely to be aggravated into the future unless much greater strides are taken to reduce pollutants from all sources.
Moreover there is a strong relationship between the location of polluting industrial manufacturing and our goods movement facilities and corridors and low-income residents of color24. More protective polices, more inspections and better enforcement of existing
regulations continues to be a major need, as is the need for more standardized, comprehensive monitoring and reporting requirements. More research on chemical toxicity is needed, especially on cumulative and synergistic impacts of exposure. More research on clean manufacturing – which has lagged – is also needed. However, continued progress on reduction of diesel particulates, efforts like the Clean Up Green Up initiative25 , and the transformation of the transportation sector to zero emission vehicles provides promise for better grades in future years.

UCLA Institute of the Environment and Sustainability La Kretz Hall, Suite 300
Box 951496 Los Angeles, CA 90095-1496
Tel: (310) 825-5008 Fax: (310) 825-9663
[email protected] www.environment.ucla.edu