Embed Size (px)
Citation preview
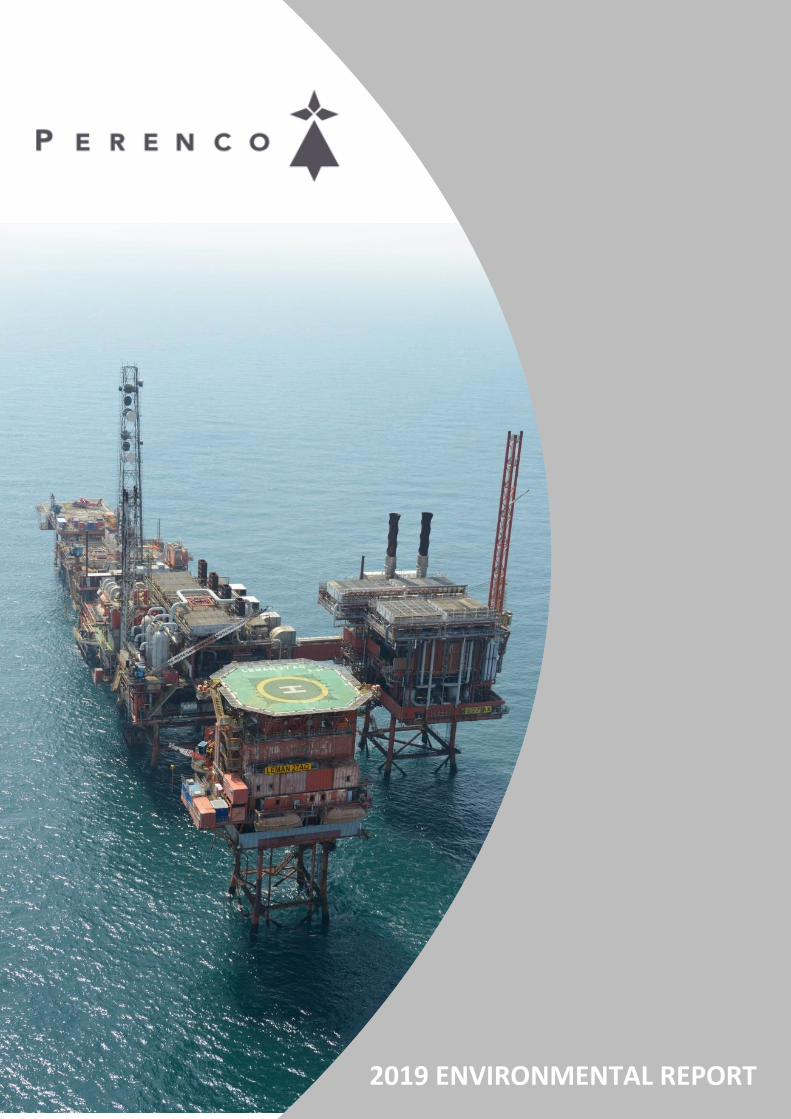
ENVIRONMENTAL REPORT 2019
2019 ENVIRONMENTAL REPORT

1
TABLE OF CONTENTS
Perenco UK Southern North Sea 3
SNS Operations 2019 4
SNS Operations: Production Hub Profiles 5
Ravenspurn North (RN) Hub 5
Cleeton Hub 5
West Sole Hub 6
LAPS Hub 6
Indefatigable (Inde) Hub 7
Leman Hub 7
Trent, Tyne and Tors 8
PUK SNS Environmental Management System 9
PUK SNS Environmental Policy 10
Environmental Improvements 2019 11
Environmental Performance 2019 13
Atmospheric Emissions 13
Carbon Dioxide (EU ETS) 13
PUK SNS CO2 Intensity Ratio 14
Other Emissions 15
Waste 17
Operational Waste by Manned Platforms 18
Decommissioning Waste 19
Other Waste 20
Chemical Use and Discharge 21
Decommissioning Chemicals 23
Oil in Produced Water 24
Inde 26
Trent 26
Excalibur 27
Ravenspurn North (Johnson) 27
Accidental Releases 27
Performance Against Environmental Objectives 2019 30
Environmental Objectives and Targets 2020 32
2
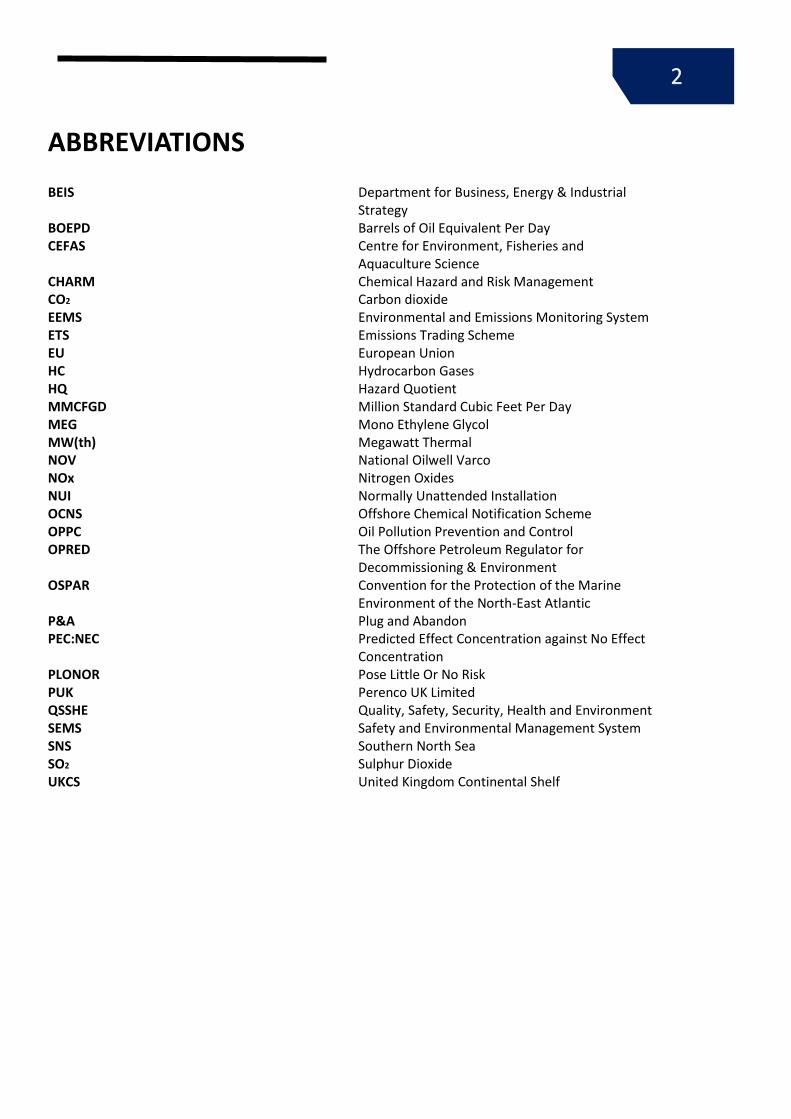
ABBREVIATIONS
BEIS BOEPD
Department for Business, Energy & Industrial Strategy Barrels of Oil Equivalent Per Day
CEFAS Centre for Environment, Fisheries and Aquaculture Science
CHARM Chemical Hazard and Risk Management CO2 Carbon dioxide EEMS Environmental and Emissions Monitoring System ETS Emissions Trading Scheme EU European Union HC Hydrocarbon Gases HQ MMCFGD
Hazard Quotient Million Standard Cubic Feet Per Day
MEG Mono Ethylene Glycol MW(th) Megawatt Thermal NOV National Oilwell Varco NOx Nitrogen Oxides NUI Normally Unattended Installation OCNS Offshore Chemical Notification Scheme OPPC Oil Pollution Prevention and Control OPRED The Offshore Petroleum Regulator for
Decommissioning & Environment OSPAR Convention for the Protection of the Marine
Environment of the North-East Atlantic P&A Plug and Abandon PEC:NEC Predicted Effect Concentration against No Effect
Concentration PLONOR Pose Little Or No Risk PUK Perenco UK Limited QSSHE Quality, Safety, Security, Health and Environment SEMS Safety and Environmental Management System SNS Southern North Sea SO2 Sulphur Dioxide UKCS United Kingdom Continental Shelf

3
PERENCO UK SOUTHERN NORTH SEA Perenco UK Limited Southern North Sea Operations (referred to hereafter as ‘PUK SNS’) has been operating in the Southern North Sea (SNS) since 2003 and processes up to 15% of the UK's national gas production. PUK’s daily production is approximately 300 mmcfgd (51,400 boepd equivalent) with an additional 300 mmcfgd processed and exported from other producers.
PUK SNS owns and operates the largest infrastructure within the United Kingdom Continental Shelf (UKCS), comprising 45 offshore platforms, 14 subsea wells, and a network of more than 2,400 km of pipelines connected to its two onshore terminals Bacton and Dimlington where the gas is received, treated, metered and then exported into the UK National Grid.
PUK SNS are responsible for over 10% of the UKCS well stock and have more than 200 wells permanently producing across 40 gas fields; Leman, Indefatigable, LAPS, Trent, Cleeton including Wollaston, Whittle, Ravenspurn North and Ravenspurn South, West Sole comprising West Sole, Hyde, Hoton and Newsham fields and the Amethyst field.
The Offshore Petroleum Regulator for Environment and Decommissioning (OPRED) requires all operators of offshore installations to produce a Public Statement to report their environmental performance under the OSPAR Recommendation 2003/5 ‘To promote the Use and Implementation of Environmental Management Systems by the Offshore Industry’. These statements must be prepared on an annual basis, covering offshore installation activities carried out during the previous calendar year, and made available to the public by the 1st June of each year.
This report outlines PUK SNS’s offshore environmental performance for its UKCS operations during 2019. The Wytch Farm, Bacton Terminal and Dimlington Terminal operations are therefore excluded from this report.
Figure.1 SNS Operations
4
SNS OPERATIONS 2019 In 2019 PUK SNS saw a continued high level of offshore activity. This activity ranged from normal production operations, to platform based well intervention projects, through to a full decommissioning activities. The following were key permitted project activities undertaken during 2019:
North West Bell Pipeline Repair: subsea clamp installed on PL1705;
Pipeline Remediation: Mattresses and rock placement on PL22, PL23 and PL24;
Thames Subsea Well Removal: Removal of three wellheads and wellhead protection structures ;
Pickerill Decommissioning: Pickerill A and B hydrocarbon free and platform dismantlement preparation;
Tyne Decommissioning: Platform dismantlement and removal (Jan 2020);
Guinevere: Platform dismantlement and removal (Jan 2020).
5
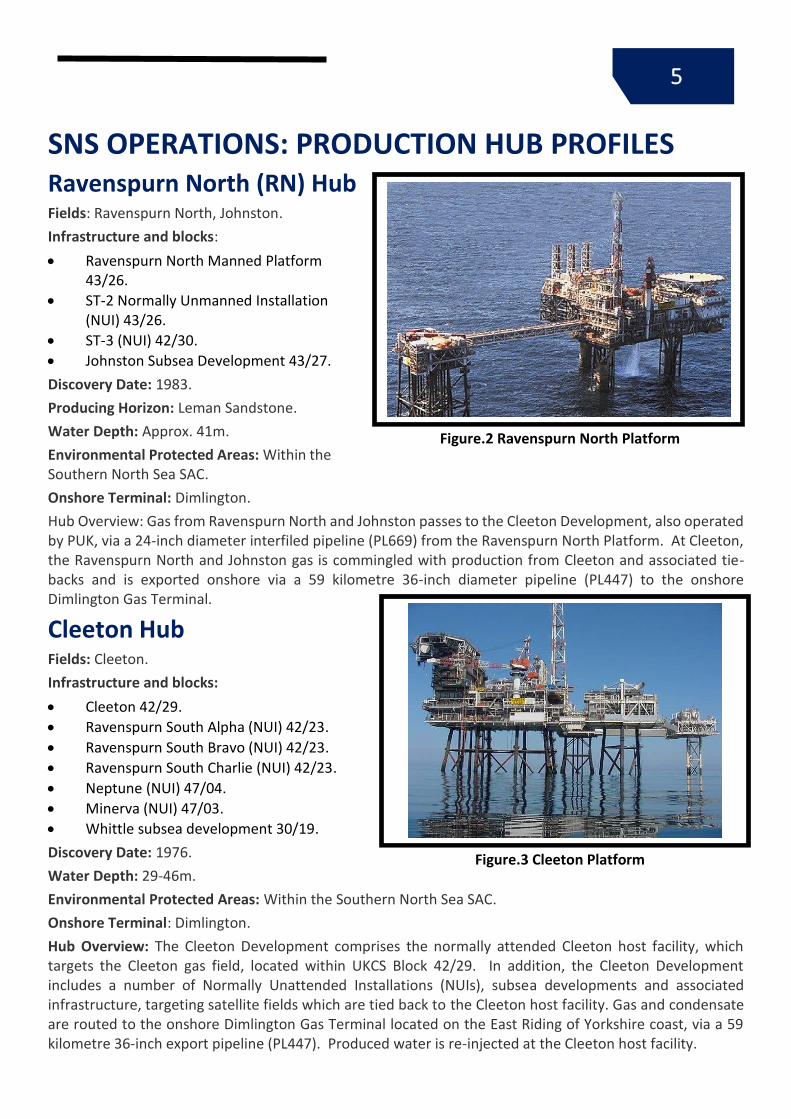
SNS OPERATIONS: PRODUCTION HUB PROFILES Ravenspurn North (RN) Hub Fields: Ravenspurn North, Johnston.
Infrastructure and blocks:
Ravenspurn North Manned Platform 43/26.
ST-2 Normally Unmanned Installation (NUI) 43/26.
ST-3 (NUI) 42/30.
Johnston Subsea Development 43/27.
Discovery Date: 1983.
Producing Horizon: Leman Sandstone.
Water Depth: Approx. 41m.
Environmental Protected Areas: Within the Southern North Sea SAC.
Onshore Terminal: Dimlington.
Hub Overview: Gas from Ravenspurn North and Johnston passes to the Cleeton Development, also operated by PUK, via a 24-inch diameter interfiled pipeline (PL669) from the Ravenspurn North Platform. At Cleeton, the Ravenspurn North and Johnston gas is commingled with production from Cleeton and associated tie-backs and is exported onshore via a 59 kilometre 36-inch diameter pipeline (PL447) to the onshore Dimlington Gas Terminal.
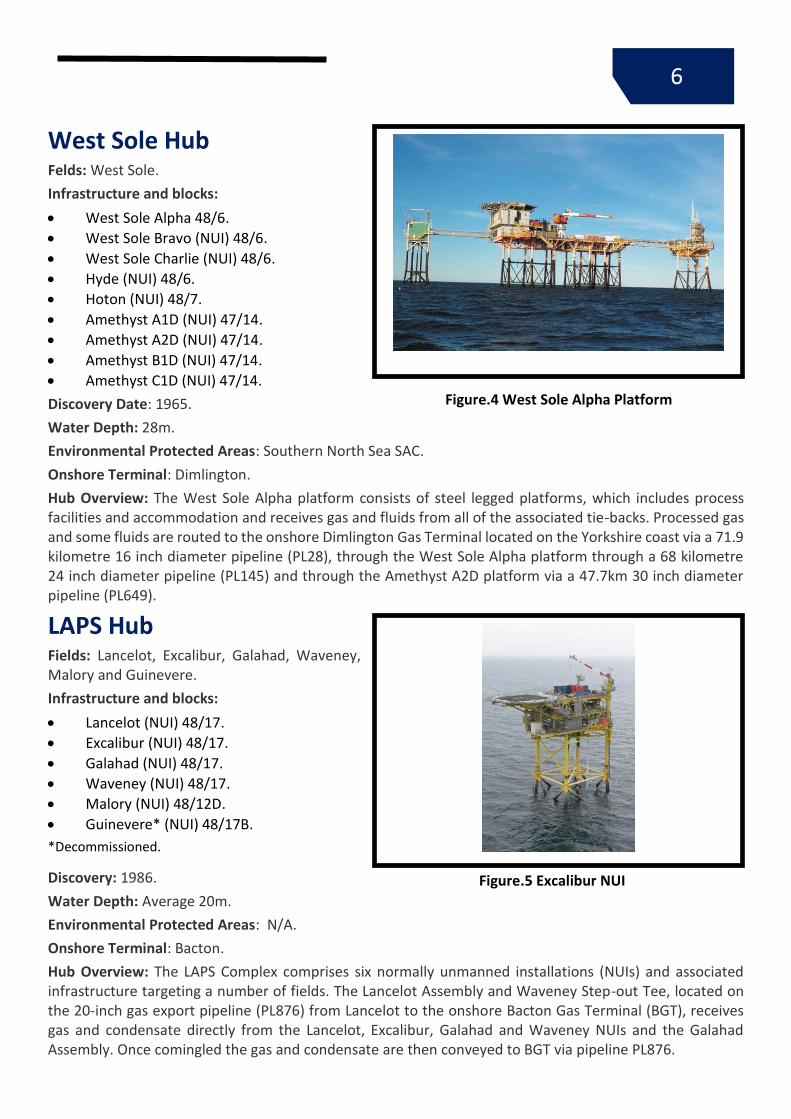
Cleeton Hub Fields: Cleeton.
Infrastructure and blocks:
Cleeton 42/29.
Ravenspurn South Alpha (NUI) 42/23.
Ravenspurn South Bravo (NUI) 42/23.
Ravenspurn South Charlie (NUI) 42/23.
Neptune (NUI) 47/04.
Minerva (NUI) 47/03.
Whittle subsea development 30/19.
Discovery Date: 1976.
Water Depth: 29-46m.
Environmental Protected Areas: Within the Southern North Sea SAC.
Onshore Terminal: Dimlington.
Hub Overview: The Cleeton Development comprises the normally attended Cleeton host facility, which targets the Cleeton gas field, located within UKCS Block 42/29. In addition, the Cleeton Development includes a number of Normally Unattended Installations (NUIs), subsea developments and associated infrastructure, targeting satellite fields which are tied back to the Cleeton host facility. Gas and condensate are routed to the onshore Dimlington Gas Terminal located on the East Riding of Yorkshire coast, via a 59 kilometre 36-inch export pipeline (PL447). Produced water is re-injected at the Cleeton host facility.
Figure.2 Ravenspurn North Platform
Figure.3 Cleeton Platform
6
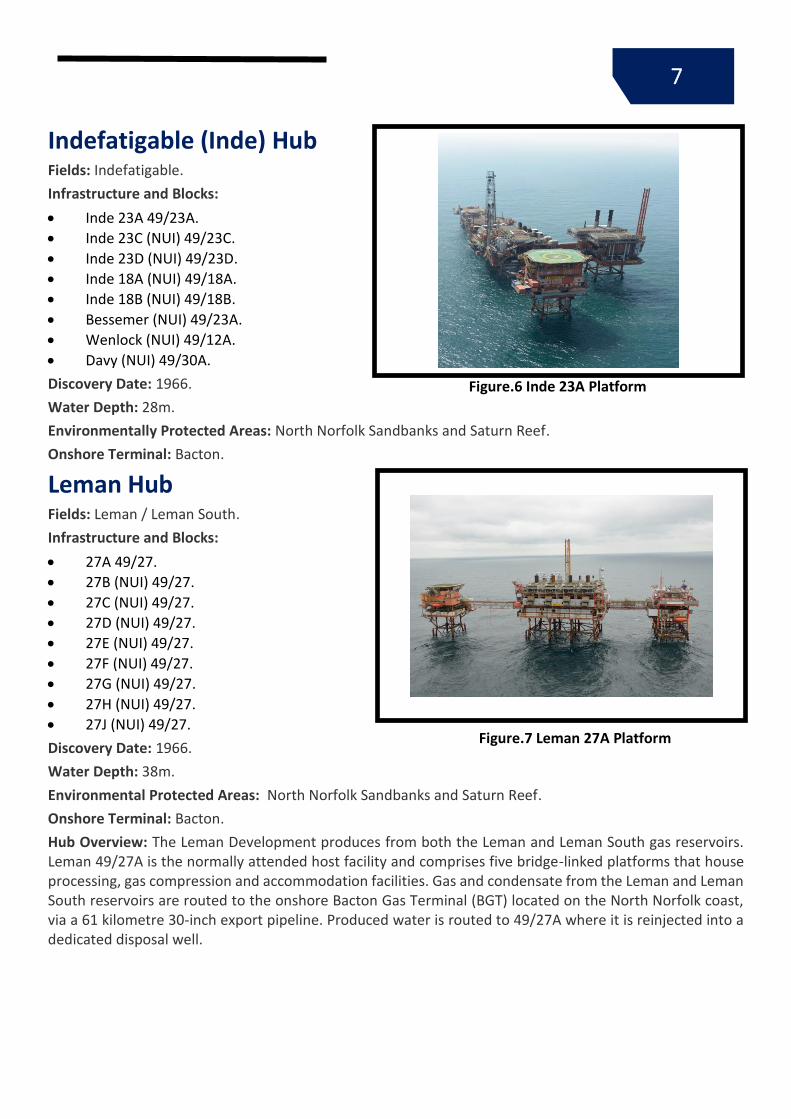
West Sole Hub Felds: West Sole.
Infrastructure and blocks:
West Sole Alpha 48/6.
West Sole Bravo (NUI) 48/6.
West Sole Charlie (NUI) 48/6.
Hyde (NUI) 48/6.
Hoton (NUI) 48/7.
Amethyst A1D (NUI) 47/14.
Amethyst A2D (NUI) 47/14.
Amethyst B1D (NUI) 47/14.
Amethyst C1D (NUI) 47/14.
Discovery Date: 1965.
Water Depth: 28m.
Environmental Protected Areas: Southern North Sea SAC.
Onshore Terminal: Dimlington.
Hub Overview: The West Sole Alpha platform consists of steel legged platforms, which includes process facilities and accommodation and receives gas and fluids from all of the associated tie-backs. Processed gas and some fluids are routed to the onshore Dimlington Gas Terminal located on the Yorkshire coast via a 71.9 kilometre 16 inch diameter pipeline (PL28), through the West Sole Alpha platform through a 68 kilometre 24 inch diameter pipeline (PL145) and through the Amethyst A2D platform via a 47.7km 30 inch diameter pipeline (PL649).
LAPS Hub Fields: Lancelot, Excalibur, Galahad, Waveney, Malory and Guinevere.
Infrastructure and blocks:
Lancelot (NUI) 48/17.
Excalibur (NUI) 48/17.
Galahad (NUI) 48/17.
Waveney (NUI) 48/17.
Malory (NUI) 48/12D.
Guinevere* (NUI) 48/17B.
*Decommissioned.
Discovery: 1986.
Water Depth: Average 20m.
Environmental Protected Areas: N/A.
Onshore Terminal: Bacton.
Hub Overview: The LAPS Complex comprises six normally unmanned installations (NUIs) and associated infrastructure targeting a number of fields. The Lancelot Assembly and Waveney Step-out Tee, located on the 20-inch gas export pipeline (PL876) from Lancelot to the onshore Bacton Gas Terminal (BGT), receives gas and condensate directly from the Lancelot, Excalibur, Galahad and Waveney NUIs and the Galahad Assembly. Once comingled the gas and condensate are then conveyed to BGT via pipeline PL876.
Figure.4 West Sole Alpha Platform
Figure.5 Excalibur NUI
7
Indefatigable (Inde) Hub Fields: Indefatigable.
Infrastructure and Blocks:
Inde 23A 49/23A.
Inde 23C (NUI) 49/23C.
Inde 23D (NUI) 49/23D.
Inde 18A (NUI) 49/18A.
Inde 18B (NUI) 49/18B.
Bessemer (NUI) 49/23A.
Wenlock (NUI) 49/12A.
Davy (NUI) 49/30A.
Discovery Date: 1966.
Water Depth: 28m.
Environmentally Protected Areas: North Norfolk Sandbanks and Saturn Reef.
Onshore Terminal: Bacton.
Leman Hub Fields: Leman / Leman South.
Infrastructure and Blocks:
27A 49/27.
27B (NUI) 49/27.
27C (NUI) 49/27.
27D (NUI) 49/27.
27E (NUI) 49/27.
27F (NUI) 49/27.
27G (NUI) 49/27.
27H (NUI) 49/27.
27J (NUI) 49/27.
Discovery Date: 1966.
Water Depth: 38m.
Environmental Protected Areas: North Norfolk Sandbanks and Saturn Reef.
Onshore Terminal: Bacton.
Hub Overview: The Leman Development produces from both the Leman and Leman South gas reservoirs. Leman 49/27A is the normally attended host facility and comprises five bridge-linked platforms that house processing, gas compression and accommodation facilities. Gas and condensate from the Leman and Leman South reservoirs are routed to the onshore Bacton Gas Terminal (BGT) located on the North Norfolk coast, via a 61 kilometre 30-inch export pipeline. Produced water is routed to 49/27A where it is reinjected into a dedicated disposal well.
Figure.6 Inde 23A Platform
Figure.7 Leman 27A Platform
8
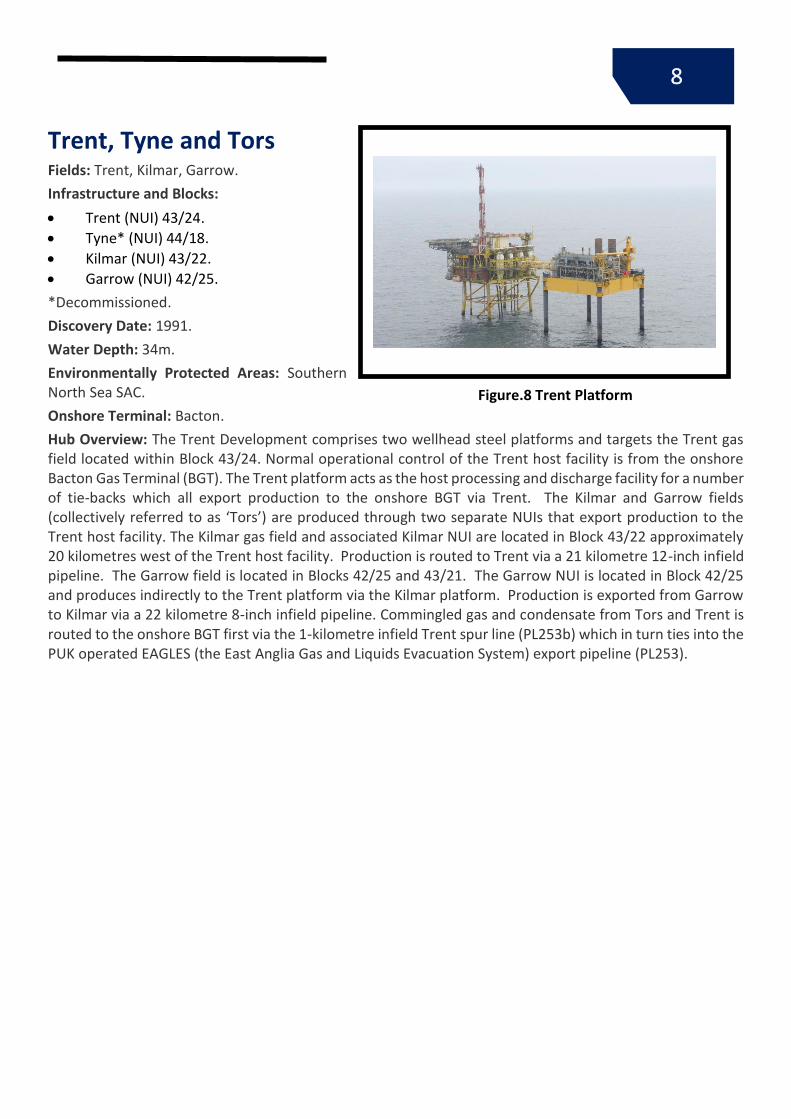
Trent, Tyne and Tors Fields: Trent, Kilmar, Garrow.
Infrastructure and Blocks:
Trent (NUI) 43/24.
Tyne* (NUI) 44/18.
Kilmar (NUI) 43/22.
Garrow (NUI) 42/25.
*Decommissioned.
Discovery Date: 1991.
Water Depth: 34m.
Environmentally Protected Areas: Southern North Sea SAC.
Onshore Terminal: Bacton.
Hub Overview: The Trent Development comprises two wellhead steel platforms and targets the Trent gas field located within Block 43/24. Normal operational control of the Trent host facility is from the onshore Bacton Gas Terminal (BGT). The Trent platform acts as the host processing and discharge facility for a number of tie-backs which all export production to the onshore BGT via Trent. The Kilmar and Garrow fields (collectively referred to as ‘Tors’) are produced through two separate NUIs that export production to the Trent host facility. The Kilmar gas field and associated Kilmar NUI are located in Block 43/22 approximately 20 kilometres west of the Trent host facility. Production is routed to Trent via a 21 kilometre 12-inch infield pipeline. The Garrow field is located in Blocks 42/25 and 43/21. The Garrow NUI is located in Block 42/25 and produces indirectly to the Trent platform via the Kilmar platform. Production is exported from Garrow to Kilmar via a 22 kilometre 8-inch infield pipeline. Commingled gas and condensate from Tors and Trent is routed to the onshore BGT first via the 1-kilometre infield Trent spur line (PL253b) which in turn ties into the PUK operated EAGLES (the East Anglia Gas and Liquids Evacuation System) export pipeline (PL253).
Figure.8 Trent Platform
9
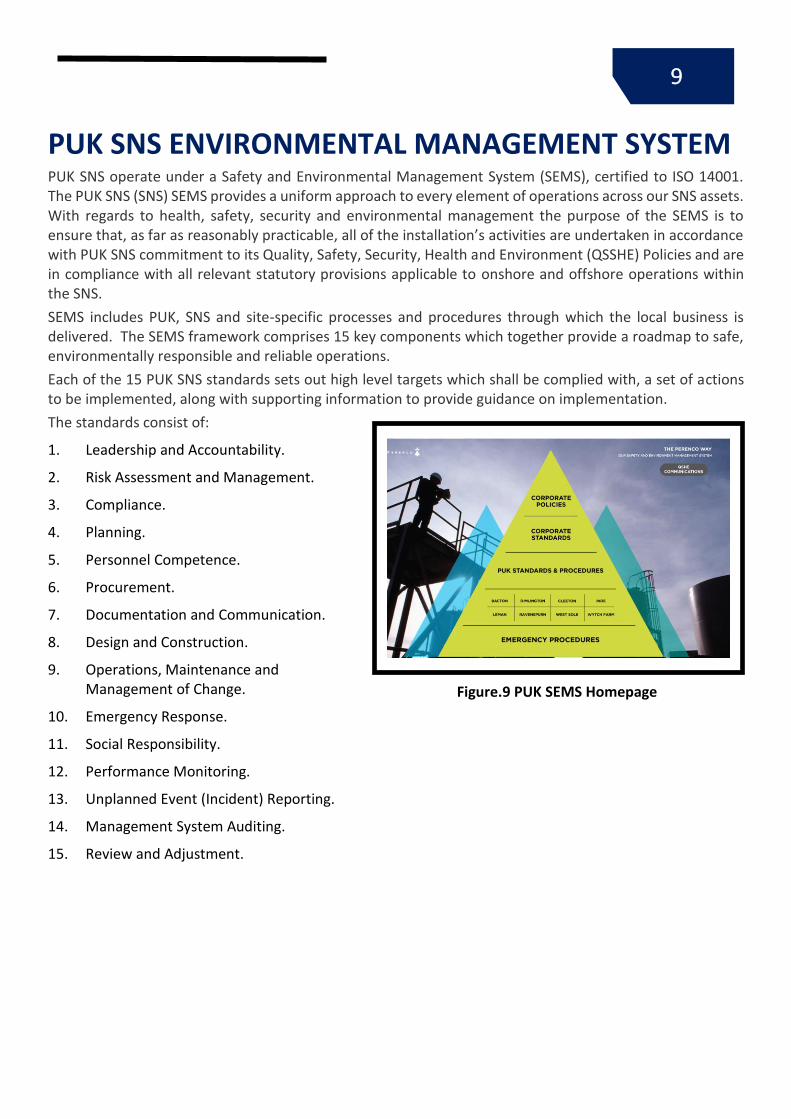
PUK SNS ENVIRONMENTAL MANAGEMENT SYSTEM PUK SNS operate under a Safety and Environmental Management System (SEMS), certified to ISO 14001. The PUK SNS (SNS) SEMS provides a uniform approach to every element of operations across our SNS assets. With regards to health, safety, security and environmental management the purpose of the SEMS is to ensure that, as far as reasonably practicable, all of the installation’s activities are undertaken in accordance with PUK SNS commitment to its Quality, Safety, Security, Health and Environment (QSSHE) Policies and are in compliance with all relevant statutory provisions applicable to onshore and offshore operations within the SNS.
SEMS includes PUK, SNS and site-specific processes and procedures through which the local business is delivered. The SEMS framework comprises 15 key components which together provide a roadmap to safe, environmentally responsible and reliable operations.
Each of the 15 PUK SNS standards sets out high level targets which shall be complied with, a set of actions to be implemented, along with supporting information to provide guidance on implementation.
The standards consist of:
1. Leadership and Accountability.
2. Risk Assessment and Management.
3. Compliance.
4. Planning.
5. Personnel Competence.
6. Procurement.
7. Documentation and Communication.
8. Design and Construction.
9. Operations, Maintenance and Management of Change.
10. Emergency Response.
11. Social Responsibility.
12. Performance Monitoring.
13. Unplanned Event (Incident) Reporting.
14. Management System Auditing.
15. Review and Adjustment.
Figure.9 PUK SEMS Homepage
10
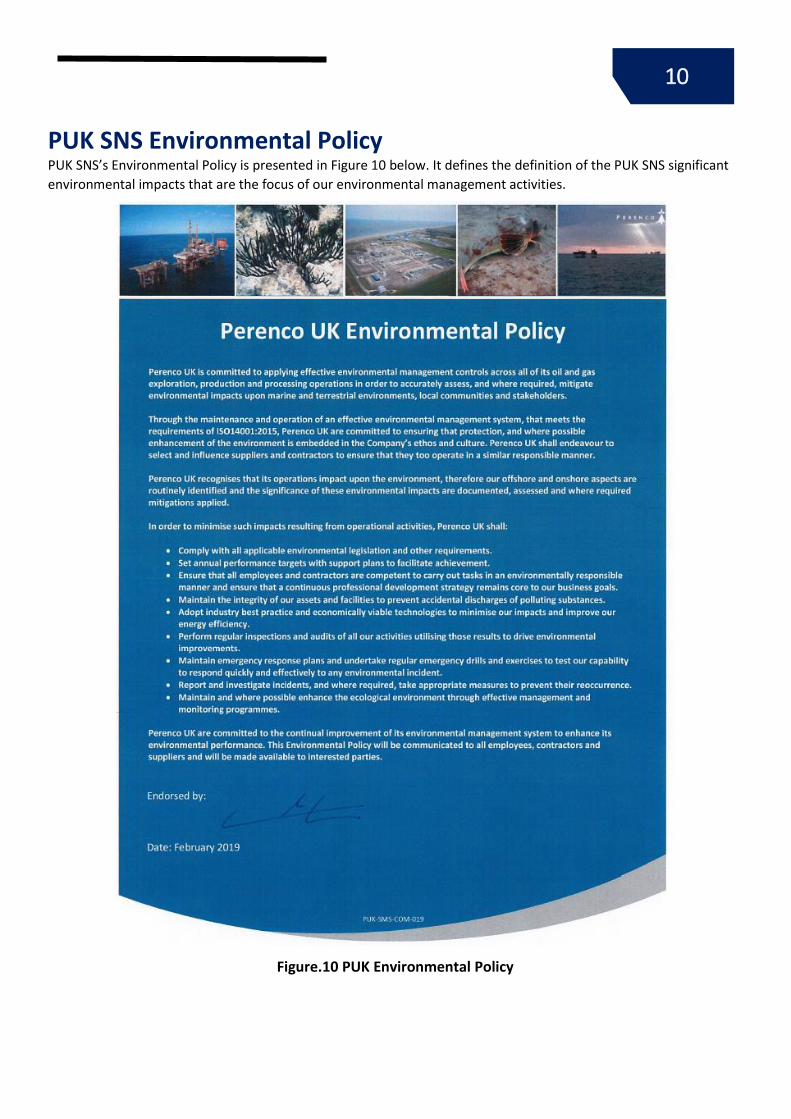
PUK SNS Environmental Policy PUK SNS’s Environmental Policy is presented in Figure 10 below. It defines the definition of the PUK SNS significant
environmental impacts that are the focus of our environmental management activities.
Figure.10 PUK Environmental Policy

11
ENVIRONMENTAL IMPROVEMENTS 2019 PUK SNS is committed to continued improvements in environmental performance. In 2019, PUK SNS saw improvements in many environmental Key Performance Indicators (KPIs). Highlights include:
An overall reduction in CO2 emissions from 2014 – 2019;
All PUK SNS imported electricity for 2019 was from renewable resources;
Successfully diversion all general and all hazardous wastes, within the boundaries of the legal framework, from entering landfill;
A reduction in the use of chemicals used and discharged; and
A reduction of oil discharged to sea.
One of the key projects progressing during 2019, with
significant environmental benefits, is the Southern Hub
Area Rationalisation Project (SHARP), through Front End
Engineering Design (FEED), which will significantly reduce
the CO2 emissions by an estimated 100,000 tonnes of CO2
once it comes on stream in 2021.
2019 has also seen the roll out of a range of initiatives aimed at reducing impacts on the environment both marine and terrestrial, as well as raising awareness of the marine life around our platforms. This year also marked the introduction of the Environmental Reps role, a voluntary extension of the Safety Reps role, aimed at providing valuable support in both onshore and offshore workforce engagement.
An overview of our initiates are outlined below:
Plastic Reduction Offshore: Working closely with our catering contractors we have introduced a number of measures aimed at reducing our reliance on single use plastics including:
Switching from polystyrene cups to re-usable mugs.
Removal of plastic drinks stirrers.
Switching from plastic to compostable food containers on our walk to work vessel.
Continual raising of awareness through platform visits and liaison with waste contractor.
Marine Mammal Identification: The Eastern English Coastline provides a range of habitats crucial to both marine mammals and seabirds, both of which can be observed nearfield of the offshore assets. This year PUK SNS introduced a way for our offshore crews to record any sightings of both mammals and sea birds, our identification charts and record sheets are present on all manned platforms, and allow us to better understand the marine life around our platforms.
Figure.11 Proposed SHARP Platform Design
12
Environmental Representatives: PUK now have Environmental Representatives (E-Reps) on each manned platform as well as several at each terminal. Our E-Reps work closely with the Environmental Team and their Assets across various activities and initiatives. They also provide support on OPRED inspections and ISO14001 external audits.
13
ENVIRONMENTAL PERFORMANCE 2019 PUK SNS monitors and report on atmospheric emissions, the discharge in produced water, the use and discharge of chemicals, the disposal of waste, and hydrocarbon/ chemical spill incidents. This section the relevant information that was reported via the online Environmental and Emissions Monitoring System (EEMS) for operations during 2019.
Atmospheric Emissions Carbon Dioxide (EU ETS)
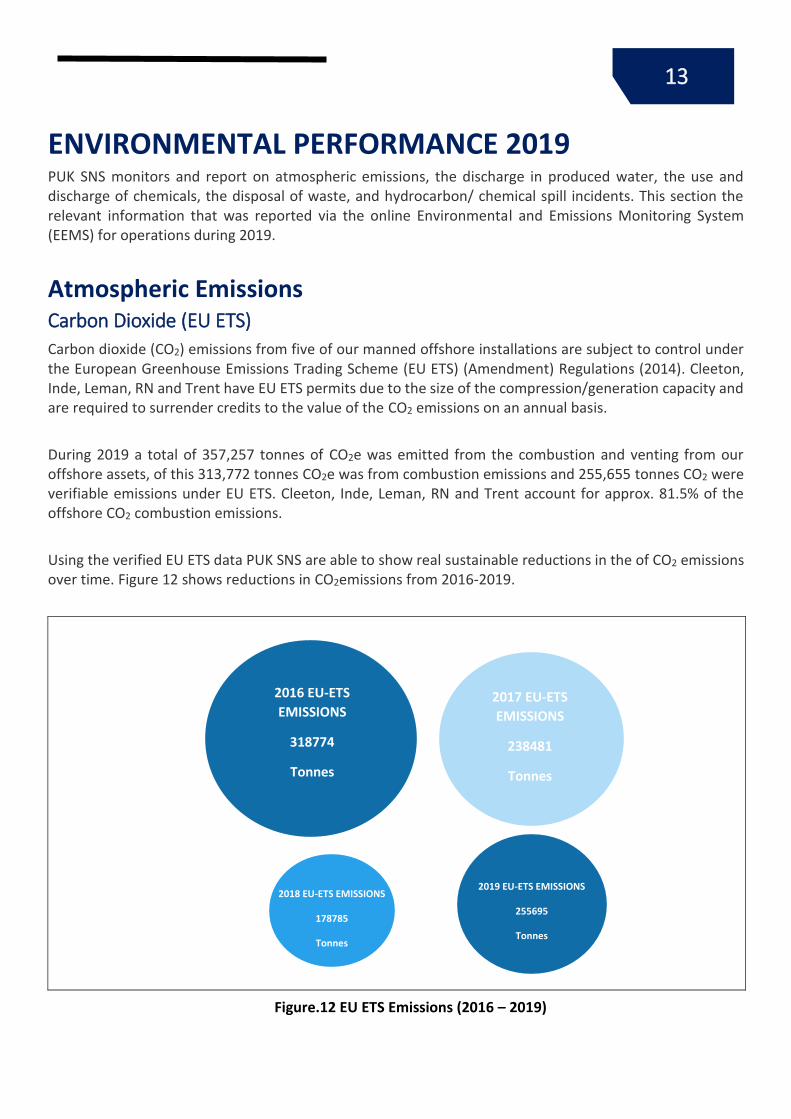
Carbon dioxide (CO2) emissions from five of our manned offshore installations are subject to control under the European Greenhouse Emissions Trading Scheme (EU ETS) (Amendment) Regulations (2014). Cleeton, Inde, Leman, RN and Trent have EU ETS permits due to the size of the compression/generation capacity and are required to surrender credits to the value of the CO2 emissions on an annual basis.
During 2019 a total of 357,257 tonnes of CO2e was emitted from the combustion and venting from our offshore assets, of this 313,772 tonnes CO2e was from combustion emissions and 255,655 tonnes CO2 were verifiable emissions under EU ETS. Cleeton, Inde, Leman, RN and Trent account for approx. 81.5% of the offshore CO2 combustion emissions.
Using the verified EU ETS data PUK SNS are able to show real sustainable reductions in the of CO2 emissions over time. Figure 12 shows reductions in CO2emissions from 2016-2019.
Figure.12 EU ETS Emissions (2016 – 2019)
2016 EU-ETS
EMISSIONS
318774
Tonnes
2017 EU-ETS
EMISSIONS
238481
Tonnes
2019 EU-ETS EMISSIONS
255695
Tonnes
2018 EU-ETS EMISSIONS
178785
Tonnes
14
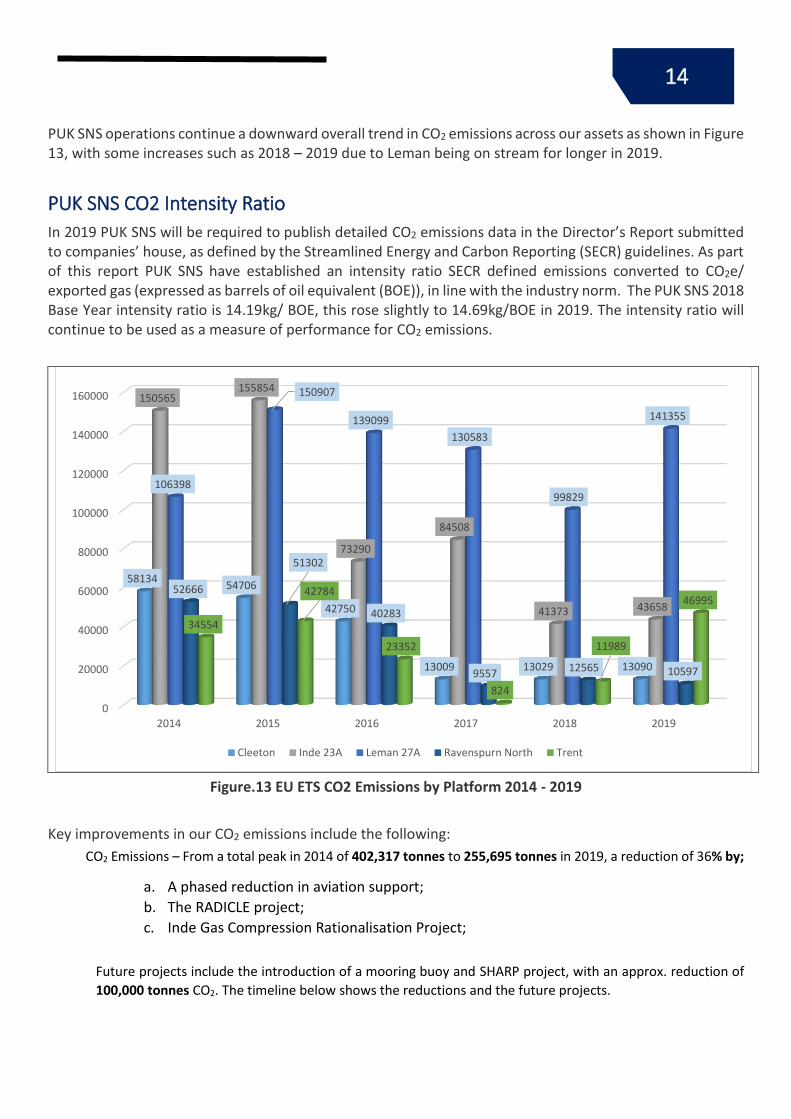
PUK SNS operations continue a downward overall trend in CO2 emissions across our assets as shown in Figure 13, with some increases such as 2018 – 2019 due to Leman being on stream for longer in 2019.
PUK SNS CO2 Intensity Ratio
In 2019 PUK SNS will be required to publish detailed CO2 emissions data in the Director’s Report submitted to companies’ house, as defined by the Streamlined Energy and Carbon Reporting (SECR) guidelines. As part of this report PUK SNS have established an intensity ratio SECR defined emissions converted to CO2e/ exported gas (expressed as barrels of oil equivalent (BOE)), in line with the industry norm. The PUK SNS 2018 Base Year intensity ratio is 14.19kg/ BOE, this rose slightly to 14.69kg/BOE in 2019. The intensity ratio will continue to be used as a measure of performance for CO2 emissions.
Figure.13 EU ETS CO2 Emissions by Platform 2014 - 2019
Key improvements in our CO2 emissions include the following:
CO2 Emissions – From a total peak in 2014 of 402,317 tonnes to 255,695 tonnes in 2019, a reduction of 36% by;
a. A phased reduction in aviation support;
b. The RADICLE project;
c. Inde Gas Compression Rationalisation Project;
Future projects include the introduction of a mooring buoy and SHARP project, with an approx. reduction of
100,000 tonnes CO2. The timeline below shows the reductions and the future projects.
0
20000
40000
60000
80000
100000
120000
140000
160000
2014 2015 2016 2017 2018 2019
5813454706
42750
13009 13029 13090
150565155854
73290
84508
41373 43658
106398
150907
139099
130583
99829
141355
52666
51302
40283
9557 12565 10597
34554
42784
23352
824
11989
46995
Cleeton Inde 23A Leman 27A Ravenspurn North Trent
15
Other Emissions
The environmental impacts of concern attributable to combustion processes also include the emissions to atmosphere of Nitrogen Oxides (NOx). These have the potential to cause health impacts, and also contribute to acid rain. Offshore receptors are broadly insensitive to the amounts of NOx that are emitted from the combustion of gas. The SNS assets; Indefatigable, Leman and Trent have an installed capacity exceeding 50 MW (th) and are subject to regulatory controls under the Offshore Combustion Installations (Pollution Prevention and Control) Regulations 2013. Figure. 15 outlines the 2019 NOX emissions.
Note: Leman has a considerably higher level of NOx due to the large power generation driving the compression. This is expected to reduced in line with the reduction of CO2 emissions once SHARP project comes onstream in 2021.
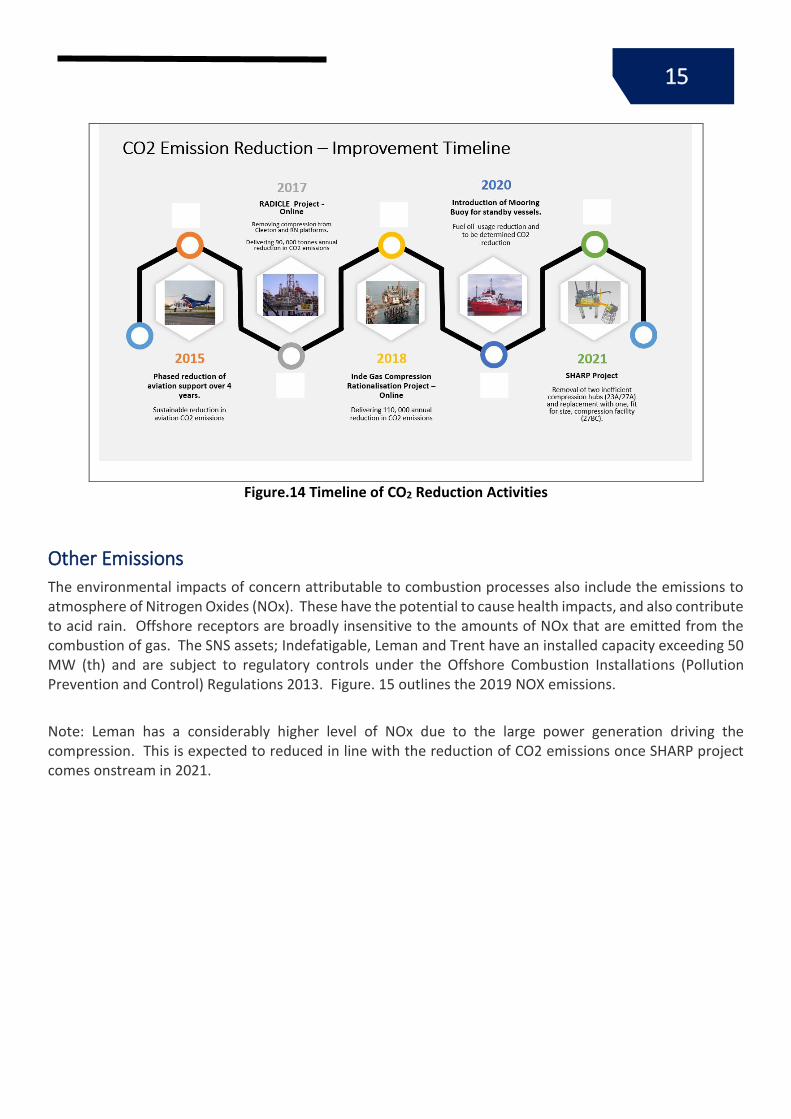
Figure.14 Timeline of CO2 Reduction Activities

16
0
50
100
150
200
250
300
350
35
109
326
27
121
0.118805.43688 2 0 2.138403.787343.040092.89872 0 2.9331723.84750
1.51000
Oxi
des
of
Nit
roge
n (
ton
nes
)
Calculated Emission
Figure.15 Total NOx Emissions per Platform (2019)

17
Waste In 2019 PUK SNS successfully diverted all general and hazardous wastes* from entering landfill.
This was achieved by working closely with our principle waste management contractor and proactively managing the wastes generated as a result of operational activities by application of the waste hierarchy.
*The only exception being asbestos and asbestos contaminated waste where 2.97 tonnes have been disposed of via licenced landfills during 2019. This is however the required disposal route for such wastes.
0
100
200
300
400
500
600
700
800
900
1,000
Recycling Waste to Energy Incinerate Landfill Other
242.412
11.40 0.047 0.089
305.048
959.096
182.755
0 0 1.510.003 0 0.12 1.511 0
Qu
anti
ty (
ton
nes
)
Fate
Group I - Special Group II - General Group III - Other
Figure.16 Total Operational Waste (2019)

18
Operational Waste by Manned Platforms
Figure.17 Total Operational Waste by Manned Platforms (2019)
19
Decommissioning Waste
0
100
200
300
400
500
600
700
800
Energy Endeavour Pickerill A Pickerill B
20.497
726.73
373.823
Qu
anti
ty (
ton
nes
)
182
410
Hazardous (tonnes)
Non-hazardous (tonnes)
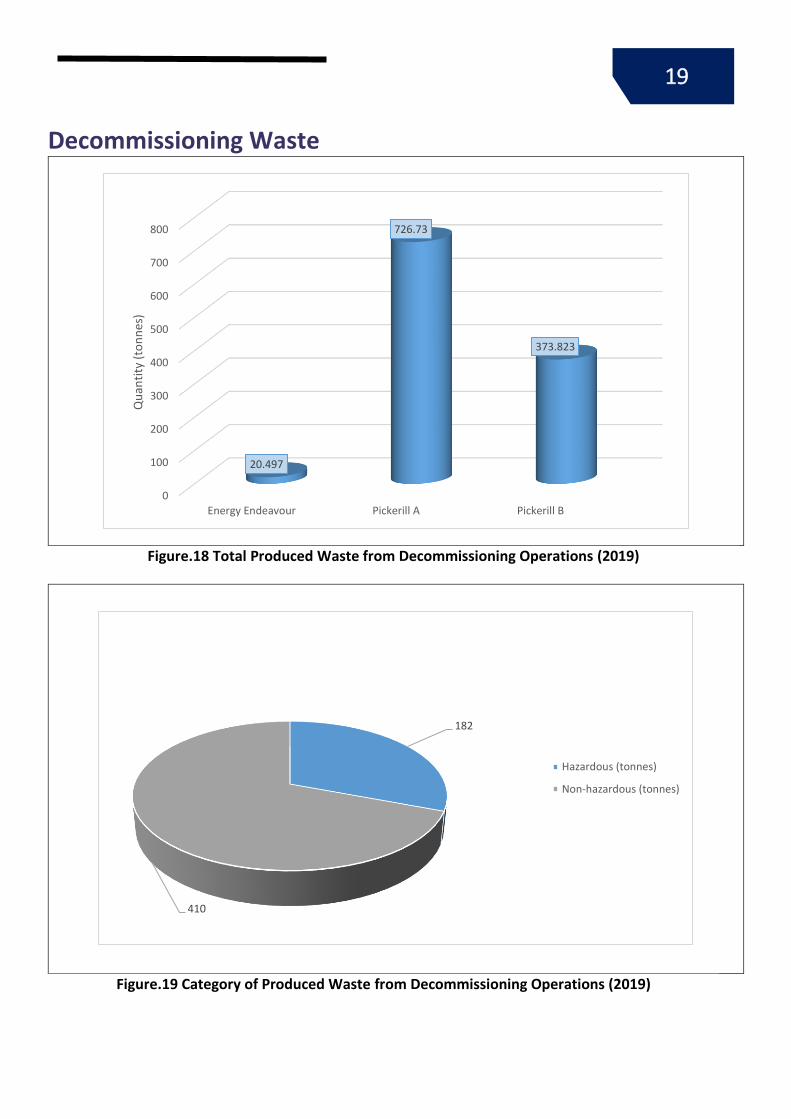
Figure.18 Total Produced Waste from Decommissioning Operations (2019)
Figure.19 Category of Produced Waste from Decommissioning Operations (2019)
20
Decommissioning waste was generated during the 2019 HCF campaign on the Pickerill A and Pickerill B platforms, both of these campaigns were completed by the Energy Endeavour Jack up barge.
The Pickerill A HCF campaign generated almost 50% more waste than the Pickerill B HCF campaign primarily due to the greater amount of work required, a total nine wells were plug & abandonment (P&A) as opposed to seven on Pickerill B. Of the total decommissioning waste generated during 2019 the majority was classified as non-hazardous (69.2%) (Figure 19), including general waste and non-hazardous scrap metal, 87t and 85t during Pickerill A and 81t and 51t for Pickerill B.
While the total hazardous waste generated included a number of different waste types, the majority of hazardous waste generated during 2019 was dominated by dirty water contaminated with hydrocarbons, oil based mud, rags contaminated with oil and empty contaminated plastic drums.
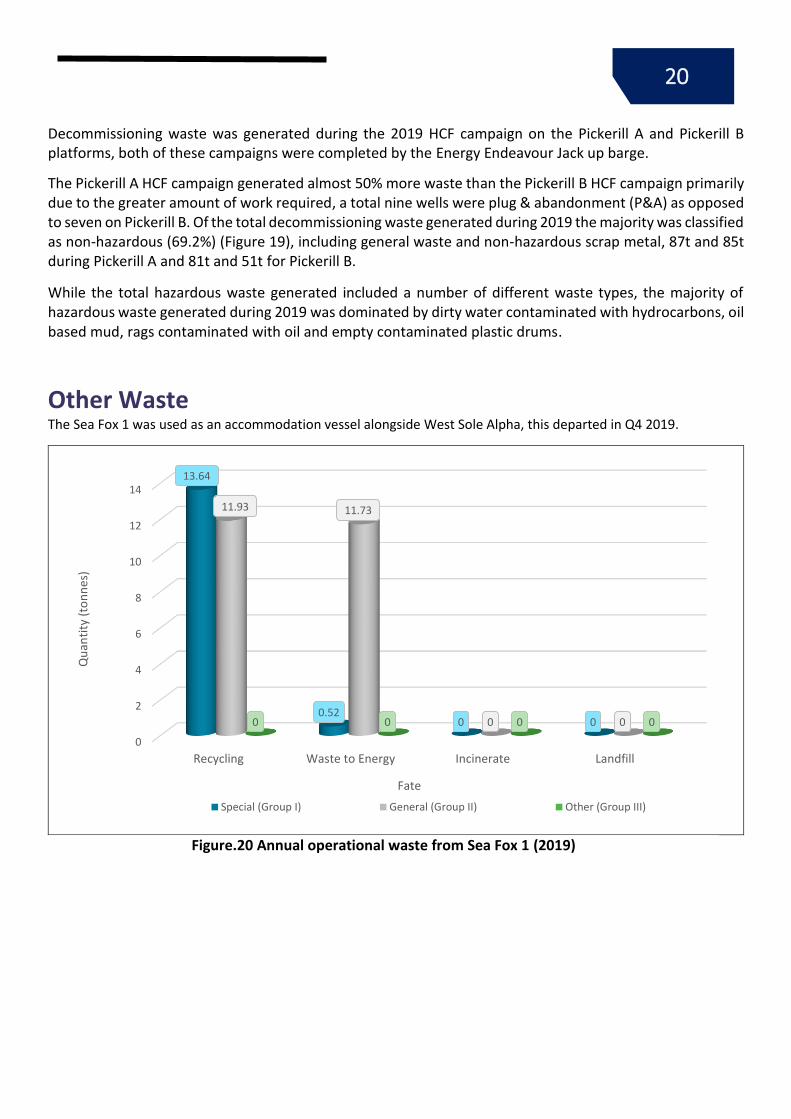
Other Waste The Sea Fox 1 was used as an accommodation vessel alongside West Sole Alpha, this departed in Q4 2019.
0
2
4
6
8
10
12
14
Recycling Waste to Energy Incinerate Landfill
13.64
0.520 0
11.93 11.73
0 00 0 0 0
Qu
anti
ty (
ton
nes
)
Fate
Special (Group I) General (Group II) Other (Group III)
Figure.20 Annual operational waste from Sea Fox 1 (2019)
21
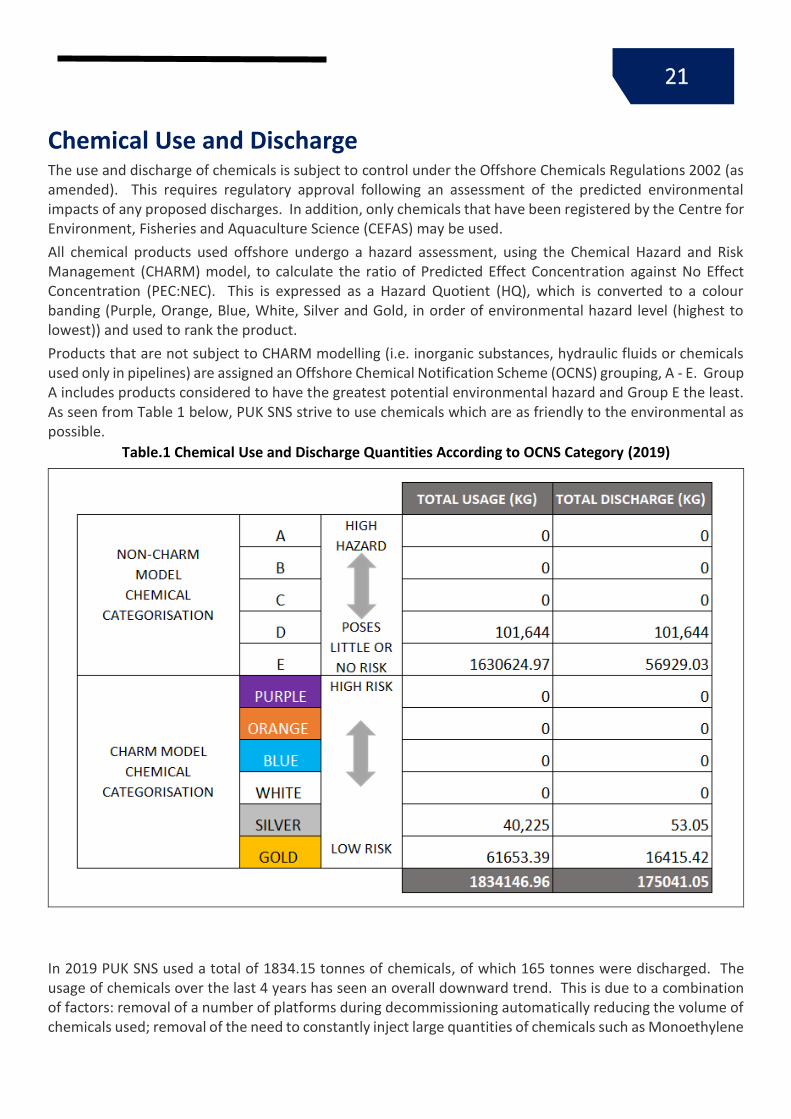
Table.1 Chemical Use and Discharge Quantities According to OCNS Category (2019)
Chemical Use and Discharge
The use and discharge of chemicals is subject to control under the Offshore Chemicals Regulations 2002 (as amended). This requires regulatory approval following an assessment of the predicted environmental impacts of any proposed discharges. In addition, only chemicals that have been registered by the Centre for Environment, Fisheries and Aquaculture Science (CEFAS) may be used.
All chemical products used offshore undergo a hazard assessment, using the Chemical Hazard and Risk Management (CHARM) model, to calculate the ratio of Predicted Effect Concentration against No Effect Concentration (PEC:NEC). This is expressed as a Hazard Quotient (HQ), which is converted to a colour banding (Purple, Orange, Blue, White, Silver and Gold, in order of environmental hazard level (highest to lowest)) and used to rank the product.
Products that are not subject to CHARM modelling (i.e. inorganic substances, hydraulic fluids or chemicals used only in pipelines) are assigned an Offshore Chemical Notification Scheme (OCNS) grouping, A - E. Group A includes products considered to have the greatest potential environmental hazard and Group E the least. As seen from Table 1 below, PUK SNS strive to use chemicals which are as friendly to the environmental as possible.
In 2019 PUK SNS used a total of 1834.15 tonnes of chemicals, of which 165 tonnes were discharged. The usage of chemicals over the last 4 years has seen an overall downward trend. This is due to a combination of factors: removal of a number of platforms during decommissioning automatically reducing the volume of chemicals used; removal of the need to constantly inject large quantities of chemicals such as Monoethylene

22
Glycol (MEG) and replaced it with far smaller amounts of corrosion inhibitor; and a move away from continuous dosing and use more infrequent batch dosing, where technically feasible to do so.
0
500000
1000000
1500000
2000000
2500000
3000000
3500000
4000000
4500000
2016 2017 2018 2019
4002828
2835279.27
1900919.84 1834146.96
Ch
emic
al (
kg)
Use Discharge
0.2%
88%
12%
Candidate for Substitution PLONOR Other
Figure.21 Annual Chemical Usage and Discharge (2016-2019)
Figure.22 Chemical Usage by Category (2019)

23
During 2019, the majority of the chemicals used in production operations pose little or no risk (PLONOR). Only 15 chemicals identified as candidates for substitution were used in production operations.
PUK SNS is continuing to reduce chemical use at our SNS production assets, focusing on phasing out the use and discharge of chemicals with substitutional warnings and a programme of compatibility testing is ongoing to facilitate this.
Decommissioning Chemicals
A total of 745.13 tons of chemicals were used for decommissioning operations during 2019. Of this 61.60 tonnes were discharged to sea (8.2%).
The majority of chemicals used were designated as PLONOR, of which Class 'G' Oilwell (Portland) Cement made up the largest volume (Figure 23). This chemical provides the bulk powder used in the production of cement plugs which were applied to the Pickerill A and Pickerill B wells during P&A operations.
The use of chemicals with a SUB warning was limited during 2019 with SUB chemicals representing 0.2% of total chemical use (Figure 23). This use was entirely made up of the chemical BA-10. This polymer is included in the cement slurry system used to improve fluid loss properties. The additive’s film-forming tendency limits interparticle flow within the matrix of the cement to control fluid loss from the slurry to permeable formations and was required for use in all wells.
Despite having a SUB warning, the use of BA-10 during decommissioning operations generated an RQ<1 indicating that there was no significant impact to the marine environment from the discharge of BA-10 during operations.
While the discharge of cementing chemicals is usually limited to the cleaning out of lines and dead volumes within the mixing pits, during 2019 two emergency aborted cement batches were discharged to sea resulting in a higher discharge volume than would be expected for normal operations.
0.00
100000.00
200000.00
300000.00
400000.00
500000.00
600000.00
700000.00
PLONOR SUB Non SUB/PLONOR
683468.89
1387.27
60275.1055150.14
163.57 6295.27
Ch
emic
al (
kg)
Use Discharge
Figure.23 Decommissioning Chemical use by Grouping (2019)

24
Oil in Produced Water The discharge of oil is subject to control under the Oil Pollution Prevention and Control (OPPC) Regulations 2005 (as amended). After treatment, oil in produced water was discharged from 9 of our operated assets in the SNS. The volume of produced water discharged from each asset during 2019 is presented in Figure 25 and the monthly flow-weighted average concentration of oil in produced water for each asset, along with the consented limit, are presented in Figure 26.
Please Note: There are produced water re-injection systems at Cleeton, Leman and Amethyst.
0
500
1000
1500
2000
2500
3000
3500
4000
4500
5000
2016 2017 2018 2019
2579.358278
4683.569953
2,945
2274.19
Tota
l Oil
Dis
char
ged
(kg
)
Oil (Kg)
Figure.24 Annual Oil Discharged (2016-2019)

25
Overall the total volume of hydrocarbons being discharged to sea is decreasing. Through decommissioing we are reducing the number of platforms that operate with a discharge to sea and using produced water reinjection systems where possible. In addition to this, as the fields are maturing the recovery of hydrocarbons is decreasing meaning there are less discharges containing oil to sea.
0.00
2,000.00
4,000.00
6,000.00
8,000.00
10,000.00
12,000.00
14,000.00
16,000.00
18,000.00
20,000.00
948.7
13,979.00
16,779.00
4,048.00
827.2 492.6
19,838.00
10,091.41
453.9
5,106.43
Vo
lum
e (c
ub
ic m
etre
s)
Discharged Produced Water (m3)
Figure.25 Produced Water by Asset (2019)

26
During 2019, the monthly flow-weighted average concentration of oil in produced water for the majority of our SNS assets was below the consented limit (30 mg/l). However, this limit was exceeded at four of our assets (Inde, Trent, Excalibur and Ravenspurn North (Johnston tie back)). The reason for this exceedance is provided below.
Inde The SEREP tower number two was not working correctly, the filter medium (beads) were washed out, thus
not filtering the produced water. In addition, the fuel gas compressor was being drained on a regular basis.
This system contains a high percentage of condensate in the oil. We have now modified the way the
system is run to rectify this.
Trent Liquid handling issues were encountered from a well feeding into the Trent platform impacting the de-watering package. A level indicator fault resulted in the de-watering package being bypassed meaning Trent handled a higher volume of process liquids. This increase caused the retention time of the process water to be less and resulted in an elevated result being recorded.
99.57
7.0210.48
30.2924.49
7.30
67.95
33.26
19.93
13.09
0.00
20.00
40.00
60.00
80.00
100.00
120.00
Mo
nth
ly F
low
-Wei
ghte
d A
vera
ge C
on
cen
trat
ion
(m
g/l)
Consented Limit (30 mg/l) Oil in Produced Water (mg/l)
Figure.26 Monthly Oil in Produced Water vs. Consented Limit (2019)
27
Excalibur Condensate and produced water Level Control systems were identified as possible contributors to the
elevated oil in water concentrations encountered in 2019 and were subsequently overhauled during the
annual shutdown period.
Ravenspurn North (Johnson) The Ravenspurn North Johnson Tie-In had a non-compliance for exceeding the permitted limit (30 mg/l) of
oil in water concentration. The Johnston coalescer is oversized for the amount of water and therefore does
not operate effectively. The remedial works carried out on Johnston well J6 by Premier Oil to ensure well
flow creates a large amount of produced water. Insufficient separation causes an emulsion to be formed
within the produced water, resulting in high readings. Occasional excursions of this produced water occurs
when the well is brought online after resting and a slug of liquid is received. Normal operation is to process
all produced water through the Ravenspurn North system, however both Ravenspurn North and Johnson
have historically discharged produced water which was a far higher level than the 30 mg/l limit set in the
permits.
In order to improve performance, further modifications to the produced water process are being
commissioned. The new oily water treatment package consists of a bespoke filtration system with
coalescer as a further means of removing hydrocarbons.
Accidental Releases As spills at sea can have consequences for the marine environment, PUK SNS work to minimise the risk with a focus on prevention. We have BEIS OPRED approved oil emergency pollution plans (OPEPS) in place across all our assets.
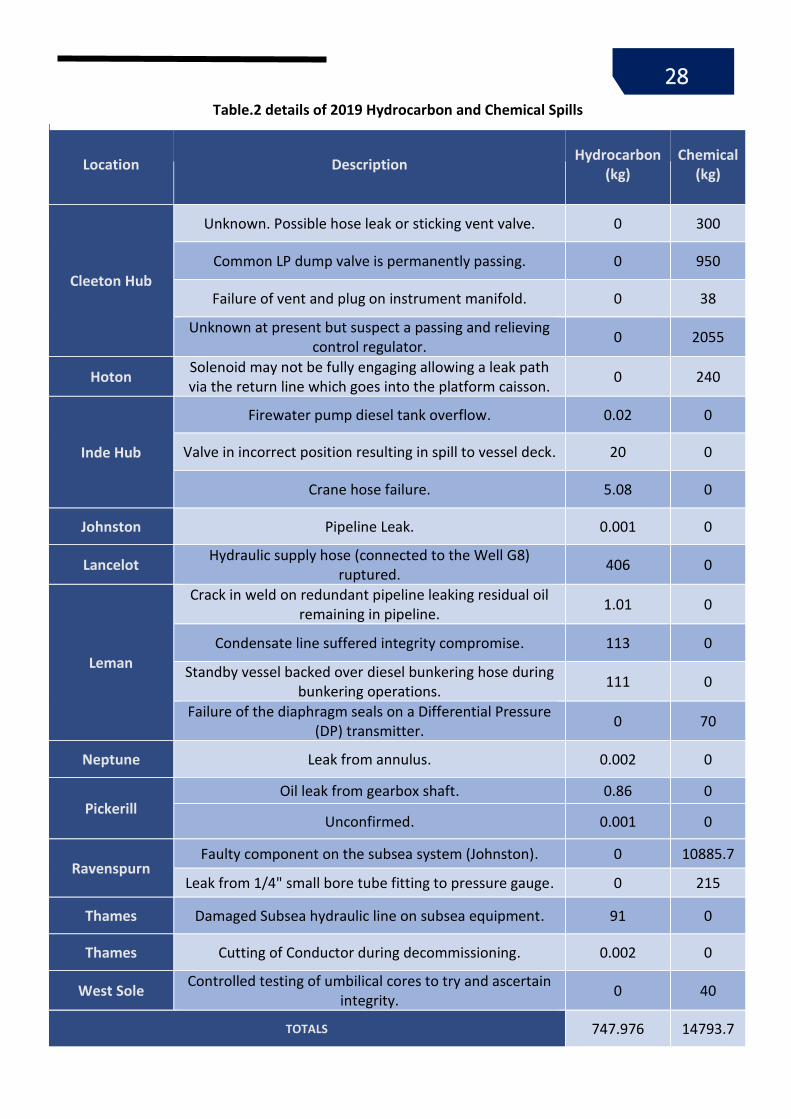
The Oil Pollution and Control Regulations apply to hydrocarbon and chemical spills to sea and these have to be reported and are subject to detailed investigation to ascertain the cause and prevent recurrence. A total of 22 spills were reported during 2019. Brief details of the hydrocarbon and chemical spills are provided in Table 2. Figure 27 shows the majority of substances spilt were chemicals (95 percent) and approximately 70% of the chemical releases were from one source, a passing valve on a subsea control module (SCM) on the third party Johnston field, a subsea tieback to the Ravenspurn North Hub. The faulty SCM has since been changed out.
28
Location Description Hydrocarbon
(kg) Chemical
(kg)
Cleeton Hub
Unknown. Possible hose leak or sticking vent valve. 0 300
Common LP dump valve is permanently passing. 0 950
Failure of vent and plug on instrument manifold. 0 38
Unknown at present but suspect a passing and relieving control regulator.
0 2055
Hoton Solenoid may not be fully engaging allowing a leak path via the return line which goes into the platform caisson.
0 240
Inde Hub
Firewater pump diesel tank overflow. 0.02 0
Valve in incorrect position resulting in spill to vessel deck. 20 0
Crane hose failure. 5.08 0
Johnston Pipeline Leak. 0.001 0
Lancelot Hydraulic supply hose (connected to the Well G8)
ruptured. 406 0
Leman
Crack in weld on redundant pipeline leaking residual oil remaining in pipeline.
1.01 0
Condensate line suffered integrity compromise. 113 0
Standby vessel backed over diesel bunkering hose during bunkering operations.
111 0
Failure of the diaphragm seals on a Differential Pressure (DP) transmitter.
0 70
Neptune Leak from annulus. 0.002 0
Pickerill Oil leak from gearbox shaft. 0.86 0
Unconfirmed. 0.001 0
Ravenspurn Faulty component on the subsea system (Johnston). 0 10885.7
Leak from 1/4" small bore tube fitting to pressure gauge. 0 215
Thames Damaged Subsea hydraulic line on subsea equipment. 91 0
Thames Cutting of Conductor during decommissioning. 0.002 0
West Sole Controlled testing of umbilical cores to try and ascertain
integrity. 0 40
TOTALS 747.976 14793.7
Table.2 details of 2019 Hydrocarbon and Chemical Spills

29
Hydrocarbon (kg), 747.976
Chemical (kg), 14,793.70
Hydrocarbon (kg)
Chemical (kg)
Figure.27 Chemical Spills Hydrocarbon vs. Chemical (2019)
30
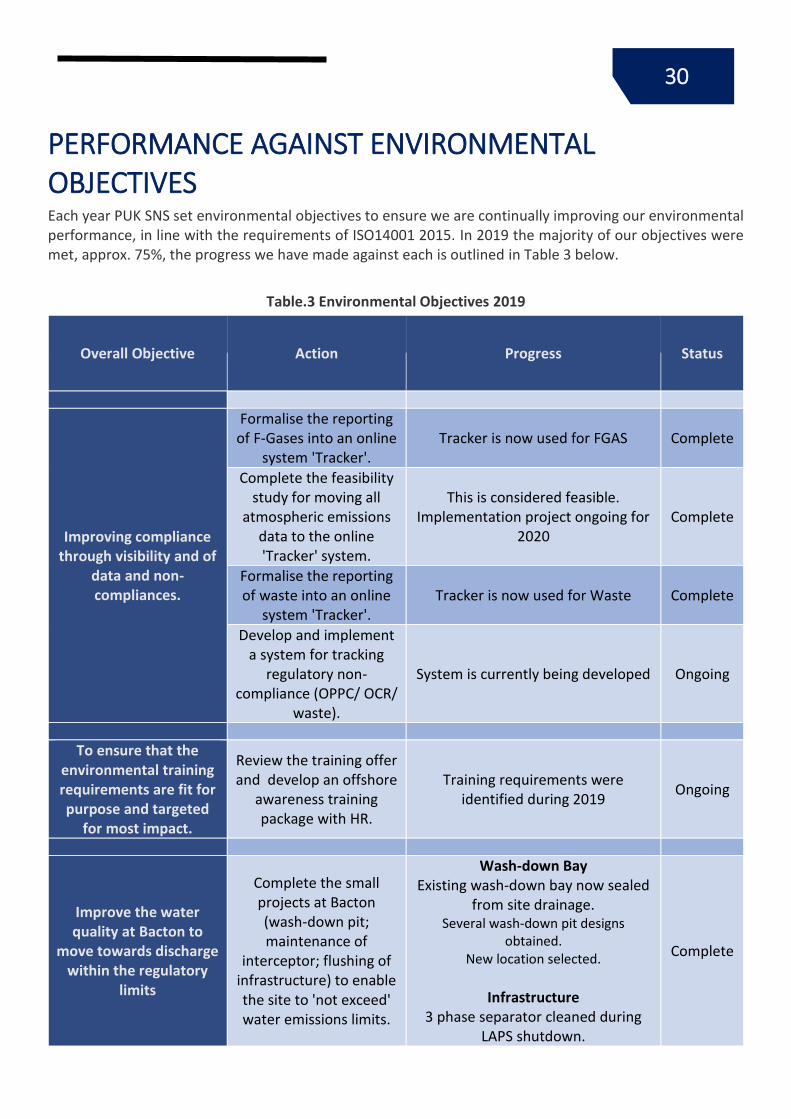
PERFORMANCE AGAINST ENVIRONMENTAL OBJECTIVES Each year PUK SNS set environmental objectives to ensure we are continually improving our environmental performance, in line with the requirements of ISO14001 2015. In 2019 the majority of our objectives were met, approx. 75%, the progress we have made against each is outlined in Table 3 below.
Table.3 Environmental Objectives 2019
Overall Objective Action Progress Status
Improving compliance through visibility and of
data and non-compliances.
Formalise the reporting of F-Gases into an online
system 'Tracker'. Tracker is now used for FGAS Complete
Complete the feasibility study for moving all
atmospheric emissions data to the online 'Tracker' system.
This is considered feasible. Implementation project ongoing for
2020 Complete
Formalise the reporting of waste into an online
system 'Tracker'. Tracker is now used for Waste Complete
Develop and implement a system for tracking
regulatory non-compliance (OPPC/ OCR/
waste).
System is currently being developed Ongoing
To ensure that the environmental training requirements are fit for purpose and targeted
for most impact.
Review the training offer and develop an offshore
awareness training package with HR.
Training requirements were identified during 2019
Ongoing
Improve the water quality at Bacton to
move towards discharge within the regulatory
limits
Complete the small projects at Bacton (wash-down pit; maintenance of
interceptor; flushing of infrastructure) to enable the site to 'not exceed' water emissions limits.
Wash-down Bay Existing wash-down bay now sealed
from site drainage. Several wash-down pit designs
obtained. New location selected.
Infrastructure
3 phase separator cleaned during LAPS shutdown.
Complete

31
External sampling and analysis undertaken to determine Bio-
digester efficiency and potential contributions to poor water quality.
Biological additives now in use to increase efficacy.
Drain surveys and repairs undertaken for main site and Annex.
Site interceptors’ undergone extensive drain down and cleaning
process. Oily Water Skimmer pits drained
down, cleaned and integrity assessed.
Water Treatment Project
Several technological solutions were explored.
An in-depth feasibility study undertaken to assess viability. Due
to reducing produced waters volumes the proposed options were not financially viable. Assessment of individual incoming produced water
stream continues.
To make sustainable improvements within
the supply chain.
Review the current procurement strategy
and integrate sustainable considerations into the
existing company procurement strategy.
Sustainable procurement policy developed and now in use.
Complete
Undertake 4 supply chain audits with high
risk E or regulatory compliance in line with QA Supplier Procedure.
4 audits completed and reports issued.
Complete

32
ENVIRONMENTAL OBJECTIVES AND TARGETS FOR 2020 Table.4 2020 Environmental Objectives and Targets
Business Objective Overall Objective Aspect
Extending the field life whilst Maximising
Economic Recovery (MER) in line with the UK Net Zero Strategy
Delivery of the Southern Hub Asset
Rationalisation Project (SHARP) project detailed
define phase.
(Note: SHARP is the removal of two
inefficient compression hubs and replace with
one, fit for size, compression facility).
Air Emissions
Identification of behavioural and
operational changes to drive efficiency/ limit
emissions (CO2 equivalent) on the
Northern Hub manned platforms and terminals.
Air Emissions
Establish an understanding of sources
of methane emissions (both in design and fugitive) on manned
platforms and terminals
Air Emissions


![INDEX [] · sns 인플루언서마케팅(1) sns 인스타그램 셜 네트워크플랫폼의특징은이용자가마케팅에직적으로 참여하며 단기간에빠른콘텐츠확산및글로벌타깃이가능한이](https://img.pdfslide.us/doc/110x75/602506004f28a16c44278cb0/index-sns-oeeoeeoe1-sns-fee-oe-eoeoeeeeoeoeeoe.jpg)