Embed Size (px)
Citation preview
National Environmental Engineering Research Institute Nehru Marg, Nagpur 440 020
May 2010
Environmental Post Evaluation of the Projects under the Schemes in the Taj Trapezium Zone
Sponsor : MoEF, New Delhi
Final Report
Environmental Post Evaluation of the Projects under the Schemes in the Taj Trapezium Zone
Sponsored by MoEF
National Environmental Engineering Research Institute Nehru Marg, Nagpur - 440 020
May 2010
FOREWORD
Over last few decades, various industrial, commercial and residential
activities surrounding the Taj Mahal have resulted in adverse impacts on the
monument, prompting the Government of India, judiciary, activist groups and various
donor agencies to raise awareness about the potential threat and also to develop
programs to ensure the monument’s survival and sustainability. Subsequently, a
Mission Management Board under the Chairmanship of the Chief Secretary, UP was
constituted for overseeing the implementation, monitoring and reviewing of the
various programmes / schemes formulated for the protection of Taj Mahal. These
schemes were related to uninterrupted power supply, construction & widening of
roads, augmentation of water supply, improvement of drainage and sanitation, solid
waste management, etc.
Ministry of Environment & Forests (MoEF) retained National Environmental
Engineering Research Institute (NEERI) for conducting Environmental Post
Evaluation of the Projects under the Schemes in the Taj Trapezium Zone. The
objectives of the study was to see improvement in environmental quality on the
environs of Taj Mahal and other historical monuments, to provide
tangible/quantifiable benefits of the 8 completed projects and to provide clear cut
directions on taking up new projects based on the evaluation report. The report
based on the evaluation of various schemes has come out with clear cut
recommendations which should facilitate the Ministry for taking necessary decisions.
The co-operation and assistance rendered by the concerned State
Government Departments and Commissioner, Agra and the officials of MoEF in this
study are gratefully acknowledged.
(Tapan Chakrabarti) Director
Nagpur
Date:

CREDITS
National Environmental Engineering Research Institute
Project Team
Bassin, J.K.
Bhattacharya, J. K.
Gupta, R. K.
Karthik, M.
Nandy, T.
Raman, N.S.
Rao, C.V.C.
Vaidya, A.N.
Project Leaders
Animesh Kumar and Pandey, J. S.
Project Coordinator
Wate, S. R.
Project Guide
Chakrabarti, T.
i
Contents
Item Page No.
List of Figures III List of Tables IV List of Exhibits V List of Annexure VII Executive Summary 1-14
1 Introduction 1.1-1.8 About Gokul barrage 1.4 About storm water drainage system in Agra 1.7 About Solid waste management 1.8 2 Objectives and their Attainment 2.1-2.8
2.1 For electricity related projects 2.1 2.2 For road related projects 2.3 2.3 For Gokul Barrage 2.4 2.4 For Storm Water Drainage 2.5 2.5 For Solid Waste Management 2.6 2.6 Overall objectives and attainment 2.8
3 Methodology 3.1-3.6
3.1 For electricity related projects 3.1 3.2 For road related projects 3.2 3.3 For Gokul Barrage project 3.2 3.4 For storm water drainage project 3.3 3.5 For solid waste management project 3.3 3.6 RTI Application 3.3
4 Post Project Environmental Evaluation 4.1-4.47
4.1 Projects related to “Improvement in Electric Supply at Agra” 4.1 4.2 Projects related to road construction 4.4 4.3 Post project environmental evaluation of Gokul Barrage 4.17 4.4 Post project environmental evaluation of Storm water drainage 4.21 4.5 Post environmental evaluation of solid waste management Project 4.33
5 Environmental Management Plan 5.1-5.9
5.1 For electricity related projects 5.1 5.2 For road related projects 5.2 5.3 For Gokul Barrage 5.2 5.4 For Storm water drainage 5.4 5.5 EMP for Solid Waste Management 5.5
6 Conclusion and Recommendations 6.1-6.5
6.1 For Road related projects 6.1 6.2 For electricity related projects 6.2 6.3 For Gokul Barrage 6.2 6.4 For storm water drainage system 6.3 6.5 For solid waste management 6.4
ii
List of Figures
Figure No. Title Page No.
1.1 Location of Gokul Barrage on River Yamuna in 1.5
Mathura
2.1 Falling ground water levels in the vicinity of Gokul 2.6
Barrage Project
4.1 Agra city map showing missing link and new roads 4.10
4.2 SPM Concentration in Agra: Temporal Variation 4.11
4.3 SO2 – Concentrations in Agra: Temporal Variation 4.12
4.4 NO2 - Concentrations in Agra: Temporal Variation 4.13
4.5 Comparison of Taj Mahal air quality with that of 4.14
nearby area: SPM
4.6 Comparison of Taj Mahal air quality with that of 4.14
nearby area: RSPM
4.7 Comparison of Taj Mahal air quality with that of 4.15
nearby area: SO2
4.8 Comparison of Taj Mahal air quality with that of 4.15
nearby area: NO2
4.9 Passage of vehicles through the bridge 4.20
4.10 Location of Major Storm Water Drains Discharge 4.28
into river Yamuna
iii
List of Tables
Table No. Title Page No.
1.1 Major Specification of Gokul Barrage Project 1.6
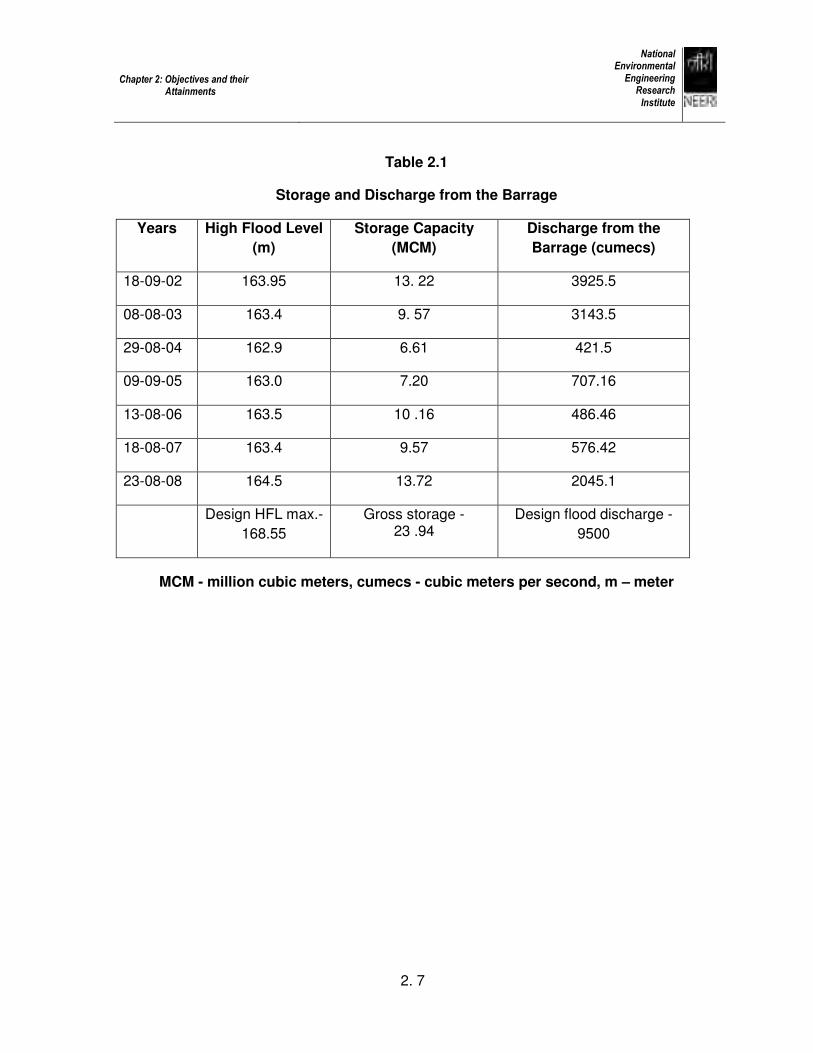
2.1 Storage and discharge from the barrage 2.7
3.1 Emission factors for DG set 3.4
3.2 Vehicle mix 3.4
3.3 Correction Factor for vehicle speed 3.5
3.4 Emission factors 3.6
4.1 Comparison of ambient air quality of Agra with 4.16
neighboring cities
4.2 Surface water concentration of dissolved oxygen and 4.18
BOD in Gokul Barrage Project
4.3 Storage and discharge from the barrage 4.19
4.4 Storm Water Drains in Agra City and the Coverage 4.24
Areas
4.5 Status of Storm Water Drainage Scheme 4.26
4.6 Maintenance of Storm Water Drainage System and 4.27
Expenditure Incurred
4.7 Fund Released against the project budget and its 4.34
utilization by AMC
4.8 Infrastructure Proposed and Procured by AMC 4.34
(period 1999-2003) in the project
4.9 Ranking Criteria for Solid Waste Management 4.42
System
4.10 Ranking of Municipal Solid Waste Management 4.46
System of Agra
iv
List of Exhibits
Exhibit No. Title Page No.
1.1 Gokul Barrage on Yamuna River 1.7
4.1 Broken storm water drains which helps in increasing 4.29
silting and seepage from the surrounding environment
4.2 Indiscriminate disposal of solid wastes in open storm 4.29
water drains in Azampara drain
4.3 Storm water drain near Agra fort discharging into
Yamuna river 4.30
4.4 Sludge and silt removal from stormwater drains by 4.30
workers. Workers not protected while undertaking the
task
4.5 Stormwater drain in the Yamuna Kinara Road near 4.31
Jahangir Palace. Taj Mahal seen in the background
about 2.0 km from the site
4.6 Bhairon drain outfall in Yamuna river 4.31
4.7 Excavated silt material in front of a house blocking 4.32
entry to the house and reducing the width of road
4.8 Excavated silt and sludge is dried on the roads 4.32
4.9 Open roadside dumps 4.36
4.10 Dumper placer bin in improper condition 4.37
4.11 Lifting of waste from roadside dump 4.37
4.12 Old disposal site near Nangla-Rambal 4.38
4.13 Old disposal site near Nangla-Rambal 4.38
4.14 Active landfill site, near Chhaleswar (west) 4.39
railway station
4.15 Active landfill site, near Chhaleswar (west) 4.39
railway station
4.16 Proposed landfill site at Kuberpur 4.40
4.17 Proposed landfill site at Kuberpur 4.40
v
List of Annexure
Annexure No.
Particulars
I
II
III
IV
V
VI
VII
VIII
IX
X
A short write up on CALINE 4
Print out of the website
Tender document pages
Relevant pages from draft report of ARAI
US EPA standard for PM2.5
Relevant pages from CPCB Annual Report
Guidelines for EMP of Storm water drainage
Management Information System
RTI Application
Water quality Criteria
Executive Summary
Consequent to the Hon’ble Supreme Court orders dated 4.9.96 in the Writ Petition No.
13381/84, the Planning Commission estimated (in consultation with the State Government)
an amount of 600 crores on equal Centre-State partnership required to implement various
schemes relating to protection of the Taj Mahal. A Mission Management Board under the
Chairmanship of the Chief Secretary, UP was constituted for overseeing the implementation,
monitoring and reviewing the various programmes/schemes formulated for the protection of
the Taj Mahal. These schemes were related to uninterrupted power supply, augmentation of
water supply, improvement of drainage and sanitation, efficient solid waste management and
city tree plantation in the context of environmental protection of Taj Mahal. The EFC Memo,
giving details of the scheme on Taj Protection Mission, was approved in the EFC meeting
held on 26.10.98. On 23.2.99, the Cabinet Committee on Economic Affairs approved
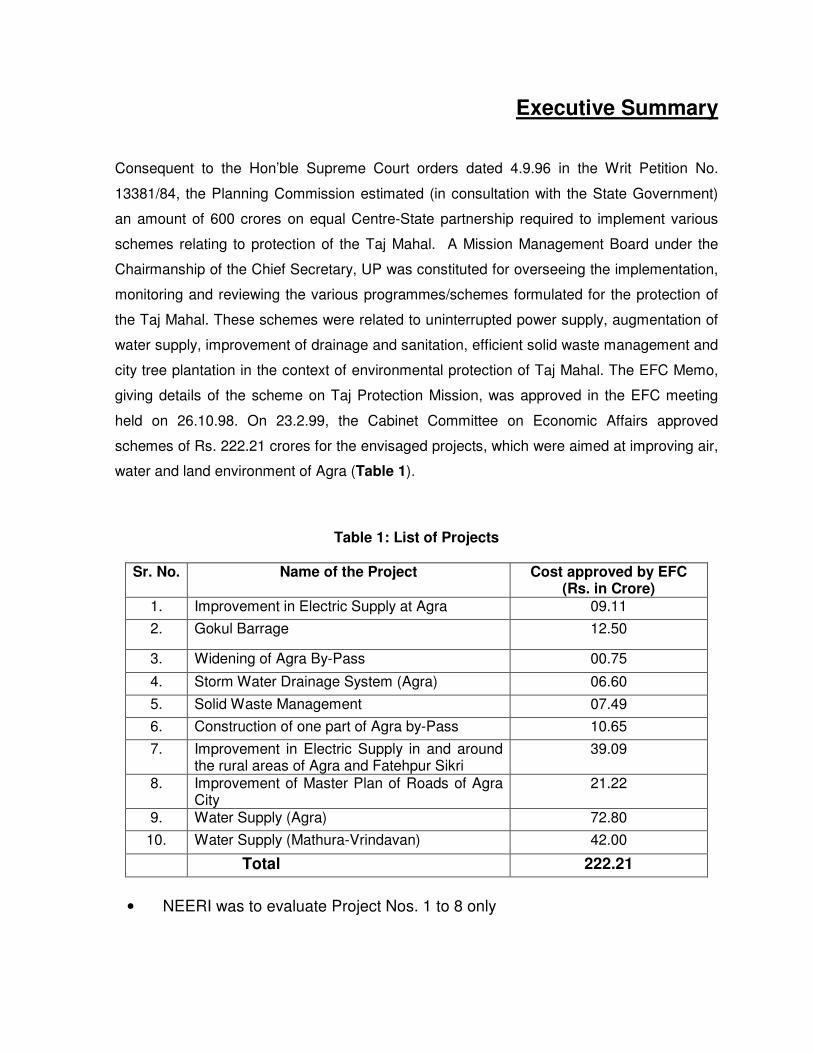
schemes of Rs. 222.21 crores for the envisaged projects, which were aimed at improving air,
water and land environment of Agra (Table 1).
Table 1: List of Projects
Sr. No. Name of the Project Cost approved by EFC (Rs. in Crore)
1. Improvement in Electric Supply at Agra 09.11
2. Gokul Barrage 12.50
3. Widening of Agra By-Pass 00.75
4. Storm Water Drainage System (Agra) 06.60
5. Solid Waste Management 07.49
6. Construction of one part of Agra by-Pass 10.65
7. Improvement in Electric Supply in and around the rural areas of Agra and Fatehpur Sikri
39.09
8. Improvement of Master Plan of Roads of Agra City
21.22
9. Water Supply (Agra) 72.80
10. Water Supply (Mathura-Vrindavan) 42.00
Total 222.21
• NEERI was to evaluate Project Nos. 1 to 8 only
Executive Summary
National Environmental Engineering Research Institute
2
• Project Nos 1,3,6,7 and 8, viz. “Improvement in Electric Supply at Agra”;
“Widening of Agra By-Pass”; “Construction of one part of Agra By-Pass”;
“Improvement in Electric Supply in and around Rural Areas of Agra and Fatehpur
Sikri”; and “Improvement of Master Plan of Roads of Agra City” envisaged
improving the overall air quality of the city.
• Project Nos. 2 and 4, viz. “Gokul Barrage” and “Storm Water Drainage System
(Agra)” envisaged improvement of overall water-quality of the city
• Project no. 5, viz. “Solid Waste Management” envisaged improvement of overall
aesthetics and environment of the city.
NEERI was retained by the Ministry of Environment and Forests (MoEF) for
conducting post environmental evaluation of the eight schemes, which were either completed
or neared completion. Accordingly, post environmental evaluation of project Nos 1 to 8 was
taken up by NEERI.
The objectives of the post evaluation studies were:
• To see improvement in environmental quality on the environs of Taj Mahal and
other historical monuments
• To provide tangible/ quantifiable benefits of the 8 completed projects
• To provide clear cut directions on taking up new projects since consideration of
the new projects in the Taj Trapezium Zone (TTZ) was to be linked to the
outcome of the post-evaluation report.
Methodologies followed for post environmental evaluation for electricity and road related projects
Improvement in environment due to implementation of electricity and road related
projects was assessed in terms of reduction in emissions due to envisaged activities in the
project. The reduction in emissions in an area distinctly improves air quality of the area.
Reduction in emissions was calculated using published emission factors and annual mean
concentrations of ambient air quality parameters as reported from the secondary data. While
calculating emission reductions, certain assumptions were made where the required data
were not available. Following assumptions were made:
Executive Summary
National Environmental Engineering Research Institute
3
In case of projects on electricity improvement - The electricity capacity expansion
is equivalent to the DG sets use and AP-42 emission factors of DG sets were used to
calculate reduction in emissions
In case of projects related to road – A mix of 100 vehicles per hour was considered
for all the roads. Speed of the vehicle before the implementation of the project was
considered to be 10-15 Km/h and that after implementation as 40-50 Km/h. Emission factors
were picked up from the draft report on “Emission Factor Development for Indian Vehicles“,
as a part of Ambient Air Quality Monitoring and Emission Source Apportionment Studies by
ARAI, Pune.
In case of calculating reduction in impact on Taj Mahal due to construction of
bypass – Dispersion model CALINE4 was used for this purpose. This model is suitable for
impact assessment due to roadways/highways
The post project environmental evaluation of Project 1: Improvement in electric supply
at Agra-II (Rs. 9.11 Crore) has brought about reduction of 234.61, 218.736, 3316.320,
264.600 and 716.184 Kg/h for PM, SO2, NOx, HC and CO emissions respectively in Agra.
The post project environmental evaluation of Project 7: Improvement in electric supply
in and around the rural areas of Agra and Fatehpur Sikri
(Rs. 39.09 Crore) has brought about reduction of 89, 83, 1263, 101 and 273 Kg/h for PM,
SO2, NOx, HC and CO emissions in the rural areas of Agra & Fatehpur Sikri. This project
was also to provide rural electrification in 85 coded villages. The supply of domestic
electricity to the villages will bring about social benefits to rural poor. Small-scale businesses
and access to electric power for schools and public services was facilitated by this scheme.
Potential beneficiary enterprises will be small industries like saw mills, grain mills and other
agricultural processing and storage businesses. Improvement in public facilities (e.g. health
& education) as a result of availability of electricity is also evident. The projects will cause
increased economic activity in industrial, agricultural and commercial sectors as a result of
availability of electric supply in the targeted rural areas. The facilities like communication,
internet, computer literacy and charging of mobile phones will be generated. Electric lighting
adds to security at night and enables extended opportunities for work and study. As a
consequence, the quality of life and extent of economic opportunity of the targeted villagers
will be transformed.
Executive Summary
National Environmental Engineering Research Institute
4
The post project environmental evaluation of Project No. 6: Construction of one part
of Agra Bye-pass (Rs10.65 Crore later revised to 26.91 Crore) has resulted in the reduction
of CO, HC, NOx, CO2 and PM emissions by 14.4, 3.2, 3.8, 639 and 0.02 Kg/h and other
pollutants, such as hydrocarbons, benzene, 1-3 butadiene, formaldehyde, total aldehydes
and total PAH by 1007, 96, 146, 23, 235 and 4445 mg/h considering 100 vehicle mix per
hour on the road.
The post project environmental evaluation of Project No. 3: Widening of Agra Bye-
pass (Rs. 0.75 Crore) has resulted in the reduction of CO, HC, NOx, CO2 and PM by 1.4, 2.5,
10, 726 and 1.6 Kg/h and hydrocarbons, benzene, 1-3 butadine, formaldehyde, total
aldehydes and total PAH by 1002, 95, 145, 23, 234 and 4423 mg/h considering 100 vehicle
mix per hour on the road.
The post project environmental evaluation of Project No. 8: Improvement of Master
plan of Roads of Agra city (Rs. 21.22 Crore) has resulted in the reduction of CO, HC, NOx,
CO2 and PM by 20.8, 3.7, 9.3, 863 and 1 Kg/h and hydrocarbons, benzene, 1-3 butadine,
formaldehyde, total aldehydes and total PAH by 1126, 127, 158, 28, 257 and
4505 mg/h considering 100 vehicle mix per hour in Agra.
Construction of 2 new Roads/bypass envisaged in this project – This will bring
about 80% reductions in emission impact on Taj Mahal. The two bypasses would exchange
the traffic at a distance of 2 and 4 Km away from Taj Mahal which was otherwise at 500
meters from Taj Mahal, when these roads/bypasses were not created.
Thus implementation of the electricity related projects has helped improving overall
quality of life of the rural population around Agra and Fatehpur Sikri. This has also resulted in
reduction in use of diesel generators in Agra city and in rural area for agriculture which were
causing pollution in the TTZ, thereby bringing an improvement of air quality due to reduced
emissions.
With the implementation of the road related projects, there had been vehicular
decongestion on the TTZ roads thereby reducing air pollution emissions in the TTZ. The well-
built and maintained roads in the Agra city would result in overall positive impact on the
tourists visiting Agra.
Executive Summary
National Environmental Engineering Research Institute
5
The impact of the implementation of above projects in improving the ambient air
quality is apparent from the tendency of the ambient air quality for 1996-2006 wherein it was
observed that the ambient air concentration of acid forming gases, SO2 and NO2 substantially
reduced in the years 2001-2002. A reduction of 27-41 % in SPM, 70-82% in SO2 and 46-74%
in NO2 concentration has been observed. There is an increasing tendency beyond 2002
which may be attributed to rise in man and vehicular population. The rain water pH data for
the year 2008 indicated that the pH is near neutral.
A comparison of ambient air quality of Taj Mahal with respect to SPM, RSPM, SO2
and NO2 with the nearby areas (Itmad ud Daulah, Nunhai and Rambagh) showed that the air
quality at Taj Mahal is better with respect to all the 3 other areas. However, the SPM and
RSPM concentrations at all the four sites are above the CPCB limit of 70 and 50 µg/m3
respectively. The annual average concentration of SO2 is within the CPCB limits of 15 µg/m3
whereas the annual average NO2 concentration has exceeded the CPCB limit of 15 µg/m3.
A comparison of ambient air quality of Agra with neighboring cities (Mathura,
Firozabad and Bharatpur), conducted by CPCB during winter months in 2006-07 followed by
the analysis of organic fraction, showed that the anthropogenic sources were maximum at
Nunhai Industrial area in Agra, followed by Industrial area in Firozabad. Mathura had the
least organic fraction in SPM. PM2.5 concentration at Taj Mahal was reported to be 246
µg/m3 in winter months and 25 µg/m3 during monsoon. These concentrations are higher than
the 24-h average concentration standard, 15 µg/m3 of US EPA. India is yet to set standards
for PM2.5.
Following suggestions have been made in the Environmental Management plan
(EMP):
For Road related Projects:
• The roads shoulders should be paved to keep them free from vegetative growth
• Proper road drainage system should be in place and the drainage system should
be periodically cleared so as to ensure water flow
• Restrain truckers from overloading
• Vehicles carrying loose materials should be covered to prevent spillage
Executive Summary
National Environmental Engineering Research Institute
6
• Trees should be replanted on roadsides wherever feasible to arrest traffic
pollution and absorb noise
• Slopes along the road side should be stabilized to avoid road cutting/deterioration,
for example, by planting grass on the slopes
• Emergency response system should be in place to offset accidents involving
transportation of hazardous material
• Unqualified vehicles should not be permitted to run
• Road surface condition should be maintained to reduce noise pollution
• Any ditches/pot holes on the road surface should be immediately repaired/filled
• Traffic signs, regulating the speed of the vehicles, should be erected and
maintained to enhance the efficiency of the vehicles
• Traffic rules should be strictly enforced
For Electricity related Projects:
• The threat of soil erosion around the electric towers can be alleviated by building
a foundation embankment or contouring on sloping land
• Trees posing safety hazard, because they are too close to transmission lines,
should be trimmed down periodically
• Efficiency measurement of the electricity distribution system (transmission and
transformation) should be carried out
• Frequency of load shedding and cuts should be monitored and documented
• Extent of improvement in living conditions of the population and contribution to
poverty alleviation and economic growth in the target rural area should be
documented
• Steps should be taken to increase the efficiency, reliability, and quality of
electricity supply
• Steps should be taken to reduce power cuts during peak time thereby limiting the
use of private diesel powered generators
For Gokul Barrage:

Executive Summary
National Environmental Engineering Research Institute
7
• Resource operation plan and environment management system should be
prepared and implemented
• Forcing factors or system states should be monitored
• Sufficient upstream measure should be taken to prevent breach
• Water level, flow rate, ground water level, water quality, biological indicators, bed
level change, condition of structure, sluices, power supply, effluent loading (if
any) etc should regularly be monitored
• Accidents/incident/near misses should be recorded
• Contingency plan should be prepared and implemented
• Silt/sediment/accretion should be periodically removed
• The EMP should be revised in the event of change in effluent loading (if any),
change in upstream/downstream water quality, engineering works, abstraction
For Storm Water Drainage:
• A map illustrating areas to be protected/restored, together with proposed
development patterns, should be developed and maintained
• Areas where special consideration is required at the subdivision plan stage
should be identified
• Preliminary sediment control plan, operation and maintenance considerations
should be in place
• Proper management of open areas and land use pattern
• Proper management/utilization of wetlands and wet ponds
For Solid Waste Management:
• House to house collection of MSW should be adopted in various areas of Agra.
For this purpose containerized handcarts with bell ringing system, tricycles with
container, small vehicles with separate compartments for dry and wet waste can
be used
• Community bins used for storage of waste should be placed at appropriate
locations. The rationality in allocation of bins should be maintained. Factors like
magnitude of waste generation and resident’s convenience should be taken into
consideration.
Executive Summary
National Environmental Engineering Research Institute
8
• Old community bins should be removed after expiry of life period and new bins
should be installed
• To avoid double handling of waste, closed metallic containers, which are lifted by
dumper placers, can be used.
• Community bins should be emptied regularly. Care should be taken not to allow
the bins to overflow and create unhygienic conditions
• Road sweeping should be done at least twice a day
• Long handled brooms or mechanical sweepers should be used in place of short-
handled brooms
• All roadside dumps should be removed
• Proper work allotment to the sweeping staff should be done
• In the areas where road width is very small making it difficult for even tricycles,
handcarts etc to enter, small collection bins should be provided
• Industrial and biomedical wastes should not be mixed with MSW as they are
governed by separate Rules and Regulations
• Horticulture waste, debris, and slaughter house waste should be collected
separately
• Routes for the vehicle transporting MSW should be properly planned
• Dumper placer vehicles can be attached with metallic container for carrying the
containers to the disposal site and, after emptying, the containers can be brought
back to the original place. This arrangement avoids double handling of waste
• All the vehicles should be parked in garages or covered parking places
• Old vehicles should be replaced by new ones for economy and better efficiency
• Transfer stations should be provided when the collection points are far away from
the disposal site
• Preventive and routine maintenance of vehicles should be done in suitably
equipped workshop
• Sanitary landfill should be developed and operated for MSW in accordance with
Guidelines of Municipal Solid Wastes (Management and Handling) Rules, 2000.
Executive Summary
National Environmental Engineering Research Institute
9
• Selection of the landfill site should be based on environmental considerations and
geological and hydro-geological factors
• The sanitary landfill should be developed which can be operated for 20-25 years
• Landfill site should be away from the habitation clusters, forest areas, water
bodies, monuments, national parks, wet lands and places of cultural, historical or
religious importance
• A buffer zone should be developed around the landfill site
• Proper approach road for the landfill should be developed
• Proper fencing should be provided around the landfill site to prevent unauthorized
entry of persons or entry of animals
• Weighbridge facility should be provided for recording the quantity of waste
reaching the landfill site
• Landfill site should be provided with office facility for record keeping, monitoring
and other relevant activities
• Time to time health inspection of the solid waste management workers should be
done
• Safety measures for the workers should be adopted
• Fire fighting equipment should be provided at the site
• First-aid facility should be made available
• Drinking water facility and electrical lighting arrangements should be made
available
• A composite liner comprising of high density polyethylene (HDPE) of thickness of
1.5 mm and clay of thickness 90 cm should be provided at the bottom and sides
of the landfill
• Permeability coefficient of the soil should be less than or equal to 1 x 10⁻⁷ cm per
second
• Compaction of waste should be carried out by compactors
• Level of the ground water table should be at least 2 m below the base of the
landfill
Executive Summary
National Environmental Engineering Research Institute
10
• Leachate collection, storage and treatment system should be provided
• Monitoring of ground water quality should be conducted at regular interval
• Gas collection facility with provision for flaring up or utilization should be installed
• During operation of the landfill, soil cover or debris of 10 cm thickness should be
provided
• An intermediate cover of 65 cm thickness can be applied prior to rainy season
• While closing the landfill site, soil cover of thickness 60 cm and permeability
coefficient less than or equal to 1 x 10⁻⁷ cm should be applied. A drainage layer
of thickness of 15 cm should be provided on top of soil layer and a vegetative
layer of thickness of 45 cm should be provided at the top
• Proper waste segregation should be practised followed by conversion of
recyclable constituents, viz. plastics, metals, glass and paper to value added
products
• Should composting be practiced, it should be done in an environment-friendly
manner. Guidelines provided in the Rules should be followed
• Other processing options for the MSW are thermal processing with energy
recovery, bio-processing, refuse derived fuel, etc. However, before adoption of
any particular technology, there is a need to examine its sustainability, cost
effectiveness and environment friendliness
• Protective materials, viz. gumboots, gloves, goggles and masks should be
provided to the MSW workers
• Health check up programmes for MSW workers should be conducted biannually
or annually
• Spot fining system can be introduced for controlling improper disposal of waste
• Incentive scheme can be introduced for increasing efficiency
• Supervision and monitoring system of the solid waste management activities
should be strengthened
• Public awareness programme should be conducted from time to time
• A citizen forum can be constituted for interaction with public
• Training programme should be conducted from time to time for various levels of
staff
Executive Summary
National Environmental Engineering Research Institute
11
Conclusions and recommendations
For Road and Electricity related Projects:
• The completed road and electricity related projects have brought improvement in
TTZ with respect to immediate neighboring cities. There had been an
improvement in the environs of Taj Mahal and other historical monuments.
• Construction of new roads, widening of existing roads and construction of missing
links have helped ease out traffic movement, reduce frequency of engine idling
and increase traffic speed thereby helped reducing vehicle exhaust emissions in
the TTZ. This has, in turn, brought improvement in the ambient air quality and
resulted in positive impact on the Taj Mahal marble and the environment
• Further improvement of road network in future should be funded to meet
increased traffic volume over the years as evident from the rising tendency in
concentration of NO2.
• The benefits of the projects for domestic supply and use in small-scale
businesses and in getting access to electric power for schools and public services
are evident. Potential beneficiary enterprises will be small industries like saw
mills, grain mills and other agricultural processing and storage businesses.
Improvement in public facilities (e.g. health & education), as a result of availability
of electricity, is also evident. The projects would cause increased economic
activity in industrial, agricultural and commercial sectors as a result of availability
of electric supply in project areas. The facilities like communication, internet,
computer literacy and charging of mobile phones would be generated. Electric
lighting adds to security at night and enables extended opportunities for work and
study. As a consequence the quality of life and extent of economic opportunity
would be improved
• Financial and technical support should be provided to achieve reductions in
overall technical and commercial losses, increased availability of electricity, and
improved voltage profile
Executive Summary
National Environmental Engineering Research Institute
12
• Financial support in the electricity supply infrastructure should be provided to
enhance electricity access rate and to ensure improved efficiency, to reduce
peaking shortages and therefore assist the country to alleviate poverty and
achieve the set National goals
• Further enhancement in electric supply in future should be funded to meet
increased domestic use of electricity to fulfill energy needs
• Feasibility of electrification of non-codified villages also may be looked into
For Storm Water Drainage Project:
The storm water drains of Agra city were half a century old. The storm water drainage
systems constructed by the UP Jal Nigam (UPJN) are maintained by Agra Nagar Nigam
(ANN). The ANN claims that the storm water drains are de-silted and cleaned annually.
However, during our visit, we found that the existing structural conditions of the drains are
not good. These drains are not functioning properly due to silting and accumulation of solid
waste, which are not cleaned regularly by the authorities. There is no arrangement at outfall
locations drains/nallas for arresting the solid waste, which is finding its way finally into the
river Yamuna. Also, the outfalls of the drains are not provided with control structure to avoid
back flow from the river.
Out of total area of 8360 hectares of agriculture land, only 1400 hectares has
sewerage system. This is inadequate due to increase in population and extension of habited
area. In the absence of comprehensive sewerage system, the storm water drains carry raw
sewage and discharge directly into river Yamuna. As a result, most of the drains carry
domestic sewage laden with solid wastes.
The data revealed that more than 92% of the work was completed in Mustfa Quarter
area, Sikandra area, and Naval Ganj area. However, only 62% of the work was completed in
Bhim Nagar area as the work has been stopped by the monitoring committee. An
expenditure of 450.01 lacs has been incurred on the work executed as against the financial
grant of Rs. 565.38 lacs.
The drain cleaning activities needs to be undertaken in all the major drains
discharging into river Yamuna to improve the environmental status. The implementation of
Executive Summary
National Environmental Engineering Research Institute
13
the project did not give much advantage in term of development of the facility benefiting the
environmental status of the area under study.
For Gokul Barrage Project:
Gokul barrage was constructed at Gokul in Mathura under the TTZ by Uttar Pradesh
Irrigation Department, Mathura. The barrage has been constructed on the river Yamuna with
view to augment the water availability for Agra, Mathura and Vrindavan and to improve the
ground water table in the area and reducing the salinity level. The construction of the barrage
at Gokul was initiated in the year 1990 and completed in 2001.
It maintained high flood levels within 162.9 - 164.05 meters. The downstream
discharge was maintained between 421 and 3925 cumecs depending on the storage levels
after monsoon. The quantity of water stored in the barrage was lowest during the year 2004.
The major reasons attributed include low rainfall during the period and maintaining
downstream minimum flow conditions. Presently, around 30 cusec (73.5 MLD) and 115
cusec (282 MLD) of water are supplied at Mathura and Agra. Based on the data provided by
the UP Jal Nigam, the ground water levels have fallen over the years between 2003 and
2009.
Construction of the barrage on Yamuna River has bought mixed results to the public
and environment at large. Some salient features of the project include.
• The flow in the river downstream has been impacted as a result of the
impoundment, and the characteristics of the river Yamuna has changed due to
reduced flow conditions downstream. The quality of impounded water of the
barrage with respect to dissolved oxygen meets the CPCB classification D for
propagation of wild life and fisheries in Inland surface water Standards, however,
fail to meet the BOD parameter. Large-scale growth of water hyacinth was also
found in the river at the Gokul barrage in Mathura.
• The TDS concentration in the ground water samples from the nearby areas
indicated concentrations in the range of 777-1664 mg/l. However, the TDS
concentration of the ground water collected from hand pumps was considerably
higher in downstream vis-à-vis upstream quality. Some hand pumps water quality

Executive Summary
National Environmental Engineering Research Institute
14
does not meet the CPCB classification E (Irrigation, Industrial cooling and
controlled disposal) of water quality for conductivity.
• The surrounding area near the barrage has increased vegetative cover due to
availability of water.
• Construction of a four lane road on the barrage with foot path on both sides has
resulted in partial reduction of traffic in Mathura due to diversion of vehicles
through the barrage, reducing waiting times since the project was implemented
For Solid Waste Management:
• An amount of Rs. 749.00 lakhs were released by the MoEF for improvement of
solid waste management system of Agra.
• The information collected by a team of scientists from Agra Municipal Corporation
and from on-site inspection revealed that procurement and deployment of
equipments, vehicles and community bins have improved the situation of MSW
management in a few areas in the vicinity of Taj Mahal. Other areas also need
such improvement. Sanitary landfill has not been developed for the city. As per
ranking exercise carried by the Institute, Agra comes under ‘fair’ category with a
score of 437 out of 1000.
• Various specific measures for improvement in solid waste management
suggested in environmental management plan include collection and storage,
transportation, treatment and disposal. Preparation of comprehensive DPR and
action plan, introduction of MIS system for monitoring, release of funds in
installment with time to time monitoring of the project activities and a third party
evaluation of implemented project are also recommended and need to be
considered during future funding of such types of project.
CChhaapptteerr 11
IInnttrroodduuccttiioonn
Agra (27°10′N, 78°05′E) is located in north central India 200 km southeast of
Delhi. Two-thirds of its peripheral boundaries (SE, W and NW) are bounded by the Rajasthan
desert. The soil type is a mixture of sand and loam, containing excess of salts. The city is
about 169 m above the MSL and has semi-arid climate with atmospheric temperature
ranging between 11 to 48°C (max.) and 0.7 to 30°C (min.), relative humidity between 25–
95%, and average rainfall of about 650 mm per year. The climate of Agra has been broadly
divided into three seasons: winter (November to February), summer (March to June) and
monsoon (July to October). The prevailing directions follow two distinct patterns: during
monsoon winds are from W, NW, SW and NE Sector, while during the rest of the seasons
they are from W and NW sector.
The 10,400 sq km region covered under the TTZ has been categorized as a
sensitive zone because of the existence of many world Heritage Sites. Some important urban
centers, which come under the Taj Trapezium Zone, include Agra, Firozabad, Mathura,
Bharatpur, Jalesar and Hathras. These are the primary growth centers of the region. They
influence not only the regional economy but also the environment. The region is most fertile
in the country. Besides the Taj Mahal, the TTZ includes two other world heritage monuments
Chapter 1: Introduction
National Environmental Engineering Research Institute
1. 2
- the “Agra Fort” and “Fatehpur Sikri”. About two million tourists visit Agra every year, making
it a major source of revenue and foreign exchange for the region. However, continuously
rising environmental pollution has been the cause of concern for the protection of Taj marble.
Over last few decades, the damage caused to the Taj Mahal by the pollution
created by various industrial, commercial and residential activities surrounding it has been
prompting the government of India, courts, activist groups and various donor agencies to
raise awareness about the threat and to develop programs to protect the monument. In 1979,
the Government of India (GOI) constituted a High Power Committee (HPC) to protect the Taj
Mahal monument from chemical corrosion and degradation. Thereafter, no polluting industry
was allowed to establish or expand in Agra. Subsequently, there had been many
environmental interventions. They include installation of air pollution control units by 173
industries (out of 265) by 1994 and some others especially between 1996 and 2000 have
resulted in overall improvement in environmental quality of Agra city during that period.
Consequent to the Hon’ble Supreme Court orders dated 4.9.96 in the Writ Petition
No. 13381/84; the Planning Commission estimated (in consultation with the State
Government) an amount of 600 crores on equal Centre-State partnership to implement
various schemes relating to protection of the Taj Mahal. A Mission management Board
under the Chairmanship of the Chief Secretary, UP was constituted for overseeing the
implementation, monitoring and reviewing the various programmes/schemes formulated for
the protection of the Taj Mahal. These schemes were related to uninterrupted power supply,
augmentation of water supply, improvement of drainage and sanitation and city tree
plantation in the context of environmental protection of Taj Mahal. The EFC Memo giving
details of the scheme on Taj Protection Mission was approved in the EFC meeting held on
26.10.98. On 23.2.99, the Cabinet Committee on Economic Affairs approved schemes of
Rs. 222.21 crores for the envisaged projects, which were aimed at improving air, water and
land environment of Agra.

Chapter 1: Introduction
National Environmental Engineering Research Institute
1. 3
List of Projects
Sr. No. Name of the Project Cost approved by EFC (Rs. in Crore)
1. Improvement in Electric Supply at Agra 09.11
2. Gokul Barrage 12.50
3. Widening of Agra By-Pass 00.75
4. Storm Water Drainage System (Agra) 06.60
5. Solid Waste Management 07.49
6. Construction of one part of Agra by-Pass 10.65
7. Improvement in Electric Supply in and around the rural areas of Agra and Fatehpur Sikri
39.09
8. Improvement of Master Plan of Roads of Agra City 21.22
9. Water Supply (Agra) 72.80
10. Water Supply (Mathura-Vrindavan) 42.00
Total 222.21
• NEERI was to evaluate Project Nos. 1 to 8 only
Project Nos. 1,3,6,7 and 8, viz. “Improvement in Electric Supply at Agra”; “Widening of Agra
By-Pass”; “Construction of one part of Agra By-Pass”; “Improvement in Electric Supply in
and around Rural Areas of Agra and Fatehpur Sikri”; and “Improvement of Master Plan of
Roads of Agra City” envisaged improving the overall air quality of the city.
Project No. 2, viz. “Gokul Barrage” envisaged improvement of overall water-quality of the
city
Project Nos. 4 and 5, viz. “Storm Water Drainage System” and “Solid Waste Management”
envisaged improvement of overall aesthetics and environment of the city.
Chapter 1: Introduction
National Environmental Engineering Research Institute
1. 4
Later, it was decided by the MoEF that new proposals would be considered for
financial assistance under TTZ only after conducting the post evaluation of already funded
projects primarily taken up for improvement of environmental quality around Taj Mahal and
other important monuments. Subsequently, in the meeting held on 9th May 2006 at MoEF, it
was decided that out of the above ten approved schemes, post evaluation of eight schemes,
which were either completed or neared completion (S.No.1-8) be taken up based mainly on
the existing guidelines and available information. Accordingly NEERI was retained for
conducting the post environmental evaluation.
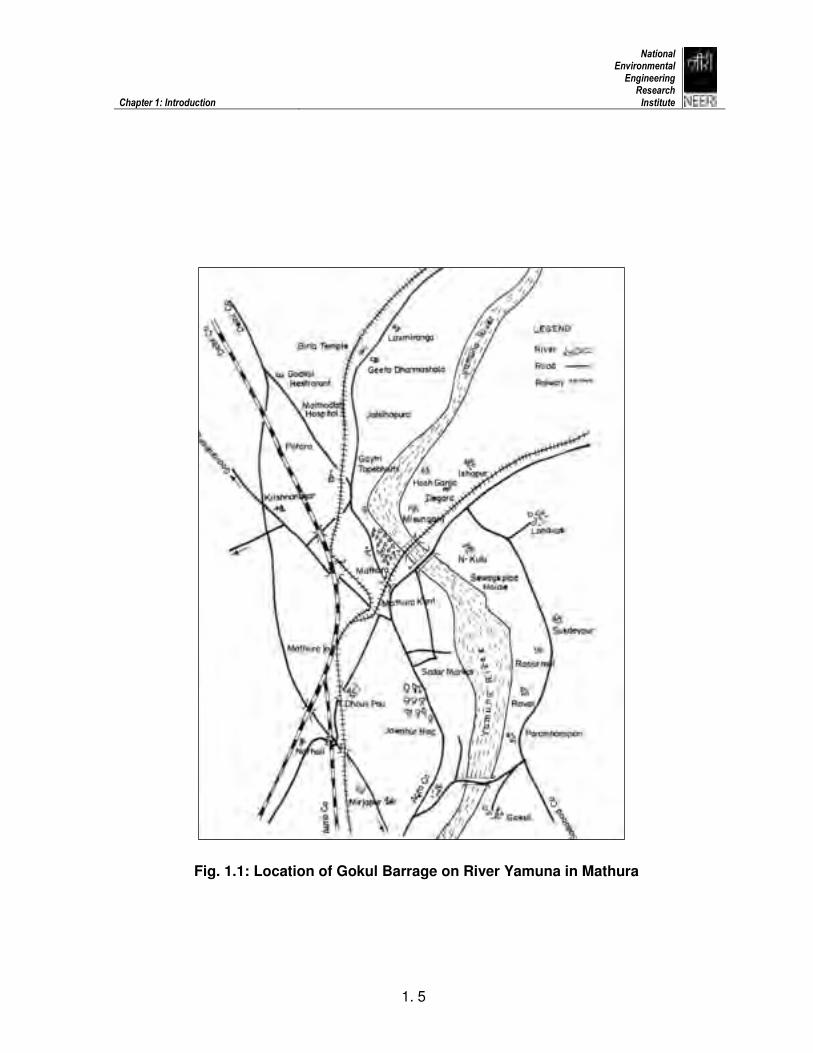
About Gokul barrage
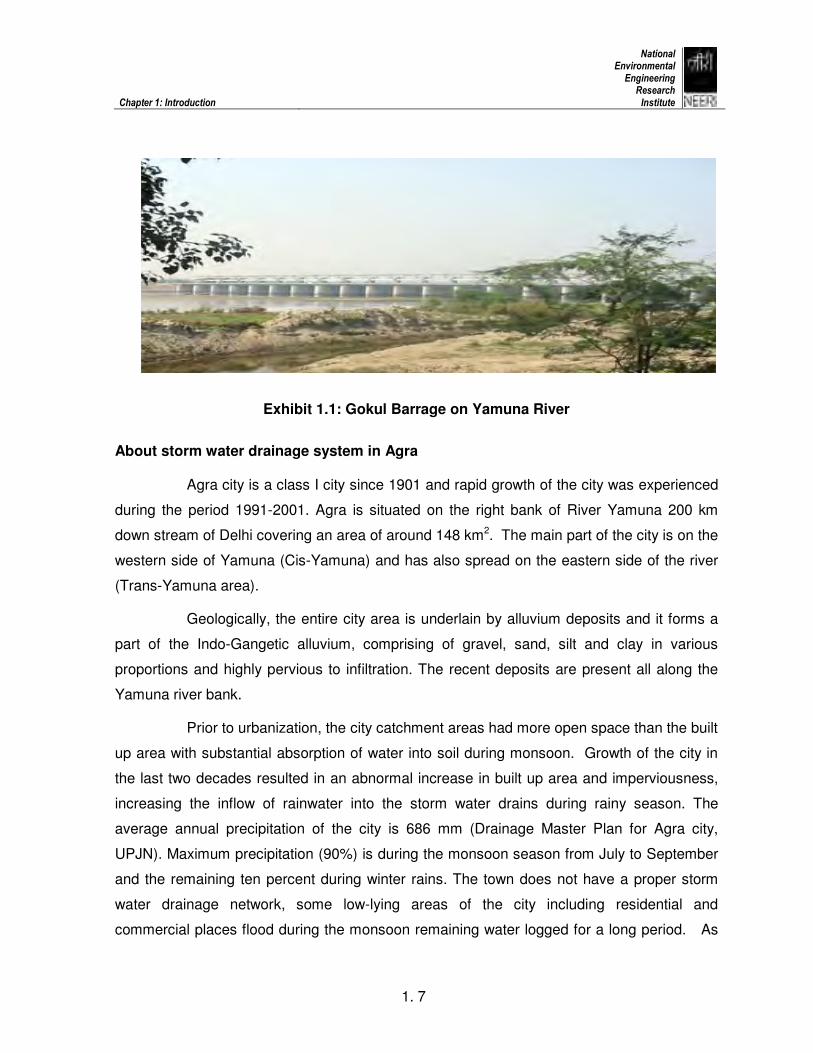
A barrage was constructed at Gokul in Mathura under the TTZ by Uttar Pradesh
Irrigation Department, Mathura (Fig. 1.1). The barrage (Exhibit 1.1) has been constructed on
the river Yamuna with a view to augment the water availability in Agra, Mathura and
Vrindhavan. The construction of the barrage was initiated in the year 1990. The catchment
area covered by the barrage is about 25900 sq. km and is designed for a peak flood
discharge at 9500 cumecs. Gokul Barrage project was intended to serve Mathura, Agra and
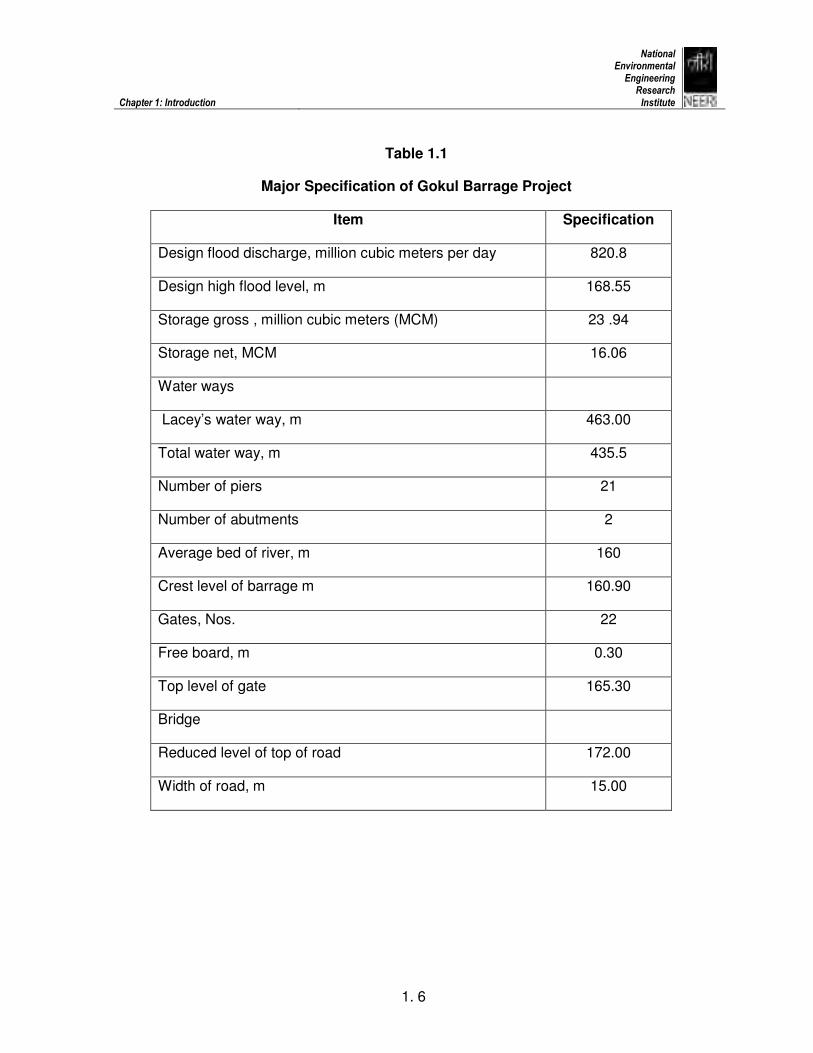
Vrindhavan for an estimated population of 17.0 lakh [2001 census]. Major specification of the
Gokul Barrage Project is presented in Table 1.1.
The initial cost approved for the Gokul Barrage project was Rs.12.5 crores. The
cost of the project in 1988 was estimated at Rs. 29.75 crores based on 1988 price index
(CWC lr.no.2/234/87/PAN/411 dated. 23/02/89). The project was revised again in 1995-96
with an estimated cost of Rs.74.38 crores based on 1995 price index (CWC letter No.
2/234/87 PAN/2044-47 dated 21/11/96) and revised again in 1998 to Rs. 93.64 crores (1998
price index). However, an amount of Rs. 92.20 crores was sanctioned and released.
Chapter 1: Introduction
National Environmental Engineering Research Institute
1. 5
Fig. 1.1: Location of Gokul Barrage on River Yamuna in Mathura
Chapter 1: Introduction
National Environmental Engineering Research Institute
1. 6
Table 1.1
Major Specification of Gokul Barrage Project
Item Specification
Design flood discharge, million cubic meters per day 820.8
Design high flood level, m 168.55
Storage gross , million cubic meters (MCM) 23 .94
Storage net, MCM 16.06
Water ways
Lacey’s water way, m 463.00
Total water way, m 435.5
Number of piers 21
Number of abutments 2
Average bed of river, m 160
Crest level of barrage m 160.90
Gates, Nos. 22
Free board, m 0.30
Top level of gate 165.30
Bridge
Reduced level of top of road 172.00
Width of road, m 15.00
Chapter 1: Introduction
National Environmental Engineering Research Institute
1. 7
Exhibit 1.1: Gokul Barrage on Yamuna River
About storm water drainage system in Agra
Agra city is a class I city since 1901 and rapid growth of the city was experienced
during the period 1991-2001. Agra is situated on the right bank of River Yamuna 200 km
down stream of Delhi covering an area of around 148 km2. The main part of the city is on the
western side of Yamuna (Cis-Yamuna) and has also spread on the eastern side of the river
(Trans-Yamuna area).
Geologically, the entire city area is underlain by alluvium deposits and it forms a
part of the Indo-Gangetic alluvium, comprising of gravel, sand, silt and clay in various
proportions and highly pervious to infiltration. The recent deposits are present all along the
Yamuna river bank.
Prior to urbanization, the city catchment areas had more open space than the built
up area with substantial absorption of water into soil during monsoon. Growth of the city in
the last two decades resulted in an abnormal increase in built up area and imperviousness,
increasing the inflow of rainwater into the storm water drains during rainy season. The
average annual precipitation of the city is 686 mm (Drainage Master Plan for Agra city,
UPJN). Maximum precipitation (90%) is during the monsoon season from July to September
and the remaining ten percent during winter rains. The town does not have a proper storm
water drainage network, some low-lying areas of the city including residential and
commercial places flood during the monsoon remaining water logged for a long period. As

Chapter 1: Introduction
National Environmental Engineering Research Institute
1. 8
the city is situated on the bank of river Yamuna, the storm water of the town finally
discharges into the river.
The existing storm water drains of Agra city are very old and were constructed
half a century ago. Presently, the storm water drainage systems are constructed by the UP
Jal Nigam (UPJN), while Agra Nagar Nigam (ANN) undertakes the task of maintaining the
storm water drains in the city. Storm water drains in the city are annually desilted and
cleaned as claimed by the ANN. An amount of Rs. 6.60 crore was approved towards
construction and maintenance of the storm water drains in Agra.
About Solid waste management in Agra
As per 2001 census, total population of Agra was 12, 75,135. As per the data provided by
Agra Municipal Corporation, the present population is about 15 lakh. Total area of Agra city is
about 140 sq. km. For solid waste management, the whole Agra city has been divided into 19
zones. At present, Additional Health Officer is responsible for solid waste management
activities. He is assisted by Chief Sanitary Inspectors, Sanitary Inspectors, Zonal Sanitary
Officers and Supervisors. About 2750 staff is engaged for the collection municipal solid
waste (MSW) including sweeping and other sanitation works. About 650-710 tonnes of MSW
are generated per day in Agra. The MSW contains biodegradables like leaves, vegetable,
fruits, kitchen waste etc. About 43-46% of biodegradables have been reported in the MSW of
Agra. Besides, MSW also contains recyclables like glass, paper, metal and plastics.
At present, mainly community bin collection system is used for collection of MSW in Agra.
The type of bins used in Agra is mainly RCC and dumper placer bins. Besides, there are a
number of roadside dumps spread all over the city. For primary collection of wastes,
handcarts, wheel barrows and tricycles are used. Vehicles used for transportation of waste
from collection point to disposal site are mainly ordinary trucks, tipper trucks, tractor and
trailer, dumper placer and autotype vehicles.
At present, sanitary landfill is not available at Agra. Only indiscriminate dumping of MSW is
carried out at specific locations. Composting of MSW is done only at a small scale level.
CChhaapptteerr 22
OObbjjeeccttiivveess aanndd TThheeiirr
AAttttaaiinnmmeennttss
The overall objectives of the post evaluation studies were:
• To see improvement in environmental quality on the environs of Taj Mahal and
other historical monuments
• To provide tangible/ quantifiable benefits of the 8 completed projects
• To provide clear cut directions on taking up new projects as consideration of the
new projects in the TTZ was linked to the outcome of the post-evaluation report.
2.1 For Electricity related Projects
(Source: Respective Project Reports collected from respective State Government Departments)
Project No. 1: Improvement in Electric Supply at Agra: 9.11 Crore
Chapter 2: Objectives and their Attainments
National Environmental Engineering Research Institute
2. 2
Project No. 7: Improvement in Electric Supply in and around the rural areas of Agra and
Fatehpur Sikri: 39.09 Crore
Objectives
The following were the objectives of the above two schemes related to electric supply
as noted from the DPR (detailed project report) of “Taj Trapezium Yojna” of
Rs 39.09 Crores and 9.11 Crores, U P Power Corporation Ltd. Agra Region, Agra:
“Experts are of the opinion that the smoke belching from the coal/diesel oil fired
industries and diesel operated water pumping sets in the vicinity of Taj Mahal located in Taj
Trapezium Zone is a potential threat to environment and elegance of Taj Mahal and other
historic monuments in and around Agra for which our country is proud of. To prevent the
elegance of these monuments and make smoke free atmosphere in TTZ area, this scheme
was proposed and presented to State Govt. for funding of the creation of infrastructure and
its maintenance afterwards. The above scheme was mainly the social welfare scheme; the
society will be benefited from the implementation of the scheme”.
The following were targeted to achieve the above objectives:
1 Electrification of 754 nos. of unelectrified, codified villages in the area and
electrification of 95 numbers of slum colonies/villages in Agra Municipal area.
2 To reduce the voltage drop at the sub-station and feeders.
3 To supply electricity for at least 14 hrs. per day in the rural areas
4 To energize the private tube wells/state tube wells over agricultural development
5 To give electric connections to the rural people for lighting their houses and develop
cottage industries
Attainment
Implementation of the above projects has helped improving overall quality of life of
the rural population around Agra and Fatehpur Sikri. This has also resulted in reduction in
use of diesel generators in Agra city and in rural area for agriculture which were causing
pollution in the TTZ, thereby improvement of air quality due to reduced emissions.

Chapter 2: Objectives and their Attainments
National Environmental Engineering Research Institute
2. 3
The impact of the implementation of above projects in improving the ambient air
quality is apparent from the Figs. 1-3 (Chapter 4) wherein it can be seen that the ambient air
concentration of acid forming gases, SO2 and NO2 was substantially reduced in the year
2000. A 27-41 % reduction in ambient SPM concentration, 70-82% reduction in concentration
of ambient SO2 and 46-74% reduction in concentration of ambient NO2 was seen during 200-
2-03 in comparison to 1996-98 levels. There is, however, an increasing tendency of these
gases from 2001 onwards in ambient air. Also the rain water pH data for the year 2008 as in
Table below suggests the pH is near neutral.
(Source: CPCB, New Delhi)
Table Showing Neutralization Ratio of Rain Water at Agra-2008
Months pH Conductivity (µmhos/cm)
Sum of Cations (Eq. wt)
Sum of Anions (Eq. wt)
NR=Neutralization Ratio of
Cations & Anions
7.07 100.0 0.8954 0.5303 1.7
May 6.78 40.6 0.3558 0.1629 2.2
7.29 68.2 0.9216 0.3586 2.6
7.60 76.0 0.9844 0.2108 4.7
June 7.32 133.1 1.4781 1.0957 1.3
7.31 46.7 0.6527 0.2898 2.3
7.23 44.2 0.9216 0.2450 3.8
7.34 47.5 0.4285 0.2530 1.7
July 7.23 35.3 2.0773 0.1809 11.5
August 7.28 46.7 0.4962 0.1822 2.7
2.2 For Road related Projects
Project No. 3: Widening of Agra By-Pass: 00.75 Crore
Chapter 2: Objectives and their Attainments
National Environmental Engineering Research Institute
2. 4
Project No. 6: Construction of one part of Agra by-Pass: 10.65 Crore
Project No. 8: Improvement of Master Plan of Roads of Agra City: 21.22 Crore
Objectives
As noted from the U. P. P.W.D. (Lok Nirman Vibhag, Agra) project report, the
objectives of the implementation of the above three projects were protecting the TTZ from
environmental pollution and bringing out overall development from the angle of tourism.
Widening of canalpatri road and construction of road parallel to the existing canal
Patri road, and construction of missing links in the master plan roads of Agra city were
targeted.
Attainment
With the implementation of the above three projects, there will be vehicular
decongestion on the TTZ roads thereby reducing air pollution emissions in the TTZ. The well-
built and maintained rods in the Agra city will result in overall positive impact on the tourists
visiting Agra.
2.3 For Gokul Barrage
Project No. 2: Gokul Barrage
Objectives
The major objectives of the project were to augment water supply in Agra Mathura
and Vrindavan. Other objectives include increase ground water table in the area and reduce
salinity levels.
Attainment
Construction of the barrage on Yamuna River has bought mixed results to the public
and environment at large. Since the completion of the project on 2001, the downstream
discharge was maintained between 421 and 3925 cumecs (Table 2.1) depending on the post
monsoon storage levels. Presently around 30 cusec (73.5 MLD) and 115 cusec (282 MLD) is
supplied at Mathura and Agra. Based on the data provided by the UP Jal Nigam, the ground
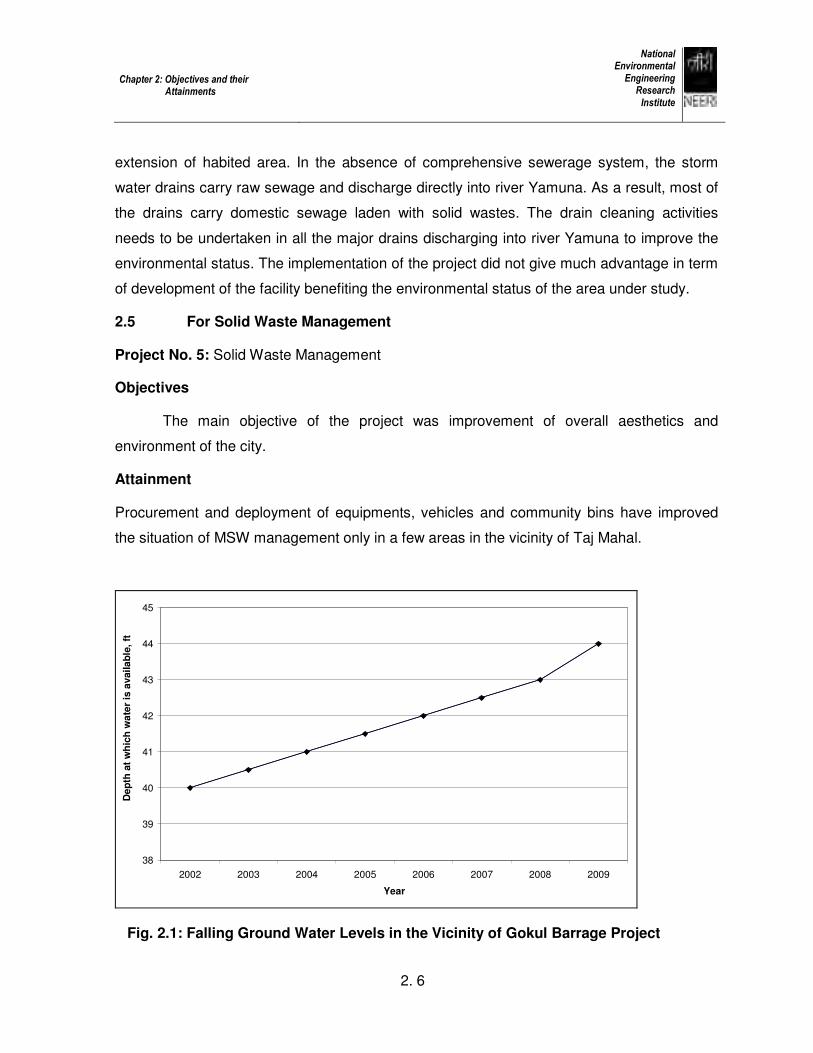
water levels have fallen over the years between 2003 and 2009 (Fig. 2.1).
Chapter 2: Objectives and their Attainments
National Environmental Engineering Research Institute
2. 5
• The quality of impounded water of the barrage with respect to dissolved oxygen
meets the CPCB classification D for propagation wild life and fisheries in inland
surface water Standards, however failed to meet the BOD parameter. Large-scale
growth of water hyacinth was also found in the river at the Gokul barrage in
Mathura.
• The TDS concentration in the ground water samples from the near by areas
indicated concentrations in the range 777-1664 mg/l. However, the TDS
concentration of the ground water collected from hand pumps was considerably
higher in downstream vis-à-vis upstream quality. Some hand pumps water quality
does not meet the CPCB classification E (Irrigation, Industrial cooling and
controlled disposal) of water quality for conductivity.
• The surrounding area near the barrage has increased vegetative cover due to
availability of water.
• Construction of a four lane road on the barrage with foot path on both sides has
resulted in partial reduction of traffic in Mathura due to diversion of vehicles
through the barrage, reducing waiting times since project implementation
2.4 For Storm Water Drainage
Project No. 4: Storm Water Drainage System (Agra)
Objectives
The main objective of the project was improvement of overall aesthetics and
environment of the city.
Attainment
These drains are not functioning properly due to silting and accumulation of solid
waste, which are not cleaned regularly by the authorities. There is no arrangement at outfall
locations of drains/nallas for arresting the solid waste, which is finding its way finally into the
river Yamuna. Also, the outfalls of the drains are not provided with control structure to avoid
back flow from the river. Out of total area of 8360 hectares of agriculture land, only 1400
hectares has sewerage system. This is inadequate due to increase in population and
Chapter 2: Objectives and their Attainments
National Environmental Engineering Research Institute
2. 6
extension of habited area. In the absence of comprehensive sewerage system, the storm
water drains carry raw sewage and discharge directly into river Yamuna. As a result, most of
the drains carry domestic sewage laden with solid wastes. The drain cleaning activities
needs to be undertaken in all the major drains discharging into river Yamuna to improve the
environmental status. The implementation of the project did not give much advantage in term
of development of the facility benefiting the environmental status of the area under study.
2.5 For Solid Waste Management
Project No. 5: Solid Waste Management
Objectives
The main objective of the project was improvement of overall aesthetics and
environment of the city.
Attainment
Procurement and deployment of equipments, vehicles and community bins have improved
the situation of MSW management only in a few areas in the vicinity of Taj Mahal.
38
39
40
41
42
43
44
45
2002 2003 2004 2005 2006 2007 2008 2009
Year
De
pth
at
wh
ich
wa
ter
is a
vail
ab
le,
ft
Fig. 2.1: Falling Ground Water Levels in the Vicinity of Gokul Barrage Project
Chapter 2: Objectives and their Attainments
National Environmental Engineering Research Institute
2. 7
Table 2.1
Storage and Discharge from the Barrage
Years High Flood Level
(m)
Storage Capacity
(MCM)
Discharge from the
Barrage (cumecs)
18-09-02 163.95 13. 22 3925.5
08-08-03 163.4 9. 57 3143.5
29-08-04 162.9 6.61 421.5
09-09-05 163.0 7.20 707.16
13-08-06 163.5 10 .16 486.46
18-08-07 163.4 9.57 576.42
23-08-08 164.5 13.72 2045.1
Design HFL max.-
168.55
Gross storage - 23 .94
Design flood discharge -
9500
MCM - million cubic meters, cumecs - cubic meters per second, m – meter
Chapter 2: Objectives and their Attainments
National Environmental Engineering Research Institute
2. 8
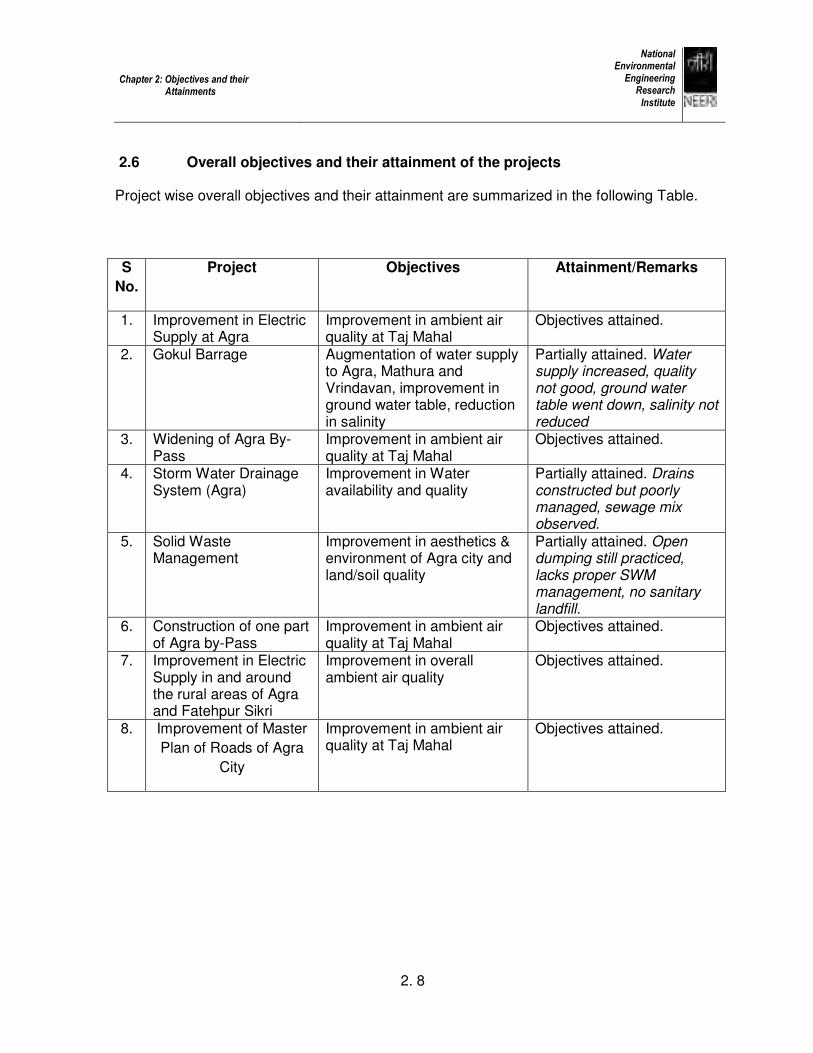
2.6 Overall objectives and their attainment of the projects
Project wise overall objectives and their attainment are summarized in the following Table.
S
No.
Project Objectives Attainment/Remarks
1. Improvement in Electric Supply at Agra
Improvement in ambient air quality at Taj Mahal
Objectives attained.
2. Gokul Barrage Augmentation of water supply to Agra, Mathura and Vrindavan, improvement in ground water table, reduction in salinity
Partially attained. Water supply increased, quality not good, ground water table went down, salinity not reduced
3. Widening of Agra By-Pass
Improvement in ambient air quality at Taj Mahal
Objectives attained.
4. Storm Water Drainage System (Agra)
Improvement in Water availability and quality
Partially attained. Drains constructed but poorly managed, sewage mix observed.
5. Solid Waste Management
Improvement in aesthetics & environment of Agra city and land/soil quality
Partially attained. Open dumping still practiced, lacks proper SWM management, no sanitary landfill.
6. Construction of one part of Agra by-Pass
Improvement in ambient air quality at Taj Mahal
Objectives attained.
7. Improvement in Electric Supply in and around the rural areas of Agra and Fatehpur Sikri
Improvement in overall ambient air quality
Objectives attained.
8. Improvement of Master
Plan of Roads of Agra
City
Improvement in ambient air quality at Taj Mahal
Objectives attained.
CChhaapptteerr 33
MMeetthhooddoollooggyy
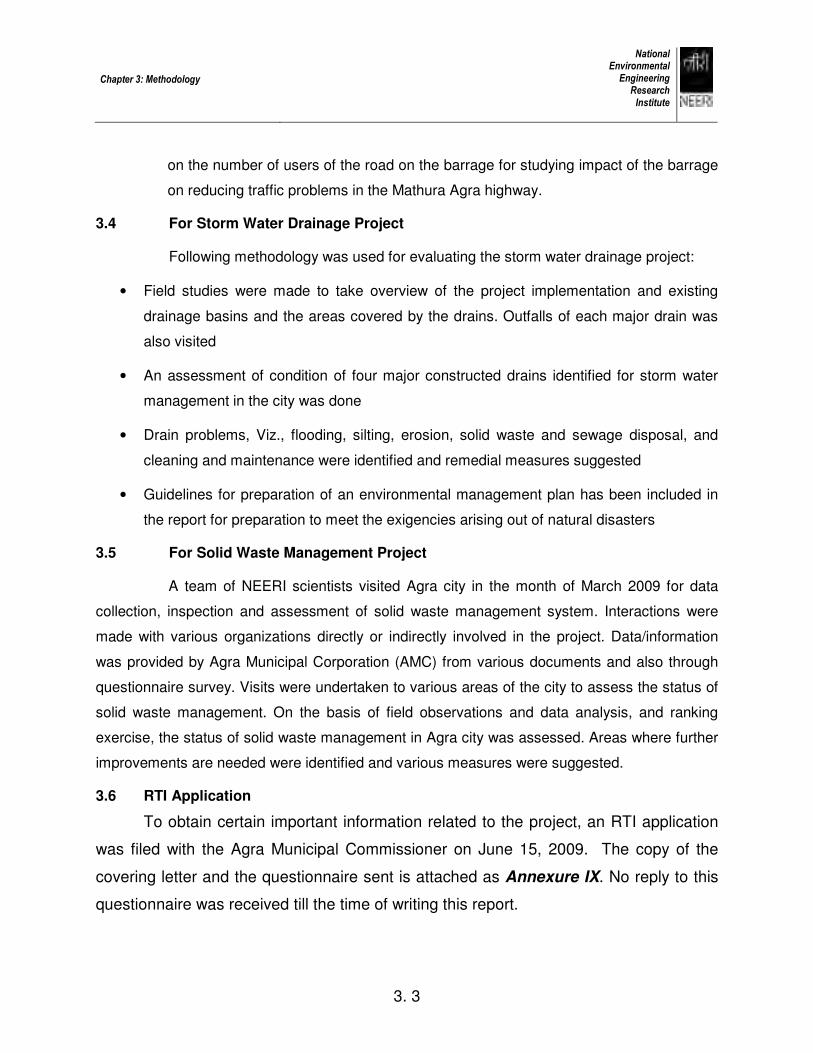
For Projects related to Improvement in Air quality
Improvement in air environment due to implementation of a project can be assessed
in terms of reduction in emissions due to envisaged activities in the project. The reduction in
emissions in an area obviously improves air quality of the area. The impact of emission
reduction on air quality can be assessed either through dispersion modeling or through actual
ambient air quality monitoring. The air dispersion modelling requires extensive data on the
sources and knowledge of micrometeorology of the area and therefore beyond the scope of this
report. In this report the reduction in emissions have been calculated and annual mean
concentrations of ambient air quality parameters have also been reported from the secondary
data. While calculating emission reductions certain assumptions have been made where
required data was not available. The assumptions made are listed below:
3.1 For Electricity related Projects
Since the detail information (numbers, capacity, operating hours, fuel consumption,
location etc) on the diesel generator sets used in the different areas of the TTZ before and after
the project is not available, it was assumed that the capacity expansion is equivalent to the DG

Chapter 3: Methodology
National Environmental Engineering Research Institute
3. 2
sets use. AP-42 emission factors for the DG sets (Table 3.1) were considered for the calculation
of emissions.
3.2 For Road related Projects
i. Since the data on vehicle movements on the different roads in TTZ during the project
period (1998-2002) is not available, all calculations regarding road projects have
been made per 100 vehicles mix according to the Table 3.2.
ii. The speed of the vehicles before the implementation of the project is assumed to be
10-15 Km/h and, after the project implementation, the speed is assumed 40-50
Km/h. The emission factors have been adjusted accordingly for vehicle speed as
given in Table 3.3.
iii. Emission factors considered as per the draft report on “Emission Factor
development for Indian Vehicles“, as a part of Ambient Air Quality Monitoring and
Emission Source Apportionment Studies by ARAI, Pune (Table 3.4).
iv. For calculating reduction in impact on Taj Mahal due to construction of bypass at 2
and 4 Km away for allowing the vehicular traffic to change between Shamsabad and
Fatehabad roads without going 500 m near the Taj for the change, we have taken
the help of USEPA Line source model CALINE4. We have predicted the pollutant
concentration at 500 m, 2 Km and 4 Km for the 100/125’ wide road with the 100
vehicles per hour. A short write up on the model CALINE4 is appended as
Annexure-I.
3.3 For Gokul Barrage Project
Assessment was carried by obtaining details on the status of the project. The major
objectives included improved water quantity and quality in the region to meet the
potable water requirements of the region. Therefore water samples were collected
from the barrage upstream and downstream and analyzed for assessing the quality
of water from the barrage. Ground water samples were also collected and analyzed
for assessing ground water quality near the barrage. Secondary data was collected
Chapter 3: Methodology
National Environmental Engineering Research Institute
3. 3
on the number of users of the road on the barrage for studying impact of the barrage
on reducing traffic problems in the Mathura Agra highway.
3.4 For Storm Water Drainage Project
Following methodology was used for evaluating the storm water drainage project:
• Field studies were made to take overview of the project implementation and existing
drainage basins and the areas covered by the drains. Outfalls of each major drain was
also visited
• An assessment of condition of four major constructed drains identified for storm water
management in the city was done
• Drain problems, Viz., flooding, silting, erosion, solid waste and sewage disposal, and
cleaning and maintenance were identified and remedial measures suggested
• Guidelines for preparation of an environmental management plan has been included in
the report for preparation to meet the exigencies arising out of natural disasters
3.5 For Solid Waste Management Project
A team of NEERI scientists visited Agra city in the month of March 2009 for data
collection, inspection and assessment of solid waste management system. Interactions were
made with various organizations directly or indirectly involved in the project. Data/information
was provided by Agra Municipal Corporation (AMC) from various documents and also through
questionnaire survey. Visits were undertaken to various areas of the city to assess the status of
solid waste management. On the basis of field observations and data analysis, and ranking
exercise, the status of solid waste management in Agra city was assessed. Areas where further
improvements are needed were identified and various measures were suggested.
3.6 RTI Application
To obtain certain important information related to the project, an RTI application
was filed with the Agra Municipal Commissioner on June 15, 2009. The copy of the
covering letter and the questionnaire sent is attached as Annexure IX. No reply to this
questionnaire was received till the time of writing this report.
Chapter 3: Methodology
National Environmental Engineering Research Institute
3. 4
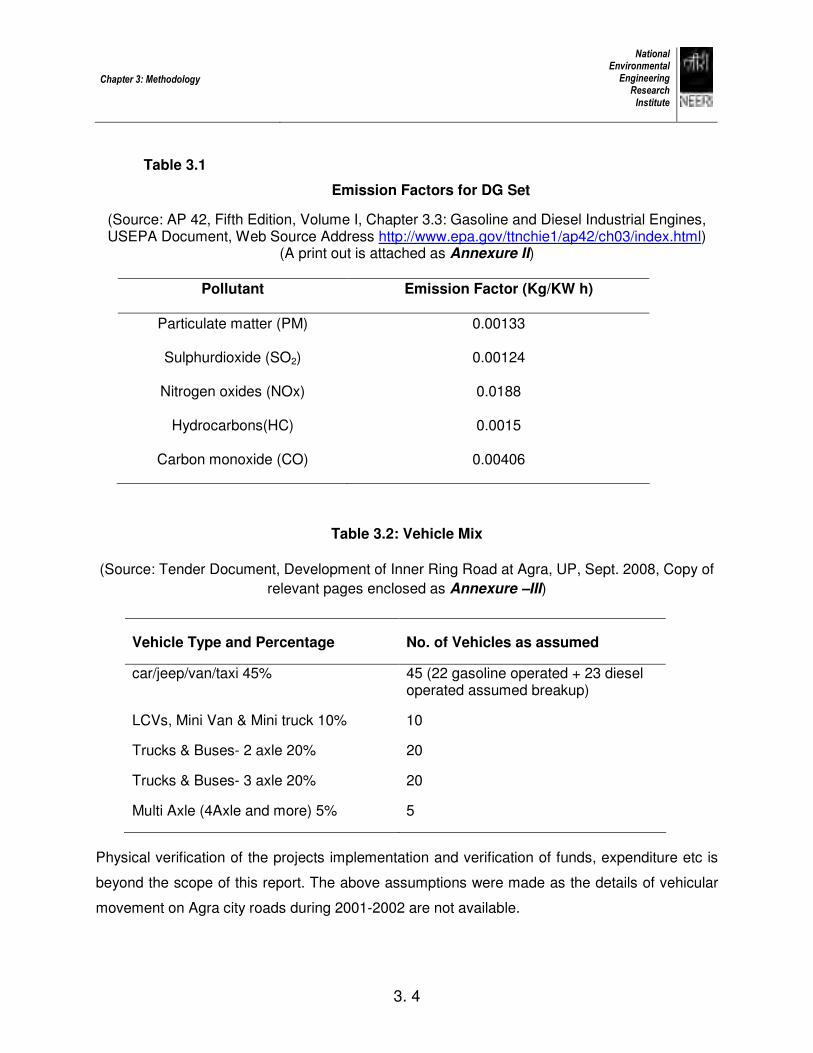
Table 3.1
Emission Factors for DG Set
(Source: AP 42, Fifth Edition, Volume I, Chapter 3.3: Gasoline and Diesel Industrial Engines, USEPA Document, Web Source Address http://www.epa.gov/ttnchie1/ap42/ch03/index.html)
(A print out is attached as Annexure II)
Pollutant Emission Factor (Kg/KW h)
Particulate matter (PM) 0.00133
Sulphurdioxide (SO2) 0.00124
Nitrogen oxides (NOx) 0.0188
Hydrocarbons(HC) 0.0015
Carbon monoxide (CO) 0.00406
Table 3.2: Vehicle Mix
(Source: Tender Document, Development of Inner Ring Road at Agra, UP, Sept. 2008, Copy of
relevant pages enclosed as Annexure –III)
Vehicle Type and Percentage No. of Vehicles as assumed
car/jeep/van/taxi 45% 45 (22 gasoline operated + 23 diesel operated assumed breakup)
LCVs, Mini Van & Mini truck 10% 10
Trucks & Buses- 2 axle 20% 20
Trucks & Buses- 3 axle 20% 20
Multi Axle (4Axle and more) 5% 5
Physical verification of the projects implementation and verification of funds, expenditure etc is
beyond the scope of this report. The above assumptions were made as the details of vehicular
movement on Agra city roads during 2001-2002 are not available.
Chapter 3: Methodology
National Environmental Engineering Research Institute
3. 5
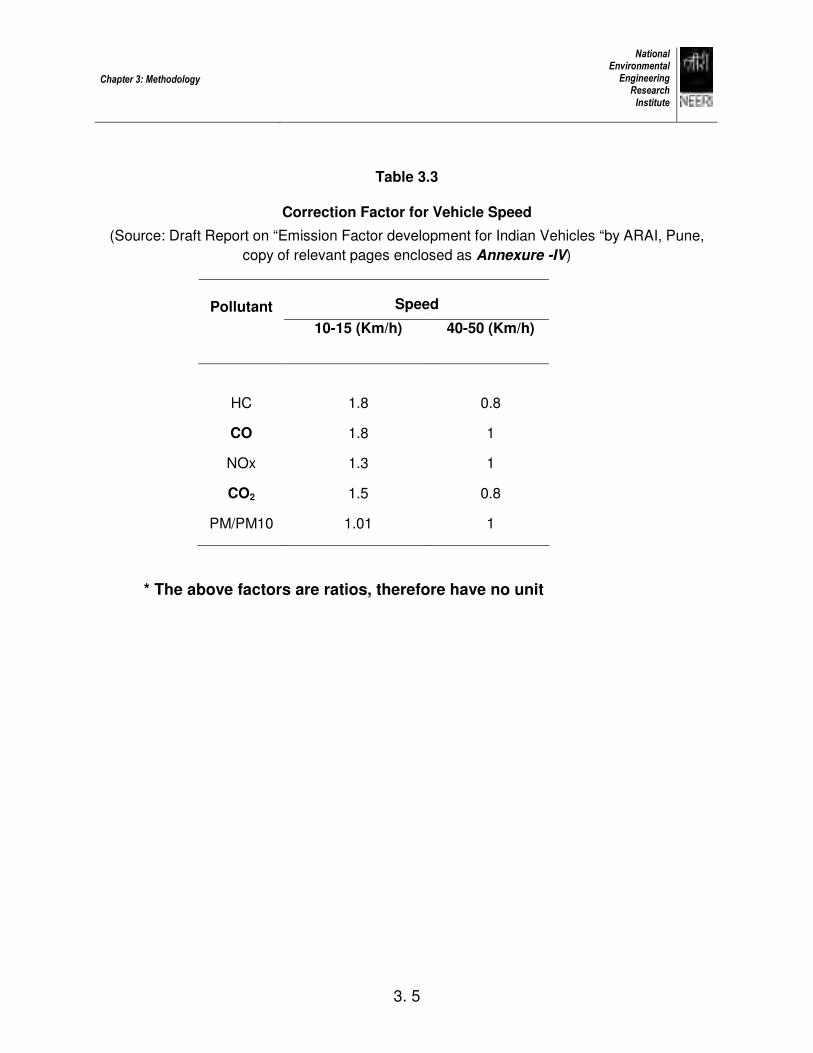
Table 3.3
Correction Factor for Vehicle Speed
(Source: Draft Report on “Emission Factor development for Indian Vehicles “by ARAI, Pune,
copy of relevant pages enclosed as Annexure -IV)
Speed
Pollutant
10-15 (Km/h) 40-50 (Km/h)
HC 1.8 0.8
CO 1.8 1
NOx 1.3 1
CO2 1.5 0.8
PM/PM10 1.01 1
* The above factors are ratios, therefore have no unit
Chapter 3: Methodology
National Environmental Engineering Research Institute
3. 6
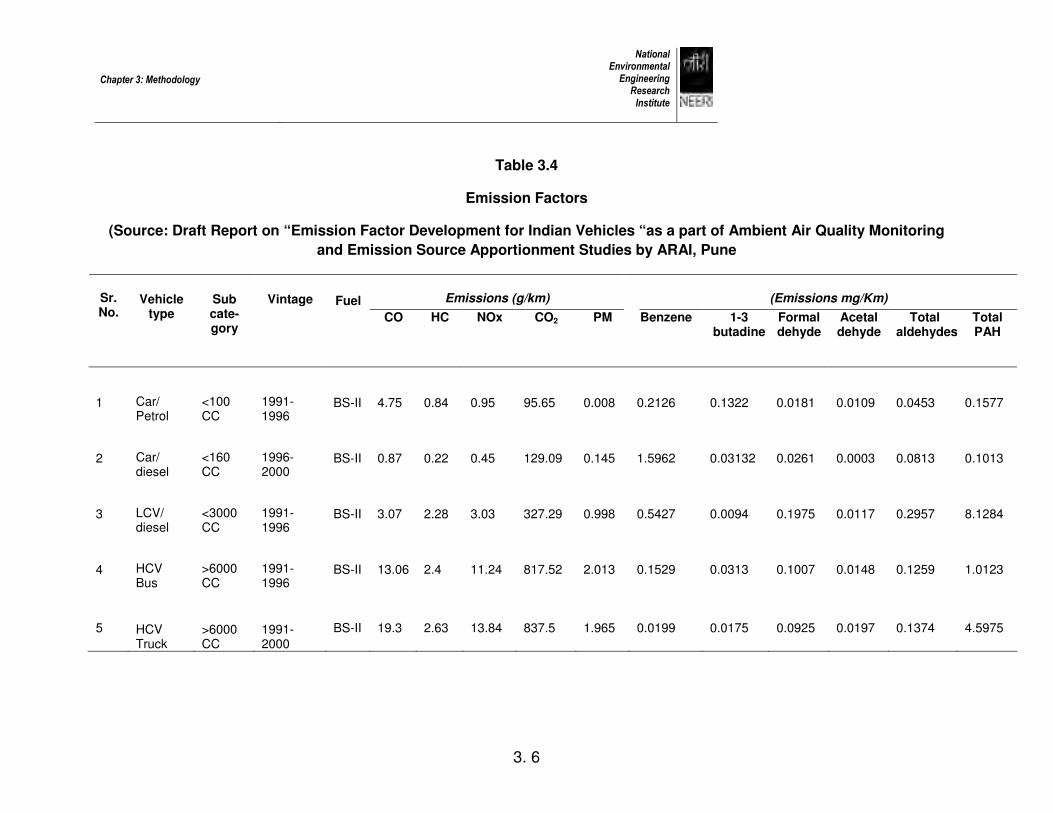
Table 3.4
Emission Factors
(Source: Draft Report on “Emission Factor Development for Indian Vehicles “as a part of Ambient Air Quality Monitoring
and Emission Source Apportionment Studies by ARAI, Pune
Emissions (g/km) (Emissions mg/Km)
Sr. No.
Vehicle type
Sub cate-gory
Vintage
Fuel
CO HC NOx CO2 PM Benzene 1-3 butadine
Formaldehyde
Acetaldehyde
Total aldehydess
Total PAH
1 Car/ Petrol
<100 CC
1991-1996
BS-II 4.75 0.84 0.95 95.65 0.008 0.2126 0.1322 0.0181 0.0109 0.0453 0.1577
2 Car/ diesel
<160 CC
1996-2000
BS-II 0.87 0.22 0.45 129.09 0.145 1.5962 0.03132 0.0261 0.0003 0.0813 0.1013
3 LCV/ diesel
<3000 CC
1991-1996
BS-II 3.07 2.28 3.03 327.29 0.998 0.5427 0.0094 0.1975 0.0117 0.2957 8.1284
4 HCV Bus
>6000 CC
1991-1996
BS-II 13.06 2.4 11.24 817.52 2.013 0.1529 0.0313 0.1007 0.0148 0.1259 1.0123
5 HCV Truck
>6000 CC
1991-2000
BS-II 19.3 2.63 13.84 837.5 1.965 0.0199 0.0175 0.0925 0.0197 0.1374 4.5975

CChhaapptteerr 44
PPoosstt PPrroojjeecctt
EEnnvviirroonnmmeennttaall
EEvvaalluuaattiioonn
4.1 Projects related to “Improvement in Electric Supply at Agra”
Project 1: Improvement in electric supply at Agra-II (Rs. 9.11 Crore)
Source: DPR of Rs. 9.11 Cr. Scheme of TTZ (Scheme for environment
improvement in Taj-Trapezium Area), dated 3 April 2006 by Electricity transmission
Circle, Power Corporation Ltd, 64 Khamba, Bypass Road, Agra - 282007
Electric supply capacity before the scheme (available power) = 615 MVA
Electric supply capacity after the scheme (available power) = 615+315 =
930 MVA
The scheme was completed in August 2001

Chapter 4: Post project Environmental Evaluation
National Environmental Engineering Research Institute
4. 2
It is stated that the demand load was more or less the same. Therefore, it was
assumed that equivalent power was being generated by DG sets.
Assumption 1.
Assuming 30% transmission losses, available power at
consumer end = 70% of 315 MVA= 220.5 MVA
Assumption 2.
220.5 MVA= 220.5x0.8 MW=176.4 MW = 176400 KW
220.5 MVA worth of power was being generated by using DG
sets
Emission reduction for pollutant type i (Kg/h) = (emission factor
for pollutant i (in Kg/KW h) x (Additional power available in KW)
Assumption 3. AP-42 emission factors Kg per KW/h generation
Pollutant Emission factor
(Kg/KW h)
Emission
reduction
(Kg/h)
Particulate matter (PM) 0.00133 234.612
Sulphurdioxide (SO2) 0.00124 218.736
Nitrogen oxides (NOx) 0.0188 3316.320
Hydrocarbons(HC) 0.0015 264.600
Carbon monoxide (CO) 0.00406 716.184
It is stated in the project report that the power was being rostered for 2 to
3 hours a day before implementation of the above project and that on completion of the
project the demand load was more or less the same thereby fulfilling the requirement. It
can, therefore, be stated that with the implementation of the above project, the PM, SO2,
NOx, HC and CO emissions in Agra had reduced by 234.61, 218.736, 3316.320, 264.600
and 716.184 Kg/h respectively.

Chapter 4: Post project Environmental Evaluation
National Environmental Engineering Research Institute
4. 3
Project 7: Improvement in Electric Supply in & around the Rural Areas of
Agra & Fatehpur Sikri (Rs 39.09 Crore)
Source: DPR of Rs. 9.11 Cr. Scheme of TTZ (Scheme for environment
improvement in Taj-Trapezium Area) dated 3 April 2006 by Electricity transmission Circle,
Power Corporation Ltd, 64 Khamba, Bypass Road, Agra 282007
Following were envisaged under the scheme:
1. A New substation of 132/33 KV at Bodla (40 MVA)
2. Enhancement of transmission capacity of 132/33 KV substation at Bah (20 MVA)
3. Enhancement of transmission capacity of 132/33 KV substation at Gokul (40 MVA)
4. Enhancement of transmission capacity of 132/33 KV substation at Shamsabad Road (20 MVA)
5. Rural electrification in 85 villages
The scheme added 120 MVA power capacity
Assumption 1.
30% transmission losses, the incremental power available at the
consumer end
is 70% of 120 MVA = 84 MVA = 84x0.8 MW=67.2 MW=67200 KW
Assumption 2. 67200 KW power was being generated by using DG sets pre day
Assumption 3: AP-42 emission factors Kg/ KW h generation
Total Emission reduced by implementing the above 39.09 Crore Scheme
Pollutant
Emission Factor
(Kg/KW h)
Emission Reduction
(Kg/h)
Particulate matter (PM) 0.00133 89.376
Sulphurdioxide (SO2) 0.00124 83.328
Nitrogen oxides (NOx) 0.0188 1263.36
Hydrocarbons (HC) 0.0015 100.8
Carbon monoxide (CO) 0.00406 272.832
Chapter 4: Post project Environmental Evaluation
National Environmental Engineering Research Institute
4. 4
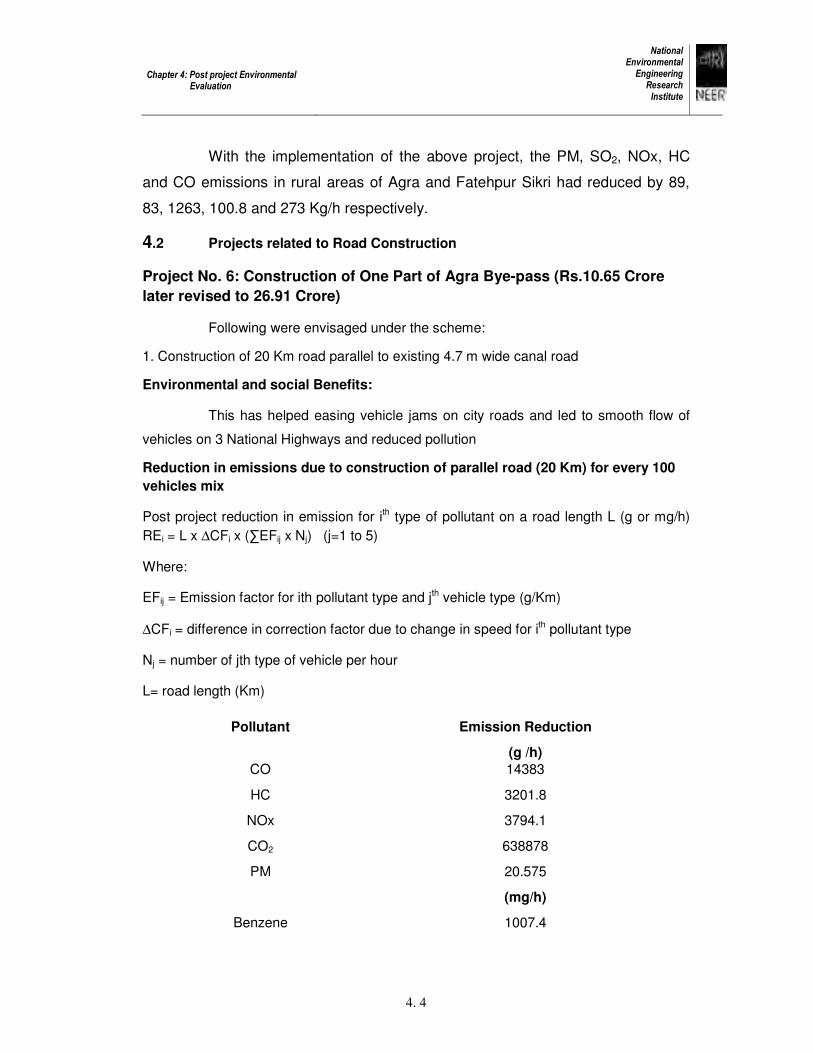
With the implementation of the above project, the PM, SO2, NOx, HC
and CO emissions in rural areas of Agra and Fatehpur Sikri had reduced by 89,
83, 1263, 100.8 and 273 Kg/h respectively.
4.2 Projects related to Road Construction
Project No. 6: Construction of One Part of Agra Bye-pass (Rs.10.65 Crore
later revised to 26.91 Crore)
Following were envisaged under the scheme:
1. Construction of 20 Km road parallel to existing 4.7 m wide canal road
Environmental and social Benefits:
This has helped easing vehicle jams on city roads and led to smooth flow of
vehicles on 3 National Highways and reduced pollution
Reduction in emissions due to construction of parallel road (20 Km) for every 100
vehicles mix
Post project reduction in emission for ith type of pollutant on a road length L (g or mg/h)
REi = L x ∆CFi x (∑EFij x Nj) (j=1 to 5)
Where:
EFij = Emission factor for ith pollutant type and jth vehicle type (g/Km)
∆CFi = difference in correction factor due to change in speed for ith pollutant type
Nj = number of jth type of vehicle per hour
L= road length (Km)
Pollutant Emission Reduction
(g /h)
CO 14383
HC 3201.8
NOx 3794.1
CO2 638878
PM 20.575
(mg/h)
Benzene 1007.4

Chapter 4: Post project Environmental Evaluation
National Environmental Engineering Research Institute
4. 5
1-3 butadine 95.725
Formaldehyde 146
Acetaldehyde 23.044
Total aldehydes 235.53
Total PAH 4445.3
The above project has resulted in the reduction of pollutant emissions; CO,
HC, NOx, CO2 and PM by 14.4, 3.2, 3.8, 639 and 0.02 Kg/h respectively and other
hydrocarbons, benzene, 1-3 butadine, formaldehyde, total aldehydes and total PAH by
1007, 96, 146, 23, 235 and 4445 mg/h respectively considering 100 vehicle mix per hour
on the road.
Project No. 3: Widening of Agra Bye-pass (Rs. 0.75 Crore)
Canal patri road 19.9 Km long, to be widened from existing 3.72 m to 4.72m
Status: Completed (length=19.9 Km)
Post project reduction in emission for ith type of pollutant on a road length L (g or mg/h)
REi = L x ∆CFi x (∑ EFij x Nj) (j=1 to 5)
Where
EFij = Emission factor for ith pollutant type and jth vehicle type (g/Km)
∆CFi = difference in correction factor due to change in speed for ith pollutant type
Nj = number of jth type of vehicle per hour
L= road length (Km)
Pollutant Emission reduction
(g /h )
CO 14310.6
HC 2548.6
NOx 10067.0
CO2 726495.9
PM 1637.8
(mg/h)
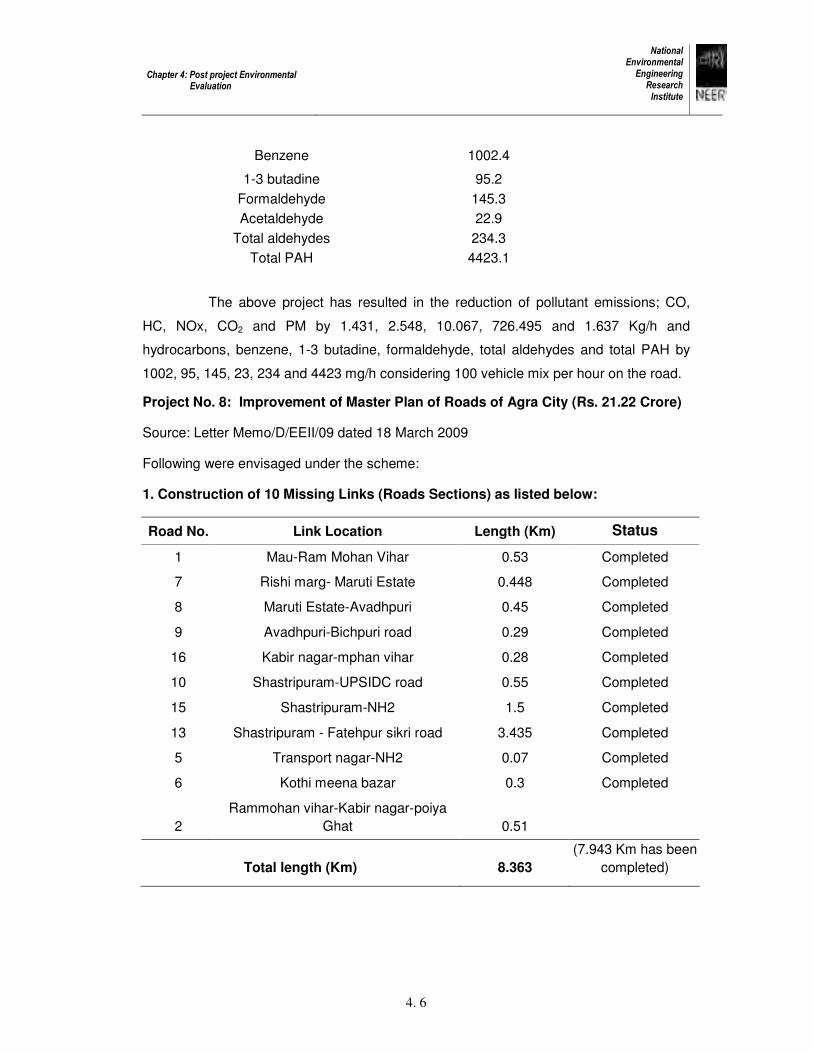
Chapter 4: Post project Environmental Evaluation
National Environmental Engineering Research Institute
4. 6
Benzene 1002.4
1-3 butadine 95.2
Formaldehyde 145.3
Acetaldehyde 22.9
Total aldehydes 234.3
Total PAH 4423.1
The above project has resulted in the reduction of pollutant emissions; CO,
HC, NOx, CO2 and PM by 1.431, 2.548, 10.067, 726.495 and 1.637 Kg/h and
hydrocarbons, benzene, 1-3 butadine, formaldehyde, total aldehydes and total PAH by
1002, 95, 145, 23, 234 and 4423 mg/h considering 100 vehicle mix per hour on the road.
Project No. 8: Improvement of Master Plan of Roads of Agra City (Rs. 21.22 Crore)
Source: Letter Memo/D/EEII/09 dated 18 March 2009
Following were envisaged under the scheme:
1. Construction of 10 Missing Links (Roads Sections) as listed below:
Road No. Link Location Length (Km) Status
1 Mau-Ram Mohan Vihar 0.53 Completed
7 Rishi marg- Maruti Estate 0.448 Completed
8 Maruti Estate-Avadhpuri 0.45 Completed
9 Avadhpuri-Bichpuri road 0.29 Completed
16 Kabir nagar-mphan vihar 0.28 Completed
10 Shastripuram-UPSIDC road 0.55 Completed
15 Shastripuram-NH2 1.5 Completed
13 Shastripuram - Fatehpur sikri road 3.435 Completed
5 Transport nagar-NH2 0.07 Completed
6 Kothi meena bazar 0.3 Completed
2
Rammohan vihar-Kabir nagar-poiya
Ghat 0.51
Total length (Km) 8.363
(7.943 Km has been
completed)
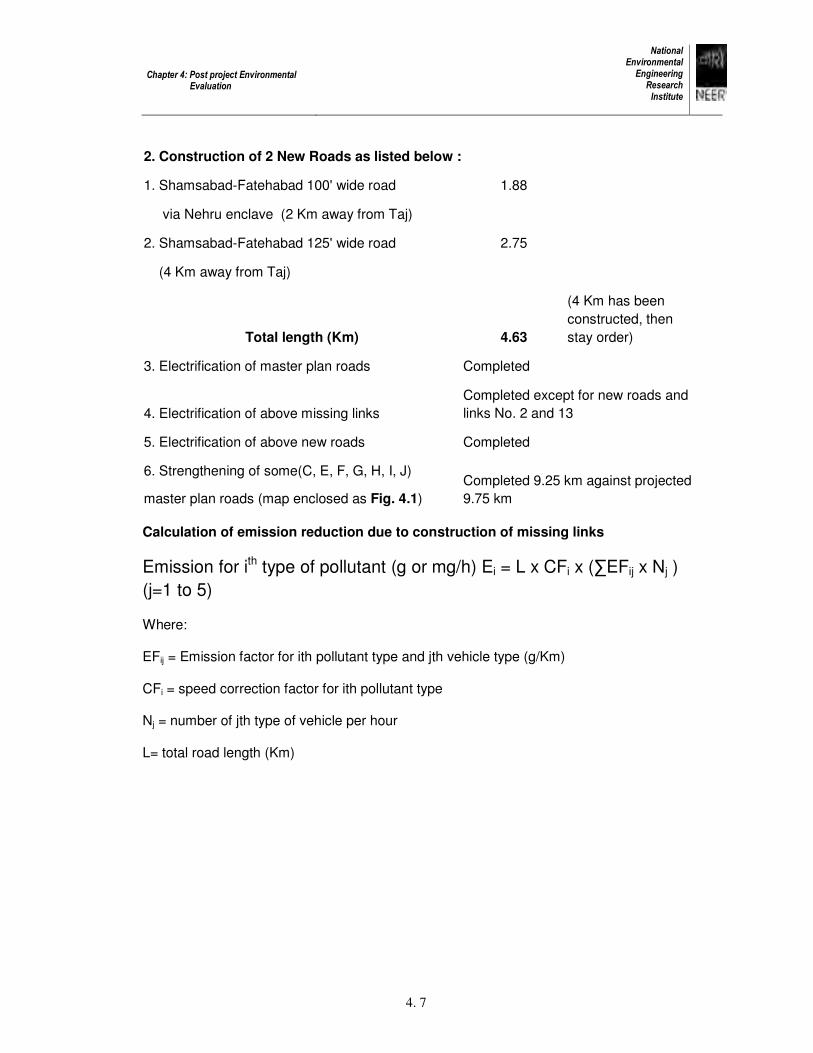
Chapter 4: Post project Environmental Evaluation
National Environmental Engineering Research Institute
4. 7
2. Construction of 2 New Roads as listed below :
1. Shamsabad-Fatehabad 100' wide road 1.88
via Nehru enclave (2 Km away from Taj)
2. Shamsabad-Fatehabad 125' wide road 2.75
(4 Km away from Taj)
Total length (Km) 4.63
(4 Km has been
constructed, then
stay order)
3. Electrification of master plan roads Completed
4. Electrification of above missing links
Completed except for new roads and
links No. 2 and 13
5. Electrification of above new roads Completed
6. Strengthening of some(C, E, F, G, H, I, J)
master plan roads (map enclosed as Fig. 4.1)
Completed 9.25 km against projected
9.75 km
Calculation of emission reduction due to construction of missing links
Emission for ith type of pollutant (g or mg/h) Ei = L x CFi x (∑EFij x Nj )
(j=1 to 5)
Where:
EFij = Emission factor for ith pollutant type and jth vehicle type (g/Km)
CFi = speed correction factor for ith pollutant type
Nj = number of jth type of vehicle per hour
L= total road length (Km)
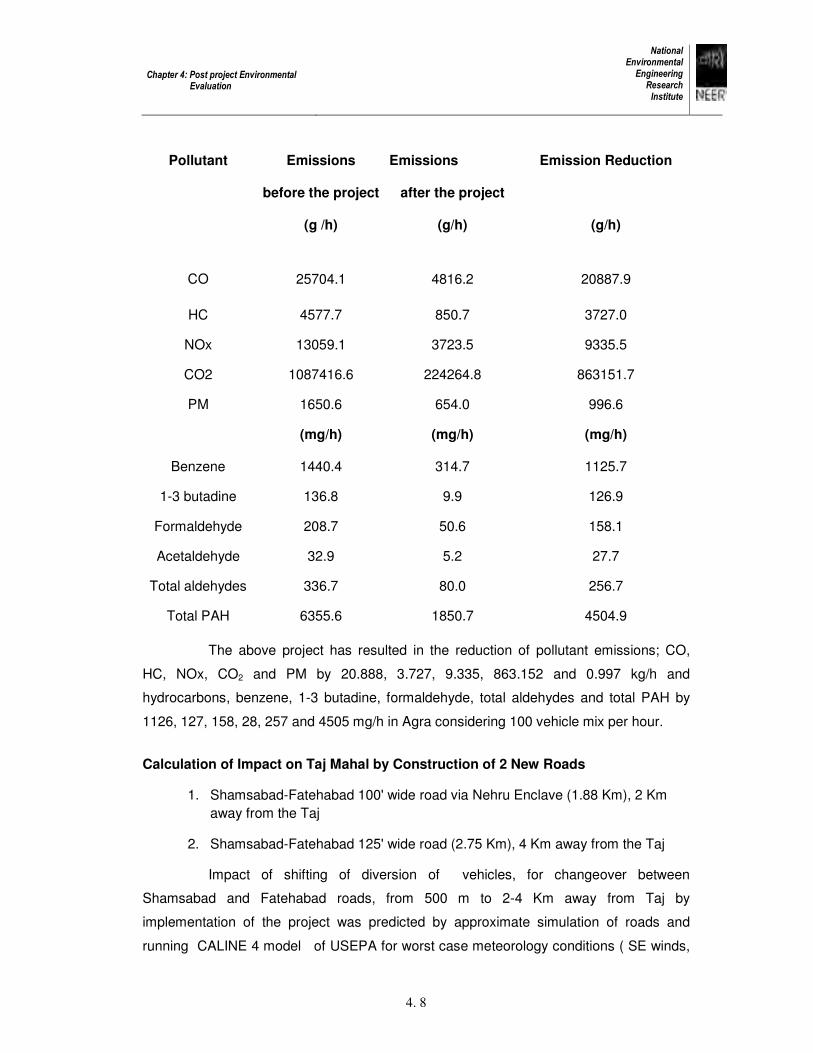
Chapter 4: Post project Environmental Evaluation
National Environmental Engineering Research Institute
4. 8
Pollutant Emissions Emissions Emission Reduction
before the project after the project
(g /h) (g/h) (g/h)
CO 25704.1 4816.2 20887.9
HC 4577.7 850.7 3727.0
NOx 13059.1 3723.5 9335.5
CO2 1087416.6 224264.8 863151.7
PM 1650.6 654.0 996.6
(mg/h) (mg/h) (mg/h)
Benzene 1440.4 314.7 1125.7
1-3 butadine 136.8 9.9 126.9
Formaldehyde 208.7 50.6 158.1
Acetaldehyde 32.9 5.2 27.7
Total aldehydes 336.7 80.0 256.7
Total PAH 6355.6 1850.7 4504.9
The above project has resulted in the reduction of pollutant emissions; CO,
HC, NOx, CO2 and PM by 20.888, 3.727, 9.335, 863.152 and 0.997 kg/h and
hydrocarbons, benzene, 1-3 butadine, formaldehyde, total aldehydes and total PAH by
1126, 127, 158, 28, 257 and 4505 mg/h in Agra considering 100 vehicle mix per hour.
Calculation of Impact on Taj Mahal by Construction of 2 New Roads
1. Shamsabad-Fatehabad 100' wide road via Nehru Enclave (1.88 Km), 2 Km
away from the Taj
2. Shamsabad-Fatehabad 125' wide road (2.75 Km), 4 Km away from the Taj
Impact of shifting of diversion of vehicles, for changeover between
Shamsabad and Fatehabad roads, from 500 m to 2-4 Km away from Taj by
implementation of the project was predicted by approximate simulation of roads and
running CALINE 4 model of USEPA for worst case meteorology conditions ( SE winds,
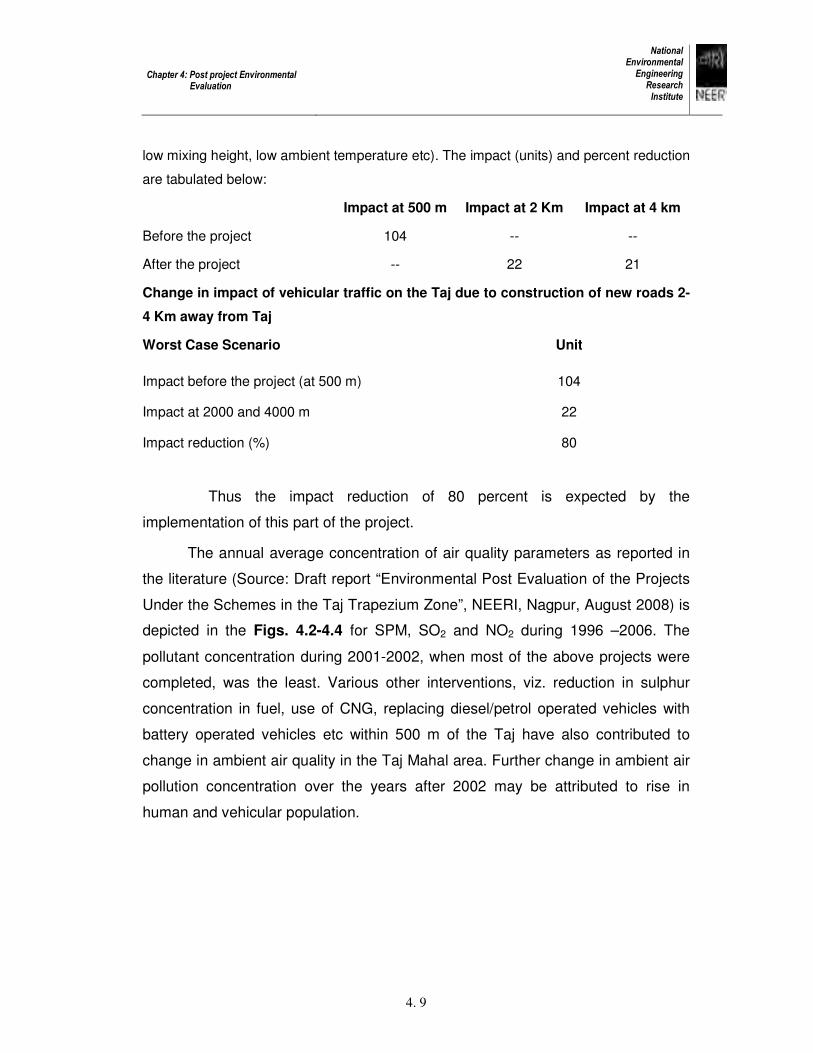
Chapter 4: Post project Environmental Evaluation
National Environmental Engineering Research Institute
4. 9
low mixing height, low ambient temperature etc). The impact (units) and percent reduction
are tabulated below:
Impact at 500 m Impact at 2 Km Impact at 4 km
Before the project 104 -- --
After the project -- 22 21
Change in impact of vehicular traffic on the Taj due to construction of new roads 2-
4 Km away from Taj
Worst Case Scenario Unit
Impact before the project (at 500 m) 104
Impact at 2000 and 4000 m 22
Impact reduction (%) 80
Thus the impact reduction of 80 percent is expected by the
implementation of this part of the project.
The annual average concentration of air quality parameters as reported in
the literature (Source: Draft report “Environmental Post Evaluation of the Projects
Under the Schemes in the Taj Trapezium Zone”, NEERI, Nagpur, August 2008) is
depicted in the Figs. 4.2-4.4 for SPM, SO2 and NO2 during 1996 –2006. The
pollutant concentration during 2001-2002, when most of the above projects were
completed, was the least. Various other interventions, viz. reduction in sulphur
concentration in fuel, use of CNG, replacing diesel/petrol operated vehicles with
battery operated vehicles etc within 500 m of the Taj have also contributed to
change in ambient air quality in the Taj Mahal area. Further change in ambient air
pollution concentration over the years after 2002 may be attributed to rise in
human and vehicular population.
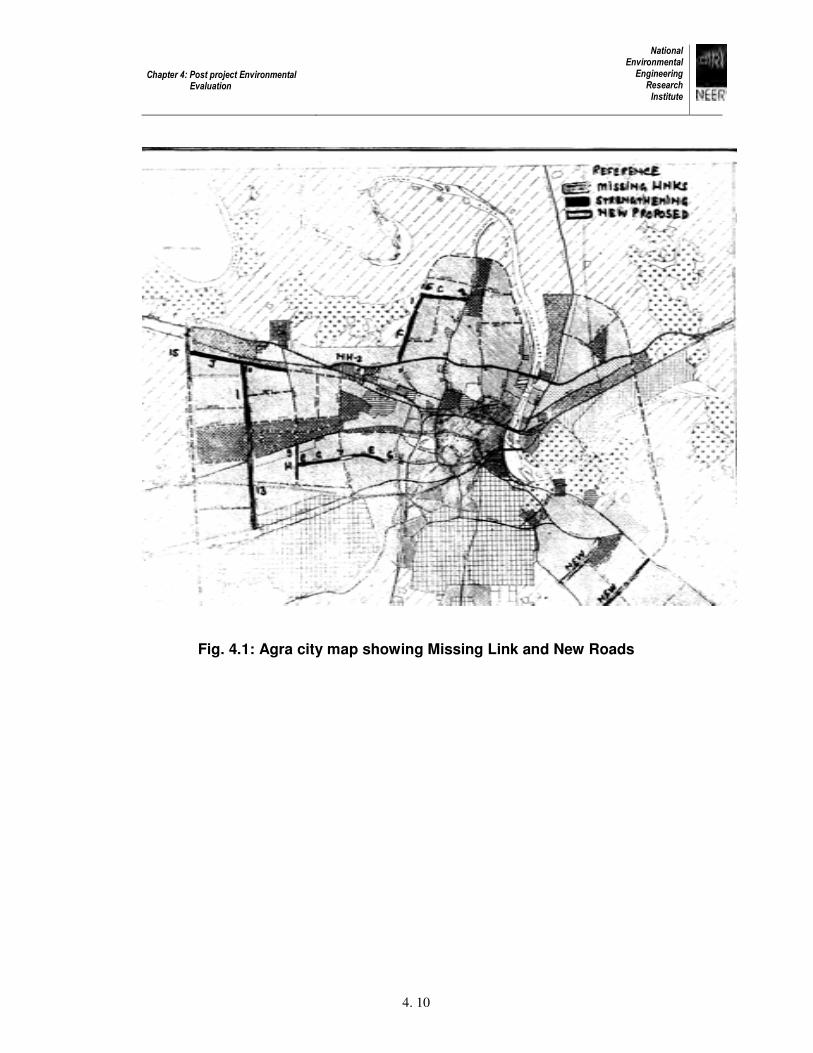
Chapter 4: Post project Environmental Evaluation
National Environmental Engineering Research Institute
4. 10
Fig. 4.1: Agra city map showing Missing Link and New Roads
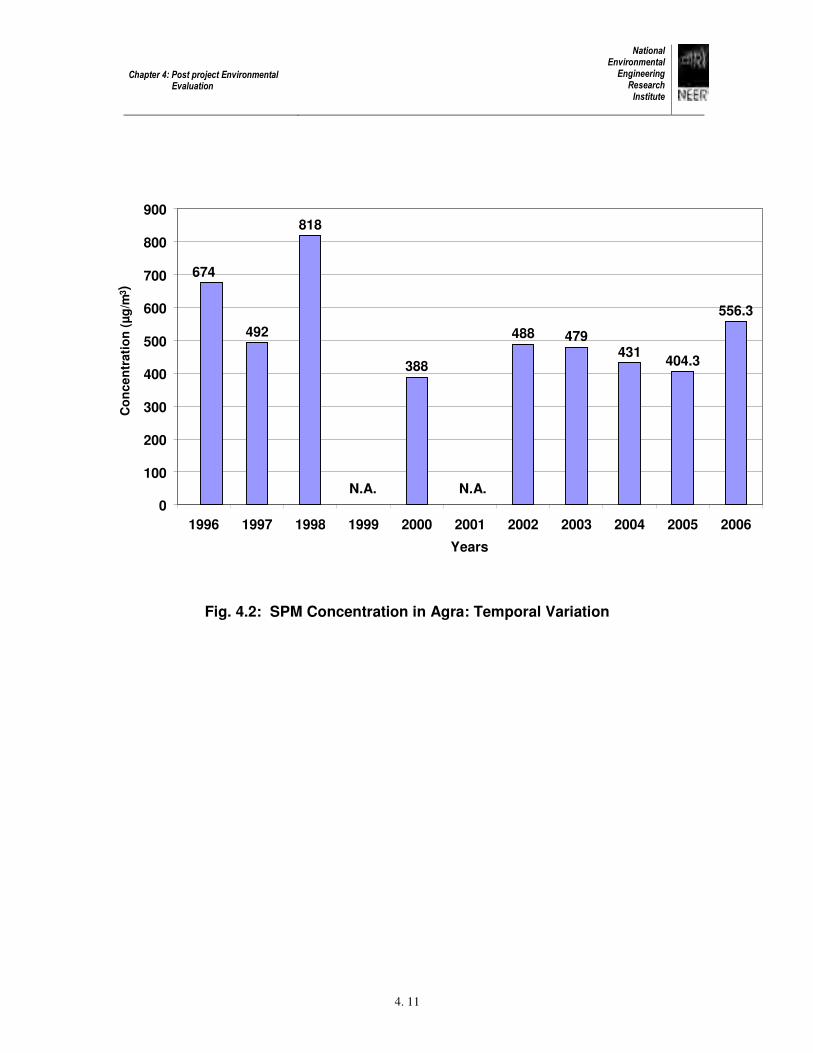
Chapter 4: Post project Environmental Evaluation
National Environmental Engineering Research Institute
4. 11
Fig. 4.2: SPM Concentration in Agra: Temporal Variation
674
492
818
388
488 479
431404.3
556.3
0
100
200
300
400
500
600
700
800
900
1996 1997 1998 1999 2000 2001 2002 2003 2004 2005 2006
Years
3 )
N.A. N.A.
Co
nc
en
trati
on
(µ
g/m
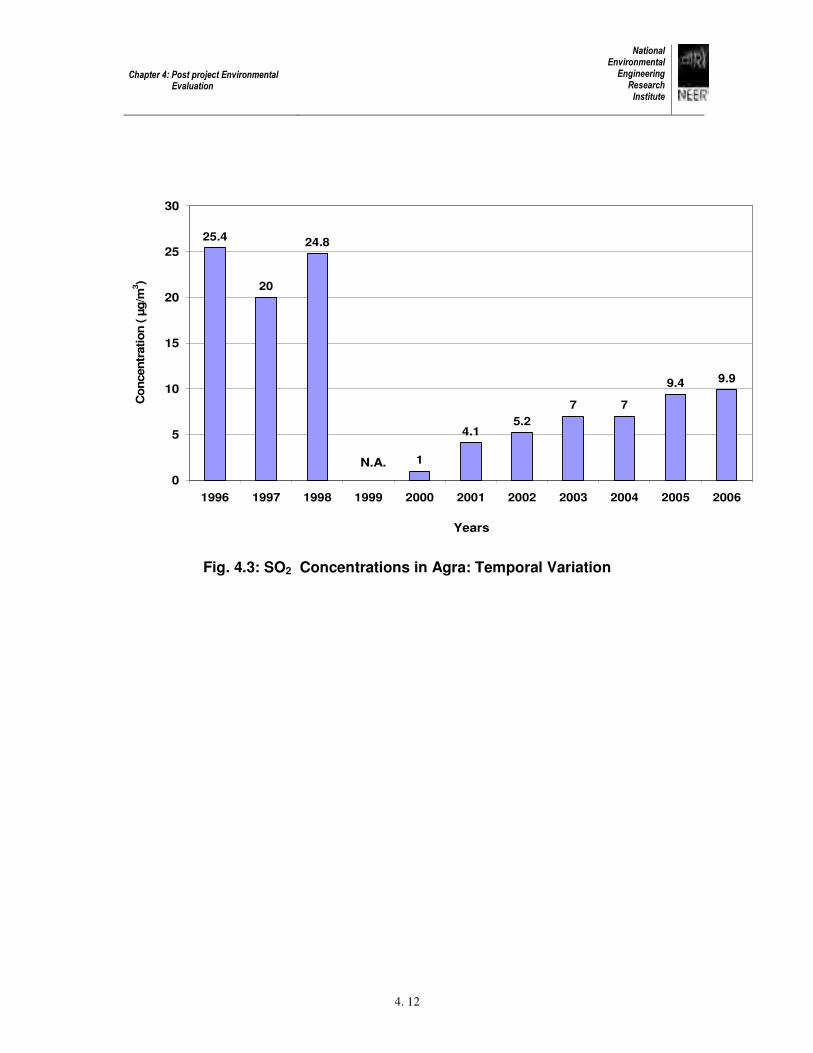
Chapter 4: Post project Environmental Evaluation
National Environmental Engineering Research Institute
4. 12
25.4
20
24.8
1
4.15.2
7 7
9.4 9.9
0
5
10
15
20
25
30
1996 1997 1998 1999 2000 2001 2002 2003 2004 2005 2006
Years
Concentr
ation ( µ
g/m
3)
N.A.
Fig. 4.3: SO2 Concentrations in Agra: Temporal Variation
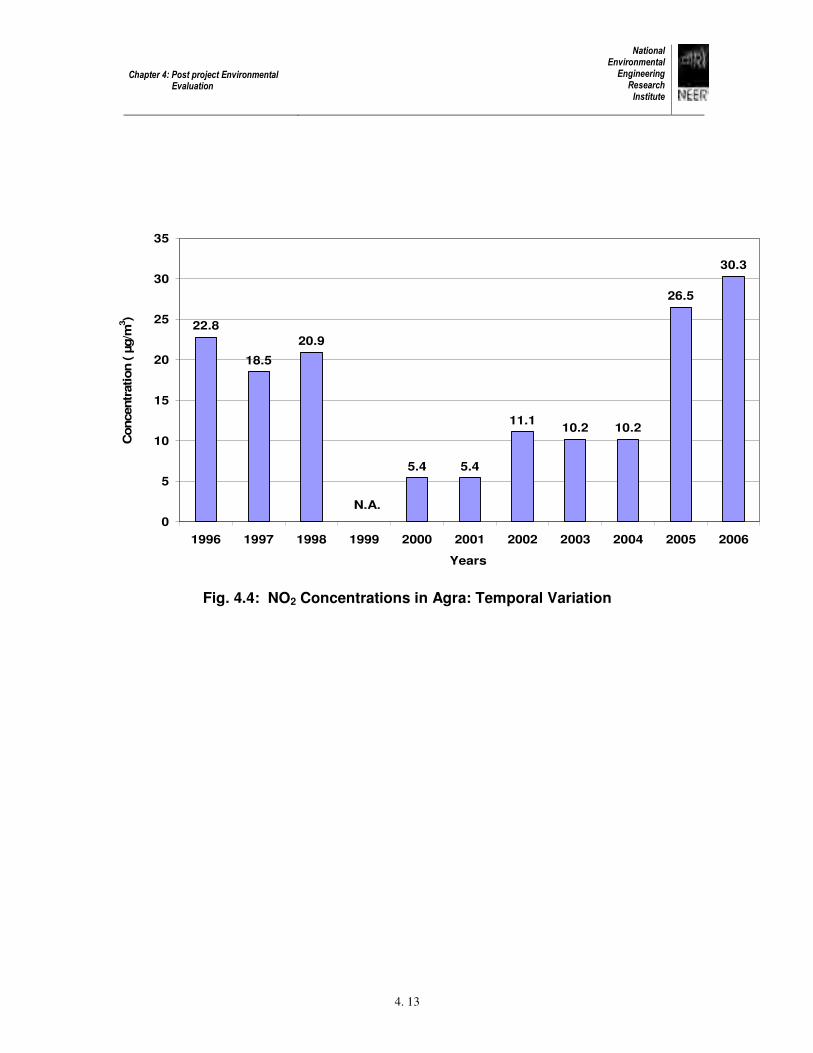
Chapter 4: Post project Environmental Evaluation
National Environmental Engineering Research Institute
4. 13
22.8
18.5
20.9
5.4 5.4
11.110.2 10.2
26.5
30.3
0
5
10
15
20
25
30
35
1996 1997 1998 1999 2000 2001 2002 2003 2004 2005 2006
Years
Concentr
ation ( µ
g/m
3)
N.A.
Fig. 4.4: NO2 Concentrations in Agra: Temporal Variation
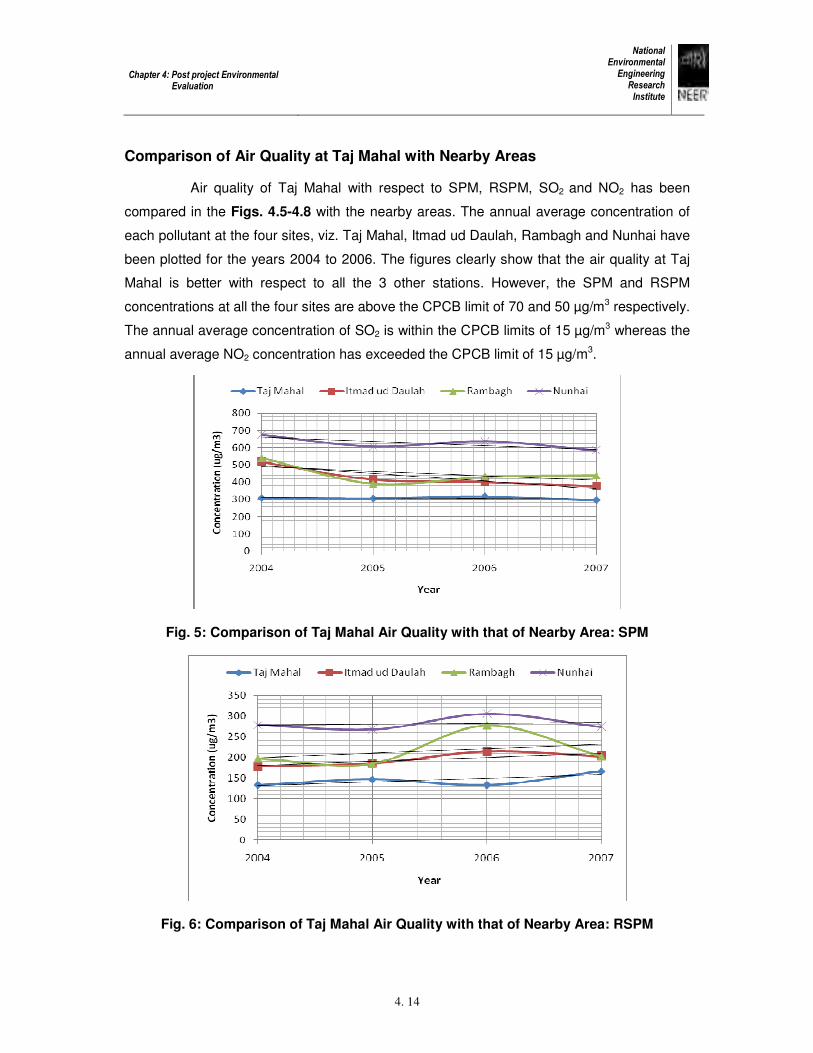
Chapter 4: Post project Environmental Evaluation
National Environmental Engineering Research Institute
4. 14
Comparison of Air Quality at Taj Mahal with Nearby Areas
Air quality of Taj Mahal with respect to SPM, RSPM, SO2 and NO2 has been
compared in the Figs. 4.5-4.8 with the nearby areas. The annual average concentration of
each pollutant at the four sites, viz. Taj Mahal, Itmad ud Daulah, Rambagh and Nunhai have
been plotted for the years 2004 to 2006. The figures clearly show that the air quality at Taj
Mahal is better with respect to all the 3 other stations. However, the SPM and RSPM
concentrations at all the four sites are above the CPCB limit of 70 and 50 µg/m3 respectively.
The annual average concentration of SO2 is within the CPCB limits of 15 µg/m3 whereas the
annual average NO2 concentration has exceeded the CPCB limit of 15 µg/m3.
Fig. 5: Comparison of Taj Mahal Air Quality with that of Nearby Area: SPM
Fig. 6: Comparison of Taj Mahal Air Quality with that of Nearby Area: RSPM

Chapter 4: Post project Environmental Evaluation
National Environmental Engineering Research Institute
4. 15
Fig. 7: Comparison of Taj Mahal Air Quality with that of Nearby Area: SO2
Fig. 8: Comparison of Taj Mahal Air Quality with that of Nearby Area: NO2
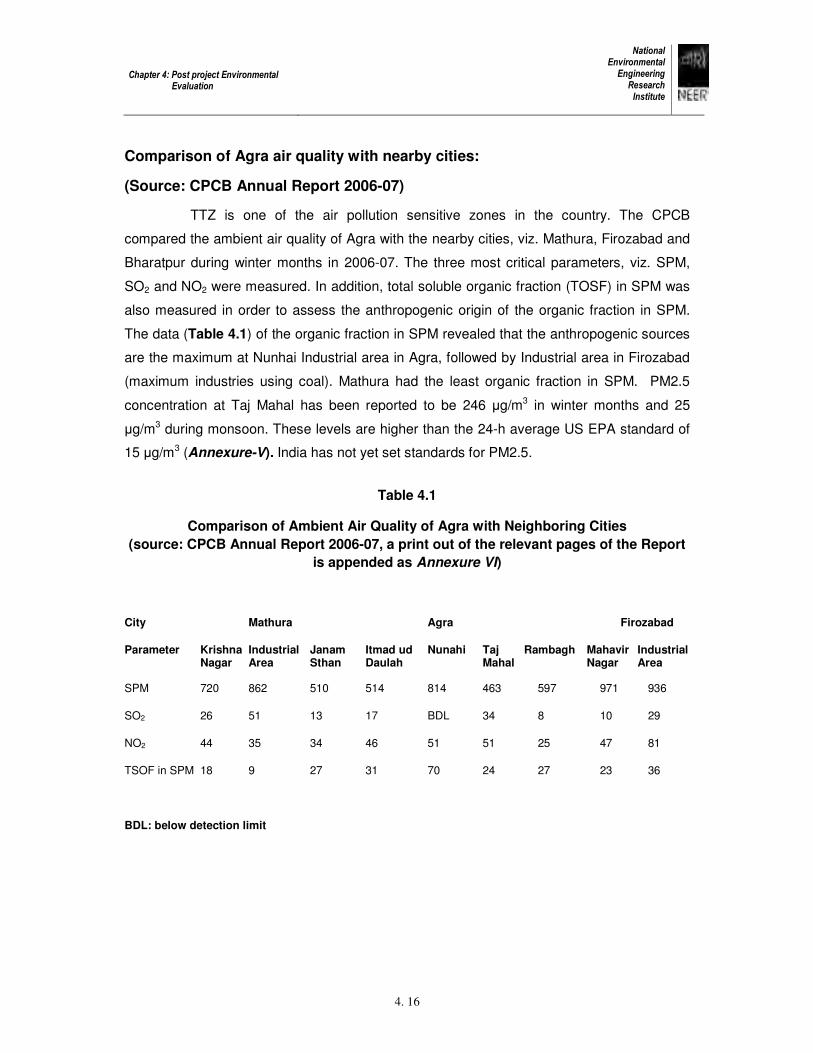
Chapter 4: Post project Environmental Evaluation
National Environmental Engineering Research Institute
4. 16
Comparison of Agra air quality with nearby cities:
(Source: CPCB Annual Report 2006-07)
TTZ is one of the air pollution sensitive zones in the country. The CPCB
compared the ambient air quality of Agra with the nearby cities, viz. Mathura, Firozabad and
Bharatpur during winter months in 2006-07. The three most critical parameters, viz. SPM,
SO2 and NO2 were measured. In addition, total soluble organic fraction (TOSF) in SPM was
also measured in order to assess the anthropogenic origin of the organic fraction in SPM.
The data (Table 4.1) of the organic fraction in SPM revealed that the anthropogenic sources
are the maximum at Nunhai Industrial area in Agra, followed by Industrial area in Firozabad
(maximum industries using coal). Mathura had the least organic fraction in SPM. PM2.5
concentration at Taj Mahal has been reported to be 246 µg/m3 in winter months and 25
µg/m3 during monsoon. These levels are higher than the 24-h average US EPA standard of
15 µg/m3 (Annexure-V). India has not yet set standards for PM2.5.
Table 4.1
Comparison of Ambient Air Quality of Agra with Neighboring Cities
(source: CPCB Annual Report 2006-07, a print out of the relevant pages of the Report
is appended as Annexure VI)
City Mathura Agra Firozabad
Parameter Krishna Industrial Janam Itmad ud Nunahi Taj Rambagh Mahavir Industrial Nagar Area Sthan Daulah Mahal Nagar Area
SPM 720 862 510 514 814 463 597 971 936
SO2 26 51 13 17 BDL 34 8 10 29
NO2 44 35 34 46 51 51 25 47 81
TSOF in SPM 18 9 27 31 70 24 27 23 36
BDL: below detection limit
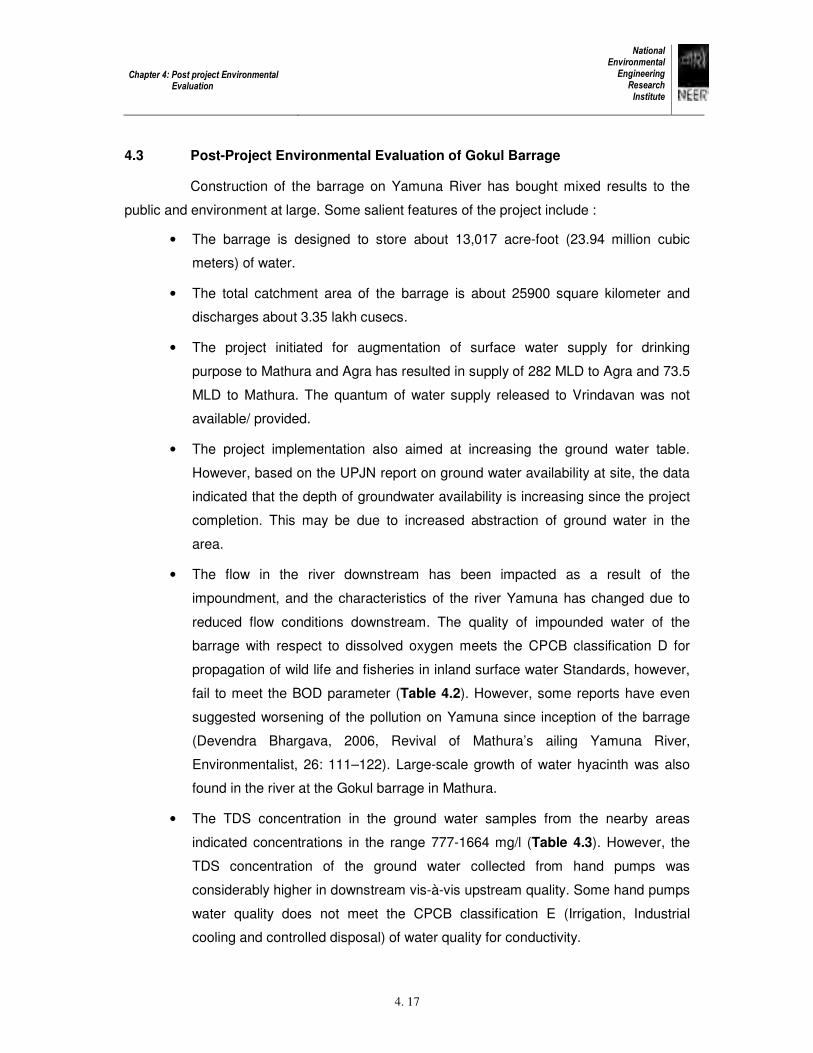
Chapter 4: Post project Environmental Evaluation
National Environmental Engineering Research Institute
4. 17
4.3 Post-Project Environmental Evaluation of Gokul Barrage
Construction of the barrage on Yamuna River has bought mixed results to the
public and environment at large. Some salient features of the project include :
• The barrage is designed to store about 13,017 acre-foot (23.94 million cubic
meters) of water.
• The total catchment area of the barrage is about 25900 square kilometer and
discharges about 3.35 lakh cusecs.
• The project initiated for augmentation of surface water supply for drinking
purpose to Mathura and Agra has resulted in supply of 282 MLD to Agra and 73.5
MLD to Mathura. The quantum of water supply released to Vrindavan was not
available/ provided.
• The project implementation also aimed at increasing the ground water table.
However, based on the UPJN report on ground water availability at site, the data
indicated that the depth of groundwater availability is increasing since the project
completion. This may be due to increased abstraction of ground water in the
area.
• The flow in the river downstream has been impacted as a result of the
impoundment, and the characteristics of the river Yamuna has changed due to
reduced flow conditions downstream. The quality of impounded water of the
barrage with respect to dissolved oxygen meets the CPCB classification D for
propagation of wild life and fisheries in inland surface water Standards, however,
fail to meet the BOD parameter (Table 4.2). However, some reports have even
suggested worsening of the pollution on Yamuna since inception of the barrage
(Devendra Bhargava, 2006, Revival of Mathura’s ailing Yamuna River,
Environmentalist, 26: 111–122). Large-scale growth of water hyacinth was also
found in the river at the Gokul barrage in Mathura.
• The TDS concentration in the ground water samples from the nearby areas
indicated concentrations in the range 777-1664 mg/l (Table 4.3). However, the
TDS concentration of the ground water collected from hand pumps was
considerably higher in downstream vis-à-vis upstream quality. Some hand pumps
water quality does not meet the CPCB classification E (Irrigation, Industrial
cooling and controlled disposal) of water quality for conductivity.
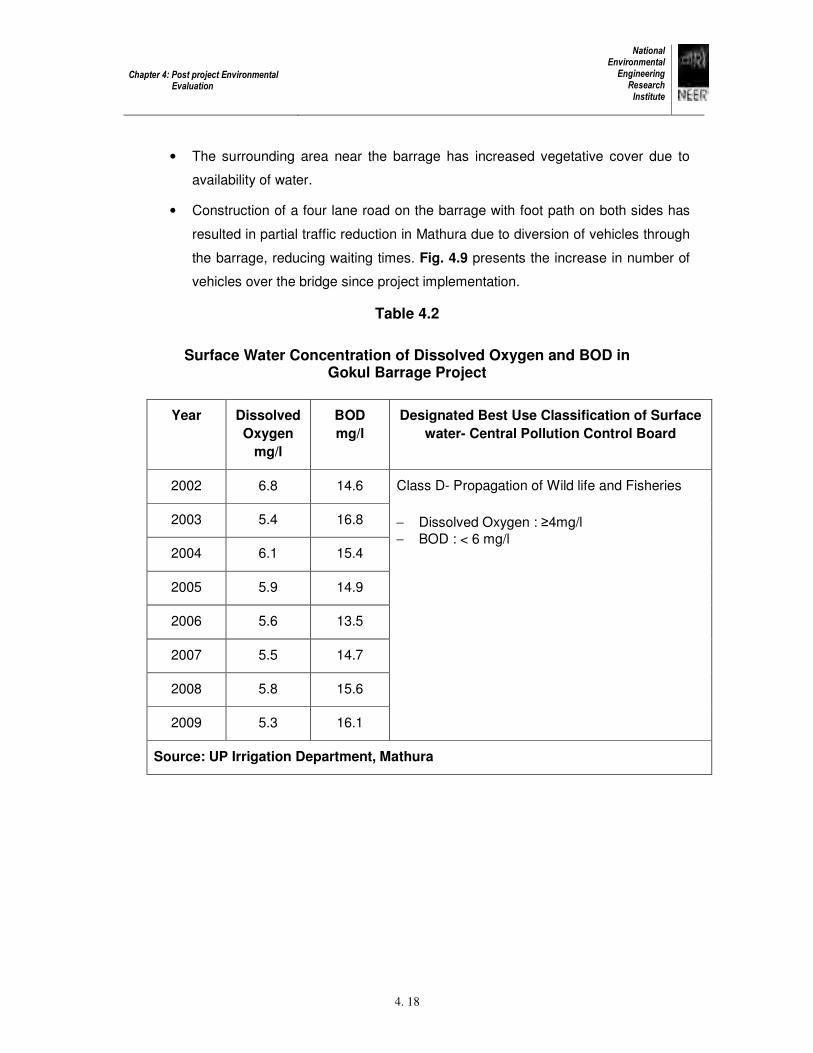
Chapter 4: Post project Environmental Evaluation
National Environmental Engineering Research Institute
4. 18
• The surrounding area near the barrage has increased vegetative cover due to
availability of water.
• Construction of a four lane road on the barrage with foot path on both sides has
resulted in partial traffic reduction in Mathura due to diversion of vehicles through
the barrage, reducing waiting times. Fig. 4.9 presents the increase in number of
vehicles over the bridge since project implementation.
Table 4.2
Surface Water Concentration of Dissolved Oxygen and BOD in
Gokul Barrage Project
Year Dissolved
Oxygen
mg/l
BOD
mg/l
Designated Best Use Classification of Surface
water- Central Pollution Control Board
2002 6.8 14.6
2003 5.4 16.8
2004 6.1 15.4
2005 5.9 14.9
2006 5.6 13.5
2007 5.5 14.7
2008 5.8 15.6
2009 5.3 16.1
Class D- Propagation of Wild life and Fisheries
− Dissolved Oxygen : ≥4mg/l
− BOD : < 6 mg/l
Source: UP Irrigation Department, Mathura
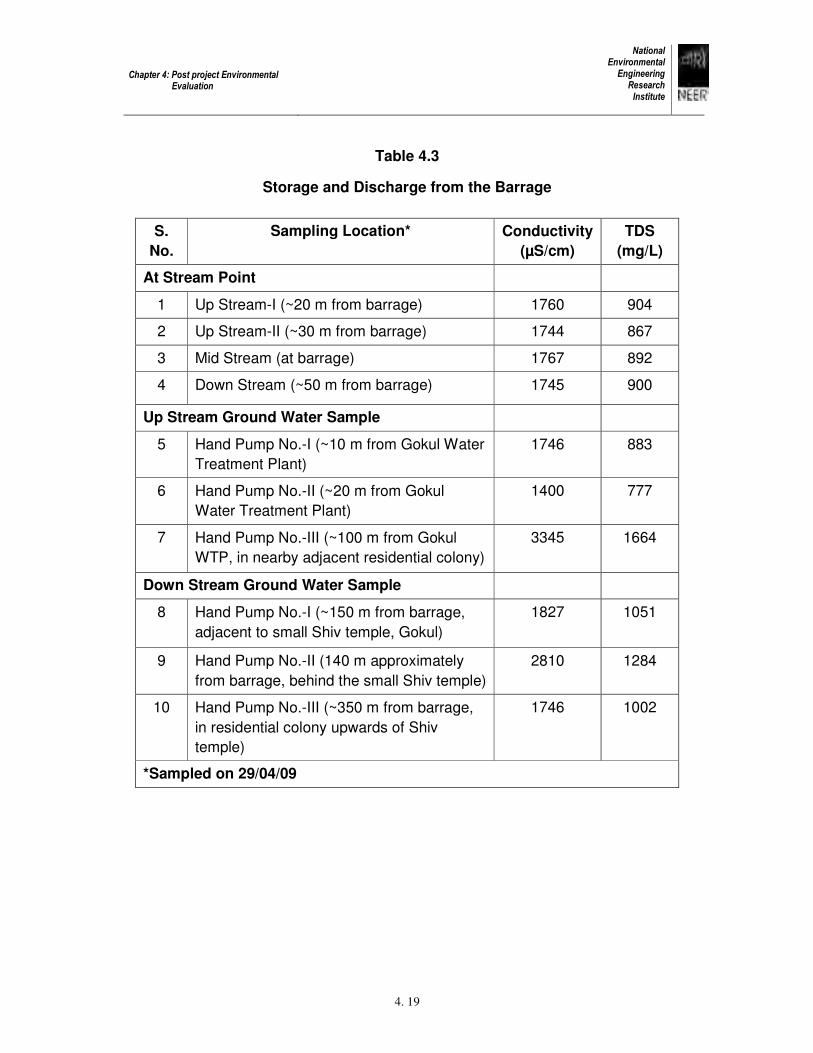
Chapter 4: Post project Environmental Evaluation
National Environmental Engineering Research Institute
4. 19
Table 4.3
Storage and Discharge from the Barrage
S.
No.
Sampling Location* Conductivity
(µS/cm)
TDS
(mg/L)
At Stream Point
1 Up Stream-I (~20 m from barrage) 1760 904
2 Up Stream-II (~30 m from barrage) 1744 867
3 Mid Stream (at barrage) 1767 892
4 Down Stream (~50 m from barrage) 1745 900
Up Stream Ground Water Sample
5 Hand Pump No.-I (~10 m from Gokul Water
Treatment Plant)
1746 883
6 Hand Pump No.-II (~20 m from Gokul
Water Treatment Plant)
1400 777
7 Hand Pump No.-III (~100 m from Gokul
WTP, in nearby adjacent residential colony)
3345 1664
Down Stream Ground Water Sample
8 Hand Pump No.-I (~150 m from barrage,
adjacent to small Shiv temple, Gokul)
1827 1051
9 Hand Pump No.-II (140 m approximately
from barrage, behind the small Shiv temple)
2810 1284
10 Hand Pump No.-III (~350 m from barrage,
in residential colony upwards of Shiv
temple)
1746 1002
*Sampled on 29/04/09
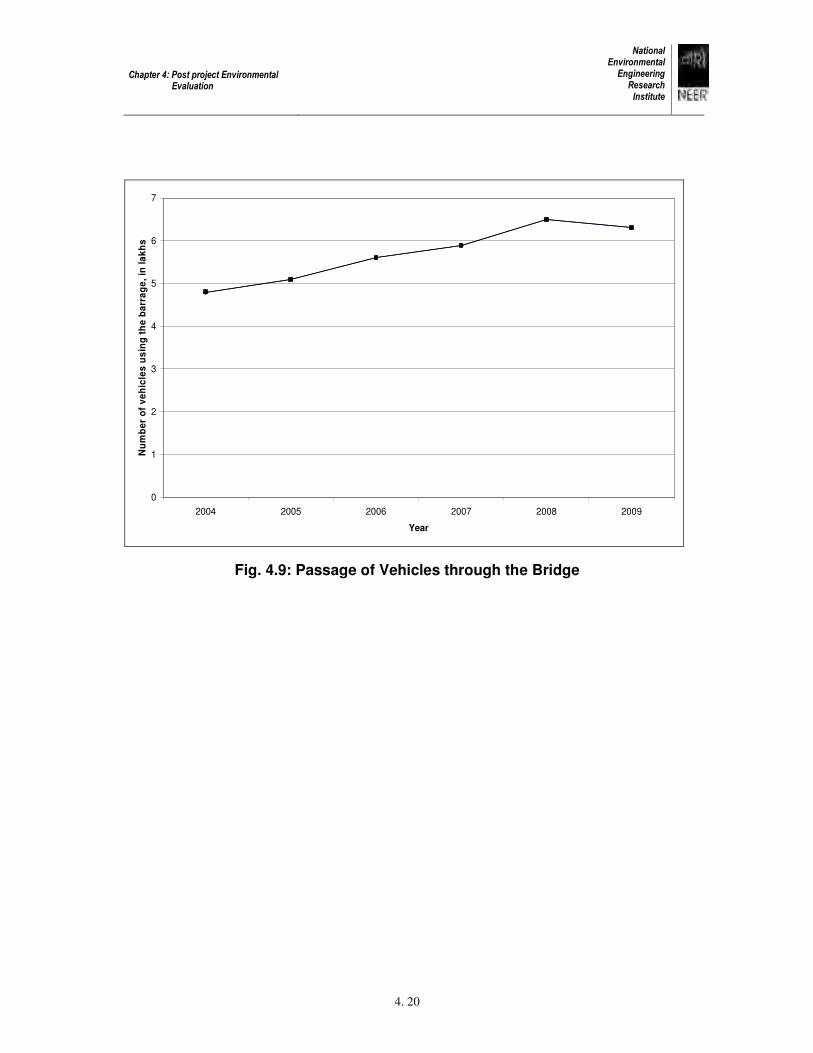
Chapter 4: Post project Environmental Evaluation
National Environmental Engineering Research Institute
4. 20
0
1
2
3
4
5
6
7
2004 2005 2006 2007 2008 2009
Year
Nu
mb
er
of
ve
hic
les
us
ing
th
e b
arr
ag
e,
in l
ak
hs
Fig. 4.9: Passage of Vehicles through the Bridge
Chapter 4: Post project Environmental Evaluation
National Environmental Engineering Research Institute
4. 21
4.4 Post-Project Environmental Evaluation of Storm Water Drainage
Storm Water Drainage Network in the City
The existing drainage system, as per the data available with UPJN, indicated that
the drainage system in the city has been classified into 11 major catchments/zones and a
number of kacha open drains. Around 21 major open drains spread across the entire Agra
city, collect and convey the storm water finally into river Yamuna (Fig. 4.10). However, no
data is available on the details of the catchment area served by the drains. Table 4 presents
the 21 major drains in the city and the coverage areas (names) of the respective drains with
discharge points. Mantola and Bhairon drains are the largest drains. In addition, there are
several medium and small drains which discharge into the major drains.
Challenges in the Maintenance of Existing Storm Water Drains
Agra city is densely built up with a network of manmade and kacha drains for
collection and conveyance of storm water. The drains are of composite nature with lined
and unlined sections, trapezoidal and rectangular sections, regular and irregular sections.
However, the existing conditions of the drains are not good, as far as structures are
concerned. These drains are not functioning properly due to silting and accumulation of solid
waste, which are not cleaned regularly by the authorities. There is no arrangement at outfall
locations drains/nallas for arresting the solid waste, which is finding its way finally into the
river (Exhibits 4.1 to 4.8). Also, the outfalls of the drains are not provided with control
structure to avoid back flow from the river.
The city lacks a sewerage system for collection and conveyance of the domestic
and industrial effluents. A small area of the city (1400 ha.) has been covered by an aging
sewerage system out of total area of 8360 ha of the city. The old system that exists in 1400
ha area is inadequate due to increase in population and extension of habited area. In the
absence of comprehensive sewerage system, the storm water drains carry raw sewage and
discharge directly into river Yamuna. As a result, most of the drains presented in the Table
4.4 carry domestic sewage laden with solid wastes.
Status of Storm Water Drain constructed under the Project
UPJN has constructed four drains in Agra city in coordination with the ANN and
Agra Development Authority (ADA). Table 4.5 presents the current status of the project
implementation as provided by the UPJN. The data revealed that more than 92% of the work

Chapter 4: Post project Environmental Evaluation
National Environmental Engineering Research Institute
4. 22
was completed in Mustfa Quarter area, Sikandra area, and Naval Ganj area. However, only
62% of the work was completed in Bhim Nagar area as the work has been stopped by the
monitoring committee. An expenditure of 450.01 lakh has been incurred on the work
executed as against the financial grant of Rs. 565.38 lakh.
The ANN undertakes annual maintenance of the storm water drains constructed
in Agra city before monsoon. Based on the information available with the ANN, Table 4.6
provides the desilting and repairing activity undertaken during the year 2007 for maintenance
work including the cost incurred. Maintenance work comprising desilting was carried out in
Paliwal Park, Mantola, Bhairon and Taj East Gate drains covering around 4.49 km stretch.
The expenditure incurred towards the maintenance work was Rs. 94.48 lacs as against the
grant of Rs.94.62 lacs.
Cleaning of storm water drains as indicated in the Table 4.6 has resulted in partial
reduction of clogging of the drains mentioned and reduced waterloging in the respective
catchment areas as claimed by the concerned authority. However, the activities needed to
be undertaken in all the major drains discharging into river Yamuna wore to improve upon
the environmental status.
The implementation of the project has literally not gained much advantage in
terms of development of the facility benefiting the environmental status of the area under
study.
Issues of Concern in Storm Water Drainage System
The problems of existing storm water drainage system in Agra city are as follows:
• Open drains: The storm water drainage provided are open, allowing disposal of
garbage, polythene bags, waste material and construction debris thereby
reducing the drain capacity and choking leading to flooding during monsoon.
• Siltation: Since most of the drains are open, lot of silt deposits in the drains
reducing the carrying capacity. Choking of the drains at culverts is a common
feature.
• Domestic sewage/wastewaters: Majority of the storm water drains were observed
to carry domestic sewage from the residential and commercial areas in absence
of sewerage system.

Chapter 4: Post project Environmental Evaluation
National Environmental Engineering Research Institute
4. 23
• Encroachment: Most of the drains in the commercial areas of the city were
encroached by the shopkeepers (extending their shops or constructing steps
towards their shops). Construction of temporary toilet shades over drain was also
observed. In some areas, there was no service road/lane to access the drain for
cleaning or repair.
• Water logging: The vacant land and low lying areas have been progressively
developed with building construction. The old ponds, which used to hold excess
storm run-off, have now been habited. This aggravated the problem of water
logging.
• Vegetation near drains: Penetration of roots from nearby trees through the cracks
in the drains and growth of plants inside the drain eventually leads to choking of
the drains.
• Lack of storm water drains: There is inadequate provision of storm water
drainage in the newly developed areas of the city.
• Inefficient cleaning: The city has poor facility for cleaning and maintenance of the
drainage system due to limited resources.

Chapter 4: Post project Environmental Evaluation
National Environmental Engineering Research Institute
4. 24
Table 4.4
Storm Water Drains in Agra City and the Coverage Areas
Sr. No. Drain name Coverage areas Discharge points
Kachha Drains - Cis-Yamuna
1. Rajwaha Rajwada, Sita Ram Colony, New Adarsh Nagar,
Ganga Gauri colony, Balkeshwar Road
2. Balkeshwar Nagala Thipri, Lohiya Nagar, New Saraswathi
Nagar, Balkeshwar Road
3. Water Works Kaushal Pur, Bhagwan Crossing, Indra Puri, Suresh
Nagar, Nehru Nagar, Mughal Road, Karbala, Nagla
Bihari, parts of Kamla Nagar, Sultan Ganj, Langre
Ki Chauk, Jeoni Ma, Water works Chauraha
crossing
Routed to STP of capacity
78MLD (Dhandpura STP)
and finally discharged into
Yamuna river
4. Krishna Colony Patel Nagar Road, Laxmi Mill Crossing, Krishna
colony and Jeoni Mandi Directly into river
5. Paliwal Jewamo Mandi, Bhairon Bazaar, Yamuna Kinara
Road Directly into river
6. Bhairon Nagla Beni Prasad, Gandhi Nagar, Valmiki Basti,
Paliwal park Road, Moti LL Nehru Road, Old Vijay
Nagar, Ambedkar Nagar, Peer Kalyani, Railway
Maal Godam, Wazeerpura Road, Sanjay Place
Road, Chimman Lal road, Free Ganj, Ghas Ki
Mandi Road, Madar Gate, Belan Ganj, Bhairon
Bazaar
7. Belanganj Joins Bhairon Ganj
Pumped from Bhairon
Sewage pumping station
into Yamuna river
8. Khoja Jeen Khana, Kala Mahal, Gulab Khana, Kotwali,
Gali, Kacheri Ghat, Drum Mandi, Baans Darwaza,
Belan Ganj, Chatta Bazaar
Directly into river
9. Papal Mandi Maal Ka Bazaar, Peepal Mandi, Ram Chand Gupta
Road, Namak Ki Mandi, Daresi, Fountain
Chauraha, Chatta Road
Directly into river
11. Taj West Gate Taj Tourist Shopping Complex, Taj Mahal Parking,
Sham Shan Ghat, Udhyan nursery Directly into river
12. Taj East Gate Rajpur, Shamshabad Road, Vashistpuram, Kalindi
Vihar Road, Bank Colony, Bagh Rajpur, Pakki
Sarai, Lacchipura, Shaheed nagar, Kareem Nagar,
Gobar Chauki, Harjupura, Gummat, Purani Mandi,
Taj Ganj, Navada, Impeypura, Bagichi Patira, Park
Tola, Basai Kalan, Marutam Nagar, Billochpura
Tajganj, Telipara, Kohai, Taj East Gate Road
Directly into river
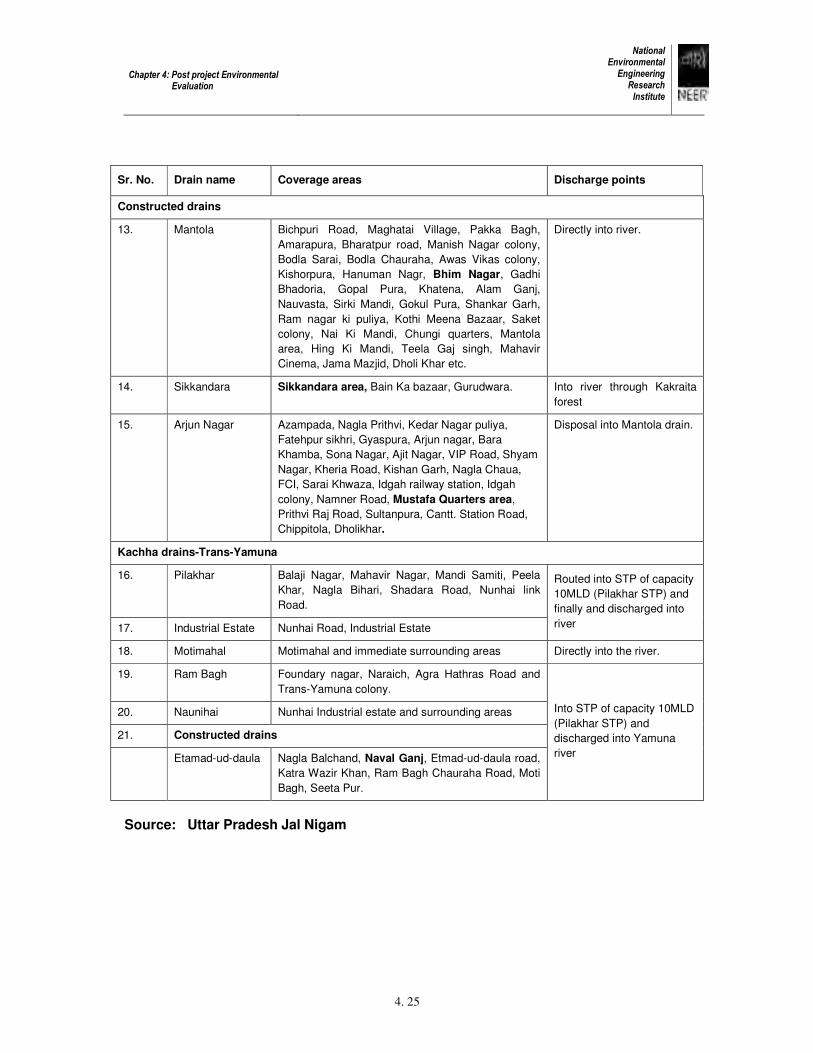
Chapter 4: Post project Environmental Evaluation
National Environmental Engineering Research Institute
4. 25
Sr. No. Drain name Coverage areas Discharge points
Constructed drains
13. Mantola Bichpuri Road, Maghatai Village, Pakka Bagh,
Amarapura, Bharatpur road, Manish Nagar colony,
Bodla Sarai, Bodla Chauraha, Awas Vikas colony,
Kishorpura, Hanuman Nagr, Bhim Nagar, Gadhi
Bhadoria, Gopal Pura, Khatena, Alam Ganj,
Nauvasta, Sirki Mandi, Gokul Pura, Shankar Garh,
Ram nagar ki puliya, Kothi Meena Bazaar, Saket
colony, Nai Ki Mandi, Chungi quarters, Mantola
area, Hing Ki Mandi, Teela Gaj singh, Mahavir
Cinema, Jama Mazjid, Dholi Khar etc.
Directly into river.
14. Sikkandara Sikkandara area, Bain Ka bazaar, Gurudwara. Into river through Kakraita
forest
15. Arjun Nagar Azampada, Nagla Prithvi, Kedar Nagar puliya,
Fatehpur sikhri, Gyaspura, Arjun nagar, Bara
Khamba, Sona Nagar, Ajit Nagar, VIP Road, Shyam
Nagar, Kheria Road, Kishan Garh, Nagla Chaua,
FCI, Sarai Khwaza, Idgah railway station, Idgah
colony, Namner Road, Mustafa Quarters area,
Prithvi Raj Road, Sultanpura, Cantt. Station Road,
Chippitola, Dholikhar.
Disposal into Mantola drain.
Kachha drains-Trans-Yamuna
16. Pilakhar Balaji Nagar, Mahavir Nagar, Mandi Samiti, Peela
Khar, Nagla Bihari, Shadara Road, Nunhai link
Road.
17. Industrial Estate Nunhai Road, Industrial Estate
Routed into STP of capacity
10MLD (Pilakhar STP) and
finally and discharged into
river
18. Motimahal Motimahal and immediate surrounding areas Directly into the river.
19. Ram Bagh Foundary nagar, Naraich, Agra Hathras Road and
Trans-Yamuna colony.
20. Naunihai Nunhai Industrial estate and surrounding areas
21. Constructed drains
Etamad-ud-daula Nagla Balchand, Naval Ganj, Etmad-ud-daula road,
Katra Wazir Khan, Ram Bagh Chauraha Road, Moti
Bagh, Seeta Pur.
Into STP of capacity 10MLD
(Pilakhar STP) and
discharged into Yamuna
river
Source: Uttar Pradesh Jal Nigam

Chapter 4: Post project Environmental Evaluation
National Environmental Engineering Research Institute
4. 26
Table 4.5
Status of Storm Water Drainage Scheme
(Status February 2009)
Sr.
No.
Work Provision Work level
A. DRAIN
1. Bhim Nagar Area
6.25 km 62% complete. Work stopped as per
direction of monitoring committee
2. Naval Ganj Area 4.73 km 100% completed
3. Sikandra Area 2.30 km 95% completed
4. Mustfa Quarter Area 5.35 km 92% completed
B. FINANCIAL
(in lakh Rupees)
565.38
(Granted)
Rs.450.01
(Incurred)
Source: Uttar Pradesh Jal Nigam
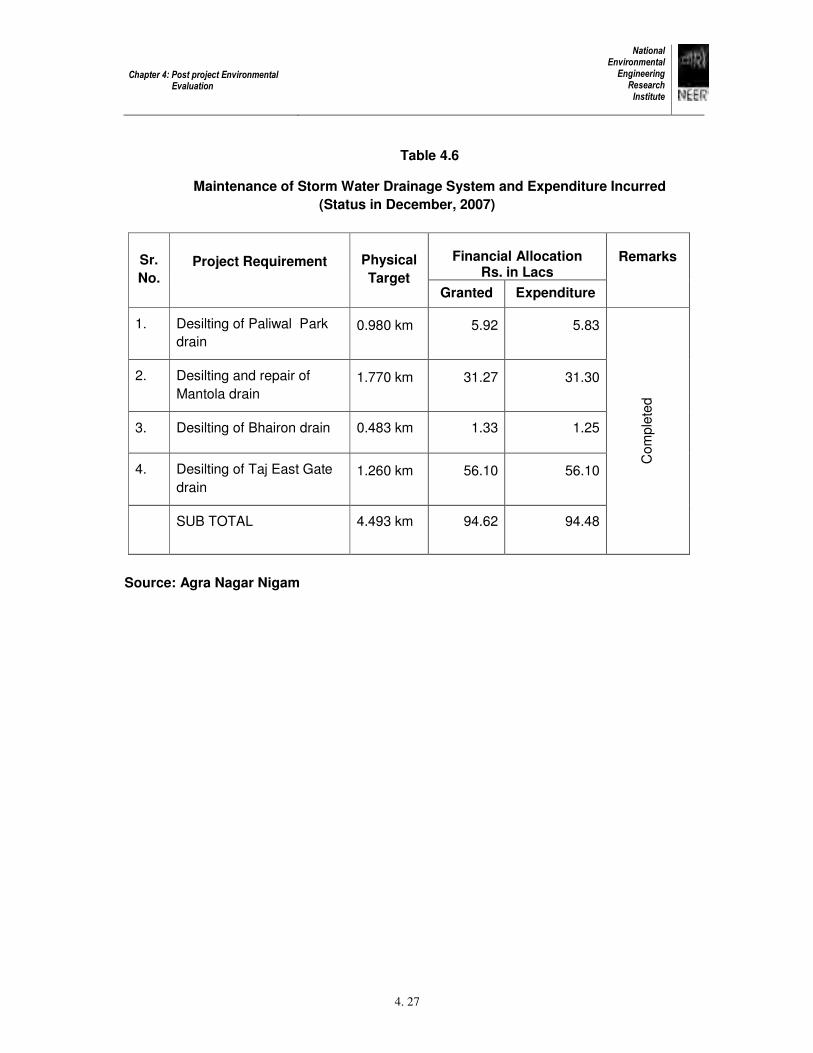
Chapter 4: Post project Environmental Evaluation
National Environmental Engineering Research Institute
4. 27
Table 4.6
Maintenance of Storm Water Drainage System and Expenditure Incurred
(Status in December, 2007)
Financial Allocation Rs. in Lacs
Sr.
No.
Project Requirement Physical
Target Granted Expenditure
Remarks
1. Desilting of Paliwal Park
drain 0.980 km 5.92 5.83
2. Desilting and repair of
Mantola drain 1.770 km 31.27 31.30
3. Desilting of Bhairon drain 0.483 km 1.33 1.25
4. Desilting of Taj East Gate
drain
1.260 km 56.10 56.10
SUB TOTAL 4.493 km 94.62 94.48
Com
ple
ted
Source: Agra Nagar Nigam
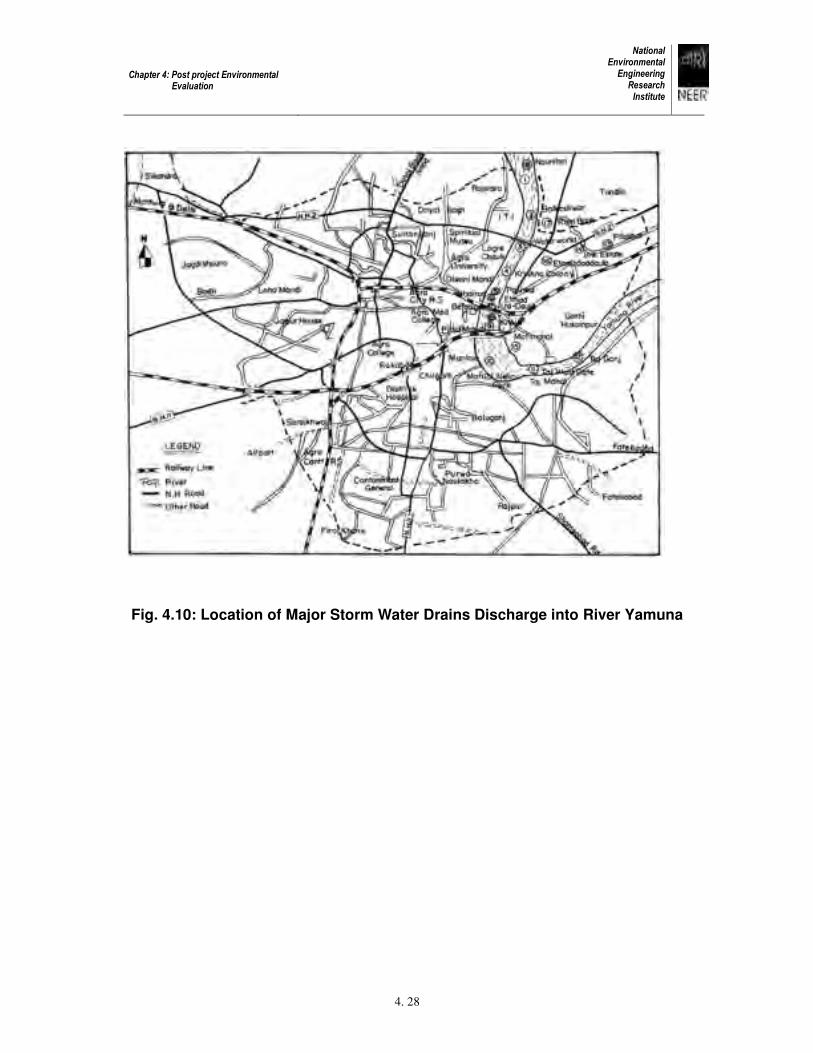
Chapter 4: Post project Environmental Evaluation
National Environmental Engineering Research Institute
4. 28
Fig. 4.10: Location of Major Storm Water Drains Discharge into River Yamuna

Chapter 4: Post project Environmental Evaluation
National Environmental Engineering Research Institute
4. 29
Exhibit 4.1: Broken Storm Water Drains which helps in increasing
Silting and Seepage from the Surrounding Environment
Exhibit 4.2 : Indiscriminate Disposal of Solid Wastes in Open Storm Water Drains
in Azampara drain
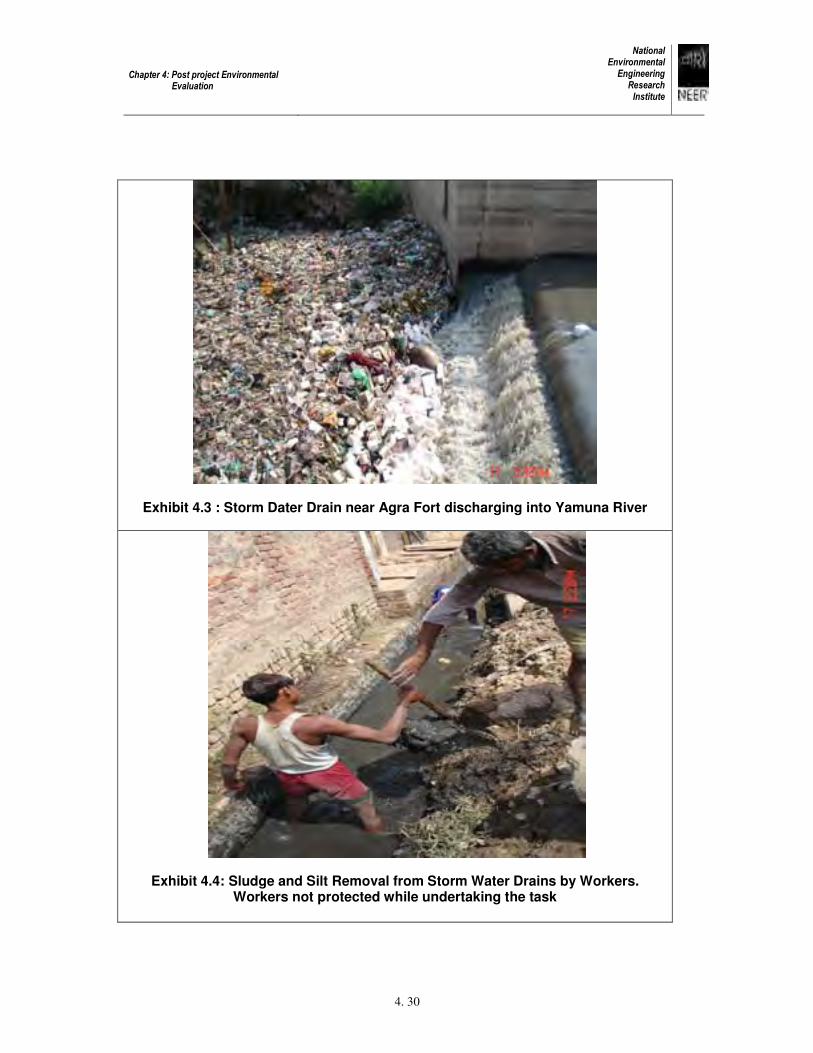
Chapter 4: Post project Environmental Evaluation
National Environmental Engineering Research Institute
4. 30
Exhibit 4.3 : Storm Dater Drain near Agra Fort discharging into Yamuna River
Exhibit 4.4: Sludge and Silt Removal from Storm Water Drains by Workers. Workers not protected while undertaking the task
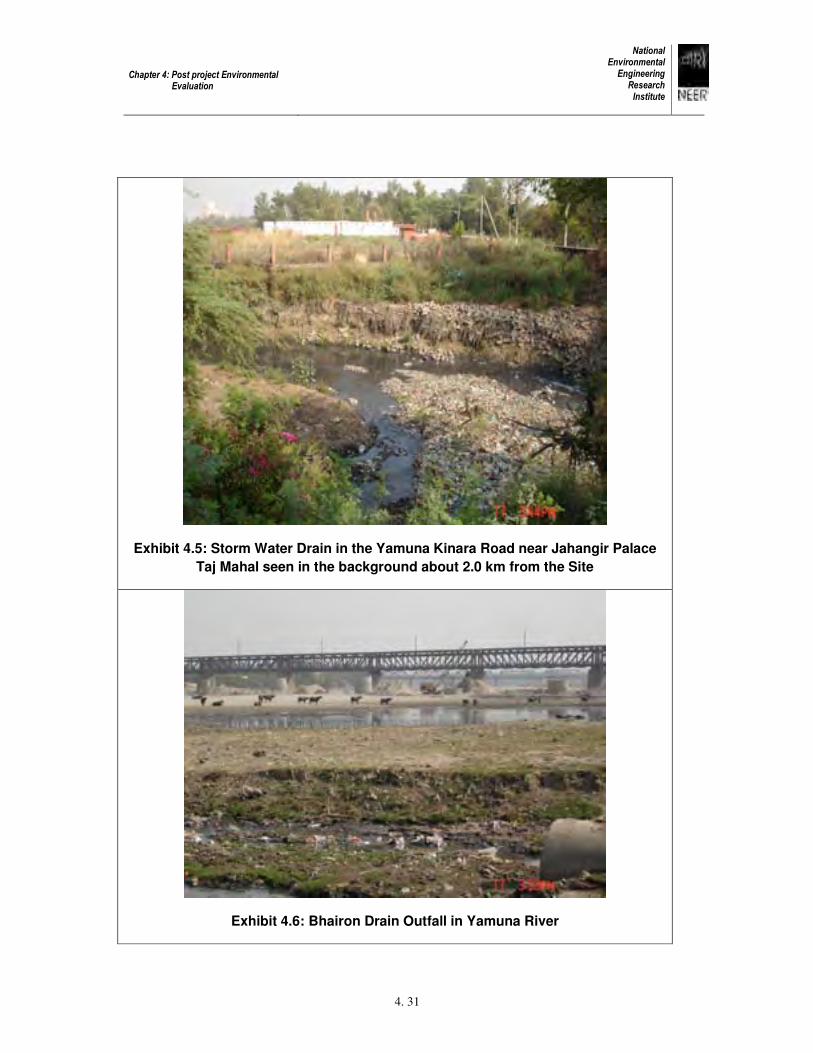
Chapter 4: Post project Environmental Evaluation
National Environmental Engineering Research Institute
4. 31
Exhibit 4.5: Storm Water Drain in the Yamuna Kinara Road near Jahangir Palace
Taj Mahal seen in the background about 2.0 km from the Site
Exhibit 4.6: Bhairon Drain Outfall in Yamuna River

Chapter 4: Post project Environmental Evaluation
National Environmental Engineering Research Institute
4. 32
Exhibit 4.7: Excavated Silt Material in front of a House blocking entry to the House
and reducing the Width of Road
Exhibit 4.8: Excavated Silt and Sludge is dried on the Roads before removed
through Excavator for Disposal into Low-Lying Area

Chapter 4: Post project Environmental Evaluation
National Environmental Engineering Research Institute
4. 33
4.5 Post Environmental Evaluation of Solid Waste Management Project
For proper management of MSW generated at the rate of about 650-710 tonnes per
day, funds of Rs. 749.00 lakh were received in different installments by AMC, which also
included the budgets for construction of latrines and mud pumps in different areas. The amount
was approved in 1998-99 against the proposal submitted by AMC to the government. Table4.7
indicates the amounts released in different installment and their utilization as per the information
provided by Agra Municipal Corporation. As reported by Agra Municipal Corporation, various
infrastructure facilities were established and equipments were procured during project period
(1999-2003). It has also been reported by AMC that, in majority cases, target has been
achieved. Table 4.8 indicates the status of procurement of infrastructure facilities, as reported
by AMC.
The following observations on solid waste management have been made during the
visit of the NEERI scientists:
Observations on Collection and Storage System for MSW
• House to house collection is not carried out rigorously
• Segregation of dry waste and wet waste is not carried out in an organized manner
and on a large scale. Even in some community bins, biomedical waste was found
along with municipal solid waste
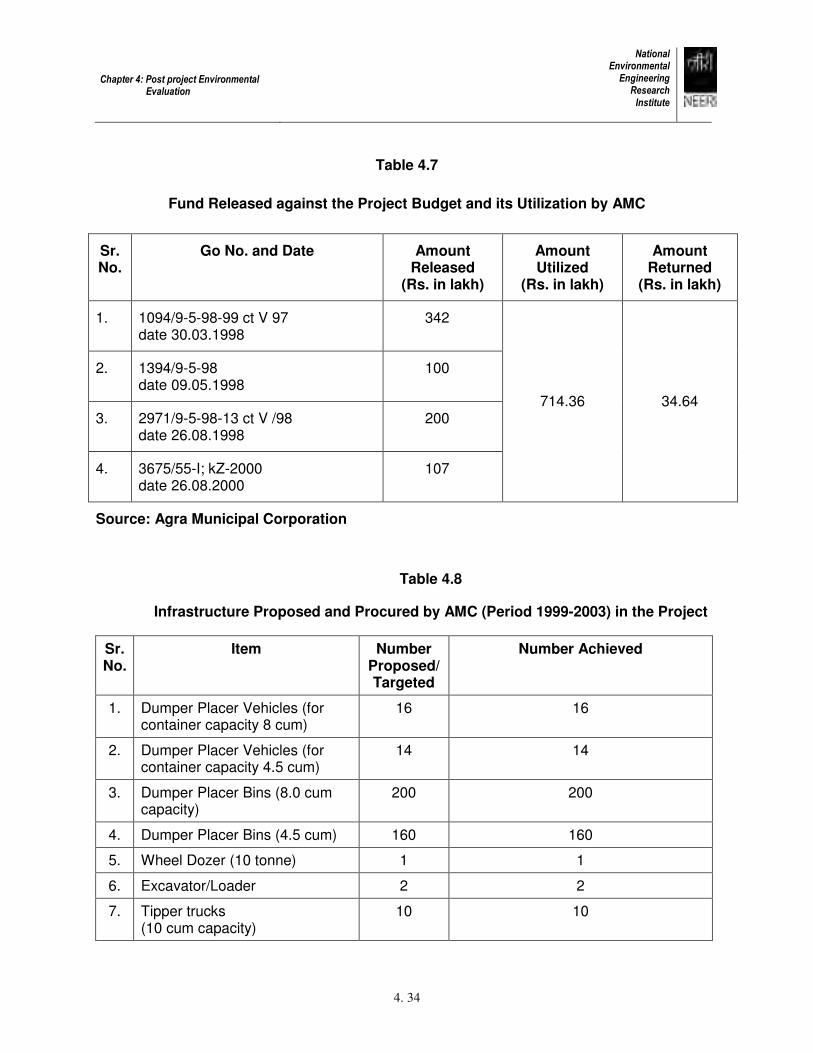
Chapter 4: Post project Environmental Evaluation
National Environmental Engineering Research Institute
4. 34
Table 4.7
Fund Released against the Project Budget and its Utilization by AMC
Sr. No.
Go No. and Date Amount Released
(Rs. in lakh)
Amount Utilized
(Rs. in lakh)
Amount Returned
(Rs. in lakh)
1. 1094/9-5-98-99 ct V 97 date 30.03.1998
342
2. 1394/9-5-98 date 09.05.1998
100
3. 2971/9-5-98-13 ct V /98 date 26.08.1998
200
4. 3675/55-I; kZ-2000 date 26.08.2000
107
714.36 34.64
Source: Agra Municipal Corporation
Table 4.8
Infrastructure Proposed and Procured by AMC (Period 1999-2003) in the Project
Sr. No.
Item Number Proposed/ Targeted
Number Achieved
1. Dumper Placer Vehicles (for container capacity 8 cum)
16 16
2. Dumper Placer Vehicles (for container capacity 4.5 cum)
14 14
3. Dumper Placer Bins (8.0 cum capacity)
200 200
4. Dumper Placer Bins (4.5 cum) 160 160
5. Wheel Dozer (10 tonne) 1 1
6. Excavator/Loader 2 2
7. Tipper trucks (10 cum capacity)
10 10
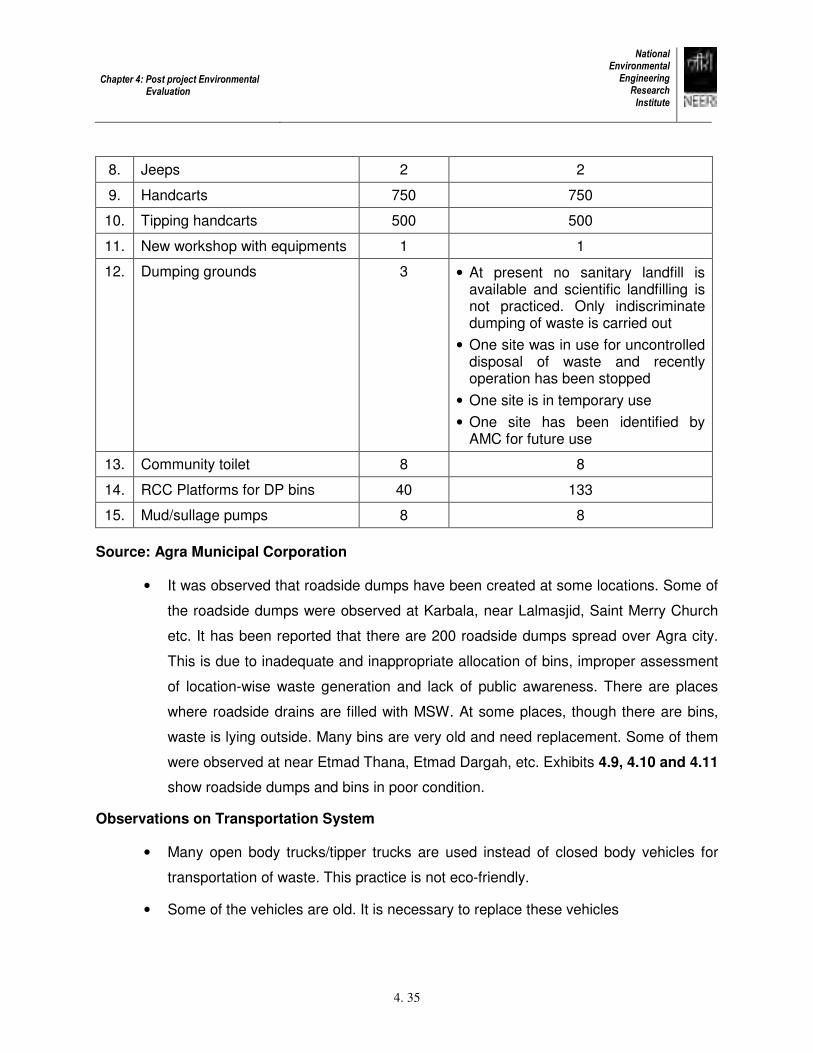
Chapter 4: Post project Environmental Evaluation
National Environmental Engineering Research Institute
4. 35
8. Jeeps 2 2
9. Handcarts 750 750
10. Tipping handcarts 500 500
11. New workshop with equipments 1 1
12. Dumping grounds 3 • At present no sanitary landfill is available and scientific landfilling is not practiced. Only indiscriminate dumping of waste is carried out
• One site was in use for uncontrolled disposal of waste and recently operation has been stopped
• One site is in temporary use
• One site has been identified by AMC for future use
13. Community toilet 8 8
14. RCC Platforms for DP bins 40 133
15. Mud/sullage pumps 8 8
Source: Agra Municipal Corporation
• It was observed that roadside dumps have been created at some locations. Some of
the roadside dumps were observed at Karbala, near Lalmasjid, Saint Merry Church
etc. It has been reported that there are 200 roadside dumps spread over Agra city.
This is due to inadequate and inappropriate allocation of bins, improper assessment
of location-wise waste generation and lack of public awareness. There are places
where roadside drains are filled with MSW. At some places, though there are bins,
waste is lying outside. Many bins are very old and need replacement. Some of them
were observed at near Etmad Thana, Etmad Dargah, etc. Exhibits 4.9, 4.10 and 4.11
show roadside dumps and bins in poor condition.
Observations on Transportation System
• Many open body trucks/tipper trucks are used instead of closed body vehicles for
transportation of waste. This practice is not eco-friendly.
• Some of the vehicles are old. It is necessary to replace these vehicles

Chapter 4: Post project Environmental Evaluation
National Environmental Engineering Research Institute
4. 36
• At present no MSW transfer station is available at Agra. This creates problems
specially when the collection spots are located far away from the disposal site
• Some vehicles are parked in open place. This deteriorates the condition of vehicles
and causes reduction of active life of the vehicle
Observations on Disposal System
• There is no sanitary landfill site for MSW disposal assigned for Agra city. Therefore,
MSW is dumped openly in specific locations. At these sites there are no liners and
leachate collection facility. Compaction of waste is not carried out. Soil cover is not
applied over the waste. The previous dumping ground was located at Shahdra near
Nangla-Rambal area. Recently, dumping of MSW in this area has been discontinued.
At present, MSW is dumped near Chhalesar (West) railway station. Uncontrolled
disposal is being practiced in this area also. A site at Kuberpur (near modern
slaughter house) has been proposed for developing sanitary landfill. Exhibits 4.12 to
4.17 show the old, present and proposed disposal sites of Agra.
Exhibit 4.9: Open Roadside Dumps
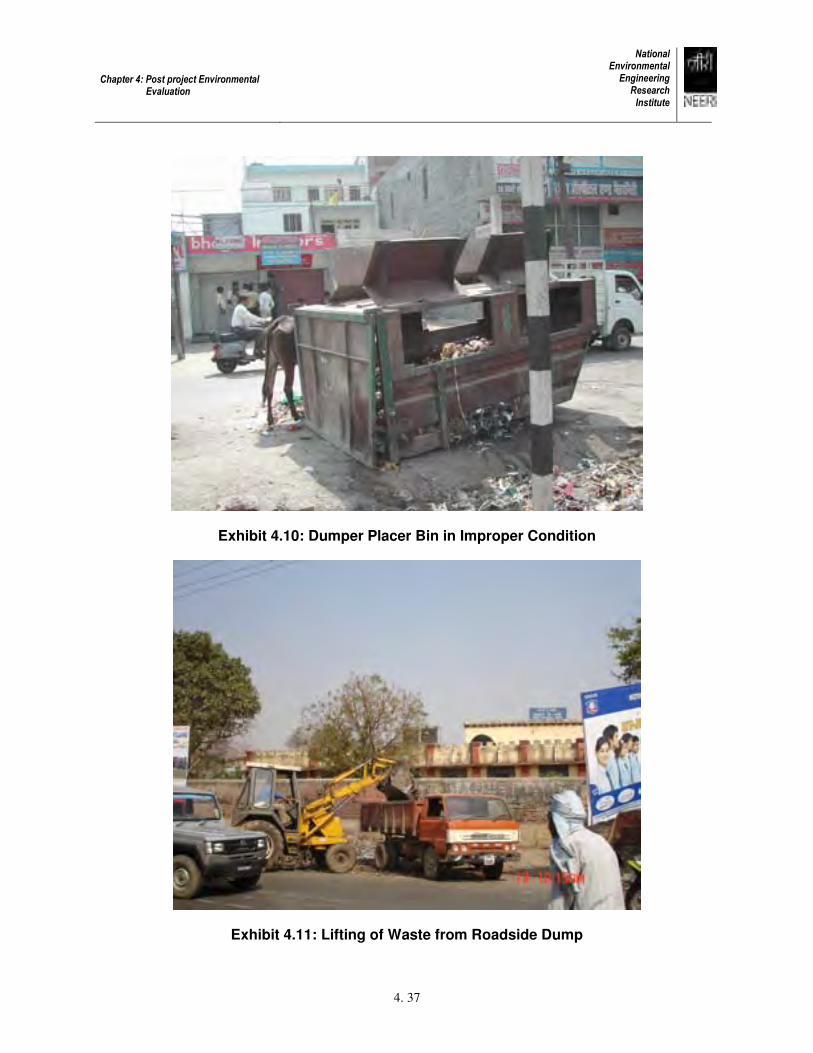
Chapter 4: Post project Environmental Evaluation
National Environmental Engineering Research Institute
4. 37
Exhibit 4.10: Dumper Placer Bin in Improper Condition
Exhibit 4.11: Lifting of Waste from Roadside Dump
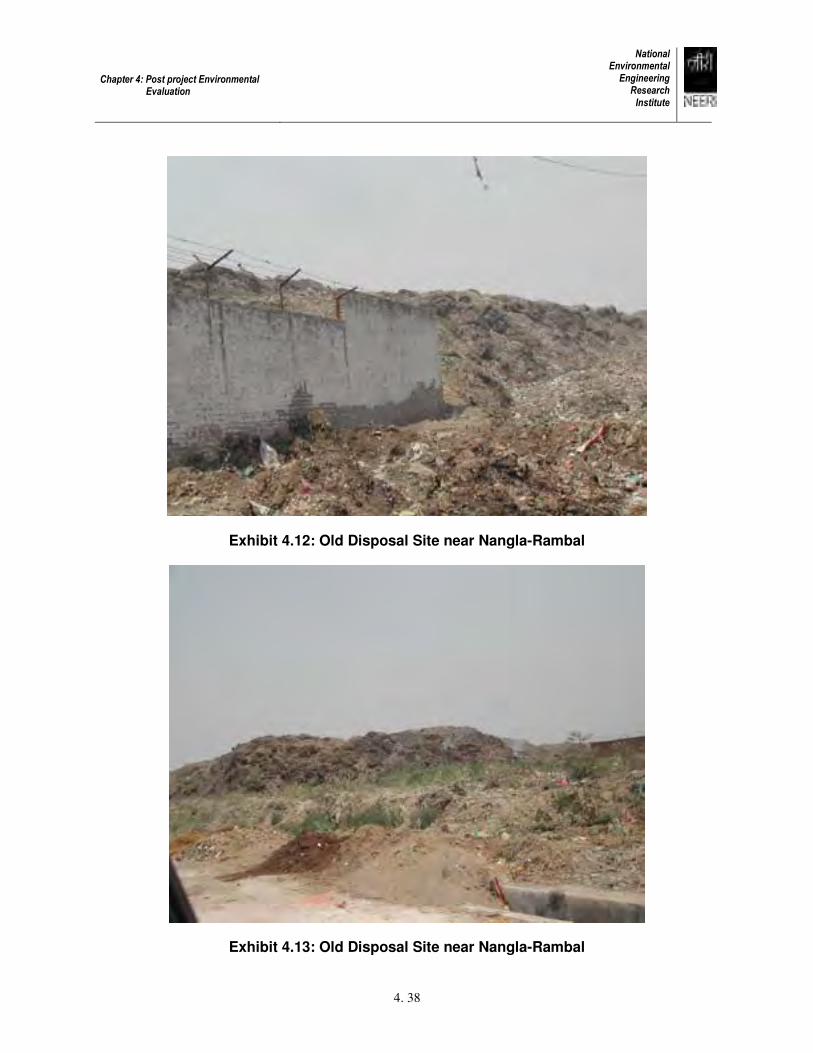
Chapter 4: Post project Environmental Evaluation
National Environmental Engineering Research Institute
4. 38
Exhibit 4.12: Old Disposal Site near Nangla-Rambal
Exhibit 4.13: Old Disposal Site near Nangla-Rambal
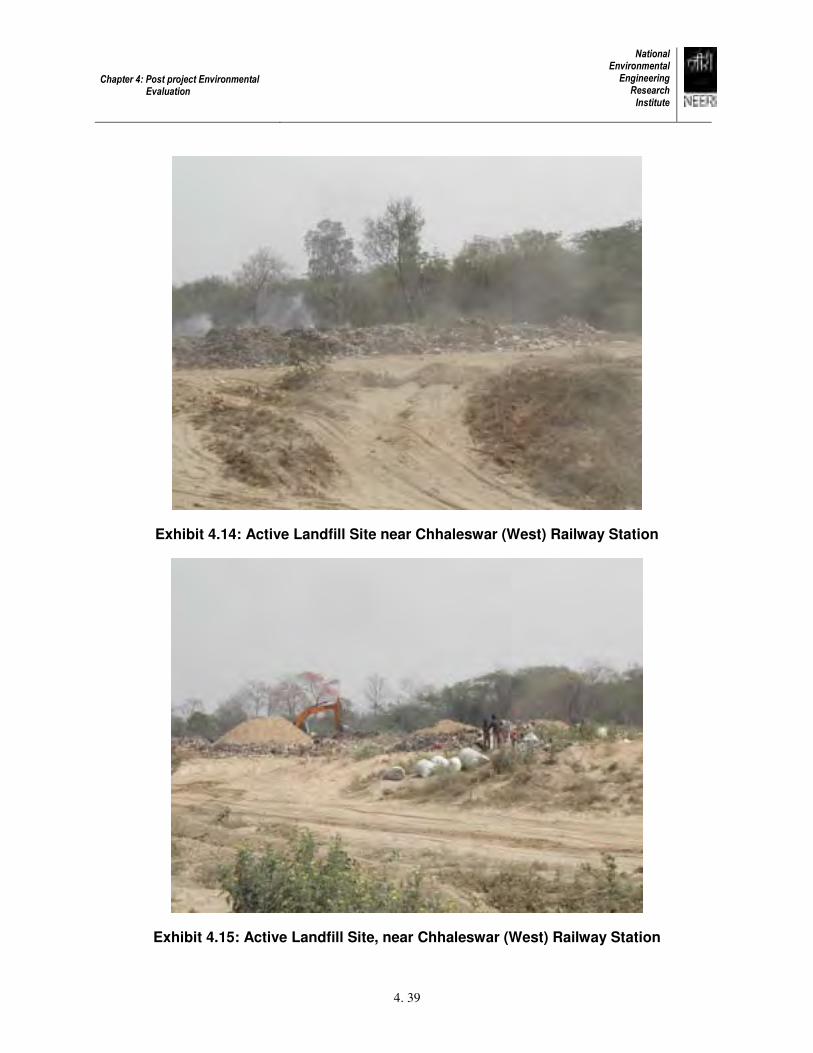
Chapter 4: Post project Environmental Evaluation
National Environmental Engineering Research Institute
4. 39
Exhibit 4.14: Active Landfill Site near Chhaleswar (West) Railway Station
Exhibit 4.15: Active Landfill Site, near Chhaleswar (West) Railway Station
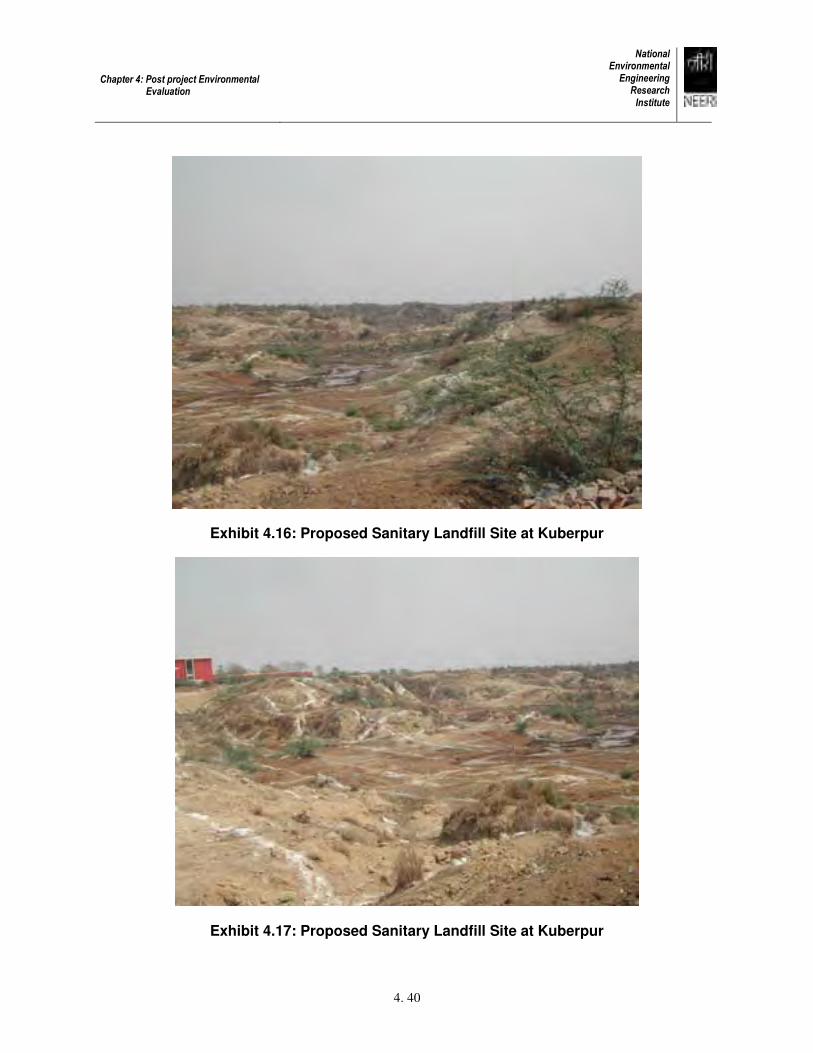
Chapter 4: Post project Environmental Evaluation
National Environmental Engineering Research Institute
4. 40
Exhibit 4.16: Proposed Sanitary Landfill Site at Kuberpur
Exhibit 4.17: Proposed Sanitary Landfill Site at Kuberpur
Chapter 4: Post project Environmental Evaluation
National Environmental Engineering Research Institute
4. 41
Observations on Processing System
• No proper waste processing facility for treating a large amount of biodegradables is
available in Agra.
Observations on Occupational Heath Aspects
• At present only dresses/uniforms are provided to the workers. No protective
materials are provided to the workers for protection of health.
• Heath check up programme for workers is not conducted
Ranking of Existing Solid Waste Management System
Ranking exercise has been carried out to evaluate the existing solid waste
management system. A maximum mark of 1000 was distributed to the following activities/factors
influencing the management activities on the basis of importance.
• Waste characteristics
• Climatic condition
• Collection of waste
• Storage of waste
• Transportation of waste
• Treatment of waste
• Disposal of waste
Various criteria were identified for each activity and accordingly the marks were
allotted. Four gradations viz., very good, good, fair, and not satisfactory were assigned against
different ranges of score. Criteria and results of ranking are presented in Table 4.9 and 4.10. As
per ranking, solid waste management of Agra can be placed in ‘fair’ category.
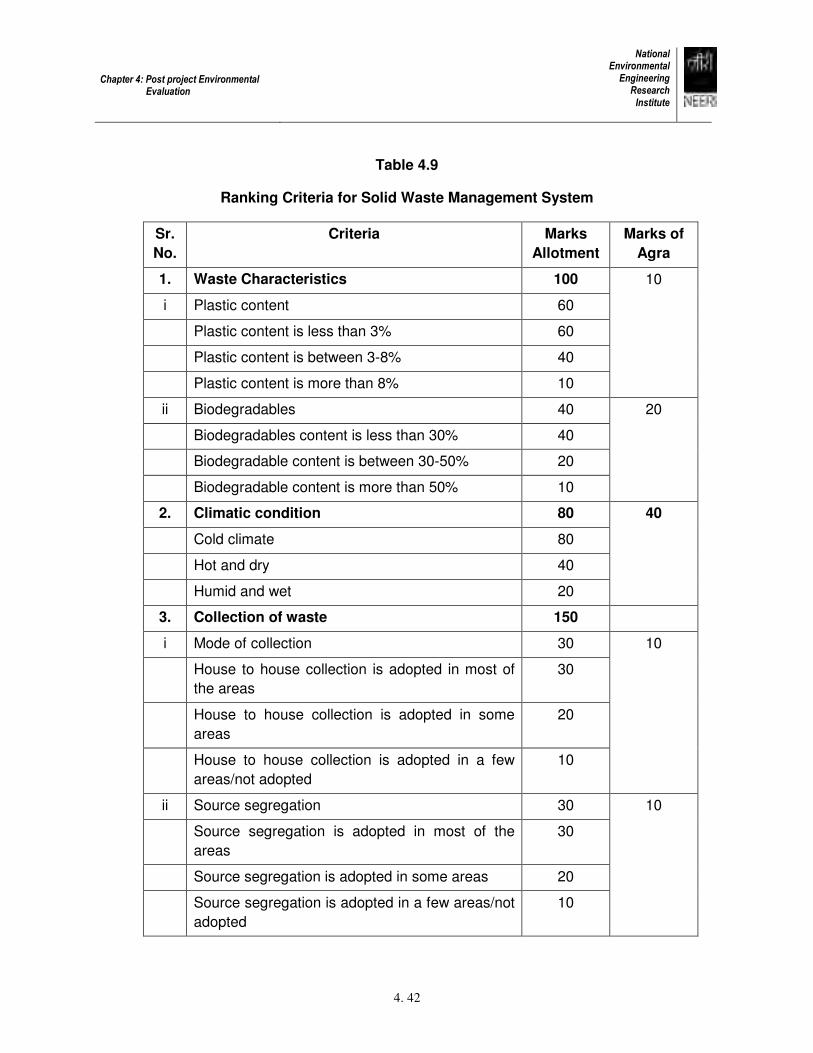
Chapter 4: Post project Environmental Evaluation
National Environmental Engineering Research Institute
4. 42
Table 4.9
Ranking Criteria for Solid Waste Management System
Sr.
No.
Criteria Marks
Allotment
Marks of
Agra
1. Waste Characteristics 100
i Plastic content 60
Plastic content is less than 3% 60
Plastic content is between 3-8% 40
Plastic content is more than 8% 10
10
ii Biodegradables 40
Biodegradables content is less than 30% 40
Biodegradable content is between 30-50% 20
Biodegradable content is more than 50% 10
20
2. Climatic condition 80
Cold climate 80
Hot and dry 40
Humid and wet 20
40
3. Collection of waste 150
i Mode of collection 30
House to house collection is adopted in most of
the areas
30
House to house collection is adopted in some
areas
20
House to house collection is adopted in a few
areas/not adopted
10
10
ii Source segregation 30
Source segregation is adopted in most of the
areas
30
Source segregation is adopted in some areas 20
Source segregation is adopted in a few areas/not
adopted
10
10
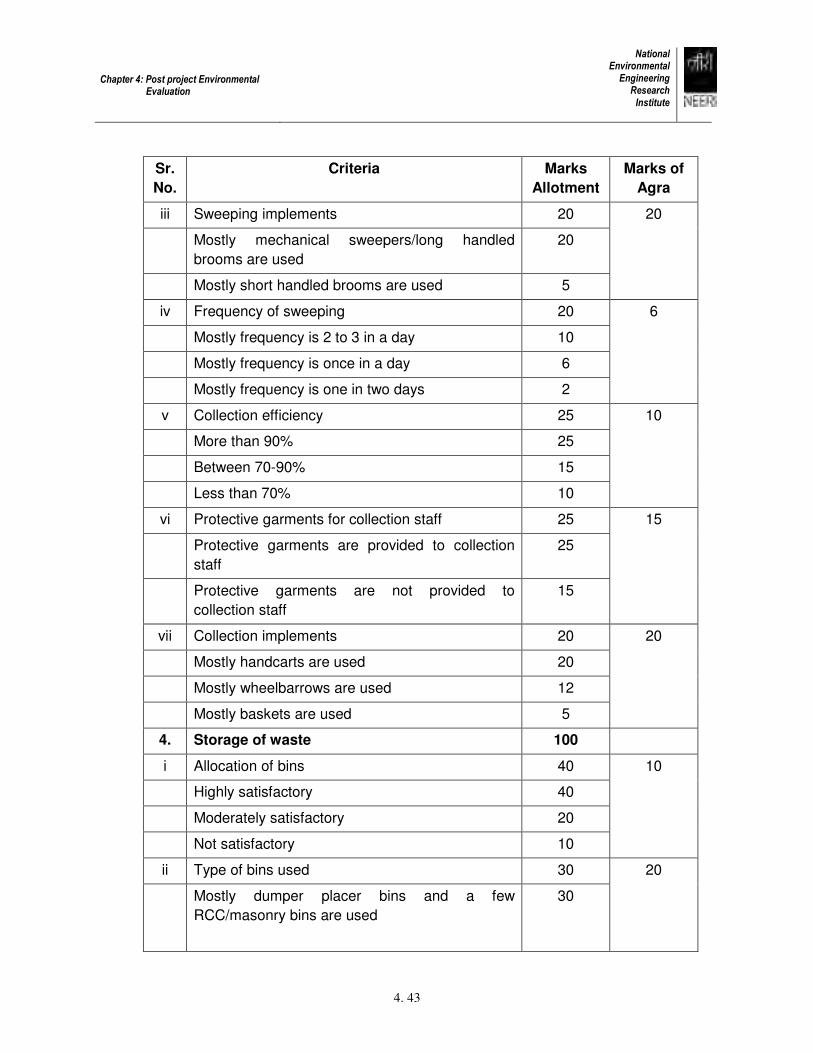
Chapter 4: Post project Environmental Evaluation
National Environmental Engineering Research Institute
4. 43
Sr.
No.
Criteria Marks
Allotment
Marks of
Agra
iii Sweeping implements 20
Mostly mechanical sweepers/long handled
brooms are used
20
Mostly short handled brooms are used 5
20
iv Frequency of sweeping 20
Mostly frequency is 2 to 3 in a day 10
Mostly frequency is once in a day 6
Mostly frequency is one in two days 2
6
v Collection efficiency 25
More than 90% 25
Between 70-90% 15
Less than 70% 10
10
vi Protective garments for collection staff 25
Protective garments are provided to collection
staff
25
Protective garments are not provided to
collection staff
15
15
vii Collection implements 20
Mostly handcarts are used 20
Mostly wheelbarrows are used 12
Mostly baskets are used 5
20
4. Storage of waste 100
i Allocation of bins 40
Highly satisfactory 40
Moderately satisfactory 20
Not satisfactory 10
10
ii Type of bins used 30
Mostly dumper placer bins and a few
RCC/masonry bins are used
30
20
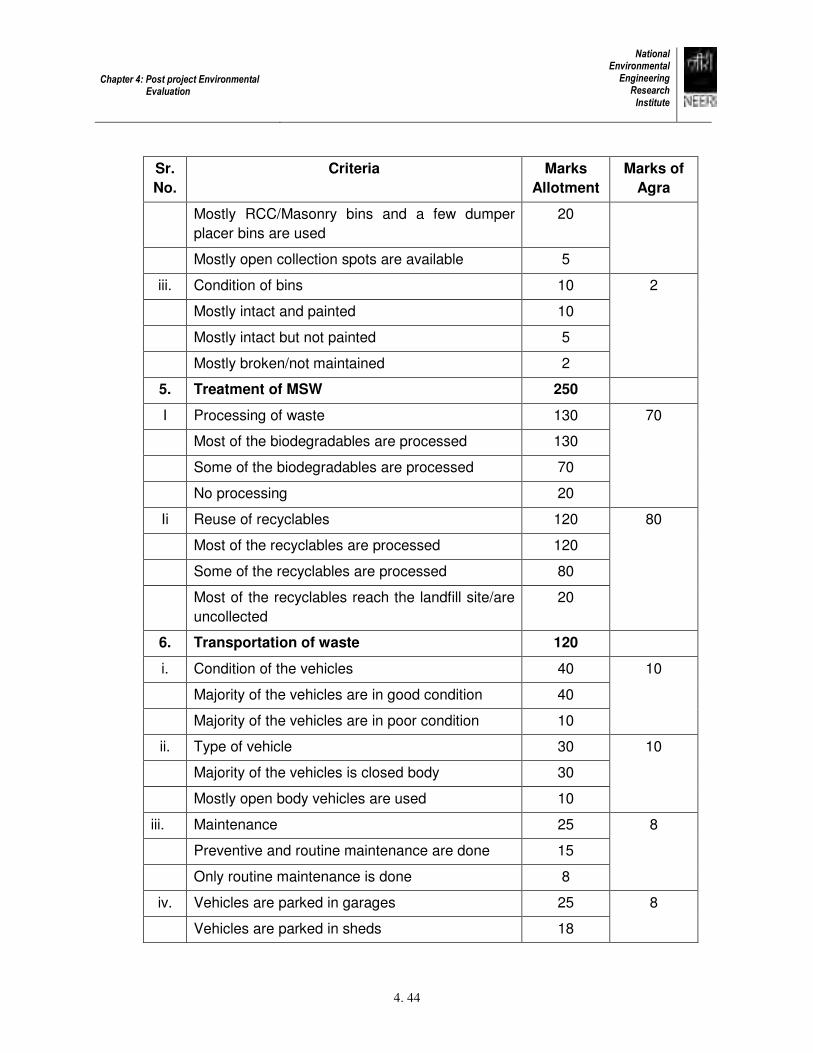
Chapter 4: Post project Environmental Evaluation
National Environmental Engineering Research Institute
4. 44
Sr.
No.
Criteria Marks
Allotment
Marks of
Agra
Mostly RCC/Masonry bins and a few dumper
placer bins are used
20
Mostly open collection spots are available 5
iii. Condition of bins 10
Mostly intact and painted 10
Mostly intact but not painted 5
Mostly broken/not maintained 2
2
5. Treatment of MSW 250
I Processing of waste 130
Most of the biodegradables are processed 130
Some of the biodegradables are processed 70
No processing 20
70
Ii Reuse of recyclables 120
Most of the recyclables are processed 120
Some of the recyclables are processed 80
Most of the recyclables reach the landfill site/are
uncollected
20
80
6. Transportation of waste 120
i. Condition of the vehicles 40
Majority of the vehicles are in good condition 40
Majority of the vehicles are in poor condition 10
10
ii. Type of vehicle 30
Majority of the vehicles is closed body 30
Mostly open body vehicles are used 10
10
iii. Maintenance 25
Preventive and routine maintenance are done 15
Only routine maintenance is done 8
8
iv. Vehicles are parked in garages 25
Vehicles are parked in sheds 18
8
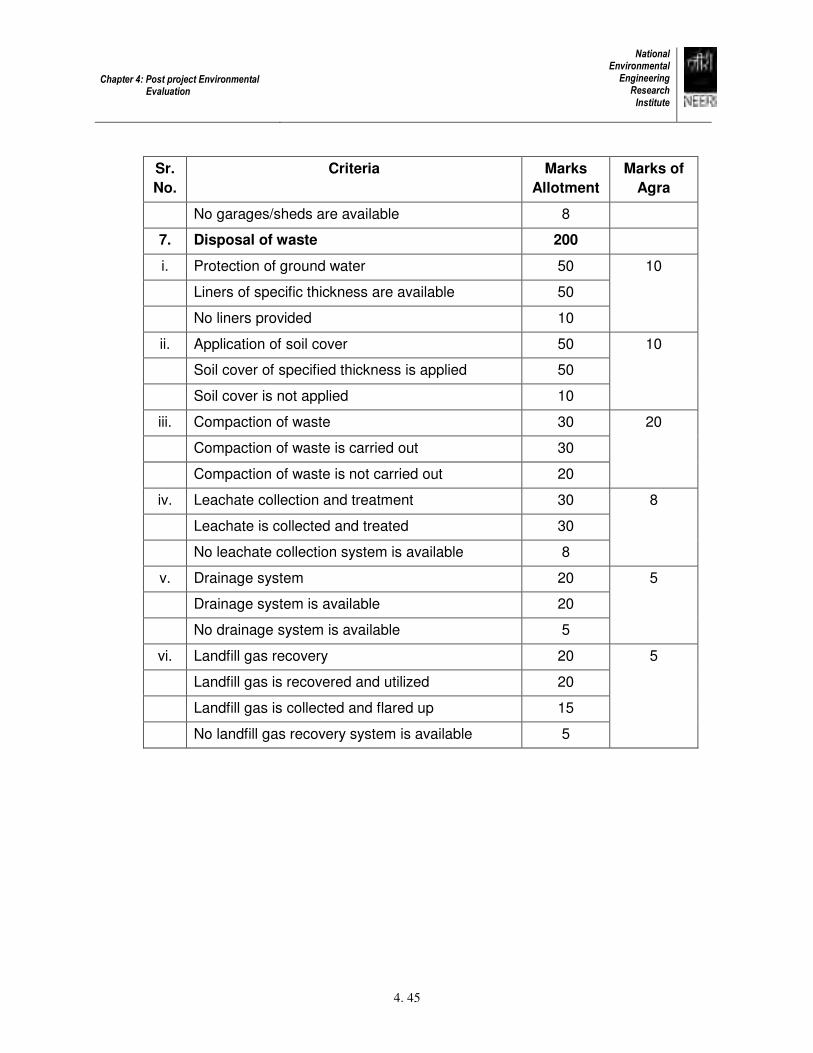
Chapter 4: Post project Environmental Evaluation
National Environmental Engineering Research Institute
4. 45
Sr.
No.
Criteria Marks
Allotment
Marks of
Agra
No garages/sheds are available 8
7. Disposal of waste 200
i. Protection of ground water 50
Liners of specific thickness are available 50
No liners provided 10
10
ii. Application of soil cover 50
Soil cover of specified thickness is applied 50
Soil cover is not applied 10
10
iii. Compaction of waste 30
Compaction of waste is carried out 30
Compaction of waste is not carried out 20
20
iv. Leachate collection and treatment 30
Leachate is collected and treated 30
No leachate collection system is available 8
8
v. Drainage system 20
Drainage system is available 20
No drainage system is available 5
5
vi. Landfill gas recovery 20
Landfill gas is recovered and utilized 20
Landfill gas is collected and flared up 15
No landfill gas recovery system is available 5
5
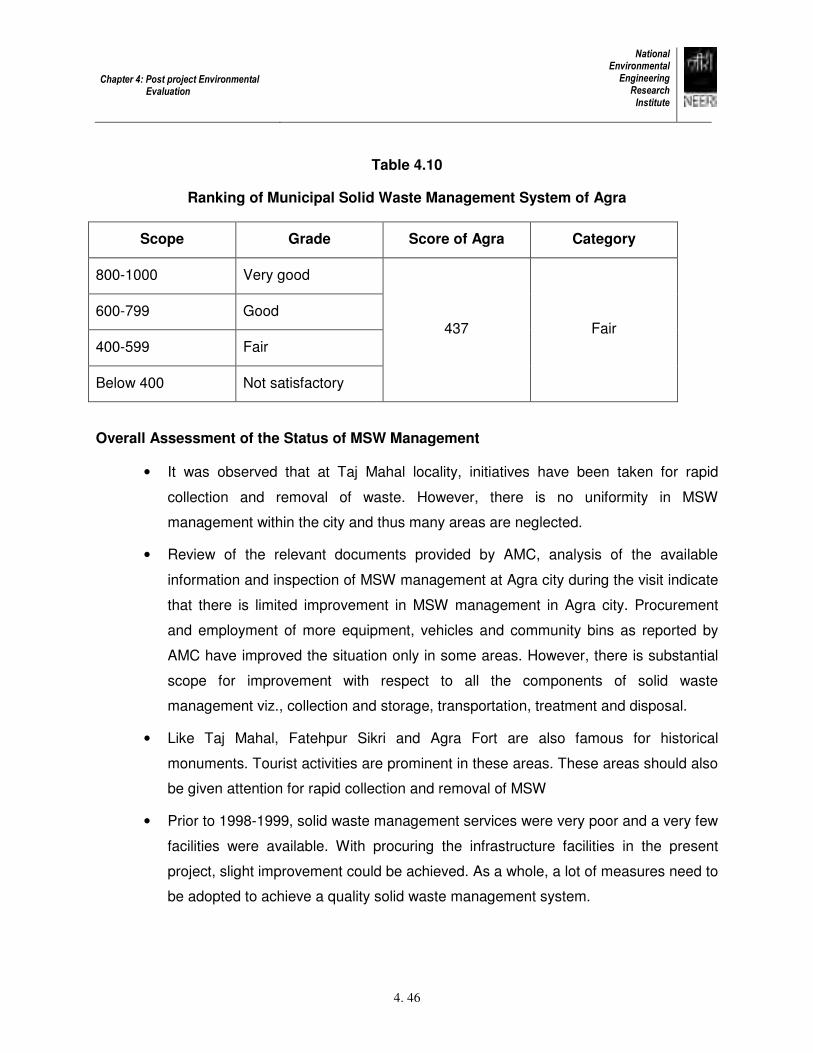
Chapter 4: Post project Environmental Evaluation
National Environmental Engineering Research Institute
4. 46
Table 4.10
Ranking of Municipal Solid Waste Management System of Agra
Scope Grade Score of Agra Category
800-1000 Very good
600-799 Good
400-599 Fair
Below 400 Not satisfactory
437 Fair
Overall Assessment of the Status of MSW Management
• It was observed that at Taj Mahal locality, initiatives have been taken for rapid
collection and removal of waste. However, there is no uniformity in MSW
management within the city and thus many areas are neglected.
• Review of the relevant documents provided by AMC, analysis of the available
information and inspection of MSW management at Agra city during the visit indicate
that there is limited improvement in MSW management in Agra city. Procurement
and employment of more equipment, vehicles and community bins as reported by
AMC have improved the situation only in some areas. However, there is substantial
scope for improvement with respect to all the components of solid waste
management viz., collection and storage, transportation, treatment and disposal.
• Like Taj Mahal, Fatehpur Sikri and Agra Fort are also famous for historical
monuments. Tourist activities are prominent in these areas. These areas should also
be given attention for rapid collection and removal of MSW
• Prior to 1998-1999, solid waste management services were very poor and a very few
facilities were available. With procuring the infrastructure facilities in the present
project, slight improvement could be achieved. As a whole, a lot of measures need to
be adopted to achieve a quality solid waste management system.

Chapter 4: Post project Environmental Evaluation
National Environmental Engineering Research Institute
4. 47
• As per ranking exercise, score for Agra is 437 out of 1000 which comes under fair
category. To upgrade the solid waste management system, there is necessity to
adopt further improvement measures
• Comprehensive DPR was not available. This is needed for comprehensive studies
on solid waste management.
CChhaapptteerr 55
EEnnvviirroonnmmeennttaall
MMaannaaggeemmeenntt PPllaann
5.1 For Electricity Related Projects
• The threat of soil erosion around the towers can be alleviated by building a foundation
embankment or contouring on sloping land
• Trees posing safety hazard because they are too close to transmission lines should
be trimmed down periodically
• Efficiency measurement of the electricity distribution system (transmission and
transformation) should be carried out
• Frequency of load shedding and cuts should be monitored and documented
• Extent of improvement in living conditions of the population and contribution to
poverty alleviation and economic growth in the target area should be documented
• Steps should be taken to increase the efficiency, reliability, and quality of electricity
supply
Chapter 5:Environmental Management Plan
National Environmental Engineering Research Institute
5. 2
• Steps should be taken to reduce power cuts during peak time thereby limiting the use
of private diesel powered generators
5.2 For Road Related Projects
• The roads shoulders should be paved to keep them free from vegetative growth
• Proper road drainage system should be in place and the drainage system should be
periodically cleared so as to ensure water flow
• Truckers should be restrained from overloading
• Vehicles carrying loose materials should be covered to prevent spillage
• Trees should be replanted on roadsides wherever feasible to arrest traffic pollution,
absorb noise and provide alternative fuel source
• Slopes along the roadsides should be stabilized to avoid road cutting/deterioration by
e.g. planting grass on slopes
• Emergency response system should be in place to offset accidents involving
transportation of hazardous material
• There should be a proper coordination between transportation and RTO to prevent
traffic jams
• Vehicle exhaust inspection system should be enhanced
• Unqualified vehicles should not be permitted to operate
• Road surface condition should be maintained to reduce noise pollution
• Any ditches/pot holes on the road surface should be immediately repaired/filled
• Traffic signs, regulating the speed of the vehicles should be erected and maintained
to enhance the efficiency of the vehicles
• Traffic rules should be strictly enforced
5.3 For Gokul Barrage
• Resource operation plan and environment management system should be prepared
and implemented
• Downstream minimum flow should be maintained

Chapter 5:Environmental Management Plan
National Environmental Engineering Research Institute
5. 3
• Forcing factors or system states should be monitored
� Algae
The environmental conditions within the rivers impounded behind the barrage favours
formation of large blooms of planktonic algae. Blooms can die forming scums on the
surface of the water and is unsightly and giving rise to malodours as they
decompose. Blue-green algal scums are reported to contain toxins that could pose a
risk to public health. Decaying blooms also cause a dip in the oxygen concentration.
This is of particular concern that toxic algae can poison fish and other wildlife within
the lake and also pose a threat to public health. Periodical monitoring and clearing
mechanisms should to be devised.
� Dissolved oxygen
Warm weather and little wind reduces the dissolved oxygen concentration in the
deeper waters. Low dissolved oxygen levels could significantly impact upon the fish,
invertebrate and birds living in the barrage. The dissolved oxygen concentration
levels should be a minimum of 5mg/l in all places and all times. Continuous real-time
water quality monitoring and routine water quality sampling analysis facilitate the
measurement of dissolved oxygen levels.
� Groundwater
Groundwater should be analysed on a regular basis to check for deterioration in
quality. Ground and river water quality should be monitored regularly.
� Water related health problems.
Increased incidences of malaria, hepatitis and stomach related ailments are largely
associated with water contamination. The severity of health related problems indicate
that problem is largely related to water and its management.
• Sufficient upstream measure should be taken to prevent breach
• Water level, flow rate, ground water level, water quality, biological indicators, bed
level change, condition of structure, sluices, power supply, effluent loading (if any) etc
should regularly be monitored
Chapter 5:Environmental Management Plan
National Environmental Engineering Research Institute
5. 4
• Accidents/incident/near misses should be recorded
• Contingency plan should be prepared and implemented
• Silt/sediment/accretion should be periodically removed
• The EMP should be revised in the event of change in effluent loading (if any), change
in upstream/downstream water quality, engineering works, abstraction
5.4 For Storm Water Drainage
A write up on guidelines for preparation of EMP for storm water management
system is appended as Annexure-VII.
• A map illustrating areas to be protected/restored together with proposed development
patterns
• Preliminary design of restoration/enhancement measures, e.g., proposed cross-
section of terrestrial/aquatic/recreation corridor
• Summary of findings from the eenvironmental impact statement
• Location sizing and preliminary design of all SWMPs, together with drainage areas
• Identification of areas where special consideration is required at the subdivision plan
stage, e.g., areas requiring grading limits and tree preservation planning
• Detailed description of steps to be undertaken at the subdivision plan phase
• Preliminary sediment control plan
• Operation and maintenance considerations
• Other deliverables that may be presented, depending upon the level of details and
preference/requirements of the agencies include: land use patterns
• Open areas
The integration of storm water management initiatives as components of the
open areas system contributes to the realization of these goals by increasing the physical
area of available open space, enhancing terrestrial and aquatic habitat diversity and
enhancing recreational and educational opportunities. The following are examples of
Chapter 5:Environmental Management Plan
National Environmental Engineering Research Institute
5. 5
techniques which have been applied to integrate storm water management initiatives and
enhance the open space network:
• Incorporation of wet ponds and wetlands within active or passive parks as ecological
or recreational features
• Integration of ponds and wetlands with school blocks to provide outdoor
environmental education opportunities
• Design of pond systems to replicate a new valley corridor and extension of a tributary
of an existing river system
• Design of a series of wet ponds as an aesthetic feature or entrance feature within a
community
• Creation of a wetland as an extension of an existing forest community
• Integration of playfields within the basin of a dry detention pond
• Design of subsurface storage and/or infiltration systems beneath playfields within
parks or school yards
• Installation of infiltration galleries beneath walkways as part of a recreational trail
system
• Incorporation of a constructed biofilters as an educational amenity within a park
5.5 EMP for Solid Waste Management
Environmental management plan for solid waste is delineated in keeping with the
guidelines of Municipal Solid Waste (Management & Handling) Rules, 2000. The various
improvement measures needed to be adopted are as follows:
Improvement Measures for Collection and Storage of Waste
• House to house collection involves door to door collection. The system should be
adopted in various areas of Agra. Waste may be collected at specific time by
municipal corporation staff from houses. Containerized handcarts with bell ringing
system, tricycles with container, and small vehicles with separate compartments for
dry and wet waste can be provided for this purpose.
• Source segregation of dry and wet waste should be carried out. Dry waste includes
paper, plastic, metals, glass etc. Wet waste includes leaf, vegetables, fruits, food
waste etc. Dry and wet waste should be collected separately.
Chapter 5:Environmental Management Plan
National Environmental Engineering Research Institute
5. 6
• Community bins used for storage of waste should be placed at appropriate locations.
The rationality in allocation of bins should be maintained. Factors like magnitude of
waste generation and resident’s convenience should be taken into consideration.
• Old community bins should be removed after expiry of life period and new bins should
be installed
• To avoid double handling of waste, closed metallic containers, which are lifted by
dumper placers, can be used.
• Community bins should be emptied regularly. The bins should not be in overflowing
condition creating unhygienic condition
• Community bins should be closed type
• Road sweeping should be done at least twice a day
• Long handled brooms or mechanical sweepers should be used in place of short-
handled brooms
• All roadside dumps should be removed
• Proper work allotment to the sweeping staff should be facilitated
• In the slum areas, sometimes road width is very small. So entry of even tricycles,
handcarts are also difficult. For collection of waste, small bins should be provided in
those areas
• Industrial and biomedical wastes should not be mixed with MSW as they are
governed by separate Rules and Regulations
• Horticulture waste, debris, and slaughter house waste should be collected separately
Improvement Measures for Transportation System
• Vehicle routes should be properly planned
• Dumper placer vehicles can be attached with metallic container for carrying the
containers to the disposal site and after emptying, the containers to be brought back
to the original position along the roadsides. This system avoids double handling of
waste
• The vehicles should be closed
• All the vehicles should be kept at covered space of garages or covered parking place

Chapter 5:Environmental Management Plan
National Environmental Engineering Research Institute
5. 7
• Old vehicles should be replaced by new ones for economy and better efficiency
• Transfer stations can be provided when the collection points are far away from the
disposal site
• Preventive and routine maintenance should be facilitated at the workshop
• The workshop should be provided with the necessary equipments
Improvement in Disposal System of MSW
At present uncontrolled land filling is practiced at Agra. It is necessary to develop
and operate sanitary landfill for municipal solid waste following guidelines of Municipal Solid
Wastes (Management and Handling) Rules, 2000. Selection of the landfill site should be
based on environmental considerations, geological and hydrogeological factors. It is also
desirable to follow the following factors:
• Developing a sanitary landfill which can be operated for 20-25 years
• Landfill site shall be away from the habitation clusters, forest areas, water bodies,
monuments, national parks, wet lands and places of cultural, historical or religious
importance
• A buffer zone should be developed around the landfill site
• Landfill site should be located minimum 20 km away from the airport
• Proper approach road for the landfill should be developed
• Proper fencing should be provided around the landfill site to prevent unauthorized
entry of persons or entry of animals
• Weighbridge facility should be provided for regular entry of quantity of waste reaching
the landfill site
• Landfill site should be provided with office facility for record keeping, monitoring and
other relevant activities
• Time to time health inspection of the solid waste management workers should be
facilitated
• Safety measures for the workers should be adopted. Fire fighting equipment should
be provided at the site

Chapter 5:Environmental Management Plan
National Environmental Engineering Research Institute
5. 8
• First-aid facility should be made available
• Drinking water facility and electrical lighting arrangements should be made available
Salient Features of Sanitary Landfill
Salient features of sanitary landfill are as follows:
• A composite liner comprising of high density polyethylene (HDPE) of thickness 1.5
mm and clay of thickness 90 cm should be provided at the bottom and sites of the
landfill
• Permeability coefficient of the soil should be less than or equal to 1 x 10⁻⁷ cm per
second
• Compaction of waste should be carried out by compactors
• Level of the ground water table should be at least 2 m below the base of the landfill
• Leachate collection, storage and treatment system should be provided
• Monitoring of ground water quality should be conducted at regular interval
• Gas collection facility with provision for flaring up or utilization should be installed
• During operation of the landfill, soil cover or debris of 10 cm thickness should be
provided
• An intermediate cover of 65 cm thickness can be applied prior to rainy season
Closure of the Landfill Site
The following measures need to be adopted during closure of the landfill site:
• Soil cover of thickness 60 cm and permeability coefficient less than or equal to
1 x 10⁻⁷ cm should be applied
• A drainage layer of thickness 15 cm should be provided on top of soil layer
• A vegetable layer of thickness 45 cm should be provided at the top
Improvement Measures for Processing Facility

Chapter 5:Environmental Management Plan
National Environmental Engineering Research Institute
5. 9
Proper utilization of the recyclables like plastics, metals, glass and paper is a
pathway of waste minimization. Proper waste segregation should be practised followed by
conversion of recyclable constituents to value added products.
Compost is a good soil conditioner and can be used in agriculture and gardening.
However, composting should be done in an environment-friendly manner. Guidelines
provided in the rules should also be followed.
There are many processing options available like thermal processing with energy
recovery, bio-processing, refuse derived fuel, etc. However, before adoption of any particular
technology, there is a need to examine the following factors:
• Whether the technologies are sustainable to meet the future need
• Whether the technologies are environment-friendly and cost-effective
• Whether the technologies adopted in developed countries are suitable in Indian
condition
Occupational Health Aspects
• Protective gears like gumboots, gloves, goggles and masks should be provided to the
workers
• Health check up programme should be conducted biannually or annually
Institutional Aspects
• Spot fining system can be introduced for controlling improper disposal of waste
• Incentive scheme can be introduced for increasing efficiency
• Supervision and monitoring system of the solid waste management activities should
be strengthened
• Public awareness programme should be conducted from time to time
• A citizen forum can be constituted for interaction with public
• Training programme should be conducted from time to time for various levels of staff
CChhaapptteerr 66
CCoonncclluussiioonnss aanndd
RReeccoommmmeennddaattiioonnss
6.1 For Road Related Projects
• The completed road and electricity related projects have brought improvement in
TTZ with respect to immediate neighboring cities. There had been be an
improvement in the environs of Taj Mahal and other historical monuments.
• Construction of new roads, widening of existing roads and construction of missing
links helped ease out traffic movement, reduced frequency of engine idling,
increased traffic speed thereby helped reducing vehicle exhaust emissions in the
TTZ. This has, in turn, improved the ambient air quality and resulted in positive
impact on the Taj Mahal marble and the environment
• Further improvement of road network in future should be funded to meet
increased traffic volume over the years as evident from the rising tendency in
concentration of NO2.
Chapter 6: Conclusions and Recommendations
National Environmental Engineering Research Institute
6. 2
6.2 For Electricity Related Projects
• The benefits of the projects for domestic supply and use in small-scale
businesses and in access to electric power for schools and public services are
evident. Potential beneficiary enterprises will be small industries like saw mills,
grain mills and other agricultural processing and storage businesses.
Improvement in public facilities (e.g. health & education) as a result of availability
of electricity is also evident. The projects will cause increased economic activity in
industrial, agricultural and commercial sectors as a result of availability of electric
supply in project areas. The facilities like communication, internet, computer
literacy and charging of mobile phones shall be generated. Electric lighting adds
to security at night and enables extended opportunities for work and study. As a
consequence the quality of life and extent of economic opportunity will be
transformed.
• Financial and technical support should be provided to achieve reductions in
overall technical and commercial losses, increased availability of electricity, and
improved voltage profile
• Financial support in the electricity supply infrastructure should be provided to
enhance electricity access rate and to ensure improved efficiency, to reduce
peaking shortages and therefore assist the country to alleviate poverty and
achieve the set National goals
• Further enhancement in electric supply in future should be funded to meet
increased domestic use of electricity to fulfill energy needs
• Feasibility of electrification of non-codified villages also may be looked into
6.3 For Gokul Barrage
The implementation of the Gokul Barrage project has definitely augmented
potable water supply to Agra and Mathura. However, the water quality in the river
doesn’t meet drinking water requirement as the CPCB classification for inland
surface water (Annexure-X). The water needs to be treated for use as potable
water. In addition, the ground water table of the area as well as salinity of ground
Chapter 6: Conclusions and Recommendations
National Environmental Engineering Research Institute
6. 3
water had not improved which was one of the objectives of the project, and this
may be due to increased abstraction of ground water from the area.
6.4 For Storm Water Drainage System
Agra is a world-class architectural heritage site and hence requires extensive
storm water drainage and sewerage system to reduce damage to the roads and streets and
to provide and maintain sanitary conditions to the people of Agra city meeting JNNURM
objectives. An amount of Rs.6.60 crores was sanctioned towards storm water management
in Agra. Around, Rs.4.50 crores have been utilized by the UPJN towards construction of the
four storm water drains covering a stretch of around 18.63 km. Further, Rs. 0.95 crores was
spent towards maintenance for de-silting and cleaning of four drains by ANN. A total amount
of Rs. 5.45 crores have been spent against Rs.6.60 crore sanctioned.
The construction of the engineered storm water drains have been carried out only
in some areas which is minuscule when compared to the area of the city (presently 148 sq.
km). Sewerage systems do not exist in major part of the city which leads to discharge of
sewage and domestic effluents into the storm water drains which finally drains into the
Yamuna. Thus, the storm water drains basically carry sanitary sewage.
Water logging in the low-lying areas can be prevented through regular
maintenance comprising removal of solid waste, silt, plants and roots from the drains
accompanied by a public awareness campaign by the relevant authorities. Guidelines for
staffing and equipment necessary for drainage maintenance works must be followed which
include drain cleaning frequency, manpower required to maintain the system, fixing of
management structure, training and skill development.
The recommendations to improve the storm water systems should include:
• Development of a proper sewerage system for the city to restrict domestic
sewage entering the storm water systems
• Proper maintenance of the existing drain structures
• Prevention of solid waste dumping into storm water drains by providing drain
covers, and adopting proper solid waste management practices

Chapter 6: Conclusions and Recommendations
National Environmental Engineering Research Institute
6. 4
• Allow the existing and new drains to function at their design capacities, through
regular maintenance comprising of cleaning, desilting, repairing and remodeling
of the existing drains
• Construction of cross drainage works
• Drainage outfall structure and construction of rainwater harvesting structures and
recharging ponds
6.5 For Solid Waste Management
• Environmental management plan as discussed in the earlier chapter can be taken
into consideration during implementation of solid waste management project
• A comprehensive Detailed Project Report (DPR) should be prepared for solid
waste management project through competent agency
• DPR can be prepared in keeping with the guidelines of CPCB
• Action plan can be prepared with the time period for various activities
• Quantification and characterization of waste should be carried out. Quantity and
characteristics are the two basic parameters for estimation of infrastructure
requirement
• Funds can be released in installments for implementation of solid waste
management project with time to time monitoring of the progress of the work
• A Management Information System (MIS) must exist
• For implementation, the possibility of Public-private-participation (PPP) may be
explored.
• The outcome of PPP may be evaluated by third party where requirement of
compliance and status of compliance management need to exist. A write up on
MIS is enclosed as Annexure –VIII
Other Developmental Project on Solid Waste Management
Chapter 6: Conclusions and Recommendations
National Environmental Engineering Research Institute
6. 5
Though, it is out of context of the present study, it is felt necessary to mention that
one project proposal on solid waste management under Jawaharlal Nehru National Urban
Renewal Mission (JNNURM) is in process as reported by Agra Municipal Corporation. The
proposed activities include development of sanitary landfill, development of processing
facilities, improvement of collection, storage and transportation system etc.

Annexure I
About CALINE4 Model
CALINE4 is dispersion model for predicting air pollutant concentration near roadways. It
is a simple line source Gaussian plume dispersion model developed by California
Department of transportation (CALTRAN). The user defines the proposed roadway
geometry, worst-case meteorological parameters, anticipated traffic volumes, and
receptor positions. The user also defines air pollutant emission factors for each
roadway link. CALIN4’s accuracy is well balanced with the accuracy of state of the art
predictive models for emissions and traffic.
The CALINE4 divides individual highway links into a series of elements from which
incremental concentrations are computed and then summed to form a total
concentration estimate for a particular receptor location. The receptor distance is
measures along a perpendicular from the receptor to the link central line.
CALINE4 treats the region directly over the highway as a zone of uniform emission and
turbulence. This is designated as mixing zone and is defined as the region over the
traveled way plus 3 meters on either side. The additional width accounts for the initial
horizontal dispersion imparted to pollutants by the vehicle wake. Within the mixing zone,
the mechanical turbulence created by moving vehicle and the thermal turbulence
created by hot vehicle exhaust are assumed to be the dominant dispersive mechanism.
Vehicle emissions are released and rapidly dispersed within the trailing wake of each
vehicle. Further initial dispersion occurs through the action of turbulence generated by
the other passing vehicle. In CALINE4 it is assumed that the longer a parcel of air
resides I the turbulence mixing zone, the greater the amount of initial vertical dispersion
the parcel will undergo.
For vertical dispersion parameter the CALINE4 uses modified version of Pasquill-Smith
vertical dispersion curves that includes thermal effects of vehicle exhaust emissions. For
horizontal dispersion parameter the model uses a method developed by Draxler to
compute values for the Gaussian horizontal dispersion parameter.
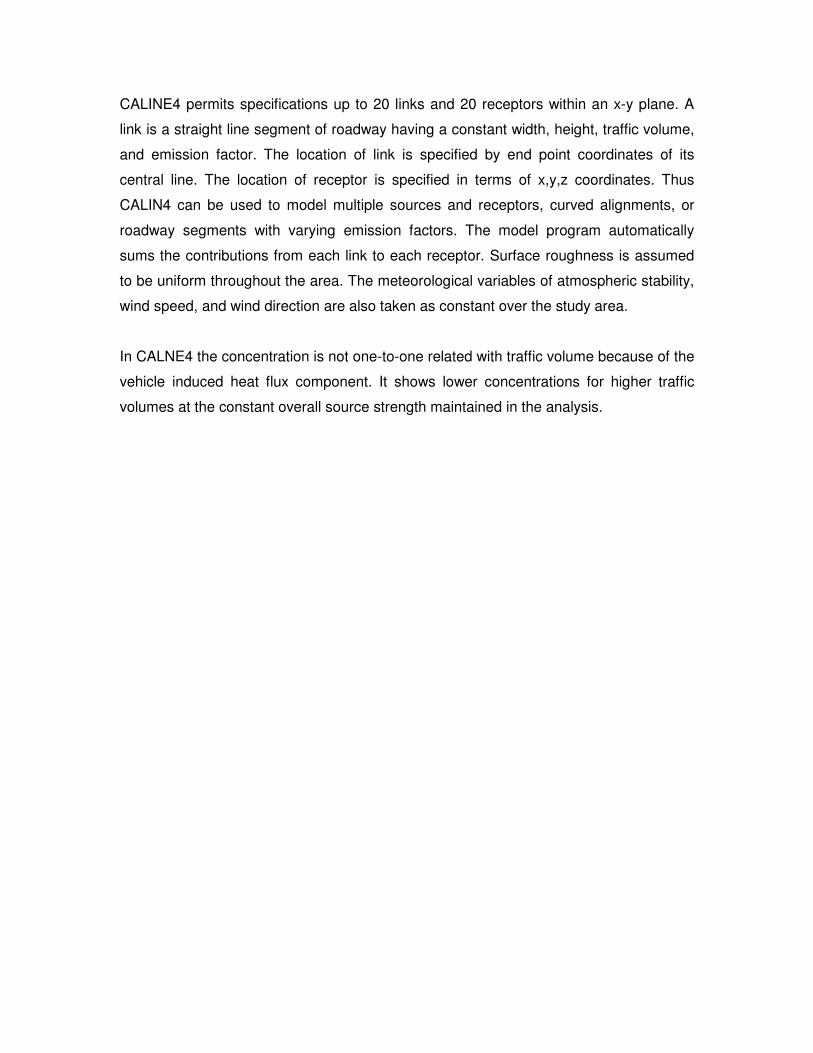
CALINE4 permits specifications up to 20 links and 20 receptors within an x-y plane. A
link is a straight line segment of roadway having a constant width, height, traffic volume,
and emission factor. The location of link is specified by end point coordinates of its
central line. The location of receptor is specified in terms of x,y,z coordinates. Thus
CALIN4 can be used to model multiple sources and receptors, curved alignments, or
roadway segments with varying emission factors. The model program automatically
sums the contributions from each link to each receptor. Surface roughness is assumed
to be uniform throughout the area. The meteorological variables of atmospheric stability,
wind speed, and wind direction are also taken as constant over the study area.
In CALNE4 the concentration is not one-to-one related with traffic volume because of the
vehicle induced heat flux component. It shows lower concentrations for higher traffic
volumes at the constant overall source strength maintained in the analysis.
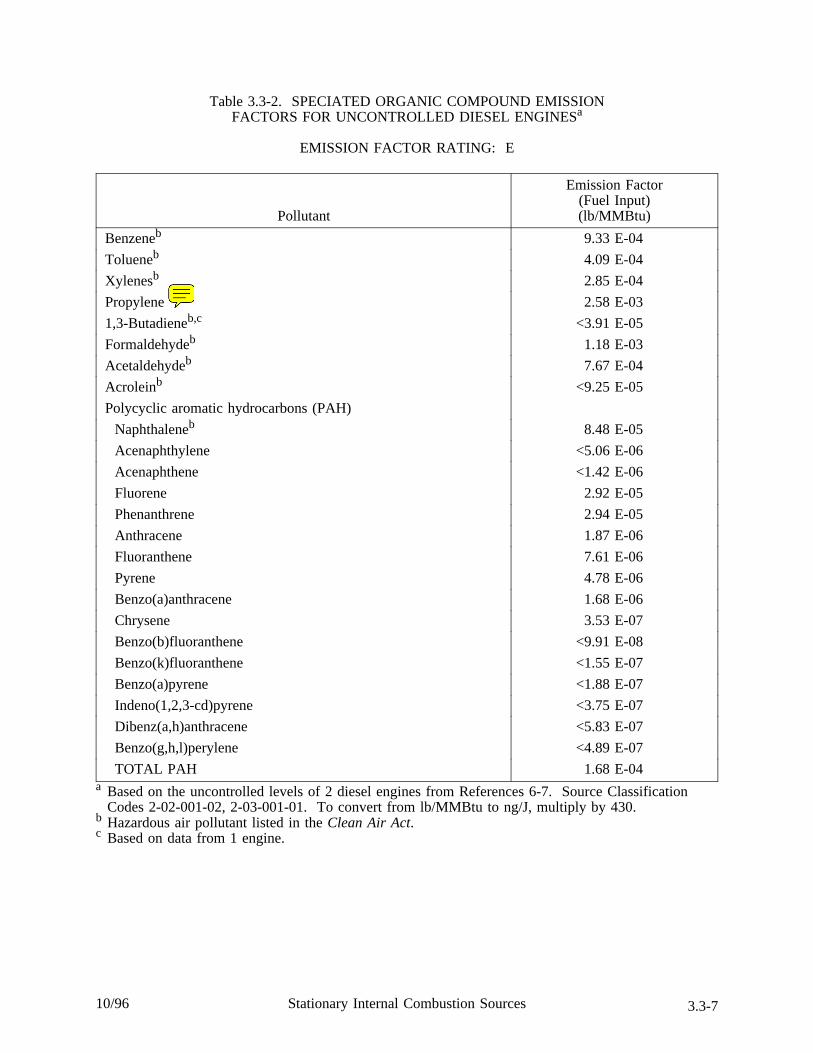
Table 3.3-2. SPECIATED ORGANIC COMPOUND EMISSIONFACTORS FOR UNCONTROLLED DIESEL ENGINESa
EMISSION FACTOR RATING: E
Pollutant
Emission Factor(Fuel Input)(lb/MMBtu)
Benzeneb 9.33 E-04
Tolueneb 4.09 E-04
Xylenesb 2.85 E-04
Propylene 2.58 E-03
1,3-Butadieneb,c <3.91 E-05
Formaldehydeb 1.18 E-03
Acetaldehydeb 7.67 E-04
Acroleinb <9.25 E-05
Polycyclic aromatic hydrocarbons (PAH)
Naphthaleneb 8.48 E-05
Acenaphthylene <5.06 E-06
Acenaphthene <1.42 E-06
Fluorene 2.92 E-05
Phenanthrene 2.94 E-05
Anthracene 1.87 E-06
Fluoranthene 7.61 E-06
Pyrene 4.78 E-06
Benzo(a)anthracene 1.68 E-06
Chrysene 3.53 E-07
Benzo(b)fluoranthene <9.91 E-08
Benzo(k)fluoranthene <1.55 E-07
Benzo(a)pyrene <1.88 E-07
Indeno(1,2,3-cd)pyrene <3.75 E-07
Dibenz(a,h)anthracene <5.83 E-07
Benzo(g,h,l)perylene <4.89 E-07
TOTAL PAH 1.68 E-04a Based on the uncontrolled levels of 2 diesel engines from References 6-7. Source Classification
Codes 2-02-001-02, 2-03-001-01. To convert from lb/MMBtu to ng/J, multiply by 430.b Hazardous air pollutant listed in theClean Air Act.c Based on data from 1 engine.
10/96 Stationary Internal Combustion Sources 3.3-7
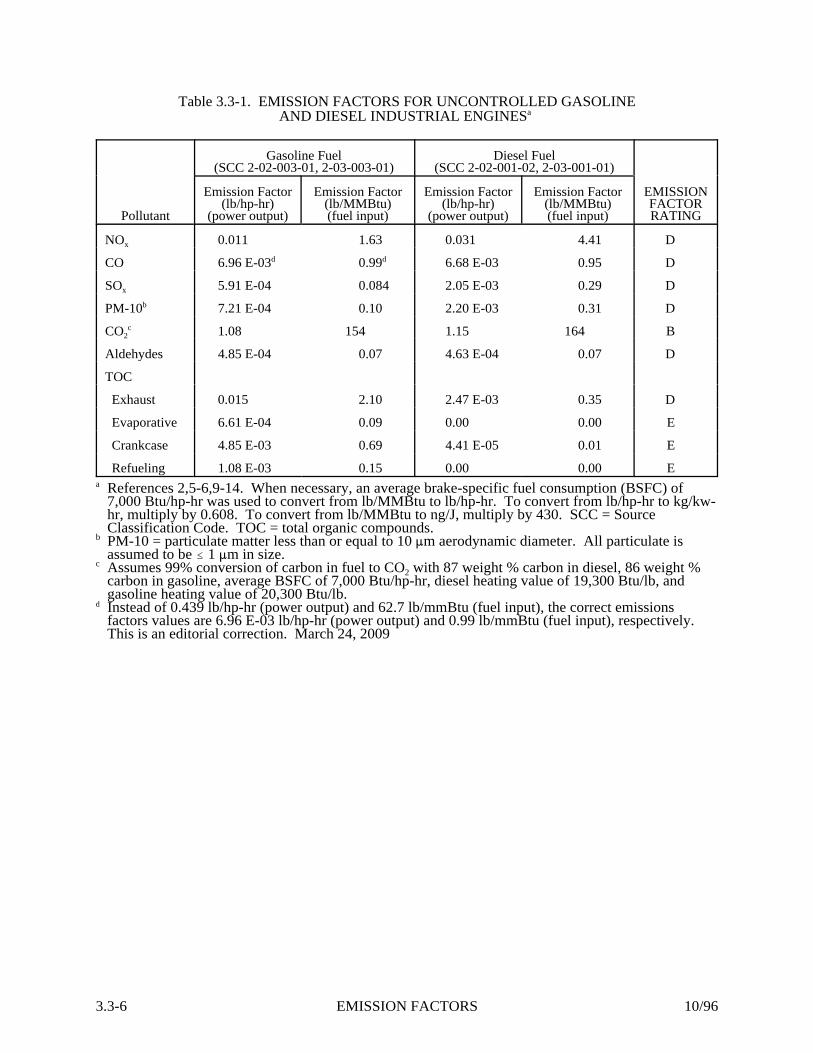
EMISSION FACTORS 10/963.3-6
Table 3.3-1. EMISSION FACTORS FOR UNCONTROLLED GASOLINEAND DIESEL INDUSTRIAL ENGINESa
Pollutant
Gasoline Fuel(SCC 2-02-003-01, 2-03-003-01)
Diesel Fuel(SCC 2-02-001-02, 2-03-001-01)
EMISSIONFACTORRATING
Emission Factor(lb/hp-hr)
(power output)
Emission Factor(lb/MMBtu)(fuel input)
Emission Factor(lb/hp-hr)
(power output)
Emission Factor(lb/MMBtu)(fuel input)
NOx 0.011 1.63 0.031 4.41 D
CO 6.96 E-03d 0.99d 6.68 E-03 0.95 D
SOx 5.91 E-04 0.084 2.05 E-03 0.29 D
PM-10b 7.21 E-04 0.10 2.20 E-03 0.31 D
CO2c 1.08 154 1.15 164 B
Aldehydes 4.85 E-04 0.07 4.63 E-04 0.07 D
TOC
Exhaust 0.015 2.10 2.47 E-03 0.35 D
Evaporative 6.61 E-04 0.09 0.00 0.00 E
Crankcase 4.85 E-03 0.69 4.41 E-05 0.01 E
Refueling 1.08 E-03 0.15 0.00 0.00 Ea References 2,5-6,9-14. When necessary, an average brake-specific fuel consumption (BSFC) of
7,000 Btu/hp-hr was used to convert from lb/MMBtu to lb/hp-hr. To convert from lb/hp-hr to kg/kw-hr, multiply by 0.608. To convert from lb/MMBtu to ng/J, multiply by 430. SCC = SourceClassification Code. TOC = total organic compounds.
b PM-10 = particulate matter less than or equal to 10 :m aerodynamic diameter. All particulate isassumed to be # 1 :m in size.
c Assumes 99% conversion of carbon in fuel to CO2 with 87 weight % carbon in diesel, 86 weight %carbon in gasoline, average BSFC of 7,000 Btu/hp-hr, diesel heating value of 19,300 Btu/lb, andgasoline heating value of 20,300 Btu/lb.
d Instead of 0.439 lb/hp-hr (power output) and 62.7 lb/mmBtu (fuel input), the correct emissionsfactors values are 6.96 E-03 lb/hp-hr (power output) and 0.99 lb/mmBtu (fuel input), respectively.This is an editorial correction. March 24, 2009
DEVELOPMENT OF INNER RING ROAD AT
AGRA, UTTAR PRADESH
Under Integrated Urban Rejuvenation Plan
ON DESIGN, BUILD, FINANCE, OPERATE
AND TRANSFER (DBFOT) BASIS UNDER PUBLIC PRIVATE PARTNERSHIP (PPP)
REQUEST FOR QUALIFICATION DOCUMENT
SEPTEMBER 2008
Nodal Agency
AWAS BANDHU, UTTAR PRADESH, HOUSING & URBAN PLANNING DEPARTMENT,
GOVERNMENT OF UTTAR PRADESH
IST FLOOR, JANPATH MARKET, LUCKNOW-226001
TEL: 0522-2237161 FAX:0522-2612098, E-MAIL: [email protected]
WEB: awas.up.nic.in
Project Consultants
SREI Infrastructure Finance Limited In Association with
DHV India Private Limited
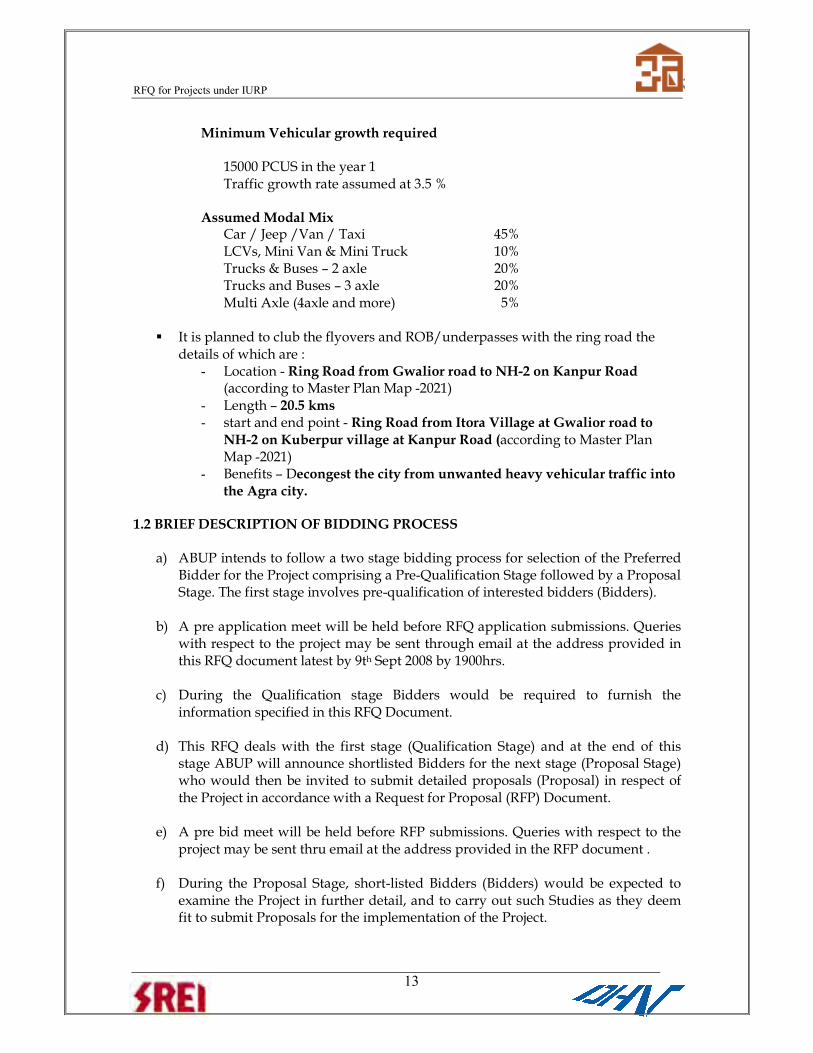
RFQ for Projects under IURP
13
Minimum Vehicular growth required 15000 PCUS in the year 1 Traffic growth rate assumed at 3.5 %
Assumed Modal Mix Car / Jeep /Van / Taxi 45% LCVs, Mini Van & Mini Truck 10% Trucks & Buses – 2 axle 20% Trucks and Buses – 3 axle 20% Multi Axle (4axle and more) 5%
� It is planned to club the flyovers and ROB/underpasses with the ring road the details of which are :
- Location - Ring Road from Gwalior road to NH-2 on Kanpur Road (according to Master Plan Map -2021)
- Length – 20.5 kms - start and end point - Ring Road from Itora Village at Gwalior road to
NH-2 on Kuberpur village at Kanpur Road (according to Master Plan Map -2021)
- Benefits – Decongest the city from unwanted heavy vehicular traffic into the Agra city.
1.2 BRIEF DESCRIPTION OF BIDDING PROCESS a) ABUP intends to follow a two stage bidding process for selection of the Preferred Bidder for the Project comprising a Pre-Qualification Stage followed by a Proposal Stage. The first stage involves pre-qualification of interested bidders (Bidders).
b) A pre application meet will be held before RFQ application submissions. Queries with respect to the project may be sent through email at the address provided in this RFQ document latest by 9th Sept 2008 by 1900hrs.
c) During the Qualification stage Bidders would be required to furnish the information specified in this RFQ Document.
d) This RFQ deals with the first stage (Qualification Stage) and at the end of this stage ABUP will announce shortlisted Bidders for the next stage (Proposal Stage) who would then be invited to submit detailed proposals (Proposal) in respect of the Project in accordance with a Request for Proposal (RFP) Document.
e) A pre bid meet will be held before RFP submissions. Queries with respect to the project may be sent thru email at the address provided in the RFP document .
f) During the Proposal Stage, short-listed Bidders (Bidders) would be expected to examine the Project in further detail, and to carry out such Studies as they deem fit to submit Proposals for the implementation of the Project.
Project Rep No.: AFL/2006-07/IOCL/Emission Factor Project/Final Rep dt. August 17, 2007
DRAFT
THE AUTOMOTIVE RESEARCH ASSOCIATION OF INDIA
Air Quality Monitoring Project-Indian Clean Air Programme (ICAP)
Draft report on
“Emission Factor development for Indian Vehicles “ as a part of Ambient Air Quality Monitoring and Emission
Source Apportionment Studies
Project Sponsored by
CPCB/ MOEF Indian Oil Corporation Ltd. Faridabad Hindustan Petroleum Corporation Ltd.
Bharat Petroleum Corporation Ltd. Reliance Industries Ltd.
Project Executed by
ARAI, Pune
© The Automotive Research Association of India
P.O. Box. 832, Pune-4
REVISION STATUS: REVISION-4 DT. AUGUST 8, 2007
Page 1 of 94
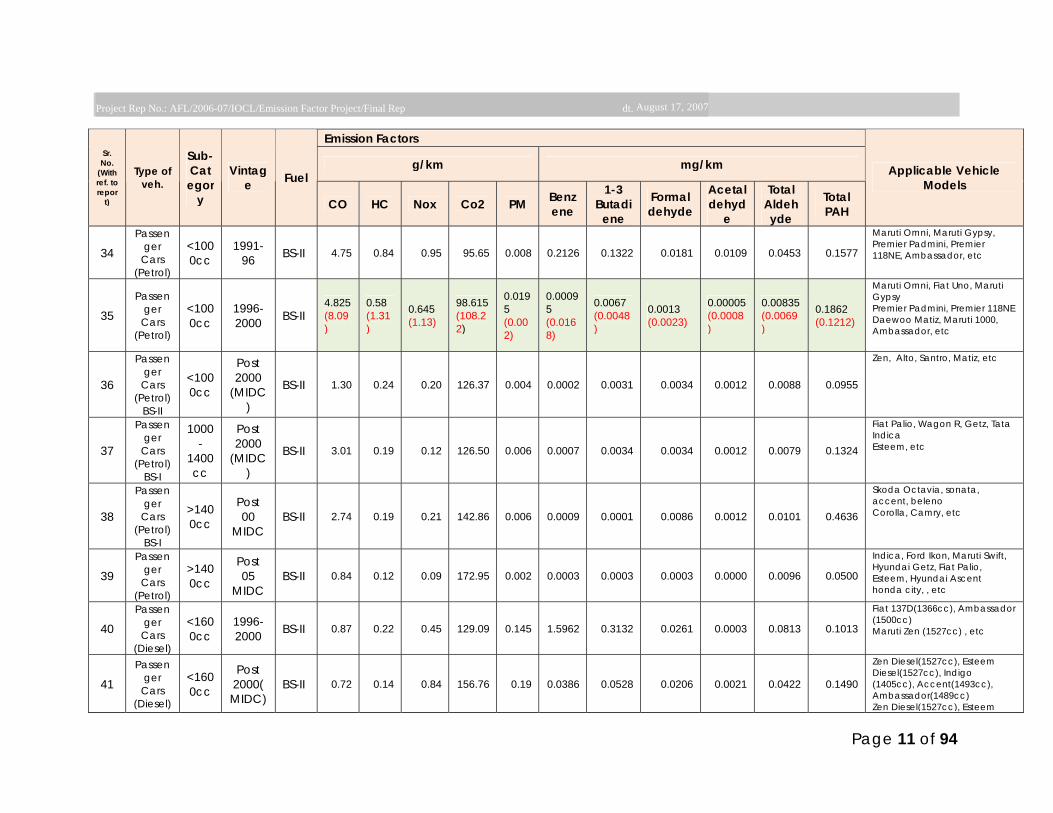
Project Rep No.: AFL/2006-07/IOCL/Emission Factor Project/Final Rep dt. August 17, 2007
Emission Factors
g/km mg/km Sr. No.
(With ref. to repor
t)
Type of veh.
Sub-Categor
y
Vintage Fuel
CO HC Nox Co2 PM Benzene
1-3 Butadi
ene
Formaldehyde
Acetaldehyd
e
Total Aldehyde
Total PAH
Applicable Vehicle Models
34 Passen
ger Cars
(Petrol)
<1000cc
1991-96 BS-II 4.75 0.84 0.95 95.65 0.008 0.2126 0.1322 0.0181 0.0109 0.0453 0.1577
Maruti Omni, Maruti Gypsy, Premier Padmini, Premier 118NE, Ambassador, etc
35 Passen
ger Cars
(Petrol)
<1000cc
1996-2000 BS-II
4.825 (8.09)
0.58 (1.31)
0.645 (1.13)
98.615 (108.22)
0.0195 (0.002)
0.00095 (0.0168)
0.0067 (0.0048)
0.0013 (0.0023)
0.00005 (0.0008)
0.00835 (0.0069)
0.1862 (0.1212)
Maruti Omni, Fiat Uno, Maruti Gypsy Premier Padmini, Premier 118NE Daewoo Matiz, Maruti 1000, Ambassador, etc
36
Passenger
Cars (Petrol)
BS-II
<1000cc
Post 2000
(MIDC)
BS-II 1.30 0.24 0.20 126.37 0.004 0.0002 0.0031 0.0034 0.0012 0.0088 0.0955
Zen, Alto, Santro, Matiz, etc
37
Passenger
Cars (Petrol)
BS-I
1000-
1400cc
Post 2000
(MIDC)
BS-II 3.01 0.19 0.12 126.50 0.006 0.0007 0.0034 0.0034 0.0012 0.0079 0.1324
Fiat Palio, Wagon R, Getz, Tata Indica Esteem, etc
38
Passenger
Cars (Petrol)
BS-I
>1400cc
Post 00
MIDC BS-II 2.74 0.19 0.21 142.86 0.006 0.0009 0.0001 0.0086 0.0012 0.0101 0.4636
Skoda Octavia, sonata, accent, beleno Corolla, Camry, etc
39 Passen
ger Cars
(Petrol)
>1400cc
Post 05
MIDC BS-II 0.84 0.12 0.09 172.95 0.002 0.0003 0.0003 0.0003 0.0000 0.0096 0.0500
Indica, Ford Ikon, Maruti Swift, Hyundai Getz, Fiat Palio, Esteem, Hyundai Ascent honda city, , etc
40 Passen
ger Cars
(Diesel)
<1600cc
1996-2000 BS-II 0.87 0.22 0.45 129.09 0.145 1.5962 0.3132 0.0261 0.0003 0.0813 0.1013
Fiat 137D(1366cc), Ambassador (1500cc) Maruti Zen (1527cc) , etc
41 Passen
ger Cars
(Diesel)
<1600cc
Post 2000(MIDC)
BS-II 0.72 0.14 0.84 156.76 0.19 0.0386 0.0528 0.0206 0.0021 0.0422 0.1490
Zen Diesel(1527cc), Esteem Diesel(1527cc), Indigo (1405cc), Accent(1493cc), Ambassador(1489cc) Zen Diesel(1527cc), Esteem
Page 11 of 94
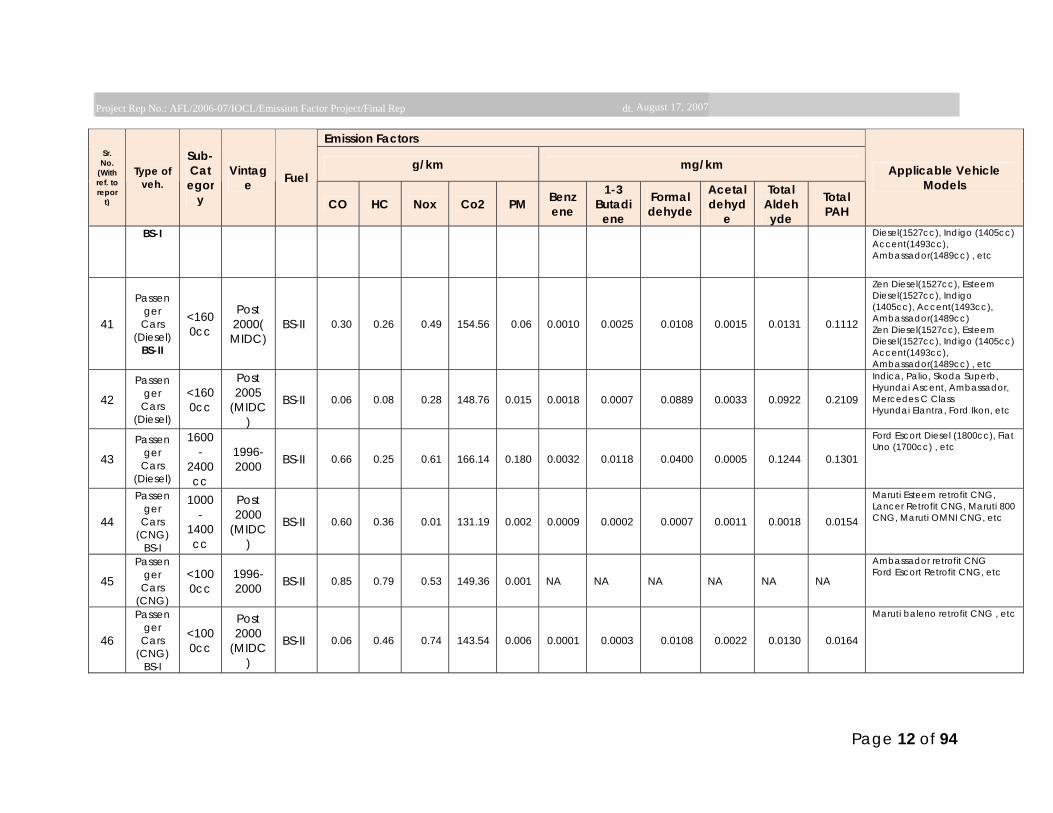
Project Rep No.: AFL/2006-07/IOCL/Emission Factor Project/Final Rep dt. August 17, 2007
Emission Factors
g/km mg/km Sr. No.
(With ref. to repor
t)
Type of veh.
Sub-Categor
y
Vintage Fuel
CO HC Nox Co2 PM Benzene
1-3 Butadi
ene
Formaldehyde
Acetaldehyd
e
Total Aldehyde
Total PAH
Applicable Vehicle Models
BS-I Diesel(1527cc), Indigo (1405cc) Accent(1493cc), Ambassador(1489cc) , etc
41
Passenger
Cars (Diesel)
BS-II
<1600cc
Post 2000(MIDC)
BS-II 0.30 0.26 0.49 154.56 0.06 0.0010 0.0025 0.0108 0.0015 0.0131 0.1112
Zen Diesel(1527cc), Esteem Diesel(1527cc), Indigo (1405cc), Accent(1493cc), Ambassador(1489cc) Zen Diesel(1527cc), Esteem Diesel(1527cc), Indigo (1405cc) Accent(1493cc), Ambassador(1489cc) , etc
42 Passen
ger Cars
(Diesel)
<1600cc
Post 2005
(MIDC)
BS-II 0.06 0.08 0.28 148.76 0.015 0.0018 0.0007 0.0889 0.0033 0.0922 0.2109
Indica, Palio, Skoda Superb, Hyundai Ascent, Ambassador, Mercedes C Class Hyundai Elantra, Ford Ikon, etc
43 Passen
ger Cars
(Diesel)
1600-
2400cc
1996-2000 BS-II 0.66 0.25 0.61 166.14 0.180 0.0032 0.0118 0.0400 0.0005 0.1244 0.1301
Ford Escort Diesel (1800cc), Fiat Uno (1700cc) , etc
44
Passenger
Cars (CNG)
BS-I
1000-
1400cc
Post 2000
(MIDC)
BS-II 0.60 0.36 0.01 131.19 0.002 0.0009 0.0002 0.0007 0.0011 0.0018 0.0154
Maruti Esteem retrofit CNG, Lancer Retrofit CNG, Maruti 800 CNG, Maruti OMNI CNG, etc
45 Passen
ger Cars
(CNG)
<1000cc
1996-2000 BS-II 0.85 0.79 0.53 149.36 0.001 NA NA NA NA NA NA
Ambassador retrofit CNG Ford Escort Retrofit CNG, etc
46
Passenger
Cars (CNG)
BS-I
<1000cc
Post 2000
(MIDC)
BS-II 0.06 0.46 0.74 143.54 0.006 0.0001 0.0003 0.0108 0.0022 0.0130 0.0164
Maruti baleno retrofit CNG , etc
Page 12 of 94
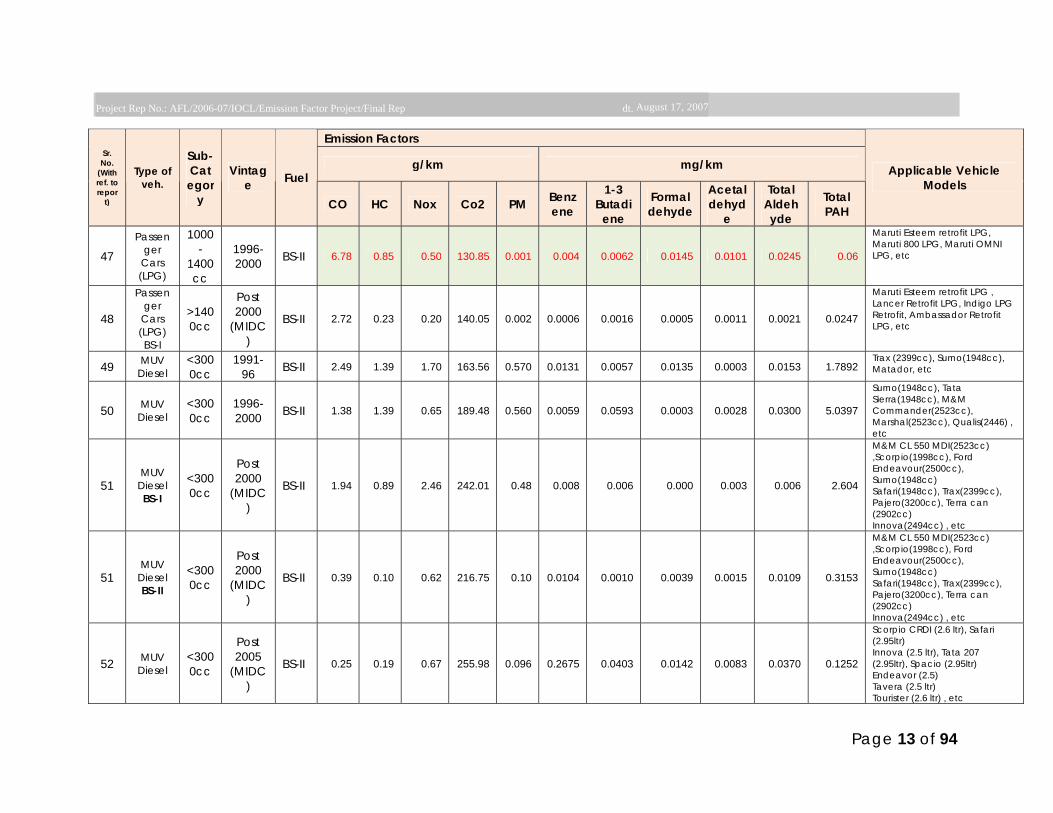
Project Rep No.: AFL/2006-07/IOCL/Emission Factor Project/Final Rep dt. August 17, 2007
Emission Factors
g/km mg/km Sr. No.
(With ref. to repor
t)
Type of veh.
Sub-Categor
y
Vintage Fuel
CO HC Nox Co2 PM Benzene
1-3 Butadi
ene
Formaldehyde
Acetaldehyd
e
Total Aldehyde
Total PAH
Applicable Vehicle Models
47 Passen
ger Cars (LPG)
1000-
1400cc
1996-2000 BS-II 6.78 0.85 0.50 130.85 0.001 0.004 0.0062 0.0145 0.0101 0.0245 0.06
Maruti Esteem retrofit LPG, Maruti 800 LPG, Maruti OMNI LPG, etc
48
Passenger
Cars (LPG) BS-I
>1400cc
Post 2000
(MIDC)
BS-II 2.72 0.23 0.20 140.05 0.002 0.0006 0.0016 0.0005 0.0011 0.0021 0.0247
Maruti Esteem retrofit LPG , Lancer Retrofit LPG, Indigo LPG Retrofit, Ambassador Retrofit LPG, etc
49 MUV Diesel
<3000cc
1991-96 BS-II 2.49 1.39 1.70 163.56 0.570 0.0131 0.0057 0.0135 0.0003 0.0153 1.7892
Trax (2399cc), Sumo(1948cc), Matador, etc
50 MUV Diesel
<3000cc
1996-2000 BS-II 1.38 1.39 0.65 189.48 0.560 0.0059 0.0593 0.0003 0.0028 0.0300 5.0397
Sumo(1948cc), Tata Sierra(1948cc), M&M Commander(2523cc), Marshal(2523cc), Qualis(2446) , etc
51 MUV
Diesel BS-I
<3000cc
Post 2000
(MIDC)
BS-II 1.94 0.89 2.46 242.01 0.48 0.008 0.006 0.000 0.003 0.006 2.604
M&M CL 550 MDI(2523cc) ,Scorpio(1998cc), Ford Endeavour(2500cc), Sumo(1948cc) Safari(1948cc), Trax(2399cc), Pajero(3200cc), Terra can (2902cc) Innova(2494cc) , etc
51 MUV
Diesel BS-II
<3000cc
Post 2000
(MIDC)
BS-II 0.39 0.10 0.62 216.75 0.10 0.0104 0.0010 0.0039 0.0015 0.0109 0.3153
M&M CL 550 MDI(2523cc) ,Scorpio(1998cc), Ford Endeavour(2500cc), Sumo(1948cc) Safari(1948cc), Trax(2399cc), Pajero(3200cc), Terra can (2902cc) Innova(2494cc) , etc
52 MUV Diesel
<3000cc
Post 2005
(MIDC)
BS-II 0.25 0.19 0.67 255.98 0.096 0.2675 0.0403 0.0142 0.0083 0.0370 0.1252
Scorpio CRDI (2.6 ltr), Safari (2.95ltr) Innova (2.5 ltr), Tata 207 (2.95ltr), Spacio (2.95ltr) Endeavor (2.5) Tavera (2.5 ltr) Tourister (2.6 ltr) , etc
Page 13 of 94

Project Rep No.: AFL/2006-07/IOCL/Emission Factor Project/Final Rep dt. August 17, 2007
Emission Factors
g/km mg/km Sr. No.
(With ref. to repor
t)
Type of veh.
Sub-Categor
y
Vintage Fuel
CO HC Nox Co2 PM Benzene
1-3 Butadi
ene
Formaldehyde
Acetaldehyd
e
Total Aldehyde
Total PAH
Applicable Vehicle Models
53 LCV Diesel
<3000cc
1991-96 BS-II 3.07 2.28 3.03 327.29 0.998 0.5427 0.0094 0.1975 0.0117 0.2957 8.1284
Eicher 10.70 (3298cc), BTL Excel (2650cc), M&M DI Load Carrier(2523cc) M&M Loadking(2609cc), Telco SFC410 (2956cc), Telco LPT712(3783cc), Eicher Skyline(3298cc), M&M DI Express(2523cc), M&M Tourister(2609cc) AL PSV3 LYNX(3839cc), Tata SFC 407 minibus(2956cc), Telco LP709minibus(3783cc), HM RTV(3.3 and 2ltr) , etc
54 LCV Diesel
<3000cc
1996-2000 BS-II 3.00 1.28 2.48 333.31 0.655 0.2015 0.2147 0.1176 0.0059 0.2169 3.7742
Eicher 10.70 (3298cc), BTL Excel (2650cc), M&M DI Load Carrier(2523cc) M&M Loadking(2609cc), Telco SFC410 (2956cc), Telco LPT712(3783cc) Eicher Skyline(3298cc), M&M DI Express(2523cc), M&M Tourister(2609cc) AL PSV3 LYNX(3839cc), Tata SFC 407 minibus(2956cc), Telco LP709minibus(3783cc), HM RTV(3.3 and 2ltr) , etc
55 LCV Diesel
>3000cc
Post 2000 BS-II 3.66 1.35 2.12 401.25 0.475 0.1959 0.4154 0.0028 0.0083 0.0222 8.2679
BTL Traveller (2650cc), M&M DI Express(2523cc), M&M Tourister(2609cc) AL PSV3 LYNX(3839cc), Tata SFC 407 minibus(2956cc), Telco LP709minibus(3783cc), HM RTV(3.3 and 2ltr) , etc
56 HCV
Diesel Bus
>6000cc
1991-96 BS-II 13.06 2.40 11.24 817.52 2.013 0.1529 0.0313 0.1007 0.0148 0.1259 1.0123
Eicher 20/16RHD(4.9lt), TELCO LF936CE(5.9ltr), TELCO LP1510(5.9lt) Eicher 20/16RHD(4.9lt), TELCO LF936CE(5.9ltr), TELCO LP1510(5.9lt), AL 3/1 COMET (6.54Lit) , etc
Page 14 of 94

Project Rep No.: AFL/2006-07/IOCL/Emission Factor Project/Final Rep dt. August 17, 2007
Emission Factors
g/km mg/km Sr. No.
(With ref. to repor
t)
Type of veh.
Sub-Categor
y
Vintage Fuel
CO HC Nox Co2 PM Benzene
1-3 Butadi
ene
Formaldehyde
Acetaldehyd
e
Total Aldehyde
Total PAH
Applicable Vehicle Models
57 HCV
Diesel Bus
>6000cc
1996-2000 BS-II 4.48 1.46 15.25 920.77 1.213 0.1008 0.0093 0.1015 0.0029 0.1191 3.6515
Eicher 30.25RHD(4.9lt), TELCO LPT2515(5.9lt), TELCO LP/LPO /LPS/SE/SK(5.9lt), Eicher 30.25RHD(4.9lt) TELCO LPT2515(5.9lt), TECO LPT 2518(5.9lt) , etc
58 HCV
Diesel Bus
>6000cc
Post 2000 BS-II 12.14 0.39 11.50 668.00 0.795 0.0126 0.0017 0.0104 0.0136 0.0458 0.2833
Volvo FM9, B7R (9.4lt) , Volvo FM12 (12.3lt), TECO LPT 2518(5.9lt), TELCO LPT2515(5.9lt), Volvo FM9, B7R (9.4lt) Volvo FM12 (12.3lt), TECO LPT 2518(5.9lt) TELCO LPT2515(5.9lt) , etc
59 HCV
Diesel Bus
>6000cc
Post 2005 BS-II 3.92 0.16 6.53 602.01 0.300 0.0101 0.0096 0.0523 0.0082 0.1458 1.3715
Volvo FM9, B7R (9.4lt), Volvo FM12 (12.3lt), TATA NOVUS, TATA LPT2515, etc
60 HCV CNG Bus
>6000cc
Post 2000 BS-II 3.72 3.75 6.21 806.50 N A N A N A N A N A N A N A
All TATA and AL CNG Buses , etc
61 HCV
Diesel Truck
>6000cc
1991-2000 BS-II 19.30 2.63 13.84 837.50 1.965 0.0199 0.0175 0.0925 0.0197 0.1374 4.5975
Eicher 20/16RHD(4.9lt) TELCO LF936CE(5.9ltr) TELCO LP1510(5.9lt) ALCO 3/1 COMET (6.54Lit) Eicher 20/16RHD(4.9lt) TELCO LF936CE(5.9ltr) TELCO LP1510(5.9lt) ALCO 3/1 COMET (6.54Lit), etc
62 HCV
Diesel Truck
>6000cc
Post 2000 BS-II 6.00 0.37 9.30 762.39 1.240 0.0049 0.0074 0.0610 0.0000 0.0837 3.9707
TECO LPT 2518(5.9lt) , TELCO LPT2515(5.9lt) , Volvo FM9, B7R (9.4lt) , Volvo FM12 (12.3lt) , TECO LPT 2518(5.9lt) , TELCO LPT2515(5.9lt) , etc
*ID's in red color are the vehicles whose data is not to be considered for EF. These vehicles would be repeated under Source Profiling of Vehicular Emissions project. @ Since 2W 2s Motorcycle>80cc are very few in no. actually plying on road, the expert group has decided to neglect this category
Page 15 of 94
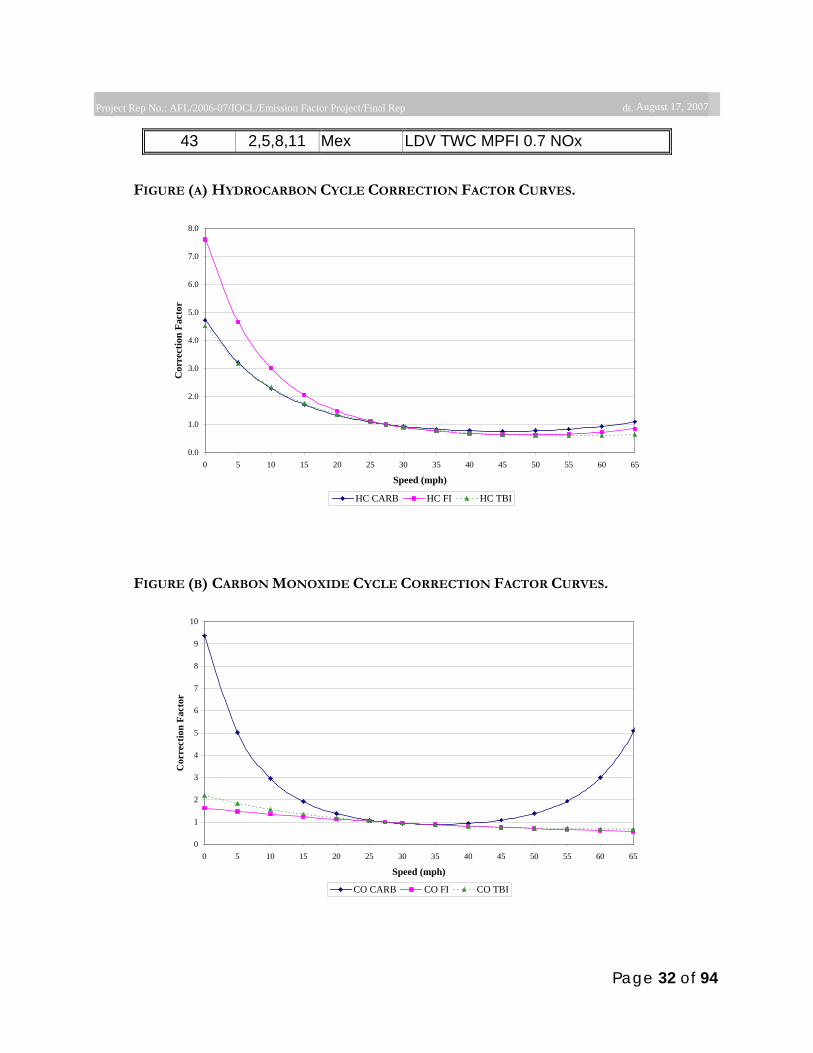
Project Rep No.: AFL/2006-07/IOCL/Emission Factor Project/Final Rep dt. August 17, 2007
43 2,5,8,11 Mex LDV TWC MPFI 0.7 NOx
FIGURE (A) HYDROCARBON CYCLE CORRECTION FACTOR CURVES.
0.0
1.0
2.0
3.0
4.0
5.0
6.0
7.0
8.0
0 5 10 15 20 25 30 35 40 45 50 55 60 65
Speed (mph)
Cor
rect
ion
Fact
or
HC CARB HC FI HC TBI
FIGURE (B) CARBON MONOXIDE CYCLE CORRECTION FACTOR CURVES.
0
1
2
3
4
5
6
7
8
9
10
0 5 10 15 20 25 30 35 40 45 50 55 60 65
Speed (mph)
Cor
rect
ion
Fact
or
CO CARB CO FI CO TBI
Page 32 of 94
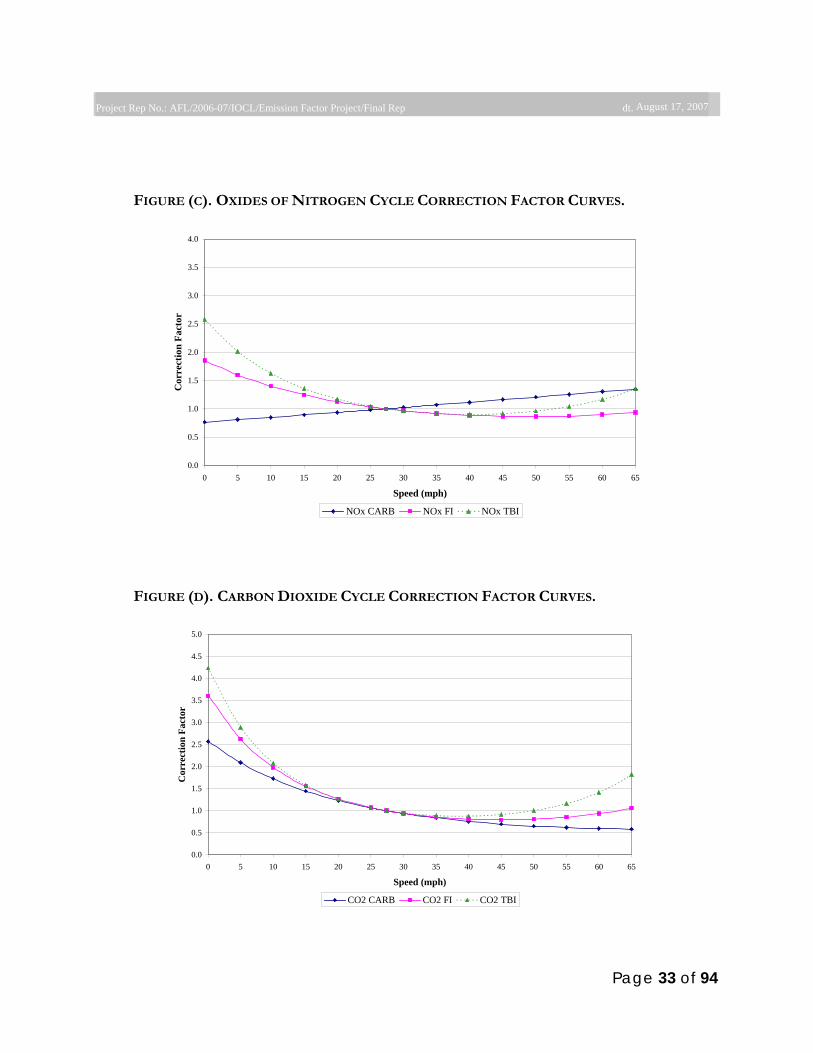
Project Rep No.: AFL/2006-07/IOCL/Emission Factor Project/Final Rep dt. August 17, 2007
FIGURE (C). OXIDES OF NITROGEN CYCLE CORRECTION FACTOR CURVES.
0.0
0.5
1.0
1.5
2.0
2.5
3.0
3.5
4.0
0 5 10 15 20 25 30 35 40 45 50 55 60 65
Speed (mph)
Cor
rect
ion
Fact
or
NOx CARB NOx FI NOx TBI
FIGURE (D). CARBON DIOXIDE CYCLE CORRECTION FACTOR CURVES.
3.5
4.0
4.5
5.0
1.5
2.0
2.5
3.0
Cor
rect
ion
Fact
or
0.00
0.5
1.0
10 15 2 30 3 40 50 60 65
(mp5 20 5 5 45 55
Speed h)
CO2 CARB CO2 FI CO
2 TBI
Page 33 of 94
VerDate Aug<31>2005 15:23 Apr 24, 2007 Jkt 211001 PO 00000 Frm 00001 Fmt 4717 Sfmt 4717 E:\FR\FM\25APR2.SGM 25APR2cpric
e-se
wel
l on
PR
OD
PC
61 w
ith R
ULE
S2
Wednesday,
April 25, 2007
Part II
Environmental Protection Agency 40 CFR Part 51 Clean Air Fine Particle Implementation Rule; Final Rule Agency Information Collection Activities: Proposed Collection; Comment Request; PM2.5 Ozone National Ambient Air Quality Standard Implementation Rule; EPA ICR No. 2258.01; Notice

VerDate Aug<31>2005 15:23 Apr 24, 2007 Jkt 211001 PO 00000 Frm 00002 Fmt 4701 Sfmt 4700 E:\FR\FM\25APR2.SGM 25APR2cpric
e-se
wel
l on
PR
OD
PC
61 w
ith R
ULE
S2
20586 Federal Register / Vol. 72, No. 79 / Wednesday, April 25, 2007 / Rules and Regulations
ENVIRONMENTAL PROTECTION AGENCY
40 CFR Part 51
[EPA–HQ–OAR–2003–0062; FRL–8295–2]
RIN 2060–AK74
Clean Air Fine Particle Implementation Rule
AGENCY: Environmental Protection Agency (EPA). ACTION: Final rule.
SUMMARY: This final action provides rules and guidance on the Clean Air Act (CAA) requirements for State and Tribal plans to implement the 1997 fine particle (PM2.5) national ambient air quality standards (NAAQS). Fine particles and precursor pollutants are emitted by a wide range of sources, including power plants, cars, trucks, industrial sources, and other burning or combustion-related activities. Health effects that have been associated with exposure to PM2.5 include premature death, aggravation of heart and lung disease, and asthma attacks. Those particularly sensitive to PM2.5 exposure include older adults, people with heart and lung disease, and children.
Air quality designations became effective on April 5, 2005 for 39 areas (with a total population of 90 million) that were not attaining the 1997 PM2.5
standards. By April 5, 2008, each State having a nonattainment area must submit to EPA an attainment demonstration and adopted regulations ensuring that the area will attain the standards as expeditiously as practicable, but no later than 2015. This rule and preamble describe the requirements that States and Tribes must meet in their implementation plans for attainment of the 1997 fine particle NAAQS. (Note that this rule does not include final PM2.5
requirements for the new source review (NSR) program; the final NSR rule will be issued at a later date.) DATES: This rule is effective on May 29, 2007. ADDRESSES: The EPA has established a docket for this action under Docket ID EPA–HQ–OAR–2003–0062. All documents relevant to this action are listed in the Federal docket management system at www.regulations.gov. Although listed in the index, some information is not publicly available (e.g. Confidential Business Information or other information whose disclosure is restricted by statute). Certain other material, such as copyrighted material, is not placed on the Internet and will be publicly available only in hard copy
form. Publicly available docket materials are available either electronically through www.regulations.gov or in hard copy format at the EPA Docket Center, EPA/ DC, EPA West, Room 3334, 1301 Constitution Avenue, NW., Washington, DC. The Public Reading Room is open from 8:30 a.m. to 4:30 p.m., Monday through Friday, excluding legal holidays. The telephone number for the Public Reading Room is (202) 566–1744, and the telephone number for the Office of Air and Radiation Docket and Information Center is (202) 566–1742. A variety of information and materials related to the fine particle NAAQS and implementation program are also available on EPA’s Web site: http:// www.epa.gov/air/particles. FOR FURTHER INFORMATION CONTACT: For general information, contact Mr. Richard Damberg, U.S. Environmental Protection Agency, Office of Air Quality Planning and Standards, Mail Code C539–01, Research Triangle Park, NC 27711, phone number (919) 54l–5592 or by e-mail at: [email protected]. SUPPLEMENTARY INFORMATION:
General Information
A. Does this action apply to me?
Entities potentially regulated by this action are State and local air quality agencies.
B. Where can I get a copy of this document and other related information?
In addition to being available in the docket, an electronic copy of this final rule will also be available on the World Wide Web. Following signature by the EPA Administrator, a copy of this final rule will be posted at http:// www.epa.gov/particles/actions.html.
C. How is the preamble organized?
I. Background II. Elements of the Clean Air Fine Particle
Implementation Rule A. Precursors and Pollutants Contributing
to Fine Particle Formation B. No Classification System C. Due Dates and Basic Requirements for
Attainment Demonstrations D. Attainment Dates E. Modeling and Attainment
Demonstrations F. Reasonably Available Control
Technology and Reasonably Available Control Measures
G. Reasonable Further Progress H. Contingency Measures I. Transportation Conformity J. General Conformity K. Emission Inventory Requirements L. Condensable Particulate Matter Test
Methods and Related Data Issues M. Improving Source Monitoring
N. Guidance Specific to Tribes O. Enforcement and Compliance P. Emergency Episodes Q. Ambient Monitoring
III. Statutory and Executive Order Reviews A. Executive Order 12866: Regulatory
Planning and Review B. Paperwork Reduction Act C. Regulatory Flexibility Act D. Unfunded Mandates Reform Act E. Executive Order 13132: Federalism F. Executive Order 13175: Consultation
and Coordination With Indian Tribal Governments
G. Executive Order 13045: Protection of Children From Environmental Health and Safety Risks
H. Executive Order 13211: Actions That Significantly Affect Energy Supply, Distribution, or Use
I. National Technology Transfer Advancement Act
J. Executive Order 12898: Federal Actions To Address Environmental Justice in Minority Populations and Low-Income Populations
K. Congressional Review Act L. Petitions for Judicial Review M. Judicial Review
IV. Statutory Authority
I. Background Fine particles in the atmosphere are
comprised of a complex mixture of components. Common constituents include: sulfate (SO4); nitrate (NO3); ammonium; elemental carbon; a great variety of organic compounds; and inorganic material (including metals, dust, sea salt, and other trace elements) generally referred to as ‘‘crustal’’ material, although it may contain material from other sources. Airborne particles generally less than or equal to 2.5 micrometers in diameter are considered to be ‘‘fine particles’’ (also referred to as PM2.5). (A micrometer is one-millionth of a meter, and 2.5 micrometers is less than one-seventh the average width of a human hair.) ‘‘Primary’’ particles are emitted directly into the air as a solid or liquid particle (e.g., elemental carbon from diesel engines or fire activities, or condensable organic particles from gasoline engines). ‘‘Secondary’’ particles (e.g., sulfate and nitrate) form in the atmosphere as a result of various chemical reactions. (Section II of the proposed rule included detailed technical discussion on PM2.5, its precursors, formation processes, and emissions sources.)
The EPA established air quality standards for PM2.5 based on evidence from numerous health studies demonstrating that serious health effects are associated with exposures to elevated levels of PM2.5. Epidemiological studies have shown statistically significant correlations between elevated PM2.5 levels and premature mortality. Other important
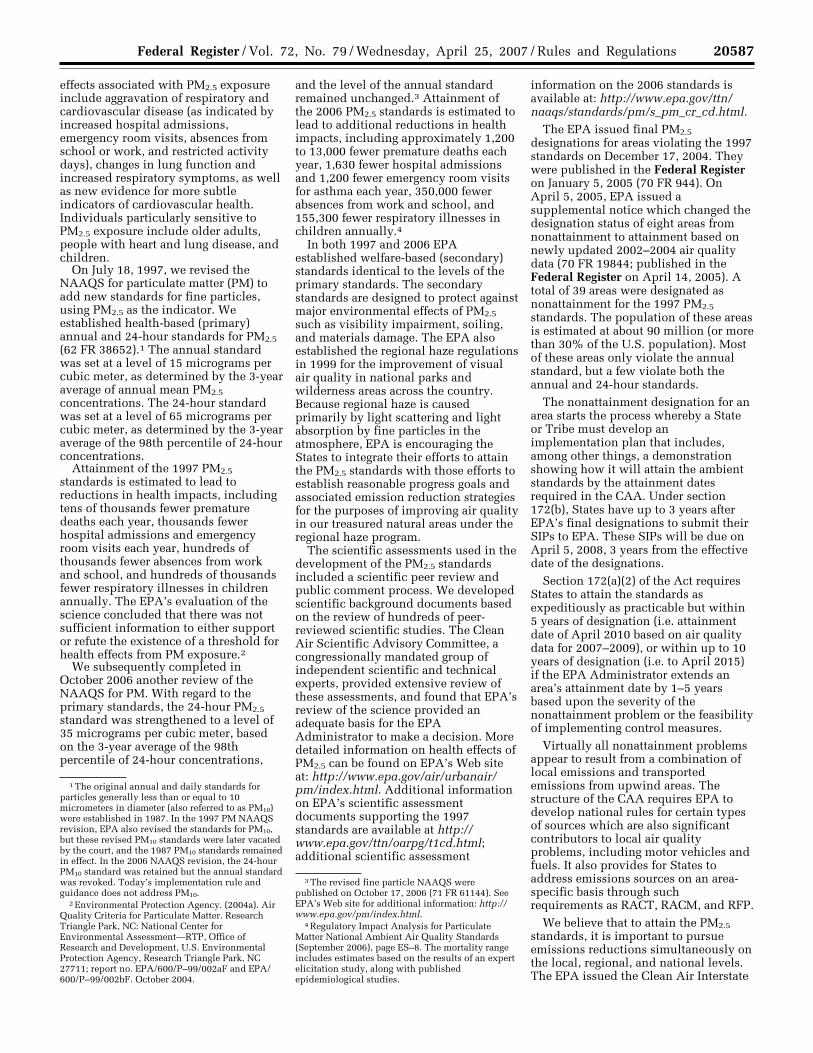
VerDate Aug<31>2005 15:23 Apr 24, 2007 Jkt 211001 PO 00000 Frm 00003 Fmt 4701 Sfmt 4700 E:\FR\FM\25APR2.SGM 25APR2cpric
e-se
wel
l on
PR
OD
PC
61 w
ith R
ULE
S2
Federal Register / Vol. 72, No. 79 / Wednesday, April 25, 2007 / Rules and Regulations 20587
effects associated with PM2.5 exposure include aggravation of respiratory and cardiovascular disease (as indicated by increased hospital admissions, emergency room visits, absences from school or work, and restricted activity days), changes in lung function and increased respiratory symptoms, as well as new evidence for more subtle indicators of cardiovascular health. Individuals particularly sensitive to PM2.5 exposure include older adults, people with heart and lung disease, and children.
On July 18, 1997, we revised the NAAQS for particulate matter (PM) to add new standards for fine particles, using PM2.5 as the indicator. We established health-based (primary) annual and 24-hour standards for PM2.5
(62 FR 38652).1 The annual standard was set at a level of 15 micrograms per cubic meter, as determined by the 3-year average of annual mean PM2.5
concentrations. The 24-hour standard was set at a level of 65 micrograms per cubic meter, as determined by the 3-year average of the 98th percentile of 24-hour concentrations.
Attainment of the 1997 PM2.5
standards is estimated to lead to reductions in health impacts, including tens of thousands fewer premature deaths each year, thousands fewer hospital admissions and emergency room visits each year, hundreds of thousands fewer absences from work and school, and hundreds of thousands fewer respiratory illnesses in children annually. The EPA’s evaluation of the science concluded that there was not sufficient information to either support or refute the existence of a threshold for health effects from PM exposure.2
We subsequently completed in October 2006 another review of the NAAQS for PM. With regard to the primary standards, the 24-hour PM2.5
standard was strengthened to a level of 35 micrograms per cubic meter, based on the 3-year average of the 98th percentile of 24-hour concentrations,
1 The original annual and daily standards for particles generally less than or equal to 10 micrometers in diameter (also referred to as PM10) were established in 1987. In the 1997 PM NAAQS revision, EPA also revised the standards for PM10, but these revised PM10 standards were later vacated by the court, and the 1987 PM10 standards remained in effect. In the 2006 NAAQS revision, the 24-hour PM10 standard was retained but the annual standard was revoked. Today’s implementation rule and guidance does not address PM10.
2 Environmental Protection Agency. (2004a). Air Quality Criteria for Particulate Matter. Research Triangle Park, NC: National Center for Environmental Assessment—RTP, Office of Research and Development, U.S. Environmental Protection Agency, Research Triangle Park, NC 27711; report no. EPA/600/P–99/002aF and EPA/ 600/P–99/002bF. October 2004.
and the level of the annual standard remained unchanged.3 Attainment of the 2006 PM2.5 standards is estimated to lead to additional reductions in health impacts, including approximately 1,200 to 13,000 fewer premature deaths each year, 1,630 fewer hospital admissions and 1,200 fewer emergency room visits for asthma each year, 350,000 fewer absences from work and school, and 155,300 fewer respiratory illnesses in children annually.4
In both 1997 and 2006 EPA established welfare-based (secondary) standards identical to the levels of the primary standards. The secondary standards are designed to protect against major environmental effects of PM2.5
such as visibility impairment, soiling, and materials damage. The EPA also established the regional haze regulations in 1999 for the improvement of visual air quality in national parks and wilderness areas across the country. Because regional haze is caused primarily by light scattering and light absorption by fine particles in the atmosphere, EPA is encouraging the States to integrate their efforts to attain the PM2.5 standards with those efforts to establish reasonable progress goals and associated emission reduction strategies for the purposes of improving air quality in our treasured natural areas under the regional haze program.
The scientific assessments used in the development of the PM2.5 standards included a scientific peer review and public comment process. We developed scientific background documents based on the review of hundreds of peer-reviewed scientific studies. The Clean Air Scientific Advisory Committee, a congressionally mandated group of independent scientific and technical experts, provided extensive review of these assessments, and found that EPA’s review of the science provided an adequate basis for the EPA Administrator to make a decision. More detailed information on health effects of PM2.5 can be found on EPA’s Web site at: http://www.epa.gov/air/urbanair/ pm/index.html. Additional information on EPA’s scientific assessment documents supporting the 1997 standards are available at http:// www.epa.gov/ttn/oarpg/t1cd.html; additional scientific assessment
3 The revised fine particle NAAQS were published on October 17, 2006 (71 FR 61144). See EPA’s Web site for additional information: http:// www.epa.gov/pm/index.html.
4 Regulatory Impact Analysis for Particulate Matter National Ambient Air Quality Standards (September 2006), page ES–8. The mortality range includes estimates based on the results of an expert elicitation study, along with published epidemiological studies.
information on the 2006 standards is available at: http://www.epa.gov/ttn/ naaqs/standards/pm/s_pm_cr_cd.html.
The EPA issued final PM2.5
designations for areas violating the 1997 standards on December 17, 2004. They were published in the Federal Register on January 5, 2005 (70 FR 944). On April 5, 2005, EPA issued a supplemental notice which changed the designation status of eight areas from nonattainment to attainment based on newly updated 2002–2004 air quality data (70 FR 19844; published in the Federal Register on April 14, 2005). A total of 39 areas were designated as nonattainment for the 1997 PM2.5
standards. The population of these areas is estimated at about 90 million (or more than 30% of the U.S. population). Most of these areas only violate the annual standard, but a few violate both the annual and 24-hour standards.
The nonattainment designation for an area starts the process whereby a State or Tribe must develop an implementation plan that includes, among other things, a demonstration showing how it will attain the ambient standards by the attainment dates required in the CAA. Under section 172(b), States have up to 3 years after EPA’s final designations to submit their SIPs to EPA. These SIPs will be due on April 5, 2008, 3 years from the effective date of the designations.
Section 172(a)(2) of the Act requires States to attain the standards as expeditiously as practicable but within 5 years of designation (i.e. attainment date of April 2010 based on air quality data for 2007–2009), or within up to 10 years of designation (i.e. to April 2015) if the EPA Administrator extends an area’s attainment date by 1–5 years based upon the severity of the nonattainment problem or the feasibility of implementing control measures.
Virtually all nonattainment problems appear to result from a combination of local emissions and transported emissions from upwind areas. The structure of the CAA requires EPA to develop national rules for certain types of sources which are also significant contributors to local air quality problems, including motor vehicles and fuels. It also provides for States to address emissions sources on an area-specific basis through such requirements as RACT, RACM, and RFP.
We believe that to attain the PM2.5
standards, it is important to pursue emissions reductions simultaneously on the local, regional, and national levels. The EPA issued the Clean Air Interstate
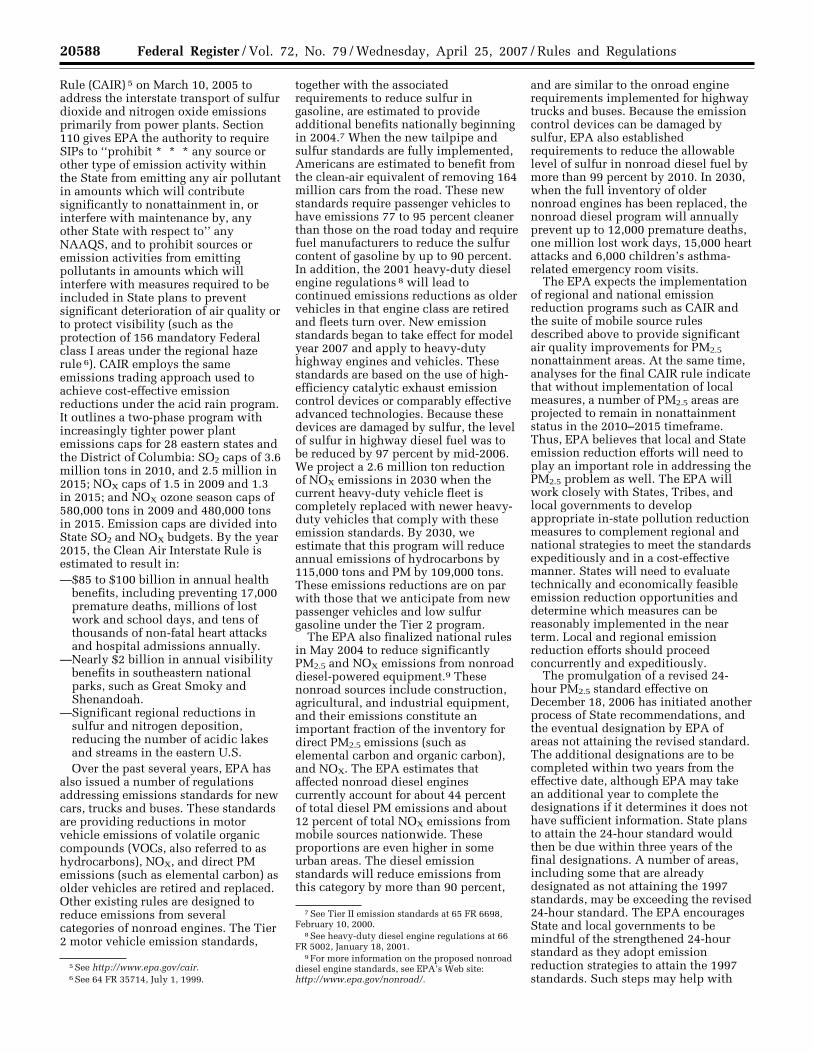
VerDate Aug<31>2005 15:23 Apr 24, 2007 Jkt 211001 PO 00000 Frm 00004 Fmt 4701 Sfmt 4700 E:\FR\FM\25APR2.SGM 25APR2cpric
e-se
wel
l on
PR
OD
PC
61 w
ith R
ULE
S2
20588 Federal Register / Vol. 72, No. 79 / Wednesday, April 25, 2007 / Rules and Regulations
Rule (CAIR) 5 on March 10, 2005 to address the interstate transport of sulfur dioxide and nitrogen oxide emissions primarily from power plants. Section 110 gives EPA the authority to require SIPs to ‘‘prohibit * * * any source or other type of emission activity within the State from emitting any air pollutant in amounts which will contribute significantly to nonattainment in, or interfere with maintenance by, any other State with respect to’’ any NAAQS, and to prohibit sources or emission activities from emitting pollutants in amounts which will interfere with measures required to be included in State plans to prevent significant deterioration of air quality or to protect visibility (such as the protection of 156 mandatory Federal class I areas under the regional haze rule 6). CAIR employs the same emissions trading approach used to achieve cost-effective emission reductions under the acid rain program. It outlines a two-phase program with increasingly tighter power plant emissions caps for 28 eastern states and the District of Columbia: SO2 caps of 3.6 million tons in 2010, and 2.5 million in 2015; NOX caps of 1.5 in 2009 and 1.3 in 2015; and NOX ozone season caps of 580,000 tons in 2009 and 480,000 tons in 2015. Emission caps are divided into State SO2 and NOX budgets. By the year 2015, the Clean Air Interstate Rule is estimated to result in: —$85 to $100 billion in annual health
benefits, including preventing 17,000 premature deaths, millions of lost work and school days, and tens of thousands of non-fatal heart attacks and hospital admissions annually.
—Nearly $2 billion in annual visibility benefits in southeastern national parks, such as Great Smoky and Shenandoah.
—Significant regional reductions in sulfur and nitrogen deposition, reducing the number of acidic lakes and streams in the eastern U.S. Over the past several years, EPA has
also issued a number of regulations addressing emissions standards for new cars, trucks and buses. These standards are providing reductions in motor vehicle emissions of volatile organic compounds (VOCs, also referred to as hydrocarbons), NOX, and direct PM emissions (such as elemental carbon) as older vehicles are retired and replaced. Other existing rules are designed to reduce emissions from several categories of nonroad engines. The Tier 2 motor vehicle emission standards,
5 See http://www.epa.gov/cair. 6 See 64 FR 35714, July 1, 1999.
together with the associated requirements to reduce sulfur in gasoline, are estimated to provide additional benefits nationally beginning in 2004.7 When the new tailpipe and sulfur standards are fully implemented, Americans are estimated to benefit from the clean-air equivalent of removing 164 million cars from the road. These new standards require passenger vehicles to have emissions 77 to 95 percent cleaner than those on the road today and require fuel manufacturers to reduce the sulfur content of gasoline by up to 90 percent. In addition, the 2001 heavy-duty diesel engine regulations 8 will lead to continued emissions reductions as older vehicles in that engine class are retired and fleets turn over. New emission standards began to take effect for model year 2007 and apply to heavy-duty highway engines and vehicles. These standards are based on the use of high-efficiency catalytic exhaust emission control devices or comparably effective advanced technologies. Because these devices are damaged by sulfur, the level of sulfur in highway diesel fuel was to be reduced by 97 percent by mid-2006. We project a 2.6 million ton reduction of NOX emissions in 2030 when the current heavy-duty vehicle fleet is completely replaced with newer heavy-duty vehicles that comply with these emission standards. By 2030, we estimate that this program will reduce annual emissions of hydrocarbons by 115,000 tons and PM by 109,000 tons. These emissions reductions are on par with those that we anticipate from new passenger vehicles and low sulfur gasoline under the Tier 2 program.
The EPA also finalized national rules in May 2004 to reduce significantly PM2.5 and NOX emissions from nonroad diesel-powered equipment.9 These nonroad sources include construction, agricultural, and industrial equipment, and their emissions constitute an important fraction of the inventory for direct PM2.5 emissions (such as elemental carbon and organic carbon), and NOX. The EPA estimates that affected nonroad diesel engines currently account for about 44 percent of total diesel PM emissions and about 12 percent of total NOX emissions from mobile sources nationwide. These proportions are even higher in some urban areas. The diesel emission standards will reduce emissions from this category by more than 90 percent,
7 See Tier II emission standards at 65 FR 6698, February 10, 2000.
8 See heavy-duty diesel engine regulations at 66 FR 5002, January 18, 2001.
9 For more information on the proposed nonroad diesel engine standards, see EPA’s Web site: http://www.epa.gov/nonroad/.
and are similar to the onroad engine requirements implemented for highway trucks and buses. Because the emission control devices can be damaged by sulfur, EPA also established requirements to reduce the allowable level of sulfur in nonroad diesel fuel by more than 99 percent by 2010. In 2030, when the full inventory of older nonroad engines has been replaced, the nonroad diesel program will annually prevent up to 12,000 premature deaths, one million lost work days, 15,000 heart attacks and 6,000 children’s asthma-related emergency room visits.
The EPA expects the implementation of regional and national emission reduction programs such as CAIR and the suite of mobile source rules described above to provide significant air quality improvements for PM2.5
nonattainment areas. At the same time, analyses for the final CAIR rule indicate that without implementation of local measures, a number of PM2.5 areas are projected to remain in nonattainment status in the 2010–2015 timeframe. Thus, EPA believes that local and State emission reduction efforts will need to play an important role in addressing the PM2.5 problem as well. The EPA will work closely with States, Tribes, and local governments to develop appropriate in-state pollution reduction measures to complement regional and national strategies to meet the standards expeditiously and in a cost-effective manner. States will need to evaluate technically and economically feasible emission reduction opportunities and determine which measures can be reasonably implemented in the near term. Local and regional emission reduction efforts should proceed concurrently and expeditiously.
The promulgation of a revised 24-hour PM2.5 standard effective on December 18, 2006 has initiated another process of State recommendations, and the eventual designation by EPA of areas not attaining the revised standard. The additional designations are to be completed within two years from the effective date, although EPA may take an additional year to complete the designations if it determines it does not have sufficient information. State plans to attain the 24-hour standard would then be due within three years of the final designations. A number of areas, including some that are already designated as not attaining the 1997 standards, may be exceeding the revised 24-hour standard. The EPA encourages State and local governments to be mindful of the strengthened 24-hour standard as they adopt emission reduction strategies to attain the 1997 standards. Such steps may help with
Ambient Air Quality Monitoring (AAQM) at Agra CPCB is monitoring Ambient Air Quality at Agra as a floow up of direction of Hon’ble Supreme Court of India in the year 2000. The annual average values, standard deviations and percentage violation of primary pollutants viz. SPM, RSPM, SO2 and NO2 for the year 2006-07 at all four monitoring locations, viz. Tajmahal, It-mad-ud-daulah, Rambagh and Nunhai. with reference to sensitive area ambient air quality goal are presented Table 5.26.
Table 5.26 : Ambient Air Quality Status at Agra (Year 2006-07)
Locations Parameters Annual Average
Standard Deviations
No of Valid monitoring days
% Violations
Tajmahal SO2
(Day Average = 30
µg/m3 & Annual
Standard =15µg/m3)
5 2 267 00
Itmad ud daulah 6 2 103 00
Rambagh 6 2 116 00
Nunhai 6 2 115 00
Tajmahal NO2
(Day Average = 30
µg/m3 & Annual
Standard =15µg/m3)
21 8 266 21
Itmad ud daulah 24 8 103 29
Rambagh 23 6 116 28
Nunhai 35 11 115 67
TajMahal RSPM
(Day Average = 75
µg/m3 & Annual
Standard =50µg/m3)
129 73 269 66
Itmad ud daulah 221 88 101 91
Rambagh 235 90 114 91
Nunhai 280 124 107 93
TajMahal SPM
(Day Average = 100
µg/m3 & Annual
Standard =70µg/m3)
295 127 264 83
Itmad ud daulah 375 148 95 98
Rambagh 414 116 108 99
Nunhai 563 221 113 99
Remarks:
• All the values are in µg/m3 of Air
• % Violation: Percentage violation with respect to National Ambient Air Quality Standards (24 Hourly Average)
• Valid monitoring day: Sampling time 16 hours or more in a day
• Sensitive Area Ambient Air Quality Goal are referred for calculations
Considering 2% violation in a year as mentioned in the ambient air quality goal, no violation for parameter SO2 was observed at any locations. The situation with respect to violation of norms for Nitrogen Dioxide was 21%, 29%, 27% and 66% at Tajmahal, Itmad-ud-daulah, Rambagh and Nunhai respectively. The other parameters viz. RSPM and SPM remained critical. Ambient air quality at Tajmahal remained least polluted among four stations, while Nunhai has maximum air pollutant concentration. Both SPM and RSPM were critical as were observed in last four years.
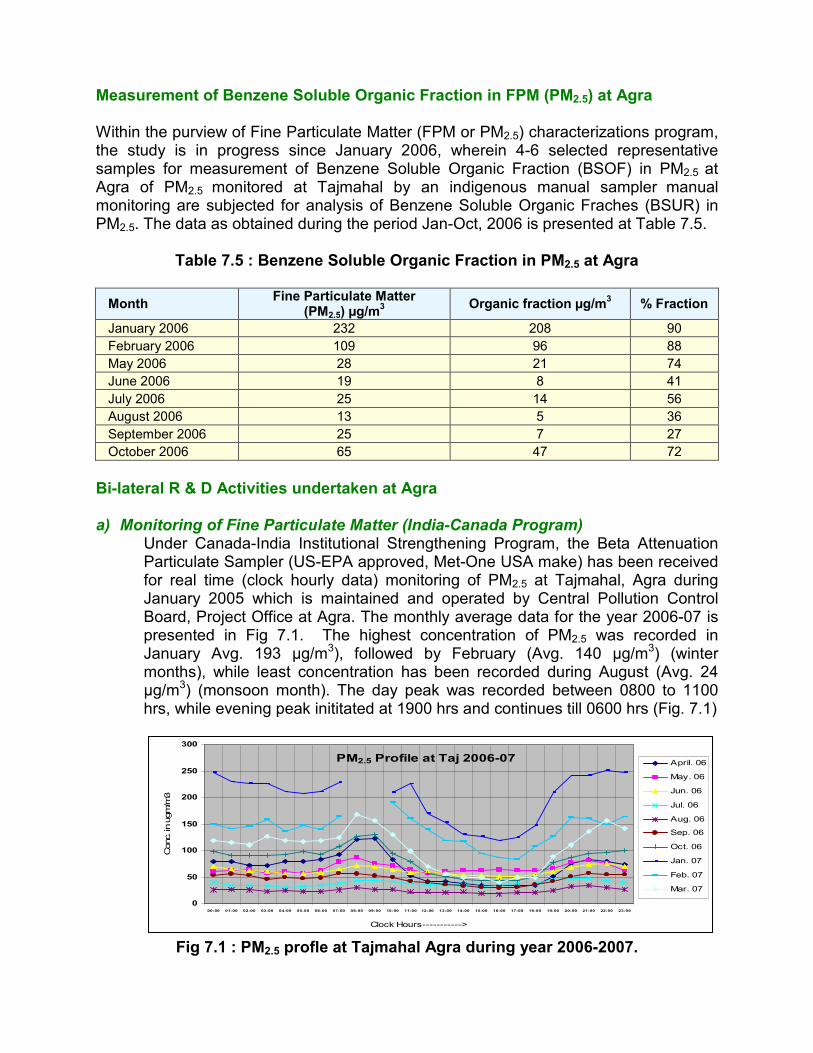
PM2.5 Profile at Taj 2006-07
0
50
100
150
200
250
300
00:00 01:00 02:00 03:00 04:00 05:00 06:00 07:00 08:00 09:00 10:00 11:00 12:00 13:00 14:00 15:00 16:00 17:00 18:00 19:00 20:00 21:00 22:00 23:00
Clock Hours----------->
Conc. in
ugm
/m3
April. 06
May. 06
Jun. 06
Jul. 06
Aug. 06
Sep. 06
Oct. 06
Jan. 07
Feb. 07
Mar. 07
Measurement of Benzene Soluble Organic Fraction in FPM (PM2.5) at Agra Within the purview of Fine Particulate Matter (FPM or PM2.5) characterizations program, the study is in progress since January 2006, wherein 4-6 selected representative samples for measurement of Benzene Soluble Organic Fraction (BSOF) in PM2.5 at Agra of PM2.5 monitored at Tajmahal by an indigenous manual sampler manual monitoring are subjected for analysis of Benzene Soluble Organic Fraches (BSUR) in PM2.5. The data as obtained during the period Jan-Oct, 2006 is presented at Table 7.5.
Table 7.5 : Benzene Soluble Organic Fraction in PM2.5 at Agra
Month Fine Particulate Matter
(PM2.5) µg/m3
Organic fraction µg/m3 % Fraction
January 2006 232 208 90
February 2006 109 96 88
May 2006 28 21 74
June 2006 19 8 41
July 2006 25 14 56
August 2006 13 5 36
September 2006 25 7 27
October 2006 65 47 72
Bi-lateral R & D Activities undertaken at Agra a) Monitoring of Fine Particulate Matter (India-Canada Program)
Under Canada-India Institutional Strengthening Program, the Beta Attenuation Particulate Sampler (US-EPA approved, Met-One USA make) has been received for real time (clock hourly data) monitoring of PM2.5 at Tajmahal, Agra during January 2005 which is maintained and operated by Central Pollution Control Board, Project Office at Agra. The monthly average data for the year 2006-07 is presented in Fig 7.1. The highest concentration of PM2.5 was recorded in January Avg. 193 µg/m3), followed by February (Avg. 140 µg/m3) (winter months), while least concentration has been recorded during August (Avg. 24 µg/m3) (monsoon month). The day peak was recorded between 0800 to 1100 hrs, while evening peak inititated at 1900 hrs and continues till 0600 hrs (Fig. 7.1)
Fig 7.1 : PM2.5 profle at Tajmahal Agra during year 2006-2007.
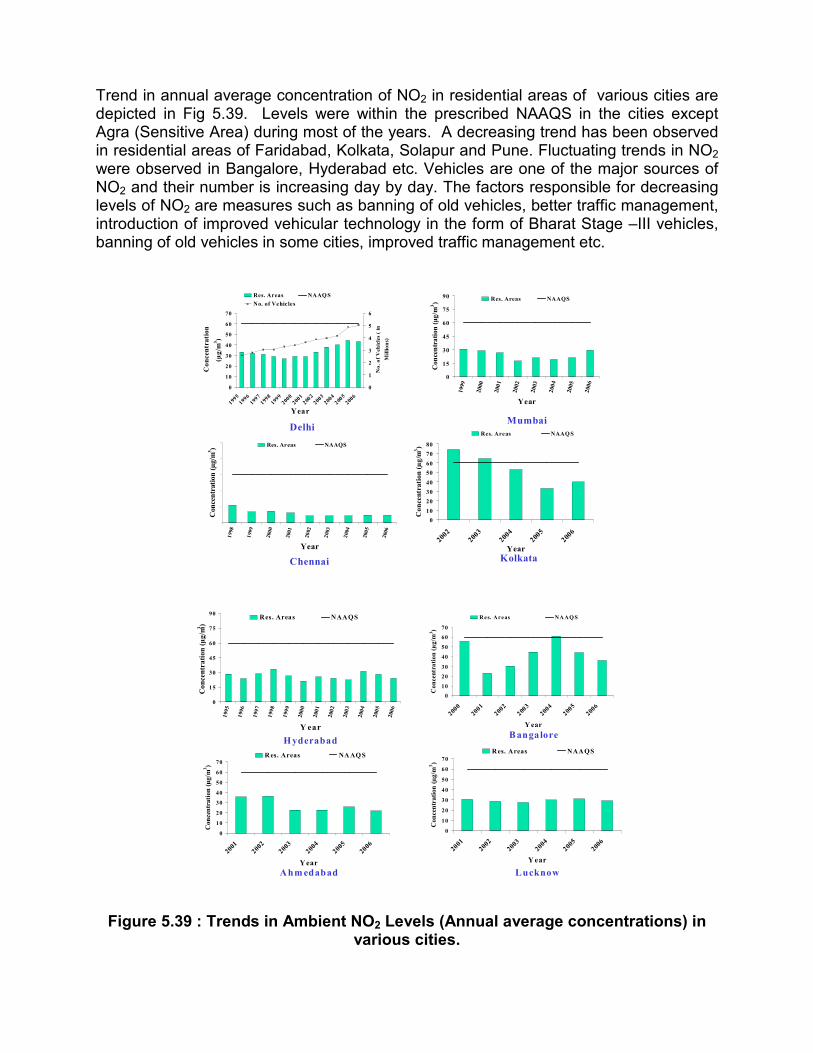
Trend in annual average concentration of NO2 in residential areas of various cities are depicted in Fig 5.39. Levels were within the prescribed NAAQS in the cities except Agra (Sensitive Area) during most of the years. A decreasing trend has been observed in residential areas of Faridabad, Kolkata, Solapur and Pune. Fluctuating trends in NO2 were observed in Bangalore, Hyderabad etc. Vehicles are one of the major sources of NO2 and their number is increasing day by day. The factors responsible for decreasing levels of NO2 are measures such as banning of old vehicles, better traffic management, introduction of improved vehicular technology in the form of Bharat Stage –III vehicles, banning of old vehicles in some cities, improved traffic management etc.
0
10
20
30
40
50
60
70
1995
1996
1997
1998
1999
2000
2001
2002
2003
2004
2005
2006
Year
Co
ncen
tra
tio
n
(µg
/m3)
0
1
2
3
4
5
6
No
. o
f V
eh
icle
s (
in
Mil
lio
ns)
Res. Areas NAAQ S
No. of Vehicles
0
10
20
30
40
50
60
70
80
2002
2003
2004
2005
2006
Year
Co
nce
ntr
ati
on
(µ
g/m
3)
Res. Areas NAAQ SDelhi
Mumbai
Chennai Kolkata
0
15
30
45
60
75
90
1999
2000
200
1
2002
2003
200
4
2005
200
6
Year
Con
cen
tra
tion
(µ
g/m
3)
Res. Areas NAAQS
0
2 0
4 0
6 0
8 0
1 00
1998
1999
200
0
2001
20
02
2003
2004
200
5
2006
Year
Con
cen
trati
on
(µ
g/m
3)
Res. Areas NAAQS
0
10
20
30
40
50
60
70
2000
2001
2002
2003
2004
2005
2006
Y ear
Co
nce
ntr
ati
on
(µ
g/m
3)
R es. Areas NA AQ S
0
10
20
30
40
50
60
70
2001
2002
2003
2004
2005
2006
Year
Con
cen
trati
on
(µ
g/m
3)
R es. Areas NA AQ S
H yderabadB angalore
Ahm edabad Lucknow
0
10
20
30
40
50
60
70
2001
2002
2003
2004
2005
2006
Y ear
Con
cen
trati
on
(µ
g/m
3)
Res. Areas NAAQS
0
15
30
45
60
75
90
199
5
199
6
199
7
199
8
199
9
200
0
200
1
200
2
200
3
200
4
200
5
200
6
Y ear
Co
nce
ntr
ati
on
(µ
g/m
3)
Res. Areas NAAQS
Figure 5.39 : Trends in Ambient NO2 Levels (Annual average concentrations) in various cities.
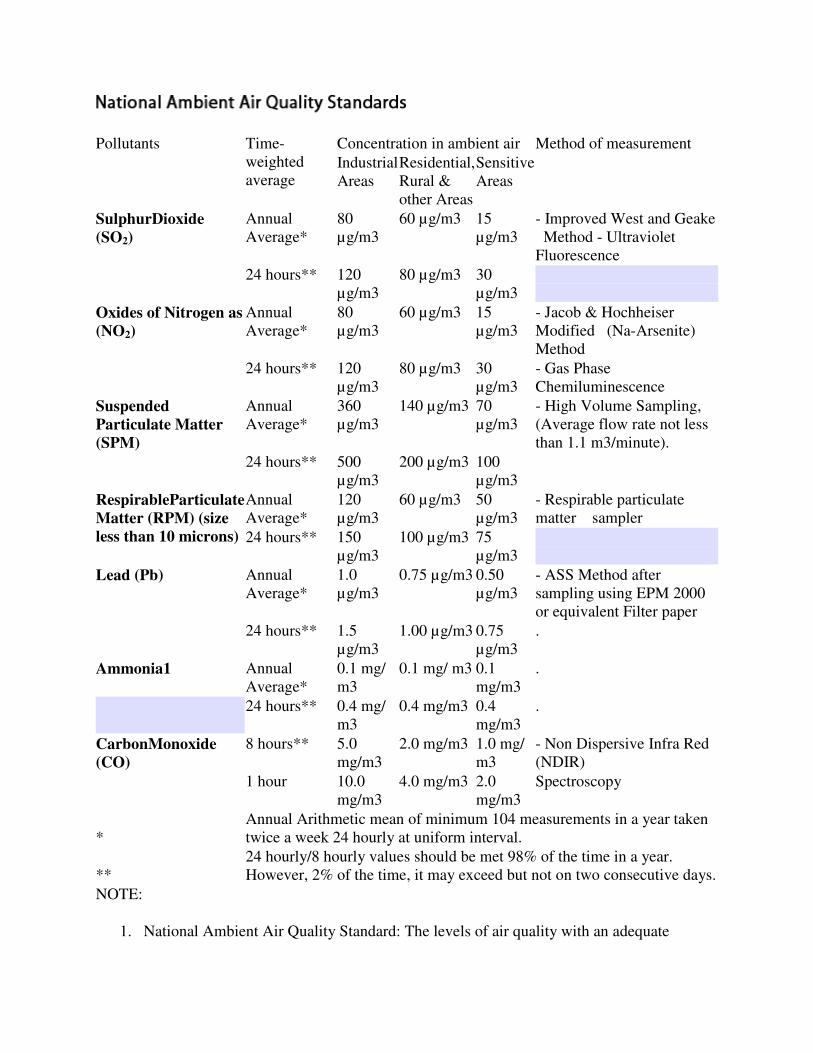
Concentration in ambient air Pollutants Time-weighted average
Industrial Areas
Residential, Rural & other Areas
Sensitive Areas
Method of measurement
Annual Average*
80 µg/m3
60 µg/m3 15 µg/m3
- Improved West and Geake Method - Ultraviolet Fluorescence
SulphurDioxide (SO2)
24 hours** 120 µg/m3
80 µg/m3 30 µg/m3
Annual Average*
80 µg/m3
60 µg/m3 15 µg/m3
- Jacob & Hochheiser Modified (Na-Arsenite) Method
Oxides of Nitrogen as (NO2)
24 hours** 120 µg/m3
80 µg/m3 30 µg/m3
- Gas Phase Chemiluminescence
Annual Average*
360 µg/m3
140 µg/m3 70 µg/m3
- High Volume Sampling, (Average flow rate not less than 1.1 m3/minute).
Suspended Particulate Matter (SPM)
24 hours** 500 µg/m3
200 µg/m3 100 µg/m3
Annual Average*
120 µg/m3
60 µg/m3 50 µg/m3
- Respirable particulate matter sampler
RespirableParticulate Matter (RPM) (size less than 10 microns) 24 hours** 150
µg/m3 100 µg/m3 75
µg/m3
Annual Average*
1.0 µg/m3
0.75 µg/m3 0.50 µg/m3
- ASS Method after sampling using EPM 2000 or equivalent Filter paper
Lead (Pb)
24 hours** 1.5 µg/m3
1.00 µg/m3 0.75 µg/m3
.
Ammonia1 Annual Average*
0.1 mg/ m3
0.1 mg/ m3 0.1 mg/m3
.
24 hours** 0.4 mg/ m3
0.4 mg/m3 0.4 mg/m3
.
8 hours** 5.0 mg/m3
2.0 mg/m3 1.0 mg/ m3
- Non Dispersive Infra Red (NDIR)
CarbonMonoxide (CO)
1 hour 10.0 mg/m3
4.0 mg/m3 2.0 mg/m3
Spectroscopy
*
Annual Arithmetic mean of minimum 104 measurements in a year taken twice a week 24 hourly at uniform interval.
**
24 hourly/8 hourly values should be met 98% of the time in a year. However, 2% of the time, it may exceed but not on two consecutive days.
NOTE:
1. National Ambient Air Quality Standard: The levels of air quality with an adequate
margin of safety, to protect the public health,, vegetation and property. 2. Whenever and wherever two consecutive values exceeds the limit specified above for the
respective category, it would be considered adequate reason to institute regular/continuous monitoring and further investigations.
3. The standards for H2S and CS2 have been notified seperately vide GSR No. 7, dated December 22, 1998 under Rayon Industry - for details please see Sl. No. 65 of this document.
[S.O. 384(E), Air (Prevention & Control of Pollution) Act, 1981, dated April 11, 1994 ] [EPA Notification: GSR 176 (E), April 02, 1996]
1. Included vide Notification SO. 955 (E), Air (Prevention & Control of Pollution) Act, 1981 dated October 14, 1998)
Annexure VII
Guidelines for Preparation of Environmental Management Plan for Storm Water Management Systems
The Environmental Management Plan (also referred to as an Environmental
Impact Report) is typically carried out prior to consideration of Draft Plan Approval.
Typically, impact assessments are carried out for the proposed land use. Alternative
management strategies are developed on storm water management practices.
Collectively, the management practices will ensure that the environmental resources are
protected, restored or enhanced in accordance with defined goals and objectives.
Comparative evaluation of the strategies will lead to the selection of the preferred
alternative.
Good planning for the storm water management has a strong ecological
attribute. It also provides a fundamental basis for achieving storm water quality and
improvement efficiently and cost effectively. Soils which are permeable and existing
vegetation communities are suited to infiltration and can function as biofilters and
landscape that are naturally conducive to the implementation of detention initiatives
should be identified along with other characteristics to achieve storm water management
objectives. The watershed planning approach, which is now ingrained within the
municipal planning process, ensures that the important features and other interrelated
factors are identified and understood at a regional scale. As a result, storm water
management opportunities afforded by the existing natural heritage features and
functional systems are identified early in the process. This helps ensure that these
opportunities will not be overlooked or lost when storm water management initiatives are
implemented at a site-specific scale.
1
Annexure VIII
Environmental Management Information Systems for Urban Environment
Environmental Management Information Systems (EMIS) concentrates on the
spatial aspect of urban planning and management. Information is crucial to various planning
and managemental activities. The challenges experienced by cities usually are :
• to determine what data and information is needed for the purpose at hand;
• to find out if it exists and where;
• how to get hold of it if it exists and how to collect it if it does not;
• how to store this information in easily accessible and referenced form;
• how to interpret the data, resolve questions of quality, inconsistencies;
• to determine who needs the information, when and in what form(s); and
• to disseminate it as required.
These challenges can be overcome by formalising, institutionalising and sustaining
an information system in inspite of data gathering exercise. Management information
systems has standardised and clear procedures and formats, which are flexible in
application; is integrated into a permanent organisational structure, is independent of any
critical individual input; and is sustained with the necessary resources (funding, staffing, etc.)
and political backing. It is an attractive system whose services are actively sought, and is
capable of fulfilling this demand. An EMIS concentrates on the spatial aspect of urban
planning and management and provides the basis for an open planning framework which
complements or even supercedes traditional master planning concepts and, therefore, is
applicable not only to environmental planning but to a broad range of urban planning
approaches.
Purpose
“EMIS Provides concise timely and relevant information for the decision-making
process on urban issues"
1. To provide Concise, Timely, and Usable Information on Urban Issues
One purpose of an EMIS is to show the relationships between environment and
developmental issues. Such a system consists of formalised steps to capture information, as
2
well as fixed procedures to retrieve this information. Generally speaking, the EMIS covers
the gathering of relevant information for a participatory urban environmental planning and
management process. However, it can also include the collection of information about the
various urban issues (such as poverty, environment, security) facing a particular city. This
information is stored in archives, databases and in maps. Information maintained and
generated through such a system is usually up-to-date as it allows for continuous input of
data generated through an agreed standard, involving public and popular participation. The
information is presented in an easily understandable form using attractive maps, graphics
and photos. The information is widely accessible, for example through information kiosks,
newspaper features, local neighbourhood exhibitions, general distribution publications, etc.
2. To support Participatory Decision-making Process in an Urban Management
Framework
The EMIS is designed to provide information which is directly usable by the
participants involved in an urban management process. The information is therefore not
comprehensive or overly technical, but highly focused, concentrating on what is relevant for
the decision-making process. Because it is up-to-date, issue-oriented, and well-presented,
the EMIS information directly supports a consultative and participatory working group
process. Because it relies on stakeholder participation for finding and inputting data, the
EMIS is not an exclusive technical exercise but a broader-based participatory one.
Principles :
Dynamic learning system: An EMIS is a dynamic information system, so new data has to
be fed into it continuously. An information system does not have to be comprehensive to be
useful, and in any case it takes considerable time to assemble and process the necessary
data. In the meantime, decisions on environmental issues have to be taken - they cannot
wait for ever more information. Provided that attention focuses on the priorities of the users,
even modest, incremental improvements in information and knowledge about an issue can
be very useful. This tends to be especially valid in the environmental area, where the major
problem is not necessarily a complete lack of information, but its fragmentation, perhaps a
reflection of the fact that environment is not generally recognised as a technical sector in its
own right. Over time, as new issues crop up, the information system will increase its
coverage and scope, through both passive and active collection modes of system, provided
that an appropriate framework is in place. At an advanced stage, the framework can be a
3
sophisticated computerised GIS. The important point is that the system receives regular
maintenance and updating.
Uses best available information: An EMIS accepts and uses the best information which is
available. It is tempting when defining information systems to be too ambitious and technical
professionals often insist on being complete and all-encompassing. This of course can never
be achieved, and seeking perfection in this way is invariably counter-productive. A law of
diminishing returns applies here, the time and resource costs of getting "better" data will
quickly exceed the benefits gained from that extra data. Frequently projects can be delayed
because essential information is missing, but available time and resources do not allow in-
depth research. In such cases it is necessary to rely on estimated figures, common sense or
community knowledge. The more the data is partial, missing, inconsistent etc; the more
judgmental expertise is required to convert it into meaningful and reliable information. Non-
scientific information may quite properly and effectively be used as long as the source and
its limitations are understood. The challenge is to find the right balance. Of course the
objective would be to replace this kind of information at a later stage of the EMIS with more
accurate data. But for the moment, what counts is that some information is better than none.
Avoid the data trap: Specific attention should be given to avoid falling into the "data trap",
i.e. getting bogged down in a large, general purpose, open-ended and unfocused data
collection exercise, almost invariably unsuccessful and therefore largely irrelevant. The
purpose of EMIS is not to substitute for general purpose or even sectoral statistical services
or research institutions. Nor is information synonymous with data, only with analysis,
interpretation and synthesis does data turn into information.
Distinguishes between facts and policies : An EMIS makes a clear distinction between
factual information and policy information. Factual thematic maps show quantifiable or
"countable" data, for example geology maps, soil maps, population density maps, etc. Policy
maps show information about certain policy decisions such as national acts, laws and by-
laws, global environmental standards or rules and conditions developed by stakeholders
during the working group process. Policy maps are based on an intensive participatory
process. They are subjective as they show policy aims and represent different opinions
which have been negotiated during the working group process. These maps will be always
disputed and discussed - but they provide an extremely valuable support for those
discussions.
4
Generally Accessible: Information in the EMIS has to be easily accessible for all
stakeholders and for civil society as a whole. The EMIS helps therefore to avoid the all too
common "data bank syndrome". The information system should not be viewed as static
hoard of valuable information, deposited by its owners to be carefully guarded from
unauthorised access, as in the vaults of a bank. Rather it should be seen as a continual flow,
like a newspaper, where information is incessantly and actively sought out, quickly analysed
and summarised, and rapidly distributed widely and without restriction. Information is like
news, a perishable product that loses value over time. The usefulness and influence of a
newspaper comes from immediately disseminating new information, not retaining it. An
effective information outreach strategy is absolutely necessary for the success of the EMIS.
Appropriate technology: An EMIS does not depend on highly sophisticated technology.
The system can be implemented at various levels of sophistication, manual or computerized,
and it will make best use of tools available. Not the best technology but the compatibility to
existing systems and capacities is the key to a successful EMIS. The main outputs of an
EMIS are attractive and colourful maps and therefore a geographical information system
(GIS) is a suitable tool for the EMIS.
Working Methodology:
The following experiences on key elements of the EMIS are based on practical
experience from its application in many cities around the world. It has used environment as a
particular entry point, but experience has shown that, with suitable but simple modifications,
the EMIS can easily be adapted to other thematic areas and sectors, such as security and
disaster management. The following steps focus on the spatial analysis part of the EMIS by
using maps and geographical information systems.
Step 1: Setting-Up the System
Setting up an EMIS unit takes quite some resources, and must be supported by an adequate
number of personnel, at least one dedicated professional officer and one assistant. An EMIS
system can be built without computer equipment, but it is much easier to use a computer-
based Geographic Information System (GIS) to handle the amount of data the system will
contain. Fortunately, good "off the shelf" GIS software is readily available and will run on a
standard high-performance desk-top computer; an A0 inkjet printer and input devices such
as a digitising board and a scanner are also key equipment. For fieldwork, a Global
Positioning System (GPS) receiver will be essential, but these are now widely available at

5
reasonable prices. A light table is vital for group discussions around particular maps printed
on transparent material.
Step 2: Forming the Mapping Group
To link the EMIS with the stakeholders and users of the system, it is very useful to establish
a Mapping Group. The major task of such a group is to support and work with the EMIS
technical unit and to provide a continuous link between users and providers. This group can
be useful by providing inputs and asking questions during the EMIS-building exercise. In
Step 1 they advise on purchasing equipment. For Step 3 they can provide information about
existing maps and for Step 4 they can decide on the content and lay-out of the Basic Map.
The Mapping Group facilitates the link between the Working Groups and the EMIS unit, and
it is this group which discusses the needs of Thematic Maps, the mapping rationale for
Suitability and Sensitivity Map, and the overlay procedures. Finally, the Mapping Group can
play a role in capacity-building and training.
Step 3: Taking Inventory
The EMIS inventory stage covers the search for existing data and maps (a difficult task
which involves searching over a wide range of organisations and potential sources), setting
up a filing system for hardcopies, developing a filing system for the digital data, and
establishing a reference database of all relevant maps and data.
Step 4: Preparing the Base Map
A Base Map includes the main features of the city such as major rivers, main roads,
historical monuments and basic landforms. These basic features should be used in each
map created later on to give some guidance and orientation on the location. The layers of
the Base Map function as master layers, so rivers, roads or boundaries will never ever be
digitised again unless they undergo physical change (i.e. a river may change course). When
printing the first Base Maps, it is essential to decide on a standard layout which can be used
for all the EMIS maps. It is important to design the Base Map, in terms of the inclusion of
information and the graphics chosen.
Step 5: Preparing Thematic Maps
In the EMIS, Thematic Maps show strictly factual information, for example, height of water
table level in metres underneath the ground, soil eroded each year in centimetres, persons
6
per hectare for each administrative sub-unit, and so on. The input for these Thematic Maps
will come from existing maps, scientific reports or existing data, which can be found in
different city departments or academic and research institutions, or which can be generated
by the Issue-Specific Working Groups.
Step 6: Preparing Suitability and Sensitivity Maps
The creation of a Suitability and Sensitivity Map involves the interpretation of factual data as
found in Thematic Maps and the evaluation of these findings. This focuses on drawing
conclusions about conditions in specific areas and defining and applying "rules and
regulations" according to these conditions. For instance, the Working Groups may assign
ranks to these "rules and conditions" according to the impact of urban issues on
development or the impact of development on the various environmental issues. A Suitability
Map could show, for example, areas marked or graded by their suitability for housing
development, say on environmental criteria such as slope of land, soil stability, ground water
table, flooding exposure, etc.
Step 7: Overlaying of Fact and Policy Maps
For some outputs of the EMIS it is necessary to combine information from several maps or
data sets. The interaction between environment and developmental issues, i.e. the
identification of crucial, hotspots can be simulated by overlaying a variety of maps.
(Overlaying can be done manually, using transparent maps in combination, or on the
computer through the GIS system.) Different combinations of overlays will generate the
necessary outputs which are significant for urban planning and management.
Step 8: Information Outreaching
The EMIS uses a participatory approach and therefore public information activities are an
important part of the system. Continuous and active "outreach" to the public at large can
stimulate the identification or provision of new information into the system, and equally it can
be used to field-text and refine the outputs to ensure they are understandable and useable.
Methods to promote the system include city-wide and local exhibitions, the world-wide-web,
printed publications, use of print and television/radio media, interactive map publication on
CD-ROM, etc.
7
Step 9: Maintaining the System
An EMIS is a continuously evolving system. Thus, even though the design of the system is
completed, the data content grows and changes continuously over time. In order to maintain
the system it is vital to anchor the system in the most appropriate department or institution,
to ensure public involvement, and to acquire a regular budget on a long-term basis. The
anchoring department has to commit itself to continuously up-date the system (undertaking
the costs involved) and must provide a continuous training programme for the EMIS users
and operators.
Sample Areas of Application:
Though presented as Environmental MIS, this approach is capable with limited modification,
of responding to diverse needs and uses in urban planning and management. Thus, a
generic EMIS (which could also be called an Urban Management Information System -
UMIS) has the capability to serve a number of urban management functions. The planning
department is concerned about the physical development of the city, while the environment
department needs to better manage environmental resources and hazards. The EMIS has
been used to attract investors by providing maps which show the best locations for
investment in the city.
Linkage with UG Norms:
The key elements of EMIS established within a participatory decision making framework are
its interactive nature and its accessibility to all users and stakeholders including community
groups, organized informal sector operators, developers, researchers and public activists.
This greatly enhances transparency and makes information a shared resource, so the EMIS
also becomes an effective tool to empower the different stakeholder groups.
Reference: http://www.serd.ait.ac.th/ump/html/emistk.htm
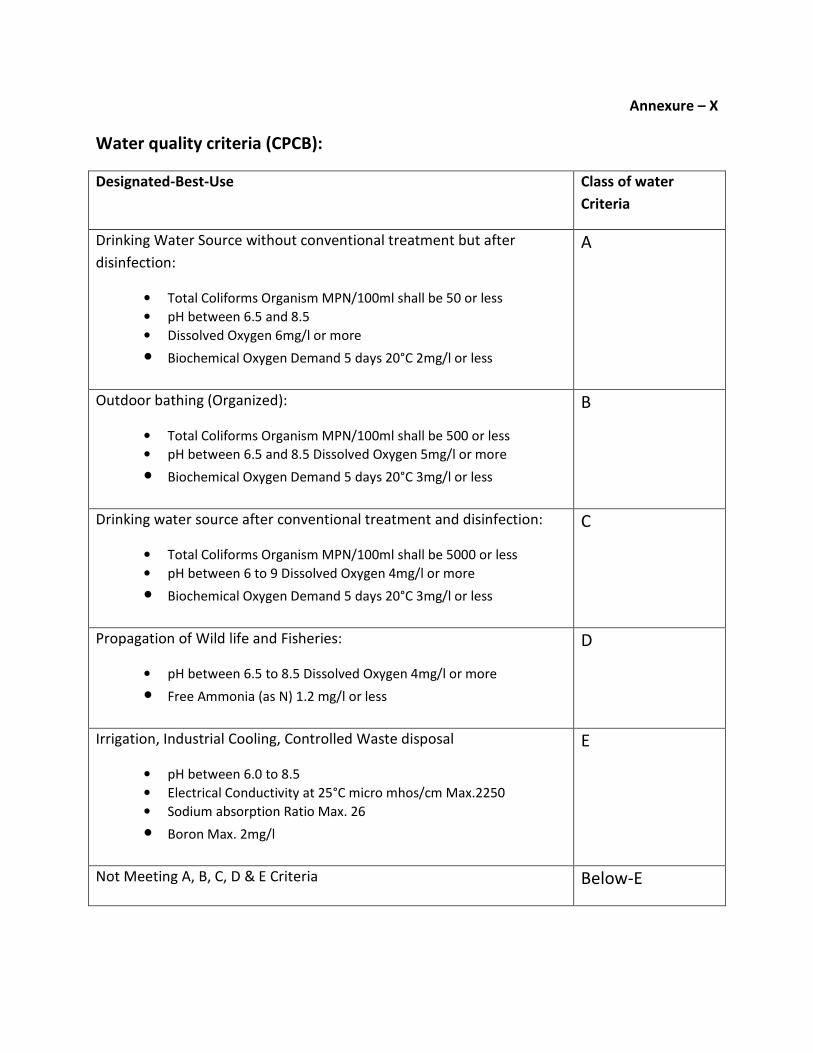
Annexure – X
Water quality criteria (CPCB):
Designated-Best-Use Class of water
Criteria
Drinking Water Source without conventional treatment but after
disinfection:
• Total Coliforms Organism MPN/100ml shall be 50 or less
• pH between 6.5 and 8.5
• Dissolved Oxygen 6mg/l or more
• Biochemical Oxygen Demand 5 days 20°C 2mg/l or less
A
Outdoor bathing (Organized):
• Total Coliforms Organism MPN/100ml shall be 500 or less
• pH between 6.5 and 8.5 Dissolved Oxygen 5mg/l or more
• Biochemical Oxygen Demand 5 days 20°C 3mg/l or less
B
Drinking water source after conventional treatment and disinfection:
• Total Coliforms Organism MPN/100ml shall be 5000 or less
• pH between 6 to 9 Dissolved Oxygen 4mg/l or more
• Biochemical Oxygen Demand 5 days 20°C 3mg/l or less
C
Propagation of Wild life and Fisheries:
• pH between 6.5 to 8.5 Dissolved Oxygen 4mg/l or more
• Free Ammonia (as N) 1.2 mg/l or less
D
Irrigation, Industrial Cooling, Controlled Waste disposal
• pH between 6.0 to 8.5
• Electrical Conductivity at 25°C micro mhos/cm Max.2250
• Sodium absorption Ratio Max. 26
• Boron Max. 2mg/l
E
Not Meeting A, B, C, D & E Criteria Below-E