Embed Size (px)
Citation preview

U
Environmental Performance Report 2003REPORT ON PROGRESS AND 2002 DATA

Contents
This is a brief description of our approach to environmentalmanagement – including our sustainability initiatives in agriculture,fish and water – and an overview of our environmental performancein 2002. Further details are available in the Environment & Societysection of our website www.unilever.com.
Who we are 2
Chairmen’s message 3
Unilever and sustainable development 4
Key events in 2002 6
Executive responsibilities and 8environmental management
Summary of environmental 10performance
Environmental performance 11
Key performance trends 11
Environmental impact 14
Data parameters 16
Scope and quality of our data 17
Progress against targets 18
Verifier’s statement and 20Unilever’s response
Unilever Environmental Performance Report 1
See our website www.unilever.com(click Environment & Society) forfurther information on ourenvironmental performance.
Who we are
Unilever is a multi-local multinational with consumers, employees,business partners and shareholders on every continent.
The Unilever Group was created in1930 when the UK soap-maker Lever Brothers merged its businesseswith those of the Dutch margarineproducer, Margarine Unie. Unileverhas operations in around 100 countries and our products are on sale in 150.
Unilever has two divisions – Foodsand Home & Personal Care. Foodbrands include such well-knownnames as Bertolli, Hellmann’s, Knorr,Lipton and Magnum. Home &Personal Care brands include Dove,Lux, Omo, Pond’s and Sunsilk.
At the end of 2002, we employed247,000 people and our turnoverwas €48,760 million (see chartbelow). By the very nature of ourbusiness in cleaning, grooming andfeeding people, our success depends on our companies being
close to consumers and deeply rootedin the societies and environments inwhich we operate. Over two-thirds ofour raw materials come fromagricultural sources.
All Unilever companies must complywith Unilever’s environmental policyand management standards thatapply across the Group.
Wh
o w
e are
Unilever Environmental Performance Report 2
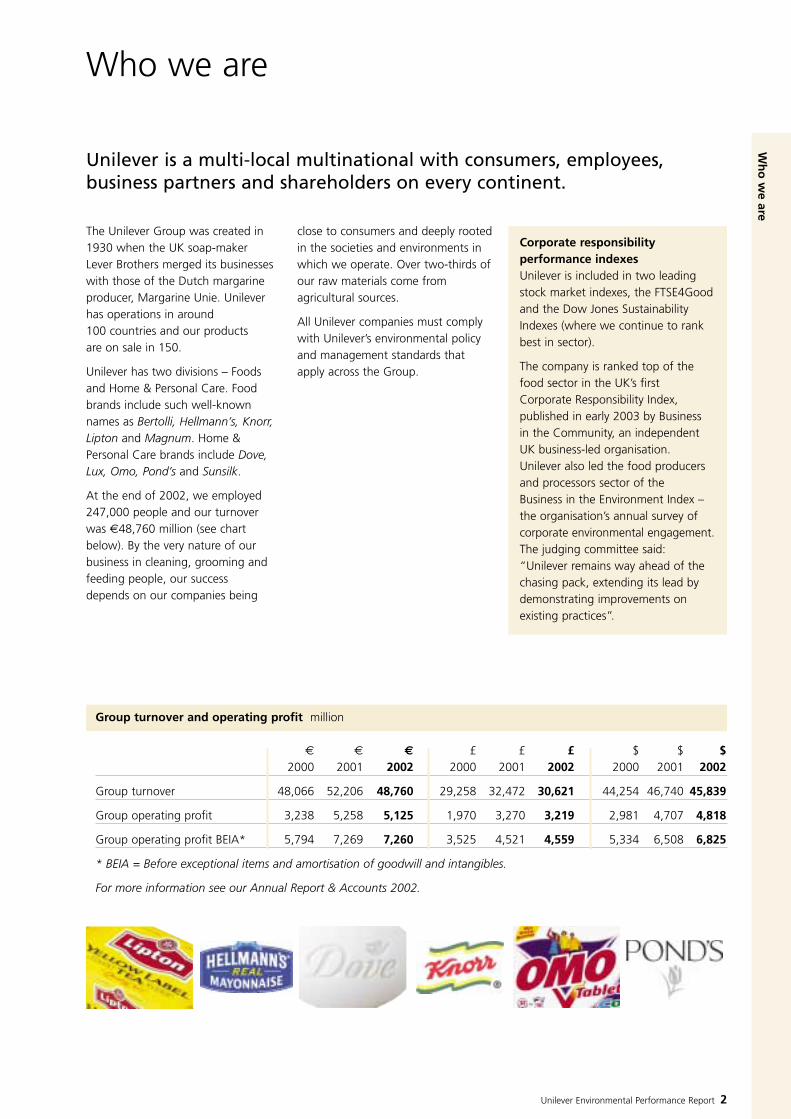
Group turnover and operating profit million
€ € € £ £ £ $ $ $2000 2001 2002 2000 2001 2002 2000 2001 2002
Group turnover 48,066 52,206 48,760 29,258 32,472 30,621 44,254 46,740 45,839
Group operating profit 3,238 5,258 5,125 1,970 3,270 3,219 2,981 4,707 4,818
Group operating profit BEIA* 5,794 7,269 7,260 3,525 4,521 4,559 5,334 6,508 6,825
* BEIA = Before exceptional items and amortisation of goodwill and intangibles.
For more information see our Annual Report & Accounts 2002.
Corporate responsibilityperformance indexesUnilever is included in two leadingstock market indexes, the FTSE4Goodand the Dow Jones SustainabilityIndexes (where we continue to rankbest in sector).
The company is ranked top of thefood sector in the UK’s first Corporate Responsibility Index,published in early 2003 by Business in the Community, an independentUK business-led organisation. Unilever also led the food producersand processors sector of the Business in the Environment Index –the organisation’s annual survey ofcorporate environmental engagement.The judging committee said:“Unilever remains way ahead of thechasing pack, extending its lead bydemonstrating improvements onexisting practices”.

Chairmen’s message
Business behaviour is coming under increasing scrutiny in every part of the world. Our clear values, business principles and commitment toenvironmental and social responsibility are proving important assets aswe continue to progress and prosper.
During 2002 – the period covered by this report – webought more than a third of our fish from sustainablesources and completed protocols for the sustainablemanagement of five key crops. Our efforts to improve thequality of water in rivers and lakes and our initiatives topromote sustainable agriculture and fishing wererecognised externally. For the fourth year running we haveled our sector in the Dow Jones Sustainability Indexes. Thequality of our environmental reporting was recognised bythe Association of Chartered Certified Accountants (ACCA)when Unilever won ACCA’s Best Environmental ReportAward in the UK.
We continued to improve the environmental managementand eco-efficiency (doing more with less) of our factories.Our improvement targets covering seven parameters arestretching and we did not meet them all in 2002. Thereare good reasons for this (see pages 11-13). However thedata clearly show we continue to make progress towardsour long-term objectives.
A review of our environmental strategy in 2002 showedthat we made good progress in eco-efficiency, developingenvironmentally better products, and in our threesustainability initiatives (agriculture, fish and water). Theseactivities remain central to our commitment to contributeto sustainable development.
The review identified three additional areas for ourattention. First, we need to connect better with society on
environmental care and ensure that we understandevolving expectations. Second, we must make the most ofour eco-manufacturing skills across the wider supply chain,including third-party product suppliers, providers of keyraw materials, and transportation. Third, we need toembed environmental sustainability into everyday decisions. During 2003, plans will be developed withUnilever’s Foods and Home & Personal Care Divisions totackle these areas.
We are confident that our commitment to environmentalimprovement and social responsibility – deeply-rooted inour corporate culture – will continue to fortify our brands,inspire our people and contribute to building trustbetween us and our many stakeholders. This will help us maintain our momentum on our business plan calledPath to Growth.
We thank all our employees for their commitment andexceptional teamwork throughout the year.
Antony Burgmans Niall FitzGerald
Chairmen of Unilever
Ch
airmen
‘s messag
e
Unilever Environmental Performance Report 3
Antony Burgmans Niall FitzGerald

Unilever and sustainable development
By making and selling brands that meet people’s everyday needs, wehave grown into one of the world’s largest consumer goods businesses.
We believe that doing business in a responsible way has a positive social and environmental impact. We create and share wealth, invest inlocal economies, develop people’s skills and spread expertise – includinggood environmental practice – across borders.
As a global company we aim to playour part in addressing global social andenvironmental concerns, such as healthand hygiene, water quality andsustainable agriculture.
This is why we are committed tocontribute to sustainable development– meeting the needs of the presentwithout compromising the ability offuture generations to meet their needs.
There are many people andorganisations who affect our businessor are affected by it, includingemployees, customers, consumers,business partners, investors,governments and regulators.
As a multi-local multinational, wetackle global concerns with localactions and operate in partnership with local agencies, governments andnon-governmental organisations.
We work with many businessorganisations, including the WorldBusiness Council for SustainableDevelopment, and we were one of the founding signatories to the United Nations Global Compact.
Our commitment to corporateresponsibility is an integral part of ouroperating tradition. It is spelt out in our recently revised Code of BusinessPrinciples and in our CorporatePurpose. It finds practical expression in the worldwide standards we haveset to ensure the safety of ourconsumers and our workforce and tominimise the environmental impact ofour operations.
This report deals with theenvironmental aspects of our work. We also produce a Social Review,which sets out Unilever’s approach toresponsible corporate behaviour. It outlines current policies andpractices, with local companyexamples, and provides a baseline fromwhich we can measure future socialperformance. The Social Review, plusan overview brochure of Unilever'sapproach to environmental and socialresponsibility (Global Challenges: LocalActions), are available in theEnvironment & Society section of ourwebsite www.unilever.com.
Sustainability initiativesWe, as a business, depend on ahealthy environment. The people whobuy our cleaning products, forexample, need clean water to use them and we need clean water tomake them. Our frozen fish businessmust have a regular supply of healthyfish and our foods business needshigh-quality farmed goods.
We are very conscious of ourdependence on a healthy environmentand the need to keep it that way withsound environmental practices of ourown. We use a life cycle approach toassess our overall impact on theenvironment. This enables us toanalyse our impacts and to concentrateon those areas where we can bring thegreatest benefits.
Many issues that affect us are outsideour direct control – either at thebeginning of the supply chain or at theend. This is why in our sustainabilityinitiatives we focus on three areas thatare directly relevant to our business butwhich go beyond our own operations.These are agriculture, fish and water.
Un
ilever and
sustain
able d
evelop
men
t
Unilever Environmental Performance Report 4
AgricultureOver two-thirds of our raw materialscome from agriculture and we havealways aimed for a responsibleapproach to farming practices. But inrecent years it became clear thatincreasing environmental and socialpressures on agriculture (whichthreaten our supply chains) andgrowing consumer concerns about thefood chain (which threaten ourmarkets) demanded a more radicalattitude. This led to our SustainableAgriculture Programme, which beganin the 1990s.
We have completed guidelines for the sustainable management of all five of our key crops – palm oil, tea,peas, spinach and tomatoes – whichare published on a website set up to share our knowledge(www.growingforthefuture.com).
We are also working with other major food companies – includingGroupe Danone and Nestlé – topromote sustainable agriculturepractices through the SustainableAgriculture Initiative Platform(www.saiplatform.org).
See page 6 for our progress in 2002.
FishThe world’s major fisheries are underthreat. Catches of the most importantspecies for human consumption are attheir lowest levels in recent years.According to the UN’s Food andAgriculture Organisation, 48% of allfisheries are fully exploited, 16% over-fished and 9% depleted.
We are one of the world’s largestbuyers of frozen fish for our Iglo, BirdsEye and Findus brands. Without regularsupplies we would have no fishbusiness, so we have a clearcommercial interest to protect andpreserve fish stocks. In 1996 we madea long-term commitment to buy all ourfish from sustainable sources. We set a milestone to achieve this by 2005.Also that year, working with theconservation organisation WWF, wejointly set up the Marine StewardshipCouncil (MSC) to establish acertification process for sustainablefishing practices.
See page 7 for progress in 2002.
WaterOur activities are intimately linked withsafe water supplies, whether used inour operations, or by our suppliers, orby consumers who use our products.We have looked at our water usethrough the full life cycle of ourproducts, and right across our productrange, from raw material sourcing toconsumer use of our products. This has given us a global picture – ourimprint – of the way we impact onwater resources.
The imprints of our two Divisions arequite different. Most of the water usedin the Foods Division is in agriculture.We estimate that half of our overallwater imprint is associated withgrowing the produce that accounts forover two-thirds of our raw materials. InHome & Personal Care, the imprint isdominated by water used byconsumers – bathing, cleaning teethand washing clothes. This underlinesthe need for us to work withconsumers to foster the responsibleuse of water. It is clearly in our long-term interests to do so becausewithout clean water many of ourbranded products would be unusable.
Understanding our imprint is enablingus to define priorities and toimplement a framework for waterwithin which our companies andproduct categories should operate.
Our SWIM (Sustainable WaterIntegrated catchment Management)principles and guidelines have beenused to evaluate and focus our current projects.
For more detail on sustainability seethe Environment & Society section ofour website www.unilever.com.
Un
ilever and
sustain
able d
evelop
men
t
Unilever Environmental Performance Report 5
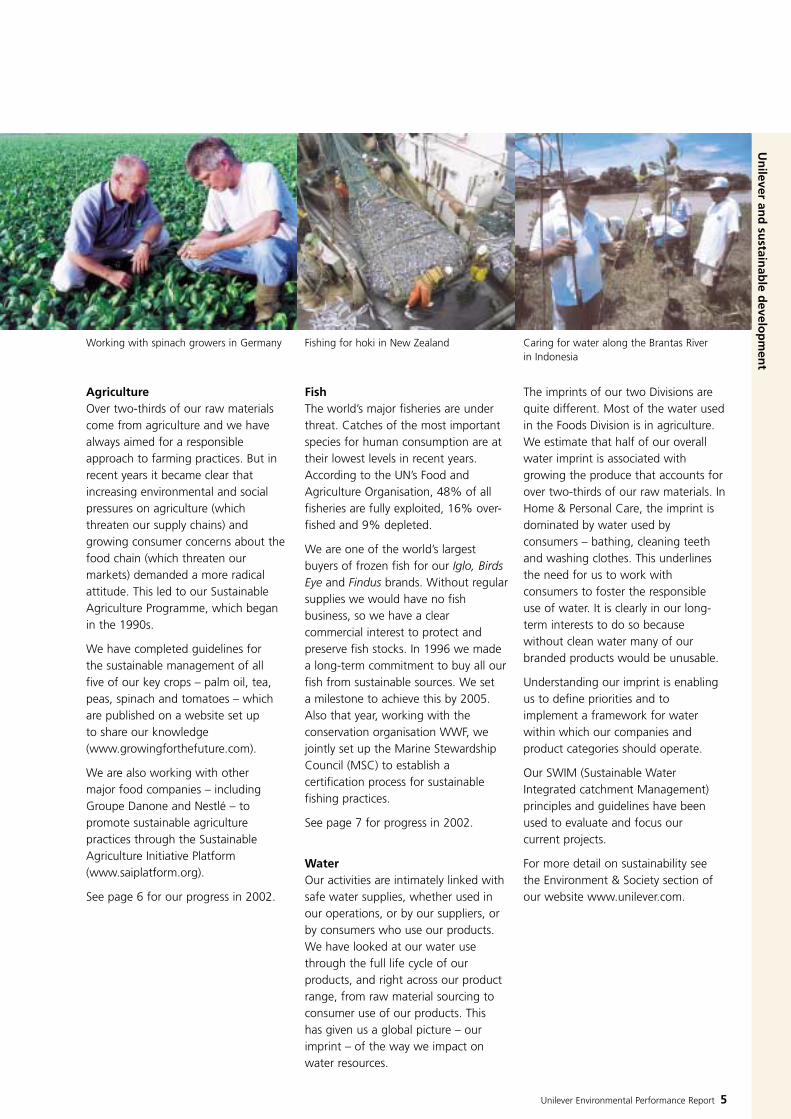
Working with spinach growers in Germany Fishing for hoki in New Zealand Caring for water along the Brantas River in Indonesia

Key events in 2002
In 2002, we continued to share our knowledge ofsustainable agriculture practices with others in the foodindustry, farming organisations, non-governmentalorganisations and anyone else interested in the issues.
Our expertise has been developed over the past five yearsthrough our work in our Sustainable Agriculture Programme(see page 5). We have produced two summary brochures onprogress and a number covering specific crops (all availableas downloads on our website).
Our aim is to ensure Unilever’s continued access to its keyagricultural raw materials, and ultimately to develop marketmechanisms that allow consumers and customers (egretailers) to influence the sourcing of raw materials throughtheir buying habits.
We prefer to see this work as non-competitive. We wantothers to join us in this endeavour to promote sustainablepractices that will in the end benefit us all.
In 2002, we worked with many interested organisations invarious parts of the world in the development of guidelineson best practice. Together with Groupe Danone and Nestléwe helped found the Sustainable Agriculture Initiative (SAI)Platform, a food industry project that supports thedevelopment of sustainable agriculture world-wide.
As a further demonstration of our willingness to share our knowledge, in 2002 we launched a separate website(www.growingforthefuture.com). This will develop into a central access point for anyone wanting to find out more about our progress and will include detailed technical information.
Key even
ts in 2002
Unilever Environmental Performance Report 6
Booklets on our sustainable agricultureprogramme are available atwww.growingforthefuture.com
Alaska pollock, one of the fish species usedby Unilever
Unilever's exhibition at the World Summit onSustainable Development, in Johannesburg,September 2002
Sustainable agriculture
In 2002 preparations continued for soil remediation at theformer thermometer factory in Kodaikanal, southern India,operated by Hindustan Lever Limited (HLL).
The factory used to manufacture mercury thermometers,largely for export, and was due for closure because it wasnot part of HLL's core business. In March 2001, followingreceipt of information from local NGOs including GreenpeaceIndia, HLL found that there had been breaches of proceduresfor the disposal of glass scrap. The company actedstraightaway and voluntarily halted production at the factory.
Through most of 2002, extensive investigations and meetingswith the authorities and interested individuals took place.Independent environmental consultants, URS, completed arisk assessment of the mercury-related operations at the site.
The URS Final Report on Environmental Site Assessment andRisk Assessment for Mercury was presented to the WorkingCommittee of the Tamil Nadu Pollution Control Board at itsmeeting in October 2002. As the first stage of site
remediation, the Working Committee agreed to HLL's offerto export the following materials to the USA for mercuryrecovery and recycling:
● All mercury-containing glass scrap accumulated at the site
● Effluent treatment plant residue containing mercury
● Thermometers in various stages of manufacture when thefactory operation was shut
● All stocks of mercury.
The URS report documentation also included reviews ofHLL's medical surveillance programme by three independentbodies: the consultancy TNO (Netherlands Organisation forApplied Scientific Research); the All India Institute of MedicalSciences; and the Indian Association of Occupational Health.The reviews confirmed that adequate health procedures hadbeen in place and that there was no adverse health impactbecause of operations with mercury at the site. See the fullstory in the Environment & Society pages at www.unilever.com.
Kodaikanal
Key even
ts in 2002
Unilever Environmental Performance Report 7
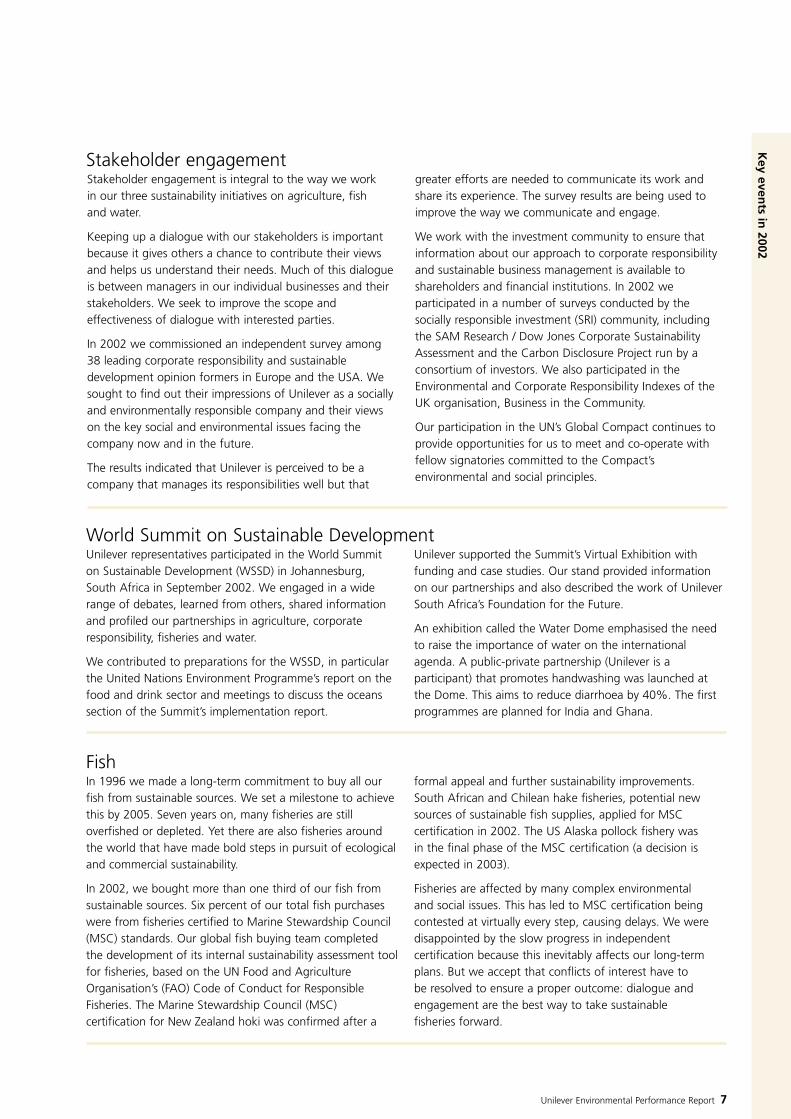
Unilever representatives participated in the World Summit on Sustainable Development (WSSD) in Johannesburg, South Africa in September 2002. We engaged in a widerange of debates, learned from others, shared informationand profiled our partnerships in agriculture, corporateresponsibility, fisheries and water.
We contributed to preparations for the WSSD, in particularthe United Nations Environment Programme’s report on thefood and drink sector and meetings to discuss the oceanssection of the Summit’s implementation report.
Unilever supported the Summit’s Virtual Exhibition withfunding and case studies. Our stand provided informationon our partnerships and also described the work of UnileverSouth Africa’s Foundation for the Future.
An exhibition called the Water Dome emphasised the needto raise the importance of water on the internationalagenda. A public-private partnership (Unilever is aparticipant) that promotes handwashing was launched atthe Dome. This aims to reduce diarrhoea by 40%. The firstprogrammes are planned for India and Ghana.
World Summit on Sustainable Development
In 1996 we made a long-term commitment to buy all ourfish from sustainable sources. We set a milestone to achievethis by 2005. Seven years on, many fisheries are stilloverfished or depleted. Yet there are also fisheries aroundthe world that have made bold steps in pursuit of ecologicaland commercial sustainability.
In 2002, we bought more than one third of our fish fromsustainable sources. Six percent of our total fish purchaseswere from fisheries certified to Marine Stewardship Council(MSC) standards. Our global fish buying team completed the development of its internal sustainability assessment toolfor fisheries, based on the UN Food and AgricultureOrganisation’s (FAO) Code of Conduct for ResponsibleFisheries. The Marine Stewardship Council (MSC)certification for New Zealand hoki was confirmed after a
formal appeal and further sustainability improvements.South African and Chilean hake fisheries, potential newsources of sustainable fish supplies, applied for MSCcertification in 2002. The US Alaska pollock fishery was in the final phase of the MSC certification (a decision isexpected in 2003).
Fisheries are affected by many complex environmental and social issues. This has led to MSC certification beingcontested at virtually every step, causing delays. We weredisappointed by the slow progress in independentcertification because this inevitably affects our long-termplans. But we accept that conflicts of interest have to be resolved to ensure a proper outcome: dialogue andengagement are the best way to take sustainable fisheries forward.
Fish
Stakeholder engagement is integral to the way we work in our three sustainability initiatives on agriculture, fish and water.
Keeping up a dialogue with our stakeholders is importantbecause it gives others a chance to contribute their viewsand helps us understand their needs. Much of this dialogueis between managers in our individual businesses and theirstakeholders. We seek to improve the scope andeffectiveness of dialogue with interested parties.
In 2002 we commissioned an independent survey among 38 leading corporate responsibility and sustainabledevelopment opinion formers in Europe and the USA. Wesought to find out their impressions of Unilever as a sociallyand environmentally responsible company and their viewson the key social and environmental issues facing thecompany now and in the future.
The results indicated that Unilever is perceived to be acompany that manages its responsibilities well but that
greater efforts are needed to communicate its work and share its experience. The survey results are being used toimprove the way we communicate and engage.
We work with the investment community to ensure thatinformation about our approach to corporate responsibilityand sustainable business management is available toshareholders and financial institutions. In 2002 weparticipated in a number of surveys conducted by thesocially responsible investment (SRI) community, includingthe SAM Research / Dow Jones Corporate SustainabilityAssessment and the Carbon Disclosure Project run by aconsortium of investors. We also participated in theEnvironmental and Corporate Responsibility Indexes of theUK organisation, Business in the Community.
Our participation in the UN’s Global Compact continues toprovide opportunities for us to meet and co-operate withfellow signatories committed to the Compact’senvironmental and social principles.
Stakeholder engagement

Executive resp
on
sibilities an
d en
viron
men
tal man
agem
ent
Unilever Environmental Performance Report 8
Executive responsibilities andenvironmental management
We have an environmental policy that applies to all Unilever companies world-wide.
Our policy sets out our commitment to meet the needs of customers andconsumers in an environmentally soundand sustainable manner, throughcontinuous improvements inenvironmental performance in all our activities.
Our environmental strategy focusesprimarily on achieving its goals througheco-efficiency in manufacturing, eco-innovation in our products, and our three sustainability initiatives onagriculture, fish and water.
Furthermore, we intend to give asharper focus to three areas:
● First, we need to connect better withsociety on environmental care andensure that we understand evolvingexpectations
● Make the most of our eco-manufacturing skills across the widersupply chain, including third-partyproduct suppliers, providers of keyraw materials, and transportation
● Ensure that environmentalsustainability is firmly embedded ineveryday decision making.
To implement our policy and strategy we have a clear line of responsibility forthe environment, starting at the top ofthe company.
The Unilever Chairmen and ExecutiveCommittee develop strategic policies for
environmental issues, with overalloperational responsibility located in theFoods Division and Home & PersonalCare Division. Daily responsibility formanagement and oversight ofenvironmental issues and policyimplementation rests with the localmanagement of the operatingcompanies in the respective countries.
Support to the business is provided by:
The Unilever Environment Group(UEG). This is the strategy and policy-making group that carries theenvironmental responsibility on behalf of the Board. Chaired by Clive Butler,Corporate Development Director, its roleis to ensure that we honour ourcommitment to contribute to theenvironmental pillar of sustainabledevelopment and to continuouslyimprove our environmentalperformance. The UEG is made up ofindividuals from the Divisions / BusinessGroups and corporate expertise onsafety, health, environment andcommunications.
In 2002, we had four external advisorsin the UEG who contribute valuableindependent views on our plans andadvise on emerging and long-termenvironmental issues. Advisors meettwice a year as part of the UEG andindividually with senior managementand scientists.
The advisors in 2002 were:
● Daniel Esty, Director of Yale Centre forEnvironmental Law and Policy
● Rajendra Pachauri, Director of the TataEnergy Research Institute in India
● Jonathon Porritt, Programme Directorof Forum for the Future
● Björn Stigson, President of the World Business Council forSustainable Development
● Pieter Winsemius, member of theNetherlands' Scientific Council forGovernment Policy.
In 2002, Rajendra Pachauri wasappointed chairman of theIntergovernmental Panel on ClimateChange. He has resigned as a Unileveradvisor to concentrate on his duties. Wecongratulate him on his new position.
Safety and Environmental AssuranceCentre (SEAC). This is a centraltechnical resource providing expertiseand advice on safety and environmentmatters, such as expert knowledge ofhazard analysis and risk assessment forour products and processes. This is alsoour centre for life cycle assessment.
Unilever Environmental Performance Report 9
Executive resp
on
sibilities an
d en
viron
men
tal man
agem
ent
All Unilever companies must complywith the Unilever Framework Standardsfor occupational health and safety,environmental care and consumer safety,in a manner that recognises, and isconsistent with, local legislation.
Our environmental managementsystems are designed to achievecontinuous improvement and arecompatible with international standards.
Our Environmental Care FrameworkStandards require all Unilever operationsto establish an environmentalmanagement system. The framework isbased on the ISO 14001 managementsystems standard, and is ultimatelyapplicable to all parts of the business. Itis supported by specific standards andguidance documents covering areassuch as environmental aspectsevaluation, incident investigation andaudit protocols to assess compliancewith the framework standards.
Each site is audited at least once everythree years by trained Unileveremployees who come from other sites.
Various environmental training courseshave been developed and implementedusing a “train the trainers” approach.Examples include: a course to implementthe framework standards; awarenesstraining for senior managers andoperational staff; plus a course forsafety, health and environment (SHE)auditors within the Business Groups.
We are committed to eco-efficiency –improving the environmental efficiencyof our manufacturing operations, and to incorporating environmental factors in the design and re-design of our products – eco-innovation. We are developing new tools forproduct developers to assess theenvironmental impact of productsthroughout their life cycle.
Working with the CambridgeProgramme for Industry and Forum for the Future, we are developing aninnovative sustainability learning projectto help managers understand the issuesand opportunities, particularly in productdevelopment and the supply chain.
Our target is to have all our lead sitescertified to ISO 14001 by the end of2003. During 2002, a further 23 siteswere certified, but 20 certified sites wereclosed or divested. At the end of 2002we had 114 certified sites. We arecontinuing with the certification ofindividual sites but we are likely to fallshort of 100% certification of our leadsites by end 2003. This is largelybecause of the many changes within ourmanufacturing network and the need tofocus on the implementation of ourEnvironmental Care FrameworkStandards. In addition to the ongoingsite certification programme, we areexploring the possibility of externalverification of our Environmental CareFramework Standards against the ISO 14001 standard.
Management systems

Unilever Environmental Performance Report 10
Summary of environmental performance
This is a summary of the environmental performance of ourmanufacturing sites over the last five years. The graph shows the overallimprovement (%) since 1998 and our five-year targets to 2007. The tableshows the load per tonne of production for the last five years.
Load per tonne of production 1998-2002
Parameter Units 1998 1999 2000 2001 2002
Chemical oxygen demand (COD) kg/tonne 2.96 2.79 2.50 2.33 2.31
Hazardous waste kg/tonne 0.66 0.62 0.50 0.50 0.55 (0.42)
Non-hazardous waste kg/tonne 14.86 13.00 12.00 11.26 9.88
Water m3/tonne 6.54 6.06 5.43 5.04 4.29
Energy GJ/tonne 2.57 2.40 2.27 2.19 2.15
Carbon dioxide (CO2) from energy kg/tonne 217.23 208.14 197.91 198.59 195.17
Boiler/Utilities oxides of sulphur (SOx) kg/tonne 0.55 0.45 0.42 0.34 0.29
( ) Figure without one-off disposal of contaminated soil
Sum
mary o
f enviro
nm
ental p
erform
ance
Reduction in load per tonne of production since 1998 and targets for 2007
expressed as % of the 1998 kg / tonne figures
1998
2002
Target 2007
20
40
60
80
100100
Hazardouswaste
Boiler/Utilities
SOx
Non-hazardouswaste
CO2 fromenergy
COD
Water
Note: This report shows our energy use as well as the resultingCO2 emissions. Since 1999 we have focused on global warming potential and this is why we include a target for CO2 from energy.
Energy sources account for 93% of our greenhouse gas (GHG)emissions from manufacturing – the remainder is from landfillingbiodegradable wastes, aerobic treatment of wastewater andlosses of refrigerants.

Environmental performance
Key performance trends
Here are the trends in the key performance indicators of ourmanufacturing sites up to 2002. For further details on the issues andactions we have taken to reduce our impact, visit the Environment &Society section of our website www.unilever.com. See page 16 for adescription of our data parameters.
Enviro
nm
ental p
erform
ance K
ey performance trends
Unilever Environmental Performance Report 11
Estimated COD sent to the aqueous environment
Total COD leaving the sites
0703020201009998
COD kg / tonne of production
Showing estimated COD sent to the aqueous environment
2.96
2.79
2.50
2.33
2.08
TAR
GET
TAR
GET
TAR
GET
2.31
0.92
0.93
0.78
0.54
0.48
2.13
2.00
0703020201009998
Water m3 / tonne of production
6.54
6.06
5.43
5.04
4.82
TAR
GET
TAR
GET
TAR
GET
4.29
4.03
3.87
Unilever manufacturing performance 1998-2002 and targets: reductions in load per tonne of production
The total COD load per tonne of production decreased by0.8% in 2002, leaving us short of our target. This waslargely because of:
● Improved COD measurement at some of our major sites. Previously, data were estimated from BiochemicalOxygen Demand (BOD) loads or via estimated effluentvolumes
● The trend at our sites to use offsite municipal treatmentrather than onsite treatment. This leads to a largerquantity of COD leaving the site but is not a measure ofthe impact on the environment. Over 90% of the totalCOD load leaving our sites is subsequently treated inmunicipal works. We estimate that municipal treatmentremoves 87.5% of the COD from this source, whichmeans the COD discharged to the aqueous environmentis much lower than the total COD leaving our sites.
Total water consumption per tonne of production wasdown by 15% in 2002, exceeding our target. Thereduction was due to improvements in the way water ismeasured and also improvements in water management attwo major sites in Brazil and the USA. In addition, a site inthe Netherlands that used a large amount of water wasclosed during 2002. Over half the water used by ourfactories is not of drinking quality and a large proportion isonly used once for cooling and is not contaminated.
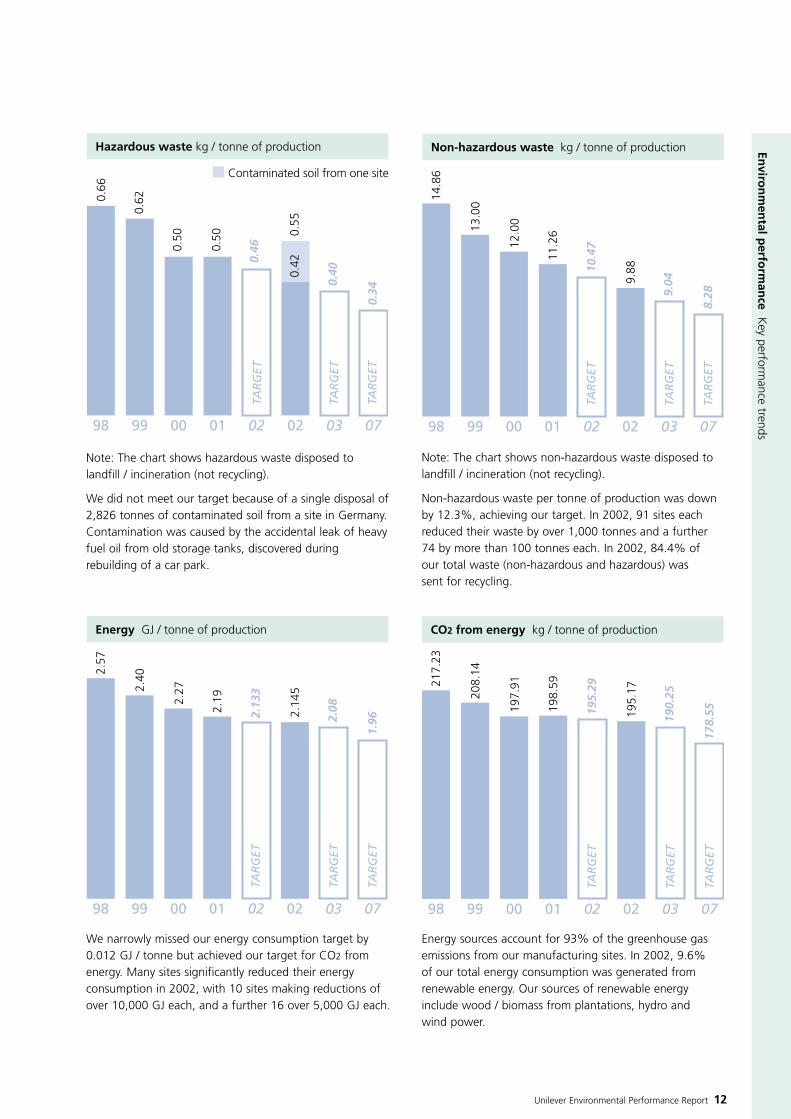
Note: The chart shows hazardous waste disposed to landfill / incineration (not recycling).
We did not meet our target because of a single disposal of2,826 tonnes of contaminated soil from a site in Germany.Contamination was caused by the accidental leak of heavyfuel oil from old storage tanks, discovered duringrebuilding of a car park.
Enviro
nm
ental p
erform
ance K
ey performance trends
Unilever Environmental Performance Report 12
Hazardous waste kg / tonne of production
TAR
GET
TAR
GET
TAR
GET
0703020201009998
0.66
0.62
0.50
0.50
0.42
0.55
0.46
0.40
0.34
Contaminated soil from one site
0703020201009998
Non-hazardous waste kg / tonne of production
14.8
6
13.0
0
12.0
0
11.2
6
10.4
7TA
RG
ET
TAR
GET
TAR
GET
9.88
9.04
8.28
Note: The chart shows non-hazardous waste disposed tolandfill / incineration (not recycling).
Non-hazardous waste per tonne of production was down by 12.3%, achieving our target. In 2002, 91 sites eachreduced their waste by over 1,000 tonnes and a further 74 by more than 100 tonnes each. In 2002, 84.4% of our total waste (non-hazardous and hazardous) was sent for recycling.
0703020201009998
Energy GJ / tonne of production
2.57
2.40
2.27
2.19
2.13
3TA
RG
ET
TAR
GET
TAR
GET
2.14
5
2.08
1.96
0703020201009998
CO2 from energy kg / tonne of production
217.
23
208.
14
197.
91
198.
59
195.
29TA
RG
ET
TAR
GET
TAR
GET
195.
17
190.
25
178.
55
We narrowly missed our energy consumption target by0.012 GJ / tonne but achieved our target for CO2 fromenergy. Many sites significantly reduced their energyconsumption in 2002, with 10 sites making reductions ofover 10,000 GJ each, and a further 16 over 5,000 GJ each.
Energy sources account for 93% of the greenhouse gasemissions from our manufacturing sites. In 2002, 9.6% of our total energy consumption was generated fromrenewable energy. Our sources of renewable energyinclude wood / biomass from plantations, hydro and wind power.

Our target was exceeded, achieved by using less fuel oil(heavy and light) at our factories. NOx emissions have alsodeclined since 1998 because of lower fuel consumptionand the greater use of natural gas (produces less NOx).
SOx emissions from sulphonation are about 3% of the SOxload emitted from our boilers and are separately reportedin the Environment & Society section of our website (see'Additional data').
Enviro
nm
ental p
erform
ance K
ey performance trends
Unilever Environmental Performance Report 13
0703020201009998
Boiler / Utilities SOx kg / tonne of production
0.55
0.45
0.42
0.34
0.31
TAR
GET
TAR
GET
TAR
GET
0.29
0.27
0.26
We measure the amount of ozone depletinggases (CFCs, HCFCs and mixtures) in refrigerationand air conditioning systems at our sites, andassess the losses each year. The emissions areexpressed as kg CFC-11 equivalent.
Ozone depleting potential kg / tonne of production
0.00
016
0.00
016
0.00
014
020100

Environmental impact
In 2002, the total environmental impact from our manufacturing sitesdecreased for all our key performance indicators except hazardous waste(caused by a single incident). See notes in charts on pages 11-13 forgreater detail.
Enviro
nm
ental p
erform
ance Environm
ental impact
Unilever Environmental Performance Report 14
COD 103 tonnes63
.0
61.1
54.9
52.5
50.0
0201009998
Water 106 m3
146.
3
138.
6
125.
0
119.
4
94.9
0201009998
Production 106 tonnes
22.4
22.9
23.0
23.7
22.1
0201009998
Non-hazardous waste 103 tonnes
331.
9
297.
7
276.
3
266.
6
218.
8
0201009998
Energy 106 GJ
57.6
54.9
52.2
51.8
47.5
0201009998
Hazardous waste 103 tonnes
14.7
14.0
11.5
11.7
9.4
12.2
Contaminated soil from one site
0201009998
See next page for CO2 from energy chart.

Enviro
nm
ental p
erform
ance Environm
ental impact
Unilever Environmental Performance Report 15
Number of Number of Number of Total cost ofsites in Unilever sites reporting fines fines (€)
1998 495 473 16 44,020
1999 449 449 2 4,860
2000 435 435 8 45,814
2001 472 464 9 19,222
2002 409 408 2 1,939
Environmental prosecutions and fines
This is a summary of penalties incurred for infringementof environmental regulations. The prosecutions and finescover our manufacturing sites (401) and our corporatehead offices and research laboratories (eight). Thenumber of manufacturing sites in Unilever is constantly
changing because of acquisitions, disposals and closures.The two fines in 2002 were due to exceeding regulatorylimits for liquid effluent at one manufacturing site. Ouraim is to reach 100% compliance.
Boiler / Utilities SOx 103 tonnes
12.1
10.3
9.5
8.1
6.4
0201009998 020100
Ozone depleting potential tonnes
3.6
3.6
3.0
CO2 from energy 106 tonnes
4.9
4.8
4.6 4.7
4.3
0201009998

Data parameters
Seven key environmental performance parameters are used by ourmanufacturing operations for reporting emissions and setting futurereduction targets.
Total COD (Chemical Oxygen Demand, tonnes) COD represents the ingredients andproduct lost from our manufacturingprocesses, and mainly arises duringcleaning operations. COD is widelyused by regulatory bodies to controlindustrial wastewaters, and to calculatethe correct level of charges fordownstream municipal wastewatertreatment, which is designed toremove most of the COD before thewastewater is discharged to theenvironment. The Unilever COD datarepresent the load discharged from the factory. The data do not make anyallowance for the fact that based onindividual site data we estimate afurther 87.5% of this material isremoved in municipal wastewatertreatment plants. Consequently theCOD load which actually reaches theenvironment is much lower.
Total water consumption (m3)Water consumption is also widely used as a measure of manufacturingperformance. It is measured in allUnilever’s factories. The Unilever datarepresent all water consumed andinclude water used as an ingredient inproducts as well as uncontaminatednon-contact cooling water andwastewater.
Total hazardous and non-hazardouswaste (tonnes) (Reported separately) In terms of potential impact on theenvironment, it is important todistinguish between hazardous andnon-hazardous waste. Since there is no common international wasteclassification, the Unilever data are based on the national legal definitionsapplicable for each site, and are simplythe total mass of material disposed offrom the site under each classification.We report recycling data separately in the waste and effluent section ofour website.
Total energy consumption (GJ or 109 Joules) and CO2 from energy use (tonnes)Energy consumption per tonne ofproduct is widely used as amanufacturing performance indicator.Since 1999 we have focused on globalwarming potential (in tonnes CO2) andthis is why our targets are expressed interms of CO2 from energy as well asenergy consumption. The globalwarming potential has been calculatedfrom the source energy data usinginternationally accepted conversionfactors derived from theIntergovernmental Panel on ClimateChange (IPCC) and the InternationalEnergy Agency (IEA).
Boiler / Utilities SOx (tonnes)This air emission parameter is relevantto most sites since almost all have aboiler used for generating steam. Insome cases diesel generators are alsoused onsite for electricity generation.The Unilever data are calculated fromthe total mass of fuel consumed, andits sulphur content, and are expressedin terms of a mass of sulphur dioxide(SO2). Emissions of SOx contribute toacid rain potential.
Data p
arameters
Unilever Environmental Performance Report 16

Scope and quality of our data
ScopeIn 2002, 400 manufacturing sitesreported environmental performancedata. These were located in 76 different countries. There were 20 new sites reporting. Eighty-oneexisting sites were sold or closed andmost of these did not report. One site(Trituraf in Côte d’Ivoire) did not reportowing to civil war.
We also collect data from ourcorporate head offices and researchlaboratories (eight sites) onenvironmental prosecutions and fines (none in 2002).
We do not collect data from third partycompanies that manufacture or packour products.
QualityWe continually improve the collectionand reporting of environmentalperformance data via a globalelectronic system.
Highlights for 2002:
● 99.8% of sites reportedenvironmental data
● 99% of sites reported on all keyenvironmental parameters, apartfrom COD
● 93.5% of sites reported COD data
● Improved guidance and training wasgiven to the Business Groups forvalidating and reportingenvironmental performance data
● Additional reports providingfeedback on their performance wereavailable to the business through thefurther development of the web-based reporting tool.
Scop
e and
qu
ality of o
ur d
ata
Unilever Environmental Performance Report 17

Progress against targets
Our overall performance generally has been good in improving our eco-efficiency. But setting and achieving targets at site level can bedifficult because of the dynamic nature of our business.
For example, about 100 new sites were added after themerger with Bestfoods in 2001 and 45 DiverseyLever siteswere divested in 2002. Often there are also significantchanges in the mix of products made at our manufacturingsites. This makes target setting difficult, particularly fornew sites. We have developed training programmes tofurther integrate environmental target setting into theoverall planning for the sites and Business Groups.
See the notes under the individual charts on the previous pages for the reasons why we did not meetparticular targets.
The following three tables summarise our progress againstour environmental targets in manufacturing, innovationand sustainable resource use.
Prog
ress again
st targets
Unilever Environmental Performance Report 18
Target Performance Target reduction 2002 % Actual reduction 2002 %
COD Not met 10.71 0.77
Hazardous waste Not met 8.60 –10.60 (15.17)*
Non-hazardous waste Target met 7.02 12.26
Water Target met 4.34 15.00
Energy Not met 2.38 1.83
CO2 from energy Target met 1.66 1.72
Boiler / Utilities SOx Target met 9.68 14.96
*Figure in brackets excludes one-off disposal of contaminated soil. The minus figure denotes an increase (see page 12 for hazardous waste chart).
Eco-efficiency in manufacturing
Eco-efficiency in innovation
Target
To incorporate eco-efficiency inproduct design by extending theapplication of life cycle assessmentand developing new tools for use byproduct designers.
Performance
On track.
Comments
We are using environmental checklistsand guidance to design a number ofproducts. New tools are beingdeveloped to make life cycleassessments more accessible toproduct developers.
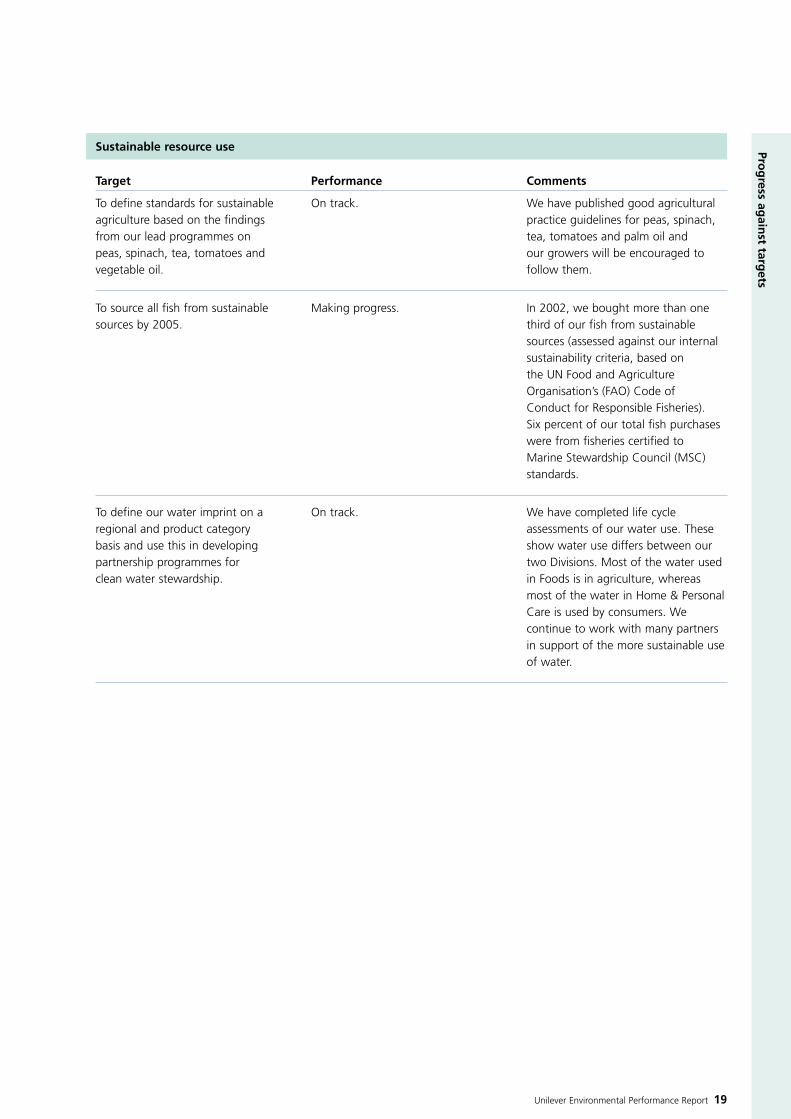
To source all fish from sustainablesources by 2005.
Making progress. In 2002, we bought more than one third of our fish from sustainablesources (assessed against our internalsustainability criteria, based on the UN Food and AgricultureOrganisation’s (FAO) Code of Conduct for Responsible Fisheries). Six percent of our total fish purchaseswere from fisheries certified to Marine Stewardship Council (MSC)standards.
Prog
ress again
st targets
Unilever Environmental Performance Report 19
To define our water imprint on aregional and product category basis and use this in developing partnership programmes for clean water stewardship.
On track. We have completed life cycleassessments of our water use. Theseshow water use differs between ourtwo Divisions. Most of the water usedin Foods is in agriculture, whereasmost of the water in Home & PersonalCare is used by consumers. Wecontinue to work with many partnersin support of the more sustainable useof water.
Sustainable resource use
Target
To define standards for sustainableagriculture based on the findings from our lead programmes on peas, spinach, tea, tomatoes andvegetable oil.
Performance
On track.
Comments
We have published good agriculturalpractice guidelines for peas, spinach,tea, tomatoes and palm oil and our growers will be encouraged tofollow them.

Section
head
ing
s
Unilever Environmental Performance Report 20
Verifier’s statementV
erifier’s statemen
t
Verification Objectives and ScopeURS Verification Ltd (URSVL) wascommissioned by Unilever to providean independent verification of selectedenvironmental data and related claimspresented on the Unilever website,www.unilever.com under theEnvironment & Society section. URSVL has undertaken this verificationexercise for Unilever for the third year of a three year programme,considering environmentalperformance data from each ofUnilever’s Business Groups.
Key objectives of the verificationincluded the review of:
● implementation and communicationof environmental strategies;
● the effectiveness of data collectionsystems;
● the accuracy of environmentalperformance data at a sample ofsites; and
● environmental aspects of Unilever’ssustainable fish initiative.
As a result of these verificationactivities, URSVL has provided opinionson the accuracy and completeness of:
● Unilever’s EnvironmentalPerformance Report 2003 (Report onprogress and 2002 data); and
● Selected environmental data andrelated claims present on Unilever’sweb site (“Environment & Society”section) as of July 2003.
For the purposes of this statement theabove sources are hereafter referred toas Unilever’s EnvironmentalPerformance Report 2003. URSVL hasalso made suggestions forimprovements to Unilever’senvironmental programme andassociated reporting.
Responsibilities of Directors and Verifiers The information contained in theEnvironmental Performance Report2003 is the sole responsibility of theDirectors of Unilever. This verificationstatement represents the independentopinion of URSVL. URSVL was notinvolved in the preparation of anymaterial included in this report or onUnilever’s website.
Verification MethodThe approach followed by URSVL isaligned to International AccreditationForum IAF Guide 66, Guidance toGuide 66-EA-7/02 and EN 45012.These are international frameworksoutlining the general requirements for bodies operating independentassessment and certification/registration of environmentalmanagement systems. URSVLenvironmental auditors conducted theverification process following thegeneral principles of environmentalauditing and audit procedures ascontained within the internationalstandards, ISO 19011. We have alsoaligned our approach to certainrequirements of the Global ReportingInitiative (GRI) and AA1000.
We established a three year samplingstrategy in 2001, which has beenrefined each year through discussionwith corporate personnel and thefindings from our previous verificationworks. This year quantitative data fromtwelve sites (7.9% of global productiontonnage) and information onenvironmental management systemsfrom a further seven sites was verified.The sample was selected based on acombination of business representation,regional representation, high energyand water users, and high productionvolume. The sample this year includedsites from four Business Groups: HPCNorth America, Foods Latin America,Foods Asia and HPC Europe. We alsoverified environmental informationrelated to Unilever’s sustainable fish initiative.
Our initial focus was on the assessmentof Unilever’s environmental programme,management systems and datacollection systems. On the basis of thisinvestigation and our findings wereviewed the 2003 Environment Reportto determine the accuracy andcompleteness of the informationpresented in the document.
Opinion
Environmental ProgrammeUnilever has continued to develop andprogress its environmental programme.Achievements of specific note during2002 include the further developmentof a new Environmental Strategy forUnilever, based on a critical review ofprevious performance against businessobjectives, with areas for improvementsidentified as a key focus for action.URSVL particularly commends theobjective to apply Unilever’s skills in eco-efficiency throughout the supply chain.
URSVL also notes the commitment tosustainable fisheries made by Unilever,and would encourage Unilever tocontinue to work with the value chainto help broader adoption ofsustainable fishing practices.
CompletenessURSVL considers that the report textand data relating to environmentalperformance and managementaddresses the significant environmentalaspects of the business and these havebeen reported in a fair and balancedmanner. We also welcome the trendtowards greater transparency asdemonstrated by Unilever in theirwillingness to report openly on themercury contamination incident inKodaikanal, India.
We commend Unilever’s initiative incommissioning an opinion leadersurvey which was carried out in 2002.We note that the process of evaluation of stakeholder opinion is emerging and the link to reporting is yet to beclearly established.

Unilever Environmental Performance Report 21
Verifier’s statem
ent
We also note that Unilever continuesto fully report on prosecutions andfines but a more systematic coverageof incidents would lead to greatertransparency.
AccuracyThe environmental performancereporting system is effective, generatingdata which is generally accurate andreliable. The system is well embeddedin most business processes, leading toadditional benefits in environmentalmanagement at some of the samplesites. This is particularly apparent inthose Business Groups which havereceived data management training.
Overall data accuracy continues toimprove and URSVL welcomes themeasures that Unilever hasimplemented following the 2002report verification recommendations,which have further improved thevalidation of data at site and businessgroup level.
However, there continue to be minorinefficiencies in the systems orprocesses used for the collection and
management of data at a number ofthe sample sites. We noted someminor errors in calculation and oneerror which was material at a site leveland has been subsequently resolvedwith the revised figure used in the report.
Suggestions for Improvements inUnilever’s EnvironmentalProgramme
● Guidance and training has led to ademonstrable improvement in datamanagement and should be activelyencouraged, particularly with sitesnew to the environmentalprogramme; and
● Unilever should consider how best to feedback to stakeholders theresults of engagement processes.
Suggestions to Improve FutureReporting
● Unilever should consider thereporting of incidents in addition to the report of prosecutions andfines to conform with emerging best practice;
● The new Unilever EnvironmentalStrategy, which includes theobjective to apply their eco-manufacturing skills across the wider supply chain, will requireconsideration of additionalperformance indicators across allstrategy objectives to monitor success.
● A more disciplined approach toevaluating stakeholder opinionswould help Unilever be moreeffective in balancing bothstakeholder opinions and Unilever’sStrategic objectives.
David WestwoodDirectorFor and on behalf of URS Verification LtdLondon, July 2003
URSVL has carried out its services by checking samples of data, information and documents which have been made available to URSVL byUnilever. Accordingly, URSVL has not checked or reviewed all of Unilever’s data, information and documents. The verification statementprovided herein by URSVL is not intended to be used as advice or as the basis for any decisions, including, without limitation, financial orinvestment decisions.
URS Verification Ltd (URSVL) havecontinued their programme of verifyingour environmental performance on arolling three year basis covering eachof our global business areas during thistimescale. As the verifiers indicated,they have focused on our environmentalstrategy, management systems anddata collection programme and it isgratifying to see an acknowledgementof the continuing progress we havemade in these areas.
URSVL conclude that the report textand data relating to environmentalperformance and managementaddresses the significant environmental
aspects of the business and that thesehave been reported in a fair andbalanced manner. In addition URSVLhave welcomed our new EnvironmentalStrategy and the trend towards greatertransparency shown in our reporting.They have identified areas where wecan improve and we will take this onboard in our programme for 2003/2004.
With regard to the verifier’s suggestionsfor our environmental programme and future reporting, these will betaken into account in our ongoingwork programme.
● We will continue to maintain ourperformance in data validation and
focus our training activities on newsites through using existing processesand tools
● We will look for opportunities toimprove our process for stakeholderengagement and how this inputsinto our reporting process
● We will continue to review ourapproach to incident reporting in linewith good practice
● As part of our new EnvironmentStrategy we will identify appropriateperformance indicators to monitorsuccessful implementation.
Unilever's response to verifier’s statement

U
Further details about our environmentalactivities are available on theEnvironment & Society section of ourwebsite www.unilever.com
For more information pleasecontact:Helen KeepCorporate Relations DepartmentUnilever PLCUnilever HouseBlackfriarsLondon EC4P 4BQUK
Tel: +44 (0)20 7822 6378E-mail: [email protected]
Writing & consultancy: Context
Design: Red Letter Design


![Sunsilk 3Dot Occidental Font Cascade[1]](https://img.pdfslide.us/doc/110x75/55cf94c3550346f57ba439e7/sunsilk-3dot-occidental-font-cascade1.jpg)