Embed Size (px)
Citation preview
EPA 903-R-00-016CBP/TRS 248/00
July 1999Reprinted June 2001
Environmental Outcome-Based Management:Using Environmental Goals and Measures
in the Chesapeake Bay Program
Chesapeake Bay ProgramA Watershed Partnership

i
New York
Virginia
Maryland
Pennsylvania
D.C.West Virginia Delaware
For more information about the Chesapeake Bay Program, call 1-800-YOURBAY,or visit the Bay Program web-site at www.chesapeakebay.net
Recycled/Recyclable - Printed on Recycled Paper 30% Post Consumer
FORWARD
The Chesapeake Bay Program is the unique regional partnership of federal, state and local govern-ment agencies which has been leading the restoration of the Chesapeake Bay since the signing of thefirst Chesapeake Bay Agreement in 1983. The Bay is one of the most carefully monitored bodies ofwater in the world, and a considerable amount of information on environmental conditions has beencollected. Over the past decade, the U. S. Environmental Protection Agency (EPA) and its Chesa-peake Bay Program partners have maintained a systematic approach for the use of this informationto inform the public about the state of the Bay, to establish measurable restoration goals, and toinform many other program management decisions. EPA believes that much of the progress of thisrestoration program can be attributed to its partnership approach and the participants’ willingness toset bold, long-term environmental goals and to use environmental and other outcome measures tomonitor results and inform the public. Lessons learned from this program may be of particularinterest to other natural resource agencies and to any governmental entity with interest in outcome-based management.
This document has been a collaborative effort of managers and staff of the EPA Region 3 Chesa-peake Bay Program Office.

TABLE OF CONTENTS
Page
FORWARD............................................................................................................................................i
TABLE OF CONTENTS.......................................................................................................................ii
INTRODUCTION..................................................................................................................................1
1. ESTABLISHING ENVIRONMENTAL OUTCOME-BASED MANAGEMENT...................5
• Monitoring Program......................................................................................................5• Development of Environmental Outcome Measures.....................................................5• Challenges Faced...........................................................................................................7
2. CHESAPEAKE BAY PROGRAM ENVIRONMENTAL INDICATORS...............................9
• Environmental Indicator Framework.............................................................................9• Review and Development of Indicators.........................................................................10• Indicator Products..........................................................................................................11• Requests and Feedback.................................................................................................12
3. MANAGING FOR ENVIRONMENTAL RESULTS...............................................................15
• Program Planning and Assessment...............................................................................15• Targeting Resources....................................................................................................15• Environmental Impacts of Results-Based Management..................................................16• Continuing Challenges................................................................................................16
FUTURE DIRECTIONS.........................................................................................................................19
APPENDICES:A. CBP Organizational StructureB. CBP Measurable Environmental CommitmentsC. CBP Environmental Indicators: Categorization FrameworkD. CBP Environmental Indicators: Development and Approval Process
ii
Chesapeake Bay ProgramA Watershed Partnership

1
Chair ofChesapeake
BayCommission
Mayor of DC
Governor of PAGovernor of VAGovernor of MD
EPA Administrator Executive Council
★ ★★
The Chesapeake Bay Program Partnership
INTRODUCTION
The Chesapeake Bay Programis the premier watershed resto-ration effort currentlyunderway in the United States.It proceeds from a congression-ally-funded $27 million,five-year study undertaken inthe mid 1970s, when scientistsbegan to observe the loss ofliving resources and the publicbecame concerned aboutenvironmental degradation ingeneral. The study identifiedthe main source of the Bay’sdegradation as an oversupply ofnutrients entering the Bay, andadvocated programs that wouldlimit nutrient loadings frompoint sources like wastewatertreatment plants and nonpointsources like fertilizer runningoff farmland. The historicChesapeake Bay Agreement of1983, signed by the governorsof Maryland, Pennsylvania andVirginia, the mayor of theDistrict of Columbia, theadministrator of the Environ-mental Protection Agency(EPA) for the United Statesgovernment and the chair of theChesapeake Bay Commission,representing the state legisla-tures of the three states, calledfor all jurisdictions and agen-cies to focus their existingpollution control programs onreducing nutrient loads to theBay. Subsequent agreementsand amendments in 1987 and1992 reflected a strong ecosys-tem management approachstressing the interdependent
relationships between livingresources and their environ-ment, and includedcommitments to a set of spe-cific and far-reaching goals tiedto the restoration of the healthof the Bay. The latest agree-ment, called Chesapeake 2000,is the most comprehensive andfar-reaching agreement in theBay Program’s history. Mostcommitments in the newagreement are scheduled forcompletion by 2010.
The Bay Program is a volun-tary, consensus-based effortfocused on an interstate water-shed, and built on top of thenational and state level environ-mental regulatory programs.The Bay Program carries out itswork through a series of com-mittees, advisory committeesand subcommittees whichguide and advise the programin all aspects of Bay restorationactivities (see Appendix A).
The chief governing board ofthe program, the ChesapeakeExecutive Council, is com-prised of the Bay Agreementsignatories and meets annually.EPA represents all federalagencies, and currently, thereare 22 agencies and depart-ments participating as BayProgram partners. Formaladvisory committees for citi-zens, the scientific community,and local governments serve assounding boards for programpolicy and report to the Execu-tive Council at the annualmeeting. A policy level Princi-pals’ Staff Committee, whichincludes the chief environmen-tal and policy representatives ofthe governors, mayor and BayCommission, and the EPARegional Administrator, meetseveral times a year. Ongoingmanagement of the program isby the Implementation Com-mittee which meets every sixweeks and includes representa-

Growth of MeasurableEnvironmental Goals
tives of Bay Agreement signa-tories, federal agencies, andchairs of subcommittees andadvisory committees. Theadvisory committees, theFederal Agencies Committee,the subcommittees andworkgroups meet regularly andplay important roles in programdevelopment and implementa-tion. Because the solutions tothe Bay’s problems require theactive involvement and, to agreat extent, behavioralchanges on the part of industry,governments and the public,widespread understanding ofBay problems and their causesis very important.
EPA’s Chesapeake Bay Pro-gram Office was established in1984 to coordinate the activi-ties, investigations, andplanning of the signatoryjurisdictions and the othercooperating federal agencies.The Bay Program Officemanages federal funds (ap-proximately $19 millionannually), which are distributedpredominantly to states forimplementation of Bay restora-tion activities and to others forcontinuing scientific assess-ments. The Bay ProgramOffice maintains the core datacenter and facilities for scien-tific study, computer modelingand program implementation,and coordinates and supportsthe extensive committee struc-ture reporting to the ExecutiveCouncil.
EnvironmentalOutcome-BasedManagement
The availability and use ofenvironmental outcome infor-mation has had a profoundeffect on the operation of theChesapeake Bay Program. This“managing for results” ap-proach has brought with it newmodes of decision making andnew standards for accountabil-ity and responsibility,particularly to the public. Thedevelopment of environmentalindicators/outcome measureshas enabled the Bay Program tocommunicate a clear andconsistent public message,accelerated goal setting, sharp-ened the program’s ability togarner and target resources, andimproved the program’s abilityto regularly evaluate its man-agement strategies.
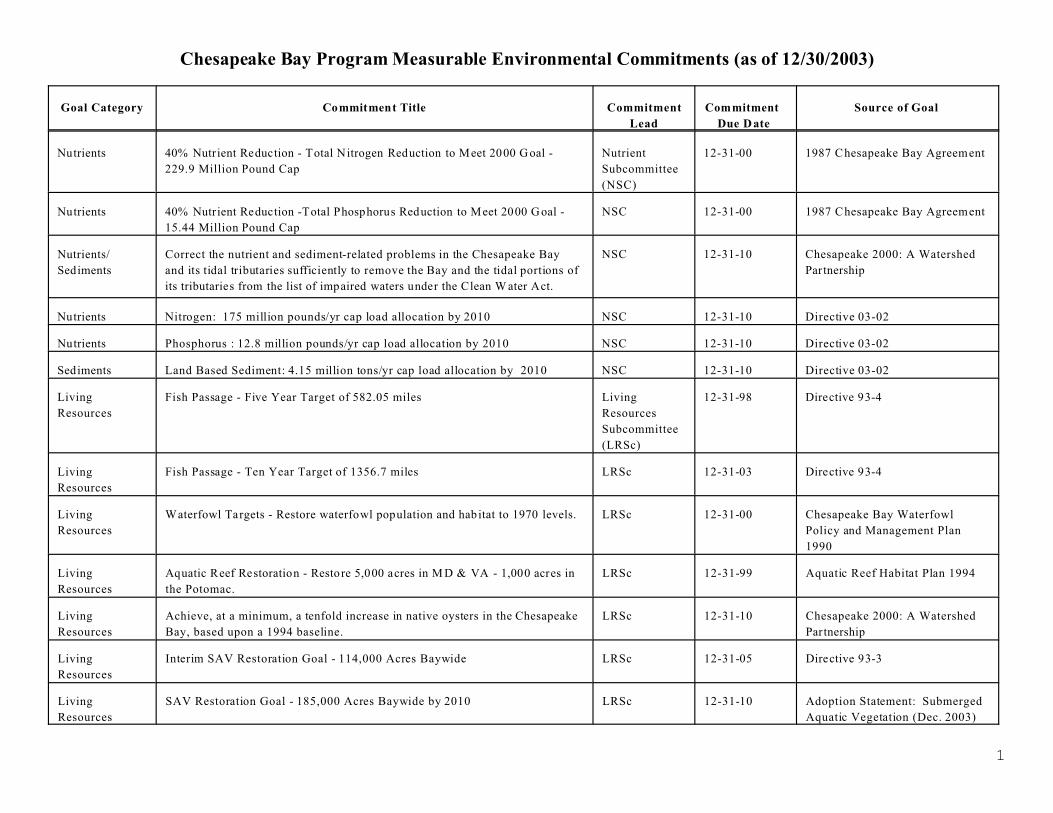
Environmental indicators/outcome measures have sup-ported goal setting for the BayProgram both in longer-termStrategic Implementation Plansand for annual planning andbudgeting. Improvements indata collection and analyses tosupport indicators enableparticipants to set measurablegoals and commitments with aclear baseline established. TheBay Program has over 40measurable goals in place atthis time and several moreunder active development (seeAppendix B).
Value of Goal-Setting
The program can point to alandmark goal adopted in 1987for a 40% reduction in nutrientloading by the year 2000 as thehighly successful prototype formany subsequent goals. It wasthe origin for an outcome-basedmanagement ethic which hasgrown stronger over the years.This single goal, adopted by thechief executives of the programthrough a voluntary agreement,has succeeded in leveragingseveral hundreds of milliondollars in programs and privateinitiatives to reduce point andnonpoint source nutrients to theBay and its rivers. This goalhas been remarkably effectivein promoting governmentalaccountability and performanceto meet the objective.
The development and formaladoption of a large number ofnew goals has occurred sincethis landmark goal was adoptedand since the indicator programwas initiated in 1991. Severalimportant new goals wereadopted in the Chesapeake2000 agreement, including the
2
87 88 89 90 92 93 94 96 20000
5
10
15
20
25
30
35
40
45
Cum
ulat
ive
# of
Goa
ls

3
EPA Bay Program Budget(fiscal year)
primary goal to improve waterquality sufficiently to sustainthe living resources of the Bayand its tidal tributaries, by2010, and to maintain thatwater quality into the future.This will mean setting in-creased nutrient reduction goalsand for the first time settingsediment reduction goalsBaywide.
Experience has shown thatgrowing public support of andfinancial investment in the BayProgram have been associatedwith the development andcommunication of bottom-lineenvironmental results. Addi-tionally, Bay Program Officestaff believe that the increasedsupport given to the program inrecent years reflects the enthu-siasm for supporting effectivefederal-state-local voluntarypartnerships to address prob-lems. Unlike many other EPAprograms, the Bay Programdoes not have independentregulatory authorities, andstrong support by state andlocal governments and otherinstitutions is key to its success.Coincident with vigorousefforts to develop goals and
environmental indicators,federal funds appropriated forthe EPA Chesapeake BayProgram increased from ap-proximately $13 million in FY1991 to nearly $21 million inFY 1996 before leveling off tothe current level of roughly $19million. When matching fundsand other leveraging optionsare considered, total dollarsspent by all federal agencies,state and local governments andother entities is significantlyhigher than this total alone.Estimates are that approxi-mately $150 million are spenteach year by a combination ofthe EPA, other federal agen-cies, and the states.
1984
1985
1986
1987
1988
1989
1990
1991
1992
1993
1994
1995
1996
1997
1998
1999
2000
2001
0
5
10
15
20
25
CB
P B
ud
get
(m
illio
ns
of
do
llars
)

CHAPTER 1 ESTABLISHING ENVIRONMENTAL OUTCOME-BASED MANAGEMENT
• Characterize existing conditions• Detect changes or trends in water quality• Understand processes and linkages between water
quality and living resources
Chesapeake Bay Monitoring Program
Applications:• Evaluate water quality management programs• Calibrate and verify water quality models• Characterize SAV habitat requirements• Support development of living resource habitat goals• Establish a baseline for environmental assessments• Stimulate research projects on hypoxia, phytoplankton,
and fish recruitment
Objectives:
Monitoring Stations
5
Monitoring Program
The Chesapeake Bay is one ofthe most carefully monitoredbodies of water in the world.Because concern for the Baydates back to the 1970s, andimplementation of restorationefforts has been going on forover a decade, there is a consid-erable body of scientificinformation and data on envi-ronmental conditions in theBay. Consistent and compa-rable data on all traditionalwater parameters have beentaken at over 130 sites in thewatershed and the open Baysince 1984. The data and trendanalyses available from thismonitoring program are someof the best in America. Amajor strength of the Chesa-peake Bay Program’smonitoring program, andoutcome-based managementapproach, is that it does not relysolely on EPA generated data,but leverages and accessesmany other reliable informationsources maintained by cooper-ating state and federal agencies(Maryland, Pennsylvania,Virginia and District of Colum-bia environmental agencies, U.S. Geological Survey, NationalOceanic and AtmosphericAdministration, U. S. ArmyCorps of Engineers, U. S. Fishand Wildlife Service, U. S.Forest Service). This greatlyextends the ability to report on
the major aspects of the ecosys-tem and fill any gaps inknowledge.
Initially, these environmentaldata were collected and ana-lyzed to define the condition ofthe water quality and livingresources, and to better under-stand the nature of the Bay’sproblems. These data were alsoused in the development of awatershed model to fosterunderstanding of Bay waterquality processes and thesensitivity of such processes toexternal nutrient loading,determined to be the maincause of the Bay’s degradation.From this model, in 1987, BayProgram participants set thecore program goal of a 40percent nutrient reduction bythe year 2000. Subsequentmonitoring data have been usedto validate this early model andto construct other simulation
models used to assess theeffectiveness of differentpollution control strategies.The monitoring data wereotherwise used to developscientific theories and strategiesfor the restoration of the Bay.Because these data serve as thefoundation of its efforts, BayProgram staff have put specialemphasis on establishingquality control and qualityassurance for all aspects of themonitoring programs in the Bayarea.
Development ofEnvironmental OutcomeMeasures
Although the environmentaldata were critical to programdevelopment, prior to 1991they were not used systemati-cally to inform Bay Programpartners and the public of theBay’s condition, environmental

CHESAPEAKE BAY PROGRAM • ENVIRONMENTAL INDICATORS
TRACK 2: LIVING RESOURCE INDICATOR
Striped Bass Spawning Stock
Source: Rugolo, et. al., 1994.Summary Report to the Striped Bass Management Board, Atlantic States Marine Fisheries Commission.
Baywide Female Spawning Stock Biomass
GOAL: The goal for a recovered fishery is a spawning stock biomass (SSB) equal to the average SSBs recorded during 1960 through 1972.
STATUS: Successful management measures led to decreased harvest pressure. The Atlantic States Marine Fisheries Commission has declared the stock restored as ofJanuary 1, 1995.
1960 65 70 75 80 85 90 950
10
20
30
40
50
60
70
80
SS
B in
dex
: F
emal
es a
ges
4-1
5 yr
s
Restoration Goal
Fishing moratoria:MD & DE: 1985-1990
VA: 1989-1990
98
The briefing slides include the goal which the indicator tracksand a succinct summary of the status conveyed by theinformation presented.
6
problems and progress beingmade in the restoration. Envi-ronmental monitoring data andtrends were presented to thepublic in the triennial “State ofthe Bay” reports, but the fre-quency and presentation werenot geared to a very eager andinterested public audience.Prior to 1995, these triennialreports focused almost exclu-sively on the water quality ofthe Bay, and much less atten-tion was devoted to describingthe health and abundance of theliving resources, which havebeen the primary public con-cern. By failing to morefrequently advise the public ofthe relative importance ofenvironmental problems affect-ing the Bay, the program waslosing an opportunity to dispelsome of the misinformationsurrounding the source of theBay’s problems. For example,in response to informationdistributed by environmentaladvocacy groups in the region,many citizens believed thattoxic emissions from largeindustrial sources were the keyproblem in the Bay area, whenin fact, nutrient pollution fromagriculture and urban/suburbandevelopment is the primaryproblem.
Moreover, environmentaloutcome information was notused to make or justify man-agement decisions. Progresswas reported in terms of thenumber and timeliness ofstrategies, management plans,and other documents includedin the list of 1987 Bay Agree-
ment commitments, rather thanthe environmental resultsachieved. Although strong,long-term goals were includedin the 1987 Bay Agreement,few intermediate measures ofenvironmental progress wereused. Budget requests did notreflect past or desired programoutcomes and consequentlypresented a less compellingrationale for resources. Earlyin 1991, EPA leadership de-cided to make the programmore accountable to the publicon a day-to-day basis by defin-ing and communicating thebottom line environmentalresults achieved by the restora-tion program. Based on aseries of interviews with EPAstaff about primary successmeasures, the Bay ProgramOffice began to develop a set ofenvironmental indicators/outcome measures to supportgoal setting and to serve astargets and endpoints for the
restoration effort. This set wasdisplayed in a first version ofthe currently-used briefingpackage called EnvironmentalIndicators: Measuring OurProgress. A cross-disciplinaryEPA quality action team wasformed to brainstorm additionalsuccess measures and to discussavailable data bases and appro-priate interpretation of the data.
While EPA staff began thiseffort, states and other stake-holders became involved earlyon following a briefing to theBay Program’s ImplementationCommittee. The partners in theprogram soon embraced theenvironmental indicatorsapproach and it was decided torefine the initial structurethrough the Bay Programcommittee and workgroupstructure. Individual indicatorswere eventually assigned toappropriate Bay Programsubcommittees for review,
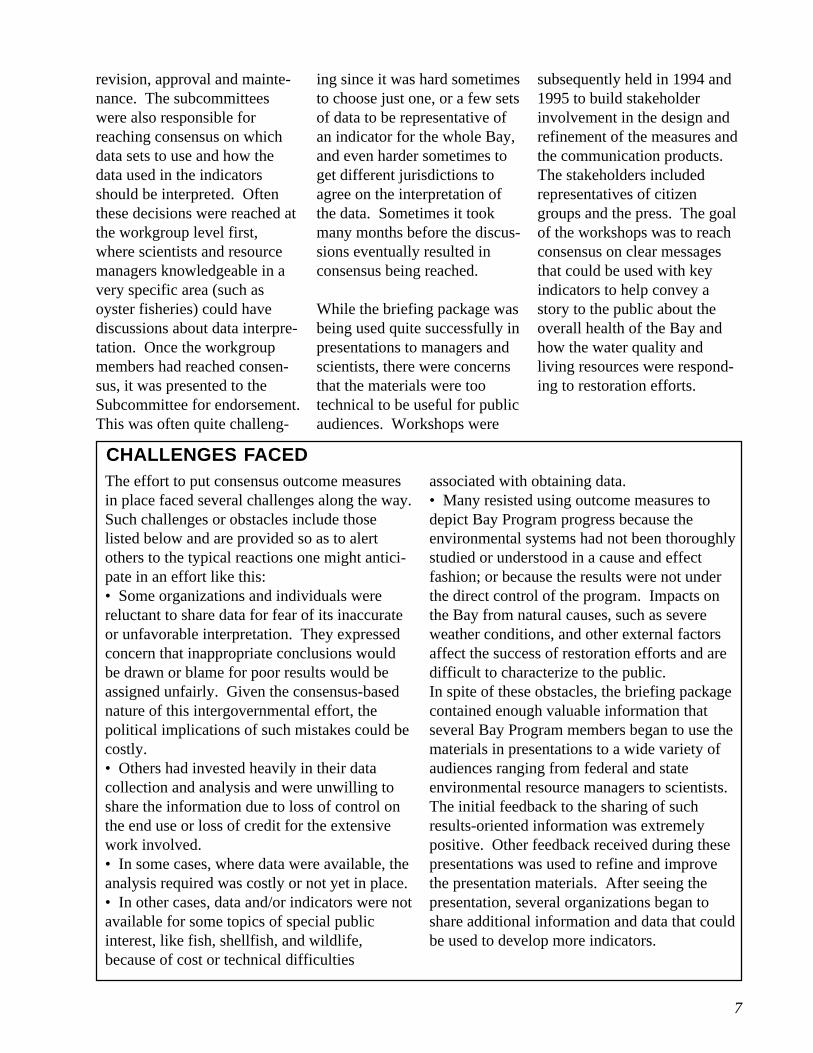
CHALLENGES FACEDThe effort to put consensus outcome measuresin place faced several challenges along the way.Such challenges or obstacles include thoselisted below and are provided so as to alertothers to the typical reactions one might antici-pate in an effort like this:• Some organizations and individuals werereluctant to share data for fear of its inaccurateor unfavorable interpretation. They expressedconcern that inappropriate conclusions wouldbe drawn or blame for poor results would beassigned unfairly. Given the consensus-basednature of this intergovernmental effort, thepolitical implications of such mistakes could becostly.• Others had invested heavily in their datacollection and analysis and were unwilling toshare the information due to loss of control onthe end use or loss of credit for the extensivework involved.• In some cases, where data were available, theanalysis required was costly or not yet in place.• In other cases, data and/or indicators were notavailable for some topics of special publicinterest, like fish, shellfish, and wildlife,because of cost or technical difficulties
associated with obtaining data.• Many resisted using outcome measures todepict Bay Program progress because theenvironmental systems had not been thoroughlystudied or understood in a cause and effectfashion; or because the results were not underthe direct control of the program. Impacts onthe Bay from natural causes, such as severeweather conditions, and other external factorsaffect the success of restoration efforts and aredifficult to characterize to the public.In spite of these obstacles, the briefing packagecontained enough valuable information thatseveral Bay Program members began to use thematerials in presentations to a wide variety ofaudiences ranging from federal and stateenvironmental resource managers to scientists.The initial feedback to the sharing of suchresults-oriented information was extremelypositive. Other feedback received during thesepresentations was used to refine and improvethe presentation materials. After seeing thepresentation, several organizations began toshare additional information and data that couldbe used to develop more indicators.
7
revision, approval and mainte-nance. The subcommitteeswere also responsible forreaching consensus on whichdata sets to use and how thedata used in the indicatorsshould be interpreted. Oftenthese decisions were reached atthe workgroup level first,where scientists and resourcemanagers knowledgeable in avery specific area (such asoyster fisheries) could havediscussions about data interpre-tation. Once the workgroupmembers had reached consen-sus, it was presented to theSubcommittee for endorsement.This was often quite challeng-
ing since it was hard sometimesto choose just one, or a few setsof data to be representative ofan indicator for the whole Bay,and even harder sometimes toget different jurisdictions toagree on the interpretation ofthe data. Sometimes it tookmany months before the discus-sions eventually resulted inconsensus being reached.
While the briefing package wasbeing used quite successfully inpresentations to managers andscientists, there were concernsthat the materials were tootechnical to be useful for publicaudiences. Workshops were
subsequently held in 1994 and1995 to build stakeholderinvolvement in the design andrefinement of the measures andthe communication products.The stakeholders includedrepresentatives of citizengroups and the press. The goalof the workshops was to reachconsensus on clear messagesthat could be used with keyindicators to help convey astory to the public about theoverall health of the Bay andhow the water quality andliving resources were respond-ing to restoration efforts.

CHAPTER 2CHESAPEAKE BAY PROGRAM ENVIRONMENTAL INDICATORS
Hierarchy of Indicators
Actions by EPA/State Regulatory Agencies
Responses of the Regulated
and NonregulatedCommunity
Changes in Discharge/Emission Quantities
Changes in Ambient Conditions
Changes in Uptake and/or Assimilation
LEVEL 1 LEVEL 2 LEVEL 3 LEVEL 4 LEVEL 5 LEVEL 6
TOTAL PHOSPHORUS
Changes in Health,
Ecology, or Other Effects
Administrative Environmental
This is how we measure environmental change
0
0.01
0.02
0.03
0.04
0.05
Tota
l Pho
spho
rus
(mg/
l)
Year85 86 87 88 89 90 91 92
= < 2 1/4 in= 2 1/4 - 4 3/4 in= > 4 3/4 in
BLUE CRAB
Source: EPA Office of Policy, Planning and Evaluation
9
EnvironmentalIndicator Framework
As commonly employed, anenvironmental indicator is adiscreet measure of one aspectof environmental quality thatcan be used alone or in combi-nation with other indicators todeliver a message or tell a storyrelated to the overall environ-mental health of an ecosystem.For example, indicators basedon ambient concentrations ofnitrogen and phosphorous in anestuary could be combined withan indicator based on totalacreage of submerged aquaticvegetation to tell a story aboutthe effects of water quality onBay living resources. Asadditional indicators are in-cluded, the message or storymay become more refined androbust.
The Bay Program’s environ-mental indicators are used forthis primary purpose of com-municating the health of theBay and its rivers to publicaudiences. But they also serveseveral other importancepurposes in tandem. Specifi-cally, the Bay Program’senvironmental indicators wereestablished for five principalpurposes:• To evaluate progress in theChesapeake Bay restorationeffort;
• To monitor environmentalcondition and environmentalresponse to restoration efforts;• To provide informationneeded to establish restorationgoals;• To regularly inform andinvolve the public in achievingthe restoration goals;• To make detailed informationand reference data for theseindicators available uponrequest so that others mayparticipate in the tracking ofprogress.
The measures are characterizedby their position in a hierarchyfrom level 1 through level 6,ranging from indicators used tomeasure administrative actions,such as issuing permits, tothose that are indirect or directmeasures of ecological orhuman health. Specifically, thesix levels include:
Level 1: Actions by EPA/StateRegulatory AgenciesLevel 2: Responses of theRegulated and Non-regulatedCommunityLevel 3: Changes inDischarge/Emission QuantitiesLevel 4: Changes in AmbientConditionsLevel 5: Changes in Uptakeand/or AssimilationLevel 6: Changes in Health,Ecology, or Other Effects
All information captured bythis continuum has value forstakeholders and policy makers.Although the indicators towardthe higher end of the continuum(levels 4 through 6) portray aclearer, more direct image ofthe environmental condition,indicators at the lower levels(levels 1 through 3) are neededto establish a link between theactions taken and effects

Levels 1-6 = Hierarchy of Indicators (actions to impacts)
Levels 1-6 = Hierarchy of Indicators (actions to impacts)
Tracks 1, 2, & 3 = Areas of FocusTracks 1, 2, & 3 = Areas of Focus
LIVINGRESOURCES
RESTORATION
LIVINGRESOURCES
RESTORATION
LIVINGRESOURCES
RESTORATION
LIVINGRESOURCES
RESTORATION
LIVINGRESOURCES
RESTORATION
TRACK 3Toxics
TRACK 3Toxics
TRACK 3Toxics
TRACK 3Toxics
TRACK 3Toxics
TRACK 2Living Resources
TRACK 2Living Resources
TRACK 2Living Resources
TRACK 2Living Resources
TRACK 2Living Resources
TRACK 1NutrientsTRACK 1NutrientsTRACK 1NutrientsTRACK 1NutrientsTRACK 1Nutrients
AMBIENT CONDITIONSAMBIENT CONDITIONSAMBIENT CONDITIONSAMBIENT CONDITIONSAMBIENT CONDITIONS
PROGRAM / ADMINISTRATIVE MEASURESPROGRAM / ADMINISTRATIVE MEASURESPROGRAM / ADMINISTRATIVE MEASURESPROGRAM / ADMINISTRATIVE MEASURESPROGRAM / ADMINISTRATIVE MEASURES
TRACK 4Cross-Cutting
TRACK 4Cross-Cutting
TRACK 4Cross-Cutting
TRACK 4Cross-Cutting
TRACK 4Cross-Cutting
How the Hierarchy and Tracks Work Together
10
observed. It is important tomaintain indicators along thecontinuum in order todemonstrate the linkagebetween actions by man andresponses in the natural system.
A basic tenet of the BayProgram’s indicators effort isthat outcome measures beclearly associated with strategicgoals for the program. The BayProgram has developed aframework for linkingenvironmental outcomemeasures to strategic programgoals, as articulated in the 1987Bay Agreement, and the threeprimary restoration objectives:reduction of nutrientenrichment effects, protectionand enhancement of livingresources, and reduction ofadverse toxic impacts. Eachindicator briefing slide isidentified with one of therestoration objectives (ortracks). Indicators withmultiple impacts are identifiedas cross-cutting. The briefingslides also include the goalwhich the indicator tracks and asuccinct summary of the statusconveyed by the informationpresented.
The three main tracks,nutrients, living resources andtoxics, converge on the sameobjective as you move up thehierarchy towards level 6indicators. For example, thenutrient track takes you frommanagement actions to nutrientloadings to nutrient levels andultimately to the health andabundance of Bay grasses and
other living resources. Theliving resources track takes youfrom habitat and harvest topopulation measures. Thetoxics track takes you fromreleases of chemicalcontaminants into theenvironment to concentrationsin the environment and inliving resources. The commonmeasures of greatestimportance for all of the tracksare the living resourceindicators.
Recently, Bay Program Officestaff have developed anadditional organizingframework that places BayProgram indicators into one orseveral categorizes. This effortwas initiated in order toaccount for the various waysthat the Bay Program, EPARegion III, and other EPAoffices and programs areorganizing indicators. Thecategories are described inAppendix C. All existingindicators, as well as thoseunder development, are
organized within thisframework and listed inAppendix C.
Review and Developmentof Indicators
At this time, the Bay Programuses over 90 indicators togauge the progress of thisrestoration effort. Forenvironmental indicators to beeffective in tracking the healthof the Chesapeake Bay, the datathat underlie them must beupdated frequently. The BayProgram Office EnvironmentalIndicators Coordinator, as wellas personnel from Bay Programsubcommittees andworkgroups, request data fromnumerous sources on a regularbasis. In addition to BayProgram monitoring data, awide range of data are obtainedfrom a host of federal and stateagencies and Bay areauniversities.
In addition to existingindicators, a large number of
CHESAPEAKE BAY PROGRAM • ENVIRONMENTAL INDICATORS
TRACK 2: LIVING RESOURCE INDICATOR
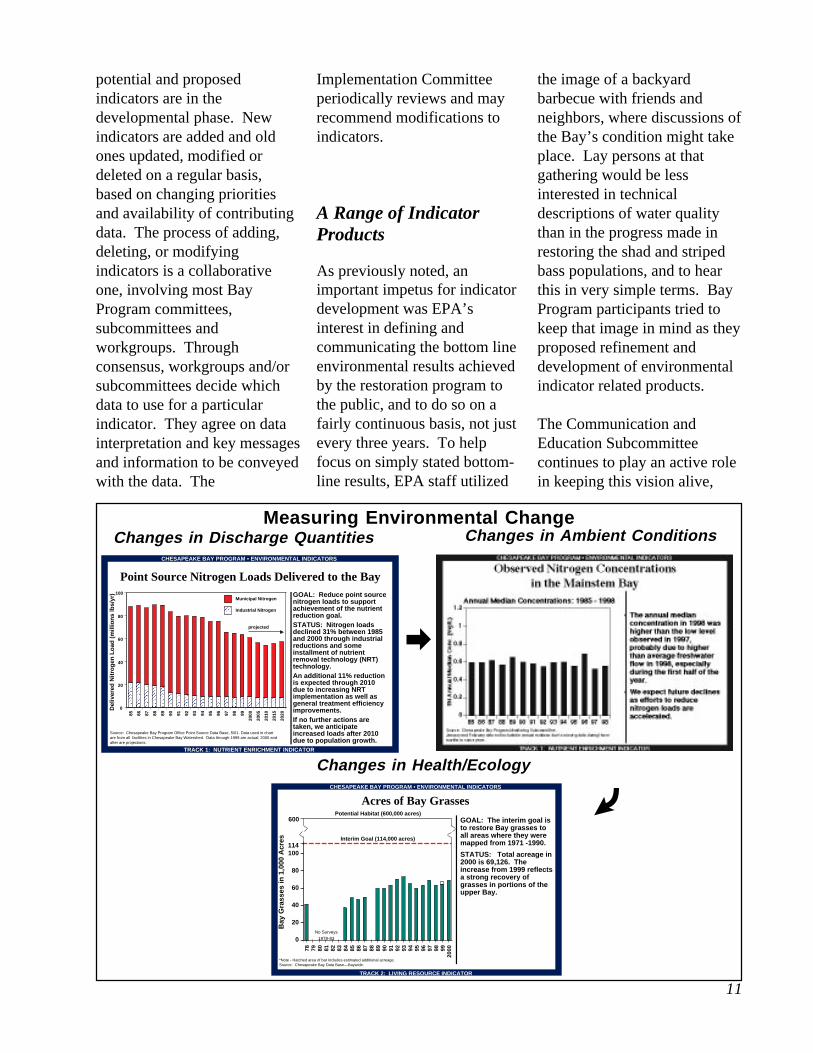
Acres of Bay Grasses
GOAL: The interim goal is to restore Bay grasses to all areas where they were mapped from 1971 -1990.
STATUS: Total acreage in 2000 is 69,126. The increase from 1999 reflects a strong recovery of grasses in portions of the upper Bay.
*Note - Hatched area of bar includes estimated additional acreage.Source: Chesapeake Bay Data Base—Baywide.
Interim Goal (114,000 acres)
600
78 79 80 81 82 83 84 85 86 87 88 89 90 91 92 93 94 95 96 97 98 9920
00
0
20
40
60
80
100
Bay
Gra
sses
in 1
,000
Acr
es
Potential Habitat (600,000 acres)
No Surveys
1979-83
114
Changes in Discharge Quantities Changes in Ambient Conditions
Changes in Health/Ecology
Measuring Environmental Change
O
@
CHESAPEAKE BAY PROGRAM • ENVIRONMENTAL INDICATORS
TRACK 1: NUTRIENT ENRICHMENT INDICATOR
Point Source Nitrogen Loads Delivered to the Bay
GOAL: Reduce point source nitrogen loads to support achievement of the nutrient reduction goal.STATUS: Nitrogen loads declined 31% between 1985 and 2000 through industrial reductions and some installment of nutrient removal technology (NRT) technology.An additional 11% reduction is expected through 2010 due to increasing NRT implementation as well as general treatment efficiency improvements.If no further actions are taken, we anticipate increased loads after 2010 due to population growth.
Source: Chesapeake Bay Program Office Point Source Data Base, 5/01. Data used in chart are from all facilities in Chesapeake Bay Watershed. Data through 1999 are actual; 2000 and after are projections.
85 86 87 88 89 90 91 92 93 94 95 96 97 98 99
2000
2005
2010
2015
2020
Del
iver
ed N
itro
gen
Lo
ad (
mill
ion
s lb
s/yr
)
Industrial Nitrogen
Municipal Nitrogen100
80
40
60
20
0
projected
11
potential and proposedindicators are in thedevelopmental phase. Newindicators are added and oldones updated, modified ordeleted on a regular basis,based on changing prioritiesand availability of contributingdata. The process of adding,deleting, or modifyingindicators is a collaborativeone, involving most BayProgram committees,subcommittees andworkgroups. Throughconsensus, workgroups and/orsubcommittees decide whichdata to use for a particularindicator. They agree on datainterpretation and key messagesand information to be conveyedwith the data. The
Implementation Committeeperiodically reviews and mayrecommend modifications toindicators.
A Range of IndicatorProducts
As previously noted, animportant impetus for indicatordevelopment was EPA’sinterest in defining andcommunicating the bottom lineenvironmental results achievedby the restoration program tothe public, and to do so on afairly continuous basis, not justevery three years. To helpfocus on simply stated bottom-line results, EPA staff utilized
the image of a backyardbarbecue with friends andneighbors, where discussions ofthe Bay’s condition might takeplace. Lay persons at thatgathering would be lessinterested in technicaldescriptions of water qualitythan in the progress made inrestoring the shad and stripedbass populations, and to hearthis in very simple terms. BayProgram participants tried tokeep that image in mind as theyproposed refinement anddevelopment of environmentalindicator related products.
The Communication andEducation Subcommitteecontinues to play an active rolein keeping this vision alive,

CHESAPEAKE BAY PROGRAM • ENVIRONMENTAL INDICATORS
TRACK 4: CROSS-CUTTING INDICATOR
Bernie Fowler's "Sneaker Index"
GOAL: Restore Bernie’s sneaker visibility to chest depth (57 to 63 inches).
STATUS: Wading in the Patuxent River at Broomes Island, MD, Bernie has seen improvements in water clarity since 1988. He says, "although this is not a scientific measure, it puts restoring the River on a human scale."
Source: Former MD State Senator C. Bernard Fowler
50’s
60’s 88 89 90 91 92 93 94 95 96 97 98 99
2000
2001
0
1
2
3
4
5
6
Vis
ibili
ty in
Fee
t
63"
57"
10"8"
16" 16"18"
28" 28"
40"
Goal
37"
44.5"
35.5"
41.5" 39.5"
31"
12
especially as it relates to usingenvironmental indicatorinformation in productsdeveloped to inform andeducate the public on Bayproblems, potential solutions,and progress, and to stimulatetheir involvement in therestoration. The Bernie FowlerSneaker Index (figure below) isan example of an indicator thathas popular support because itreinforces the importance ofcitizen involvement in therestoration, and demonstratesthat this can be done quitesimply. Although the index isnot strictly based on scientificdata, it highlights citizen effortsto keep track of local waterquality conditions and to beadvocates for water qualityimprovements.
The Environmental Indicators:Measuring Our Progressbriefing package has beenimproved and updated overtime and helps to reinforce aclear public message. A full setof speakers notes is availablefor consistent interpretation of
the data. The Communicationand Education Subcommitteedeveloped and continuouslyimproves a presentation usingkey environmental indicatorstitled The Chesapeake Bay:How is it Doing? Annualreports of restoration progress,including the popular fact sheetChesapeake 2000 and the Bay:Where Are We and Where areWe Going?, and the triennial“State of the Bay” reportsdemonstrate extensive uses ofthe environmental indicators.Press releases and fact sheetsreinforce a consistent publicmessage using the outcomemeasures. The Bay Programweb-site(www.chesapeakebay.net)includes all indicator relatedbriefing packages,presentations and fact sheets,and the materials may beviewed and downloadedby on-line users.
Requests and Feedback
In 1996, the Bay ProgramOffice began tracking requests
for environmental indicatorinformation and products madeby people outside of the office(many people within the officemake these requests frequentlyand continuously). In 1996,there were 41 requests forEnvironmental Indicators:Measuring Our Progress andThe Chesapeake Bay: How is itDoing? slide presentationmaterials and information. By1997, both of the slidepresentations and associatedmaterials were available on theweb-site. In 1997, there were89 requests for slidepresentation materials andinformation. In 1998, therewere 93 requests.
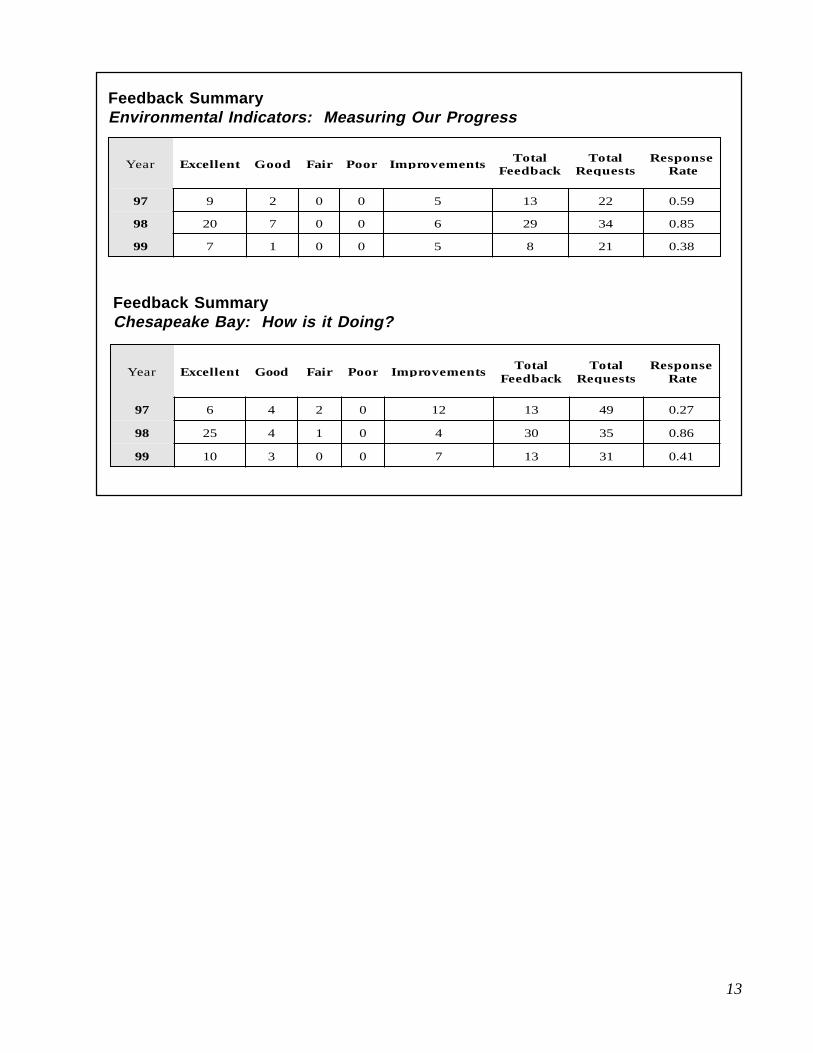
In 1997, the Bay Programbegan to solicit feedback bysending feedback forms withthe slide presentation materialsand including a feedback formwith the web-site materials.The results are summarized inthe tables below and continueto demonstrate the great valueof these products to ourcustomers. One part of theform asks for “suggestions forimprovement”. Mostsuggestions were implementedby making revisions orimprovements.
9
20
7
2
7
1
0
0
0
0
0
0
5
6
5
13
29
8
22
34
21
0.59
0.85
0.38
97
98
99
Excellent Good Fair Poor Improvements TotalFeedback
TotalRequests
Response RateYear
6
25
10
4
4
3
2
1
0
0
0
0
12
4
7
13
30
13
49
35
31
0.27
0.86
0.41
97
98
99
Excellent Good Fair Poor Improvements TotalFeedback
TotalRequests
Response RateYear
Feedback SummaryEnvironmental Indicators: Measuring Our Progress
Feedback SummaryChesapeake Bay: How is it Doing?
13

15
CHAPTER 3MANAGING FOR ENVIRONMENTAL RESULTS
Program Planning andAssessment
The use of environmental goalsand outcome measures inplanning and assessing programresults has had a remarkableeffect on the culture of the BayProgram Office and the broaderBay Program. Committeeoperations have been strength-ened because an outcomemeasure can be used to gaugeprogress for more than oneissue or concern. A focus onresults, rather than activitiesperformed, has encouragedprofessional creativity indeveloping solutions to Bayproblems. Necessary work todevelop shared definitions ofenvironmental measures resultsin greater inter-state consis-tency in goal setting andprogress measurement. Thisfacilitates clear communicationto the public. Finally, aspreviously noted, improve-ments in the environmentalindicators have facilitated goal-setting, thus better definingintended program outcomesand improving accountability tothe public.
Environmental indicators areused to develop and evaluatethe effectiveness of programstrategies. For example, toachieve the goal of 40 percentnutrient reduction by the year2000, Bay Program signatories
agreed in the 1992 amendmentsto develop and begin imple-mentation of tributary-specificstrategies. These strategiesrequire activities beyond thetraditional controls on pointsources, such as wastewatertreatment plants, and focus onimproved technologies. BayProgram participants are usinga set of environmental indica-tors, rather than counts ofoutputs like enforcementactions taken, to evaluate thesuccess of these tributarystrategies. In 2000, informationindicated that the phosphorusreduction goal was met on time.Achievement of the nitrogenreduction goal will run two orthree years late, primarily dueto construction schedules fortreatment plant improvements.As a result of the recentlysigned Chesapeake 2000agreement increased nutrient,and for the first time sediment,
reduction goals for 2010 will beset by the end of 2001. Thiswill require the development ofnew indicators that will be usedto track achievement of thesegoals.
Targeting Resources
The availability of acceptedenvironmental goals and indi-cators has allowed the BayProgram to better target itsresources. Within the BayProgram, screening criteria setby the Budget Steering Com-mittee for allocation of fundsgive great weight to proposalswhich most directly addresscommitments contained in theBay agreement. Achievementof measurable environmentalcommitments are one of theprincipal methods for subcom-mittees to demonstrate resourceneeds and program success.Projects from subcommittees
CHESAPEAKE BAY PROGRAM
CBP 12/12/00
Total Nutrient Loads Delivered to the Bayfrom "Potomac and North" Tributary Basins
GOAL: Reduce controllable loads of nutrients 40% by the year 2000 and maintain those reduced levels into the future.STATUS: In "Potomac and north" tributary basins , phosphorus loads declined 3.8 million lbs/yr between 1985 and 2000. We expect to reach the goal by 2000.Nitrogen loads declined 35 million lbs/yr. We expect to reach the goal through tributary strategy implementation, however, strategies will not be completely implemented by the end of 2000.
Source: Chesapeake Bay Program Phase 4.3 Watershed Model.Data include total nitrogen and phosphorus loads delivered to the Bay, from point and nonpoint sources, from "Potomac and north" tributary basins, from Chesapeake Bay Agreement jurisdictions (MD, PA, VA and DC) only.
Phosphorus Nitrogen
1985 2000Estimate
TributaryStrategy
0
50
100
150
200
250
300
350
Nit
rog
en L
oad
s (m
illio
ns
of
lbs/
yr)
Nitrogen Goal(for "Potomac and
north" basins)
1985 2000Estimate
TributaryStrategy
0
5
10
15
20
25
Ph
osp
ho
rus
Lo
ads
(mill
ion
s o
f lb
s/yr
)
Phosphorus Goal(for "Potomac and
north" basins)
"Potomac and north" tributary basins include: Susquehanna, Potomac, Patuxent, Western and Eastern Shore, MD.

16
CHESAPEAKE BAY PROGRAM • ENVIRONMENTAL INDICATORS
TRACK 2: LIVING RESOURCE INDICATOR
Stream Miles Opened to Migratory Fish
Source: EPA Chesapeake Bay Program Office.
GOAL: To restore access to historical spawning grounds for migratory fish.
STATUS: The removal of stream blockages and construction of fish passages in 2000 reopened 54 new miles of historic spawning habitat to migratory fish, and an additional 25.3 miles to resident fish. Total miles made available to migratory fish since 1988 is 816 with an additional 107 miles to resident fish.
89 90 91 92 93 94 95 96 97 98 99 20000
200
400
600
800
1000
1200
1400
Cu
mu
lati
ve M
iles
of
Riv
er H
abit
at O
pen
ed
Year 1998 goal (731 miles)
Year 2003 goal (1,357 miles)
Opened to Anadromous FishOpened, but not yet to Anadromous Fish
with non-measurable objectivesare at a decided disadvantageagainst outcome-orientedprojects in the contest forscarce financial resources. Thecosts for high quality data, anddata collection and analysis areconsiderable. About $2.2million per year of federalfunds supports the monitoringand data a analysis costs for air,water, living resources, andsubmerged aquatic vegetation.Approximately $400,000 peryear is devoted to operate thecomputer simulation models toexamine the potential results ofalternative strategies. Theseexpenditures support the devel-opment of bottom-lineenvironmental performancemeasures. Also, about$100,000 is used annually todevelop, update and maintainindicators and indicator prod-ucts.
Environmental Impactsof Results-BasedManagement
Environmental results-basedmanagement has impacted theBay Program in several waysprogrammatically. However,the benefits of environmentalresults-based management arenot just programmatic changes,but more importantly, measur-able environmentalimprovements. The environ-mental benefits gained throughgoal setting, indicator develop-ment and the targeting ofresources are illustrated in thefollowing example. In 1993,Bay Program partners voluntar-
ily committed to removingstream blockages and reopen-ing 1,357 miles of Baytributaries for migratory fish bythe year 2003. Resources havebeen targeted and progress isreported annually. As a result,hundreds of miles of historicspawning habitat have beenreopened, and even though theinterim goal was not attainedon time, it can be argued thatwithout the goal and indicator,resources would not have beentargeted for this purpose andvery few miles, if any, wouldhave been reopened. The long-term goal is projected to be meton time.
The Bay Program model ofmanaging for environmentalresults has been shared withother EPA offices and pro-grams, other federal agencyoffices, state and local govern-ment agencies, and nonprofitorganizations seeking to de-velop and implementenvironmental goals and indi-cator programs. The BayProgram was part of an EPA
and Office of Management andBudget case study and pilotproject, the results of whichwere used to implement Gov-ernment Performance andResults Act (GPRA) require-ments.
Continuing Challenges
While environmental indica-tors/outcome measuresrepresent a common currencyamong the different govern-ment agencies andorganizations involved in theBay Program, these entitiesmay draw different conclusionsas to the appropriate course ofaction to follow in response tothese indicators. For example,the supply of blue crabs hasdeclined over the past severalyears. While the participants inthe Bay Program agree that thisdecline has occurred, they attimes may disagree on thecause for this, its severity, andthe appropriate response. Tosome, placing limits on harvest-ing the crabs is necessary; toothers in jurisdictions that place

17
great economic and societalvalue on this industry, thatresponse is unacceptable.Nonetheless, the presence of akey indicator to track status andtrends for this vital resourcepromotes the timely discussionof viewpoints and potentialsolutions. Most importantly, itassists the public in monitoringthe data and the ultimate reso-lution.
Although the Bay Program hasbenefitted from the support ofnational and local leaders insetting measurable environmen-tal goals, political costs may besuffered by leaders and agencymanagement if these goals arenot met. Many federal govern-ment managers are reluctant toinclude annual performancegoals supported by outcomemeasures, because success inattaining such goals is affectedby factors beyond the control ofthe program managers and by
time lags. The amount of timeit takes to achieve measurableenvironmental improvementsfrom the time abatement orrestoration actions begin can beboth uncertain and lengthy.
The Chesapeake Bay Programhas emphasized the importanceof the 40 percent nutrientreduction goal, and, whilemany positive steps have beentaken to achieve this goal, theever-increasing pace of devel-opment in the watershed worksagainst the progress made.Increased public understandingof the complexity of ecosysteminteractions and the timerequired before actions yieldobservable results may lessenpolitical cost. Bay Programleadership will need to considerhow to keep public enthusiasmand confidence in the programif important goals are not metor met on time.
Mature Female Blue Crabs
• Mature female abundance is currently below the previous historical low set in 1968.
• Action needs to be taken to reduce fishing effort as a way to reduce fishing mortality.
Chesapeake Bay Program
68 72 76 80 84 88 92 96 2000-2
-1
0
1
2
Sp
awn
ing
Fem
ale
Ind
ex
Average
Blue Crabs Hanging On

15
FUTURE DIRECTIONS
The development of outcome measures willproceed in several promising directions to meetthe needs of program managers and the generalpublic and to keep the program in the forefrontof national ecosystem protection efforts. TheBay Program is placing high priority onlocalizing the measures, i.e., developing moreriver-specific or sub-watershed measures inaddition to Bay-wide average measures. Thepublic has shown a great interest in data whichdescribe the condition of local rivers and naturalresources and the program will enhance itsability to collect and display this information in away that is indexed geographically.
Another priority is the development of moresimplified or composite measures, such as anoverall index of Bay health, which will be basedon key environmental indicators and outcomemeasures. With a multitude of existingmeasures, this becomes an area of increasingneed in order to maintain a clear message for thepublic.
Key gaps in the indicators hierarchy andcontinuum will be need to be filled over time tocomplete the “cause and effect picture” for thewatershed. Bay Program participants willcontinue to identify these gaps, which will serveas the focus for future data collection efforts.
Reflecting the growing interest in sustainability,new emphasis is being placed on measuresreflecting stewardship and land use and in non-traditional areas such as social and demographicpatterns. Sustainable development indicatorsand briefing materials have been recentlydeveloped by EPA Bay Program Office staff tohelp the program measure trends in these areasand to stimulate further discussion of the linksbetween land activities and water quality. Newgoals and a long term vision for a sustainableChesapeake Bay are likely results of this effort.
LESSONS LEARNED• Be persistent. There are many obstacles andchallenges to be met along the path todeveloping and gaining endorsement for usingindicators/outcome measures to set goals andmeasure progress. However, the payoff can betremendous in terms of public enthusiasm andinterest, and internal and external politicalsupport.• Work hard to reach consensus among keystakeholders on the selection of appropriatemeasures, interpretation of data and use. Oncesold on the value of the measure they will helpmaintain it over time.• Don’t wait for the system in which you areworking to be perfectly modeled or understoodby the scientists or experts. Data gaps andanalytical problems will always exist, andinsistence on using best available informationwill inspire improvement over time.• Maintain the link to the strategic goals oforganization. Indicators must have a clear enduse to be effective. Too many measuresdeveloped for their own sake detract from thefocus of the program. Link budget support aswell to a commitment to develop tangiblemeasures.• The leadership must push for the developmentand use of these measures. This approachrequires persistence and patience and a long-term vision for the program.• Share the environmental outcome informationwith the public and partners on a regular basis.This will often yield greater understanding ofyour efforts and help create the necessary publicand political support for goal-setting andnecessary environmental improvements.
To monitor future developments in outcome-based measures for the Chesapeake BayProgram, check the web-site atwww.chesapeakebay.net.

1
Chesapeake Bay Program Measurable Environmental Commitments (as of 12/30/2003)
Goal Category Commitment Title Commitment
Lead
Commitment
Due Date
Source of Goal
Nutrients 40% Nutrient Reduction - Total Nitrogen Reduction to Meet 2000 G oal -
229.9 Million Pound Cap
Nutrient
Subcommittee
(NSC)
12-31-00 1987 Chesapeake Bay Agreement
Nutrients 40% Nutrient Reduction -Total Phosphorus Reduction to Meet 2000 G oal -
15.44 Million Pound Cap
NSC 12-31-00 1987 Chesapeake Bay Agreement
Nutrients/
Sediments
Correct the nutrient and sediment-related problems in the Chesapeake Bay
and its tidal tributaries sufficiently to remove the Bay and the tidal portions of
its tributaries from the list of impaired waters under the Clean W ater Act.
NSC 12-31-10 Chesapeake 2000: A Watershed
Partnership
Nutrients Nitrogen: 175 million pounds/yr cap load allocation by 2010 NSC 12-31-10 Directive 03-02
Nutrients Phosphorus : 12.8 million pounds/yr cap load allocation by 2010 NSC 12-31-10 Directive 03-02
Sediments Land Based Sediment: 4.15 million tons/yr cap load allocation by 2010 NSC 12-31-10 Directive 03-02
Living
Resources
Fish Passage - Five Year Target of 582.05 miles Living
Resources
Subcommittee
(LRSc)
12-31-98 Directive 93-4
Living
Resources
Fish Passage - Ten Year Target of 1356.7 miles LRSc 12-31-03 Directive 93-4
Living
Resources
Waterfowl Targets - Restore waterfowl population and hab itat to 1970 levels. LRSc 12-31-00 Chesapeake Bay Waterfowl
Policy and Management Plan
1990
Living
Resources
Aquatic Reef Restoration - Restore 5,000 acres in M D & VA - 1,000 acres in
the Potomac.
LRSc 12-31-99 Aquatic Reef Habitat Plan 1994
Living
Resources
Achieve, at a minimum, a tenfold increase in native oysters in the Chesapeake
Bay, based upon a 1994 baseline.
LRSc 12-31-10 Chesapeake 2000: A Watershed
Partnership
Living
Resources
Interim SAV Restoration Goal - 114,000 Acres Baywide LRSc 12-31-05 Directive 93-3
Living
Resources
SAV Restoration Goal - 185,000 Acres Baywide by 2010 LRSc 12-31-10 Adoption Statement: Submerged
Aquatic Vegetation (Dec. 2003)

Goal Category Commitment Title Commitment
Lead
Commitment
Due Date
Source of Goal
Chesapeake Bay Program Measurable Environmental Commitments (as of 12/30/03) 2
Living
Resources
Wetlands Goals - No Annual Net Loss, Long-T erm N et Gain LRSc Chesapeake Bay Wetlands Policy
1988
Living
Resources
Achieve a net resource gain by restoring 25,000 acres of tidal and non-tidal
wetlands.
LRSc 12-31-10 Chesapeake 2000: A Watershed
Partnership
Toxics Increase the adoption of IPM in the watershed consistent
with Administration's goal IPM on 75% of US Agricultural land
Toxics
Subcommittee
(TSC),USDA
01-01-00 Chesapeake Bay Basinwide
Toxics Reduction and Prevention
Strategy 1994
Toxics Achieve 75% voluntary reduction of toxic releases for federal facilities in the
watershed.
TSC 12-31-00 Chesapeake Bay Basinwide
Toxics Reduction and Prevention
Strategy 1994
Toxics Achieve 75% voluntary participation of industrial facilities, commercial
establishments, and small businesses in pollution prevention programs.
TSC 12-31-00 Chesapeake Bay Basinwide
Toxics Reduction and Prevention
Strategy 1994
Toxics Establish volunteer IPM practices on 75% of all Agricultural, Recreation., and
Public lands.
TSC 12-31-00 Chesapeake Bay Basinwide
Toxics Reduction and Prevention
Strategy 1994
Toxics Achieve 65% voluntary reduction in Toxics Release Inventory chemicals from
watershed industries from a 1988 baseline.
TSC 12-31-00 Chesapeake Bay Basinwide
Toxics Reduction and Prevention
Strategy 1994
Toxics Achieve 75% voluntary reduction in Chesapeake Bay Toxics of Concern
chemicals from industries in the watershed from a 1988 baseline.
TSC 12-31-00 Chesapeake Bay Basinwide
Toxics Reduction and Prevention
Strategy 1994
Toxics Achieve 100% participation by all state and local governments in the
watershed in the implementation of pollution prevention programs.
TSC 12-31-00 Chesapeake Bay Basinwide
Toxics Reduction and Prevention
Strategy 1994
Toxics Promote voluntary IPM practices on 50% of the commercial land and 25% of
the residential land within the watershed.
TSC 12-31-00 Chesapeake Bay Basinwide
Toxics Reduction and Prevention
Strategy 1994

Goal Category Commitment Title Commitment
Lead
Commitment
Due Date
Source of Goal
Chesapeake Bay Program Measurable Environmental Commitments (as of 12/30/03) 3
Toxics Eliminate all acute and chronic toxic effects from discharges under the
NPDES (water permit) program
TSC 12-31-05 Chesapeake Bay Basinwide
Toxics Reduction and Prevention
Strategy 1994
Toxics Zero release of chemical contaminants from point and nonpoint
sources, with emphasis on elimination of mixing zones for persistent or
bioaccumulative toxics.
TSC 12-31-10 Chesapeake 2000: A Watershed
Partnership and Toxics 2000
Strategy
Toxics Reduce TRI chemicals 20% watershed-wide, 1998-2010. TSC 12-31-10 Toxics 2000 Strategy
Toxics Reduce chemicals of concern 15% in impacted areas/areas at risk, 1998-2005. TSC 12-31-05 Toxics 2000 Strategy
Toxics Reduce TRI chemicals 40% from federal facilities, 2001-2006. TSC 12-31-06 Toxics 2000 Strategy
Toxics Reduce chemicals of concern 50% from federal facilities in impacted
areas/areas at risk, 2001-2006.
TSC 12-31-06 Toxics 2000 Strategy
Toxics Businesses for Bay participants will prevent or recycle one billion pounds of
hazardous substances, 1999-2005.
TSC 12-31-05 Toxics 2000 Strategy
Toxics Reduce nonpoint sources of chemicals of concern to the Regions
of Concern 30% by 2010. Baselines to be developed by 2002.
TSC 12-31-10 Toxics 2000 Strategy
Toxics No net increase of chemical contaminants from developing lands
by 2010.
TSC 12-31-10 Toxics 2000 Strategy
Cross Cutting Reduce the Chesapeake Bay region SNC rate to half of its 1987 level , to a
rate of 5.8% by the end of 1990.
NSC, TSC 12-31-90 US EPA Administrator B ill Reilly
at 1989 Executive Council
Meeting - statement
Cross Cutting Reduce the Chesapeake Bay region SNC rate for federal facilities to zero by
the end of 1990.
Federal
Agencies
Committee
(FAC)
12-31-90 US EPA Administrator B ill Reilly
at 1989 Executive Council
Meeting - statement

Goal Category Commitment Title Commitment
Lead
Commitment
Due Date
Source of Goal
Chesapeake Bay Program Measurable Environmental Commitments (as of 12/30/03) 4
Cross Cutting Recognize 165 (10%) of the local governments in the Chesapeake Bay
watershed as Bay Partner Communities.
Local
Government
Advisory
Committee
(LGAC)
12-31-00 Local Government Participation
Action Plan 1996
Cross Cutting Encourage 20% of the 165 Bay Partner Communities, recognized in 2000 , to
achieve a higher tier.
LGAC 12-31-05 Local Government Participation
Action Plan 1996
Cross Cutting Recognize 330 (20%) of the local governments in the Chesapeake Bay
watershed as Bay Partner Communities.
LGAC 12-31-05 Local Government Participation
Action Plan 1996
Cross Cutting Increase the number of designated water trails in the Chesapeake Bay region
by 500 miles.
Land , Growth
&Stewardship
Subcommittee
(LGSS)
12-31-05 Chesapeake 2000: A Watershed
Partnership
Cross Cutting Restore riparian forests on 2,010 miles of stream and shoreline in the
watershed, targeting efforts where they will be of greatest value to water
quality and living resources.
NSC, Forestry
Workgroup
12-31-10 Adoption Statement on Riparian
Forest Buffers 1996
Cross Cutting Conserve existing forests along all streams and shoreline. NSC, Forestry
Workgroup
ongoing Adoption Statement on Riparian
Forest Buffers 1996
Chesapeake 2000: A Watershed
Partnership
Cross Cutting Restore riparian forests on 10,000 miles of stream and shoreline in the
watershed, targeting efforts where they will be of greatest value to water
quality and living resources.
NSC, Forestry
Workgroup
12-31-10 Directive 03-01
Cross Cutting Work with local governments, community groups and watershed
organizations to develop and implement locally supported watershed
management plans in two thirds of the Bay watershed covered by the
Agreement.
Community
Watershed
Taskforce
(CWTF)
12-31-10 Chesapeake 2000: A Watershed
Partnership
Cross Cutting Expand by 50% the number and availability of boat waste pump-out facilities. LGSS/NSC 12-31-10 Chesapeake 2000: A Watershed
Partnership

Goal Category Commitment Title Commitment
Lead
Commitment
Due Date
Source of Goal
Chesapeake Bay Program Measurable Environmental Commitments (as of 12/30/03) 5
Cross Cutting Permanently preserve from development 20% of the land area in the
watershed by 2010.
LGSS 12-31-10 Chesapeake 2000: A Watershed
Partnership
Cross Cutting Rehabilitate and restore 1,050 brownfield sites to productive use. LGSS 12-31-10 Chesapeake 2000: A Watershed
Partnership
Cross Cutting Expand by 30% the system of public access points to the Bay, its tributaries
and related resource sites in an environmentally sensitive manner by working
with state and federal agencies, local governments and stakeholder
organizations.
LGSS 12-31-10 Chesapeake 2000: A Watershed
Partnership
Cross Cutting Reduce the rate of harmful sprawl development of forest and agricultural land
in the Chesapeake Bay watershed by 30% measured as an average over five
years from the baseline of 1992-1997.
LGSS 12-31-12 Chesapeake 2000: A Watershed
Partnership
Cross Cutting Beginning with the class of 2005, provide a meaningful Bay or stream
outdoor experience for every school student in the watershed before
graduation from high school.
CESC 2005 and
every year
after
Chesapeake 2000: A Watershed
Partnership
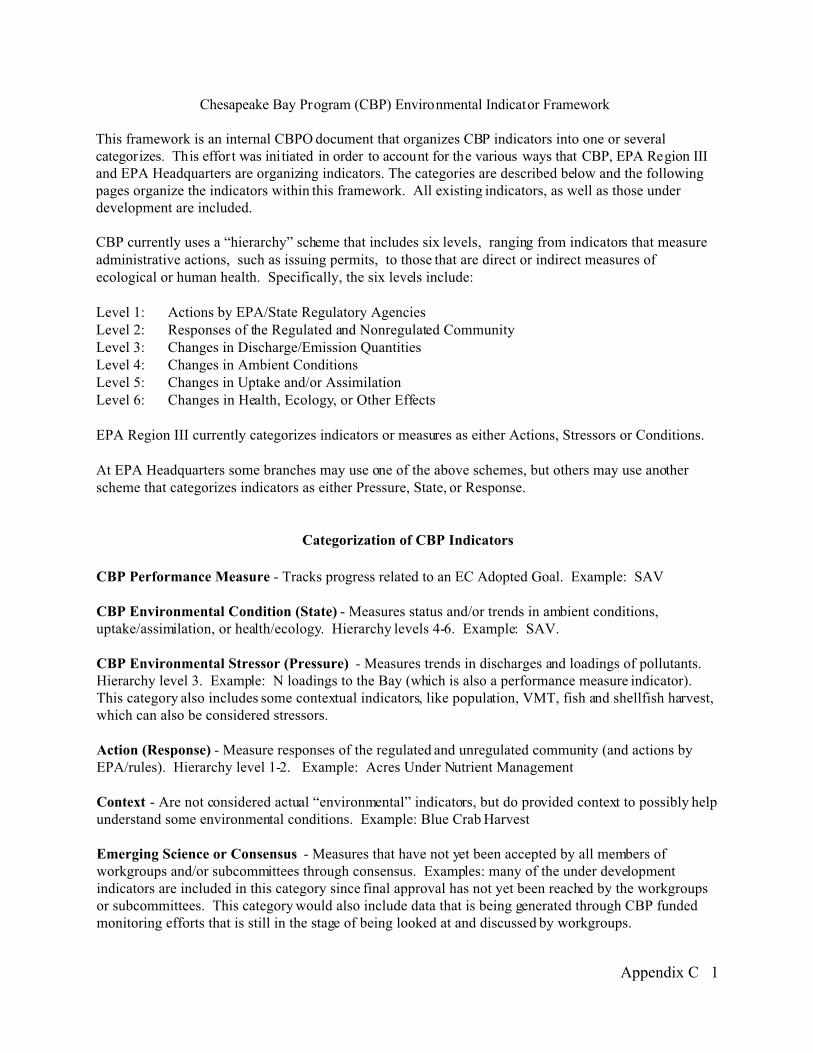
Appendix C 1
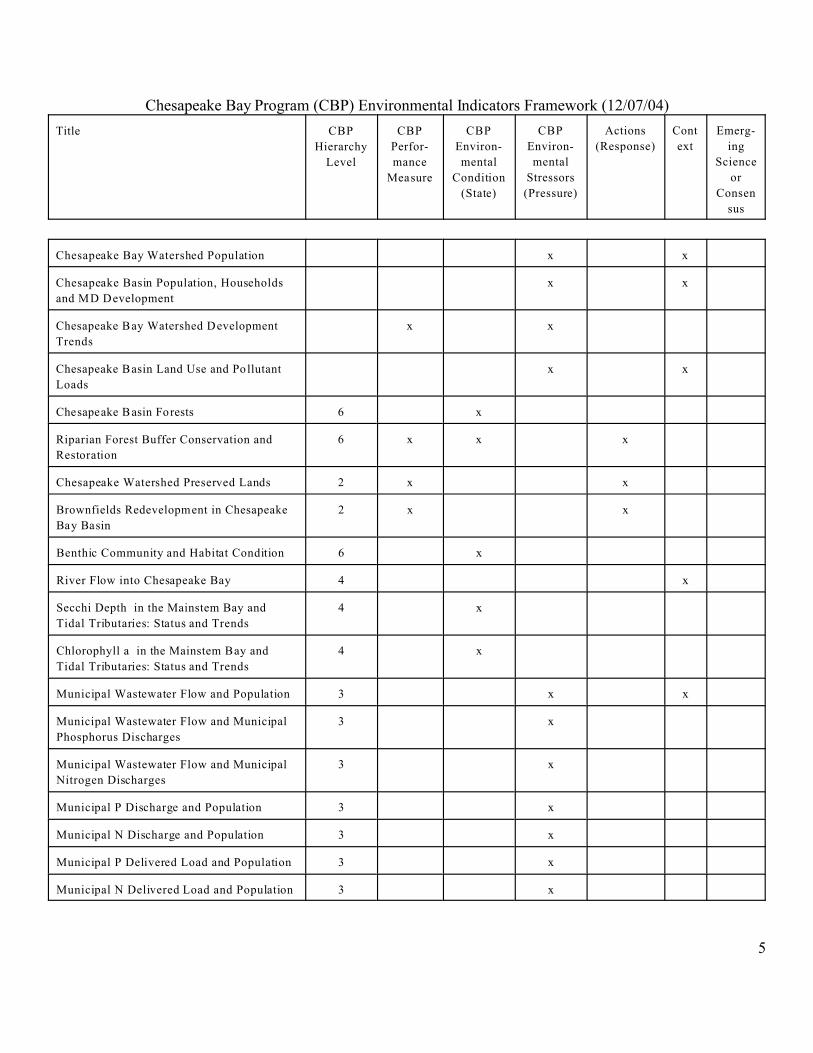
Chesapeake Bay Program (CBP) Environmental Indicator Framework
This framework is an internal CBPO document that organizes CBP indicators into one or severalcategorizes. This effort was initiated in order to account for the various ways that CBP, EPA Region IIIand EPA Headquarters are organizing indicators. The categories are described below and the followingpages organize the indicators within this framework. All existing indicators, as well as those underdevelopment are included.
CBP currently uses a “hierarchy” scheme that includes six levels, ranging from indicators that measureadministrative actions, such as issuing permits, to those that are direct or indirect measures ofecological or human health. Specifically, the six levels include:
Level 1: Actions by EPA/State Regulatory AgenciesLevel 2: Responses of the Regulated and Nonregulated CommunityLevel 3: Changes in Discharge/Emission QuantitiesLevel 4: Changes in Ambient ConditionsLevel 5: Changes in Uptake and/or AssimilationLevel 6: Changes in Health, Ecology, or Other Effects
EPA Region III currently categorizes indicators or measures as either Actions, Stressors or Conditions.
At EPA Headquarters some branches may use one of the above schemes, but others may use anotherscheme that categorizes indicators as either Pressure, State, or Response.
Categorization of CBP Indicators
CBP Performance Measure - Tracks progress related to an EC Adopted Goal. Example: SAV
CBP Environmental Condition (State) - Measures status and/or trends in ambient conditions,uptake/assimilation, or health/ecology. Hierarchy levels 4-6. Example: SAV.
CBP Environmental Stressor (Pressure) - Measures trends in discharges and loadings of pollutants. Hierarchy level 3. Example: N loadings to the Bay (which is also a performance measure indicator). This category also includes some contextual indicators, like population, VMT, fish and shellfish harvest,which can also be considered stressors.
Action (Response) - Measure responses of the regulated and unregulated community (and actions byEPA/rules). Hierarchy level 1-2. Example: Acres Under Nutrient Management
Context - Are not considered actual “environmental” indicators, but do provided context to possibly helpunderstand some environmental conditions. Example: Blue Crab Harvest
Emerging Science or Consensus - Measures that have not yet been accepted by all members ofworkgroups and/or subcommittees through consensus. Examples: many of the under developmentindicators are included in this category since final approval has not yet been reached by the workgroupsor subcommittees. This category would also include data that is being generated through CBP fundedmonitoring efforts that is still in the stage of being looked at and discussed by workgroups.

Chesapeake Bay Program (CBP) Environmental Indicator Framework
This framework is an internal CBPO document that organizes CBP indicators into one or severalcategorizes. This effort was initiated in order to account for the various ways that CBP, EPA Region IIIand EPA Headquarters are organizing indicators. The categories are described below and the followingpages organize the indicators within this framework. All existing indicators, as well as those underdevelopment are included.
CBP currently uses a “hierarchy” scheme that includes six levels, ranging from indicators that measureadministrative actions, such as issuing permits, to those that are direct or indirect measures of ecologicalor human health. Specifically, the six levels include:
Level 1: Actions by EPA/State Regulatory AgenciesLevel 2: Responses of the Regulated and Nonregulated CommunityLevel 3: Changes in Discharge/Emission QuantitiesLevel 4: Changes in Ambient ConditionsLevel 5: Changes in Uptake and/or AssimilationLevel 6: Changes in Health, Ecology, or Other Effects
EPA Region III currently categorizes indicators or measures as either Actions, Stressors or Conditions.
At EPA Headquarters some branches may use one of the above schemes, but others may use anotherscheme that categorizes indicators as either Pressure, State, or Response.
Categorization of CBP Indicators
CBP Performance Measure - Tracks progress related to an EC Adopted Goal. Example: SAV
CBP Environmental Condition (State) - Measures status and/or trends in ambient conditions,uptake/assimilation, or health/ecology. Hierarchy levels 4-6. Example: SAV.
CBP Environmental Stressor (Pressure) - Measures trends in discharges and loadings of pollutants. Hierarchy level 3. Example: N loadings to the Bay (which is also a performance measure indicator). This category also includes some contextual indicators, like population, VMT, fish and shellfish harvest,which can also be considered stressors.
Action (Response) - Measure responses of the regulated and unregulated community (and actions byEPA/rules). Hierarchy level 1-2. Example: Acres Under Nutrient Management
Context - Are not considered actual “environmental” indicators, but do provided context to possibly helpunderstand some environmental conditions. Example: Blue Crab Harvest
Emerging Science or Consensus - Measures that have not yet been accepted by all members ofworkgroups and/or subcommittees through consensus. Examples: many of the under developmentindicators are included in this category since final approval has not yet been reached by the workgroupsor subcommittees. This category would also include data that is being generated through CBP fundedmonitoring efforts that is still in the stage of being looked at and discussed by workgroups.

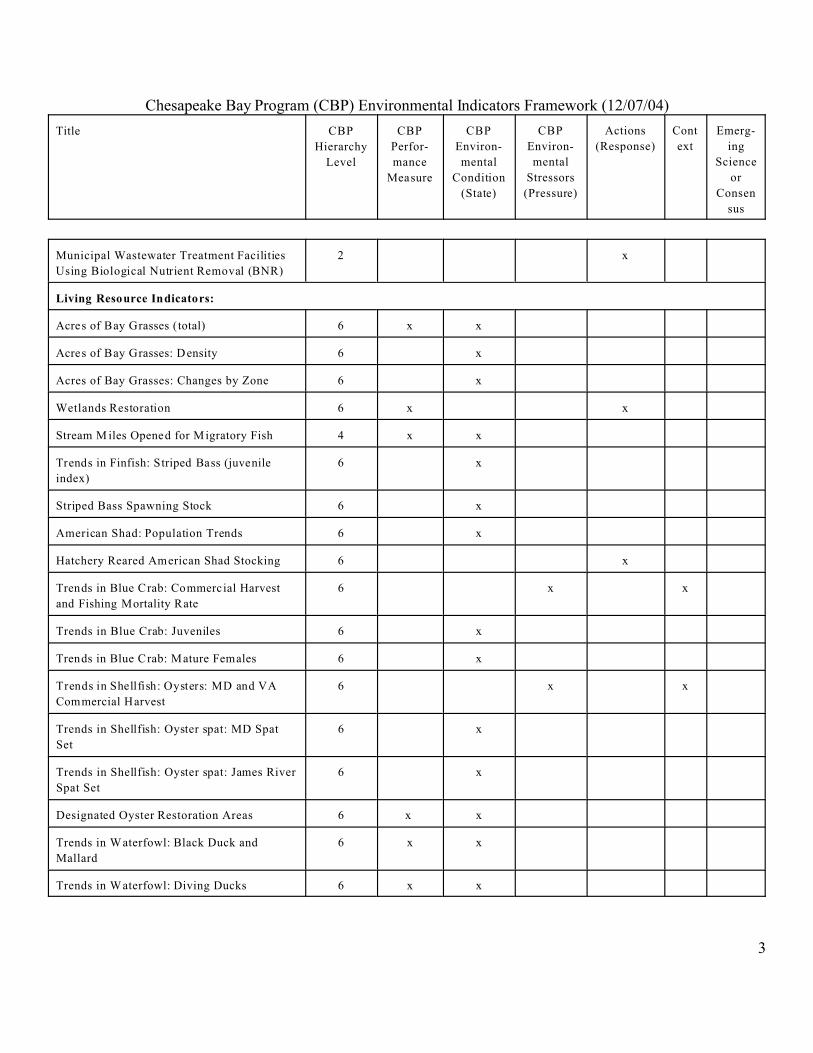
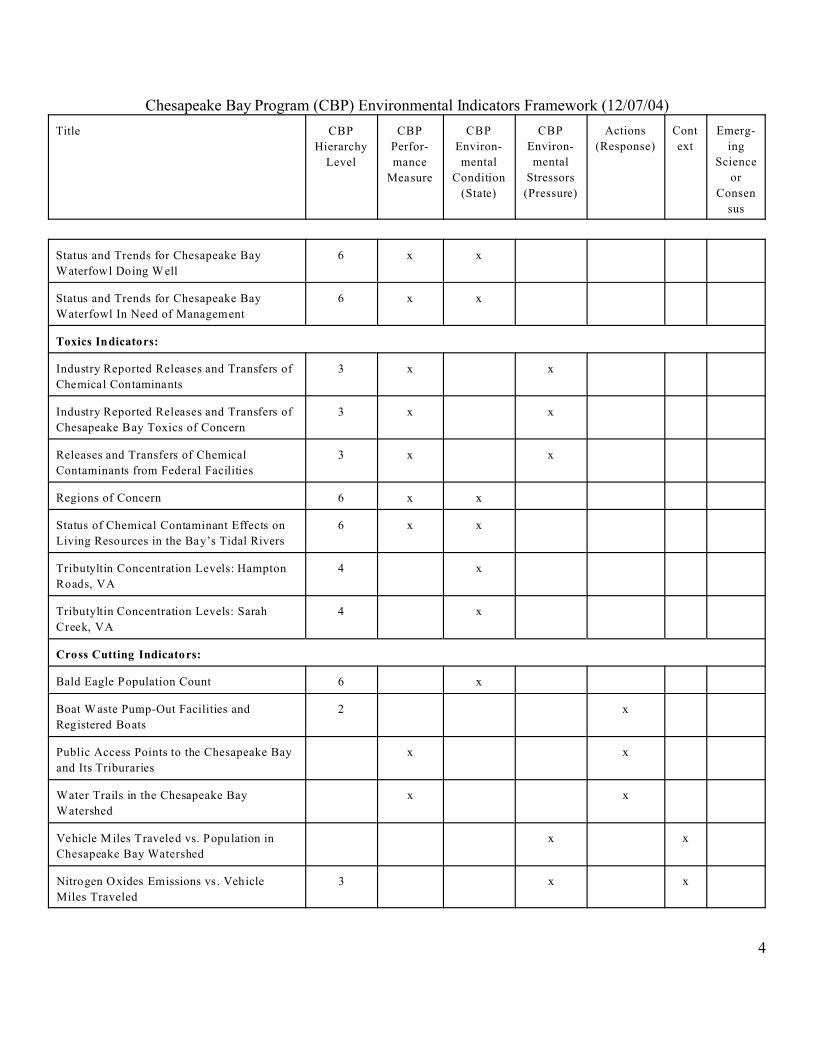
Chesapeake Bay Program (CBP) Environmental Indicators Framework (12/07/04)
Title CBP
Hierarchy
Level
CBP
Perfor-
mance
Measure
CBP
Environ-
mental
Condition
(State)
CBP
Environ-
mental
Stressors
(Pressure)
Actions
(Response)
Cont
ext
Emerg-
ing
Science
or
Consen
sus
2
APPROVED INDICATORS
Nutrient Enrichment Indicators:
Sources of Nutrient and Sediment Loads to
the Bay
x
Nutrient and Sediment Loads Delivered to
the Bay
3 x x
Point Source Phosphorus (P) Loads
Delivered to the Bay
3 x
Point Source Nitrogen (N) Loads Delivered
to the Bay
3 x
P Trends in Rivers Entering the Bay: Flow
Adjusted Concentrations
4 x
N Trends in Rivers Entering the Bay: Flow
Adjusted Concentrations
4 x
Sediment T rends in Rivers Entering the Bay:
Flow Adjusted Concentrations
4 x
Nontidal Phosphorus Loads and River Flow
To the Chesapeake Bay
4 x
Nontidal Nitrogen Loads and River Flow To
the Chesapeake Bay
4 x
Nontidal Sediment Loads and River Flow To
the Chesapeake Bay
4 x
Dissolved Oxygen Concentrations: Mainstem
Bay Summer Trends
4 x
Bottom DO Concentrations in the Mainstem
Bay and Tidal Tributaries
4 x
Acres Under Nutrient Management 2 x
Municipal Wastewater Flow and Biological
Nutrient Removal (BNR)
2 x
Chesapeake Bay Program (CBP) Environmental Indicators Framework (12/07/04)
Title CBP
Hierarchy
Level
CBP
Perfor-
mance
Measure
CBP
Environ-
mental
Condition
(State)
CBP
Environ-
mental
Stressors
(Pressure)
Actions
(Response)
Cont
ext
Emerg-
ing
Science
or
Consen
sus
3
Municipal Wastewater Treatment Facilities
Using Biological Nutrient Removal (BNR)
2 x
Living Resource Indicators:
Acres of Bay Grasses (total) 6 x x
Acres of Bay Grasses: Density 6 x
Acres of Bay Grasses: Changes by Zone 6 x
Wetlands Restoration 6 x x
Stream M iles Opened for Migratory Fish 4 x x
Trends in Finfish: Striped Bass (juvenile
index)
6 x
Striped Bass Spawning Stock 6 x
American Shad: Population Trends 6 x
Hatchery Reared American Shad Stocking 6 x
Trends in Blue Crab: Commercial Harvest
and Fishing Mortality Rate
6 x x
Trends in Blue Crab: Juveniles 6 x
Trends in Blue Crab: Mature Females 6 x
Trends in Shellfish: Oysters: MD and VA
Commercial Harvest
6 x x
Trends in Shellfish: Oyster spat: MD Spat
Set
6 x
Trends in Shellfish: Oyster spat: James River
Spat Set
6 x
Designated Oyster Restoration Areas 6 x x
Trends in Waterfowl: Black Duck and
Mallard
6 x x
Trends in Waterfowl: Diving Ducks 6 x x
Chesapeake Bay Program (CBP) Environmental Indicators Framework (12/07/04)
Title CBP
Hierarchy
Level
CBP
Perfor-
mance
Measure
CBP
Environ-
mental
Condition
(State)
CBP
Environ-
mental
Stressors
(Pressure)
Actions
(Response)
Cont
ext
Emerg-
ing
Science
or
Consen
sus
4
Status and Trends for Chesapeake Bay
Waterfowl Doing W ell
6 x x
Status and Trends for Chesapeake Bay
Waterfowl In Need of Management
6 x x
Toxics Indicators:
Industry Reported Releases and Transfers of
Chemical Contaminants
3 x x
Industry Reported Releases and Transfers of
Chesapeake Bay Toxics of Concern
3 x x
Releases and Transfers of Chemical
Contaminants from Federal Facilities
3 x x
Regions of Concern 6 x x
Status of Chemical Contaminant Effects on
Living Resources in the Bay’s Tidal Rivers
6 x x
Tributyltin Concentration Levels: Hampton
Roads, VA
4 x
Tributyltin Concentration Levels: Sarah
Creek, VA
4 x
Cross Cutting Indicators:
Bald Eagle Population Count 6 x
Boat W aste Pump-Out Facilities and
Registered Boats
2 x
Public Access Points to the Chesapeake Bay
and Its Triburaries
x x
Water Trails in the Chesapeake Bay
Watershed
x x
Vehicle M iles Traveled vs. Population in
Chesapeake Bay Watershed
x x
Nitrogen Oxides Emissions vs. Vehicle
Miles Traveled
3 x x
Chesapeake Bay Program (CBP) Environmental Indicators Framework (12/07/04)
Title CBP
Hierarchy
Level
CBP
Perfor-
mance
Measure
CBP
Environ-
mental
Condition
(State)
CBP
Environ-
mental
Stressors
(Pressure)
Actions
(Response)
Cont
ext
Emerg-
ing
Science
or
Consen
sus
5
Chesapeake Bay Watershed Population x x
Chesapeake Basin Population, Households
and MD Development
x x
Chesapeake Bay Watershed Development
Trends
x x
Chesapeake Basin Land Use and Pollutant
Loads
x x
Chesapeake Basin Forests 6 x
Riparian Forest Buffer Conservation and
Restoration
6 x x x
Chesapeake Watershed Preserved Lands 2 x x
Brownfields Redevelopment in Chesapeake
Bay Basin
2 x x
Benthic Community and Habitat Condition 6 x
River Flow into Chesapeake Bay 4 x
Secchi Depth in the Mainstem Bay and
Tidal Tributaries: Status and Trends
4 x
Chlorophyll a in the Mainstem Bay and
Tidal Tributaries: Status and Trends
4 x
Municipal Wastewater Flow and Population 3 x x
Municipal Wastewater Flow and Municipal
Phosphorus Discharges
3 x
Municipal Wastewater Flow and Municipal
Nitrogen Discharges
3 x
Municipal P Discharge and Population 3 x
Municipal N Discharge and Population 3 x
Municipal P Delivered Load and Population 3 x
Municipal N Delivered Load and Population 3 x

Chesapeake Bay Program (CBP) Environmental Indicators Framework (12/07/04)
Title CBP
Hierarchy
Level
CBP
Perfor-
mance
Measure
CBP
Environ-
mental
Condition
(State)
CBP
Environ-
mental
Stressors
(Pressure)
Actions
(Response)
Cont
ext
Emerg-
ing
Science
or
Consen
sus
6
Chesapeake Basin Sewage Disposal and
Septic System Loads
3 x x
Percent of Households on Septic vs. Sewer x x x
Bernie Fowler’s “Sneaker Index” x
Bay Watershed Residents Survey: Level of
Concern and Attitudes
x
Bay W atershed Residents Survey: Behaviors
and Attitudes
x
Knowledge of Bay Watershed Residents x
Perceptions of Bay W atershed Residents:
Water Quality
x
Perceptions of Bay Watershed Residents:
Pollution
x
Attitudes of Bay Watershed Residents:
Causes of Pollution
x
Attitudes of Bay Watershed Residents:
Impact of Pollution Sources
x
Behaviors of Bay Watershed Residents x
Chesapeake Bay Partner Communities 2 x x
Chesapeake Bay Partner Communities:
Award Status
2 x x
Priorities for Development
Areas Meeting Water Quality Conditions
Necessary to Protect Aquatic Living
Resources (several)
5 x x x
Oyster population (to be used to track 10-
fold increase goal)
6 x x x