Embed Size (px)
Citation preview

Remondis Pty Ltd
ENVIRONMENTAL MONITORING PROGRAM BLAXLAND WASTE MANAGEMENT FACILITY
SAMPLING AND ANALYSIS REPORT FOR
May, June and July 2015
Report to: Remondis Pty Ltd 34 Waterloo Avenue THORNTON NSW 2322
Report No: 24005241 Quarterly
Date: 25th of June, 2015
Prepared by: Natalie McMillan
Natalie McMillan
Environmental Supervisor
ADDRESS Unit 3, 16 Donald Street Lithgow NSW 2790 Australia PHONE +61 2 6350 7400 FAX +61 6352 3583
ACIRL Pty Ltd ABN 41 000 513 888 Part of the ALS Group A Campbell Brothers Limited Company

TABLE OF CONTENTS
1.0 LICENCE COMPLIANCE & ENVIRONMENTL MONITORING.................................................... 3
2.0 LICENSED DISCHARGE POINT MONITORING .......................................................................... 4
2.1 EPL IDENTIFICATION POINT NO. 1: EFFLUENT QUALITY MONITORING ............................................. 4 2.2 EPA IDENTIFICATION POINT NO. 7 & 8: DUST MONITORING ............................................................. 4
3.0 ENVIRONMENTAL MONITORING ................................................................................................. 5
3.1 EPL IDENTIFICATION POINT NO.10: AIR EMISSIONS MONITORING.................................................... 5 3.2 GROUND WATER MONITORING. ....................................................................................................... 5 3.3 SURFACE WATER MONITORING. ....................................................................................................... 5 3.4 LEACHATE MONITORING .................................................................................................................. 5
APPENDIX A – AIR EMMISSIONS MONITORING ................................................................................... 6
APPENDIX B – GROUND WATER MONITORING ................................................................................... 8
APPENDIX C – SURFACE WATER MONITORING ................................................................................ 32
APPENDIX D – LEACHATE WATER MONITORING.............................................................................. 45
APPENDIX E – EFFLUENT MONITORING .............................................................................................. 49
APPENDIX F- FIELD OBSERVATIONS…………………………………………………………………….50
APPENDIX G – WATER ANALYSIS METHODS..................................................................................... 51
Page 2 of 51 Report No: 24005241

1.0 LICENCE COMPLIANCE & ENVIRONMENTAL MONITORING Blue Mountains City Council operates the Blaxland Waste Management Facility located on Attunga Road, Blaxland with the Environment Protection Licence (No.10039). The following table represents a Licence Compliance Summary of the environmental monitoring and limits specified in the EPA Licence.
LICENSED DISCHARGE POINT MONITORING
EPL
Identification No.
Type of Monitoring Point
Last Sampling
Date
Licence Limit
Conditions Comments
1 Effluent Discharge 10/06/2015 N/A No
discharge
ENVIRONMENTAL MONITORING
7 Dust Monitoring Removed N/A Monthly
Sample
8 Dust Monitoring 18/06/2015 N/A Monthly Sample
10 Surface Gas Monitoring 10/06/2015 N/A
12 Ground Water Bore 2 10/06/2015 N/A
14 Ground Water Bore 4 10/06/2015 N/A
16 Ground Water Bore6A 10/06/2015 N/A
17 Ground Water Bore 7 10/06/2015 N/A
18 Surface Water S1 10/06/2015 N/A
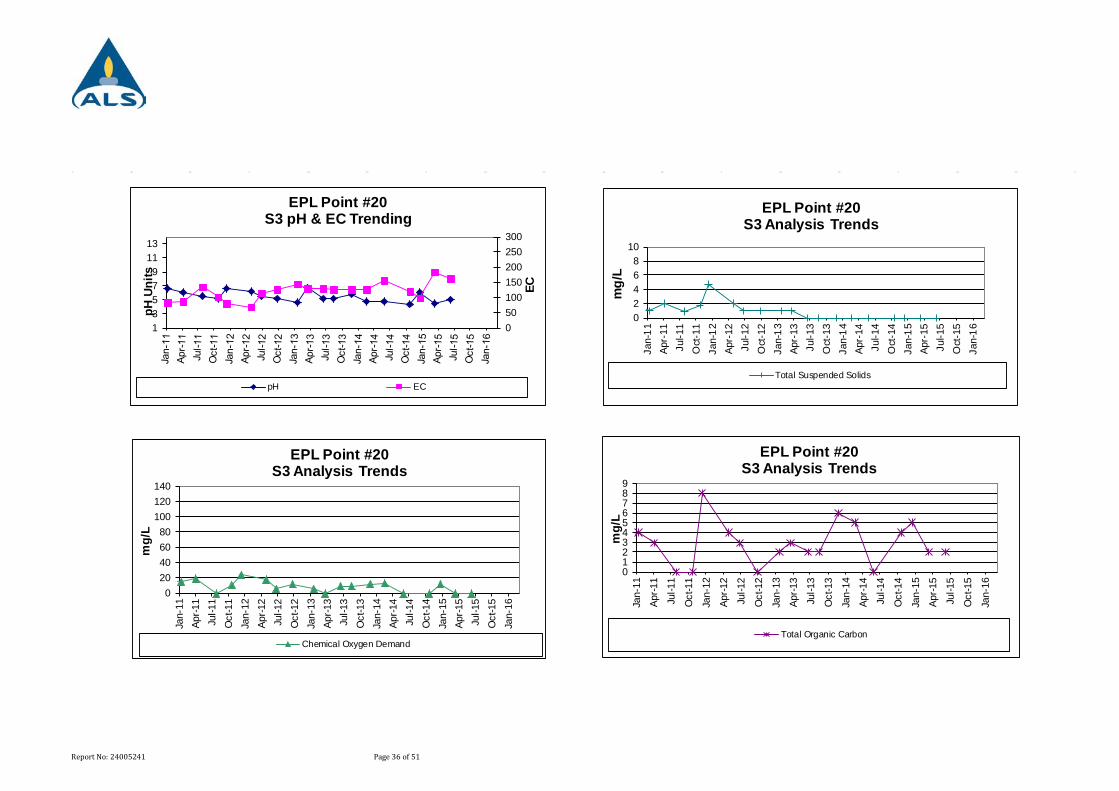
20 Surface Water S3 10/06/2015 N/A
21 Leachate L1 10/06/2015 N/A
22 Surface Water S22 10/06/2015 N/A
23 Ground Water Bore 8 10/06/2015 N/A
24 Ground Water Bore 9 10/06/2015 N/A
25 Ground Water Bore 10 10/06/2015 N/A
26 Leachate Dam 2 10/06/2015 N/A
28 Ground Water Bore 11 10/06/2015 N/A N/A: Not applicable
Page 3 of 51 Report No: 24005241

2.0 LICENSED DISCHARGE POINT MONITORING
2.1 EPL Identification Point No. 1: Effluent Quality Monitoring Effluent quality is to be monitored on a quarterly basis. The Licence also specifies that if there is no discharge on the scheduled sampling day, a sample must be taken on the first day of discharge after the scheduled sampling day. The effluent was not discharging during quarterly sampling on 10th June, 2015. Results are presented in Appendix E – Effluent Water Monitoring.
Pollutant Unit of Measure 100 percentile
concentration limit Ammonia milligrams per litre 0.9 pH pH 6.5 – 8.5 Total suspended solids milligrams per litre 50
2.2 EPA Identification Point No. 7 & 8: Dust Monitoring One dust monitoring locations exist on the site. As per the EPA licence, the sampling and analysis of the dust gauges was conducted in accordance with AS 3580.10.1. Dust gauges were collected and replaced for monthly analysis for the period between:
• 23rd of March 2015 - 24th of April 2015 • 24th of April 2015 – 21st of May 2015 • 21st of May 2015 -18th of June 2015
The monthly dust results are included on a separate monthly report.
Page 4 of 51 Report No: 24005241

3.0 ENVIRONMENTAL MONITORING
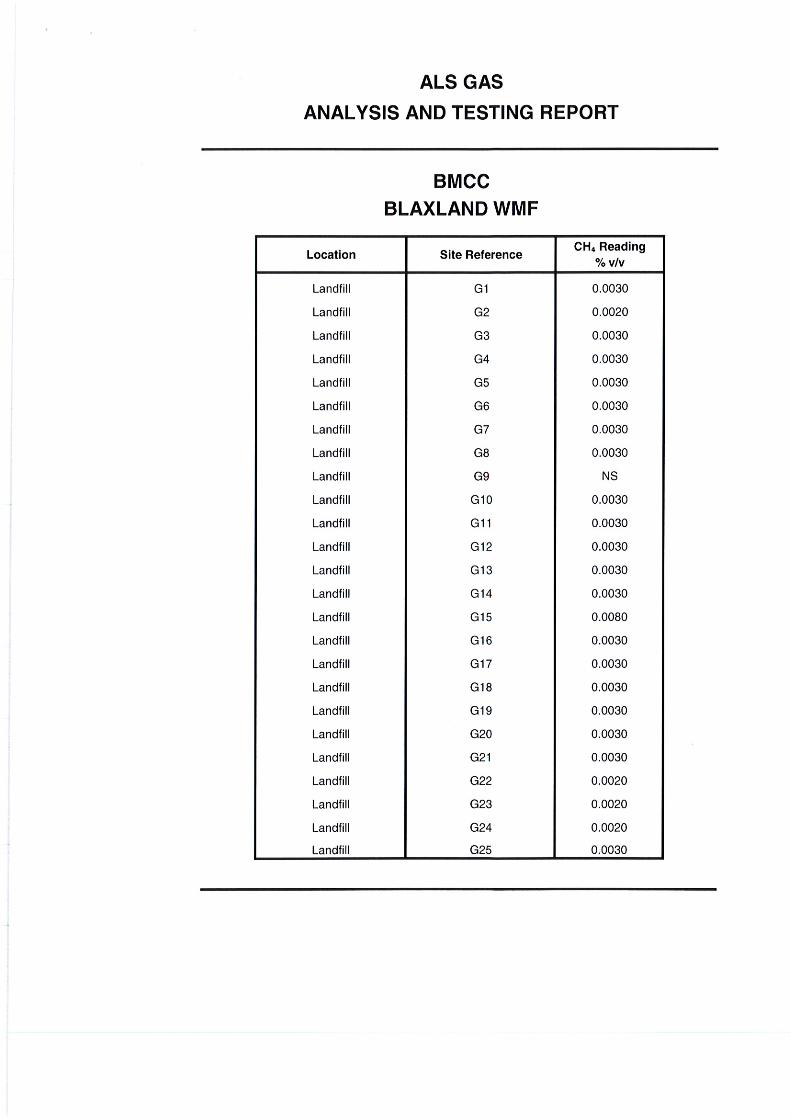
3.1 EPL Identification Point No.10: Air Emissions Monitoring According to the Licence, surface methane should be measured (% by volume) on a quarterly basis. Sampling was carried out on 10th of June, 2015 using a Model Inspectra Laser All surface methane levels measured were below the specified Landfill Gas Hazard Reporting level of 1.25% methane (v/v). Results are presented in the Appendix A – Air Emissions Monitoring
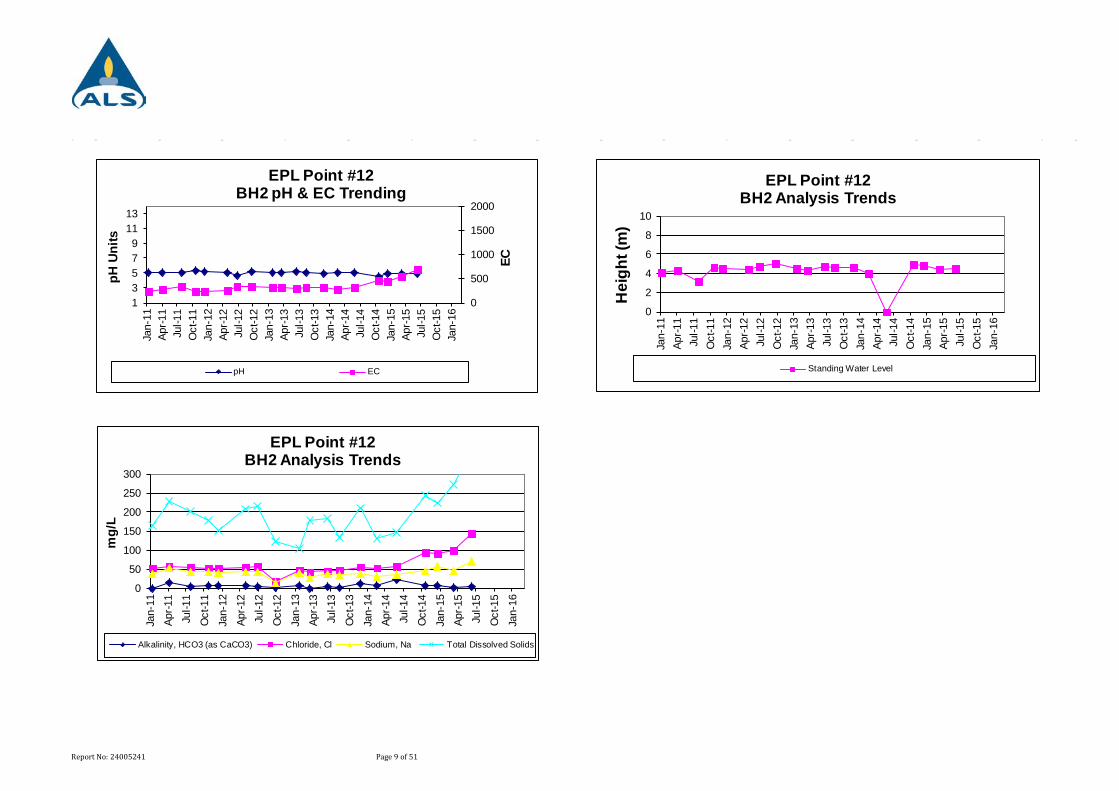
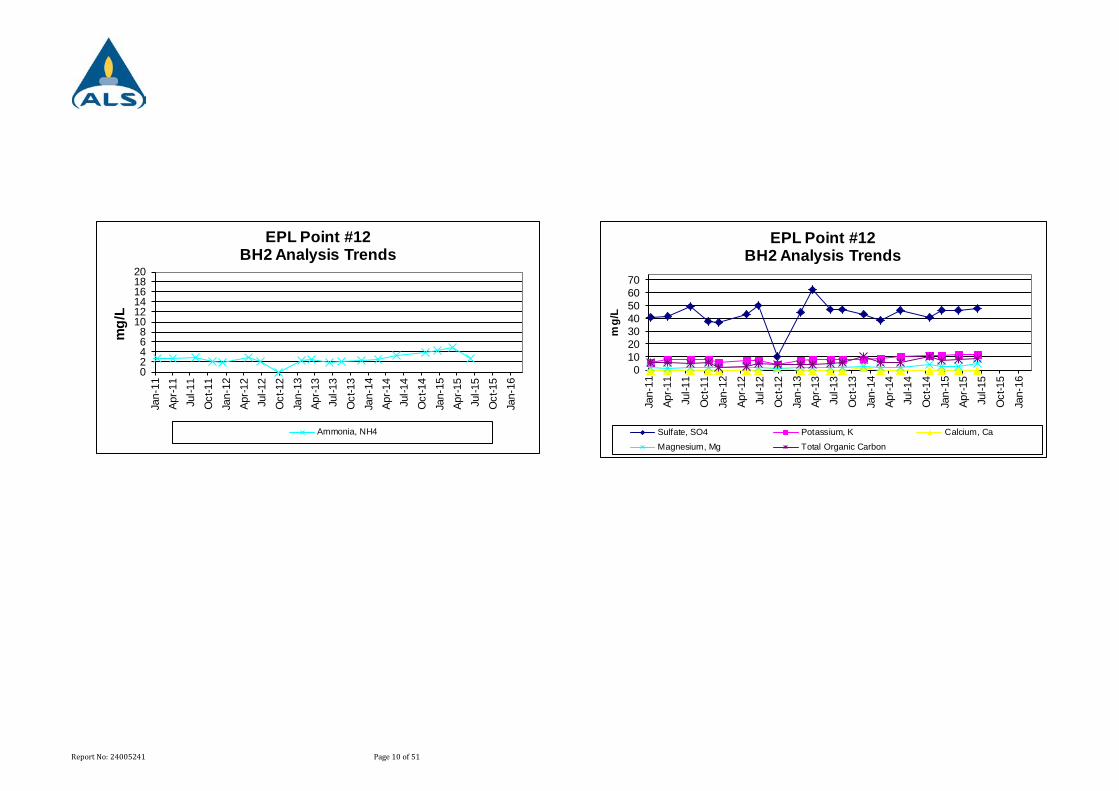
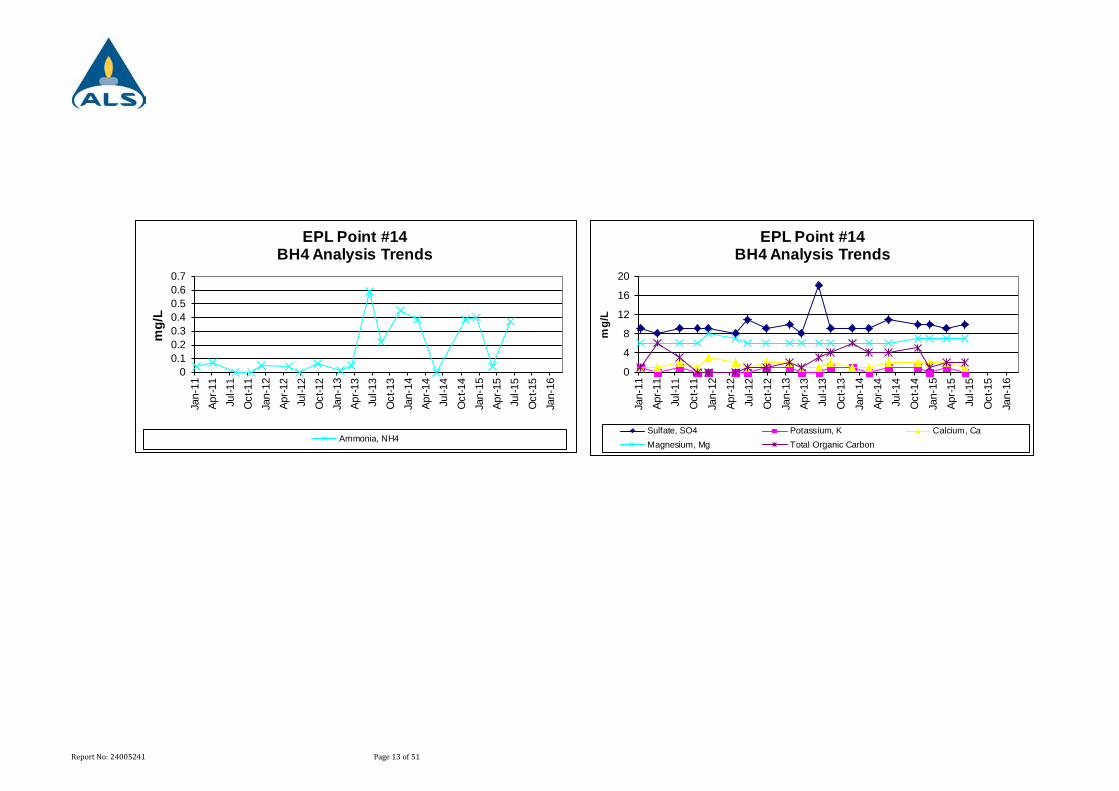
3.2 Ground Water Monitoring. Licence condition M2.3 specifies that eight ground water monitoring bores (EPL Points 12, 14, 16, 17, 23, 24, 25 & 28) are to be sampled on a quarterly basis. The bores were sampled on 10th of June, 2015. All bores were analyzed for the ‘quarterly’ parameters detailed in the Appendix – Ground Water Monitoring. The attached graphs show variation of parameters with time. Results are presented in the Appendix B – Ground Water Monitoring
3.3 Surface Water Monitoring. Licence condition M2.3 specifies that three surface water-monitoring locations (EPL Points 18, 20 & 22) are to be sampled on a quarterly basis. The three locations were sampled on 10th of June, 2015 and were analyzed for the ‘quarterly’ parameters detailed in the Appendix – Surface Water and Leachate Monitoring. The attached graphs show variation of parameters with time. Results are presented in the Appendix C – Surface Water Monitoring
3.4 Leachate Monitoring Licence condition M2.3 specifies that the licensee must monitor two Leachate locations (EPL Point 21 & 26) on a quarterly basis. Sampling for the two Leachate dams was conducted on 10th of June, 2015. All leachate water was either contained on site or pumped under a Trade Waste Agreement on the day of sampling. Results are presented in the Appendix D – Leachate Monitoring
Page 5 of 51 Report No: 24005241

APPENDIX A – AIR EMMISSIONS MONITORING
Location Surface Methane % (v/v)G1 0.0000G2 0.0000G3 0.0000G4 0.0000G5 0.0000G6 0.0000G7 0.0000G8 0.0000G9 NSG10 0.0000G11 0.0000G12 0.0000G13 0.0000G14 0.0000G15 0.0000G16 0.0010G17 0.0000G18 0.0010G19 0.0000G20 0.0020G21 0.0010G22 0.0010G23 0.0020G24 0.0000G25 0.0010
EPA MONITORING POINT 10: AIR EMISSIONS MONITORING - SURFACE METHANE PPM (V/V)
BLAXLAND WASTE TREATMENT FACILITY
Page 6 of 51 Report No: 24005241

Location Surface Methane % (v/v)
G26 0.0240G27 0.0080G28 0.0000G29 0.0040G30 0.0010G31 0.0000G32 0.0010G33 0.0000G34 0.0000G35 0.0000G36 0.0000G37 0.0000G38 0.0000G39 0.0000G40 0.0000G41 0.0000G42 0.0000G43 NSG44 NSG45 NSG46 NSG47 NSG48 NSG49 NSG50 NS
EPA MONITORING POINT 10: AIR EMISSIONS MONITORING - SURFACE METHANE PPM (V/V)
NS: No Sample (point G9 & G43-G50 not shown on sampling location map)
Date Sampled: 10/06/2015
Sampled by: J. Takahira & J. Featherstone
Meter Identification: Model Ispectra Laser.
Page 7 of 51 Report No: 24005241

APPENDIX B – GROUND WATER MONITORING
Time sampled: 11:25 12:10 12:00 12:00 12:05 12:10 12:50Date sampled: 26-Nov-13 18-Feb-14 28-May-14 21-Oct-14 18-Dec-14 11-Mar-15 10-Jun-15Sampled by: M. McCracken M. McCracken M. McCracken N. McMillan J. Takahira J. Takahira J. Takahira
UnitWater Level (m) m 4.6 4 4..88 4.85 4.81 4.34 4.47
pH pH 4.95 4.99 5.01 4.45 4.92 4.9 4.94
EC µS/cm 314 276 321 457 432 533 683
Calcium mg/L 2 <1 <1 <1 <1 <1 <1
Alkalinity (CaCO3) mg/L 12 7 21 7 7 2 5
Chloride mg/L 55 53 57 95 91 100 143
Magnesium mg/L 3 2 2 4 3 3 5
Potassium mg/L 8 9 10 11 11 12 12
Sodium mg/L 38 31 36 46 57 46 70
Ammonia (NH4) mg/L 2.28 2.49 3.16 3.78 4.24 4.79 2.6
Sulfate mg/L 43 39 46 41 46 46 48
Total Organic Carbon mg/L 10 6 6 10 7 8 9
Total Dissolved Solids mg/L 210 130 146 244 224 274 356Volume of Water Purge Lt 3 5 3 10 10 15 10
EPL Point #12
BOREHOLE (BH2)QUARTERLY ANALYSIS
Page 8 of 51 Report No: 24005241
0
500
1000
1500
2000
13579
1113
Jan-
11Ap
r-11
Jul-1
1O
ct-1
1Ja
n-12
Apr-1
2Ju
l-12
Oct
-12
Jan-
13Ap
r-13
Jul-1
3O
ct-1
3Ja
n-14
Apr-1
4Ju
l-14
Oct
-14
Jan-
15Ap
r-15
Jul-1
5O
ct-1
5Ja
n-16
EC
pH U
nits
EPL Point #12BH2 pH & EC Trending
pH EC
0
50
100
150
200
250
300
Jan-
11Ap
r-11
Jul-1
1
Oct
-11
Jan-
12
Apr-1
2
Jul-1
2
Oct
-12
Jan-
13Ap
r-13
Jul-1
3
Oct
-13
Jan-
14Ap
r-14
Jul-1
4
Oct
-14
Jan-
15Ap
r-15
Jul-1
5
Oct
-15
Jan-
16
mg/
L
EPL Point #12 BH2 Analysis Trends
Alkalinity, HCO3 (as CaCO3) Chloride, Cl Sodium, Na Total Dissolved Solids
0
2
4
6
8
10
Jan-
11Ap
r-11
Jul-1
1O
ct-1
1Ja
n-12
Apr-1
2Ju
l-12
Oct
-12
Jan-
13Ap
r-13
Jul-1
3O
ct-1
3Ja
n-14
Apr-1
4Ju
l-14
Oct
-14
Jan-
15Ap
r-15
Jul-1
5O
ct-1
5Ja
n-16
Hei
ght (
m)
EPL Point #12BH2 Analysis Trends
Standing Water Level
Page 9 of 51 Report No: 24005241
010203040506070
Jan-
11
Apr-1
1
Jul-1
1
Oct
-11
Jan-
12
Apr-1
2
Jul-1
2
Oct
-12
Jan-
13
Apr-1
3
Jul-1
3
Oct
-13
Jan-
14
Apr-1
4
Jul-1
4
Oct
-14
Jan-
15
Apr-1
5
Jul-1
5
Oct
-15
Jan-
16
mg/
L
EPL Point #12BH2 Analysis Trends
Sulfate, SO4 Potassium, K Calcium, Ca
Magnesium, Mg Total Organic Carbon
02468
101214161820
Jan-
11Ap
r-11
Jul-1
1O
ct-1
1Ja
n-12
Apr-1
2Ju
l-12
Oct
-12
Jan-
13Ap
r-13
Jul-1
3O
ct-1
3Ja
n-14
Apr-1
4Ju
l-14
Oct
-14
Jan-
15Ap
r-15
Jul-1
5O
ct-1
5Ja
n-16
mg/
L
EPL Point #12BH2 Analysis Trends
Ammonia, NH4
Page 10 of 51 Report No: 24005241

Time sampled: 11:10 11:00 12:55 12:35 12:55 13:10 13:50Date sampled: 26-Nov-13 18-Feb-14 28-May-14 21-Oct-14 18-Dec-14 11-Mar-15 10-Jun-15Sampled by: M. McCracken M. McCracken M. McCracken N. McMillan J. Takahira J. Takahira J. Takahira
UnitWater Level (m) m 12.1 12.08 12.08 12.46 12.1 11.97 12.05
pH pH 5.82 5.99 6.07 5.49 5.82 6.01 5.9
EC µS/cm 299 262 294 312 283 328 308
Calcium mg/L 1 1 2 2 2 2 1
Alkalinity (CaCO3) mg/L 15 28 41 33 30 37 40
Chloride mg/L 54 54 53 64 56 53 48
Magnesium mg/L 6 6 6 7 7 7 7
Potassium mg/L 1 <1 1 1 <1 1 <1
Sodium mg/L 23 19 21 22 25 21 18
Ammonia (NH4) mg/L 0.45 0.38 <0.01 0.38 0.4 0.04 0.37
Sulfate mg/L 9 9 11 10 10 9 10
Total Organic Carbon mg/L 6 4 4 5 1 2 2
Total Dissolved Solids mg/L 152 146 110 176 106 178 158
Volume of Water Purge Lt 3 4 5 10 5 10 6
EPL Point #14
BOREHOLE (BH4)QUARTERLY ANALYSIS
Page 11 of 51 Report No: 24005241

050100150200250300350
13579
1113
Jan-
11Ap
r-11
Jul-1
1O
ct-1
1Ja
n-12
Apr-1
2Ju
l-12
Oct
-12
Jan-
13Ap
r-13
Jul-1
3O
ct-1
3Ja
n-14
Apr-1
4Ju
l-14
Oct
-14
Jan-
15Ap
r-15
Jul-1
5O
ct-1
5Ja
n-16
EC
pH U
nits
EPL Point #14 BH4 pH & EC Trending
pH EC
0
50
100
150
200
250
Jan-
11Ap
r-11
Jul-1
1O
ct-1
1Ja
n-12
Apr-1
2Ju
l-12
Oct
-12
Jan-
13Ap
r-13
Jul-1
3O
ct-1
3Ja
n-14
Apr-1
4Ju
l-14
Oct
-14
Jan-
15Ap
r-15
Jul-1
5O
ct-1
5Ja
n-16
mg/
L
EPL Point #14BH4 Analysis Trends
Alkalinity, HCO3 (as CaCO3) Chloride, Cl Sodium, Na Total Dissolved Solids
0
5
10
15
20
Jan-
11Ap
r-11
Jul-1
1O
ct-1
1Ja
n-12
Apr-1
2Ju
l-12
Oct
-12
Jan-
13Ap
r-13
Jul-1
3O
ct-1
3Ja
n-14
Apr-1
4Ju
l-14
Oct
-14
Jan-
15Ap
r-15
Jul-1
5O
ct-1
5Ja
n-16
Hei
ght (
m)
EPL Point #14BH4 Analysis Trends
Standing Water Level
Page 12 of 51 Report No: 24005241
0
4
8
12
16
20
Jan-
11
Apr-1
1
Jul-1
1
Oct
-11
Jan-
12
Apr-1
2
Jul-1
2
Oct
-12
Jan-
13
Apr-1
3
Jul-1
3
Oct
-13
Jan-
14
Apr-1
4
Jul-1
4
Oct
-14
Jan-
15
Apr-1
5
Jul-1
5
Oct
-15
Jan-
16
mg/
L
EPL Point #14BH4 Analysis Trends
Sulfate, SO4 Potassium, K Calcium, CaMagnesium, Mg Total Organic Carbon
00.10.20.30.40.50.60.7
Jan-
11Ap
r-11
Jul-1
1O
ct-1
1Ja
n-12
Apr-1
2Ju
l-12
Oct
-12
Jan-
13Ap
r-13
Jul-1
3O
ct-1
3Ja
n-14
Apr-1
4Ju
l-14
Oct
-14
Jan-
15Ap
r-15
Jul-1
5O
ct-1
5Ja
n-16
mg/
L
EPL Point #14BH4 Analysis Trends
Ammonia, NH4
Page 13 of 51 Report No: 24005241
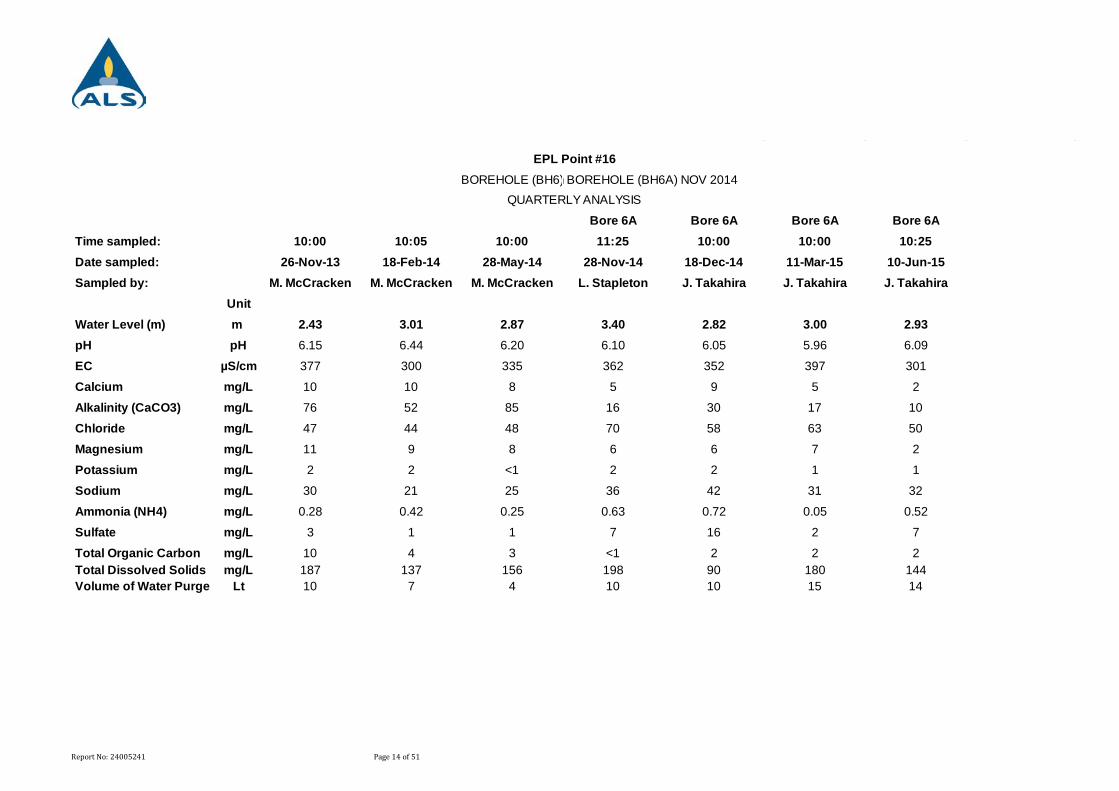
BOREHOLE (BH6) h BOREHOLE (BH6A) NOV 2014
Bore 6A Bore 6A Bore 6A Bore 6ATime sampled: 10:00 10:05 10:00 11:25 10:00 10:00 10:25Date sampled: 26-Nov-13 18-Feb-14 28-May-14 28-Nov-14 18-Dec-14 11-Mar-15 10-Jun-15Sampled by: M. McCracken M. McCracken M. McCracken L. Stapleton J. Takahira J. Takahira J. Takahira
UnitWater Level (m) m 2.43 3.01 2.87 3.40 2.82 3.00 2.93pH pH 6.15 6.44 6.20 6.10 6.05 5.96 6.09
EC µS/cm 377 300 335 362 352 397 301
Calcium mg/L 10 10 8 5 9 5 2
Alkalinity (CaCO3) mg/L 76 52 85 16 30 17 10
Chloride mg/L 47 44 48 70 58 63 50
Magnesium mg/L 11 9 8 6 6 7 2
Potassium mg/L 2 2 <1 2 2 1 1
Sodium mg/L 30 21 25 36 42 31 32
Ammonia (NH4) mg/L 0.28 0.42 0.25 0.63 0.72 0.05 0.52
Sulfate mg/L 3 1 1 7 16 2 7
Total Organic Carbon mg/L 10 4 3 <1 2 2 2Total Dissolved Solids mg/L 187 137 156 198 90 180 144Volume of Water Purge Lt 10 7 4 10 10 15 14
EPL Point #16
QUARTERLY ANALYSIS
Page 14 of 51 Report No: 24005241

0100200300400500600700800
13579
1113
Jan-
11Ap
r-11
Jul-1
1O
ct-1
1Ja
n-12
Apr-1
2Ju
l-12
Oct
-12
Jan-
13Ap
r-13
Jul-1
3O
ct-1
3Ja
n-14
Apr-1
4Ju
l-14
Oct
-14
Jan-
15Ap
r-15
Jul-1
5O
ct-1
5Ja
n-16
EC
pH U
nits
EPL Point #16BH6 pH & EC Trending
pH EC
050
100150200250300350400
Jan-
11Ap
r-11
Jul-1
1
Oct
-11
Jan-
12Ap
r-12
Jul-1
2
Oct
-12
Jan-
13Ap
r-13
Jul-1
3
Oct
-13
Jan-
14Ap
r-14
Jul-1
4
Oct
-14
Jan-
15Ap
r-15
Jul-1
5
Oct
-15
Jan-
16
mg/
L
EPL Point #16BH6 Analysis Trends
Alkalinity, HCO3 (as CaCO3) Chloride, Cl Sodium, Na Total Dissolved Solids
0
1
2
3
4
5
Jan-
11Ap
r-11
Jul-1
1O
ct-1
1Ja
n-12
Apr-1
2Ju
l-12
Oct
-12
Jan-
13Ap
r-13
Jul-1
3O
ct-1
3Ja
n-14
Apr-1
4Ju
l-14
Oct
-14
Jan-
15Ap
r-15
Jul-1
5O
ct-1
5Ja
n-16
Hei
ght (
m)
EPL Point #16BH6 Analysis Trends
Standing Water Level
Page 15 of 51 Report No: 24005241

0
10
20
30
40
50
Jan-
11
Apr-1
1
Jul-1
1
Oct
-11
Jan-
12
Apr-1
2
Jul-1
2
Oct
-12
Jan-
13
Apr-1
3
Jul-1
3
Oct
-13
Jan-
14
Apr-1
4
Jul-1
4
Oct
-14
Jan-
15
Apr-1
5
Jul-1
5
Oct
-15
Jan-
16
mg/
L
EPL Point #16BH6 Analysis Trends
Sulfate, SO4 Potassium, K Calcium, Ca
Magnesium, Mg Total Organic Carbon
00.10.20.30.40.50.60.70.80.9
1
Jan-
11Ap
r-11
Jul-1
1O
ct-1
1Ja
n-12
Apr-1
2Ju
l-12
Oct
-12
Jan-
13Ap
r-13
Jul-1
3O
ct-1
3Ja
n-14
Apr-1
4Ju
l-14
Oct
-14
Jan-
15Ap
r-15
Jul-1
5O
ct-1
5Ja
n-16
mg/
L
EPL Point #16 BH6 Analysis Trends
Ammonia, NH4
Page 16 of 51 Report No: 24005241

Time sampled: 10:40 11:10 10:55 10:50 13:55 13:55 13:45Date sampled: 26-Nov-13 18-Feb-14 28-May-14 21-Oct-14 18-Dec-14 11-Mar-15 10-Jun-15Sampled by: M. McCracken M. McCracken M. McCracken N. McMillan J. Takahira J. Takahira J. Takahira
UnitWater Level (m) m 3.62 3.70 3.65 3.57 4.86 4.62 4.42
pH pH 5.89 6.14 6.06 5.6 6.28 5.95 6.06
EC µS/cm 202 175 194 220 188 224 206
Calcium mg/L 2 1 1 2 2 1 1
Alkalinity (CaCO3) mg/L 28 26 41 28 18 29 32
Chloride mg/L 35 31 33 40 38 34 29
Magnesium mg/L 6 4 4 5 5 5 5
Potassium mg/L 2 <1 <1 1 1 <1 <1
Sodium mg/L 16 13 14 14 17 14 12
Ammonia (NH4) mg/L 0.02 <0.01 <0.01 0.35 0.49 0.04 0.28
Sulfate mg/L 3 2 3 3 2 3 3
Total Organic Carbon mg/L 4 2 1 7 <1 2 1Total Dissolved Solids mg/L 78 82 134 144 80 130 104Volume of Water Purge Lt 5 3 4 10 5 10 8
EPL Point #17
BOREHOLE (BH7)QUARTERLY ANALYSIS
Page 17 of 51 Report No: 24005241

0
500
1000
1500
1
3
5
7
9
11
13
Jan-
11A
pr-1
1Ju
l-11
Oct
-11
Jan-
12A
pr-1
2Ju
l-12
Oct
-12
Jan-
13A
pr-1
3Ju
l-13
Oct
-13
Jan-
14A
pr-1
4Ju
l-14
Oct
-14
Jan-
15A
pr-1
5Ju
l-15
Oct
-15
Jan-
16
EC
pH u
nits
EPL Point #17BH7 pH & EC Trending
pH EC
0
50
100
150
200
250
Jan-
11Ap
r-11
Jul-1
1O
ct-1
1Ja
n-12
Apr-1
2Ju
l-12
Oct
-12
Jan-
13Ap
r-13
Jul-1
3O
ct-1
3Ja
n-14
Apr-1
4Ju
l-14
Oct
-14
Jan-
15Ap
r-15
Jul-1
5O
ct-1
5Ja
n-16
mg/
L
EPL Point #17BH7 Analysis Trends
Alkalinity, HCO3 (as CaCO3) Chloride, ClSodium, Na Total Dissolved Solids
0
1
2
3
4
5
Jan-
11A
pr-1
1Ju
l-11
Oct
-11
Jan-
12A
pr-1
2Ju
l-12
Oct
-12
Jan-
13A
pr-1
3Ju
l-13
Oct
-13
Jan-
14A
pr-1
4Ju
l-14
Oct
-14
Jan-
15A
pr-1
5Ju
l-15
Oct
-15
Jan-
16
Hei
ght (
m)
EPL Point # 17BH7 Analysis Trends
Standing Water Level
Page 18 of 51 Report No: 24005241

0
5
10
15
20
Jan-
11
Apr-1
1
Jul-1
1
Oct
-11
Jan-
12
Apr-1
2
Jul-1
2
Oct
-12
Jan-
13
Apr-1
3
Jul-1
3
Oct
-13
Jan-
14
Apr-1
4
Jul-1
4
Oct
-14
Jan-
15
Apr-1
5
Jul-1
5
Oct
-15
Jan-
16
mg/
L
EPL Poimt #17BH7 Analysis Trends
Sulfate, SO4 Potassium, K Calcium, Ca
Magnesium, Mg Total Organic Carbon
0
0.1
0.2
0.3
0.4
0.5
Jan-
11Ap
r-11
Jul-1
1O
ct-1
1Ja
n-12
Apr-1
2Ju
l-12
Oct
-12
Jan-
13Ap
r-13
Jul-1
3O
ct-1
3Ja
n-14
Apr-1
4Ju
l-14
Oct
-14
Jan-
15Ap
r-15
Jul-1
5O
ct-1
5Ja
n-16
mg/
L
EPL Point #17BH7 Analysis Trends
Ammonia, NH4
Page 19 of 51 Report No: 24005241

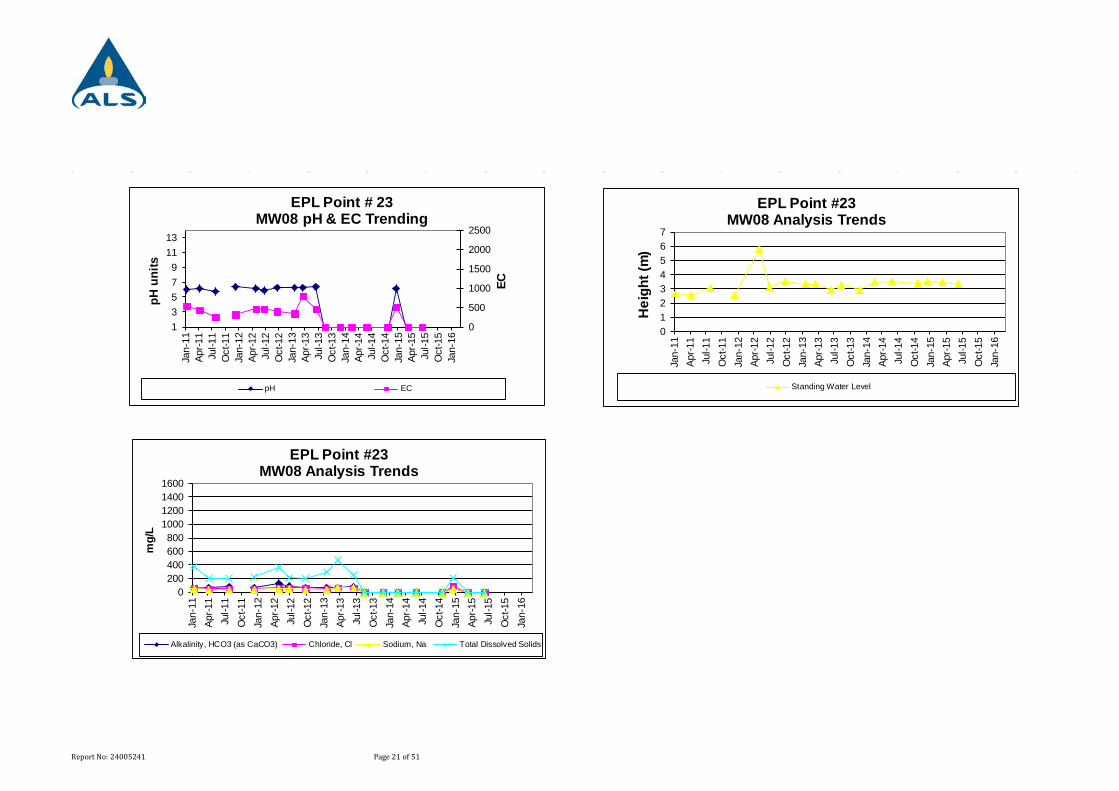
Time sampled: 11:55 12:50 12:40 12:15 12:30 12:55 13:30Date sampled: 26-Nov-13 18-Feb-14 28-May-14 21-Oct-14 18-Dec-14 11-Mar-15 10-Jun-15Sampled by: M. McCracken M. McCracken M. McCracken N. McMillan J. Takahira J. Takahira J. Takahira
UnitWater Level (m) m 2.95 3.46 3.54 3.42 3.52 3.50 3.37
pH pH NS NS NS NS 6.13 NS NS
EC µS/cm NS NS NS NS 502 NS NS
Calcium mg/L NS NS NS NS 5 NS NS
Alkalinity (CaCO3) mg/L NS NS NS NS 48 NS NS
Chloride mg/L NS NS NS NS 84 NS NS
Magnesium mg/L NS NS NS NS 9 NS NS
Potassium mg/L NS NS NS NS 26 NS NS
Sodium mg/L NS NS NS NS 49 NS NS
Ammonia (NH4) mg/L NS NS NS NS 7.84 NS NS
Sulfate mg/L NS NS NS NS 36 NS NSTotal Organic Carbon mg/L NS NS NS NS 9 NS NSTotal Dissolved Solids mg/L NS NS NS NS 206 NS NSVolume of Water Purge Lt 1
NS: No sample
EPL Point #23BOREHOLE (MW08)
QUARTERLY ANALYSIS
Page 20 of 51 Report No: 24005241
0
500
1000
1500
2000
2500
13579
1113
Jan-
11Ap
r-11
Jul-1
1O
ct-1
1Ja
n-12
Apr-1
2Ju
l-12
Oct
-12
Jan-
13Ap
r-13
Jul-1
3O
ct-1
3Ja
n-14
Apr-1
4Ju
l-14
Oct
-14
Jan-
15Ap
r-15
Jul-1
5O
ct-1
5Ja
n-16
EC
pH u
nits
EPL Point # 23MW08 pH & EC Trending
pH EC
0200400600800
1000120014001600
Jan-
11Ap
r-11
Jul-1
1O
ct-1
1Ja
n-12
Apr-1
2Ju
l-12
Oct
-12
Jan-
13Ap
r-13
Jul-1
3O
ct-1
3Ja
n-14
Apr-1
4Ju
l-14
Oct
-14
Jan-
15Ap
r-15
Jul-1
5O
ct-1
5Ja
n-16
mg/
L
EPL Point #23 MW08 Analysis Trends
Alkalinity, HCO3 (as CaCO3) Chloride, Cl Sodium, Na Total Dissolved Solids
01234567
Jan-
11Ap
r-11
Jul-1
1O
ct-1
1Ja
n-12
Apr-1
2Ju
l-12
Oct
-12
Jan-
13Ap
r-13
Jul-1
3O
ct-1
3Ja
n-14
Apr-1
4Ju
l-14
Oct
-14
Jan-
15Ap
r-15
Jul-1
5O
ct-1
5Ja
n-16
Hei
ght (
m)
EPL Point #23MW08 Analysis Trends
Standing Water Level
Page 21 of 51 Report No: 24005241

050
100150200250300350400450
Jan-
11
Apr-1
1
Jul-1
1
Oct
-11
Jan-
12
Apr-1
2
Jul-1
2
Oct
-12
Jan-
13
Apr-1
3
Jul-1
3
Oct
-13
Jan-
14
Apr-1
4
Jul-1
4
Oct
-14
Jan-
15
Apr-1
5
Jul-1
5
Oct
-15
Jan-
16
mg/
L
EPL Point #23 MW08 Analysis Trends
Sulfate, SO4 Potassium, K Calcium, Ca
Magnesium, Mg Total Organic Carbon
0
10
20
30
40
50
Jan-
11Ap
r-11
Jul-1
1O
ct-1
1Ja
n-12
Apr-1
2Ju
l-12
Oct
-12
Jan-
13Ap
r-13
Jul-1
3O
ct-1
3Ja
n-14
Apr-1
4Ju
l-14
Oct
-14
Jan-
15Ap
r-15
Jul-1
5O
ct-1
5Ja
n-16
mg/
L
EPL Point #23MW08 Analysis Trends
Ammonia, NH4
Page 22 of 51 Report No: 24005241

Time sampled: 12:10 12:40 12:30 12:25 12:30 12:40 13:20Date sampled: 26-Nov-13 18-Feb-14 28-May-14 21-Oct-14 18-Dec-14 11-Mar-15 10-Jun-15Sampled by: M. McCracken M. McCracken M. McCracken N. McMillan J. Takahira J. Takahira J. Takahira
UnitWater Level (m) m 2.95 2.85 3.60 3.39 2.25 3.44 2.94pH pH 5.47 6.09 5.99 5.55 5.75 5.6 5.85
EC µS/cm 253 216 267 330 501 618 390
Calcium mg/L <1 <1 1 2 4 5 2
Alkalinity (CaCO3) mg/L 43 37 37 30 52 50 39
Chloride mg/L 42 40 46 60 96 88 51
Magnesium mg/L 2 2 2 4 9 9 3
Potassium mg/L 15 16 17 16 24 26 20
Sodium mg/L 30 24 25 29 49 46 37Ammonia (NH4) mg/L 5.68 5.93 6.19 6.33 10 9.9 6.02Sulfate mg/L 11 9 11 20 21 60 32Total Organic Carbon mg/L 10 10 18 18 6 10 9Total Dissolved Solids mg/L 114 72 118 164 230 286 190Volume of Water Purge Lt 3 4 4 10 10 10 4
EPL Point #24BOREHOLE (MW09)
QUARTERLY ANALYSIS
Page 23 of 51 Report No: 24005241

010002000300040005000
13579
1113
Jan-
11Ap
r-11
Jul-1
1O
ct-1
1Ja
n-12
Apr-1
2Ju
l-12
Oct
-12
Jan-
13Ap
r-13
Jul-1
3O
ct-1
3Ja
n-14
Apr-1
4Ju
l-14
Oct
-14
Jan-
15Ap
r-15
Jul-1
5O
ct-1
5Ja
n-16 EC
(uS/
cm)
pH
Date
EPL Point #24MW09 pH & EC Trending
pH EC
0200400600800
100012001400160018002000
Jan-
11Ap
r-11
Jul-1
1O
ct-1
1Ja
n-12
Apr-1
2Ju
l-12
Oct
-12
Jan-
13Ap
r-13
Jul-1
3O
ct-1
3Ja
n-14
Apr-1
4Ju
l-14
Oct
-14
Jan-
15Ap
r-15
Jul-1
5O
ct-1
5Ja
n-16
mg/
L
EPL Point #24 MW09 Analysis Trends
Alkalinity, HCO3 (as CaCO3) Chloride, Cl Sodium, Na Total Dissolved Solids
012345
Jan-
11Ap
r-11
Jul-1
1O
ct-1
1Ja
n-12
Apr-1
2Ju
l-12
Oct
-12
Jan-
13Ap
r-13
Jul-1
3O
ct-1
3Ja
n-14
Apr-1
4Ju
l-14
Oct
-14
Jan-
15Ap
r-15
Jul-1
5O
ct-1
5Ja
n-16
Heig
ht (m
)
Date
EPL Point #24MW09 Analysis Trends
Standing Water Level
Page 24 of 51 Report No: 24005241

0
100
200
300
400
Jan-
11
Apr-1
1
Jul-1
1
Oct
-11
Jan-
12
Apr-1
2
Jul-1
2
Oct
-12
Jan-
13
Apr-1
3
Jul-1
3
Oct
-13
Jan-
14
Apr-1
4
Jul-1
4
Oct
-14
Jan-
15
Apr-1
5
Jul-1
5
Oct
-15
Jan-
16
mg/
L
EPL Point #24MW09 Analysis Trends
Sulfate, SO4 Potassium, K Calcium, CaMagnesium, Mg Total Organic Carbon
0
10
20
30
40
50
Jan-
11Ap
r-11
Jul-1
1O
ct-1
1Ja
n-12
Apr-1
2Ju
l-12
Oct
-12
Jan-
13Ap
r-13
Jul-1
3O
ct-1
3Ja
n-14
Apr-1
4Ju
l-14
Oct
-14
Jan-
15Ap
r-15
Jul-1
5O
ct-1
5Ja
n-16
mg/
L
EPL Point #24MW09 Analysis Trends
Ammonia, NH4
Page 25 of 51 Report No: 24005241

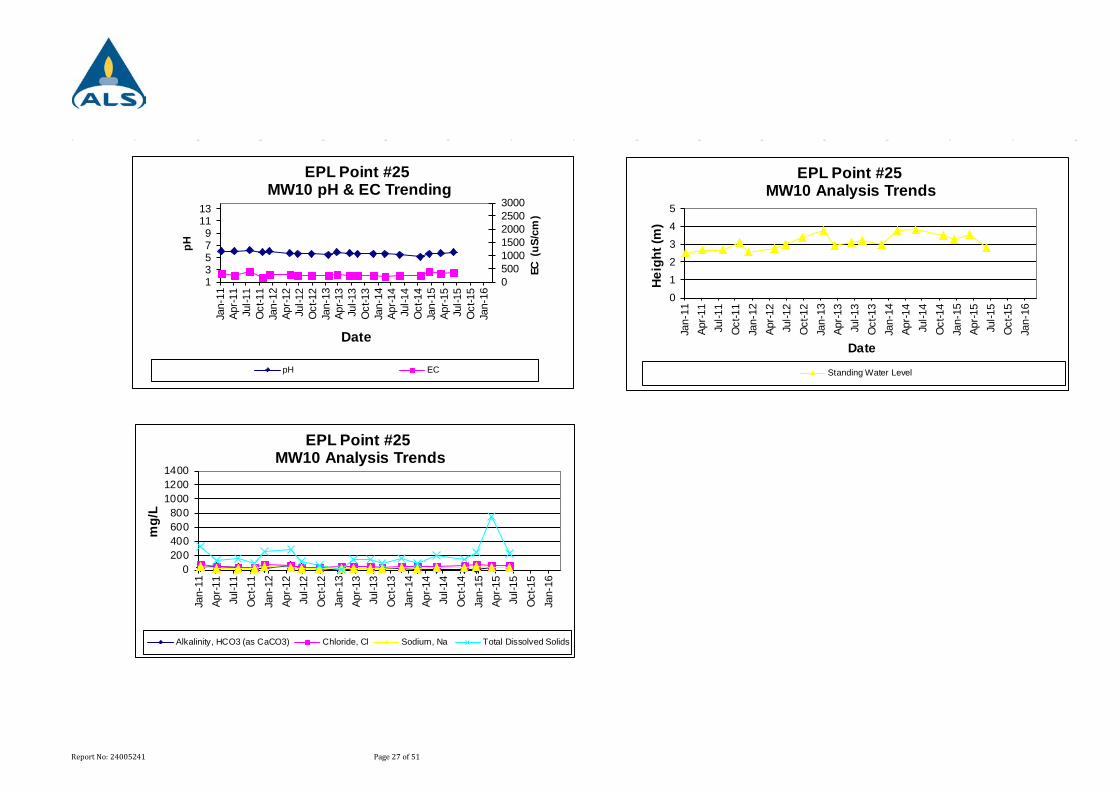
Time sampled: 12:20 12:25 12:20 12:30 12:20 12:25 13:05Date sampled: 26-Nov-13 18-Feb-14 28-May-14 21-Oct-14 18-Dec-14 11-Mar-15 10-Jun-15Sampled by: M. McCracken M. McCracken M. McCracken N. McMillan J. Takahira J. Takahira J. Takahira
UnitWater Level (m) m 2.99 3.74 3.81 3.50 3.29 3.57 2.82pH pH 5.59 5.56 5.47 5.05 5.56 5.67 5.97
EC µS/cm 223 196 226 250 375 307 363
Calcium mg/L 2 1 2 2 9 2 7
Alkalinity (CaCO3) mg/L 27 9 8 6 4 36 28
Chloride mg/L 45 43 47 57 74 64 57
Magnesium mg/L 2 1 1 2 6 2 3
Potassium mg/L 8 7 7 7 14 8 22
Sodium mg/L 29 24 33 28 42 31 35
Ammonia (NH4) mg/L 4.12 4.43 5.03 3.52 3.3 8.6 1.72
Sulfate mg/L 14 14 25 14 23 26 22
Total Organic Carbon mg/L 12 10 22 32 10 212 16
Total Dissolved Solids mg/L 160 90 204 148 244 760 225
Volume of Water Purge Lt 2 2 2 5 4 5 8
EPL Point #25BOREHOLE (MW10)
QUARTERLY ANALYSIS
Page 26 of 51 Report No: 24005241
050010001500200025003000
13579
1113
Jan-
11Ap
r-11
Jul-1
1O
ct-1
1Ja
n-12
Apr-1
2Ju
l-12
Oct
-12
Jan-
13Ap
r-13
Jul-1
3O
ct-1
3Ja
n-14
Apr-1
4Ju
l-14
Oct
-14
Jan-
15Ap
r-15
Jul-1
5O
ct-1
5Ja
n-16
EC (
uS/c
m)
pH
Date
EPL Point #25MW10 pH & EC Trending
pH EC
0200400600800
100012001400
Jan-
11Ap
r-11
Jul-1
1O
ct-1
1Ja
n-12
Apr-1
2Ju
l-12
Oct
-12
Jan-
13Ap
r-13
Jul-1
3O
ct-1
3Ja
n-14
Apr-1
4Ju
l-14
Oct
-14
Jan-
15Ap
r-15
Jul-1
5O
ct-1
5Ja
n-16
mg/
L
EPL Point #25MW10 Analysis Trends
Alkalinity, HCO3 (as CaCO3) Chloride, Cl Sodium, Na Total Dissolved Solids
012345
Jan-
11Ap
r-11
Jul-1
1O
ct-1
1Ja
n-12
Apr-1
2Ju
l-12
Oct
-12
Jan-
13Ap
r-13
Jul-1
3O
ct-1
3Ja
n-14
Apr-1
4Ju
l-14
Oct
-14
Jan-
15Ap
r-15
Jul-1
5O
ct-1
5Ja
n-16
Heig
ht (m
)
Date
EPL Point #25MW10 Analysis Trends
Standing Water Level
Page 27 of 51 Report No: 24005241

0
50
100
150
200
250
Jan-
11
Apr-1
1
Jul-1
1
Oct
-11
Jan-
12
Apr-1
2
Jul-1
2
Oct
-12
Jan-
13
Apr-1
3
Jul-1
3
Oct
-13
Jan-
14
Apr-1
4
Jul-1
4
Oct
-14
Jan-
15
Apr-1
5
Jul-1
5
Oct
-15
Jan-
16
mg/
L
EPL Point #25MW10 Analysis Trends
Sulfate, SO4 Potassium, K Calcium, Ca
Magnesium, Mg Total Organic Carbon
0
20
40
60
80
100
Jan-
11Ap
r-11
Jul-1
1O
ct-1
1Ja
n-12
Apr-1
2Ju
l-12
Oct
-12
Jan-
13Ap
r-13
Jul-1
3O
ct-1
3Ja
n-14
Apr-1
4Ju
l-14
Oct
-14
Jan-
15Ap
r-15
Jul-1
5O
ct-1
5Ja
n-16
mg/
L
EPL Point #25MW10 Analysis Trends
Ammonia, NH4
Page 28 of 51 Report No: 24005241

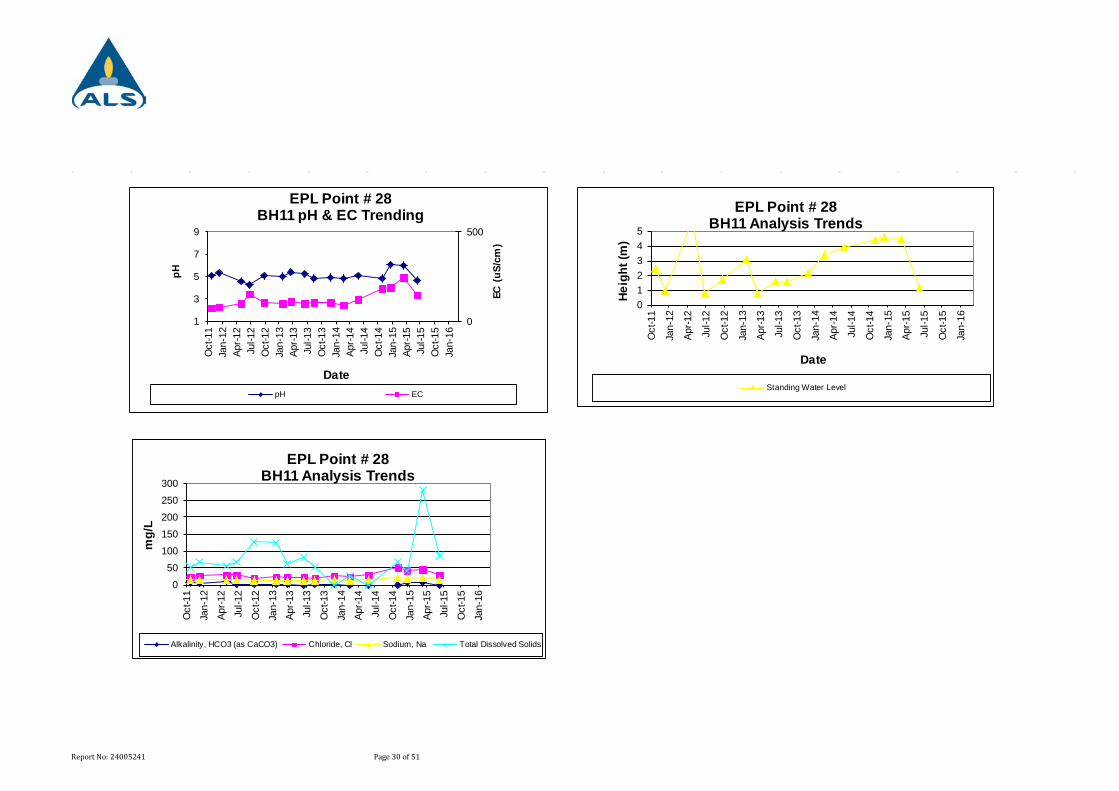
Time sampled: 11:45 11:55 11:45 10:45 11:45 11:50 11:45Date sampled: 26-Nov-13 18-Feb-14 28-May-14 29-Oct-14 18-Dec-14 11-Mar-15 10-Jun-15Sampled by: M. McCracken M. McCracken M. McCracken N. McMillan J. Takahira J. Takahira J. Takahira
UnitWater Level (m) m 2.18 3.39 3.88 4.39 4.58 4.46 1.13pH pH 4.91 4.85 5.08 4.86 6.07 6.02 4.69EC µS/cm 104 91 121 183 191 244 146Calcium mg/L 1 <1 <1 2 <1 <1 <1Alkalinity (CaCO3) mg/L 2 <1 <1 <1 6 7 <1Chloride mg/L 27 23 30 51 42 45 29Magnesium mg/L 2 1 2 3 4 4 2Potassium mg/L 3 2 3 3 1 2 2Sodium mg/L 14 12 15 20 19 21 15Ammonia (NH4) mg/L 0.02 0.33 0.35 0.02 0.44 0.59 0.01Sulfate mg/L 8 7 6 4 2 1 6Total Organic Carbon mg/L 6 7 20 5 4 7 2Total Dissolved Solids mg/L <5 27 <10 68 40 280 87Volume of Water Purge Lt 3 3 2 0 0 1 20
EPL Point 28BOREHOLE (MW11)
QUARTERLY ANALYSIS
Page 29 of 51 Report No: 24005241
0
500
1
3
5
7
9
Oct
-11
Jan-
12Ap
r-12
Jul-1
2O
ct-1
2Ja
n-13
Apr-1
3Ju
l-13
Oct
-13
Jan-
14Ap
r-14
Jul-1
4O
ct-1
4Ja
n-15
Apr-1
5Ju
l-15
Oct
-15
Jan-
16
EC (
uS/c
m)
pH
Date
EPL Point # 28 BH11 pH & EC Trending
pH EC
0
50
100
150
200
250
300
Oct
-11
Jan-
12
Apr-1
2
Jul-1
2
Oct
-12
Jan-
13
Apr-1
3
Jul-1
3
Oct
-13
Jan-
14
Apr-1
4
Jul-1
4
Oct
-14
Jan-
15
Apr-1
5
Jul-1
5
Oct
-15
Jan-
16
mg/
L
EPL Point # 28 BH11 Analysis Trends
Alkalinity, HCO3 (as CaCO3) Chloride, Cl Sodium, Na Total Dissolved Solids
012345
Oct
-11
Jan-
12
Apr-1
2
Jul-1
2
Oct
-12
Jan-
13
Apr-1
3
Jul-1
3
Oct
-13
Jan-
14
Apr-1
4
Jul-1
4
Oct
-14
Jan-
15
Apr-1
5
Jul-1
5
Oct
-15
Jan-
16
Heig
ht (m
)
Date
EPL Point # 28 BH11 Analysis Trends
Standing Water Level
Page 30 of 51 Report No: 24005241

0
5
10
15
20
25
Oct
-11
Jan-
12Ap
r-12
Jul-1
2O
ct-1
2Ja
n-13
Apr-1
3Ju
l-13
Oct
-13
Jan-
14Ap
r-14
Jul-1
4O
ct-1
4Ja
n-15
Apr-1
5Ju
l-15
Oct
-15
Jan-
16
mg/
L
EPL Point # 28 BH11 Analysis Trends
Sulfate, SO4 Potassium, K Calcium, Ca
Magnesium, Mg Total Organic Carbon
00.050.1
0.150.2
0.250.3
0.350.4
Oct
-11
Jan-
12
Apr-1
2
Jul-1
2
Oct
-12
Jan-
13
Apr-1
3
Jul-1
3
Oct
-13
Jan-
14
Apr-1
4
Jul-1
4
Oct
-14
Jan-
15
Apr-1
5
Jul-1
5
Oct
-15
Jan-
16
mg/
L
EPL Point # 28 BH11 Analysis Trends
Ammonia, NH4
Page 31 of 51 Report No: 24005241

APPENDIX C – SURFACE WATER MONITORING
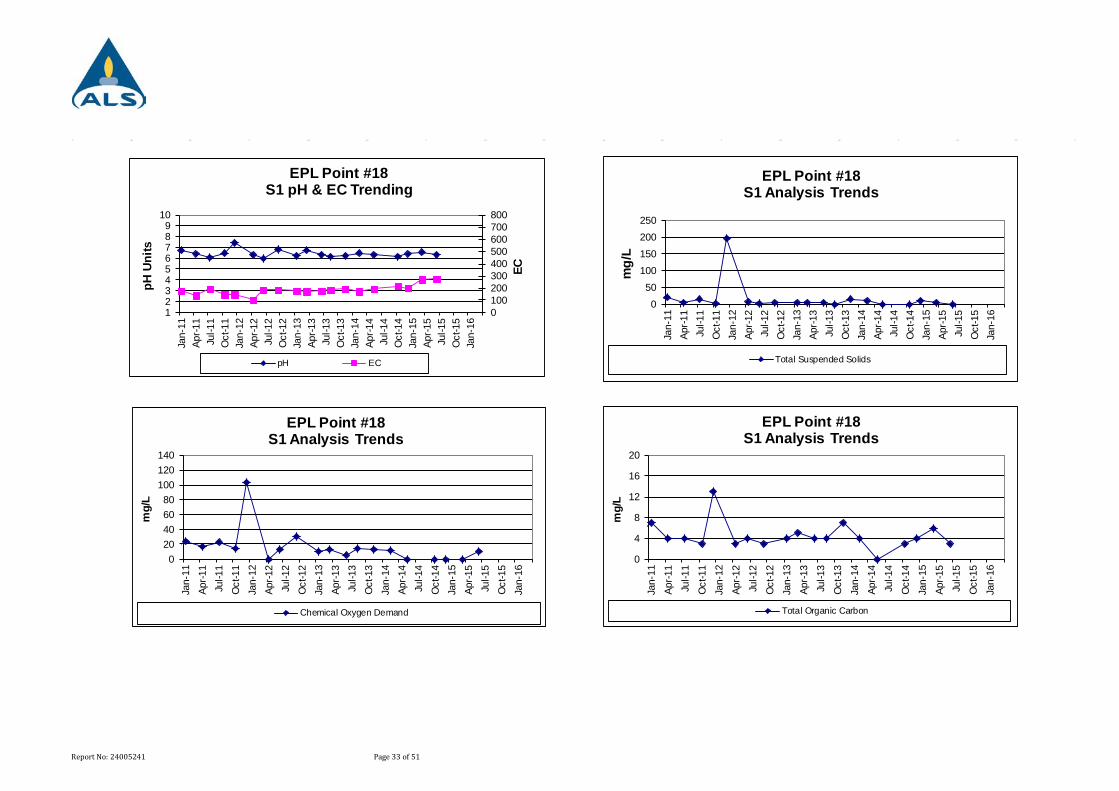
Time sampled: 10:55 13:00 11:40 13:00 13:20 13:45 14:00Date sampled: 26-Nov-13 18-Feb-14 28-May-14 21-Oct-14 18-Dec-14 11-Mar-15 10-Jun-15Sampled by: M. McCracken M. McCracken M. McCracken N. McMillan J. Takahira J. Takahira J. Takahira
UnitpH pH 6.24 6.48 6.32 6.12 6.4 6.6 6.31
EC µS/cm 194 169 193 214 198 266 274
Ammonia (NH4) mg/L 0.5 0.44 0.37 0.45 0.7 0.72 0.91
Total Organic Carbon mg/L 7 4 <1 3 4 6 3
Total Suspended Solids mg/L 16 10 <10 <10 10 5 <5BOD mg/L 3 <2 <2 <2 <2 <2 <2Chemical Oxygen Demand mg/L 13 12 <10 <10 <10 <10 11
EPL Point #18
SURFACE WATER (S1)QUARTERLY ANALYSIS
Page 32 of 51 Report No: 24005241
0100200300400500600700800
123456789
10
Jan-
11Ap
r-11
Jul-1
1O
ct-1
1Ja
n-12
Apr-1
2Ju
l-12
Oct
-12
Jan-
13Ap
r-13
Jul-1
3O
ct-1
3Ja
n-14
Apr-1
4Ju
l-14
Oct
-14
Jan-
15Ap
r-15
Jul-1
5O
ct-1
5Ja
n-16
EC
pH U
nits
EPL Point #18S1 pH & EC Trending
pH EC
020406080
100120140
Jan-
11Ap
r-11
Jul-1
1O
ct-1
1Ja
n-12
Apr-1
2Ju
l-12
Oct
-12
Jan-
13Ap
r-13
Jul-1
3O
ct-1
3Ja
n-14
Apr-1
4Ju
l-14
Oct
-14
Jan-
15Ap
r-15
Jul-1
5O
ct-1
5Ja
n-16
mg/
L
EPL Point #18S1 Analysis Trends
Chemical Oxygen Demand
050
100150200250
Jan-
11Ap
r-11
Jul-1
1O
ct-1
1Ja
n-12
Apr-1
2Ju
l-12
Oct
-12
Jan-
13Ap
r-13
Jul-1
3O
ct-1
3Ja
n-14
Apr-1
4Ju
l-14
Oct
-14
Jan-
15Ap
r-15
Jul-1
5O
ct-1
5Ja
n-16
mg/
L
EPL Point #18S1 Analysis Trends
Total Suspended Solids
0
4
8
12
16
20
Jan-
11
Apr-1
1
Jul-1
1
Oct
-11
Jan-
12
Apr-1
2
Jul-1
2
Oct
-12
Jan-
13
Apr-1
3
Jul-1
3
Oct
-13
Jan-
14
Apr-1
4
Jul-1
4
Oct
-14
Jan-
15
Apr-1
5
Jul-1
5
Oct
-15
Jan-
16
mg/
L
EPL Point #18S1 Analysis Trends
Total Organic Carbon
Page 33 of 51 Report No: 24005241

0
5
10
15
20
25
Jan-
11Ap
r-11
Jul-1
1O
ct-1
1Ja
n-12
Apr-1
2Ju
l-12
Oct
-12
Jan-
13Ap
r-13
Jul-1
3O
ct-1
3Ja
n-14
Apr-1
4Ju
l-14
Oct
-14
Jan-
15Ap
r-15
Jul-1
5O
ct-1
5Ja
n-16
mg/
L
EPL Point #18S1 Analysis Trends
Ammonia, NH4
02468
10121416
Jan-
11Ap
r-11
Jul-1
1O
ct-1
1Ja
n-12
Apr-1
2Ju
l-12
Oct
-12
Jan-
13Ap
r-13
Jul-1
3O
ct-1
3Ja
n-14
Apr-1
4Ju
l-14
Oct
-14
Jan-
15Ap
r-15
Jul-1
5O
ct-1
5Ja
n-16
mg/
L
EPL Point #18S1 Analysis Trends
BOD
Page 34 of 51 Report No: 24005241

Time sampled: 10:25 10:25 10:10 11:05 10:20 10:20 10:45Date sampled: 26-Nov-13 18-Feb-14 28-May-14 21-Oct-14 18-Dec-14 11-Mar-15 10-Jun-15Sampled by: M. McCracken M. McCracken M. McCracken N. McMillan J. Takahira J. Takahira J. Takahira
UnitpH pH 5.76 4.7 4.75 4.34 6.04 4.5 4.94
EC µS/cm 126 126 157 121 97 182 161
Ammonia (NH4) mg/L 0.02 0.01 0.03 0.01 0.03 0.02 <0.01
Total Organic Carbon mg/L 6 5 <1 4 5 2 2
Total Suspended Solids mg/L <5 <5 <10 <10 <5 <5 <5
BOD mg/L <2 <2 <2 3 <2 <2 <2
Chemical Oxygen Demand mg/L 11 13 <10 <10 12 <10 <10
EPL Point #20
SURFACE WATER (S3)
QUARTERLY ANALYSIS
Page 35 of 51 Report No: 24005241
050100150200250300
13579
1113
EC
pH U
nits
EPL Point #20S3 pH & EC Trending
pH EC
020406080
100120140
Jan-
11Ap
r-11
Jul-1
1O
ct-1
1Ja
n-12
Apr-1
2Ju
l-12
Oct
-12
Jan-
13Ap
r-13
Jul-1
3O
ct-1
3Ja
n-14
Apr-1
4Ju
l-14
Oct
-14
Jan-
15Ap
r-15
Jul-1
5O
ct-1
5Ja
n-16
mg/
L
EPL Point #20S3 Analysis Trends
Chemical Oxygen Demand
0123456789
Jan-
11
Apr-1
1
Jul-1
1
Oct
-11
Jan-
12
Apr-1
2
Jul-1
2
Oct
-12
Jan-
13
Apr-1
3
Jul-1
3
Oct
-13
Jan-
14
Apr-1
4
Jul-1
4
Oct
-14
Jan-
15
Apr-1
5
Jul-1
5
Oct
-15
Jan-
16
mg/
L
EPL Point #20S3 Analysis Trends
Total Organic Carbon
02468
10
Jan-
11Ap
r-11
Jul-1
1O
ct-1
1Ja
n-12
Apr-
12Ju
l-12
Oct
-12
Jan-
13Ap
r-13
Jul-1
3O
ct-1
3Ja
n-14
Apr-
14Ju
l-14
Oct
-14
Jan-
15Ap
r-15
Jul-1
5O
ct-1
5Ja
n-16
mg/
L
EPL Point #20S3 Analysis Trends
Total Suspended Solids
Page 36 of 51 Report No: 24005241

00.020.040.060.080.1
0.120.140.16
Jan-
11Ap
r-11
Jul-1
1O
ct-1
1Ja
n-12
Apr-1
2Ju
l-12
Oct
-12
Jan-
13Ap
r-13
Jul-1
3O
ct-1
3Ja
n-14
Apr-1
4Ju
l-14
Oct
-14
Jan-
15Ap
r-15
Jul-1
5O
ct-1
5Ja
n-16
mg/
L
EPL Point #20S3 Analysis Trends
Ammonia, NH4
0
5
10
15
Jan-
11Ap
r-11
Jul-1
1O
ct-1
1Ja
n-12
Apr-1
2Ju
l-12
Oct
-12
Jan-
13Ap
r-13
Jul-1
3O
ct-1
3Ja
n-14
Apr-1
4Ju
l-14
Oct
-14
Jan-
15Ap
r-15
Jul-1
5O
ct-1
5Ja
n-16
mg/
L
EPL Point #20S3 Analysis Trends
BOD
Page 37 of 51 Report No: 24005241

Time sampled: 11:35 13:35 11:25 11:30 12:00 11:20 11:55Date sampled: 26-Nov-13 18-Feb-14 28-May-14 21-Oct-14 18-Dec-14 11-Mar-15 10-Jun-15Sampled by: M. McCracken M. McCracken M. McCracken N. McMillan J. Takahira J. Takahira J. Takahira
UnitpH pH 6.33 5.68 7.16 4.67 6.3 6.83 6.52
EC µS/cm 170 74 177 100 113 304 300
Ammonia (NH4) mg/L 0.8 0.5 0.77 0.45 0.24 3.48 3
Total Organic Carbon mg/L 18 5 5 5 17 24 24
Total Suspended Solids mg/L 114 174 45 77 12 <5 <10
BOD mg/L <2 <2 <2 <2 <2 3 <2
Chemical Oxygen Demand mg/L 38 15 27 13 41 57 65
EPL Point #22
SURFACE WATER (S22)
QUARTERLY ANALYSIS
Page 38 of 51 Report No: 24005241

0
300
600
900
1200
13579
111315
Jul-1
1O
ct-1
1Ja
n-12
Apr-1
2Ju
l-12
Oct
-12
Jan-
13Ap
r-13
Jul-1
3O
ct-1
3Ja
n-14
Apr-1
4Ju
l-14
Oct
-14
Jan-
15Ap
r-15
Jul-1
5O
ct-1
5Ja
n-16
EC
pH U
nits
EPL Point #22S22 pH & EC Trending
pH EC
0
20
40
60
80
100
120
Jul-1
1
Oct
-11
Jan-
12
Apr-1
2
Jul-1
2
Oct
-12
Jan-
13
Apr-1
3
Jul-1
3
Oct
-13
Jan-
14
Apr-1
4
Jul-1
4
Oct
-14
Jan-
15
Apr-1
5
Jul-1
5
Oct
-15
Jan-
16
mg/
L
EPL Point #22S22 Analysis Trends
Chemical Oxygen Demand
01020304050
Jul-1
1
Oct
-11
Jan-
12
Apr-1
2
Jul-1
2
Oct
-12
Jan-
13
Apr-1
3
Jul-1
3
Oct
-13
Jan-
14
Apr-1
4
Jul-1
4
Oct
-14
Jan-
15
Apr-1
5
Jul-1
5
Oct
-15
Jan-
16
mg/
L
EPL Point #22S22 Analysis Trends
Total Organic Carbon
0200400600800
10001200
Jul-1
1
Oct
-11
Jan-
12
Apr
-12
Jul-1
2
Oct
-12
Jan-
13
Apr
-13
Jul-1
3
Oct
-13
Jan-
14
Apr
-14
Jul-1
4
Oct
-14
Jan-
15
Apr
-15
Jul-1
5
Oct
-15
Jan-
16
mg/
L
EPL Point #22S22 Analysis Trends
Total Suspended Solids
Page 39 of 51 Report No: 24005241

0123456
Jul-1
1
Oct
-11
Jan-
12
Apr-1
2
Jul-1
2
Oct
-12
Jan-
13
Apr-1
3
Jul-1
3
Oct
-13
Jan-
14
Apr-1
4
Jul-1
4
Oct
-14
Jan-
15
Apr-1
5
Jul-1
5
Oct
-15
Jan-
16
mg/
L
EPL Point #22S22 Analysis Trends
Ammonia, NH4
0102030405060
Jul-1
1
Oct
-11
Jan-
12
Apr-1
2
Jul-1
2
Oct
-12
Jan-
13
Apr-1
3
Jul-1
3
Oct
-13
Jan-
14
Apr-1
4
Jul-1
4
Oct
-14
Jan-
15
Apr-1
5
Jul-1
5
Oct
-15
Jan-
16
mg/
L
EPL Point #22S22 Analysis Trends
BOD
Page 40 of 51 Report No: 24005241

Time sampled: 11:30 10:35 14:35 10:30 10:30 10:50Date sampled: 18-Feb-14 28-May-14 21-Oct-14 18-Dec-14 11-Mar-15 10-Jun-15Sampled by: M. McCracken M. McCracken N. McMillan J. Takahira J. Takahira J. Takahira
UnitpH pH 6.64 6.07 NS 5.58 5.92 5.90
EC µS/cm 247 189 NS 97 250 181
Ammonia (NH4) mg/L 0.06 0.04 NS 0.04 0.21 0.06
NS: No sample
SURFACE WATER (Cripple Creek Inlet)
QUARTERLY ANALYSIS
Page 41 of 51 Report No: 24005241

0
300
600
900
1200
13579
111315
Feb-
14
May
-14
Aug-
14
Nov
-14
Feb-
15
May
-15
Aug-
15
Nov
-15
Feb-
16
EC
pH U
nits
Cripple Creek inlet pH & EC Trending
pH EC
0123456
Jan-
14
Apr-1
4
Jul-1
4
Oct
-14
Jan-
15
Apr-1
5
Jul-1
5
Oct
-15
Jan-
16
mg/
L
Cripple Creek inletAnalysis Trends
Ammonia, NH4
Page 42 of 51 Report No: 24005241

Time sampled: 11:40 11:35 14:50 10:55 11:40 12:00Date sampled: 18-Feb-14 28-May-14 21-Oct-14 18-Dec-14 11-Mar-15 10-Jun-15Sampled by: M. McCracken M. McCracken N. McMillan J. Takahira J. Takahira J. Takahira
UnitpH pH 7.48 7.28 NS 6.4 NS 7.04
EC µS/cm 291 209 NS 145 NS 185
Ammonia (NH4) mg/L 0.09 0.06 NS 0.10 NS 0.06
NS: No sample
SURFACE WATER (Cripple Creek Outlet)
QUARTERLY ANALYSIS
Page 43 of 51 Report No: 24005241

0
300
600
900
1200
13579
111315
Feb-
14
May
-14
Aug-
14
Nov
-14
Feb-
15
May
-15
Aug-
15
Nov
-15
Feb-
16
EC
pH U
nits
Cripple Creek outlet pH & EC Trending
pH EC
0123456
Jan-
14
Apr-1
4
Jul-1
4
Oct
-14
Jan-
15
Apr-1
5
Jul-1
5
Oct
-15
Jan-
16
mg/
L
Cripple Creek outletAnalysis Trends
Ammonia, NH4
Page 44 of 51 Report No: 24005241
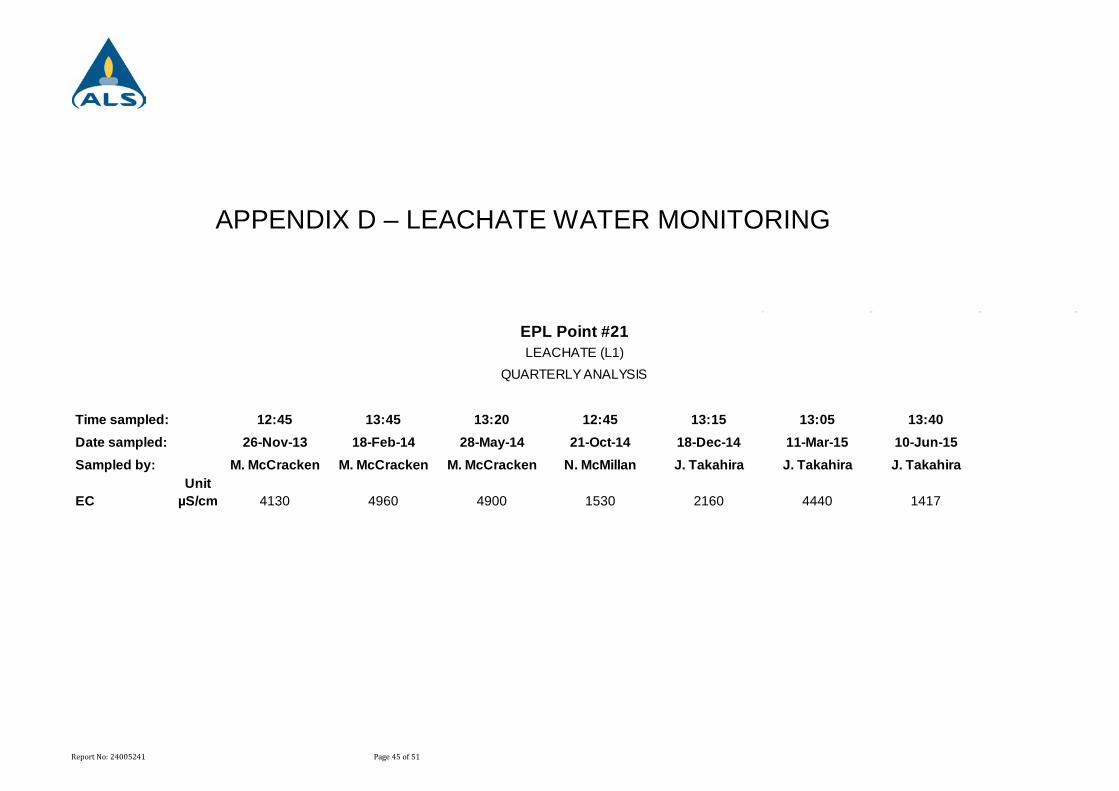
APPENDIX D – LEACHATE WATER MONITORING
Time sampled: 12:45 13:45 13:20 12:45 13:15 13:05 13:40Date sampled: 26-Nov-13 18-Feb-14 28-May-14 21-Oct-14 18-Dec-14 11-Mar-15 10-Jun-15Sampled by: M. McCracken M. McCracken M. McCracken N. McMillan J. Takahira J. Takahira J. Takahira
UnitEC µS/cm 4130 4960 4900 1530 2160 4440 1417
EPL Point #21LEACHATE (L1)
QUARTERLY ANALYSIS
Page 45 of 51 Report No: 24005241

0500
10001500200025003000350040004500500055006000
Jan-
11Ap
r-11
Jul-1
1O
ct-1
1Ja
n-12
Apr-1
2Ju
l-12
Oct
-12
Jan-
13Ap
r-13
Jul-1
3O
ct-1
3Ja
n-14
Apr-1
4Ju
l-14
Oct
-14
Jan-
15Ap
r-15
Jul-1
5O
ct-1
5Ja
n-16
EC
EPL Point #21L1 EC Trending
EC (us/cm)
Page 46 of 51 Report No: 24005241

Time sampled: 12:35 13:40 11:15 11:40 13:45 12:05 12:10Date sampled: 26-Nov-13 18-Feb-14 28-May-14 21-Oct-14 18-Dec-14 11-Mar-15 10-Jun-15Sampled by: M. McCracken M. McCracken M. McCracken N. McMillan J. Takahira J. Takahira J. Takahira
UnitEC µS/cm 4130 7980 4970 4900 5320 4460 1817
EPL Point #26LEACHATE (Dam 2)
QUARTERLY ANALYSIS
Page 47 of 51 Report No: 24005241

0100020003000400050006000700080009000
Oct
-11
Jan-
12
Apr-1
2
Jul-1
2
Oct
-12
Jan-
13
Apr-1
3
Jul-1
3
Oct
-13
Jan-
14
Apr-1
4
Jul-1
4
Oct
-14
Jan-
15
Apr-1
5
Jul-1
5
Oct
-15
Jan-
16
EC
EPL Point #26L2 EC Trending
EC
Page 48 of 51 Report No: 24005241

APPENDIX E – EFFLUENT MONITORING
Time sampled: 11:40 10:45 11:25 11:40 11:40 11:40 11:35Date sampled: 28-May-14 20-Aug-14 21-Oct-14 18-Dec-14 18-Dec-14 11-Mar-15 10-Jun-15Sampled by: M. McCracken N. McMillan N. McMillan J. Takahira J. Takahira J. Takahira J. Takahira
UnitpH pH NS 7.05 NS NS NS NS NSAmmonia, NH4 mg/L NS 0.1 NS NS NS NS NSTotal Organic Carbon mg/L NS 6 NS NS NS NS NSTotal Suspended Solids mg/L NS 28 NS NS NS NS NS
NS = No Sample. Not Discharging
EPL Point # 1EFFLUENT WATER
QUARTERLY ANALYSIS
Page 49 of 51 Report No: 24005241

APPENDIX F – FIELD OBSERVATIONS Sampling Conducted 10/06/2015
Site Water Clarity Level/discharge/ height
EPL Point 1 “Effluent” No discharge
EPL Point 12 “Bore 2” Cloudy 4.47 m
EPL Point 14 “Bore 4” Cloudy 12.05 m
EPL Point 16 “Bore 6A” Cloudy 2.93 m
EPL Point 17 “Bore 7” Slightly Cloudy 4.42 m
EPL Point 18 “S1” Clear Mod flow
EPL Point 20 “S3” Clear Low flow
EPL Point 21 “Leachate 1” Cloudy Mod level, No discharge
EPL Point 22 “S22” Slightly Cloudy Mod level
EPL Point 23 “Bore 8” Dry
EPL Point 24 “Bore 9” Cloudy 2.94 m
EPL Point 25 “Bore 10” Cloudy 2.82 m
EPL Point 28 “Bore 11” Cloudy 1.13
EPL Point 26 “Leachate 2” Cloudy Mod level
7 Day Rainfall
Date (December 2014) 7th 8th 9th 10th 11th 12th 13th
Rainfall (mm) 34.4 10.4 7.8 0.4 11.4 9.6 0.0
Environmental Conditions
Temperature Max 23.1 °C
Cloud Cover Cloudy
Wind Direction South East
Wind Speed 6 km/h
Relative Humidity 83 - 88 %
Report No: 24005241 Quarterly Page 50 of 51

APPENDIX G – WATER ANALYSIS METHODS
Test Method Laboratory
ACIRL
Lithgow ALS Sydney
NATA Accreditation
# 825 ph APHA 4500-H X Electrical Conductivity APHA 2510 X Total Dissolved Solids APHA 2540 X Total Suspended Solids APHA 2540D X Alkalinity by PC Titrator ED037P X Dissolved Major Cations ED093F X Ammonia as N EK055G X Total Organic Carbon EP005 X Chloride (mg/l) ED045G X Biochemical Oxygen Demand (mg/L) EP030 X Chemical Oxygen Demand EP026ST X Sulfur (as SO4)(mg/l) ED041 X
In accordance with “Standard Methods for the Examination of Water & Wastewater” APHA, AWWA, WEF and Water & Wastewater Examination Manual (V. Dean Adams)
ALS Report No: ES1428398 ALS follows and is accredited by NATA for the following standards:
- Australian Standard 5667.6:1998 Part 6: Guidance on sampling of rivers and streams - Australian Standard 5667.10:1998 Part 10: Guidance on sampling of waste waters - Australian Standard 5667.1:1998 Guidance on the design of sampling programs,
sampling techniques and the preservations and handling of samples - Australian Standard 5667.11:1998 Part 11: Guidance on sampling of groundwaters - APHA 2510: Conductivity - APHA 4500-H: pH Value - APHA 2540 C. Total Dissolved Solids Dried at 180 C - APHA 2540 D. Total Suspended Solids Dried at 103-105 C
Report No.24004904 Quarterly 51 of 51