Embed Size (px)
Citation preview
SANDIA REPORT SAND2012-0967 Unlimited Release Printed February 2012
Environmental Management System (EMS) Objectives & Targets Annual Results Summary – FY2011
Douglas W. Vetter
Prepared by Sandia National Laboratories Albuquerque, New Mexico 87185 and Livermore, California 94550
Sandia National Laboratories is a multi-program laboratory managed and operated by Sandia Corporation, a wholly owned subsidiary of Lockheed Martin Corporation, for the U.S. Department of Energy’s National Nuclear Secu rity Administration under contract DE-AC04-94AL85000.
Approved for public release; further dissemination unlimited.
EMS Objectives & Targets Annual Results Summary – FY2011
2
Issued by Sandia National Laboratories, operated for the United States Department of Energy by Sandia
Corporation.
NOTICE: This report was prepared as an account of work sponsored by an agency of the United States
Government. Neither the United States Government, nor any agency thereof, nor any of their employees, nor
any of their contractors, subcontractors, or their employees, make any warranty, express or implied, or assume
any legal liability or responsibility for the accuracy, completeness, or usefulness of any information, apparatus,
product, or process disclosed, or represent that its use would not infringe privately owned rights. Reference
herein to any specific commercial product, process, or service by trade name, trademark, manufacturer, or
otherwise, does not necessarily constitute or imply its endorsement, recommendation, or favoring by the United
States Government, any agency thereof, or any of their contractors or subcontractors. The views and opinions
expressed herein do not necessarily state or reflect those of the United States Government, any agency thereof,
or any of their contractors.
Printed in the United States of America. This report has been reproduced directly from the best available copy.
Available to DOE and DOE contractors from
U.S. Department of Energy
Office of Scientific and Technical Information
P.O. Box 62
Oak Ridge, TN 37831
Telephone: (865) 576-8401
Facsimile: (865) 576-5728
E-Mail: [email protected]
Online ordering: http://www.osti.gov/bridge
Available to the public from
U.S. Department of Commerce
National Technical Information Service
5285 Port Royal Rd.
Springfield, VA 22161
Telephone: (800) 553-6847
Facsimile: (703) 605-6900
E-Mail: [email protected]
Online order: http://www.ntis.gov/help/ordermethods.asp?loc=7-4-0#online
EMS Objectives & Targets Annual Results Summary – FY2011
3
SAND2012-0967
Unlimited Release
Printed February 2012
Environmental Management System (EMS) Objectives & Targets
Annual Results Summary – FY2011
Environmental Management System
Sandia National Laboratories
PO Box 5800
Albuquerque, New Mexico 87185-0619
Abstract
Sandia National Laboratories/New Mexico’s (SNL/NM) Environmental Management System is the
integrated approach for members of the workforce to identify and manage environmental risks. Each
Fiscal Year (FY) SNL/NM performs an analysis to identify environmental aspects, and the environmental
programs associated with them are charged with the task of routinely monitoring and measuring the
objectives and targets that are established to mitigate potential impacts of SNL/NM’s operations on the
environment. An annual summary of the results achieved towards meeting established objectives and
targets provides a connection to, and rational for, annually revised environmental aspects. The purpose of
this document is to summarize the results achieved and documented in FY2011.
EMS Objectives & Targets Annual Results Summary – FY2011
4
Acknowledgments
We would like to thank all the members of the Corporate EMS Team and Points-of-Contact who
contributed to the monitoring and measuring of Corporate EMS Objectives and Targets during FY2011:
Stephanie A. Salinas
Morgan E. Gerard
Pascale S. Waffelaert
Katrina M. Wagner
Michael D. Nagy
Joanna L. Eckstein
Jeffrey T. Young
Robert D. Statler
Chris A. Evans
Mary T. Bultmann
Marti K. Adams
Ralph J. Wrons
Samuel A. McCord
Rosemary P. Avery
EMS Objectives & Targets Annual Results Summary – FY2011
5
Table of Contents Acronyms .................................................................................................................................................... 6
1.0 Introduction ......................................................................................................................................... 7 1.1 Description of the Activity .................................................................................................................... 7 1.2 Purpose & Scope ................................................................................................................................... 7
2.0 Objectives and Targets summary ...................................................................................................... 8 2.1 Significant Aspect: Land Use ................................................................................................................ 8 2.2 Environmental Aspect: Air Emissions – Mobile Sources ..................................................................... 9 2.3 Environmental Aspect: Air Emissions – Greenhouse Gas (GHG) ...................................................... 10 2.4 Environmental Aspect: Personnel Transportation ............................................................................... 11
2.5 Significant Aspect: Hazardous Waste ................................................................................................. 13 2.6 Environmental Aspect: Solid Waste .................................................................................................... 15 2.7 Environmental Aspect: Resource Use - Energy .................................................................................. 16 2.8 Environmental Aspect: Resource Use - Water .................................................................................... 17
3.0 Documentation and Recordkeeping ................................................................................................. 19 4.0 References .......................................................................................................................................... 19 4.1 Reference Document ........................................................................................................................... 19
5.0 Attachments ....................................................................................................................................... 19
6.0 Definitions .......................................................................................................................................... 19
List of Figures Figure 1. GHG Emission Reduction Status (in Tonnes of Carbon Dioxide Equivalents - CO2e). .......... 11
Figure 2. SNL Fleet Petroleum Use Reduction Trend ............................................................................. 12 Figure 3. SNL Fleet Alternative Fuel Use Increase Trend ....................................................................... 13 Figure 4. FY2011 Solid Waste Diversion Trend (excluding C&D waste). ............................................. 16
Figure 5. Annual Energy Use Intensity Reduction Trend. ....................................................................... 17
Figure 6. Annual Water Use Intensity Reduction Trend. ......................................................................... 18
EMS Objectives & Targets Annual Results Summary – FY2011
6
Acronyms & Abbreviations
AOP Administrative Operating Procedure
BTU British Thermal Unit
C&D Construction & Demolition
CINT Center for Integrated Nanotechnology
DOE U. S. Department of Energy
EISA Energy Independence and Security Act
ELM Environmental Life-cycle Management
EMS Environmental Management System
EO Executive Order
ES&H Environment, Safety, & Health
FMOC Facilities Management and Operations Center
FY Fiscal Year
Gal gallon
GHG Greenhouse Gas
gsf Gross Square Footage
HWMF Hazardous Waste Management Facility
MOW Member of the Workforce
NA Not Applicable
NEPA National Environmental Policy Act
P2 Pollution Prevention
PPOA Pollution Prevention Opportunity Assessment
Sandia Sandia Corporation
SF-6 Sulfur Hexafluoride
SNL Sandia National Laboratories
SNL/NM Sandia National Laboratories/New Mexico
SSP Site Sustainability Plan
WIMS Waste Information Management System
yr year
EMS Objectives & Targets Annual Results Summary – FY2011
7
1.0 INTRODUCTION
1.1 Description of the Activity
Sandia National Laboratories/New Mexico’s (SNL/NM) Environmental Management System (EMS) is
the integrated approach for members of the workforce (MOW) to identify and manage environmental
risks. Each Fiscal Year (FY) environmental aspects are evaluated and prioritized, and the environmental
programs associated with them are charged with the task of routinely monitoring and measuring the
objectives and targets that are designed to mitigate the impact of SNL/NM’s operations on the
environment.
Monitoring and measurement information supports SNL/NM’s EMS program compliance requirements
and provides a status of overall progress in meeting site environmental objectives. Based on the annual
evaluation and prioritization of environmental aspects, procedures for monitoring and measurement are
revised to reflect objectives and targets performance metrics, associated operational controls, and
documentation requirements. An annual summary of the results achieved towards meeting established
objectives and targets provides a yearly overview of environmental performance and a connection to, and
rational for, the annual evaluation and prioritization of environmental aspects.
1.2 Purpose & Scope
The purpose of this document is to annually summarize results achieved and documented through
monitoring and measurement of objectives and targets established to progress SNL/NM towards
mitigating its significant environmental aspects. In addition, this annual summary will provide a roadmap
for year to year changes in the significant aspects and objectives and targets tracked by the SNL/NM EMS
Team. This provides consistency, continuity and connectivity between objectives and targets for the
previous, current, and upcoming years.
In FY2011 an important scope change occurred when the U.S. Department of Energy (DOE) issued DOE
Order 436.1, Department Sustainability, superseding DOE Orders 450.1 and 430.2A. This new DOE
Order requires sites to use EMS as a platform for Site Sustainability Plan (SSP) implementation and for
programs with objectives and measurable targets that contribute to the Department meeting its
sustainability goals. Although this order is not within Sandia Corporation’s (Sandia’s) Management and
Operating Contract, the intent of the DOE Order is implemented through Sandia’s requirement for an
International Organization for Standardization 14001 certified EMS. SNL/NM’s EMS had previously
included several SSP sustainability goals as objectives and targets, but were measured and monitored on
the basis of SNL/NM activities only. The scope of measuring and monitoring SSP-specific sustainability
goals was expanded for FY2011 to include all SNL sites (e.g., New Mexico, California, Nevada, and
Hawaii).
Processes and procedures associated with measuring and monitoring of EMS objectives and targets are
described in administrative operating procedure (AOP), Monitoring & Measuring Procedures,
AOP 09-06.
EMS Objectives & Targets Annual Results Summary – FY2011
8
2.0 OBJECTIVES AND TARGETS SUMMARY
2.1 Significant Aspect: Land Use
Objective: Minimize Impact to the Environment from Land Use
Target: Implement the Complete the Environmental Life-Cycle Management Form corporate
procedure by January 15, 2011, and upon implementation, minimize environmental impacts
through project evaluations.
Scope: NM Site-Specific
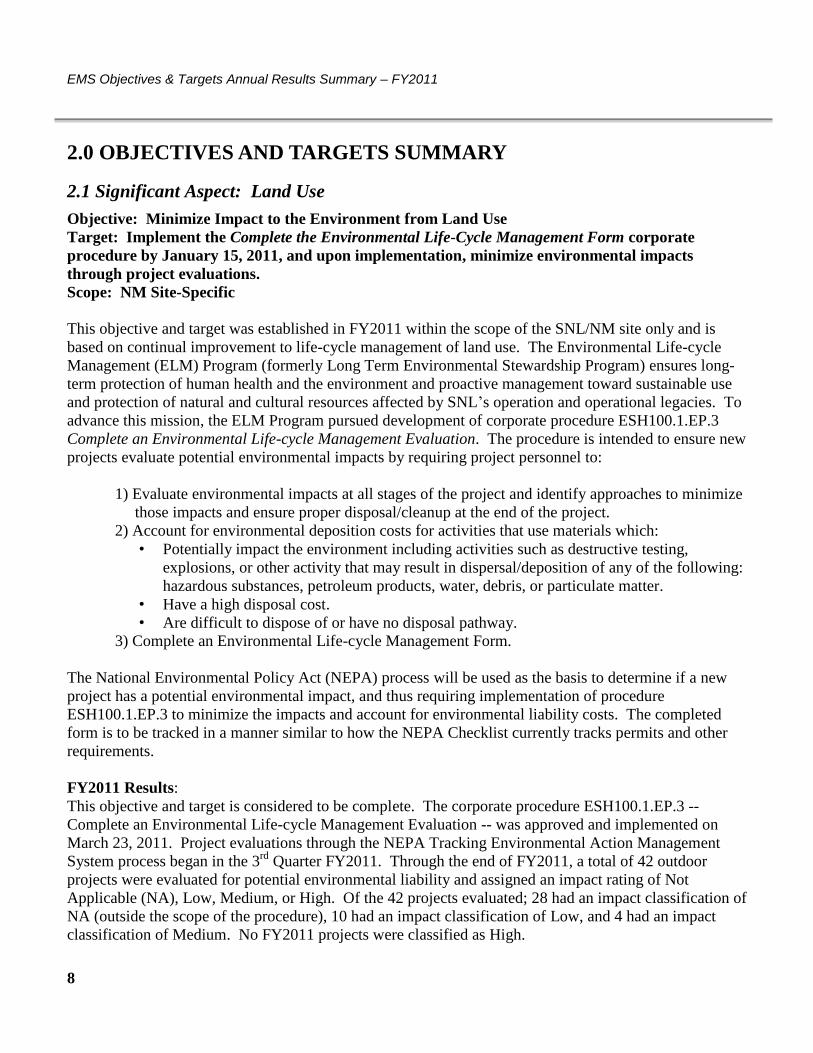
This objective and target was established in FY2011 within the scope of the SNL/NM site only and is
based on continual improvement to life-cycle management of land use. The Environmental Life-cycle
Management (ELM) Program (formerly Long Term Environmental Stewardship Program) ensures long-
term protection of human health and the environment and proactive management toward sustainable use
and protection of natural and cultural resources affected by SNL’s operation and operational legacies. To
advance this mission, the ELM Program pursued development of corporate procedure ESH100.1.EP.3
Complete an Environmental Life-cycle Management Evaluation. The procedure is intended to ensure new
projects evaluate potential environmental impacts by requiring project personnel to:
1) Evaluate environmental impacts at all stages of the project and identify approaches to minimize
those impacts and ensure proper disposal/cleanup at the end of the project.
2) Account for environmental deposition costs for activities that use materials which:
• Potentially impact the environment including activities such as destructive testing,
explosions, or other activity that may result in dispersal/deposition of any of the following:
hazardous substances, petroleum products, water, debris, or particulate matter.
• Have a high disposal cost.
• Are difficult to dispose of or have no disposal pathway.
3) Complete an Environmental Life-cycle Management Form.
The National Environmental Policy Act (NEPA) process will be used as the basis to determine if a new
project has a potential environmental impact, and thus requiring implementation of procedure
ESH100.1.EP.3 to minimize the impacts and account for environmental liability costs. The completed
form is to be tracked in a manner similar to how the NEPA Checklist currently tracks permits and other
requirements.
FY2011 Results:
This objective and target is considered to be complete. The corporate procedure ESH100.1.EP.3 --
Complete an Environmental Life-cycle Management Evaluation -- was approved and implemented on
March 23, 2011. Project evaluations through the NEPA Tracking Environmental Action Management
System process began in the 3rd
Quarter FY2011. Through the end of FY2011, a total of 42 outdoor
projects were evaluated for potential environmental liability and assigned an impact rating of Not
Applicable (NA), Low, Medium, or High. Of the 42 projects evaluated; 28 had an impact classification of
NA (outside the scope of the procedure), 10 had an impact classification of Low, and 4 had an impact
classification of Medium. No FY2011 projects were classified as High.
EMS Objectives & Targets Annual Results Summary – FY2011
9
Although life-cycle management of land use will be an ongoing effort at SNL, this objective and target is
considered complete and will not be included in objective and target monitoring and measurement in
FY2012.
2.2 Environmental Aspect: Air Emissions – Mobile Sources
Objective: Minimize the Number of Portable Sources
Target: By FY2012, reduce the number of portable sources by 5 percent relative to the FY2010
baseline.
Scope: NM Site-Specific
This objective and target was established in FY2011 within the scope of the SNL/NM site only and is
based on continual improvement to reduce air emissions. The Air Quality Control Program
(Environmental Programs) maintains an equipment inventory list of potential air emission sources
throughout SNL/NM. This list helps to prove site-wide compliance with applicable regulations. As
follow-on to the FY2010 objective and target established for the air emissions environmental aspect, an
effort to reduce Sandia-owned portable emission source equipment was established in FY2011 to reduce
overall air emissions.
In FY2010, Environmental Programs worked with Fleet Services, to update and verify the existing mobile
emission source inventory spreadsheet. The mobile emission source inventory spreadsheet compiles all
fossil fuel burning emission units that are capable of moving or being moved readily (i.e., portable
generators). The spreadsheet contains unit information (i.e., size, fuel type) along with the potential air
emission calculations based on Environmental Protection Agency AP-42 Emission Factors. Additionally,
a hands-on inventory of portable emission sources was completed in FY2010 to verify the Fleet Services
spreadsheet information as well as identify additional portable emission sources not managed by Fleet
Services.
In FY2011 an assessment of the hands-on inventory was conducted to identify portable sources that are
either not being used or have potential for causing environmental impacts (i.e., leaks). Owners of unused
or potentially impacting portable sources were contacted to identify disposition or reuse options. As
appropriate, assistance was provided to owners to disposition such equipment.
FY2011 Results:
The primary owners of portable emission source equipment at SNL/NM are Fleet Services and Facilities
Management and Operations Center (FMOC). FMOC Grounds and Roads successfully dispositioned 3
inventoried equipment items, including a Crack Cleaner, Melter (M/A-1), Water Buffalo (LVE001), and a
Debris Vacuum (DV-1). FMOC Mechanical Utilities successfully dispositioned 3 inventoried equipment
items, including 2 trailer mounted water pumps (WP-1 and WP-2) and a sewer line cable machine (SC-1).
Fleet Services successfully dispositioned 6 inventoried generators (GEN4, 10, 29, 32, 46, and 71) and one
inventoried air compressor (AC3). As a result, 13 of the 144 items identified in the FY2010 portable
emission source equipment inventory were successfully dispositioned. The resulting 9 percent reduction
exceeds the 5 percent target for this objective.
EMS Objectives & Targets Annual Results Summary – FY2011
10
Although reduction of air emissions will be an ongoing effort at SNL, this objective and target is
considered complete and will not be included in the objective and target measurement and monitoring in
FY2012.
2.3 Environmental Aspect: Air Emissions – Greenhouse Gas (GHG)
Objective: Reduce GHG Footprint
Target: By FY2020, reduce Scope 1 & 2 GHG emissions by 28 percent relative to a FY2008
baseline.
Scope: Corporate SSP Goal for all SNL Sites
This corporation-based goal is identified in the SSP and originates from Executive Order (EO) 13514,
Federal Leadership in Environmental, Energy, and Economic Performance. EO 13514 requires DOE to
reduce its GHG Scope 1 & 2 emissions by 28 percent by FY2020 from a FY2008 baseline. Scope 1
consists of direct emissions such as on-site combustion of fossil fuels or fugitive GHG emissions, whereas
Scope 2 consists of indirect emissions associated with the consumption of electricity, heat, or steam. Sites
are expected to aggressively strive towards the overall DOE goal of a 28 percent reduction, but will not
necessarily be held to it, as actual targets will be defined at the DOE Under Secretary level.
While individual DOE sites are not required specifically to meet the 28 percent target that the agency as a
whole is committed to meeting, Sandia as a corporation has adopted an equivalent GHG reduction in the
SSP and as an EMS Objective and Target. As a result, this objective and target have been revised from
FY2010 with respect to scope. Adoption of the corporate SSP goals for GHG reduction changed the
scope from SNL/NM-specific to include all SNL sites.
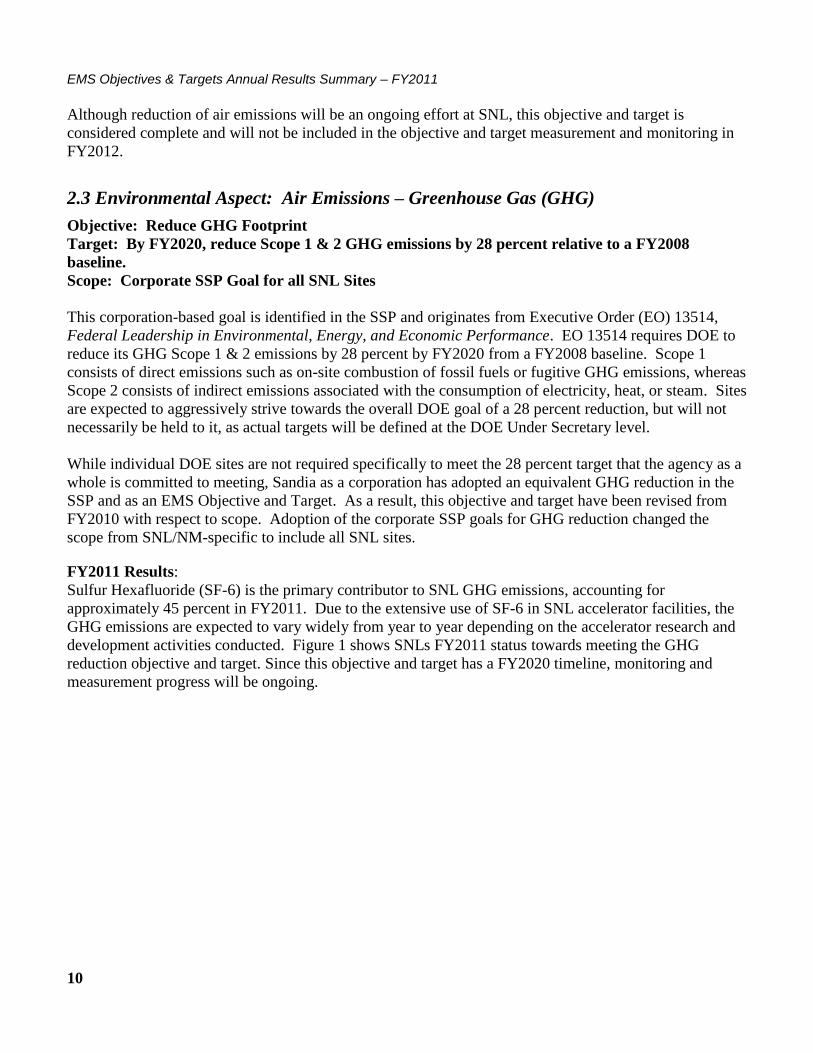
FY2011 Results:
Sulfur Hexafluoride (SF-6) is the primary contributor to SNL GHG emissions, accounting for
approximately 45 percent in FY2011. Due to the extensive use of SF-6 in SNL accelerator facilities, the
GHG emissions are expected to vary widely from year to year depending on the accelerator research and
development activities conducted. Figure 1 shows SNLs FY2011 status towards meeting the GHG
reduction objective and target. Since this objective and target has a FY2020 timeline, monitoring and
measurement progress will be ongoing.
EMS Objectives & Targets Annual Results Summary – FY2011
11
Figure 1. GHG Emission Reduction Status (in Tonnes of Carbon Dioxide Equivalents [CO2e]).
2.4 Environmental Aspect: Personnel Transportation
Objective: Reduce Use of Fleet Petroleum
Target: By FY2020, reduce fleet petroleum consumption by 2 percent per year relative to a FY2005
baseline.
Scope: Corporate SSP Goal for all SNL Sites
Objective: Increase the Use of Fleet Alternative Fuel
Target: By FY2015, increase fleet alternative fuel consumption by 10 percent per year relative to a
FY2005 baseline.
Scope: Corporate SSP Goal for all SNL Sites
These two corporation-based goals are identified in the SSP and originate from EO 13514 Federal
Leadership in Environmental, Energy, and Economic Performance (2009); EO 13423 Strengthening
Federal Environmental, Energy, and Transportation Management (2007); and the Energy Independence
and Security Act of 2007 (EISA 2007). EO 13423 requires Federal agencies to reduce “subject” fleet
petroleum use by 2 percent per year through FY2015 (from a FY2005 baseline), for an overall reduction
of 20 percent. EO 13514 incorporates this requirement and extends it to FY2020, for an overall reduction
of 30 percent. In addition, EISA 2007 requires federal agencies to increase the use of “subject”
non‐petroleum fuels, or alternative fuels, by 10 percent annually through FY2015 (from a FY2005
baseline), for an overall increase of 159.4 percent. “Subject” fuel includes the fuel used in all light‐duty,
medium‐duty, and heavy‐duty vehicles, unless such vehicles are exempted from EO 13423 (e.g., law
enforcement, emergency, and military tactical vehicles, and vehicles operated outside of the United
States).
EMS Objectives & Targets Annual Results Summary – FY2011
12
While individual DOE sites are not specifically required to meet the petroleum fuel use reduction and
alternative fuel use increase that the agency as a whole is committed to meeting, Sandia as a corporation
has adopted both these fuel use goals in the SSP and as EMS Objectives and Targets. As a result, these
two objectives and targets have been revised from FY2010 with respect to scope. Adoption of the
corporate SSP goals for petroleum fuel use reduction and alternative fuel use increase changed the scope
from SNL/NM-specific to include all SNL sites.
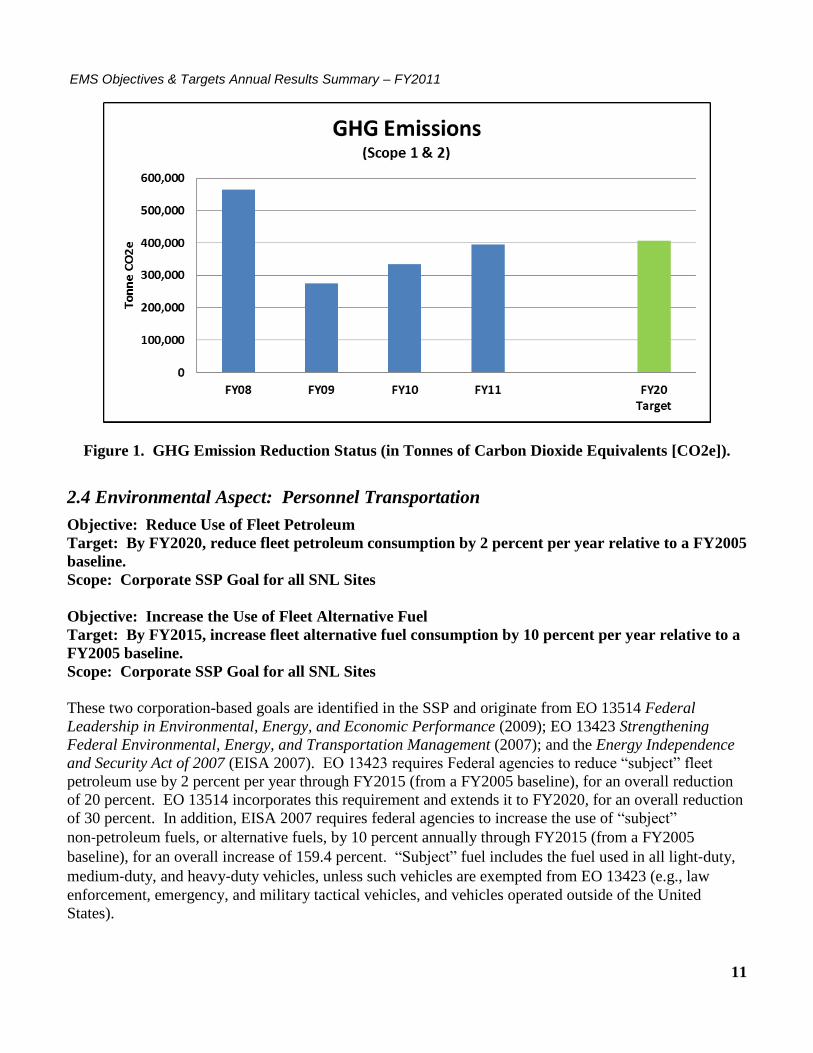
FY2011 Results:
SNL achieved a 17 percent reduction fleet petroleum use relative to FY2010, far exceeding the annual 2
percent target reduction. This resulted in an overall cumulative reduction in fleet petroleum use of 36
percent from the baseline year FY2005, which is well above the overall FY2020 target of a 30 percent
reduction. SNL achieved a 4 percent increase in fleet alternative fuel use relative to FY2010. Although
this result is below the annual 10 percent target increase, the overall cumulative increase in fleet
alternative fuel use is 98 percent compared to the baseline year FY2005. Thus, the overall cumulative
alternative fuel use increase is exceeding the overall increase trend necessary to meet the FY2015
objective and target, 159 percent increase. Figures 2 and 3 depict the Fleet petroleum reduction and
alternative fuel increase objective and target status, respectively, based on FY2011 results. Since these
objectives and targets have FY2015 and FY2020 timelines, monitoring and measurement progress will be
ongoing.
Figure 2. SNL Fleet Petroleum Use Reduction Trend

EMS Objectives & Targets Annual Results Summary – FY2011
13
Figure 3. SNL Fleet Alternative Fuel Use Increase Trend
2.5 Significant Aspect: Hazardous Waste
Objective: Reduce Quantity of Hazardous Waste Generated
Target: Determine and prioritize hazardous waste opportunities by August 30, 2011.
Scope: NM Site-Specific
This objective and target was established in FY2011 within the scope of the SNL/NM site only and is
based on continual improvement of hazardous waste reduction efforts.
All hazardous waste generated at SNL/NM is managed for disposal through the Hazardous Waste
Management Facility (HWMF). The HWMF utilizes the Waste Information Management System
(WIMS), which is a system for the management of hazardous waste generated by SNL. Hazardous waste
generation data from WIMS is tracked and reported through the Pollution Prevention (P2) Program.
Upon receiving quarterly raw data from WIMS, P2 enters the data into a “Trends” spreadsheet. The data
maintained in the Trends spreadsheet can then be used to identify and prioritize hazardous waste
reduction opportunities.
As the point of contact for this objective and target, P2 established the means for meeting this objective
and target based on three primary elements:
1. Determine an FY2010 corporate baseline with breakdown by Divisions, with highest generators
identified by waste type and corresponding buildings. Share with Division EMS Teams by
November 30, 2010.
2. For highest waste generators, meet with Division EMS Teams to determine methods of, and
timelines for, Waste Reduction assessment by March 15, 2011.

EMS Objectives & Targets Annual Results Summary – FY2011
14
3. With completed assessment(s), report on potential reduction(s) and develop an implementation
strategy for outward years.
FY2011 Results:
This objective and target was accomplished through a series of activities involving the P2 organization
and EMS Division Teams. During the first quarter of FY2011, P2 analyzed FY2010 hazardous waste
generation data to determine a corporate baseline with breakdown by Divisions. This baseline identified
the highest quantity generators by waste type and buildings. For highest waste generators, P2 and EMS
Division Teams met to determine potential methods of and timelines for Waste Reduction assessment.
During the second quarter of FY2011, P2 and EMS Division Team meetings were held with Division
2000 (multiple meetings, including Centers 2700, 2100, and 2900), Division 5000 (two meetings,
specifically 5400), and Division 6000 (two meetings with EMS Champion and others). Based on a
specific interest in waste reduction, a pollution prevention opportunity assessment (PPOA) was
immediately initiated with Center 1700.
A number of waste reduction opportunities and implementation strategies were identified during the final
two quarters of FY2011. Although the first 3 quarters of FY2011 revealed a 31 percent reduction in
routine hazardous waste generation at SNL/NM compared to the same time period in FY2010, Division
1000 was the only division with an increase. As a result, the Division 1000 Environment, Safety, &
Health (ES&H) team was presented with recent waste generation data, highlighting an excessive waste
stream of high-occurrence, low-weight lab trash packages. The Center for Integrated Nanotechnology
(CINT) building was then targeted for a walk-down of the waste process with the assigned Environmental
Compliance Coordinator and generators. Based on recommendations resulting from the walk-down, the
administrative process for laboratory trash packaging was changed, saving the generator over $3,000 and
eliminated the labor required to fill out and facilitate the pick-up of over 70 waste items annually.
Opportunities to reduce chemicals older than 10 years at CINT were also reviewed.
The Center 1700 PPOA resulted in the identification of a recycling pathway for the largest quantity solid
waste stream generated by the center (calcium fluoride). Division 6000 planned to facilitate wider use of
the Chemical Exchange Program to reduce overall chemical inventory. Center 2700 planned to reduce
their inventory of chemicals older than 10 years.
P2 worked with Fleet Services to implement the use of bulk brake cleaning product. Brake cleaner is a
chemical commonly used by Fleet technicians for many purposes and previously was used with aerosol
cans as the application method. A 55 gallon (gal) drum of the brake cleaning product was purchased
along with equipment for filling rechargeable sprayers with the product and compressed air. In FY2012,
Fleet will complete the transition from disposable aerosol cans to reusable/rechargeable sprayers
eliminating the hazardous waste disposal of exhausted cans of brake cleaner.
Although hazardous waste reduction will be an ongoing effort at SNL, this objective and target is
considered complete and will not be included in the objective and target measurement and monitoring in
FY2012.
EMS Objectives & Targets Annual Results Summary – FY2011
15
2.6 Environmental Aspect: Solid Waste
Objective: Reduce Waste
Target: By FY2012, divert 65 percent of non-hazardous solid waste, (excluding construction and
demolition debris).
Scope: NM Site-Specific
This objective and target was established in FY2011 within the scope of the SNL/NM site only and is
considered a “stretch” goal for continually improving solid waste reduction. The objective and target is
based on reducing (or diverting) solid waste sent to the landfill through measures incorporating the P2
hierarchy of reduce, reuse, and recycle. Construction and demolition (C&D) waste is specifically
excluded from this objective and target, as this portion of the solid waste stream is highly variable at
SNL/NM.
The P2 Program coordinates, tracks, and improves the recycling processes for SNL/NM and the nearby
offsite Sandia Science & Technology Park, working with both line organizations and the Waste
Management Service Center. Coordinating and improving the recycling processes are daily activities.
Diversion of solid waste in FY2011 will be increased through a number of measures, including:
Awareness and outreach to MOWs encouraging participation in available recycling opportunities,
Expansion of existing recycling programs to improve access to MOWs,
Implementation of new recycle programs, and
Improvements to the existing recycling infrastructure.
FY2011 Results:
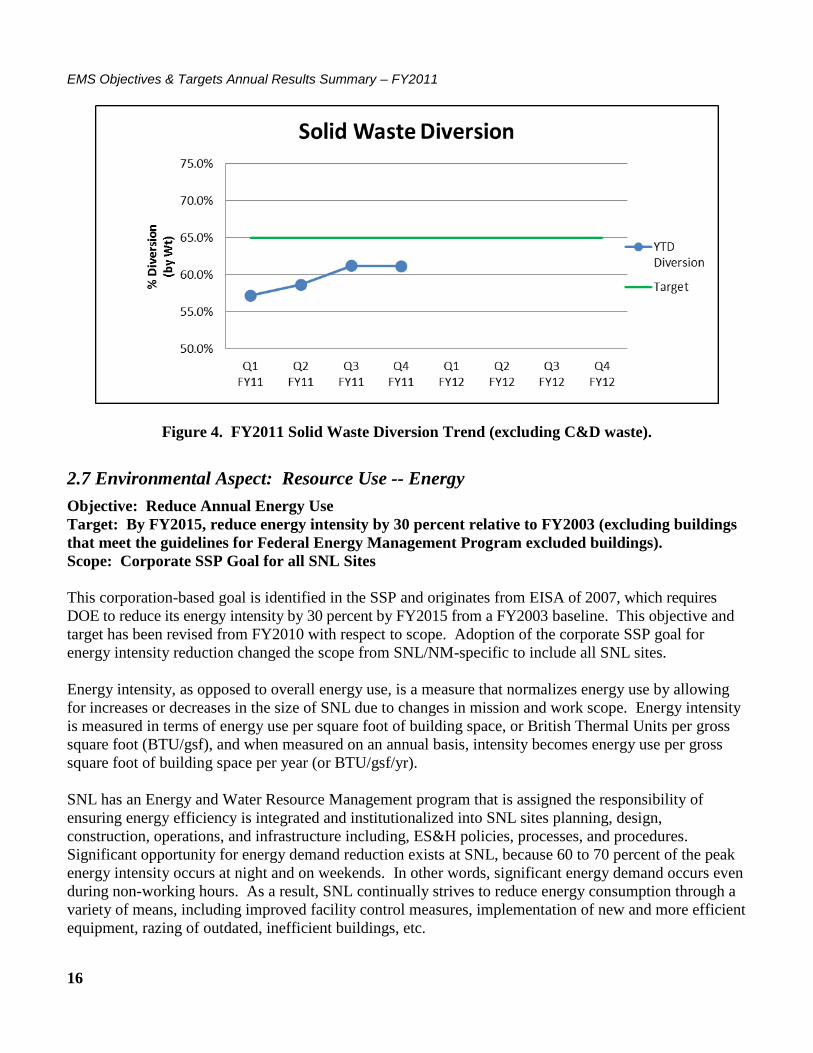
SNL/NM achieved a diversion rate of 61.2 percent in FY2011. Although the 65 percent target diversion
rate was not attained, this Objective & Target has a 2-year timeframe with an end of year FY2012
completion date. Figure 4 below shows the quarterly year-to-date solid waste diversion rate results for
FY2011. An increasing trend in the diversion occurred over the first three quarters of FY2011 and then
plateaued in the fourth and final quarter of the FY. Since this objective and target has a FY2012
completion timeline, monitoring and measurement progress will be ongoing.
EMS Objectives & Targets Annual Results Summary – FY2011
16
Figure 4. FY2011 Solid Waste Diversion Trend (excluding C&D waste).
2.7 Environmental Aspect: Resource Use -- Energy
Objective: Reduce Annual Energy Use
Target: By FY2015, reduce energy intensity by 30 percent relative to FY2003 (excluding buildings
that meet the guidelines for Federal Energy Management Program excluded buildings).
Scope: Corporate SSP Goal for all SNL Sites
This corporation-based goal is identified in the SSP and originates from EISA of 2007, which requires
DOE to reduce its energy intensity by 30 percent by FY2015 from a FY2003 baseline. This objective and
target has been revised from FY2010 with respect to scope. Adoption of the corporate SSP goal for
energy intensity reduction changed the scope from SNL/NM-specific to include all SNL sites.
Energy intensity, as opposed to overall energy use, is a measure that normalizes energy use by allowing
for increases or decreases in the size of SNL due to changes in mission and work scope. Energy intensity
is measured in terms of energy use per square foot of building space, or British Thermal Units per gross
square foot (BTU/gsf), and when measured on an annual basis, intensity becomes energy use per gross
square foot of building space per year (or BTU/gsf/yr).
SNL has an Energy and Water Resource Management program that is assigned the responsibility of
ensuring energy efficiency is integrated and institutionalized into SNL sites planning, design,
construction, operations, and infrastructure including, ES&H policies, processes, and procedures.
Significant opportunity for energy demand reduction exists at SNL, because 60 to 70 percent of the peak
energy intensity occurs at night and on weekends. In other words, significant energy demand occurs even
during non-working hours. As a result, SNL continually strives to reduce energy consumption through a
variety of means, including improved facility control measures, implementation of new and more efficient
equipment, razing of outdated, inefficient buildings, etc.
EMS Objectives & Targets Annual Results Summary – FY2011
17
FY2011 Results:
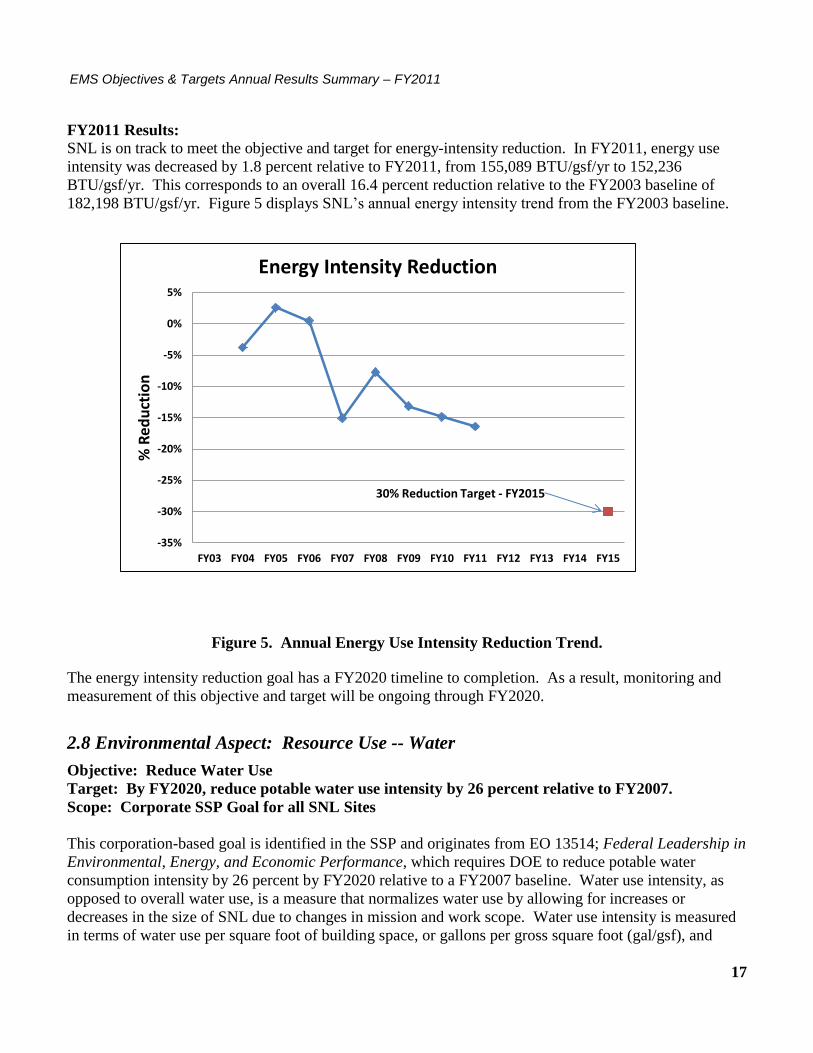
SNL is on track to meet the objective and target for energy-intensity reduction. In FY2011, energy use
intensity was decreased by 1.8 percent relative to FY2011, from 155,089 BTU/gsf/yr to 152,236
BTU/gsf/yr. This corresponds to an overall 16.4 percent reduction relative to the FY2003 baseline of
182,198 BTU/gsf/yr. Figure 5 displays SNL’s annual energy intensity trend from the FY2003 baseline.
-35%
-30%
-25%
-20%
-15%
-10%
-5%
0%
5%
FY03 FY04 FY05 FY06 FY07 FY08 FY09 FY10 FY11 FY12 FY13 FY14 FY15
% R
ed
uct
ion
Energy Intensity Reduction
30% Reduction Target - FY2015
Figure 5. Annual Energy Use Intensity Reduction Trend.
The energy intensity reduction goal has a FY2020 timeline to completion. As a result, monitoring and
measurement of this objective and target will be ongoing through FY2020.
2.8 Environmental Aspect: Resource Use -- Water
Objective: Reduce Water Use
Target: By FY2020, reduce potable water use intensity by 26 percent relative to FY2007.
Scope: Corporate SSP Goal for all SNL Sites
This corporation-based goal is identified in the SSP and originates from EO 13514; Federal Leadership in
Environmental, Energy, and Economic Performance, which requires DOE to reduce potable water
consumption intensity by 26 percent by FY2020 relative to a FY2007 baseline. Water use intensity, as
opposed to overall water use, is a measure that normalizes water use by allowing for increases or
decreases in the size of SNL due to changes in mission and work scope. Water use intensity is measured
in terms of water use per square foot of building space, or gallons per gross square foot (gal/gsf), and
EMS Objectives & Targets Annual Results Summary – FY2011
18
when measured on an annual basis becomes water use per gross square foot of building space per year (or
gal/gsf/yr).
This objective and target has been revised from FY2010 with respect to description and scope. Adoption
of the corporate SSP goal for water use intensity reduction changed the scope from SNL/NM-specific to
include all SNL sites. In addition, the previous goal and driver for water reduction, DOE Order 430.2B,
has been cancelled and replaced with the more aggressive EO 13514 goal. DOE Order 430.2B,
Departmental Energy, Renewable Energy and Transportation Management, had required DOE to reduce
water intensity by no less than 16 percent by FY2015, relative to a FY2007 baseline.
Sandia continually strives to reduce overall water consumption through a variety of means, including
implementation of low-flow plumbing fixtures, improved cooling tower operating practices, efficient
landscape irrigation technology, etc. SNL has determined that ultra-pure water process systems are one of
the largest sources of water use, while cooling is the next-largest water-using process. Although irrigation
does not account for a significant amount of the water consumed, an area that is difficult to quantify is
construction and the recent reduction in construction activities helped reduce water consumption.
Increased cooling tower cycles, condition assessments, and leak repairs on the water-distribution system
have contributed to water savings.
FY2011 Results:
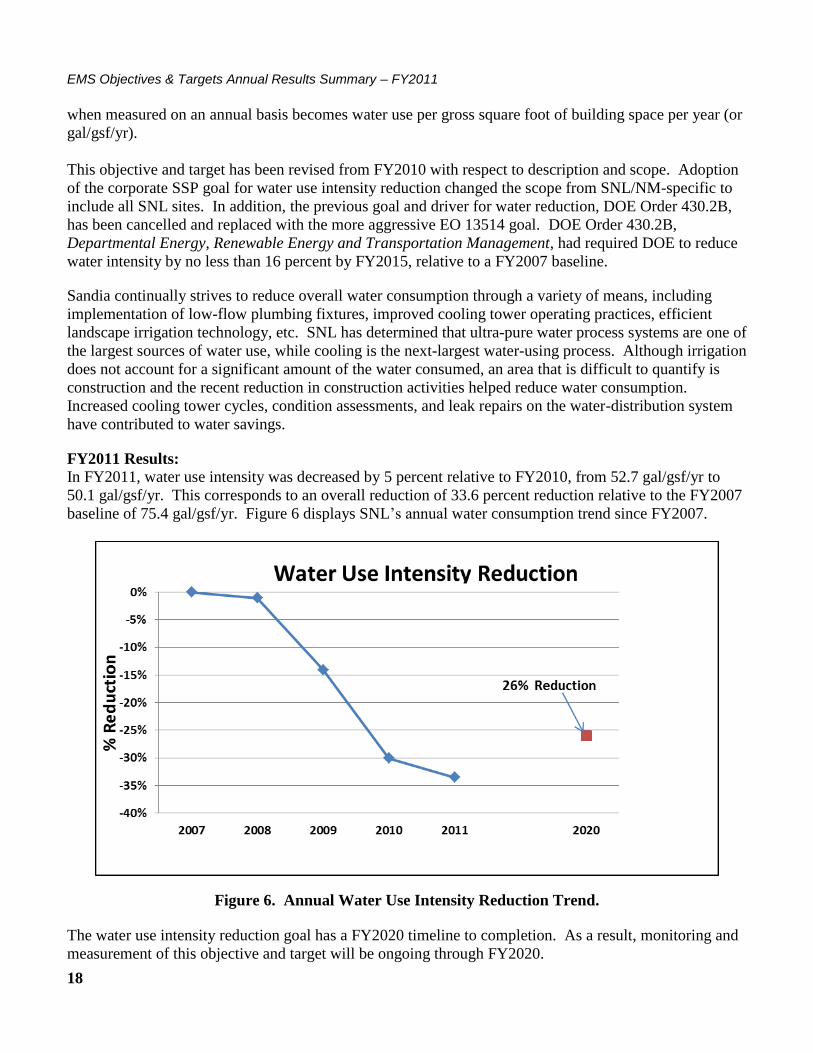
In FY2011, water use intensity was decreased by 5 percent relative to FY2010, from 52.7 gal/gsf/yr to
50.1 gal/gsf/yr. This corresponds to an overall reduction of 33.6 percent reduction relative to the FY2007
baseline of 75.4 gal/gsf/yr. Figure 6 displays SNL’s annual water consumption trend since FY2007.
Figure 6. Annual Water Use Intensity Reduction Trend.
The water use intensity reduction goal has a FY2020 timeline to completion. As a result, monitoring and
measurement of this objective and target will be ongoing through FY2020.
EMS Objectives & Targets Annual Results Summary – FY2011
19
3.0 DOCUMENTATION AND RECORDKEEPING
The data (status of Objectives and Targets) that is collected in accordance with the Monitoring and
Measurement Procedure (AOP 09-06, EMS Monitoring & Measurement Procedures) is maintained and
tracked on the EMS Implementation SharePoint Site. The data is provided for management review.
4.0 REFERENCES
4.1 Reference Document
Sandia National Laboratories/New Mexico, Environmental Management System Manual (PG470222)
5.0 ATTACHMENTS
Not Applicable
6.0 DEFINITIONS
EMS -- The Environmental Management System is a part of an organizations management system used to
develop and implement its environmental policy and manage its environmental aspects.
EMS Objectives & Targets Annual Results Summary – FY2011
20
DISTRIBUTION:
1 MS0899 RIM-Reports Management, 09532 (electronic copy)
1 MS0143 Michael W. Hazen, 04000 (electronic copy)
1 MS0725 Sidney M. Gutierrez, 04100 (electronic copy)
1 MS0729 Terry W. Cooper, 04140 (electronic copy)
1 MS0730 Stephanie A. Salinas, 04143 (electronic copy)