Embed Size (px)
Citation preview
AMER. ZOOL., 39:146-159 (1999)
Environmental Limits to Coral Reef Development: Where Do We Drawthe Line?1
JOAN A. KLEYPAS,2* JOHN W. MCMANUS.I AND LAMBERT A. B. MENEzf*National Center for Atmospheric Research, P.O. Box 3000 Boulder, CO 80307-3000
•flCLARM, MCPO Box 2631, 07J 8 Makati City, Philippines
SYNOPSIS. Understanding how reefs vary over the present ranges of environmen-tal conditions is key to understanding how coral reefs will adapt to a changingenvironment. Global environmental data of temperature, salinity, light, carbonatesaturation state, and nutrients were recently compiled for nearly 1,000 reef loca-tions. These data were statistically analyzed to (1) re-define environmental limitsover which reefs exist today, (2) identify "marginal" reefs; i.e., those that existnear or beyond "normal" environmental limits of reef distribution, and (3) broadlyclassify reefs based on these major environmental variables. Temperature and sa-linity limits to coral reefs, as determined by this analysis, are very near thosedetermined by previous researchers; but precise nutrient levels that could be con-sidered limiting to coral reefs were not obvious at the scale of this analysis. How-ever, in contrast to many previous studies that invoke low temperature as the reef-limiting factor at higher latitudes, this study indicates that reduced aragonite sat-uration and light penetration, both of which covary with temperature, may alsobe limiting. Identification of "marginal" reef environments, and a new classifica-tion of reefs based on suites of environmental conditions, provide an improvedglobal perspective toward predicting how reefs will respond to changing environ-mental conditions.
INTRODUCTION
Coral reefs have long been consideredstenotolerant ecosystems, confined by a rel-atively narrow range of environmental con-ditions. Reefs are broadly recognized as be-ing limited to warm, clear, shallow, and ful-ly saline waters. Achituv and Dubinsky(1990) reviewed the environmental limits tocoral reefs with respect to light, tempera-ture, salinity, sedimentation, "hydrome-chanic" factors, and ocean circulation, withmost of these limits having been deter-mined from site to site measurements andlaboratory experiments. Recently availableglobal data of both marine environmentalconditions and reef distribution now allowus to extend our analysis of what affectsreef distribution to the global scale. Thispaper is not a strict assessment of coral reefenvironmental tolerances everywhere, but it
1 From the Symposium Coral Reefs and Environ-mental Changes—Adaptation, Acclimation, or Extinc-tion presented at the annual Meeting of the Society forComparative and Integrative Biology, January 3-7,1998, at Boston Massachusetts.
2 E-mail: [email protected]
does address three broad goals with respectto global reef distribution. First, a data-based assessment of environmental limits tocoral reef development is presented. Sec-ond, "marginal" reefs are identified basedon their proximity to environmental limits.Third, a broad environmental classificationof reefs is proposed.
We focused on five major physico-chem-ical factors: temperature, salinity, nutrients,light availability, and aragonite saturationstate (Table 1), because we consider theseto be first-order determinants of reef distri-bution at the global scale. Many other fac-tors can ultimately determine both locationand extent of reef development, such as hy-drodynamic conditions (e.g., waves, cur-rents, storm frequency) and biological var-iables (e.g., larval sources, diversity, dis-ease), but because these usually operate atthe regional scale of reef distribution, weconsider them second-order determinants.
The quality of data used in this evalua-tion is a function of both temporal and spa-tial resolution. Temporally, data would ide-ally be resolved to the same scale that each
146
at University of T
ennessee Library on Septem
ber 5, 2014http://icb.oxfordjournals.org/
Dow
nloaded from
ENVIRONMENTAL LIMITS TO REEF DEVELOPMENT 147
TABLE 1. Physico-chemical environmental variables that potentially affect reef distribution.
Van able
Min. temp.°C
SalinityPSU
LightJJLE HK2 s"'
Arag. saturationfl-arag
Max. nutrientsu.mol liter"1
Reef limits
18181615
15-1618
11.5-14.0
25-4220
50-450
30-40% of surf.10% of surf.
not established
0.5-3.0 NO,?0.1-2.0 PO4?
Temporal scale
"annual minima""prolonged""short-term""few days expos.""long-term limit"1-2 wk. com. exp.2-30 days
continuous<1 day exposure
Limits reefsLimits corals
Notes
too many references for coraland reef temp, tolerances tolist here; for a review, seeColes and Fadlallah, 1991
Arabian Gulf
see Coles and Jokiel, 1992 forextensive review
range of It for individual corals;Ik is measure of coral adapta-tion to light (Chalker, 1981)
see Achituv and Dubinsky, 1990
Function of [Ca2+], [CO,2],temp., sal.
No limits established for NO, orPO4; see Szmant, 1997
particular variable affects a reef. For ex-ample, the "lethal dose" of low tempera-ture to corals is a function of both durationand severity of the cold water event (seeTable 1). To capture such short-term events,the data would require daily resolution. Aglobal analysis at this resolution is currentlyimpractical, so one must make the assump-tion that daily fluctuations are not signifi-cantly different between locations havingthe same weekly average temperature.
Spatially, data resolution would ideallymatch reef size. Again, this is currently im-practical, as individual reefs are usually 1—100 sq. km in size, while most global datasets have scales of 10,000 sq. km (1° X 1°).The mismatch of reef-scale to data-scale isimportant in areas where the environmentchanges rapidly over short distances, suchas where restricted water circulation (e.g., alagoon) can result in sharp temperature dif-ferences.
One final consideration of scale is thetime period over which data were collected.Many data sets used here are based on over100 years of ocean observations. Others,particularly the satellite-based data, werecollected over only a few years time andmay not represent a true climatology.
Scale is therefore an important issue inthis analysis and results should be inter-preted cautiously. If one keeps this in mind,
however, these data present a unique op-portunity to synoptically examine some im-portant global controls on reef distributiontoday, and also provide a baseline for ex-amining how changes in environmentalconditions might affect coral reefs in thefuture.
METHODS
The recent compilation of a database ofworldwide reef distribution (ReefBase,1996) has finally enabled a direct compar-ison between reef distribution and majoroceanographic environmental conditions.ReefBase provided an original number of6,451 reef locations. These were analyzedonto a 1° X 1° global grid, which resultedin a total of 968 grid cells having reefs.Forty-seven of these include only non-reefcoral communities, as described either inReefBase or other sources (e.g., Solitary Is-lands: Harriott et al, 1994; Easter Island:DiSalvo et al., 1988; Kermadec Islands:Schiel et al., 1986; St. Lucia Marine Re-serve: Riegl et al., 1995; Japan: Iryu et al.,1995; Veron, 1993). Coral communities areusually distinguished from coral reefs onthe basis of their inability to accumulate abuildup of calcium carbonate (Buddemeierand Smith, 1999). These locations were re-moved when analyzing the global limits to
at University of T
ennessee Library on Septem
ber 5, 2014http://icb.oxfordjournals.org/
Dow
nloaded from
148 J. A. KLEYPAS ET AL.
reef development, but were retained in thereef classification procedures.
Environmental conditions were compiledfor each 1° X 1° location, and statisticalmethods were used to evaluate the range ofconditions over which coral reefs are foundtoday. Temperature, salinity, nutrient, andcarbonate saturation data sets are publiclyavailable and each is briefly described be-low. Calculation of light availability wasmore complicated and is described in great-er detail below. A summary of data setsused is presented in Table 2.
Minimum, maximum and mean temper-ature data were calculated from NOAA'sAVHRR-based sea surface temperature(SST) data records. These are provided asweekly averages for the globe, and incor-porate both remotely sensed and ship-boardmeasurements (Reynolds and Marsico,1993). Minimum and maximum monthlysalinity values were derived from Levitus(1994); and phosphate and nitrate surfacemeasurements were obtained from Levituset al. (1993). All Levitus data were avail-able at 1° X 1° resolution. Surface aragonitesaturation (fi-arag) was calculated from a2° X 2° global grid of [CO3
2"] (Archer,1996). These data were extrapolated fromGEOSECS ocean chemistry data (Taka-hashi et al., 1980) and have an accuracy ofabout ±10 u,mol kg '. fl-arag was calcu-lated from [CO3
2~] according to Mucci(1983), and using annual average tempera-ture (Reynolds and Smith, 1994) and salin-ity (Levitus, 1994).
Light penetration limits how deep a reefwill grow. Light that is available to a reefis a function of three major variables: (1)light reaching the ocean surface, which is afunction of sun angle and atmospheric at-tenuation; (2) its attenuation (K) with waterdepth, which is a function of water clarity;and (3) reef depth. For this exercise, lightpenetration at a reef site was determined bycombining photosynthetically available ra-diation (PAR) at the surface with the atten-uation coefficient of light of wavelength490 nm (K^o) (Kleypas, 1997; see alsoBosscher and Schlager, 1992; Bosscher andSoutham, 1992). Monthly-averaged 3-hour-ly estimates of PAR were obtained from aninference model that uses global satellite
measurements of both top of the atmo-sphere radiation and cloud cover (Pinkerand Laszlo, 1992a, b). Maximum 3-hourlyPAR values were extracted as an estimateof monthly average PAR at noon (PARnoon).Likewise, seven years of monthly K^Q val-ues from the Coastal Zone Color Scannerarchives were averaged to produce amonthly climatology. Using these twomonthly climatologies (PARnoon and K490),and assuming that the minimum PAR nec-essary for reef growth is 250 uJE m~2 s"1
(Kleypas, 1997), monthly average depth ofmaximum light penetration (Znoon) was cal-culated according to the formula:
7 =ln(PARmin/PARnoon)
wherePARmin = minimum PAR necessary for
reef growth, 250 |xE m"2 s~'
PARnoon = maximum daily PAR at seasurface, (xE m~2 s"1
K490 = diffuse extinction coefficient oflight (\ = 490 nm), irr '
Reefs are only briefly exposed to noon-daylight intensity, so the calculated Znoon valuesare actually deeper than expected reef de-velopment. Twelve monthly values of Znoonwere calculated for each site, from whichminimum, maximum, and average Znoon val-ues were derived.
The above environmental data were com-piled for each ReefBase location and statis-tics were used to describe the limits of reefdevelopment. Statistical analyses includedbasic data analyses, principal componentanalysis, and cluster analysis (agglomera-tive nesting based on dissimilarities). Prin-cipal component and cluster analyses wereperformed using S-PLUS© version 3.3.
RESULTS
Environmental limits to reef growthThe range, average and standard devia-
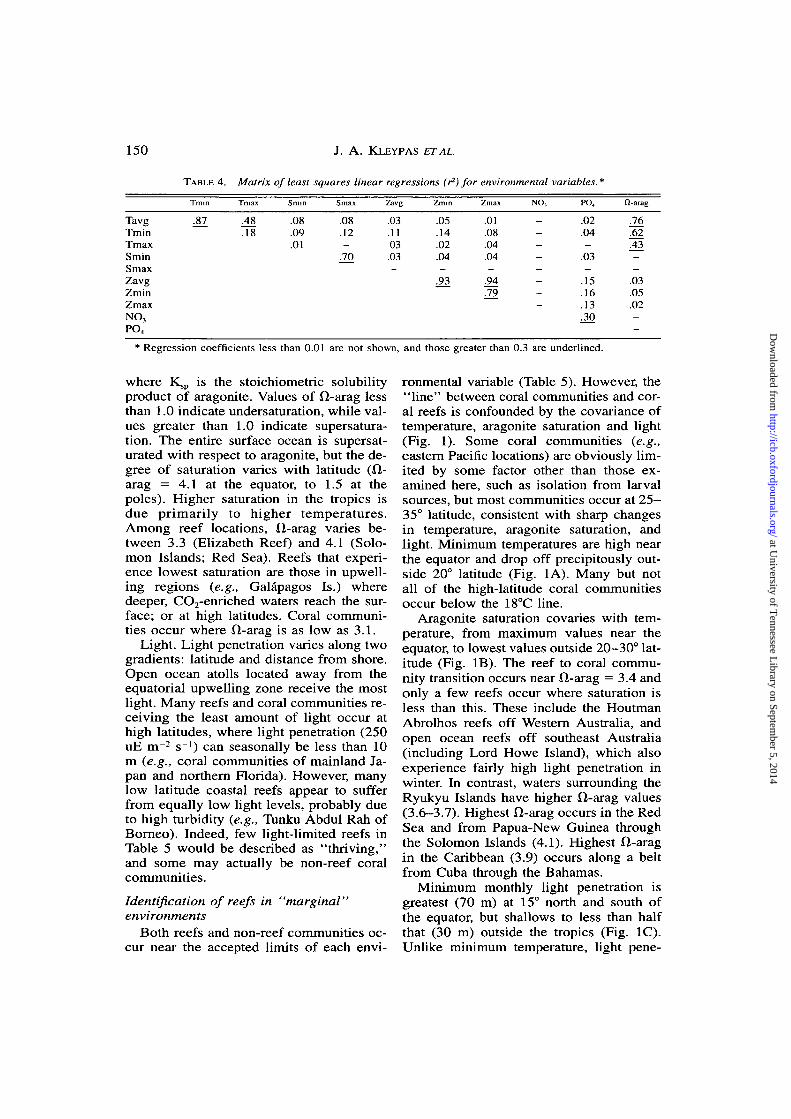
tion of environmental variables for all reefsites are summarized in Table 3. A corre-lation matrix of variables (Table 4) indi-cates that some variables are strongly cor-related, notably temperature and fl-arag (r2
at University of T
ennessee Library on Septem
ber 5, 2014http://icb.oxfordjournals.org/
Dow
nloaded from
ENVIRONMENTAL LIMITS TO REEF DEVELOPMENT
TABLE 2. Environmental data used to evaluate ReefHab locations.
149
Parameter & source
Sea surface temperatureReynolds and Marsico, 1993
SalinityLevitus, 1994
NutrientsLevitus et al., 1993
PARPinker and Laszlo, 1992a
Water transparency(CZCS attenuation coeff.)
Austin and Petzold, 1981Carbonate ion [CO,2]
Archer, 1996
Units
°c
PSU
u.mol liter"1
Wm-2
K490
u.mol kg"1
Spalial
1 deg
1 deg
1 deg
2.5 deg
18 km
2 deg
Temporal
weekly
monthly
overall avg.
monthly
monthly
overall avg.
Period of collection
1982-present
1900-present
1900-present
Jul 1987-Dec 1989
Nov 1978-Jun 1986
July 1972-Apr 1978
= 0.43-0.76), and nitrate and phosphate (r2
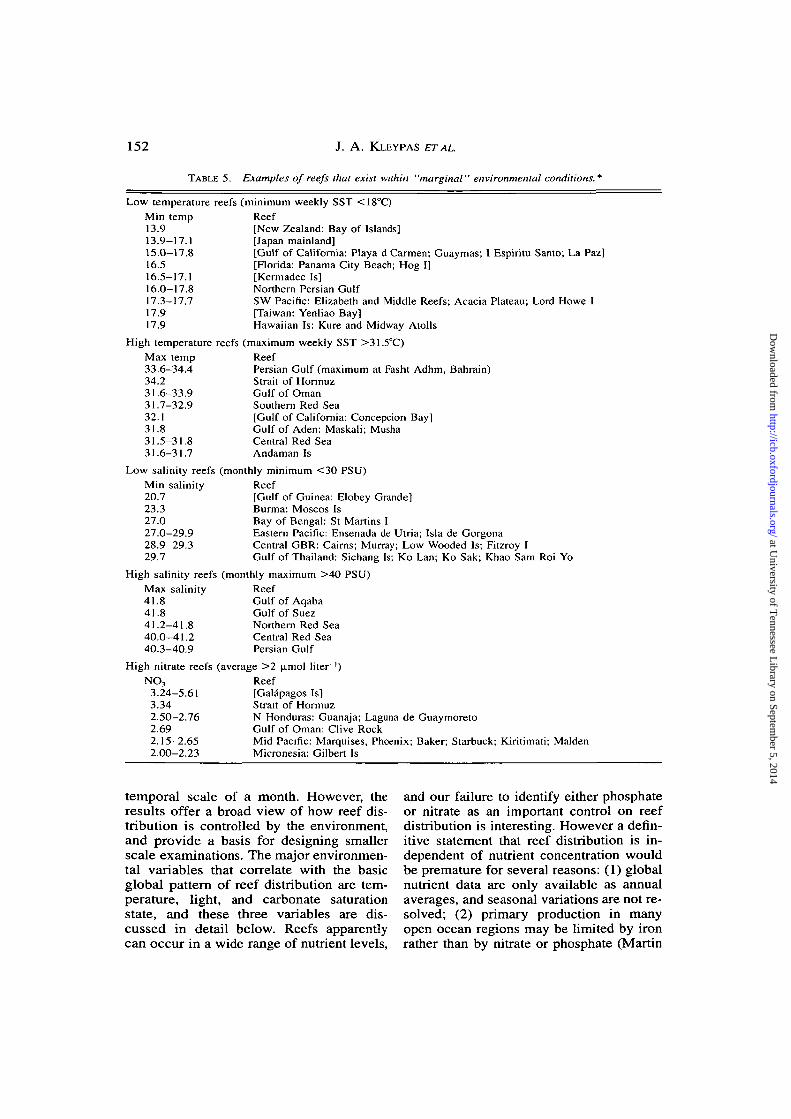
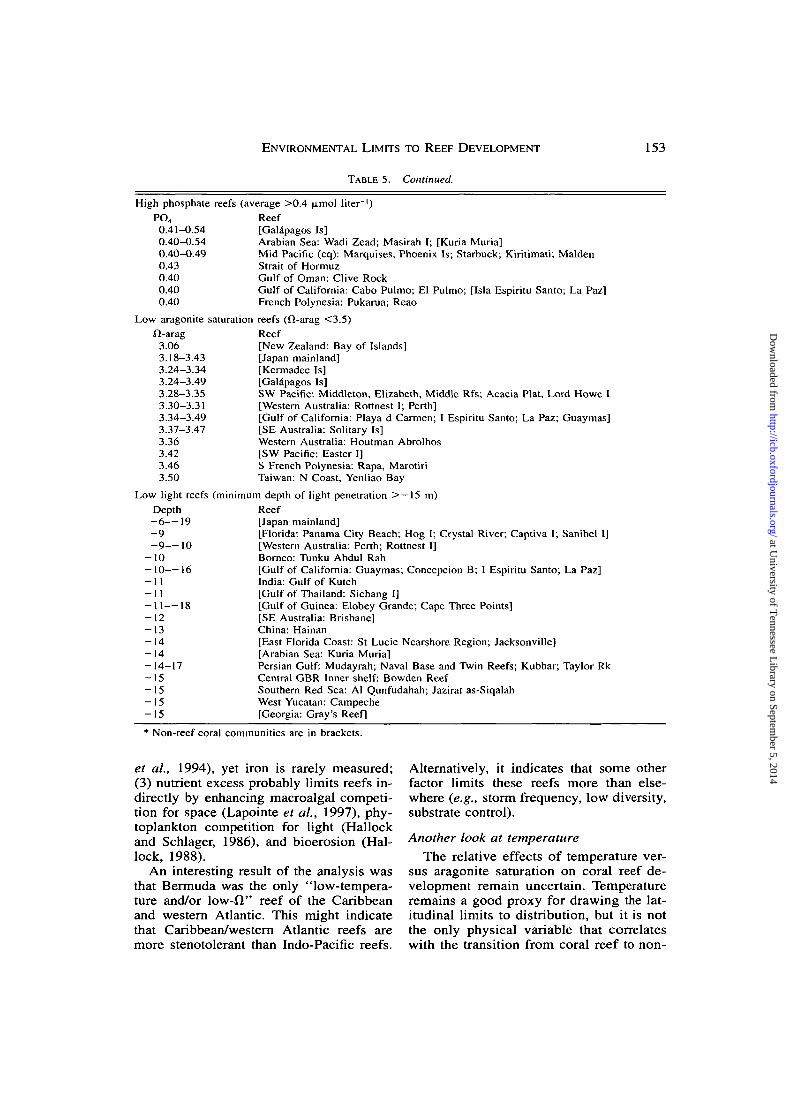
= 0.30). "Marginal" reefs and coral com-munities are identified by their proximity tothe minima or maxima of each variable (Ta-ble 5).
Temperature. Minimum weekly temper-ature for reefs is 16°C, recorded from thenorthern Persian Gulf (Kubbar and TaylorRock). Outside the Persian Gulf, minimumreef temperature is 17.3°C, at ElizabethReef off southeast Australia. The analysisdid not indicate that Red Sea reefs experi-ence weekly average temperatures less than18°C. Maximum weekly temperature onany reef site was 34.4°C, at Bahrain in thePersian Gulf. High temperature reefs are
TABLE 3. Statistically derived environmental aver-ages and extremes among reef sites (does not includenon-reef coral communities).
Variable
Temperature (°averageminimummaximum
Salinity (PSU)minimummaximum
Min
C)
21.016.024.7
23.331.2
Nutrients ((imol L ')NO,PO4
0.000.00
Max
29.528.234.4
40.041.8
3.340.54
Aragonite saturation (fl-arag)average
Max Depth ofaverageminimummaximum
3.28 4.06
Light Penetration- 9- 7
- 1 0
- 8 1- 7 2- 9 1
Avg
27.624.830.2
34.335.3
0.250.13
3.83
(m)
- 5 3- 4 0- 6 5
SD
1.11.80.6
1.20.9
0.280.08
0.09
13.513.513.4
uncommon outside semi-enclosed seas. TheAndaman Islands (Bay of Bengal), howev-er, experience temperatures to 31.7°C. Oth-er locations with high temperatures includethe Philippines (31.4°C), Spratly Islands(31.3°C), north Australia (31.2°C), and Lac-cadive Islands (31.2°C).
Salinity. The salinity range among allreef sites was 23.3-41.8 PSU, which isclose to the 25—42 range reported by Colesand Jokiel (1992). Lowest monthly salinityoccurs at Moscos Island off Burma. All lo-cations having monthly average salinitygreater than 38 are in the Red Sea and Per-sian Gulf. Among reefs outside of these twoareas, Abrolhos Reef off Brazil has thehighest salinity (37.2).
Nutrients. The modal value for both ni-trate and phosphate among all reef locationsis 0.0 |j,mol liter'1, (which indicates an im-measurable level). Ninety percent of all lo-cations have less than 0.60 u-mol liter"1 ni-trate and 90% have less than 0.20 u,mol li-ter"1 phosphate. Highest concentrations ofboth nutrients occur in the equatorial up-welling region of the eastern Pacific, nearthe Galapagos Islands (up to 5.61 u.mol li-ter"1 nitrate, and 0.54 u,mol liter"1 phos-phate). Reefs in the Strait of Hormuz alsoexperience high nutrients, while ArabianSea reefs have disproportionately highphosphate to nitrate ratios.
Aragonite Saturation. Aragonite satura-tion state (H-arag) is determined by theequation
Harag =Ksp
at University of T
ennessee Library on Septem
ber 5, 2014http://icb.oxfordjournals.org/
Dow
nloaded from
150 J. A. KLEYPAS ET AL.
TABLE 4. Matrix of least squares linear regressions (r2) for environmental variables.*
TavgTminTmaxSminSmaxZavgZminZmaxNO,PO4
Tmin
31
Tmax
.48
.18
Smin
.08
.09
.01
Smax
.08
.12_
.70
Zavg
.03
.1103.03-
Zmin
.05
.14
.02
.04_
.93
Zmax
.01
.08
.04
.04—
.94
.79
NO,
_
_
—
—
—
—
-
PO4
.02
.04—
.03_
.15
.16
.13
.30
fl-arag
.76
.62,43—_
.03
.05
.02--
* Regression coefficients less than 0.01 are not shown, and those greater than 0.3 are underlined.
where K ,̂ is the stoichiometric solubilityproduct of aragonite. Values of fl-arag lessthan 1.0 indicate undersaturation, while val-ues greater than 1.0 indicate supersatura-tion. The entire surface ocean is supersat-urated with respect to aragonite, but the de-gree of saturation varies with latitude (fl-arag = 4.1 at the equator, to 1.5 at thepoles). Higher saturation in the tropics isdue primarily to higher temperatures.Among reef locations, fl-arag varies be-tween 3.3 (Elizabeth Reef) and 4.1 (Solo-mon Islands; Red Sea). Reefs that experi-ence lowest saturation are those in upwell-ing regions (e.g., Galapagos Is.) wheredeeper, CO2-enriched waters reach the sur-face; or at high latitudes. Coral communi-ties occur where fl-arag is as low as 3.1.
Light. Light penetration varies along twogradients: latitude and distance from shore.Open ocean atolls located away from theequatorial upwelling zone receive the mostlight. Many reefs and coral communities re-ceiving the least amount of light occur athigh latitudes, where light penetration (250uE m~2 s"1) can seasonally be less than 10m (e.g., coral communities of mainland Ja-pan and northern Florida). However, manylow latitude coastal reefs appear to sufferfrom equally low light levels, probably dueto high turbidity (e.g., Tunku Abdul Rah ofBorneo). Indeed, few light-limited reefs inTable 5 would be described as "thriving,"and some may actually be non-reef coralcommunities.
Identification of reefs in "marginal"environments
Both reefs and non-reef communities oc-cur near the accepted limits of each envi-
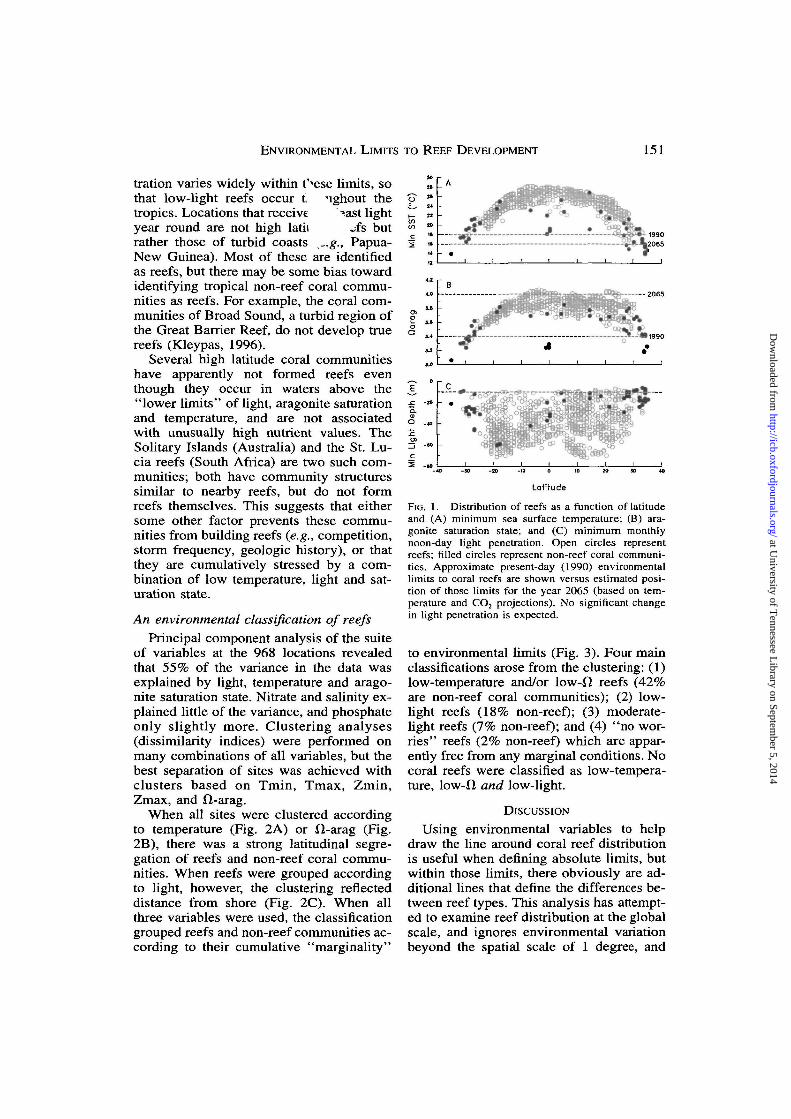
ronmental variable (Table 5). However, the"line" between coral communities and cor-al reefs is confounded by the covariance oftemperature, aragonite saturation and light(Fig. 1). Some coral communities (e.g.,eastern Pacific locations) are obviously lim-ited by some factor other than those ex-amined here, such as isolation from larvalsources, but most communities occur at 25—35° latitude, consistent with sharp changesin temperature, aragonite saturation, andlight. Minimum temperatures are high nearthe equator and drop off precipitously out-side 20° latitude (Fig. 1A). Many but notall of the high-latitude coral communitiesoccur below the 18°C line.
Aragonite saturation covaries with tem-perature, from maximum values near theequator, to lowest values outside 20—30° lat-itude (Fig. IB). The reef to coral commu-nity transition occurs near fl-arag = 3.4 andonly a few reefs occur where saturation isless than this. These include the HoutmanAbrolhos reefs off Western Australia, andopen ocean reefs off southeast Australia(including Lord Howe Island), which alsoexperience fairly high light penetration inwinter. In contrast, waters surrounding theRyukyu Islands have higher fl-arag values(3.6-3.7). Highest fl-arag occurs in the RedSea and from Papua-New Guinea throughthe Solomon Islands (4.1). Highest fl-aragin the Caribbean (3.9) occurs along a beltfrom Cuba through the Bahamas.
Minimum monthly light penetration isgreatest (70 m) at 15° north and south ofthe equator, but shallows to less than halfthat (30 m) outside the tropics (Fig. 1C).Unlike minimum temperature, light pene-
at University of T
ennessee Library on Septem
ber 5, 2014http://icb.oxfordjournals.org/
Dow
nloaded from
ENVIRONMENTAL LIMITS TO REEF DEVELOPMENT 151
tration varies widely within t^ese limits, sothat low-light reefs occur t Mghout thetropics. Locations that receive >ast lightyear round are not high latii ~fs butrather those of turbid coasts ~.g., Papua-New Guinea). Most of these are identifiedas reefs, but there may be some bias towardidentifying tropical non-reef coral commu-nities as reefs. For example, the coral com-munities of Broad Sound, a turbid region ofthe Great Barrier Reef, do not develop truereefs (Kleypas, 1996).
Several high latitude coral communitieshave apparently not formed reefs eventhough they occur in waters above the"lower limits" of light, aragonite saturationand temperature, and are not associatedwith unusually high nutrient values. TheSolitary Islands (Australia) and the St. Lu-cia reefs (South Africa) are two such com-munities; both have community structuressimilar to nearby reefs, but do not formreefs themselves. This suggests that eithersome other factor prevents these commu-nities from building reefs {e.g., competition,storm frequency, geologic history), or thatthey are cumulatively stressed by a com-bination of low temperature, light and sat-uration state.
An environmental classification of reefsPrincipal component analysis of the suite
of variables at the 968 locations revealedthat 55% of the variance in the data wasexplained by light, temperature and arago-nite saturation state. Nitrate and salinity ex-plained little of the variance, and phosphateonly slightly more. Clustering analyses(dissimilarity indices) were performed onmany combinations of all variables, but thebest separation of sites was achieved withclusters based on Tmin, Tmax, Zmin,Zmax, and fl-arag.
When all sites were clustered accordingto temperature (Fig. 2A) or fl-arag (Fig.2B), there was a strong latitudinal segre-gation of reefs and non-reef coral commu-nities. When reefs were grouped accordingto light, however, the clustering reflecteddistance from shore (Fig. 2C). When allthree variables were used, the classificationgrouped reefs and non-reef communities ac-cording to their cumulative "marginality"
- 2 0
- 4 0
-SO MmSBi 9
1si-
Latitude
FIG. 1. Distribution of reefs as a function of latitudeand (A) minimum sea surface temperature; (B) ara-gonite saturation state; and (C) minimum monthlynoon-day light penetration. Open circles representreefs; filled circles represent non-reef coral communi-ties. Approximate present-day (1990) environmentallimits to coral reefs are shown versus estimated posi-tion of those limits for the year 2065 (based on tem-perature and CO2 projections). No significant changein light penetration is expected.
to environmental limits (Fig. 3). Four mainclassifications arose from the clustering: (1)low-temperature and/or low-D reefs (42%are non-reef coral communities); (2) low-light reefs (18% non-reef); (3) moderate-light reefs (7% non-reef); and (4) "no wor-ries" reefs (2% non-reef) which are appar-ently free from any marginal conditions. Nocoral reefs were classified as low-tempera-ture, low-fl and low-light.
DISCUSSION
Using environmental variables to helpdraw the line around coral reef distributionis useful when defining absolute limits, butwithin those limits, there obviously are ad-ditional lines that define the differences be-tween reef types. This analysis has attempt-ed to examine reef distribution at the globalscale, and ignores environmental variationbeyond the spatial scale of 1 degree, and
at University of T
ennessee Library on Septem
ber 5, 2014http://icb.oxfordjournals.org/
Dow
nloaded from
152 J. A. KJLEYPAS ETAL
TABLE 5. Examples of reefs that exist within "marginal" environmental conditions.*
Low temperature reefs (minimum weekly SST <18°C)Min temp Reef13.9 [New Zealand: Bay of Islands]13.9-17.1 [Japan mainland]15.0-17.8 [Gulf of California: Playa d Carmen; Guaymas; I Espiritu Santo; La Paz]16.5 [Florida: Panama City Beach; Hog I]16.5-17.1 [Kermadec Is]16.0-17.8 Northern Persian Gulf17.3-17.7 SW Pacific: Elizabeth and Middle Reefs; Acacia Plateau; Lord Howe I17.9 [Taiwan: Yenliao Bay]17.9 Hawaiian Is: Kure and Midway Atolls
High temperature reefs (maximum weekly SST >31.5°C)Max temp Reef33.6—34.4 Persian Gulf (maximum at Fasht Adhm, Bahrain)34.2 Strait of Hormuz31.6-33.9 Gulf of Oman31.7-32.9 Southern Red Sea32.1 [Gulf of California: Concepcion Bay]31.8 Gulf of Aden: Maskali; Musha31.5-31.8 Central Red Sea31.6-31.7 Andaman Is
Low salinity reefs (monthly minimum <30 PSU)Min salinity Reef20.7 (Gulf of Guinea: Elobey Grande]23.3 Burma: Moscos Is27.0 Bay of Bengal: St Martins I27.0-29.9 Eastern Pacific: Ensenada de Utria; Isla de Gorgona28.9-29.3 Central GBR: Cairns; Murray; Low Wooded Is; Fitzroy I29.7 Gulf of Thailand: Sichang Is; Ko Lan; Ko Sak; Khao Sam Roi Yo
High salinity reefs (monthly maximum >40 PSU)Max salinity Reef41.8 GulfofAqaba41.8 Gulf of Suez41.2-41.8 Northern Red Sea40.0-41.2 Central Red Sea40.3-40.9 Persian Gulf
High nitrate reefs (average >2 ^mol liter ')NO, Reef
3.24-5.61 [Galapagos Is]3.34 Strait of Hormuz2.50—2.76 N Honduras: Guanaja; Laguna de Guaymoreto2.69 Gulf of Oman: Clive Rock2.15-2.65 Mid Pacific: Marquises, Phoenix; Baker; Starbuck; Kiritimati; Maiden2.00-2.23 Micronesia: Gilbert Is
temporal scale of a month. However, the and our failure to identify either phosphateresults offer a broad view of how reef dis- or nitrate as an important control on reeftribution is controlled by the environment, distribution is interesting. However a defin-and provide a basis for designing smaller itive statement that reef distribution is in-scale examinations. The major environmen- dependent of nutrient concentration wouldtal variables that correlate with the basic be premature for several reasons: (1) globalglobal pattern of reef distribution are tern- nutrient data are only available as annualperature, light, and carbonate saturation averages, and seasonal variations are not re-state, and these three variables are dis- solved; (2) primary production in manycussed in detail below. Reefs apparently open ocean regions may be limited by ironcan occur in a wide range of nutrient levels, rather than by nitrate or phosphate (Martin
at University of T
ennessee Library on Septem
ber 5, 2014http://icb.oxfordjournals.org/
Dow
nloaded from
ENVIRONMENTAL LIMITS TO REEF DEVELOPMENT 153
TABLE 5. Continued.
High phosphate reefs (average >0.4 u.mol liter"1)PO4 Reef
0.41-0.54 [Galapagos Is]0.40-0.54 Arabian Sea: Wadi Zead; Masirah I; [Kuria Muria]0.40—0.49 Mid Pacific (eq): Marquises, Phoenix Is; Starbuck; Kiritimati; Maiden0.43 Strait of Hormuz0.40 Gulf of Oman: Clive Rock0.40 Gulf of California: Cabo Pulmo; El Pulmo; [Isla Espiritu Santo; La Paz]0.40 French Polynesia: Pukarua; Reao
Low aragonite saturation reefs (fl-arag <3.5)Sl-arag Reef
3.06 [New Zealand: Bay of Islands]3.18-3.43 [Japan mainland]3.24-3.34 [Kermadec Is]3.24-3.49 [Galapagos Is]3.28-3.35 SW Pacific: Middleton, Elizabeth, Middle Rfs; Acacia Plat, Lord Howe I3.30-3.31 [Western Australia: Rottnest I; Perth]3.34-3.49 [Gulf of California: Playa d Carmen; I Espiritu Santo; La Paz; Guaymas]3.37-3.47 [SE Australia: Solitary Is]3.36 Western Australia: Houtman Abrolhos3.42 [SW Pacific: Easter I]3.46 S French Polynesia: Rapa, Marotiri3.50 Taiwan: N Coast, Yenliao Bay
Low light reefs (minimum depth of light penetration >—15 m)Depth Reef-6—-19 [Japan mainland]- 9 [Florida: Panama City Beach; Hog I; Crystal River; Captiva I; Sanibel I]- 9 — 1 0 [Western Australia: Perth; Rottnest I]
- 1 0 Borneo: Tunku Abdul Rah- 1 0 - - 16 [Gulf of California: Guaymas; Concepcion B; I Espiritu Santo; La Paz]-11 India: Gulf of Kutch-11 [Gulf of Thailand: Sichang I]-11—18 [Gulf of Guinea: Elobey Grande; Cape Three Points]— 12 [SE Australia: Brisbane]— 13 China: Hainan-14 [East Florida Coast: St Lucie Nearshore Region; Jacksonville]-14 [Arabian Sea: Kuria Muria]— 14-17 Persian Gulf: Mudayrah; Naval Base and Twin Reefs; Kubbar; Taylor Rk- 1 5 Central GBR Inner shelf: Bowden Reef— 15 Southern Red Sea: Al Qunfudahah; Jazirat as-Siqalah— 15 West Yucatan: Campeche-15 [Georgia: Gray's Reef]
* Non-reef coral communities are in brackets.
et al., 1994), yet iron is rarely measured; Alternatively, it indicates that some other(3) nutrient excess probably limits reefs in- factor limits these reefs more than else-directly by enhancing macroalgal competi- where (e.g., storm frequency, low diversity,tion for space (Lapointe et al, 1997), phy- substrate control),toplankton competition for light (Hallockand Schlager, 1986), and bioerosion (Hal- Another look at temperaturelock, 1988). The relative effects of temperature ver-
An interesting result of the analysis was sus aragonite saturation on coral reef de-that Bermuda was the only "low-tempera- velopment remain uncertain. Temperatureture and/or low-fi" reef of the Caribbean remains a good proxy for drawing the lat-and western Atlantic. This might indicate itudinal limits to distribution, but it is notthat Caribbean/western Atlantic reefs are the only physical variable that correlatesmore stenotolerant than Indo-Pacific reefs, with the transition from coral reef to non-
at University of T
ennessee Library on Septem
ber 5, 2014http://icb.oxfordjournals.org/
Dow
nloaded from
154 J. A. KLEYPAS ETAL.
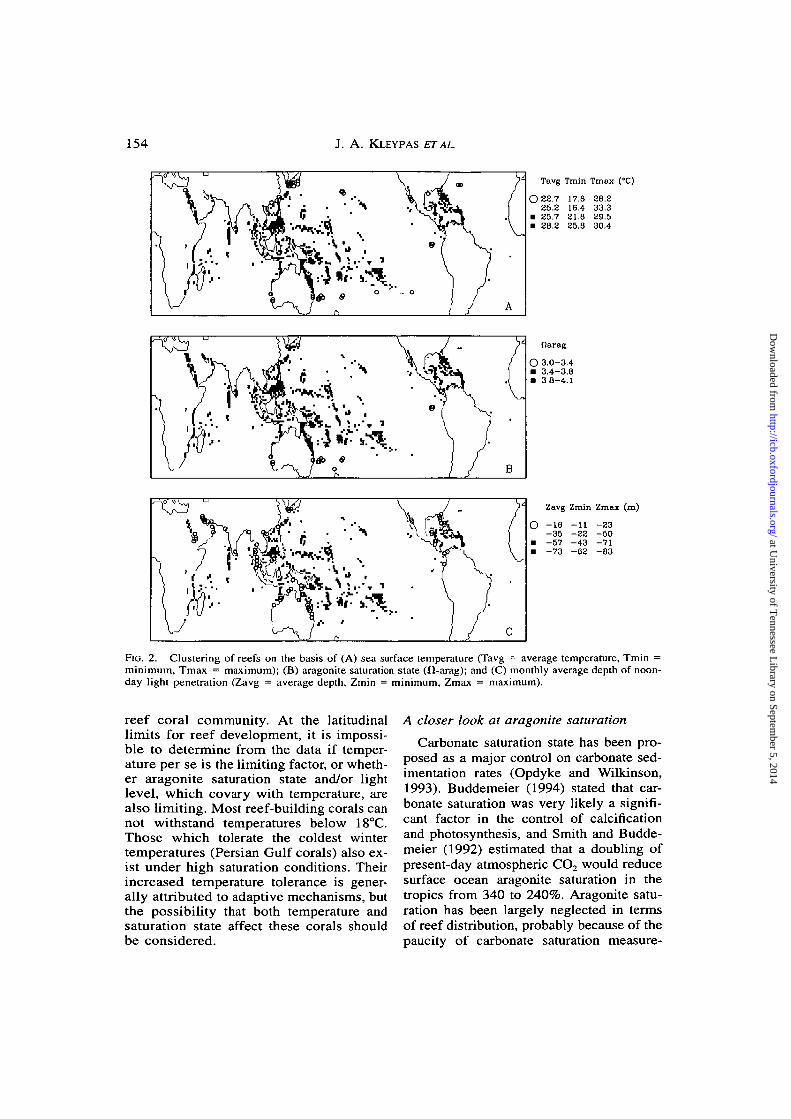
Tavg Tmin Tmax (°C)
O 22.7 17.6 28.225.2 16.4 33.3
• 25.7 21.8 29.5• 28.2 25.8 30.4
"ChH
w
*&:VT.
"V / o
^
Oarag
Zavg Zmin Zmax (m)
O -16 -11 -23-35 -22 -50
• -57 -43 -71• -73 -62 -83
FIG. 2. Clustering of reefs on the basis of (A) sea surface temperature (Tavg = average temperature, Tmin =minimum, Tmax = maximum); (B) aragonite saturation state (ft-arag); and (C) monthly average depth of noon-day light penetration (Zavg = average depth, Zmin = minimum, Zmax = maximum).
reef coral community. At the latitudinallimits for reef development, it is impossi-ble to determine from the data if temper-ature per se is the limiting factor, or wheth-er aragonite saturation state and/or lightlevel, which covary with temperature, arealso limiting. Most reef-building corals cannot withstand temperatures below 18°C.Those which tolerate the coldest wintertemperatures (Persian Gulf corals) also ex-ist under high saturation conditions. Theirincreased temperature tolerance is gener-ally attributed to adaptive mechanisms, butthe possibility that both temperature andsaturation state affect these corals shouldbe considered.
A closer look at aragonite saturation
Carbonate saturation state has been pro-posed as a major control on carbonate sed-imentation rates (Opdyke and Wilkinson,1993). Buddemeier (1994) stated that car-bonate saturation was very likely a signifi-cant factor in the control of calcificationand photosynthesis, and Smith and Budde-meier (1992) estimated that a doubling ofpresent-day atmospheric CO2 would reducesurface ocean aragonite saturation in thetropics from 340 to 240%. Aragonite satu-ration has been largely neglected in termsof reef distribution, probably because of thepaucity of carbonate saturation measure-
at University of T
ennessee Library on Septem
ber 5, 2014http://icb.oxfordjournals.org/
Dow
nloaded from
ENVIRONMENTAL LIMITS TO REEF DEVELOPMENT 155
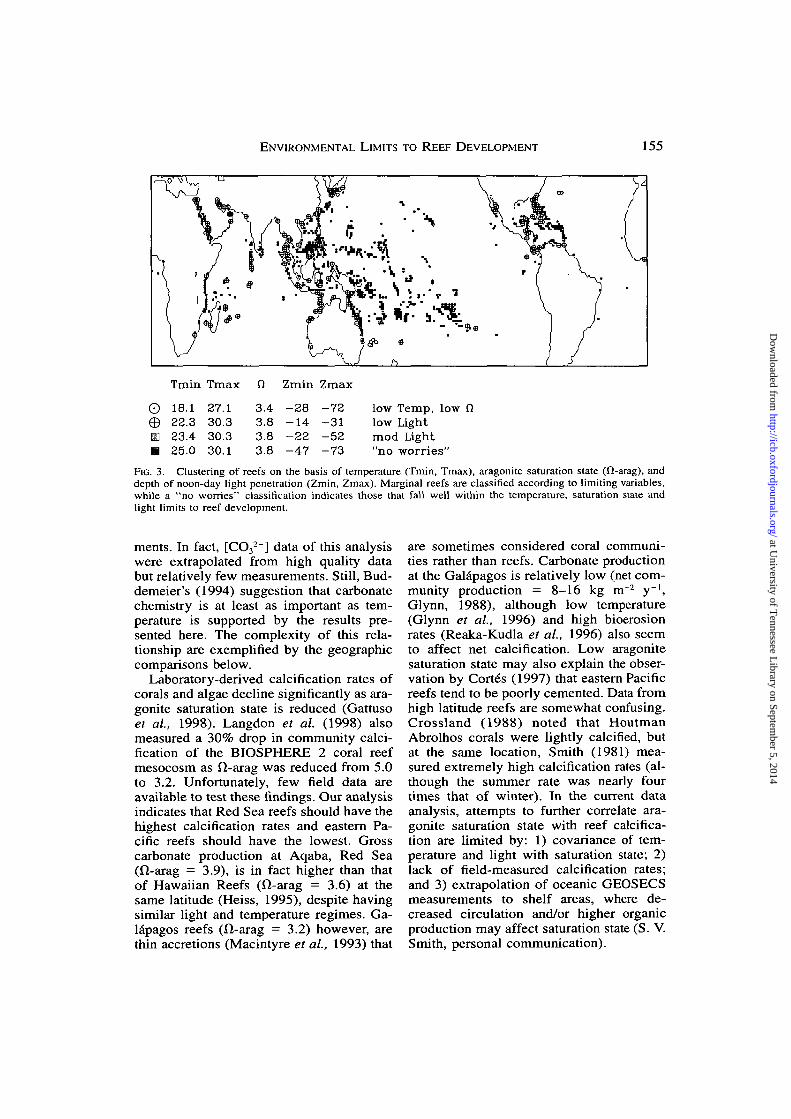
mm
Tmin
18.122.323.425.0
Tmax
27.130.330.330.1
n3.43.83.83.8
Zmin
- 2 8- 1 4- 2 2- 4 7
Zmax
- 7 2- 3 1- 5 2- 7 3
lowlow
Temp, low f)Light
mod Light"no worries"
FIG. 3. Clustering of reefs on the basis of temperature (Tmin, Tmax), aragonite saturation state (fl-arag), anddepth of noon-day light penetration (Zmin, Zmax). Marginal reefs are classified according to limiting variables,while a "no worries" classification indicates those that fall well within the temperature, saturation state andlight limits to reef development.
merits. In fact, [CO32~] data of this analysis
were extrapolated from high quality databut relatively few measurements. Still, Bud-demeier's (1994) suggestion that carbonatechemistry is at least as important as tem-perature is supported by the results pre-sented here. The complexity of this rela-tionship are exemplified by the geographiccomparisons below.
Laboratory-derived calcification rates ofcorals and algae decline significantly as ara-gonite saturation state is reduced (Gattusoet al., 1998). Langdon et al. (1998) alsomeasured a 30% drop in community calci-fication of the BIOSPHERE 2 coral reefmesocosm as fl-arag was reduced from 5.0to 3.2. Unfortunately, few field data areavailable to test these findings. Our analysisindicates that Red Sea reefs should have thehighest calcification rates and eastern Pa-cific reefs should have the lowest. Grosscarbonate production at Aqaba, Red Sea(fl-arag = 3.9), is in fact higher than thatof Hawaiian Reefs (fl-arag = 3.6) at thesame latitude (Heiss, 1995), despite havingsimilar light and temperature regimes. Ga-lapagos reefs (fl-arag = 3.2) however, arethin accretions (Macintyre et al., 1993) that
are sometimes considered coral communi-ties rather than reefs. Carbonate productionat the Galapagos is relatively low (net com-munity production = 8-16 kg m~2 y~',Glynn, 1988), although low temperature(Glynn et al., 1996) and high bioerosionrates (Reaka-Kudla et al., 1996) also seemto affect net calcification. Low aragonitesaturation state may also explain the obser-vation by Cortes (1997) that eastern Pacificreefs tend to be poorly cemented. Data fromhigh latitude reefs are somewhat confusing.Crossland (1988) noted that HoutmanAbrolhos corals were lightly calcified, butat the same location, Smith (1981) mea-sured extremely high calcification rates (al-though the summer rate was nearly fourtimes that of winter). In the current dataanalysis, attempts to further correlate ara-gonite saturation state with reef calcifica-tion are limited by: 1) covariance of tem-perature and light with saturation state; 2)lack of field-measured calcification rates;and 3) extrapolation of oceanic GEOSECSmeasurements to shelf areas, where de-creased circulation and/or higher organicproduction may affect saturation state (S. V.Smith, personal communication).
at University of T
ennessee Library on Septem
ber 5, 2014http://icb.oxfordjournals.org/
Dow
nloaded from
156 J. A. KLEYPAS ETAL.
The broad effects of light
Depth of light penetration has never beenquantitatively analyzed as a control on reefdistribution, due primarily to the lack oflight data for the ocean surface. The dataused here are only satellite-based estimatesof light penetration. Nevertheless, thesedata indicate that light penetration variesmore than any environmental factor of thisanalysis. Reduced growth rates at higherlatitudes are often attributed to low temper-atures, but the evidence here indicates that,just as light attenuation explains reducedreef calcification with depth, seasonally lowlight penetration at high latitudes may limitreef calcification to shallower depths thanin the tropics (Grigg, 1982).
In terms of a reef's ability to cope withenvironmental change, adaptations to vary-ing light conditions are the most obvious.Many studies (not discussed here) docu-ment the photoadaptive mechanisms of cor-als, from morphological plasticity to zoo-xanthellae density, to either optimize orcope with available light. These mecha-nisms allow many coral species to maintainmetabolic functions over a broad lightrange. Photosynthesis : irradiance curvesshow that most corals function uniformlyacross a range of light intensity, then de-cline rapidly outside that range (Chalker,1981). Even though corals receive less lightat high latitudes, acceptable light levels canstill be found in shallow waters, and themetabolic functions of those corals shouldbe similar to those that receive more lightin the tropics. This could explain why met-abolic studies performed on shallow reefflats show little variation with latitude (al-though see Pichon's [1997] discussion ofhigh metabolic variability as a function ofcommunity composition, season and reeftype).
Despite the adaptions to changing lightlevels, coral reefs do have minimum lightrequirements. As light penetration decreas-es outside the tropics, depth of reef growthshallows accordingly. Active reef growth athigh latitude is restricted to relatively shal-low depths (e.g., Lord Howe Island, Har-riott et al, 1995; Ryukyus, Kan et al, 1995,and Iryu et al, 1995; Kermadec Islands,
Schiel et al., 1986). Many light-limited cor-al communities listed in Table 5 {e.g., Gulfof Thailand, Gulf of Guinea) are not mar-ginal in terms of the other variables. Ofcourse, low light at some locations is dueto high suspended sediment, which itself islimiting to reef growth.
Does environmental classification reflectreef function?
Previous reef classification schemes havebeen based on geomorphology (e.g., atolls,barrier, fringing etc.). These are useful interms of historical reef development, partic-ularly with respect to sea level change andsubstrate control. Over shorter time periods,and as we enter a century of rapid globalchange, an environment-based reef classi-fication should be useful for predicting reefresponse if the classification reflects reeffunction (metabolism, nutrient cycling, cal-cification). Reef function appears to be uni-form across the latitudinal distribution ofreefs (see review of Kinsey, 1985), then de-clines rapidly at the poleward threshold ofreef distribution (Hopley, 1989). Likewise,temperature, light and saturation state re-main fairly uniform in the tropics, then alsodecline rapidly at this threshold (Fig. 1).
An environment-based reef classificationallows one to compare coral reef distribu-tion with coral reef function. For example,if light is important to overall reef function,then the wide range of light regimes acrossthe global distribution of coral reefs indi-cates that reef function varies across a con-tinental shelf as much as it does from trop-ics to high latitudes. Hopley (1989) pointedout that numbers of coral species, coralgrowth rates, and reef framework decreasedmuch more rapidly across continentalshelves than across latitudinal zones. Like-wise, the strong correlation of aragonite sat-uration state with reef distribution compelsus to more closely examine this variable interms of overall reef function. This envi-ronment-based classification will be leastuseful at sites which are affected by someother, overriding factor; for example, reefswhich are geographically isolated (easternPacific, Cortes, 1997; Brazilian coastline,Carannante et al., 1988), or which sufferfrequent storm damage (e.g., Buck Island
at University of T
ennessee Library on Septem
ber 5, 2014http://icb.oxfordjournals.org/
Dow
nloaded from
ENVIRONMENTAL LIMITS TO REEF DEVELOPMENT 157
Bar, Macintyre and Adey, 1990). However,such variables can certainly be used to re-fine the classification.
Coral reef response to global changeEstimating how reefs will respond to
global change, relies on our understandingof how reefs are distributed relative to theenvironment. Of the three major variablesaddressed in this paper, large-scale shifts inlight distribution are not likely, but globalshifts in aragonite saturation and SST areprobable. The IPCC (Houghton et al.,1996) predicts that by the middle of nextcentury, atmospheric CO2 concentrationwill reach twice the preindustrial level, andatmospheric temperatures will increase byabout 2°C. Surface ocean uptake of CO2will reduce aragonite saturation state byabout 30% (Gattuso et al, 1999), and thecurrent O-arag isoline of 3.5 will shift equa-torward by at least 15 degrees latitude (Fig.1). Alternatively, a 2°C increase in SST willmove the 18°C isotherm poleward about 5degrees latitude (Fig. 1). In the simplestanalysis, if reefs are restricted by tempera-ture, then we would expect an expansion ofreefs poleward; but if reefs are restricted bysaturation state, then we would expect aconstriction of reefs equatorward. The di-chotomy of this prediction will only be re-solved through closer examination of thesetwo controls.
In a more complicated analysis, the tran-sition from coral reefs to non-reef buildingcoral communities at high latitudes is oftenattributed to biological factors such as de-creased coral diversity, increased competi-tion with macroalgae, and increased bio-erosion. We considered these factors to besecondary at the global scale. However,where coral reefs are limited by competitionwith adjacent communities, their futuremay be determined more by response of thecompeting community to global change,than by environmental changes alone.
CONCLUSIONS
When analyzing ecological distributions,researchers naturally use data that are read-ily available or easy to measure. Tempera-ture is probably the most widely measuredocean variable, and since the initial obser-
vation of Vaughan (1919) that coral reefsare restricted to waters where annual mini-mum temperature is greater than 18°C, ithas remained a good environmental proxyfor drawing the line around reef distribu-tion. However, with respect to future studiesof reef response to global change, this studyemphasizes the need to investigate variablesthat are less well understood but which mayplay a role in determining the fate of reefsin a rapidly changing world. In particular,this attempt to define the environmentallimits to reef development points to twomajor areas for further investigation. First,as pointed out by Smith and Buddemeier(1992) and Buddemeier (1994), the role ofaragonite saturation state in limiting coralreef distribution needs to be defined. Sec-ond, although light has always been rec-ognized as an important control on coralgrowth, this relationship needs to be quan-tified at the level of coral communities andreefs. This exercise has not drawn a distinctline around coral reef and coral communitylimits, but it does enable one to approachthe question "where do we draw the line"with more information at hand.
ACKNOWLEDGMENTS
We salute Bob Buddemeier's unfounder-ing ability to paint the big picture for thoseof us who fail to see the "reefs for the cor-als." We greatly appreciate the intellectualsupport of SCOR Working Group 104members, and financial support of SCOR,LOICZ, the NOAA Coastal Ocean Pro-gram, and SICB. David Archer providedthe [CO3
2~] data (several times). We extendspecial thanks to the crewmembers behindReefBase for their hard work: M. A. Ablan,B. M. Vallejo, M. L. G. Gorospe, K. P. K.Reyes, S. G. Vergara, G. U. Coronado, I.D. Uy, C. F. Cabote, P. E. Ziegler, K. Hay-wood, and L. Halmarick. Suggestions fromDavid Hopley and two anonymous review-ers greatly improved the manuscript.
REFERENCES
Achituv, Y. and Z. Dubinsky. 1990. Evolution and zoo-geography of coral reefs. In Z. Dubinsky (ed.),Ecosystems of the world 25. Coral Reefs, Chapter1, pp. 1-9. Elsevier, Amsterdam.
Archer, D. E. 1996. An atlas of the distribution of cal-
at University of T
ennessee Library on Septem
ber 5, 2014http://icb.oxfordjournals.org/
Dow
nloaded from
158 J. A. KLEYPAS ETAL.
cium carbonate in sediments of the deep sea.Global Biogeochemical Cycles 10:159-174.
Austin, R. W. and T. J. Petzold. 1981. The determi-nation of the diffuse attenuation coefficient of seawater using the coastal zone color scanner. In J.F. R. Gower (ed.), Oceanography from space, pp.239-256. Plenum Press, New York.
Bosscher, H. and J. Southam. 1992. CARBPLAT—acomputer model to simulate the development ofcarbonate platforms. Geology 20:235-238.
Bosscher, H. and W. Schlager. 1992. Computer simu-lation of reef growth. Sedimentology 39:503-512.
Buddemeier, R. W. 1994. Symbiosis, calcification, andenvironmental interactions. Bulletin de l'lnstitutoceanographique, Monaco, n° special 13:119-131.
Buddemeier, R. W. and S. V. Smith. 1999. Coral ad-aptation and acclimatization: A most ingeniousparadox. Amer. Zool. 39:1-9.
Carannante, G., M. Esteban, J. D. Milliman, and L.Simone. 1988. Carbonate lithofacies as paleolati-tude indicators: Problems and limitations. Sed.Geol. 60:333-346.
Chalker, B. E. 1981. Simulating light-saturation curvesfor photosynthesis and calcification by reef-build-ing corals. Mar. Biol. 63:135-141.
Coles, S. L. and Y. H. Fadlallah. 1991. Reef coral sur-vival and mortality at low temperatures in the Ara-bian Gulf: New species-specific lower temperaturelimits. Coral Reefs 9:231-237.
Coles, S. L. and P. Jokiel. 1992. Effects of salinity oncoral reefs. In D. W. Connell and D. W. Hawker(eds.), Pollution in tropical aquatic systems,Chapter 6, pp. 147-166. CRC Press, Boca Raton.
Cortes, J. 1997. Biology and geology of eastern Pacificcoral reefs. Coral Reefs 16(suppl.):S39-S46.
Crossland, C. J. 1988. Latitudinal comparison of coralreef structure and function. Proc. 6th Int. CoralReef Sym. 1:221-226.
DiSalvo, L. H., J. E. Randall, and A. Cea. 1988. Eco-logical reconnaissance of the Easter Island sublit-toral marine environment. Nat. Geogr. Res. 4:451-473.
Gattuso, J.-P., I. Bourge, M. Frankignoulle, S. Ro-maine, and R. W. Buddemeier. 1998. Effect of cal-cium carbonate saturation of seawater on coralcalcification. Global and Planetary Change 18:37-46.
Gattuso, J.-P., D. Allemand, and M. Frankignoulle.1999. Photosynthesis and calcification at cellular,organismal and community levels in coral reefs:A review on interactions and control by carbonatechemistry. Amer. Zool. 39:160-183.
Glynn, P. W. 1988. El Nino warming, coral mortalityand reef framework destruction by echinoid bio-erosion in the eastern Pacific. Galaxea 7:129-160.
Glynn, P. W., J. E. N. Veron, and G. M. Wellington.1996. Clipperton Atoll (eastern Pacific): Ocean-ography, geomorphology, reef-building coral ecol-ogy and biogeography. Coral Reefs 15:71-99.
Grigg, R. W. 1982. Darwin Point: A threshold for atollformation. Coral Reefs 1:29-34.
Hallock, P. 1988. The role of nutrient availability inbioerosion: Consequences to carbonate buildups.Palaeogeogr. Palaeoclim. Palaeoecol. 63:275-291.
Hallock, P. and W. Schlager. 1986. Nutrient excess andthe demise of coral reefs and carbonate platforms.Palaios 1:389-398.
Harriott, V. J., S. D. A. Smith, and P. L. Harrison.1994. Patterns of coral community structure ofsubtropical reefs in the Solitary Islands MarineReserve, eastern Australia. Mar. Ecol. Prog. Ser.109:67-76.
Harriott, V. J., P. L. Harrison, and S. A. Banks. 1995.The coral communities of Lord Howe Island. Mar.Freshw. Res. 4:457-465.
Heiss, G. A. 1995. Carbonate production by sclerac-tinian corals at Aqaba, Gulf of Aqaba, Red Sea.Facies 33:19-34.
Hopley, D. 1989. Coral reefs: Zonation, zonality andgradients. In E. C. F. Bird and D. Kelletat (eds.),Zonality of coastal geomorphology and ecology.Proceedings of the Sylt Symposium, Essener Geo-graphische Arbeiten, Bd. 18:79-123.
Houghton, J. T, L. G. Meira Filho, B. H. Callander,N. Harris, A. Kattenberg, and K. Maskell. 1996.Climate change 1995. The science of climatechange. Cambridge Univ. Press, Cambridge.
Iryu, Y., T. Nakamori, S. Matsuda, and A. Osame.1995. Distribution of marine organisms and itsgeological significance in the modern reef com-plex of the Ryukyu Islands. Sed. Geol. 99:243-258.
Kan, H., N. Hori, Y. Nakashima, and K. Ichikawa.1995. The evolution of narrow reef flats at high-latitude in the Ryukyu Islands. Coral Reefs 14:123-130.
Kinsey, D. W. 1985. Metabolism, calcification and car-bon production. I. Systems level studies. Proc. 5th
Int. Coral Reef Sym. 4:505-526.Kleypas, J. A. 1996. Coral reef development under nat-
urally turbid conditions: Fringing reefs near BroadSound, Australia. Coral Reefs 15:153-167.
Kleypas, J. A. 1997. Modeled estimates of global reefhabitat and carbonate production since the lastglacial maximum. Paleoceanography 12:533-545.
Langdon, C, T. Takahashi, T. McConnaughey, H. An-derson, and H. West. 1998. Effect of calcium car-bonate saturation state on the rate of calcificationof an experimental coral reef. Amer. Zool. 37:72A.
Lapointe, B. E., M. M. Littler, and D. S. Littler. 1997.Macroalgal overgrowth of fringing coral reefs atDiscovery Bay, Jamaica: Bottom-up versus top-down control. Proc. 8th Int. Coral Reef Sym. 1:927-932.
Levitus, S. 1994. Climatological atlas of the worldocean. NOAA Prof. Paper, 13, Rockville, MD.
Levitus, S., M. E. Conkright, J. L. Reid, R. G. Najjar,and A. Mantyla. 1993. Distribution of nitrate,phosphate and silicate in the world oceans. Prog.Oceanography 31:245—273.
Macintyre, I. G. and W. H. Adey. 1990. Buck IslandBar, St. Croix, USVI: A reef that cannot catch upwith sea level. Atoll Res. Bull. no. 336.
Macintyre, I. G., P. W. Glynn, and J. Cortes. 1993.Holocene reef history in the eastern Pacific: Main-land Costa Rica, Canos Island, Cocos Island, and
at University of T
ennessee Library on Septem
ber 5, 2014http://icb.oxfordjournals.org/
Dow
nloaded from
ENVIRONMENTAL LIMITS TO REEF DEVELOPMENT 159
Galapagos Islands. Proc. 7th Int. Coral Reef Sym.2:1174-1184.
Martin, J. M. and 43 others. 1994. Testing the ironhypothesis in ecosystems of the equatorial PacificOcean. Nature 371:123-129.
Mucci, A. 1983. The solubility of calcite and aragonitein seawater at various salinities, temperatures, andone atmosphere total pressure. Am. J. Sci. 283:780-799.
Opdyke, B. N. and B. H. Wilkinson. 1993. Carbonatemineral saturation state and cratonic limestone ac-cumulation. Am. J. Sci. 293:217-234.
Pichon, M. 1997. Coral reef metabolism in the Indo-Pacific: The broader picture. Proc. 8th Int. CoralReef Sym. 1:977-980.
Pinker, R. T. and I. Laszlo. 1992a. Global distributionof photosynthetically active radiation as observedfrom satellites. J. Climate 5:56-65.
Pinker, R. T. and I. Laszlo. 19926. Modeling surfacesolar irradiance for satellite solar irradiance appli-cations on a global scale. J. Appl. Meteor. 31:194-211.
Reaka-Kudla, M. L., J. S. Feingold, and W. Glynn.1996. Experimental studies of rapid bioerosion ofcoral reefs in the Galapagos Islands. Coral Reefs15:101-107.
ReefBase. 1996. ReefBase: A global database on coralreefs and their resources. Ver. 1.0. CD-ROM,ICLARM, Manila.
Reynolds, R. W. and D. C. Marsico. 1993. An im-proved real-time global sea surface temperatureanalysis. J. Climate 6:768-774.
Reynolds, R. W. and T. M. Smith. 1994. A high res-olution global sea surface climatology. J. Climate7:929-948.
Riegl, B., M. H. Schleyer, P. J. Cook, and G. M.Branch. 1995. Structure of Africa's southernmostcoral communities. Bull. Mar. Sci. 56:676-691.
Schiel, D. R., M. J. Kingsford, and J. H. Choat. 1986.Depth distribution and abundance of benthic or-ganisms and fishes at the subtropical KermadecIslands. NZ J. Mar. Freshw. Res. 20:521-535.
Smith, S. V. 1981. The Houtman Abrolhos Islands:Carbon metabolism of coral reefs at high latitude.Limnol. Oceanogr. 26:612-621.
Smith, S. V. and R. W. Buddemeier. 1992. Globalchange and coral reef ecosystems. Annu. Rev.Ecol. Syst. 23:89-118.
Szmant, A. M. 1997. Nutrient effects on coral reefs:A hypothesis on the importance of topographicand trophic complexity to reef nutrient dynamics.Proc. 8th Int. Coral Reef Sym. 2:1527-1532.
Takahashi, T, W. S. Broecker, A. E. Bainbridge, andR. E Weiss. 1980. Carbonate chemistry of the At-lantic, Pacific, and Indian Oceans: The results ofthe GEOSECS expeditions. 1972-1978. NationalScience Foundation, Washington, D.C.
Vaughan, T. W. 1919. Corals and the formation of coralreefs. Annu. Rep. Smithson. Inst. 17:189-238.
Veron, J. E. N. 1993. A biogeographic database of her-matypic corals. Species of the central Indo-Pacific,genera of the world. Aust. Inst. Mar. Sci. Mono-graph Series, Vol. 10.
Corresponding Editor: Kirk Miller
at University of T
ennessee Library on Septem
ber 5, 2014http://icb.oxfordjournals.org/
Dow
nloaded from