Embed Size (px)
Citation preview
Environmental LCA of Irish dairy products Dr William Finnegan, NUI GalwayDr Jamie Goggins, NUI GalwayDr Eoghan Clifford, NUI GalwayProf Xinmin Zhan, NUI Galway

Presentation contents
• Introduction
• Macro-scale study
• Environmental LCA using plant data
• Discussion points

Presentation contents
• Introduction
• Macro-scale study
• Environmental LCA using plant data
• Discussion points
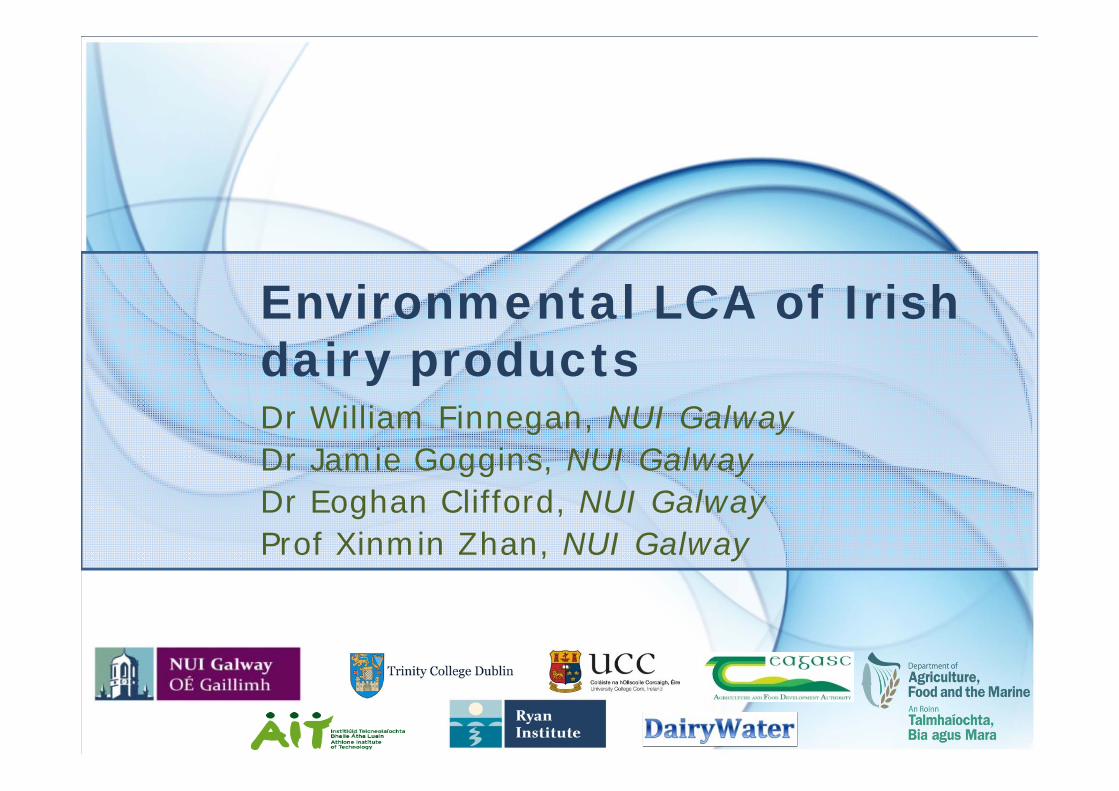
Irish milk production
0
100
200
300
400
500
600
700
800
900
1000
Jan Feb Mar Apr May Jun Jul Aug Sep Oct Nov Dec
Milk produ
ction (m
illion litres)
Avg. (2007 ‐ 2009)
2014
2015
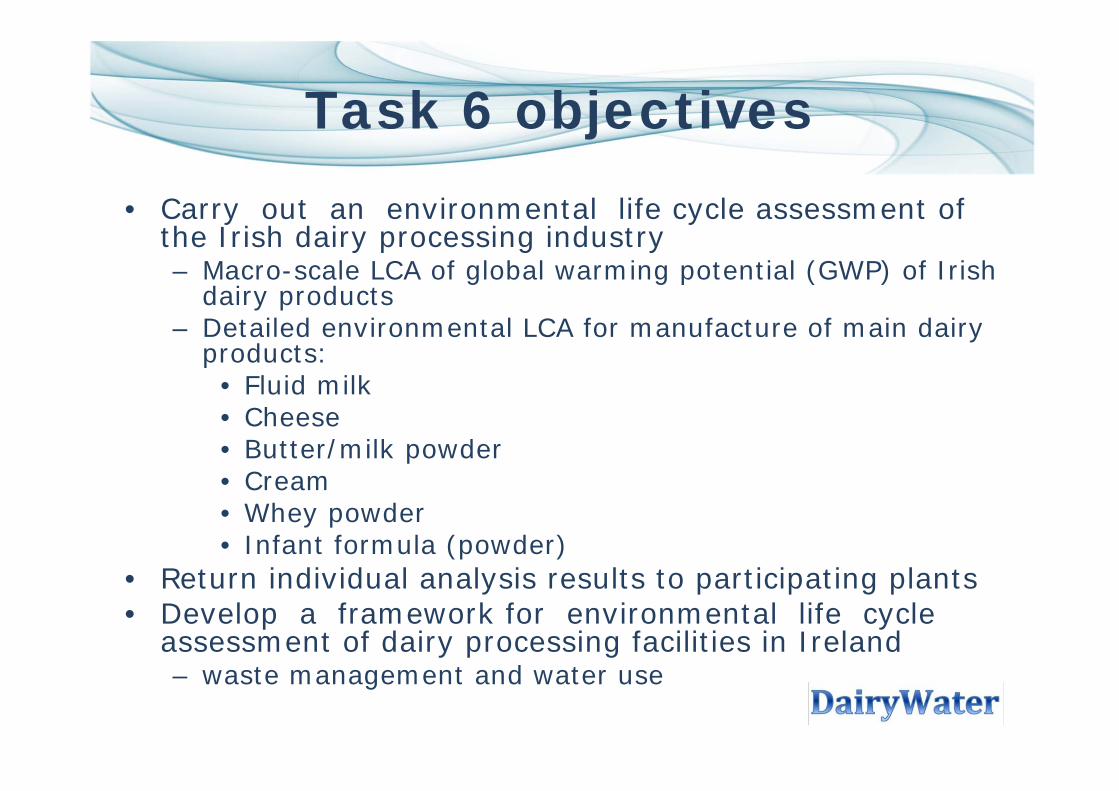
Task 6 objectives• Carry out an environmental life cycle assessment of
the Irish dairy processing industry– Macro-scale LCA of global warming potential (GWP) of Irish
dairy products– Detailed environmental LCA for manufacture of main dairy
products:• Fluid milk• Cheese• Butter/milk powder• Cream• Whey powder• Infant formula (powder)
• Return individual analysis results to participating plants• Develop a framework for environmental life cycle
assessment of dairy processing facilities in Ireland – waste management and water use

System boundaries
Wang, Y. (2011) U.S. Dairy Life Cycle Assessment: From Grass to Glass

Lifecycle inventory analysis
• Most critical part of the LCA and is dependant on the quality of the data
• Surveying and data collecting at dairy processing plants will be at the epicentre of the study
• Data generated from the studies in the project will provide the information for the comparative LCA study
• Data from industry will be collected at two levels:– For plants with adequate monitoring in place, at each
processing phase will be collected for a given product– Otherwise, an overview of the inputs and outputs,
along with engineering estimates of allocation will need to be provided

Presentation contents
• Introduction
• Macro-scale study
• Environmental LCA using plant data
• Discussion points

System boundaries
Wang, Y. (2011) U.S. Dairy Life Cycle Assessment: From Grass to Glass

Macro-scale study of Irish dairy industry
10
Casey et al. (2005)
Quinlan(2013)

Macro-scale study of Irish dairy industry
Dairy productRaw milk
production
Raw milk
transportationProcessing Total
Fluid milk 1.468 (92.4%) 0.007 (0.4%) 0.114 (7.2%) 1.589
Butter 9.225 (95.3%) 0.041 (0.4%) 0.415 (4.3%) 9.680
Cheese 6.709 (93.1%) 0.03 (0.4%) 0.464 (6.4%) 7.203
Cream 4.927 (97.3%) 0.022 (0.4%) 0.114 (2.3%) 5.063
Milk powders 10.483 (84.9%) 0.047 (0.4%) 1.824 (14.8%) 12.353
Whey powders 10.588 (80.8%) 0.047 (0.4%) 2.474 (18.9%) 13.108
*GWP associated with the production of 1 kg of various dairy products (kg CO2eq kg‐1 product)
0
0.5
1
1.5
2
2.5
3
FluidMilk
Butter Cheese Cream MilkPowders
WheyPowders
kg CO2eq kg
‐1prod
uct
Wastewater
Chemicals
Other Fuel
Natural Gas
NetElectricity

Ireland USA ItalyAustralia
Macro-scale study of dairy processing industry
0.000
0.030
0.060
0.090
0.120
0.150
Present Study *Halliday(2011)
Nutter et al.(2013)
Tan et al.(2011)
Heller andKeoleian (2011)
*Fantin et al.(2012)
kg CO2eq kg
‐1prod
uct
*Edited figure for comparison
GWP of fluid milk
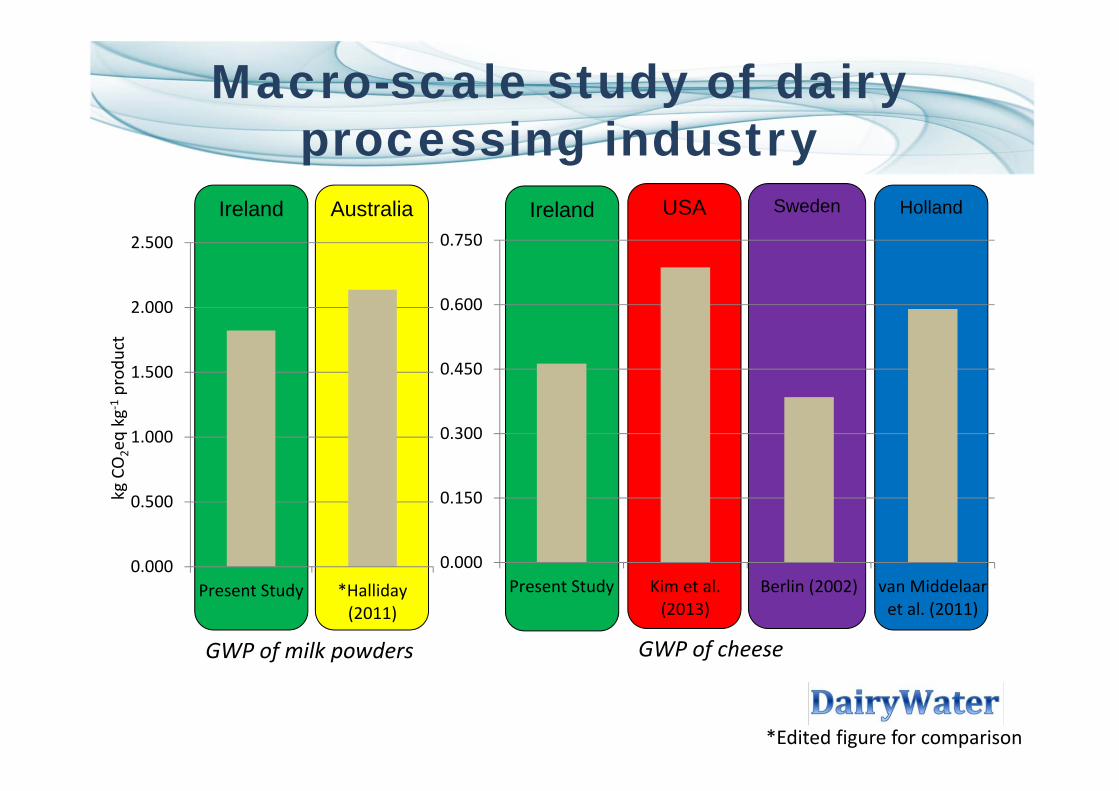
Ireland SwedenIreland USA HollandAustralia
Macro-scale study of dairy processing industry
*Edited figure for comparison
GWP of cheese
0.000
0.500
1.000
1.500
2.000
2.500
Present Study *Halliday(2011)
kg CO2eq kg
‐1prod
uct
0.000
0.150
0.300
0.450
0.600
0.750
Present Study Kim et al.(2013)
Berlin (2002) van Middelaaret al. (2011)
GWP of milk powders
Presentation contents
• Introduction
• Macro-scale study
• Environmental LCA using plant data
• Discussion points

System boundaries
Wang, Y. (2011) U.S. Dairy Life Cycle Assessment: From Grass to Glass
Present study
Potentially incorporated
Low data availability

Environmental LCA of Irish dairy processing plants
• Main input data required from plants:– Volume of milk processed– Production statistics (tonnes)– Raw milk transportation– Chemical usage– Energy usage (electrical & thermal)– Water consumption– Packaging materials used– Wastewater treatment – Solid waste disposal

GWP CED FEP MEP AP WD OD
kg CO2 eq MJ kg P eq kg N eq kg SO2 eq m3 kg CFC‐11 eq
Milk Powder 1.507 22.10 0.000120 0.000219 5.95E‐03 1.1524 2.0E‐07
Butter 0.469 4.87 0.000065 0.000122 1.44E‐03 0.5906 5.0E‐08
Fluid milk 0.188 3.72 0.000019 0.000030 7.72E‐04 0.1774 1.6E‐08
Cream 0.187 4.25 0.000019 0.000027 7.13E‐04 0.1896 1.5E‐08
Infant formula 2.906 27.61 0.000624 0.000372 8.14E‐03 26.5856 2.5E‐07
Cheese 0.480 6.59 0.000084 0.000172 1.90E‐03 0.7534 5.9E‐08
Whey powder 2.381 35.20 0.000202 0.000362 1.18E‐02 1.8908 2.9E‐07
Environmental LCA of Irish dairy processing plants
‐20%
0%
20%
40%
60%
80%
100%
GWP CED FEP MEP AP WD
Solid waste
Wastewater
Packaging
Other (process)
Fuel
Electricity
Milk tran
GWP CED FEP MEP AP WD OD
kg CO2 eq MJ kg P eq kg N eq kg SO2 eq m3 kg CFC‐11 eq
Milk Powder 1.507 22.10 0.000120 0.000219 5.95E‐03 1.1524 2.0E‐07
Butter 0.469 4.87 0.000065 0.000122 1.44E‐03 0.5906 5.0E‐08
Fluid milk 0.188 3.72 0.000019 0.000030 7.72E‐04 0.1774 1.6E‐08
Cream 0.187 4.25 0.000019 0.000027 7.13E‐04 0.1896 1.5E‐08
Infant formula 2.906 27.61 0.000624 0.000372 8.14E‐03 26.5856 2.5E‐07
Cheese 0.480 6.59 0.000084 0.000172 1.90E‐03 0.7534 5.9E‐08
Whey powder 2.381 35.20 0.000202 0.000362 1.18E‐02 1.8908 2.9E‐07
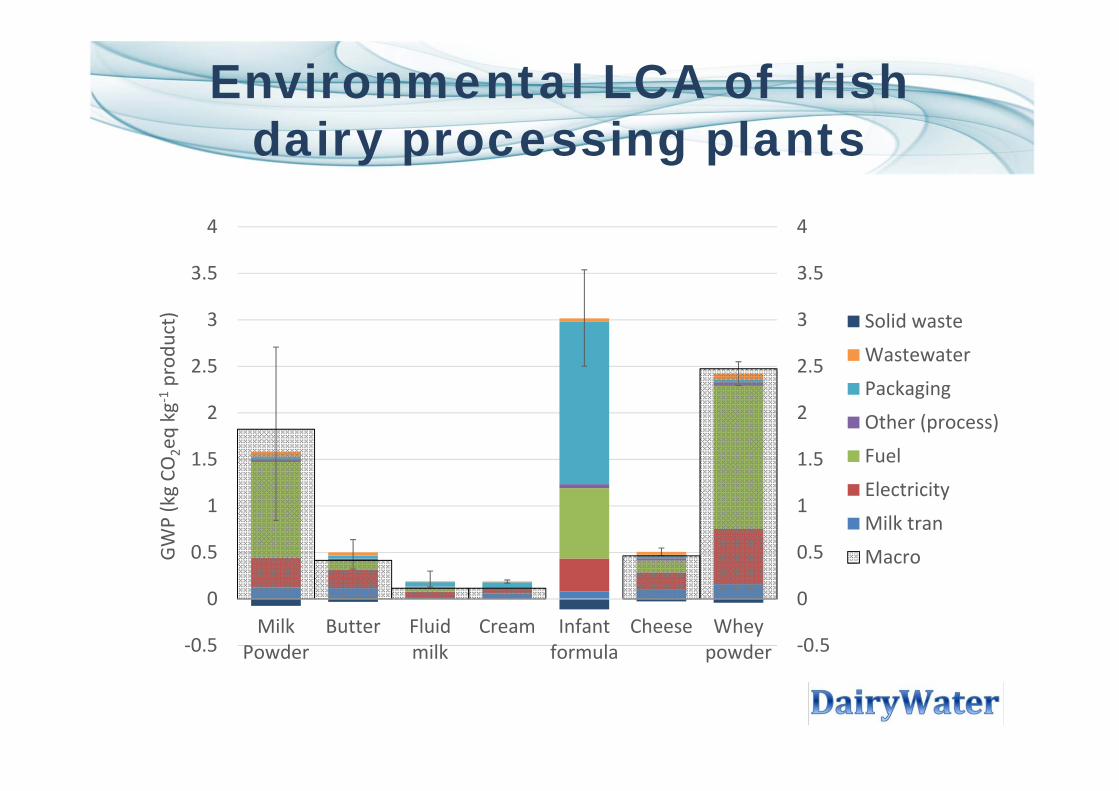
Environmental LCA of Irish dairy processing plants
‐0.5
0
0.5
1
1.5
2
2.5
3
3.5
4
‐0.5
0
0.5
1
1.5
2
2.5
3
3.5
4
MilkPowder
Butter Fluidmilk
Cream Infantformula
Cheese Wheypowder
GWP (kg CO
2eq kg
‐1prod
uct) Solid waste
Wastewater
Packaging
Other (process)
Fuel
Electricity
Milk tran
Macro
Presentation contents
• Introduction
• Macro-scale study
• Environmental LCA using plant data
• Discussion points

Discussion points
• This study will serve as a benchmark for processors– Identify opportunities to reduce impacts
• Inform policy makers of the significant contributors to environmental impacts
• Next steps:– Increase the number of plants in study– To explore the affect of seasonal variation of
milk production on these impacts– Feedback to participating dairy plants