Embed Size (px)
Citation preview
1/10/2012
1
Joel Gittelsohn, PhDCenter for Human NutritionDepartment of International HealthJohns Hopkins Bloomberg School of Public Health
January 10, 2012
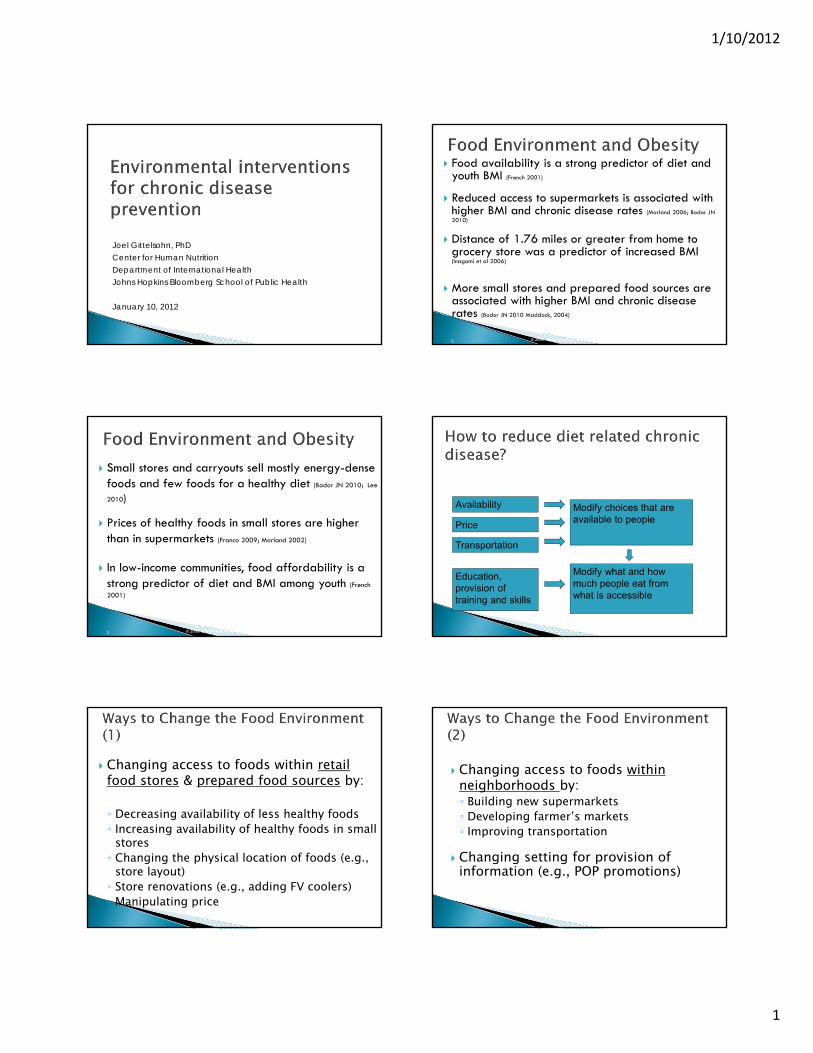
Food availability is a strong predictor of diet and youth BMI (French 2001)
Reduced access to supermarkets is associated with higher BMI and chronic disease rates (Morland 2006; Bodor JN 2010)
Distance of 1.76 miles or greater from home to grocery store was a predictor of increased BMI (Inagami et al 2006)
More small stores and prepared food sources are associated with higher BMI and chronic disease rates (Bodor JN 2010 Maddock, 2004)
2 © 2009, Johns Hopkins University. All rights reserved.
Small stores and carryouts sell mostly energy-dense foods and few foods for a healthy diet (Bodor JN 2010; Lee
2010)
Prices of healthy foods in small stores are higher than in supermarkets (Franco 2009; Morland 2002)
In low-income communities, food affordability is a strong predictor of diet and BMI among youth (French
2001)
3 © 2009, Johns Hopkins University. All rights reserved.
Modify what and how much people eat from what is accessible
Modify choices that are available to people
Education, provision of training and skills
Availability
Price
Transportation
Changing access to foods within retail food stores & prepared food sources by:
◦ Decreasing availability of less healthy foods◦ Increasing availability of healthy foods in small
stores◦ Changing the physical location of foods (e.g.,
store layout)◦ Store renovations (e.g., adding FV coolers)◦ Manipulating price
Changing access to foods within neighborhoods by:◦ Building new supermarkets◦ Developing farmer’s markets◦ Improving transportation
Changing setting for provision of information (e.g., POP promotions)

1/10/2012
2
Policy ◦ Setting store standards/requirements◦ Menu labeling◦ Rezoning◦ Taxes (E.g., SSB tax)
Work in multiple settings/ institutions at the same time◦ Integrating interventions in food stores,
restaurants, schools, worksites, etc.
Other approaches:◦ Improving food networks (distributors,
producers, retailers) ◦ Improving local production (producers)◦ Increasing nutrient content of foods
(manufacturers)◦ Changing packaging of foods
(manufacturers)
In Baltimore City (BC), more than 63% of adults are overweight or obese; 35% higher than the MD and theUS (BRFSS 2007)
37% of BC adolescents are overweight or at-risk; 29% higher than the US (BRFSS 2007)
9 © 2009, Johns Hopkins University. All rights reserved.
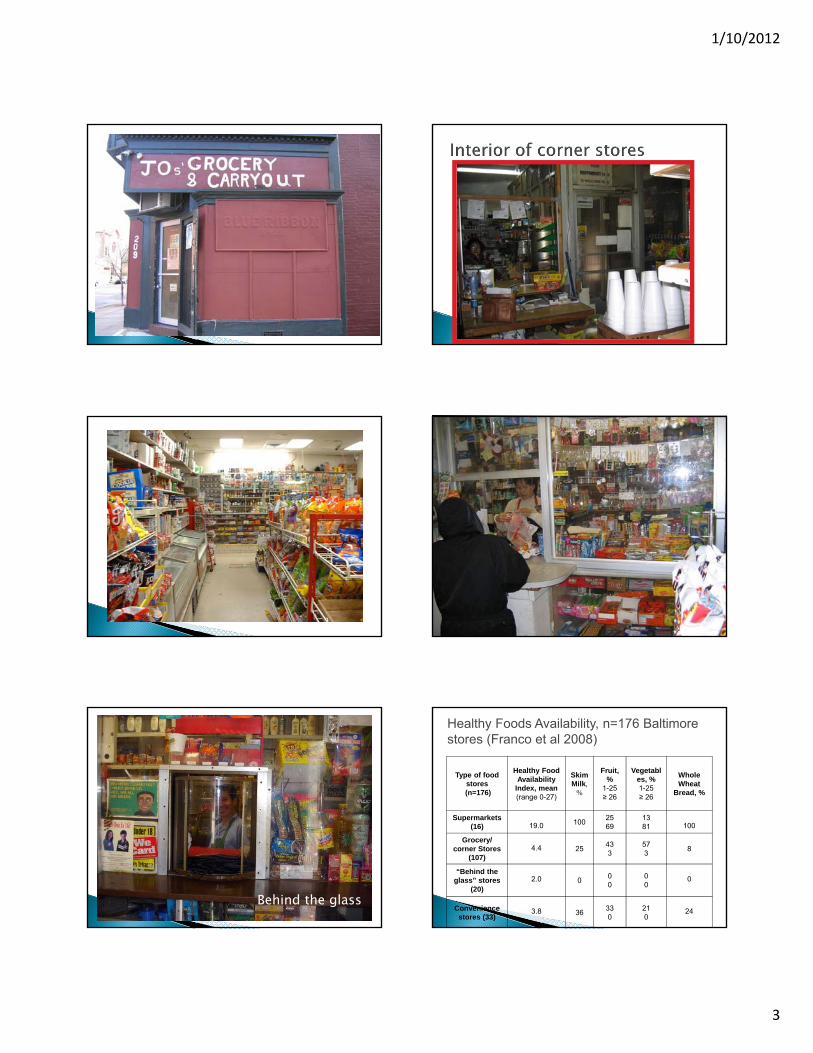
Over 500 small food stores in Baltimore, commonly called “corner stores”◦ Privately owned, 80% by Korean Americans
Corner stores outnumber larger food stores by 20 times or more
For every corner store, there is commonly a carryout on the opposite corner
Exteriors of corner stores
1/10/2012
3
Behind the glass
Healthy Foods Availability, n=176 Baltimore stores (Franco et al 2008)
Type of food stores(n=176)
Healthy Food Availability
Index, mean(range 0-27)
Skim Milk,
%
Fruit, %
1-25≥ 26
Vegetables, %1-25≥ 26
Whole Wheat
Bread, %
Supermarkets(16) 19.0 100
2569
1381 100
Grocery/ corner Stores
(107)4.4 25
433
573
8
“Behind the glass” stores
(20)2.0 0
00
00
0
Convenience stores (33)
3.8 36330
210
24
1/10/2012
4
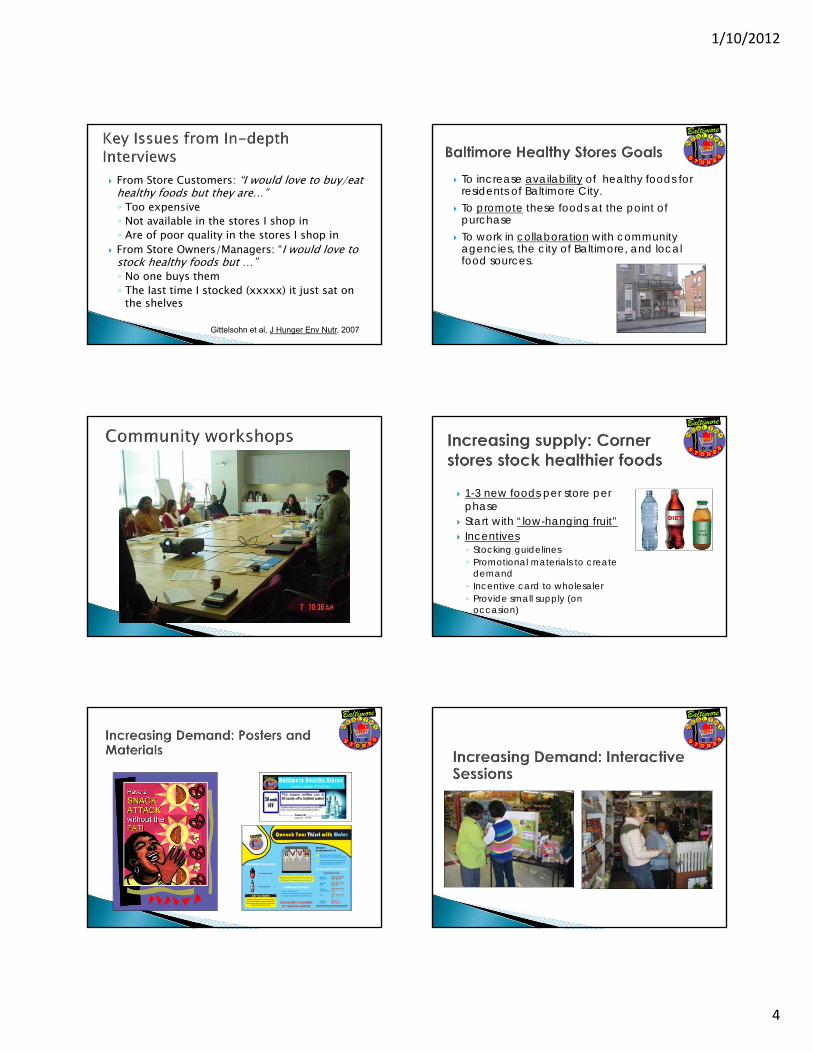
From Store Customers: “I would love to buy/eat healthy foods but they are…”◦ Too expensive◦ Not available in the stores I shop in◦ Are of poor quality in the stores I shop in
From Store Owners/Managers: “I would love to stock healthy foods but …”◦ No one buys them◦ The last time I stocked (xxxxx) it just sat on
the shelves
Gittelsohn et al, J Hunger Env Nutr, 2007
To increase availability of healthy foods for residents of Baltimore City.
To promote these foods at the point of purchase
To work in collaboration with community agencies, the city of Baltimore, and local food sources.
BaltimoreBaltimoreEE YY
TTAA LL HHHH
TT EEOO RRSS SS
TT EEOO RRSS SS
1-3 new foods per store per phase
Start with “low-hanging fruit” Incentives◦ Stocking guidelines◦ Promotional materials to create
demand◦ Incentive card to wholesaler ◦ Provide small supply (on
occasion)
BaltimoreBaltimoreEE YY
TTAA LL HHHH
TT EEOO RRSS SS
TT EEOO RRSS SS
BaltimoreBaltimoreEE YY
TTAA LL HHHH
TT EEOO RRSS SS
TT EEOO RRSS SS
BaltimoreBaltimoreEE YY
TTAA LL HHHH
TT EEOO RRSS SS
TT EEOO RRSS SS

1/10/2012
5
Nutrition Education Booklet (Korean)
Cultural Guidelines (Korean)
BaltimoreBaltimoreEE YY
TTAA LL HHHH
TT EEOO RRSS SS
TT EEOO RRSS SS
Stock Score (Range 0-10)
Sales Score (Range 0-10)
Intervention Comparison Sig. Intervention Comparison Sig.
Baseline 5.9 ± 2.0 6.8 ± 1.6 NS 4.4 ± 1.8 5 ± 1.5 NS
Post-phase 8.3 ± 1.0 6 ± 1.8 0.004 7.1 ± 2.0 5.8 ± 1.8 0.05
Post-intervention
7 ± 2.0 5.5 ± 1.5 0.009 6.4 ± 1.8 4.7 ± 1.5 0.003
Song et al, Public Health Nutrition, 2009
BaltimoreBaltimoreEE YY
TTAA LL HHHH
TT EEOO RRSS SS
TT EEOO RRSS SS
Significant impact on food preparation methods
Significant impact on frequency of purchase of promoted foods
Positive trend for healthy food intentions
Gittelsohn et al, Health Education and Behavior, 2009
BaltimoreBaltimoreEE YY
TTAA LL HHHH
TT EEOO RRSS SS
TT EEOO RRSS SS
Systematic review, Preventing Chronic Disease, in press
16 trials that met criteria◦ Focus on small food stores◦ Had impact data
Findings◦ Significant effects for increased availability of
healthy foods and improved sales of healthy foods◦ Significant effects for improved consumer
knowledge and dietary behaviors
•CDC supported center at UNC
•BHS listed as a Research-Tested Intervention
•Materials and training provided to city and state Health Departments through UNC obesity prevention course
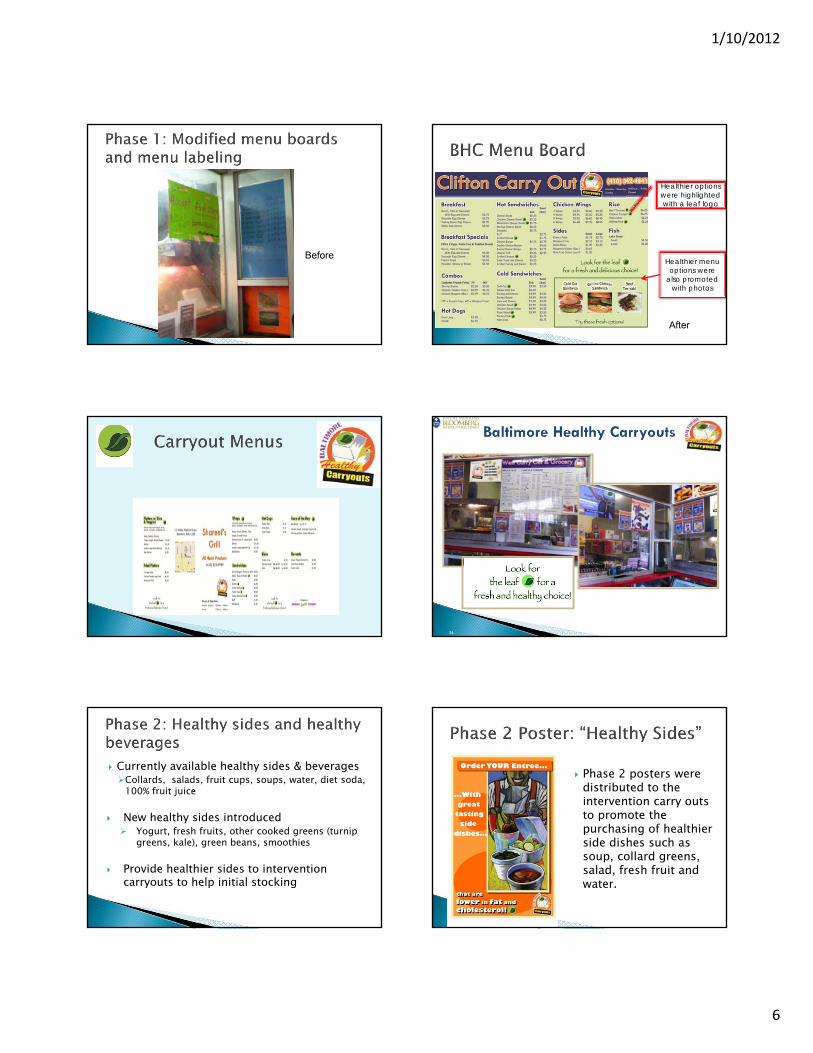
Phase 1: Menu labeling and signage
Phase 2: Introducing healthier sides & healthier beverages
Phase 3: Introducing healthy combo meal & reduced prices for healthier options
Baltimore Healthy Carryouts625 carryouts in Baltimore City
1/10/2012
6
BeforeHealthier menu
options were also promoted
with photos
Healthier options were highlighted with a leaf logo
After
34
Currently available healthy sides & beveragesCollards, salads, fruit cups, soups, water, diet soda,
100% fruit juice
New healthy sides introduced Yogurt, fresh fruits, other cooked greens (turnip
greens, kale), green beans, smoothies
Provide healthier sides to intervention carryouts to help initial stocking
Phase 2 posters were distributed to the intervention carry outs to promote the purchasing of healthier side dishes such as soup, collard greens, salad, fresh fruit and water.

1/10/2012
7
Using consistent colors “orange and purple”
Improving food preparation methods Provide a indoor grill to implement grilled chicken
tenders Provide low-fat mayonnaise
Healthy Monday promotion with price reduction Formative research to understand what is an
acceptable range to reduce prices Owners agreed to reduce up to $1 per healthy
entrée without compensation
Most carryouts only have deep-fryers and a microwave to cook foods. We purchased a grill to provide a non-fat cooking method.
0
100
200
300
400
500
600
700
Wk 1 Wk 5 Wk 9 Wk 13 Wk 17 Wk 21 Wk 25 Wk 29
Comparison 3
Comparison 2
Comparison 1
Intervention 3
Intervention 2
Intervention 1
Week 4: Phase 1
Week 15‐16: Phase 2
Week 24: Phase 3
Systematic review, in preparation
11 trials that met criteria◦ Focus on prepared food sources◦ In community settings◦ Had impact data
Findings◦ Feasibility and sustainability were high◦ Increased sales of healthy foods for most trials◦ Measures at the consumer level were generally
lacking, but in some cases showed improved awareness and frequency of purchase of promoted foods.

1/10/2012
8
To develop, implement and evaluate an environmental program for low-income AA children by creating “healthy eating zones”.
To determine if the program: ◦ significantly improves children’s food-related
psychosocial factors and food/beverage purchasing behaviors.◦ leads to significant improvements in young AA
children’s food environment, including the increased availability of affordable healthy foods.◦ leads to significant changes in food consumption.
Creation of “healthy eating zones” in and around 12+ Baltimore City recreation centers
Worked with corner stores and carryouts Increasing availability of healthy food
options Point of purchase signage Interactive sessions Use of peer educators Cooking classes for kids in recreation
centers
Pre-post evaluation◦ 242 youth-caregiver dyads (half intervention, half
comparison) Psychosocial factors Food purchasing Quantitative food frequency◦ Recreation center staff (n=12)◦ Changes to food availability in rec center, stores
and carryouts Store environmental checklists
Process evaluation

1/10/2012
9
By Direct Exposure By Intervention
Changes in obesity
Low Med High Sig. Comparison Intervention Sig.
BMI Percentile (entire sample)
-1.74 1.44 -2.91 0.34 0.22 -1.88 0.33
BMI Percentile (Baseline BMI>85)
-1.2 -2.85 -2.7 0.1 -0.78 -3.15 0.051
BMI Percentile (Baseline BMI>85, Girls only)
-1.1 N/A -3.1 0.016 -0.13 -3.16 0.03
To investigate the experiences of other small store intervention programs
To develop a list of small store guidelines appropriate to Baltimore corner stores
To incorporate this list into City rezoning plans (Transform Baltimore)
The city rezoning plan should designate certain areas/neighborhoods as “high risk” areas (defined as an area either within ¼ mile of a school or an area classified as a “food desert”).
Level 1 guidelines (1-5) should become requiredcomponents of the new licensing plan.
Level 2 guidelines (6-10) should become strongly recommended components within the licensing plan.
Level 3 guidelines (11-15) should be recommended within the licensing plan.
Compliance with guidelines should be monitored 1 month after licensing and every six months thereafter by the Baltimore City Health Department.
Baltimore City Food Policy initiatives
◦ Healthy Carryout initiative with public markets
◦ Multilevel Obesity Prevention Study (MOPS)
Changing the food environment is a viable means of addressing the chronic disease epidemic
Small food stores and prepared food sources are effective targets, particularly as a means of reaching low income populations
Can and should be supported by state and local policy

1/10/2012
10