Embed Size (px)
Citation preview
Environmental Indicators Environmental Indicators and Sustainabilityand Sustainability
Experiences from the United StatesExperiences from the United StatesBrian LaneBrian Lane
Strategic PlannerStrategic Planner
The Rocky Mountain Region
International Symposium on Indicatorsof Sustainable Development
Taipei, Taiwan Dec. 1-2

About the Rocky About the Rocky Mountain RegionMountain Region
3 0 Y e a rs o f E n v iro n m e n ta l P ro g re s s
R e p o rt
T h is rep o rt h ig h lig h ts
o u r sh ared
en v iro n m en tal
su ccesses w h ile
id en tify in g k ey
ch allen g es w h ich w e
n eed to fo cu s o n .
R eg io n 8 s eco sy stem s
are u n d er p ressu re.
L arg e tracts o f o p en
sp ace ch aracterize m u ch o f o u r R eg io n s lan d area;
h o w ev er, th e eco sy stem s fo u n d in th ese areas are
b ein g affected b y h ab itat frag m en tatio n an d
d estru ctio n , an d b y th e p o llu tio n o f th e en v iro n m en ts
p lan ts an d an im als n eed to su rv iv e.
- F u ll rep o rt-
0 4 /1 8 /2 0 0 0 - R eg io n 8co m m en ts o n latestA n im as-L aP lataim p act statem en t
0 4 /1 2 /2 0 0 0 -B ro w n field s G ran taw ard ed to C ity o fE n g lew o o d , C O
0 4 /1 2 /2 0 0 0 -B ro w n field s G ran taw ard ed to S alt L ak eC ity G atew ay P ro ject
0 4 /1 2 /2 0 0 0 - H y g ien eE lem en tary S ch o o lreceiv es th e 1 9 9 9P resid en t'sE n v iro n m en tal Y o u thA w ard
- M o re N ew s -
M a y is N a tio n a l W e tla n d s M o n th
M o re th an 1 0 ,0 0 0 sp ecies, o r 2 0 p ercen t o f th e
w o rld s fresh w ater fish h av e b eco m e ex tin ct,
th reaten ed , o r en d an g ered in recen t y ears d u e to
w etlan d s lo ss. G et in v o lv ed b y v isitin g w etlan d s
ev en ts in S o u th P latte P ark , C h erry C reek S tate
P ark , an d T w o P o n d s N atio n al W ild life R efu g e in
C o lo rad o . T h e T w o P o n d s N atio n al W ild life
R efu g e w ill h o st sev eral ev en ts in M ay an d Ju n e
su ch as th e M ay 7 In tern atio n al D aw n C h o ru s
D ay. G et u p at su n rise to listen to th e so n g b ird s
fo u n d in th e refu g e A m o rn in g b ird w alk w ill b e h eld o n M ay 2 0 .
- M o re in fo rm a tio n -
W etlan d L o sses1 7 8 0 s - 1 9 8 0 s
S ta teC O
M TN DS DU T
W YT o ta l
% L o ss*5 0 %2 7 %4 9 %3 5 %3 0 %3 8 %
4 2 %* estim ated
E P A s A g ric u ltu re P rio rity
In Ju n e, E PA , R eg io n 8 w ill h o st a m eetin g w ith
S tate an d F ed eral ag ricu ltu re related ag en cies to
create a n atio n al p artn ersh ip . M ajo r areas o f
em p h asis are: p artn ersh ip s, p esticid es risk
red u ctio n s, an im al feed in g o p eratio n s, an d g en etic
en g in eerin g .
- M o re in fo rm a tio n -
N e w a n d Im p ro v e d R e g io n 8 W e b S ite
A n u m b er o f im p ro v em en ts h av e recen tly b een m ad e to th is w eb site to
m ak e it easier to fin d in fo m atio n . W e are still in th e p ro cess o f co n v ertin g
so m e p ag es an d ad d in g n ew o n es. P lease co n tact u s if so m eth in g d o es
n o t w o rk , ap p ears to b e m issin g , o r if y o u ju st w an t to let u s k n o w h o w
w e're d o in g .
Y o u m ay also co n tact u s at:
1 -8 0 0 -2 2 7 -8 9 1 7 o r (3 0 3 ) 3 1 2 -6 3 1 2
U R L : .
M o d ified o n :
A Few Facts About the Region:- 6 States- 27 Indian Tribes- Dry Climate- Rocky Mountains- Great Plains- Large % of Land Government Managed- Home of Many Natural Treasures...Yellowstone National Park
Leading Environmental Pressures:-Agriculture-Mining-Growth and Development

The Most Widely Used The Most Widely Used Indicator FrameworkIndicator Framework
Pressure State Response
•Ambient conditions
•Body Burden Uptake
•Ecological Health & Welfare
•Discharges
•Emissions
•Regulatory Response
•Actions by Regulated Community
•Pounds of toxics used
•Vehicle miles traveled
•Number of single use disposable goods purchased
•Air quality (ppm)
•Air quality
•Tons recycled, incinerated or landfilled
•Number of air permits
• Automobiles inspected
•Number of permitted landfills or incinerators
Examples:

Point Sources
Hydromodification
Flow Regulation
Urban Runoff/Storm Sewers
Natural
Atmosperic Deposition
Habitat Modification
0 10 20 30 40
MajorModerateNot Specified
Agriculture
Indicators of Environmental Indicators of Environmental PressuresPressures
% of threatened impaired miles
Leading Sources of PollutionLAKES & STREAMS

Indicators ofIndicators ofAmbient ConditionsAmbient Conditions

Indicators of Agency Indicators of Agency ResponseResponse
1994 1995 1996 1997 1998 1999-20000
2
4
6
8
10
12
Cleanups at 18 of 45 priority hazardous waste sites
Up to 10 of remaining 27 sites by 2001
New Construction Completions by Year
Responsible Parties have performed more than 70% of long term clean ups: Taxpayer savings- $ 1.3 billion
Projected
Hazardous Waste Site Cleanups

Pros of the Pros of the Pressure-State-Response ModelPressure-State-Response Model
Good framework for thinking about Good framework for thinking about environmental causesenvironmental causes
Categorizes indicators in a common Categorizes indicators in a common sense, easy to understand waysense, easy to understand way
Fits in well with the public policy Fits in well with the public policy process process
Cons of the P-S-R Model Cons of the P-S-R Model
Some indicators don’t fit in this modelSome indicators don’t fit in this model– e.g., willingness to pay for environmentally e.g., willingness to pay for environmentally
safe productssafe products
Model is one-dimensional; the Model is one-dimensional; the environmentenvironment

Where U.S. is Headed with Where U.S. is Headed with IndicatorsIndicators
Greater emphasis on results, on the Greater emphasis on results, on the environmentenvironment– linking to environmental resultslinking to environmental results
Shift from contraints (lack of data) to Shift from contraints (lack of data) to evaluation of successevaluation of success
Shift to local and state decision-making and Shift to local and state decision-making and accountabilityaccountability
Focus on managing and measuring in a placeFocus on managing and measuring in a place Focus on longer-term sustainable indicators Focus on longer-term sustainable indicators Communicating with the Public Communicating with the Public

What is a Sustainable What is a Sustainable Indicator?Indicator?
A A measurable measurable vision of a vision of a community’community’s futures future
How to Make a Perfect How to Make a Perfect Sustainable IndicatorSustainable Indicator
ChooseSomething that the community
cares deeply about

How to Make the Perfect How to Make the Perfect Sustainable IndicatorSustainable Indicator
Measure what you want to be

Other considerations for Other considerations for selecting Sustainable Indicatorsselecting Sustainable Indicators
Relevant, understandable, and Relevant, understandable, and useableuseable
Long-term view (25-50 years)Long-term view (25-50 years) Show linkagesShow linkages Used Used

Example of a Good Example of a Good Sustainable Indicator in Sustainable Indicator in
Use:Use:
The Bernie Fowler's "Sneaker Index” The Bernie Fowler's "Sneaker Index”

Bernie Fowler has a GoalBernie Fowler has a Goal
GOAL: Restore Bernie's sneaker visibility to chest depth (57 to 63 inches).
"Although this is not a scientific measure, it puts restoring the River on a human scale."
Source: C. Bernard Fowler, 1992-1993 Chair of the Chesapeake Bay Commission;Kent Mountford, U.S. EPA Chesapeake Bay Program.
50’s 60’s 88 89 90 91 92 93 94 95 96 97 98 99 20000
1
2
3
4
5
6V
isib
ility
in F
eet
63"
57"
10"8"
16" 16"18"
28" 28"
40"
Goal
37"
44.5"
35.5"
41.5"39.5"
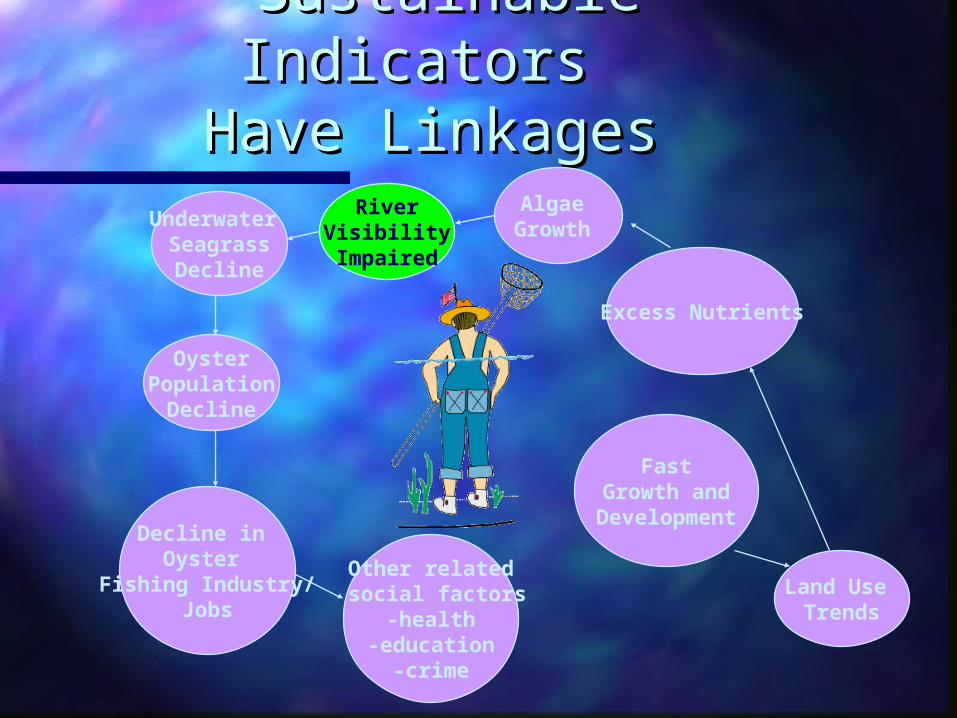
Sustainable Indicators Sustainable Indicators Have LinkagesHave Linkages
Algae Growth
OysterPopulation
Decline
Decline in Oyster
Fishing Industry/Jobs
Excess Nutrients
FastGrowth andDevelopment
Land Use Trends
Underwater SeagrassDecline
Other related social factors
-health-education
-crime
RiverVisibilityImpaired

The “Sneaker Index” is The “Sneaker Index” is Widely KnownWidely Known
11th Annual Patuxant River Wade, June 1998 PhotographSneaker Index Score: 35.5 inches
Goal: 57 to 63 inches
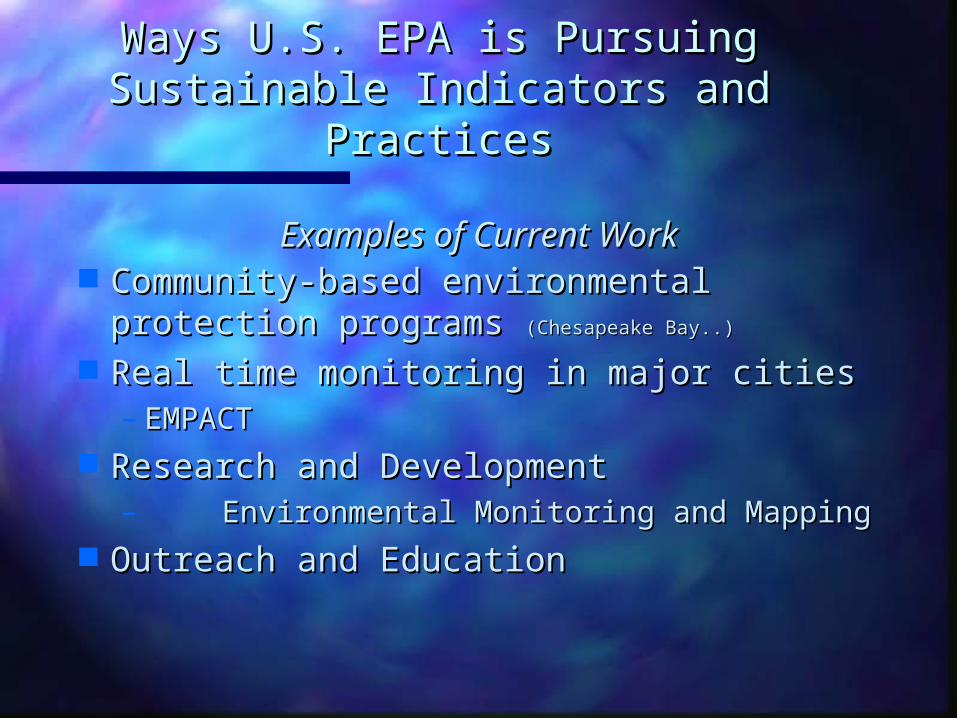
Ways U.S. EPA is Pursuing Ways U.S. EPA is Pursuing Sustainable Indicators and PracticesSustainable Indicators and Practices
Examples of Current WorkExamples of Current Work Community-based environmental Community-based environmental
protection programs protection programs (Chesapeake Bay..)(Chesapeake Bay..)
Real time monitoring in major citiesReal time monitoring in major cities– EMPACTEMPACT
Research and DevelopmentResearch and Development– Environmental Monitoring and Environmental Monitoring and
MappingMapping Outreach and EducationOutreach and Education