Embed Size (px)
Citation preview
THESIS FOR DEGREE OF DOCTOR OF PHILOSOPHY
Environmental Improvements of the
Post-Farm Dairy Chain:
Production Management by Systems Analysis Methods
JOHANNA BERLIN
Department of Energy and Environment
CHALMERS UNIVERSITY OF TECHNOLOGY
Göteborg, Sweden, 2005
Environmental Improvements of the Post-Farm Dairy Chain:
Production Management by Systems Analysis Methods
JOHANNA BERLIN
© JOHANNA BERLIN, 2005
ISBN 91-7291-655-9
Doktorsavhandlingar vid Chalmers tekniska högskola
Ny serie nr 2337
ISSN 0346-718X
ESA Report 2005:6
ISSN 1404-8167
Department of Energy and Environment
Division of Environmental Systems Analysis
Chalmers University of Technology
SE-412 96 Göteborg
Sweden
Tel: +46 31 772 10 00
http://www.esa.chalmers.se
Telephone to author: +46 31 335 56 00
E-mail to author: [email protected]
Chalmers Reproservice
Göteborg, 2005
III
Environmental Improvements of the Post-Farm Dairy Chain: Production Management by Systems Analysis Methods JOHANNA BERLIN Department of Energy and Environment Division of Environmental Systems Analysis Chalmers University of Technology Abstract The production of dairy products is becoming more centralised at the same time as the number of different products is steadily increasing. In this thesis, the environmental impact of such ongoing development trends in the post-farm dairy chain was evaluated and improvements were suggested. Methods for production management and environmental systems analysis (life cycle assessment, material flow analysis and substance flow analysis) were combined and used in the evaluations. A first assessment of potential future developments in the dairy chain showed that the least preferable scenario from an environmental point of view was the one most similar to trends in the dairy chain of today. Subsequent investigations revealed the same result. Large dairy units with long distance transports lead to a higher environmental impact than small dairy units. On the other hand, small dairy units are those for which the environmental impact is affected the most by the rising variety of cultured products. The changed consumption patterns towards more cultured products and cheese, instead of milk, cause an increased environmental impact with regard to the cultured products, whereas for cheese no clear effect was found. To enable counteraction of negative environmental effects of increased product variety, a method to sequence the production of cultured dairy products with as little environmental impact as possible was developed. The method combines production management methods and environmental systems analysis. A heuristic solution to the sequencing problem was developed and, to the extent possible, validated with an optimisation. The method was used in a case study which revealed not only the importance of a waste minimised sequence but also that of a low production frequency. Life cycle assessment was combined with an actor analysis to examine the potential of the actors in the post-farm chain (dairy, retailer and consumer) to decrease the environmental impact of dairy products. Cutting down waste of product proved to be an effective way to reduce environmental consequences. Saving energy and improving transport patterns gave in general smaller reductions. Choosing organic products decreased most environmental categories at the expense of increased eutrophication. Keywords: environmental systems analysis, life cycle assessment, LCA, environment, dairy, dairy products, cheese, yoghurt, production scheduling, actor analysis

V
List of Publications
This thesis is based on work reported in the following five appended
publications which are referred to by their Roman numerals in the text.
Paper I Sonesson, U., and Berlin, J. (2003). Environmental Impact of Future
Milk Supply Chains in Sweden: A Scenario Study.
Journal of Cleaner Production 11:253-266.
Paper II Berlin, J. (2002). Environmental Life Cycle Assessment (LCA) of
Swedish Semi-Hard Cheese.
International Dairy Journal 12: 939-953.
Paper III Berlin, J., and Sonesson, U. (2005). A Life Cycle Based Method to
Minimise Environmental Impact of Dairy Production through
Product Sequencing.
Journal of Cleaner Production, In print.
Paper IV Berlin, J., Sonesson, U., and Tillman, A.-M. (2005). Minimising
Environmental Impact by Sequencing Cultured Dairy Products: Two
Case Studies.
Submitted manuscript (March 2005).
Paper V Berlin, J., Sonesson, U., and Tillman, A.-M. (2005). An Actor
Analysis of the Environmental Improvement Potentials in the Post-
Farm Milk Chain Using Life Cycle Assessment.
Submitted manuscript (August 2005).
Reprints of Papers I - III are printed by the kind permission of Elsevier Science
Ltd.
VI
Other publications by the author
Sonesson, U., and Thuresson*, J. (2001). Mjölkkedjans miljöpåverkan – en
miljösystemanalys av framtidscenarier av försörjningskedjan för mejeriprodukter
(Environmental Impact of the Milk Chain: An Environmental Systems Analysis
of the Supply Chain for Dairy Products, in Swedish). SIK Report 2001 No 681,
SIK: The Swedish Institute for Food and Biotechnology, Göteborg, Sweden.
* Author’s surname prior to Berlin.
Berlin, J. (2001). Life Cycle Inventory (LCI) of Semi-Hard Cheese.
SIK Report 2001 No 692, SIK: The Swedish Institute for Food and
Biotechnology, Göteborg, Sweden.
Berlin, J. (2003). Life cycle assessment (LCA): An introduction.
In: Environmentally-friendly food processing. Edited by: Mattsson, B. and
Sonesson, U., Woodhead Publishing Limited, Cambridge, England.
Berlin, J. (2005). Tänk på miljön – Ät upp maten! (Think about the
environment: Eat up your food!, in Swedish). In: Mat för Livet – om framtidens
livsmedel (Food for Life: food for the future, in Swedish), The Royal Swedish
Academy of Agriculture and Forestry (KSLA), Stockholm, Sweden.
VII
The Research Program FOOD 21
The thesis work was carried out within the FOOD 21 research program. FOOD
21 is an interdisciplinary research program funded by the Foundation for
Strategic Environmental Research (MISTRA). Natural and social scientists co-
operate in analysing the sustainability of agricultural food production from farm
to fork. The long-term goal of the program is to define optimal conditions and
to develop systems and technologies for a sustainable food chain that offers the
consumers high quality products.
VIII
Acknowledgements
Many people and organisations have assisted me during my years as a doctoral
student and I am very grateful to all. My research was carried out in the context
of the FOOD 21 research program and financed by the Swedish Foundation for
Strategic Environmental Research (MISTRA) to which I wish to express my
appreciation.
I am indebted to my supervisors, Professor Anne-Marie Tillman and Dr. Ulf
Sonesson, a most complementary team. Anne-Marie guided me skilfully into
research, environmental systems analysis, publishing articles and gave me good
advice. Ulf was a source of inspiration for my research, gave his valuable
opinions and was always available for discussions.
It is also a pleasure to acknowledge Dr. Berit Mattson and Professor Thomas
Nybrant for making good suggestions and giving support along the way and to
Professor Hans Lignert, Professor Tomas Olsson, and Dr. Karin Östergren for
valuable comments and helpful suggestions on improvement of the thesis.
Lora Sharp McQueen is thanked for revising the language of the thesis.
Several people contributed data and their knowledge to the papers appended in
this thesis. I am grateful to all, in particular Christel Cederberg, C. Cederberg
AB; Allan Nilsson and Jörgen Karlsson, Arla Foods Falkenberg; Inger Larsson,
Arla Foods; Mustafa Aoufi and Anna-Lena Östensson, Arla Foods
Östgötamejeriet; Urban Sterner, Skånemejerier; and Marcus Henningsson,
Flora Vita AB, for sharing their expertise in farming and dairy processing.
Furthermore, for invaluable assistance with information and data, I am grateful
to my colleagues in the Process and Environmental Engineering group at SIK,
IX
especially Friederike Ziegler, Britta Nilsson, Katarina Lorentzon, Anna Flysjö,
Jennifer Davis, Anna Fritzon, Tomas Angerwall and Eva Olsson.
Thanks go to all of the people at the Division of Environmental Systems
Analysis at Chalmers for always welcoming me as one of the team although my
work place has been at SIK.
I am deeply thankful to my loving and caring parents, Anita and Roger, for their
support and babysitting. My parents in law, Agneta and Bengt, are thanked for
all warm concern and babysitting. I am grateful to my sister, Josefin, her
husband, Jan, and their lovely children, Amanda and Linnéa, as well as my
sister, Ida, and her boyfriend, Anders, for always supporting me.
Finally, I thank my beloved husband and daughter, Henrik and Viola, who are
the most important persons of my life. Henrik has encouraged me and given me
all the support and love I could wish. From Viola and her infectious laughter, I
have learned the meaning of life.
Göteborg, August 2005
Johanna Berlin
X
Table of Contents
Abstract .......................................................................................................................III
List of Publications...................................................................................................... V
Other publications by the author .......................................................................VI
The Research Program FOOD 21..........................................................................VII
Acknowledgements ................................................................................................ VIII
Table of Contents ........................................................................................................ X
1 Introduction ............................................................................................................ 1
1.1 The Food Market and the Dairy Industry.................................................. 2
1.2 Aim and Objectives....................................................................................... 4
1.3 Appended Papers .......................................................................................... 5
2 The Environmental Perspective of the Dairy Chain......................................... 8
2.1 Life Cycle Assessment of Dairy Products.................................................. 8
2.2 Types of Environmental Impact Related to the Dairy Chain ................. 9
2.3 Environmental Improvements................................................................... 10
2.4 Environmental Improvements from an Actor’s Perspective................. 13
3 Methods................................................................................................................. 16
3.1 Environmental Systems Analysis Tools ................................................... 16
3.2 Scenario Techniques in LCA..................................................................... 21
3.3 Operational Analysis .................................................................................. 23
4 The Environmental Consequences of Current Trends and Options for
Improvement ........................................................................................................ 27
4.1 Environmental Impact of Future Milk Supply Chains in Sweden: A
Scenario Study ............................................................................................. 27
4.2 Life Cycle Assessment of Semi-Hard Cheese ......................................... 29
4.3 Minimising Environmental Impact by Sequencing Cultured Dairy
Products: Two Case Studies ....................................................................... 30
XI
4.4 An Actor Analysis of the Environmental Improvement Potentials in
the Post-Farm Milk Chain Using Life Cycle Assessment ...................... 34
4.5 Discussion..................................................................................................... 36
5 Methodological Contributions to Environmental Systems Analysis ............ 41
5.1 A Life Cycle Based Method to Minimise Environmental Impact of
Dairy Production through Product Sequencing ...................................... 41
5.2 An Actor Analysis of the Environmental Improvement Potentials in
the Post-Farm Milk Chain using Life Cycle Assessment ....................... 43
5.3 Discussion..................................................................................................... 44
6 Conclusions........................................................................................................... 46
7 Future Work ......................................................................................................... 47
References ................................................................................................................... 49

1
1 Introduction
A tasty meal that smells good and looks appetizing to enjoy with a loved family
and dear friends is a pleasure of life. While food gives us nutrients, proteins, fats
and carbohydrates, it also acts as a source of delight, both for taste-buds and on
a social plane.
Before we can enjoy a meal, the food has to be prepared, it is purchased from a
retailer, processed by an industry, and the raw materials are produced by
agriculture. Different modes of transportation have moved the food from one
location to another. These activities affect the environment by the use of
resources and by emissions to air, water and soil. For example, the energy used
in the life cycle of the food chain, agriculture to consumption, was estimated to
be approximately 17% of the total energy use in Sweden (Uhlin, 1997). Of this
total, agriculture accounted for 15 - 18%, industry 17 - 20%, distribution 20 -
29% and consumption 38 - 45%. Agriculture stands for approximately 50% of
all eutrophication emissions in Sweden, whereas the reminder originates mainly
from sewage and transport (SEPA, 1997a, 1997b, 1997c). To the greenhouse
gases, the food system contributes around 28% (calculation based on SEPA,
2004 and Uhlin, 1997).
The Swedish population consumes seven million tonnes of food each year, the
largest part being dairy products, which constitute 25% of the total food intake
(SEPA, 1999). The consumption of milk in Sweden is high compared with the
average EU value (111.5 kg versus 76.6 kg), but for cheese the consumption is
just below average, 17.40 kg versus 18.18 kg (Swedish Board of Agriculture,
2004a). From dairy products, Swedes receive 14% of their energy intake, 25% of
their protein, and as much as 66% of their calcium (Swedish Board of
Agriculture, 2004b). The importance of dairy products in the Swedish diet is
also shown by the Swedish National Food Administration recommendation of a
2
daily consumption of half a litre of milk or a corresponding amount of other
dairy products.
Before the objective of this thesis is stated, the current trends in the food market
and the dairy industry are described. The interrelation of the appended papers is
given as the last part of the introduction.
1.1 The Food Market and the Dairy Industry
The world market for food products is becoming more integrated and
globalised. Integration is expanding with positive economic development, rising
population and greater urbanisation (Swedish Dairy Association, 2000). This
globalisation affects activities in the life cycles of foods, i.e. agriculture,
manufacture, retailing, consumption and the transports involved.
Heavy competition between dairy manufacturers, the requirements of product
development, and the production of a wider variety of products are the forces
working to cause manufacturers to cooperate and merge. This results in larger
manufacturing companies with an international market similar to that of
retailers. Several mergers and purchases of companies have taken place in the
dairy industry. For example, in northern Europe, most dairy companies have
merged into regional or national companies, and some even into international
companies (Swedish Dairy Association, 2000). Most dairies in Europe are
owned by farmers’ co-operatives.
There is a trend in the dairy industry towards production in a few large
specialised dairies. This specialisation can mean that one dairy produces mainly
consumer milk, a second cultured products and a third cheese. This leads to
more and longer transports from the dairy to the retailer. Fewer dairies and the
dairy farmers’ similar movement towards fewer farms also imply longer distance
of transports from the farm to the dairy.
3
The milk chain is a pushing system which has implications for the product
portfolio: the milk produced at the farms must be processed promptly into
products at the dairy. Since changing the volume of milk production at a dairy
farm is a slow process, it is not possible to adjust the amount of incoming milk to
rapidly changing market requirements, nor can milk be stored for long periods
of time. As the volume of incoming milk to the dairy cannot easily be adjusted,
the mix of outgoing products is changed instead, i.e. when the market
requirements change, the dairy industry must shift to other products that meet
the new requirements. This drives an increasing diversity of products. The
companies also contribute to diversity by releasing new products to generate a
greater demand for their output.
There has been a trend in the past 20 years towards increased consumption of
cultured products and cheese, with a decrease in consumption of drinking milk
products and butter. In Sweden, cultured milk and cream and yoghurt showed
an increase of 18% from 1985 to 2001. The increase in cheese consumption was
13% from 1985 to 2001, particularly soft cheese. Reductions noted in consumer
milk consumption were 26% and in butter consumption 37% from 1986 to 2001
(Swedish Board of Agriculture, 2004b).
4
1.2 Aim and Objectives
The aim of this work is two-fold. The first aim is to increase knowledge of the
environmental impact of the post-farm dairy chain and to assess potential
improvements. The second aim is to contribute to development of methodology
for environmental systems analysis.
Specific objectives related to the first aim are:
▬ assessment of the environmental consequences of ongoing changes in
society, which influence the dairy product chain, and
▬ generation of improvement options and assessment of their
environmental consequences.
Specific objectives related to methodology are:
▬ to develop a method to design an environmentally preferable, or even
best, sequence for products that are produced consecutively with the
same equipment, and
▬ to develop a method of identifying the activity, for each actor in the post-
farm chain, which offers the greatest environmental improvement in a life
cycle perspective.
In the work covered by the five papers, the goals dealt with are as follows:
• to develop potential future scenarios for the milk supply chain;
• to identify the key environmental issues for the milk supply chain;
• to acquire environmental data for the life cycle of cheese;
• to determine the key environmental issue in the life cycle of cheese;
• to design a sequence, for a given set of products, which minimises milk
waste in a multi-product manufacture;
• to investigate the environmental role of the frequency of each product in
a sequence; and
• to identify the actions, by the dairy, retailer and household, which offer
the most environmental improvement in a life cycle perspective.
5
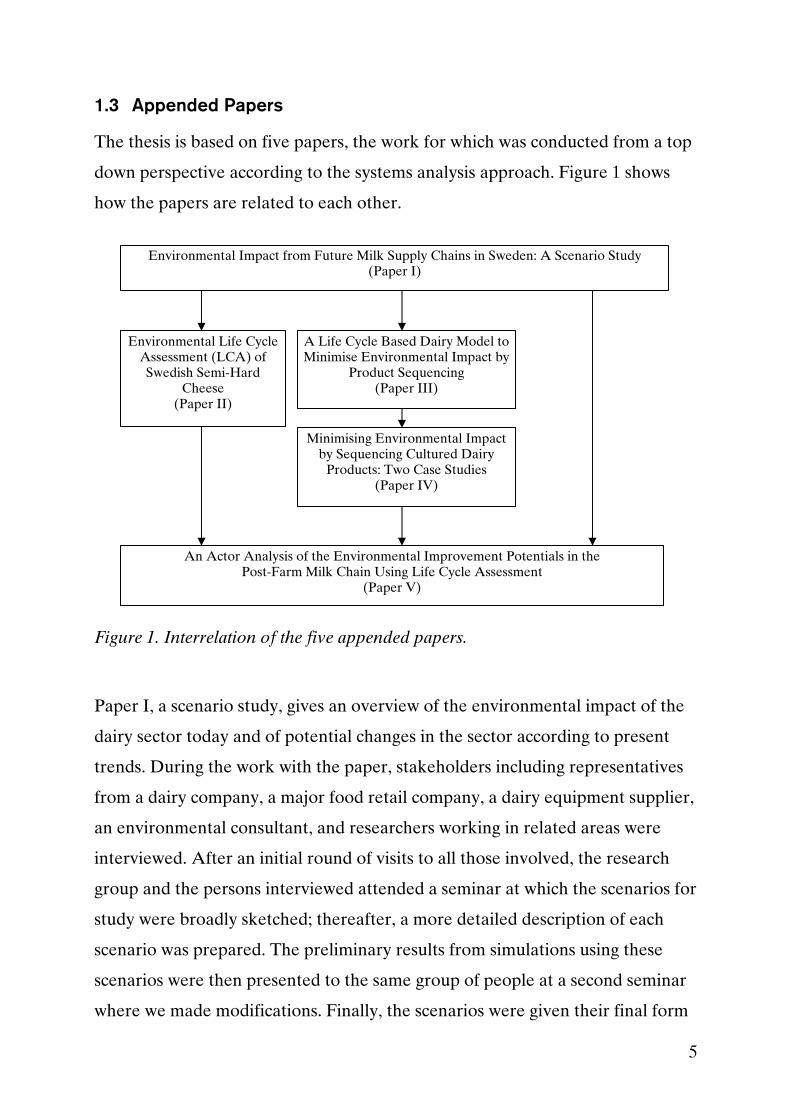
1.3 Appended Papers
The thesis is based on five papers, the work for which was conducted from a top
down perspective according to the systems analysis approach. Figure 1 shows
how the papers are related to each other.
Figure 1. Interrelation of the five appended papers.
Paper I, a scenario study, gives an overview of the environmental impact of the
dairy sector today and of potential changes in the sector according to present
trends. During the work with the paper, stakeholders including representatives
from a dairy company, a major food retail company, a dairy equipment supplier,
an environmental consultant, and researchers working in related areas were
interviewed. After an initial round of visits to all those involved, the research
group and the persons interviewed attended a seminar at which the scenarios for
study were broadly sketched; thereafter, a more detailed description of each
scenario was prepared. The preliminary results from simulations using these
scenarios were then presented to the same group of people at a second seminar
where we made modifications. Finally, the scenarios were given their final form
Environmental Impact from Future Milk Supply Chains in Sweden: A Scenario Study (Paper I)
Environmental Life Cycle Assessment (LCA) of Swedish Semi-Hard
Cheese (Paper II)
A Life Cycle Based Dairy Model to Minimise Environmental Impact by
Product Sequencing (Paper III)
Minimising Environmental Impact by Sequencing Cultured Dairy
Products: Two Case Studies (Paper IV)
An Actor Analysis of the Environmental Improvement Potentials in the Post-Farm Milk Chain Using Life Cycle Assessment
(Paper V)
6
which included: variation of products, both small and large scale dairies,
differences in modes of transport, different kinds of retailers, and a diversity of
packaging volumes. A model based on material flow and substance flow
accounting, together with the impact assessment part of life cycle assessment
(LCA), was constructed to assess the scenarios. The knowledge gained about
the dairy chain and current trends then constituted the basis for selecting
specified subjects to be further investigated in the subsequent work.
A lack of good quality, published, environmental data on cheese production and
the fact that a major quantity of the milk produced will end up as cheese
(approximately 10 kg milk is required to make 1 kg of cheese) together with the
ongoing increase in cheese consumption (13% from 1985 - 2001, Swedish Board
of Agriculture, 2004b) were the reasons for carrying out a life cycle assessment
of cheese.
That dairy products have become more and more diversified during recent years
is a fact. Product diversity was hard to include in the scenario study (Paper I) as
there was no information to be found about its environmental implications.
When diversity was discussed in the reference group, it emerged that it has been
dealt with from economic and technical viewpoints, but there were few studies
from an environmental standpoint. Hence, research was initiated on designing a
method that would minimise environmental impact by product sequencing at
the dairy (Paper III). The production of cultured products is mostly affected by
the greater product diversity when compared with drinking milk and cheese as
their batch volumes are much larger. A method for sequencing cultured
products was developed. A heuristic solution, which was designed intuitively
and based on production rules, was worked out for yoghurt production. To
determine whether the heuristic solution gave the best possible sequence from
an environmental perspective, an optimisation solution was also made. This
detailed scheduling model was successfully included in a life cycle assessment of
7
the production schedule at two dairies, Paper IV. The sequenced products were
yoghurt, sour cream, cold sauce and crème fraiche, all with multiple flavours.
During the work with the case studies, the role of frequency of each product to
be sequenced attracted attention. Technical scenarios with differing frequencies
were evaluated with life cycle assessment methodology in order to improve the
environmental impact.
Improvement assessment was also the topic of Paper V, but this time from an
actor perspective. A literature search did not reveal any publication dealing with
the measures taken by actors in the post-farm dairy chain from a life cycle
perspective. Hence, Paper V searched for the potential action, by the dairy,
retailer and household, that offers the most environmental improvement of the
product life cycle. The actions investigated were improved energy efficiency,
better transport patterns, reduced milk and product losses and organic labelling.
The three products considered were milk, yoghurt and cheese. Literature
studies and interviews with stakeholders to estimate improvement potentials
were used in combination with LCA methodology.
8
2 The Environmental Perspective of the Dairy Chain
A life cycle environmental perspective is applied in this work. First, previously
published studies of the dairy chain using life cycle assessment methodology are
given here. Next, the types of environmental impact related to the dairy chain
are discussed, followed by a section about how reductions of these impacts are
treated in the literature. The last part examines how actors can contribute to
environmental improvements.
2.1 Life Cycle Assessment of Dairy Products
As with most food items, milk products originate from agriculture. The dairy
farm produces the milk, and it is collected by a truck which delivers it to the
dairy. At the dairy the milk is processed into a variety of dairy products and
packaged for the consumer. After that they are delivered to the retailer where
the products are displayed for consumers on a refrigerator shelf or in a cold
room. A dairy item purchased by a consumer is transported to the household
and stored in the refrigerator before the final consumption. Each of these
activities in the milk chain causes environmental impact. The impacts of dairy
products have been identified and evaluated in several studies using life cycle
assessment (LCA) methodology. Nilsson and Lorentzon (1999) studied the
environmental consequences of processing milk. Høgaas Eide (2002b) made an
LCA of milk in which three milk-producing dairies were investigated. A
screening LCA of milk powder was undertaken by Blonk et al. (1997).
Lorentzon et al. (1997) studied the environmental effects of coffee cream, from
processing at the dairy to the purchaser. An LCA of the production of cultured
milk was made by Grøtan (1996), while butter was the subject of the LCA pilot
study at an Italian dairy company by Masoni et al. (1998). A soft cheese, a
Camembert, was examined in an LCA by Bernhard and Moos (1998). Although
the system boundaries differed in these publications, a consistent finding of
those which included a farming component was that agriculture had by far the
9
greatest environmental impact for most parameters. The ranking of the
contributions of the other life cycle phases to the environmental impact is not as
clear. The answer differs depending on the product and the environmental
impact category considered. However, the dairy, the production of packaging,
and the transport between retailer and household seem to make a higher
contribution than the other transports, the retailer and the household.
2.2 Types of Environmental Impact Related to the Dairy Chain
Agriculture contributes to global warming by emissions of methane and nitrous
oxide and to a lesser extent through emission of CO2 originating from the use of
fossil fuels. Livestock is the source of most of the methane emissions partly
because of ruminants’ enteric fermentation and partly due to manure
management with methane production under anaerobic conditions. Nitrous
oxide is released as a result of nitrification and de-nitrification processes in the
soil, as well as nitrogen transformation in manure. Emissions of nitrogen
pollutants are also the source of both eutrophication and acidification. The
release of ammonia is linked to the farmyard manure. Ammonia is not
acidifying in a chemical sense, but it has a strong acidifying effect as a result of
nitrification in the soil. Nitrate leaches from the arable land. Dairy farming
makes heavy demands of the land for example by soil erosion and compaction.
On the other hand, grazing ruminants also preserve valuable biotopes.
Concerning the use of resources, phosphorus should be highlighted, since it is
used not only as fertiliser but also as a mineral feed additive (Cederberg, 2002).
During processing at the dairy, separation, homogenisation and pasteurization
use most energy (Høgaas Eide and Ohlsson, 1998, Nilsson and Lorentzon,
1999). The cleaning operations have also been identified as a major source of
environmental impact (Lorentzon et al., 1997). Water, cleaning agents
(commonly used are nitric acid and sodium hydroxide) and energy are required.
The Cleaning in Place (CIP) system is usually used in dairies. This means that
10
rinsing water and cleaning agents are circulated through tanks, pipes and
process lines without dismantling the equipment. Effluents consist of milk
residues and water containing the cleaning agents. How much of the effluent
reaches the environment depends on the sewage treatment.
The production of the package as well as the waste management of packaging is
considered critical to the environmental impact, especially for products with a
low degree of processing. For dairy products, consumer milk is the least
processed, next are cultured products, and the most processed is cheese. The
manufacture of packaging as well as its distribution was shown to have a
considerable impact on energy use (17% of the total life cycle) and global
warming potential (18%) in a study of milk by Høgaas Eide (2002a). The
package was a one litre paperboard carton. The waste management of the
carton was the main contributor to eco-toxicity (59% of the total life cycle). The
design of the package is also highly relevant for the product loss in the consumer
phase (Johansson, 2002).
At the retailer and in the household, the electricity needed to keep the products
cold causes environmental impact. The environmental impact depends on the
energy mix used for producing the electricity. The Swedish average electricity
mix is made up of approximately 45 % each of hydroelectric- and nuclear
power, the remainder being produced from oil and combined heat and power
plants using bio fuel (Swedish Energy Agency, 2004). Hydroelectric power
affects biodiversity and landscape aesthetics and nuclear power cause emissions
of radioactive substances and radioactive waste.
2.3 Environmental Improvements
Within the food sector measures to decrease environmental impact are
continuously applied. Examples include improved plant nutrient balances on
farms, more energy efficient processes, reduction of material in packaging,
11
better logistic solutions, and environmental requirements for procurement.
Action for environmental improvement is traditionally taken at each part of the
food chain.
Measures to reduce environmental load in the agricultural phase are important,
as all LCAs of dairy products have identified farming as the dominant
contributor to the environmental impacts (see Section 2.1). Different types of
farming practices have been investigated in several studies. A review of the
environmental impact assessment of conventional and organic milk production
was made by de Boer (2003). Three studies of the differing agriculture practices
in northern Europe, i.e. south western Sweden, the Netherlands and southern
Germany, were reviewed. Cederberg and Mattsson (2000) assessed organic and
conventional farming practices in Sweden, and the Dutch study was carried out
by Iepema and Pijnenburg (2001). Both of these found that organic milk
production is a way to reduce pesticide use and mineral surplus. However, this
type of farming requires more grazing land than conventional farming. For
Sweden this was positive in that it promotes the domestic goals of preserving
biodiversity. However in the Netherlands, land is a scarce resource, which
makes greater land use a negative impact. Haas et al. (2001) who published the
German study came to the conclusion that, by renouncing mineral nitrogen
fertilizer, organic farming reduced the energy use and the global warming
potential in comparison with conventional farming. All three studies were based
on comparisons of experimental farms. The conclusion by de Boer (2003) was
that differences between production systems require assessments of a large
number of farms for each production system.
Another study of quantified improvement action in agriculture, made by
Hospido et al. (2003), dealt with Galician (Spanish) milk production. The
actions investigated were the reduction of milk losses during milking, a changed
feed composition with more maize and less silage, and the implementation of
12
treatment systems for water and air emissions. Moreover, a measure introduced
to improve dairy herds is the reduction of mastitis. Mastitis is an inflammatory
reaction of udder tissue to bacterial, chemical, thermal or mechanical injury.
The environmental impact of mastitis was assessed with LCA methodology by
Hospido and Sonesson (2005). A standard scenario for the incidence of mastitis
(present-day reality in Galicia) was compared with an improved one. A
reduction in the incidence of mastitis implies that the same amount of milk
would be produced in a shorter period of time or by fewer cows, hence the
impact on the environment would be lower. For example, the greenhouse gas
emissions from the agriculture sector of Spain could be reduced by 0.56% if
measures were taken to reduce the incidence of mastitis.
At the dairy, measures to lower the environmental impact include using less
energy, cleaning agents and water, decreasing the wastage of milk and other
products, thus raising the yield. A systems analysis of the energy used at two
dairies was published by Karlsson et al. (2004). Each step of the process and
each item of equipment was assessed. Specific actions to save energy were
identified and quantified with time perspectives from one to more than five
years; they concluded that the energy use could be decreased by 8% if all of the
actions were realised. Høgaas Eide et al. (2003) assessed four Cleaning in Place
(CIP) methods using life cycle assessment methodology. Production of cleaning
agents, transport, actual cleaning at the dairy and waste management of the
containers were included. The actual cleaning at the dairy was the most
important part of the life cycle. The CIP methods, enzyme-based cleaning and
one-phase alkaline cleaning, both using small volumes and low temperatures,
were found to be the best alternatives for the impacts of energy use, global
warming, acidification, eutrophication and photo-oxidant formation. A waste-
optimised product scheduling could decrease wastage of milk and products and
in that way increase the yield. A methodology for incorporating ecological
considerations into the optimization of design and scheduling of batch processes
13
was conducted by Stefanis et al. (1997); this included a case study of a cheese-
making dairy. The optimizations were based on both process economics and
environmental impact. In a theoretical study, Grau et al. (1995) introduced
optimization of process-sequence dependent changeover waste (as an
environmental issue) in product scheduling of a batch production unit.
Høgaas Eide (2002a) reviewed eleven LCAs of milk packaging and concluded
that a light-weight recyclable package, with properties that did not increase the
loss of product, was the best milk packaging alternative. Improvement options
for the retailer and in the household include more energy efficient cold storage
and other action to decrease product losses. An analysis of the ways to reduce
the energy requirements of refrigerator cabinets at the retailer was made by
Axell (2002). A test of 119 household refrigerators was made by Sonesson et al.
(2003). The difference was as much as 11.27 MJ/(per litre and year) between the
refrigerator using the most energy and the one using the least. Studies of
improvement actions to reduce the losses of dairy products in the household are
rare. There are different kinds of losses in the household, such as product left in
the container when the consumer considers it is empty, losses during
preparation, food left on the plate or in the glass, or thrown in the bin or the
sink when it has spoiled or passed shelf life. Each of these losses could be
decreased. The importance of the design of the packaging for food losses was
tested by Johansson (2002). In a comparison of packages for yoghurt, the cup
shape had 3.4% yoghurt left when considered empty, whereas the gable top had
8.7%. Losses of dairy products after mealtimes and storage were studied by
Sonesson et al. (2005) but they did not include improvement actions.
2.4 Environmental Improvements from an Actor’s Perspective
A range of actions is available to decrease the environmental impact. The best
choice for each actor may not be the same for all who are involved in the same
consumption chain because their domain of influence differs. For example,
14
although the consumer is not able to influence the production schedule at the
dairy, there is still a choice between organic or conventional milk during
purchasing. Actions taken by one person may lead to substantial improvements
in phases of the life cycle controlled by other people. Environmental studies of
the food chain from an actor perspective are rare in the literature. Jungbluth et
al. (2000) published one of the few and pointed out the consumer as the actor
with the greatest potential to influence the food chain in environmental matters.
They found that the consumer had the widest range of choice to make decisions
that reduce the environmental impact. The method applied was reviewing
published LCA studies. Five single aspects of decisions were identified: type of
agricultural practice, origin, packaging material, type of preservation and
consumption. These decisions were then assessed in simplified LCAs of meat
and vegetables. The most important options for a reduction of environmental
impact were found to be refusal of air-transported products, a preference for
organic foods and a reduction in meat consumption.
Another important decision made by the consumer is the choice between foods.
An environmental comparison of four meals was made by Carlsson-Kanyama
(1998). Although the study did not include an actor analysis, it is relevant for
this topic in that it is a study of decisions made by one actor in the food chain.
This comparison concluded that a meal composed of tomatoes, rice and pork
has nine times higher impact on climate change emissions than a meal made
from potatoes, carrots and dry peas. A subsequent investigation by Carlsson-
Kanyama et al. (2003) shows that contrasting diets with similar energy content
can vary in energy input by a factor of four, from 13 to 51 MJ. They also
concluded that the least energy consuming diets, which are far from the Swedish
average, are not in line with current trends.
In another study of the influence of decisions taken by one actor in the food
chain, Lindgren and Elmquist (2005) examined the environmental and
15
economic impacts of decision making at an arable farm. Variations in prices,
subsidies, the farmer’s attitudes about environmental concerns, and the farmer’s
skill in making production allocation choices were studied. With regard to
economic performance, either organic farming or a conventional cultivation
with a large amount of pesticides and fertilizers offered the most profit. The
former benefited from higher subsides and selling prices, the latter from large
yields. Regarding environmental impacts, the result depended on the impact
category studied. To obtain a low contribution to eutrophication and
acidification, conventional farming was preferred, due to ammonia emissions
during slurry spreading. Nevertheless, to reduce global warming, the organic
alternative was preferable because no mineral fertilizer was used.
16
3 Methods
This thesis is based on five papers, the work for which was conducted by various
methods. The aim of each study determined the choice of methods and system
boundaries used during modelling. The methods used were: environmental
systems analysis methods of various types, mostly life cycle based; a scenario
technique; quantitative problem techniques; interviews and seminars with actors
in the dairy chain; and visits to dairies. A general description of the methods
follows with specific comments about how they were used in the work.
3.1 Environmental Systems Analysis Tools
Environmental systems analysis includes several tools which can be categorised
as flow models, monetary models, procedural methods and risk assessment.
Examples of tools based on physical flows are life cycle assessment, material
flow accounting and substance flow accounting. Cost-benefit analysis facilitates
assessing total costs, including environmental costs, and benefits from a planned
project. In design for the environment, a wide range of procedural methods are
used, in an effort to include the environmental dimensions into the design
process. Risk assessment is a broad term that covers several types of
assessments, to deal with human health or environmental aspects. The risk can
also vary from diffuse to specific and can be associated with customary usage or
accidents. Frameworks for comparing differing approaches was devised by
Baumann and Cowell (1999); they were further developed in Wrisberg et al.
(2002) and Finnveden and Moberg (2005). Baumann and Cowell (1999)
emphasize the importance of practical integration of existing approaches for a
variety of applications, rather than developing new tools, and Wrisberg et al.
(2002) agreed. Furthermore, Finnveden and Moberg (2005) came to the
conclusion that, depending on the objects the tools focus on, different tools
cannot easily replace each other. In the following the tools used in the papers
17
included in this thesis are briefly outlined; life cycle assessment, material flow
accounting and substance flow accounting.
3.1.1 Life Cycle Assessment
Life cycle assessment (LCA) is used in all of the appended papers. In Paper I,
the impact assessment element of LCA methodology was chosen for the
interpretation of the result. Paper II is a descriptive LCA of cheese. An LCA
study is either descriptive or change-oriented. A descriptive (attributional or
accounting) study describes a system as it actually is. A change-orientated
(consequential or effect-oriented) study analyses the consequence of a choice.
In Paper III, a sequencing method is worked out and it is shown that it may be
linked to LCA. To evaluate the scenarios of different frequencies of production
in a sequence, LCA was linked to the sequencing method (Paper IV). The work
in Paper V started with descriptive LCAs carried out for milk, yoghurt and
cheese. Then these LCAs were changed to show the estimated improvement
measure of each actor. A comparison of the changed LCAs revealed the action
that made the greatest difference from an environmental point of view for each
actor in the chain. A brief description of LCA in general with specific examples
from the papers follows.
Life cycle assessment is a tool for evaluating the environmental impact
associated with a product, process or activity during its life cycle. This is
accomplished by identifying and quantitatively or qualitatively describing its
requirements for energy and materials, and the emissions and waste released to
the environment. The life cycle is included in the assessment, which means that
the product under study is followed from the initial extraction and processing of
raw materials through manufacturing, distribution, and use, to final disposal,
including the transports involved. Besides identifying and quantifying the
environmental impact of the product or activity, LCA also identifies what
activities in the product life cycle contribute the most to this impact. An LCA is
18
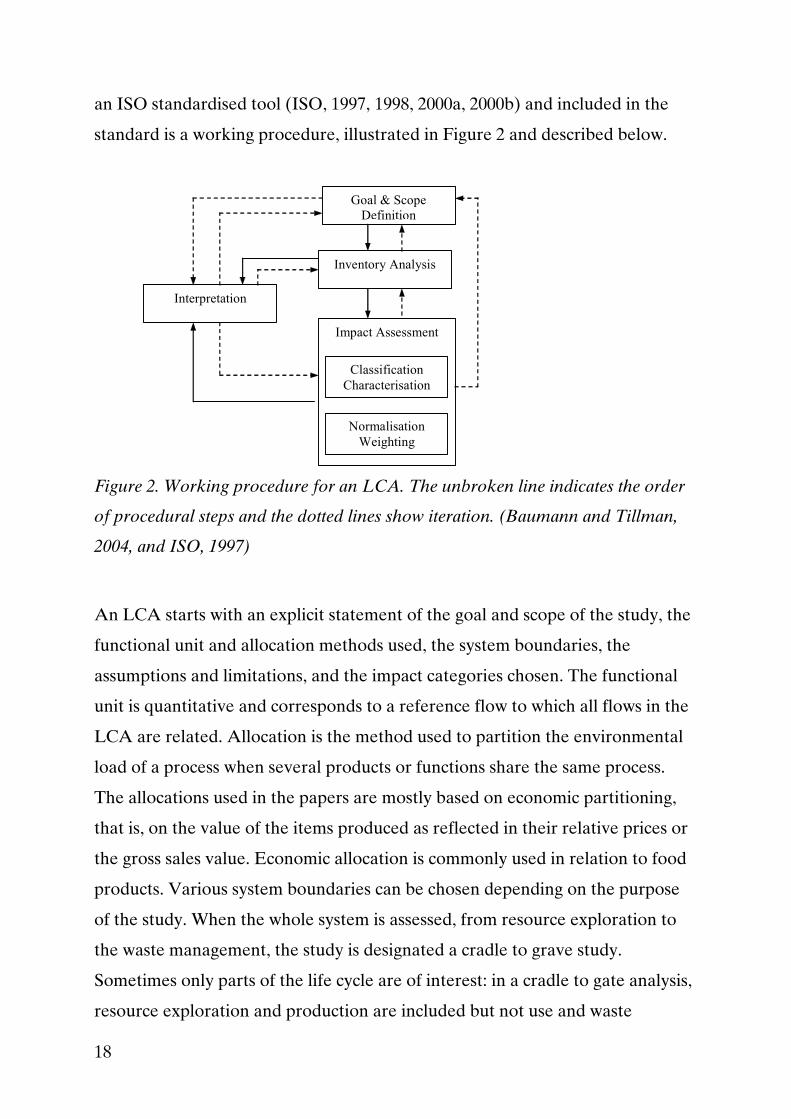
an ISO standardised tool (ISO, 1997, 1998, 2000a, 2000b) and included in the
standard is a working procedure, illustrated in Figure 2 and described below.
Figure 2. Working procedure for an LCA. The unbroken line indicates the order
of procedural steps and the dotted lines show iteration. (Baumann and Tillman,
2004, and ISO, 1997)
An LCA starts with an explicit statement of the goal and scope of the study, the
functional unit and allocation methods used, the system boundaries, the
assumptions and limitations, and the impact categories chosen. The functional
unit is quantitative and corresponds to a reference flow to which all flows in the
LCA are related. Allocation is the method used to partition the environmental
load of a process when several products or functions share the same process.
The allocations used in the papers are mostly based on economic partitioning,
that is, on the value of the items produced as reflected in their relative prices or
the gross sales value. Economic allocation is commonly used in relation to food
products. Various system boundaries can be chosen depending on the purpose
of the study. When the whole system is assessed, from resource exploration to
the waste management, the study is designated a cradle to grave study.
Sometimes only parts of the life cycle are of interest: in a cradle to gate analysis,
resource exploration and production are included but not use and waste
Goal & Scope Definition
Inventory Analysis
Impact Assessment
Classification Characterisation
Normalisation Weighting
Interpretation
19
management. Another example is gate to gate analysis in which neither the
resource exploration nor waste management are included; sometimes the use
phase is omitted as well. The goals and scope, excluding the allocation, used in
the appended papers, are summarised and listed in Table 1.
In the inventory analysis a flow model of the technical system is constructed
using data on inputs and outputs, i.e. resources, energy requirements, emissions
to air and water, and waste generation for all activities within the system
boundaries. The inventory analysis is followed by impact assessment, in which
the data are interpreted in terms of their environmental impact. In the
classification stage, the inventory parameters are sorted and assigned to specific
impact categories. The next step is characterisation, where inventory parameters
are multiplied by equivalency factors for each impact category. Thereafter all
parameters included in each impact category are added to obtain the total for
that category. Examples of environmental impact categories are acidification,
eutrophication and global warming.
For many LCAs, the analysis is concluded by a characterisation, which is the
case for all LCAs included in the appended papers. However, some analyses
involve the further step of normalisation, in which the results of the impact
categories are compared with the total impact in the geographical region
relevant for the study. The size of the region depends on the nature of the
impact; some impacts are global while others are regional or even local. During
weighting, the kinds of environmental impacts are weighted against each other
to find an overall value for the total environmental impact. For the purpose of
the papers in this thesis, normalisation and weighting were regarded as
unnecessary.
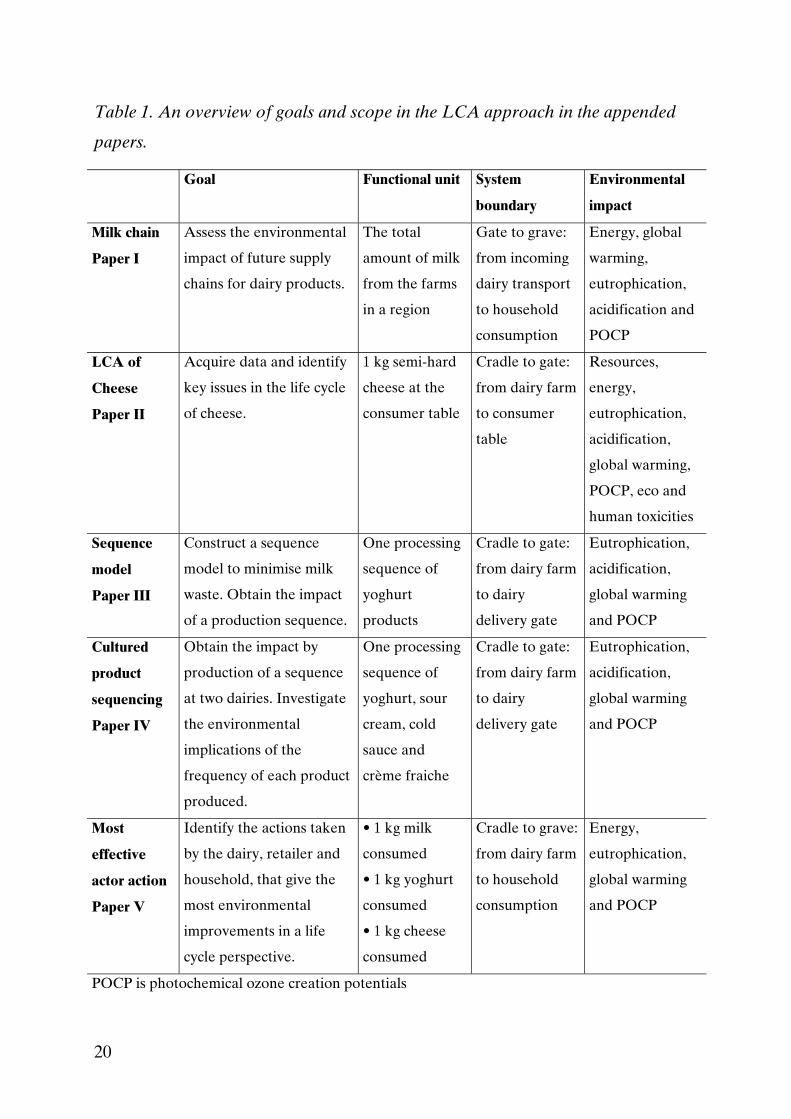
20
Table 1. An overview of goals and scope in the LCA approach in the appended
papers.
Goal Functional unit System
boundary
Environmental
impact
Milk chain
Paper I
Assess the environmental
impact of future supply
chains for dairy products.
The total
amount of milk
from the farms
in a region
Gate to grave:
from incoming
dairy transport
to household
consumption
Energy, global
warming,
eutrophication,
acidification and
POCP
LCA of
Cheese
Paper II
Acquire data and identify
key issues in the life cycle
of cheese.
1 kg semi-hard
cheese at the
consumer table
Cradle to gate:
from dairy farm
to consumer
table
Resources,
energy,
eutrophication,
acidification,
global warming,
POCP, eco and
human toxicities
Sequence
model
Paper III
Construct a sequence
model to minimise milk
waste. Obtain the impact
of a production sequence.
One processing
sequence of
yoghurt
products
Cradle to gate:
from dairy farm
to dairy
delivery gate
Eutrophication,
acidification,
global warming
and POCP
Cultured
product
sequencing
Paper IV
Obtain the impact by
production of a sequence
at two dairies. Investigate
the environmental
implications of the
frequency of each product
produced.
One processing
sequence of
yoghurt, sour
cream, cold
sauce and
crème fraiche
Cradle to gate:
from dairy farm
to dairy
delivery gate
Eutrophication,
acidification,
global warming
and POCP
Most
effective
actor action
Paper V
Identify the actions taken
by the dairy, retailer and
household, that give the
most environmental
improvements in a life
cycle perspective.
• 1 kg milk
consumed
• 1 kg yoghurt
consumed
• 1 kg cheese
consumed
Cradle to grave:
from dairy farm
to household
consumption
Energy,
eutrophication,
global warming
and POCP
POCP is photochemical ozone creation potentials
21
3.1.2 Material Flow Accounting and Substance Flow Accounting
Material flow accounting (MFA) describes all in- and outflows and
accumulation of a material, substance or element in a geographic area for a
given period of time (Udo de Haes et al. 1997). Depending on the type of
material studied, a further distinction of MFA is often applied. Bulk-material
flow analysis studies flows of materials, such as wood, iron or plastics, in a given
region. Flows of substances such as nitrogen compounds and single elements
such as cadmium or lead within a region are traced in a substance flow
accounting (SFA) (Udo de Haes et al. 1997). Van der Voet et al. (1995) state
that one of the aims of SFA is to obtain an overview of the economic and
environmental flows in a specific geographical region. Cederberg (1999), for
example, quantified the flows of nitrogen, phosphorus and potassium connected
with the production and consumption of food in a Swedish district. Both MFA
and SFA were used in Paper I, together with the impact assessment element of
LCA. The flow under study was milk in a region of central Sweden. Together
with the accounting for the resources and energy consumption, this is the part
that is based on MFA. However, accounting for the in- and outflows of all the
emissions that occurred in each step of the milk product system as well as taking
into account the protein content can be considered in an SFA. A life cycle
perspective was used in the study.
3.2 Scenario Techniques in LCA
In the context of LCA the SETAC Europe working group on scenario
development defined a scenario as a description of a possible future situation
relevant for specific LCA applications, based on specific assumptions about the
future and, when relevant, a description of a path from the present to the future
(Weidema et al., 2004, Pesonen et al., 2000). They distinguished three types of
scenario application in LCA: technology, environment, and valuation. In this
thesis most of the scenarios used can be categorised as the technology type,
which concern the technosphere or more specifically the product system, except
22
for those used in Paper I. They were based on changes in societal developments
and consumer behaviour, which in turn led to modified product systems.
According to van der Voet et al. (1995), changes in society, which affect
substance flow, can be linked to an SFA study. Examples of this are the SFA
studies connected to scenario analysis, presented by Sonesson et al. (1997) and
Björklund et al. (2000). Both of these dealt with the environmental
consequences of scenarios for waste management in Swedish cities.
3.2.1 What-if and Cornerstone Scenarios
According to Weidema et al. (2004) and Pesonen et al. (2000) there are two
principal approaches to scenario development in LCA studies: what-if scenarios
and cornerstone scenarios. The what-if approach is the most widely used of the
two and has a shorter time perspective. The environmental impact of specific
changes is compared or tested. What-if scenarios often result in quantitative
comparisons of the options selected. In a cornerstone approach scenarios are
chosen to give an overall view of the subject of study. They mark the outer
limits of possible developments in order to ensure that the differences between
them stand out clearly and to facilitate the identification of key differences.
What-if scenarios were used both in Paper IV (Cultured product sequencing)
and Paper V (Actors’ action selection). In Paper IV case studies were carried
out for several technical scenarios. Three scenarios for each dairy, with differing
frequencies of the products, were devised for the sequencing. To vary the
product frequency means to vary how often a given product was made weekly.
The frequencies of the products chosen for the scenarios were: the frequency
currently used for each product (2 - 5 times per week); twice a week for each
product; and, in the last scenario, 1 - 2 times per week for each one according to
their shelf life. The scenarios were designated: Reference, Goal and Future. The
Reference scenario reflected the current situation. The Goal scenario was
23
assumed to be achievable for most dairies within a reasonable time. The Future
scenario was believed to be attainable in the future.
In Paper V improvement measures were environmentally assessed and
compared. Each action taken by each actor can be viewed as a what-if scenario,
although it was not termed so in the paper. The actions investigated were
improved energy efficiency, better transport patterns, reduced milk and product
losses and organic labelling. These changes could be made by the dairy, the
retailer and the household, although each actor could undertake only some of
them. The time perspective was five years from now.
The scenario technique used in Paper I (the milk chain study) mirrored possible
developments in the milk supply chain. The scenarios were defined with ideas
from the reference group discussions (see Section 1.3) but with simplifications to
make them feasible. The selections were made to give an overall view of the
milk chain and thus represent the most extreme developments in society and
consumer behaviour, similar to the cornerstone approach. The reference
scenario reflects the milk chain as it was structured in 1999. A version called
Large Scale assumes a shift towards larger units within both industry and among
retailers. The Splendid Times version resembles the Large Scale but with the
difference that there has been greater economic growth. An economic recession
with a decrease in the use of cars was included in the Harsh Times version. The
last scenario simulated was the Green IT Wave which assumes a less
materialistic lifestyle. Each variation, except the reference scenario, had a time
perspective of 20 years in the future.
3.3 Operational Analysis
Operational analysis is a group of quantitative techniques for solving systems
analysis problems. Included in the category are optimisation, linear
programming, dynamic programming, and queue theory (Gustafsson et al.,
24
1982). In Paper III a heuristic procedure (an intuitively designed procedure) was
worked out to achieve the environmentally preferred production sequence of
yoghurt products. The heuristic solution was validated with an optimised one.
Both of the solutions are described below.
3.3.1 The Heuristic Solution for a Product Sequence
Heuristic procedures are intuitively designed and can give a good approximate
solution. Although they cannot be guaranteed to give an optimal solution they
are often used for very large problems (Hillier and Lieberman, 1995). The
heuristic procedures used in Paper III were based on rules used in a yoghurt
producing dairy. More specifically, the rules were based on the characteristics of
each product, which determined the choice of technique selected for a product
change. The techniques were cleaning, rinsing and the pushing principle.
Cleaning causes the most waste, use of cleaning agents and water, followed by
rinsing which uses only water; the pushing principle causes the least waste and
does not use cleaning agents or water. Therefore the best schedule uses the
pushing principle the most, while rinsing and cleaning are used as seldom as
possible.
The first step was to make a matrix of all of the products and list their individual
characteristics (base, presence of rhubarb and vanilla, allergenic potential and
intensity in colour). Then the sorting procedure starts with grouping according
to the yoghurt base. Within each base, products containing rhubarb and vanilla
were placed last. Products with allergic substances were next to the last. Finally,
the rest of the products within the base group were sorted by increasing colour,
pale ones first and the dark ones last. This sorting procedure is a solution to the
production schedule. However, there is no guarantee that this is the optimal
solution, because the sorting is done according to processing rules used during
manufacturing, and there is not a test of all possible solutions to find the best
one for the schedule.
25
3.3.2 Finding a Waste Minimised Sequence for a “Travelling Salesman
Problem”
Finding the optimal product sequencing solution involves searching through all
possible combinations of the manufacturing order of the set of products to be
sequenced. Our problem had similarities to the “travelling salesman problem”
(TSP): given a set of N cities, find the shortest route connecting them all, with
no city visited twice (Sedgewick, 1988). For our problem, the cities were
interpreted as yoghurt types and the routes connecting them were weighted
according to the waste volume caused by a product change. The waste volume
was determined by the product change technique (cleaning, rinsing, pushing
principle), which in turn was governed by the processing rules. This problem
formulation gave rise to a weighted, directed TSP. Moreover, the TSP graph was
complete since there is a route between any two products in the graph. A large
TSP is insoluble in practice, as the number of solutions that must be checked
grows in proportion to the faculty of the cities involved (N! = 1 · 2 · 3 ··· N). The
optimisation presented in Paper III was made to validate the heuristic solution
for the waste minimised sequence, for as large a number of products as possible
within a reasonable time. For more information about TSP, see Sedgewick
(1988).
For the optimisation in Paper III the problem was: Given a mix of products, find
the production sequence that causes the least waste. The waste that occurs
during a product change depends on the properties of the two products. The
problem has as many as N! solutions for the schedule, where N is the total
number of products in the sequence. First an exhaustive search was made to
check all possible solutions for the scheduling of products. The result of this was
not satisfactory; as it took 89 minutes to check the number of solutions (12! =
479 001 600) for 12 products on a standard laptop. To enable scheduling more
products, it was decided to reduce the number of solutions checked without
sacrificing optimality. The sum of the waste, x, for the first sequence was
26
calculated. For the following searches, it was fruitless to continue any sequence
for which the summed waste was greater than x, therefore these ones were
removed. After this 14 products could be sequenced with minimum waste in 140
minutes.
To improve the optimisation even more, a method known as branch-and-bound
was chosen (Sedgewick, 1988). For a given partial product sequence, a lower
bound of the total waste of all product sequences, which started with that
particular partial product sequence, was computed. If the waste of the best
sequence found so far was less than this bound, then all of those sequences
could be disregarded and did not need to be searched. The algorithm was
applied recursively until all possibilities were searched. In this way the workload
was significantly reduced, since the bound could be computed very efficiently.
The branch-and-bound technique reduced the number of solutions dramatically.
By using both of the techniques described to limit the full searches, we were
able to make a schedule of 21 products within a reasonable time (30 minutes).
With 21 products 5.1 · 1019 sequences were tested. The best of those was the
solution to our problem. Note that the algorithm is still guaranteed to find the
waste minimised sequence (Sedgewick, 1988).
27
4 The Environmental Consequences of Current Trends and
Options for Improvement
Current trends in society and industry have consequences for the milk chain and
its environmental impact. Assessment of these is one of the aims of this work
and was dealt with in three of the appended papers (I, II and IV). When
information gathered reveals a trend of negative impact, it is time to find a way
to improve the situation. Improvement possibilities, another objective of the
thesis, were dealt with in all the appended papers, in particular Papers IV and V.
This chapter gives an overview of the findings from each of the papers. A
discussion about the findings in relation to trends and improvement options
concludes the section.
4.1 Environmental Impact of Future Milk Supply Chains in Sweden: A
Scenario Study
The first paper aimed to form an overview of some potential developments of
the supply chain for dairy products in a specific region of Sweden, and the
effects these would have on of the environment. The milk supply chain under
study is located in the central part of Sweden, roughly an east-west line 100 km
north of Stockholm and southward, excluding the southernmost region, Skåne.
The milk flow in this region was investigated with the tools MFA and SFA and,
to some extent, LCA (impact assessment). The life cycle perspective used in the
study included resource use for transporting whole milk from farms to dairies,
processing in dairies, distribution to retailers, retail stores, transport to
households and finally storage in homes. The environmental impact of energy
production, manufacture of packaging material, waste management and sewage
treatment caused by the milk chain was also integrated. The agriculture was not
included. The major dairy products included were drinking milk, cream, butter,
cultured products (e.g. yoghurt) and cheese.
28
Five scenarios were worked out to mirror possible developments in the milk
supply chain, see Section 3.2.1. The total volume of milk from the farms in the
area was constant in all scenarios; the same amount of milk was also leaving the
system but in different combinations of products and losses. The most
preferable scenario from an environmental view for most impact categories was
the one designated Harsh Times, while the least preferable scenario was
Splendid Times. These two were the extremes of the economic growth in
society. In Harsh Times the price was the most important factor, and in Splendid
Times service was essential. This was shown by the products consumed, the kind
of retailers used, how to get to the retailer, and the size and material used for
packaging. In Harsh times drinking milk is the product most consumed.
Electronic shopping is frequently used or the neighbourhood retailer, as fewer
people can afford a car. The products are produced in large cardboard packages
to reduce the price of the products. In Splendid Times the amount of cheese and
cultured products consumed were increased at the expense of drinking milk.
Travelling by car to distant retailers or specialised shops is the usual way of
purchasing food. Many small bottles and packages of products with different
flavours are preferred. The bottles and packages are made of polyethylene
terephthalate (PET) and high-density polyethylene (HDPE).
Measures could be taken to improve all five scenarios. The production of
packaging materials, the waste management and the transports had the greatest
impact on the environment and resource use in all five. For transports it was the
part between retailers and households that contributed the most. Consequently,
improvement action in these areas would decrease the environmental impact.
The industrial part was important when considering resource use, such as the
net energy turnover, but had a minor impact on the effect categories included.
29
4.2 Life Cycle Assessment of Semi-Hard Cheese
The purpose of the cheese study was to identify the environmental
consequences of Swedish cheese production and the most environmentally
important activities within its life cycle. LCA fulfilled the requirements of this
objective and was found to be the appropriate method for the study. The focus
of the investigation was on the cheesemaking dairy. One of the most popular
semi-hard cheeses in Sweden was selected, Hushållsost. The system studied
covered the extraction and production of the ingredients required for
cheesemaking, as well as retailers, households, waste management and the
transports involved.
The main outcome was that milk production at the farm was the activity in the
life cycle that contributed most to the environmental impact categories included.
The result agrees with other LCAs of dairy products (see Section 2.1). The
agricultural activities accounted for as much as 93% to 99%, depending on
impact category, of the total life cycle contribution. The contribution from the
cheesemaking dairy was 0.5% to 4% depending on impact category. Apart from
the agriculture and the cheesemaking dairy, the retailers and the production of
plastic were also contributors to the environmental impact of Hushållsost.
To make substantial improvements in the environmental performance of cheese
production, it is necessary to address the activities that contribute the most to
the environmental impact. Improving farming practices with the environment in
mind could substantially raise the performance of the system studied. However,
farming is beyond the scope of this thesis, and therefore I refer to Cederberg
(1998) and Cederberg and Bergström (1999) who suggest possible ways of
improving milk production.
From the dairy’s perspective, an important improvement would be to decrease
the amount of milk required to produce cheese, and in that way reduce the
30
environmental impact from the agriculture, as less milk would need to be
produced. Identifying and minimising the losses of milk during the production
of cheese would lower the consumption of milk without affecting the final
product. There are methods to increase the yield of cheese during the
cheesemaking process, but they all have the drawback of affecting the quality of
the cheese. These methods include increasing the water and salt content of the
cheese, and retaining more whey protein in the curd (Bertelsen et al., 1983,
Johansson, 2001).
Raising the protein content of the incoming milk also gives a better yield of
cheese (Johansson, 2001). The protein content of milk depends on such factors
as the breed of cattle and the fodder used. However, the choice of fodder will
affect the environmental impact of farming; hence, with the information
available, it was not possible to predict how changing this might affect the
outcome of the entire system. Consumers, too, could contribute by minimising
wastage of cheese in the household and reducing car transportation from the
retailer to the household.
4.3 Minimising Environmental Impact by Sequencing Cultured Dairy
Products: Two Case Studies
The diversity of cultured milk products available continues to rise. In Europe
the dairy sector holds the top position in terms of innovative markets in the food
sector (Innovaction, 2003). From the dairy perspective, it is mostly the
production of cultured products that is affected by increased diversity. The
reasons are that it is the cultured products which are available in greatest variety
and also that cultured milk cannot be recycled into the process again. The waste
from cultured milk is either used as animal fodder or, when the water content is
high in the milk residues, it goes to the sewage treatment plant. Loss of product
(also called waste) occurs during each change of product; most of these take
place just before the product is packaged. When product diversity rises, the
31
number of product changes increases and, consequently, a rise in waste of
product occurs. The amount of waste, as well as use of cleaning agents, water
and energy requirements, depends on the products involved in the change.
Therefore the production schedule, where the processing order is decided, is a
key activity for reduction of the rising environmental burden caused by
diversity.
A model was designed to generate the best sequence of products, from an
environmental point of view, which causes the least waste possible while a
constant total volume is produced (Paper III). Two case studies using the
sequencing model were reported in Paper IV. It was found that the dairies do
have options to counteract the environmental effects associated with their
production sequences, for example to use a waste minimised order in the
production planning for each single day of production. A second option was the
frequency of production of each product. By examination of production
schedules on a weekly basis, it was found that the same type of product was
produced as many as five times in the same week. Therefore, scenarios with
variations in the frequency of these types were assessed, using the model (Paper
III), and analysed with LCA methodology.
The frequency with which products are processed was found to have a
significant influence on the amount of waste generated. The results clearly
showed that a decrease in frequency of production per product reduced the
waste generated by the sequence. When the frequency was changed from 2 - 5
times per product and week to twice weekly (from Reference scenario to Goal
scenario, see Section 3.2.1), the waste was decreased from 11 715 kg to 8 698 kg
for Dairy A and from 12 194 kg to 9 301 kg for Dairy B per week. (The dairies
investigated were designated Dairy A and Dairy B.) On a yearly basis, the
reduction of waste would be the amount corresponding to approximately 3.5
days of production for Dairy A and 4 days for Dairy B. It was found to be
32
possible to reduce the product frequency even further, and this was done in the
Future scenario (see Section 3.2.1); this one had a product frequency of 1 - 2
times per product depending on its shelf life. A comparison of the waste
generated each week in the Reference scenario with that in the Future scenario
showed the waste was decreased from 11 715 kg to 5 900 kg for Dairy A and
from 12 194 kg to 7 100 kg for Dairy B per week. On a yearly basis, the
reduction of waste would be the amount corresponding to approximately 7 days
of production at Dairy A and 7.5 days at Dairy B.
Less waste not only reduces environmental impact but also makes economic
savings possible. Dairies can reduce cost not only by decreasing waste but also
by reducing working time. With a changed product frequency, it was possible to
decrease the number of production days by one day per week with the Future A
scenario at Dairy A. At Dairy B the packaging was reduced by one day per
week for one of the machines with the Goal B scenario; packaging was reduced
by another day per week at each of two machines with the Future B scenario.
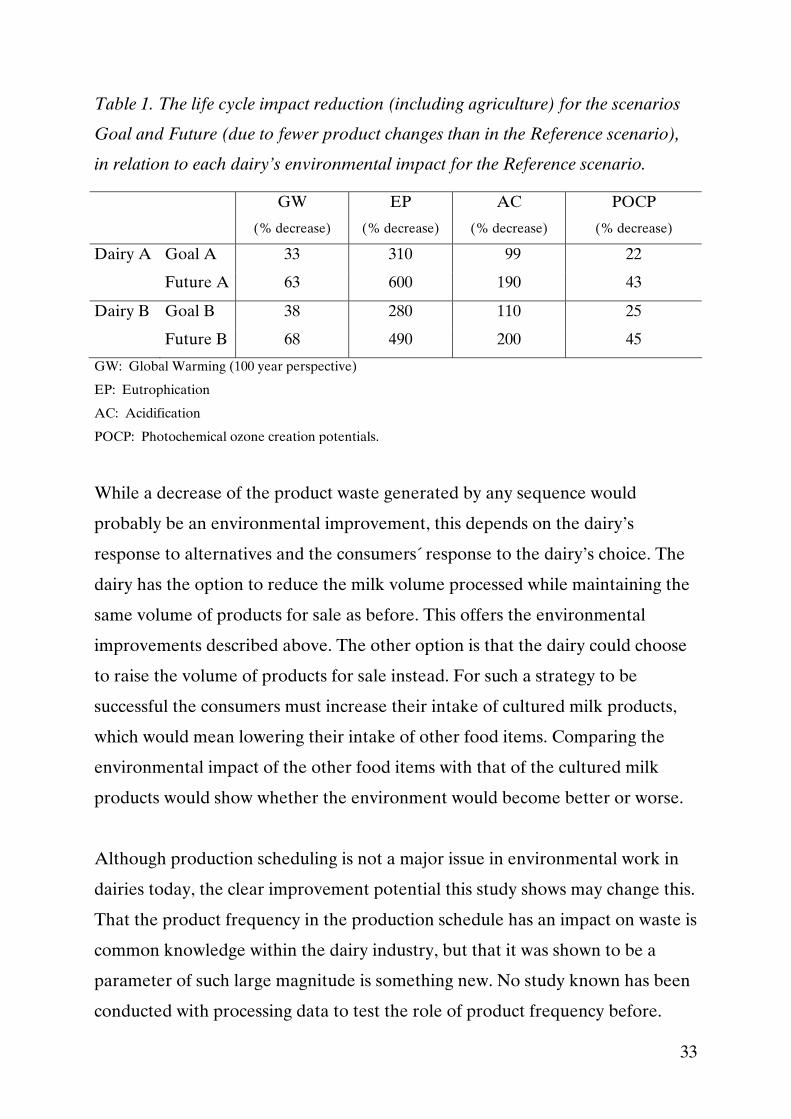
By changing the product frequency, leading to fewer product changes,
substantial environmental improvement was achieved with reduced product
waste, energy savings, and a decrease in use of cleaning agents and water. In a
life cycle perspective, a decrease of the impact categories of 1.3% was achieved
with the Goal A sequence, and 2.5% with the Future A sequence at Dairy A;
this was 1.5% with Goal B and 2.6% with Future B at Dairy B. By changing the
perspective to the dairy where the actual improvement could take place, it was
revealed that the reduction in environmental impact, for the Goal and Future
scenarios in comparison with the Reference scenario, would be even greater
than the dairies’ own contribution for some categories (Table 2). This result is
due to the extreme dominance of agriculture in the life cycle environmental
impact of dairy products, see Section 2.1 and Paper II.
33
Table 1. The life cycle impact reduction (including agriculture) for the scenarios
Goal and Future (due to fewer product changes than in the Reference scenario),
in relation to each dairy’s environmental impact for the Reference scenario.
GW
(% decrease)
EP
(% decrease)
AC
(% decrease)
POCP
(% decrease)
Dairy A Goal A 33 310 99 22
Future A 63 600 190 43
Dairy B Goal B 38 280 110 25
Future B 68 490 200 45
GW: Global Warming (100 year perspective)
EP: Eutrophication
AC: Acidification
POCP: Photochemical ozone creation potentials.
While a decrease of the product waste generated by any sequence would
probably be an environmental improvement, this depends on the dairy’s
response to alternatives and the consumers´ response to the dairy’s choice. The
dairy has the option to reduce the milk volume processed while maintaining the
same volume of products for sale as before. This offers the environmental
improvements described above. The other option is that the dairy could choose
to raise the volume of products for sale instead. For such a strategy to be
successful the consumers must increase their intake of cultured milk products,
which would mean lowering their intake of other food items. Comparing the
environmental impact of the other food items with that of the cultured milk
products would show whether the environment would become better or worse.
Although production scheduling is not a major issue in environmental work in
dairies today, the clear improvement potential this study shows may change this.
That the product frequency in the production schedule has an impact on waste is
common knowledge within the dairy industry, but that it was shown to be a
parameter of such large magnitude is something new. No study known has been
conducted with processing data to test the role of product frequency before.
34
Another advantage of working with production scheduling is that these
environmental improvements do not involve any equipment investments.
4.4 An Actor Analysis of the Environmental Improvement Potentials in
the Post-Farm Milk Chain Using Life Cycle Assessment
The challenge in working with environmental improvements is to select the
action offering the most substantial progress. However, not all actions are open
to all actors in a product chain. The aim of Paper V was to identify which one of
the measures, i.e. waste reduction, increased transport efficiency, energy savings
or the choice of organic labelled products, offers the greatest improvement
potential for the dairy, the retailer or the household. The products assessed
were milk, cheese, and yoghurt. The systems under study for the three products
were: agriculture, dairy processing, retailer, households and all connected
transports. By collecting data on possible improvements from the post-farm
actors themselves and from literature, and by using these data to recalculate
published LCAs on the selected dairy products, the aim was met.
The result is presented for the three actors individually. For the dairy, no action
stands out as superior to others. It can improve its energy use and transport
system, while also decreasing the wastage. The choice of purchasing organic
products was not considered to be within the power of the dairy. Of the three
product types, the greatest improvement potential is for yoghurt (2% reduction
of the life cycle impact), where all three actions lead to less global warming and
energy use, and decreased wastage also diminishes the eutrophication and
photochemical ozone creation potentials (POCP). For drinking milk dairies,
improving transportation is the most efficient action (reduction of 2%). For
cheesemaking dairies, actions that reduce wastage improve all impact categories
(by 1%), while greater energy efficiency is visible only as decreased use of
energy (by 1%), not as reductions of the other impact categories.
35
The improvement potentials in the retail sector have a limited effect on the life
cycle environmental impact of dairy products. The retailer can reduce its own
wastage and energy use. By adopting more energy efficient refrigerators, the
total life cycle energy use can be decreased by 1%. It is the actions of
households that offer the largest improvement potential. Waste minimisation by
the consumer would clearly lead to significant environmental improvement,
since all impact categories are reduced in this instance (in the range of 2% to
9%). Choosing organic products has a major positive effect on all three products
with regard to energy use (improvement potential in the range of 8 to 14%) and
global warming (2%). However, there is a risk of increasing some impact
categories. Choosing organic milk raises the eutrophication greatly, more than
20%. Also POCP shows a slight rise for cheese (1%). The reason for the high
contribution to eutrophication for organic milk products, a result also reported
by Cederberg and Mattsson (2000), is the high nitrate loss per kilo of milk
produced at an organic farm. This high nitrate loss has two explanations. First,
even though the nitrate loss per hectare is lower in organic farming than in
conventional farming, the yields are also lower, which means a higher nitrate
loss per kilogram yield. Second, the two farming practices differ in the choice of
concentrate feed. Peas, which have a rather high nitrate leakage in relation to
yield, are commonly used in the organic feed. The conventional farm purchases
concentrate feed with a lower nitrate discharge per kg feed (Cederberg and
Mattsson, 2000).
When the possible improvement potentials by the three actors are compared,
the household has by far the greatest improvement potential, followed by the
dairy and then the retail sector. This is because households are less efficient
today, causing large losses; they are still using inefficient home transport and
cold storage. The dairy industry can still make improvements but, since both the
processing and transport are efficient today, the potential for further efficiency
36
is lower in percentage. For example, the waste from the dairy processing of
drinking milk is often reused in the process for yoghurt production.
It should be kept in mind that even if each improvement might seem small in
relative numbers, the dominant part of the environmental impact originates
from a part of the system not directly affected by the actors studied, namely
agriculture. Despite this, some of the improvement actions studied, potentially
undertaken by actors other than agricultural ones, lead to a substantial decrease
in the life cycle environmental impact, for example a decrease of 14% was
achieved in the category energy use by choosing organic cheese.
4.5 Discussion
By comparing the milk supply chain scenarios in Paper I with the ongoing trends
in the food market and the dairy industry (Section 1.1), it is possible to gain an
understanding of the direction of the environmental impacts affected. The
scenario that correlates the most closely with the trend description in Section 1.1
is Splendid Times, based on a positive economic development of society.
Furthermore, the effect of globalisation is shown by production in a few large
specialised dairies. Other similarities are that cultured products and cheese in
small packages are preferred to drinking milk. In spite of the trend, the diversity
of products was not identified as an issue in itself in Paper I. Unfortunately, the
current scenario contributed the most to the environmental impact of the five
assessed; if product diversity had been included, it would have raised the impact
even higher (Paper IV).
To extend the assessment of the trends, the scale of milk processing, changed
consumption pattern, and diversity of products are more thoroughly discussed.
By using the scenarios in Paper I, it was possible to evaluate the differences in
environmental impact in relation to the scale of dairy production. Although the
number of dairies differed in the scenarios, the amount of milk processed was
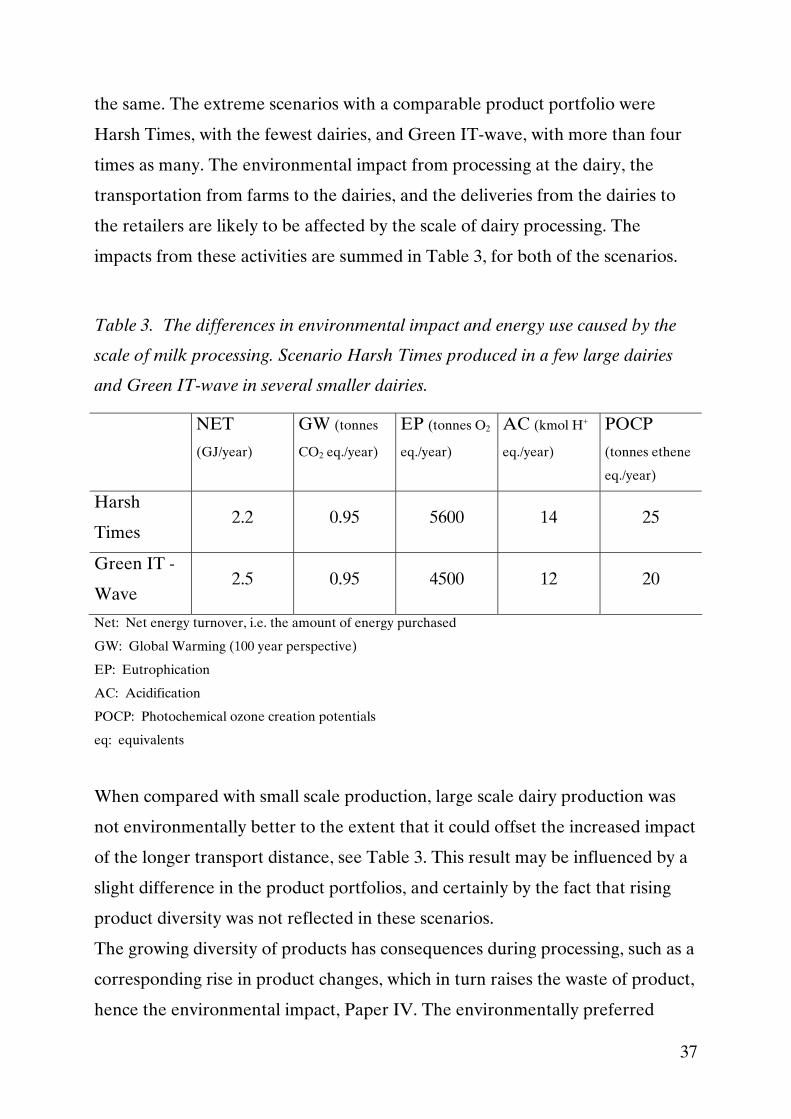
37
the same. The extreme scenarios with a comparable product portfolio were
Harsh Times, with the fewest dairies, and Green IT-wave, with more than four
times as many. The environmental impact from processing at the dairy, the
transportation from farms to the dairies, and the deliveries from the dairies to
the retailers are likely to be affected by the scale of dairy processing. The
impacts from these activities are summed in Table 3, for both of the scenarios.
Table 3. The differences in environmental impact and energy use caused by the
scale of milk processing. Scenario Harsh Times produced in a few large dairies
and Green IT-wave in several smaller dairies.
NET
(GJ/year)
GW (tonnes
CO2 eq./year)
EP (tonnes O2
eq./year)
AC (kmol H+
eq./year)
POCP
(tonnes ethene
eq./year)
Harsh
Times 2.2 0.95 5600 14 25
Green IT -
Wave 2.5 0.95 4500 12 20
Net: Net energy turnover, i.e. the amount of energy purchased
GW: Global Warming (100 year perspective)
EP: Eutrophication
AC: Acidification
POCP: Photochemical ozone creation potentials
eq: equivalents
When compared with small scale production, large scale dairy production was
not environmentally better to the extent that it could offset the increased impact
of the longer transport distance, see Table 3. This result may be influenced by a
slight difference in the product portfolios, and certainly by the fact that rising
product diversity was not reflected in these scenarios.
The growing diversity of products has consequences during processing, such as a
corresponding rise in product changes, which in turn raises the waste of product,
hence the environmental impact, Paper IV. The environmentally preferred
38
production has as few product changes as possible and when a change is
required the techniques using least resources should be used. During the work
with Papers III and IV, a difference between small dairy companies and large
ones of the effects of product diversity appeared. Small companies with high
product diversity produce only a small volume of each. This implies a large
amount of waste during production of a small volume. It showed that the
amount of waste depending on the product change was sometimes larger than
the amount of product obtained. However, in larger dairy units, where the
produced volume is higher, the proportion between waste and product was
more favourable. It was also found that for the large dairy units studied, the
product order was good and could not be improved in the sense of waste
minimisation. Moreover, we found both in large and small dairy units a great
potential for improvement by reducing the number of times each product was
produced, Paper IV. A high frequency of production of the same type of
product during the same week and also sometimes twice during the same day
was common. The latter was due to late orders from the sales department. This
lack of communication between production and sales management has
environmental and economic consequences. The highlighting of the importance
of production scheduling and the product frequency for the environmental
impact, with consequent economic saving potential, has received a very positive
response from the dairy industry.
An increased consumption of cheese and cultured products at the expense of
drinking milk may change the environmental impact of the dairy chain. In a
qualitative comparison of cheese and milk it was found that cheese is processed
more at the dairy and it is also stored for quite some time to mature, Paper II.
On the other hand, the proportion that should be compared is ten litres of milk
to one kg of cheese, as that is the amount of milk required to produce the
cheese. This has consequences for the packages, as also ten packages are
required for the milk and just one for the cheese, although the type of packaging
39
differs. All transportation after the dairy is also tenfold in volume for the milk.
Furthermore, the loss of drinking milk is higher in the household than the
cheese losses (Paper V). From the comparison of cheese and milk, no
straightforward answer can be given about a change in environmental impact.
However, a qualitative comparison of yoghurt and milk may be done. Yoghurt
is processed more at the dairy and the product diversity is higher, Paper IV.
Large product losses in the household are also a drawback for yoghurt, Paper V.
This comparison indicates that a change in consumption from milk to yoghurt
has negative consequences on the environment. Nevertheless, a comparative
LCA for cheese and milk and for yoghurt and milk are required to obtain
definite answers.
To conclude, the trends in society and industry have negative consequences for
the environmental impact of the dairy chain. First the scenario of Splendid
Times showed that the environmental impact is increasing with the ongoing
trends of today. Then the further assessment of some of the trends generated a
similar result. Large dairy units with long incoming and outgoing transports
have a higher impact than small dairy units. On the other hand, the great
increase in environmental impact caused by the rising variety of cultured
products was found to affect small dairy units the most. A negative
environmental impact would probably occur, if yoghurt were consumed instead
of milk. However, as an exception to a rule, the change in consumption from
milk to cheese is not likely to change the environmental impact.
Everything can be improved, including unwanted environmental effects.
Although within the dairy chain, agriculture is the actor which causes the largest
part of the environmental impact of dairy products, Paper V revealed that the
post-farm actors do have significant options to improve the environmental
impact. For some environmental categories, the improvement potential for an
individual actor was even greater than its own contribution to the category. For
40
example, when the dairy’s reduction of wastage in producing yoghurt was
assessed, a decrease of eutrophication by 2.4 times more than the dairy’s own
contribution was possible.
Another result revealed by this work is the identification of waste of product as
a major environmental issue in a life cycle perspective. For the actors in the
post-farm dairy chain, the waste of milk and product has not previously been
considered an environmental issue except from the perspective of waste
management. However, when the impacts of the common environmental
activities such as transport efficiency, energy savings and organic production
were compared with minimisation of product waste, the latter was as effective as
the other actions; for several environmental categories, it was shown to be the
preferred action (Paper V). Since the waste of product is a parameter that
affects not only the part of the life cycle where it arises, but also the earlier parts
of the chain, it is of significant importance to include the life cycle from the
cradle in an assessment. For milk products this implies that the system boundary
should include the agriculture and further steps in the life cycle before the
product waste occurs. This work deals with milk products, but product waste
minimisation is likely to be a major important environmental issue for all
products with a high environmental impact in the early part of the life cycle, e.g.
meat, aluminium packaging and paper products.
41
5 Methodological Contributions to Environmental Systems
Analysis
A problem solving approach was applied in this work. First, the problem was
identified, then available methodologies were explored. When a suitable
method was lacking, it was necessary to devise one. Two of the Papers, III and
V, contribute to methodology which is described below and followed by a
discussion.
5.1 A Life Cycle Based Method to Minimise Environmental Impact of
Dairy Production through Product Sequencing
The rising number of dairy products affects their environmental impact in a life
cycle perspective. During dairy processing, the production schedule is affected
by more frequent product changes, hence also cleaning operations. This causes
more milk waste, use of cleaning agents, water and energy, which all contribute
to the environmental impact in a life cycle context. To counteract this increasing
environmental impact, a method was developed to schedule a large number of
products in a way that would cause the least possible environmental impact.
During the search for a suitable method, only two studies were found that took
the environment into account during production scheduling: a theoretical study
of process-sequence dependent changeover waste, conducted by Grau et al.
(1995), and a methodology for incorporating ecological considerations into the
optimisation scheduling of a cheesemaking dairy (Stefanis et al., 1997). The
latter included a case-study of a cheesemaking dairy, but included only two
products. Consequently, to solve the problem of sequencing a great number of
products, a new method was required.
The goal of Paper III was to find a practical method to calculate a sequence of a
great number of cultured products, which is optimal or close to optimal, from a
42
waste minimisation perspective. Furthermore, to show the full environmental
implications of the waste minimisation, the sequencing model should be possible
to connect to life cycle assessment (LCA) methodology.
An inter-disciplinary approach was chosen for the method, making use of both
production scheduling and environmental systems analysis. To find the
sequence of products that is optimal from an environmental perspective, the
target function (also called optimisation criterion) must be carefully selected.
Studies of life cycle assessment literature gave us the function. Life cycle
assessments were made for several dairy products, see Section 2.1, and a
consistent finding was that agriculture had the greatest environmental impact.
Consequently, it was concluded, for the remaining parts of the life cycle of dairy
products (the dairy, retailer, consumer household, waste treatment and also all
connected transports), that the action which would offer the best outcome from
an environmental perspective was the minimisation of milk waste. For the
sequencing problem, minimisation of milk waste would also lead to a minimised
use of cleaning agents and water for cleaning during a product change in the
sequence, depending on the techniques used for product changes. Therefore, the
choice of target function fell on milk waste.
The preferred method would be to find an optimised solution through
mathematical optimisation. Nevertheless, this problem has similarities to the
“travelling-salesman-problem” (see Section 3.3.2), which means that to find the
optimal solution involves searching through a vast number of potential
solutions. In practice, this is possible for only a limited number of products
(Sedgewick, 1988). Hence, a heuristic method was developed, which was able to
handle a large number of products, see Section 3.3.1. A drawback to a heuristic
solution is that it cannot be guaranteed that it is also optimal (Hillier and
Lieberman, 1995). Therefore, it was decided to validate the result of the
heuristic method with a sequence achieved through optimisation, with as large a
number of products as could be handled with the optimisation method within a
43
reasonable time. By using techniques to limit the full searches during
optimisation (see Section 3.3.2), 21 products could be scheduled within a
reasonable time (30 minutes). The algorithm was still guaranteed to find the
weight minimised sequence (Sedgewick, 1988).
A sequence was simulated with both the heuristic and the optimised solutions
and then the results were compared. Several starting orders were tested, and the
results from both of the methods always gave the same sequence. Accordingly,
we can state that the heuristic method gives the optimal sequence from an
environmental perspective (that is a waste minimised solution) up to 21
products. This implies that the method used will also find optimal solutions for
all production sequences including fewer products, since all possible
combinations are tested in the algorithm. There is a strong reason to believe,
although it is difficult to prove mathematically, that the heuristic solution for a
sequence including more than 21 products will also be the optimal one, as there
is no known impediment in the sequence that relates to the number of products.
This production scheduling method gives the sequence, for a given set of
products, which causes a presumably minimum amount of milk waste and,
consequently, a low use of cleaning agents and water. Paper III also successfully
demonstrated that the full environmental consequences of production according
to the sequence could be assessed with LCA methodology.
5.2 An Actor Analysis of the Environmental Improvement Potentials in
the Post-Farm Milk Chain using Life Cycle Assessment
To reduce unwanted environmental consequences, a range of actions is
available. The problem is to know what measures offer the most substantial
improvement for each actor. A quantified assessment of the improvement
potential of the actors in the post-farm chain was not found in the literature.
Therefore, a method needed to be devised. The method of life cycle assessment
44
was chosen for the analysis, which was combined with the identification and
quantification of environmental improvement potentials available to the actors
along the post-farm milk chain.
First, ordinary LCAs were undertaken for the products under study (milk,
yoghurt and cheese) to find a reference for the environmental impact of each
product. Then, to select the kind of improvement action to examine, a literature
study was undertaken together with interviews of representatives from the dairy
industry. The most significant measures were found to be increased energy
efficiency, improved transport patterns, reduced product losses and purchase of
organic products. It was decided that neither product nor package changes were
to be considered. Literature study and interviews were used again, this time for
estimation of the improvement potential by each actor along the chain. Then,
the estimated values of the dairies were verified by their representatives.
Thereafter, the LCAs were recalculated using the improvement values for each
measure. To find the greatest potential, the environmental impact of the
modified LCAs and the original ones were compared for each product. To
identify the most efficient action for the dairy, the retailer and the household,
separately, the potential actions of each of them were analysed one at a time.
The method used in this study rests on the availability of reliable LCA data
from the production system, combined with accurate estimates of the
improvement potentials. Also necessary is the life cycle perspective to describe
the full effect of a potential improvement. This is particularly important for
measures dealing with waste reduction.
5.3 Discussion
The combination of environmental systems analysis with production scheduling,
as was used in Paper III, is a new approach to execute product sequencing for
the dairy industry. To choose an environmental systems analysis approach (i.e.
45
LCA) when searching for the environmental target function, used for the
sequencing, was found to be the best way of finding the parameter to minimise
for the most environmental improvement. For sequence solving, operational
analysis was used (a systems analysis methodology), which was then combined
with LCA for evaluation of the environmental impact of the nearly waste
minimised sequence. This approach of finding the production schedule that
contributes the least to the environmental impact, while still producing the same
amount of products, was appropriate for analysis of production with existing
process equipment.
Life cycle assessment studies are often interpreted with dominance and
contribution analyses, i.e. what life cycle phases and particular environmental
loads (emissions and resource consumptions) contribute the most to the over-all
results. In LCA there are seldom interpretations of the sphere of influence of
the various actors along the product chain. Paper V demonstrated the feasibility
of such an approach, by showing that the life cycle environmental implications
of improvement potentials may be quantified on an actor basis. Moreover, a life
cycle approach turned out to be crucial, since measures taken by an actor had
consequences in other parts of the product life cycle.
Both of the methods developed can be used on other product life cycles. The
production scheduling model can be used as it is for any dairy, producing
cultured products. Furthermore, the model can be applied to any batch
production sequence, although the processing rules must be changed to suit the
products under study. The actor analysis methodology suggested can be used as
it is for any life cycle.
46
6 Conclusions
Research for this thesis was guided by a two-fold aim: to increase the knowledge
of the environmental impact of the post-farm dairy chain, while assessing
potential improvement, and to contribute to development of methodology for
environmental systems analysis. This double aim was met in the five appended
papers together. The most important findings are listed.
• The future scenario closest to current trends, as well as the assessments of
production in large units, increased consumption of yoghurt, and the
rising number of cultured products, all highlight an increase in the
environmental impact of the dairy chain.
• The agriculture part is the most dominant contributor to the
environmental impact in the LCA of cheese; the most important
improvement in a life cycle perspective for the cheesemaking dairy is to
decrease its waste of milk and cheese.
• A method of constructing the environmentally preferred, life cycle based,
production sequence was developed for cultured dairy products. Using
the method will result in both environmental and economic savings for
the dairy.
• Reduction of the frequency of production of each cultured product lowers
the environmental impact.
• An actor analysis method was devised to help the actors to find the
measure that makes most substantial environmental improvement in a life
cycle perspective.
• Waste of product was revealed to be a key issue for environmental
consequences in a life cycle perspective, and reducing the waste offers a
substantial decrease in the impact.
47
7 Future Work
The research done in this thesis has provoked other interesting questions. As
waste of product turned out to be such an important environmental issue for the
dairy chain, although it had not previously been seen as one, I have several
suggestions about product waste. First, since the consumer has a large influence
on the environmental impact, which involves great losses of product, and data
about household losses is very poor, a thorough assessment of consumer
behaviour is needed. Second, more accurate information about losses of milk
and products at the other parts of the post-farm chain, such as the retailer and
dairy, is also needed. Third, an assessment of milk waste sources from the
milking in the phase of agriculture would be useful. Fourth, the scope can be
broadened to the whole food chain, and to cover the losses for Sweden. Almost
certainly, the environmental impact from the losses makes up a large part of the
total impact of the food sector.
This thesis has revealed that increasing the diversity of cultured dairy products
raises the environmental impact, both in a life cycle perspective and at the dairy
unit. This trend can be assumed to continue, by observing the dairy shelves at
German or British retailers, since Sweden still has fewer products; this is likely
to be an even more important issue in the future. The consequences would be
greatest for small dairy units, with rising losses of product leading to an increase
in environmental impact as well as economic losses. When considering small
dairy units compared with larger ones, the issue of the increasing diversity in
dairy products should be included. Therefore, a suggestion is to update and
improve the scenarios of Paper I with respect to the consequences of an
increasing number of dairy products.
A specific suggestion for improvement of the dairy process is to reduce the milk
waste in dairies by production scheduling, and to combine it with better
48
monitoring of the losses. Henningsson (2005) showed how to reduce losses by
increasing the control of them with an optical instrument, conductivity meter
and density meter. This would decrease the amount of waste during each
product change independently of changing techniques used. Combining the
waste minimised sequence with Henningsson’s monitoring methods would be
very interesting and has great potential indeed.
The final suggestion is to use the actor analysis method for other food chains.
I will conclude this thesis with a recommendation for environmental
improvement: Let us keep in mind that each food item has an environmental
history. If a food product is wasted instead of consumed, all of the
environmental impact that it has caused during its life cycle has happened for
nothing. So think about the environment, and eat up your food!
49
References
Axell, M. (2002). Vertical display cabinets in supermarkets –Energy efficiency
and the influence of air flows. Doctoral Thesis, Department of Building Services
Engineering, Chalmers University of Technology, Göteborg, Sweden.
Baumann, H., and Cowell, S. J. (1999). An evaluation framework for conceptual
and analytical approaches used in environmental management. Greener
Management International, Journal of Corporate Environmental Strategy and
Profile: 109-122.
Baumann, H., and Tillmann, A.-M. (2004). The Hitch Hiker´s Guide to LCA. An
orientation in life cycle assessment methodology and application.
Studentlitteratur, Lund, Sweden.
Bernhard, S., and Moos, T. (1998). Ökobilanz des Camemberts (Ecobalance of
Camembert, in German). Fachverein Arbeit und Umwelt, Zurich, Switzerland.
Bertelsen, E., Sven-Nilsson, E., and Willart, S. (1983). Från mjölk till
mejeriprodukter –Driftskontroll (From milk to dairy products: Operation
management, in Swedish). Livsmedelsbranschernas yrkesnämnd : Brevskolan,
Stockholm, Sweden.
Björklund, A., Bjuggren, C., Dalemo, M., and Sonesson, U. (2000). Planning
biodegradable waste handling in Stockholm, Journal of Industrial Ecology 3: 43-
58.
50
Blonk, H., Lafleur, M., and van Zeijts, H. (1997). Towards an environmental
information infrastucture for the Dutch food industry: Exploring the
environmental information conversion of five food commodities, Appendix 3:
Screening LCA on milk powder. IVAM Environmental Research & Centre for
Agriculture and Environment, Amsterdam, the Netherlands.
Carlsson-Kanyama, A. (1998). Climate change and dietry choices: How can
emissions of greenhouse gases from food consumption be reduced. Food Policy,
23(3-4): 277-293.
Carlsson-Kanyama, A., Pipping Ekström, M., and Shanahan, H. (2003). Food
and life cycle energy inputs: consequences of diet and ways to increase
efficiency. Ecological Economics 44: 293-307.
Cederberg, C. (1998). Life Cycle Assessment of Milk Production: A Comparison
of Conventional and Organic Farming. SIK Report 1998 No 643, SIK: The
Swedish Institute for Food and Biotechnology, Göteborg, Sweden.
Cederberg, C. (1999). Flows of plant nutrients in food production and
consumption in a Swedish district. Ambio 28: 502-508.
Cederberg, C., and Bergström, S. (1999). Näringsflöden och markanvändning i
ekologisk och konventionell mjölkproduktion i sydsverige (The flow of nutrients
and land use in ecological and conventional milk production in the south of
Sweden, in Swedish). Hushållningssällskapet i Halland, Halmstad, Sweden.
Cederberg, C. and Mattsson, B. (2000). Life cycle assessment of milk
production; A comparison of conventional and organic farming. Journal of
Cleaner Production 8: 49-60.
51
Cederberg, C. (2002). Life Cycle Assessment (LCA) of Animal Production.
Doctoral Thesis, Department of Applied Environmnetal Science, Göteborg
University, Göteborg, Sweden.
de Boer, I. J. M. (2003). Environmental impact assessment of conventional and
organic milk production. Livestock Production Science 80: 69-77.
Finnveden, G., and Moberg, Å. (2005). Environmental systems analysis tools:
An overview. Journal of Cleaner Production 13: 1165-1173.
Grau, R., Espuna, A., and Puigjaner, L. (1995). Environmental Considerations
in Batch Production Scheduling. Computers and Chemical Engineering 19
Suppl.: 651-56.
Grøtan, M. (1996). Livsløpsanalyse ved produksjon av kulturmelk (Life cycle
assessment of production of cultured milk, in Norwegian). Norges
Landbrukshøgskole, Institutt for Næringsmiddelfag, Ås, Norway.
Gustafsson, L., Lanshammar, H., and Sandblad, B. (1982). System och Modell -
En introduktion till systemanalysen (System and Model: An introduction to
Systems Analysis, in Swedish). Studentlitteratur, Lund, Sweden.
Haas, G., Wetterich, F., and Köpke, U. (2001). Comparing intensive, extensive
and organic grassland farming in southern Germany by process life cycle
assessment. Agriculture, Ecosystems and Environment 83: 43-53.
Henningsson, M. (2005). Loss Minimisation in Dynamic Food Processes,
Doctoral Thesis, Division of Food Engineering, Department of Food
Technology, Engineering and Nutrition, Lund Institute of Technology, Lund
University, Lund, Sweden.
52
Hillier, F. and Lieberman, G. (1995). Introduction to Operations Research.
McGraw-Hill Book Co, Singapore.
Hospido, A., Moreira, M. T., and Feijoo, G. (2003). Simplified life cycle
assessment of galician milk production. International Dairy Journal 13: 783-796.
Hospido, A., and Sonesson, U. (2005). The environmental impact of mastitis: A
case study of dairy herds, Science of the Total Environment 343(1-3): 71-82.
Høgaas Eide, M., and Ohlsson, T. (1998). A Comparison of Two Different
Approaches to Inventory Analysis of Dairies. International Journal of LCA 3(4)
209-215.
Høgaas Eide, M. (2002a). Life Cycle Assessment (LCA) of Industrial Milk
Production. Doctoral Thesis, Department of Food Science, Chalmers University
of Technology, Göteborg, Sweden.
Høgaas Eide, M. (2002b). Life Cycle Assessment (LCA) of Industrial Milk
Production. International Journal of LCA 7(2): 115-126.
Høgaas Eide, M., Holmleid, J. P., and Mattsson, B. (2003). Life Cycle
Assessment (LCA) of Cleaning-in Place Processes in Dairies. Lebensmittel
Wissenschaft und Technologie 36: 303-314.
Iepema, G., and Pijnenburg, J. (2001). Conventional versus Organic Dairy
Farming. A Comparison of Three Experimental Farms on Environmental
Impact, Animal Health and Animal Welfare. MSc Thesis, Animal Production
Systems Group, Wageningen University, Wageningen, The Netherlands.
53
Innovaction BV. (2003). In: CIAA Confederation of the food and drink
industries of the EU. Data and trends of the EU food and drink industry. CIAA
Confederation of the food and drink industries of the EU, Brussels, Belgium.
ISO. (1997). Environmental Management: Life Cycle Assessment: Principle and
Framework, EN ISO 14040:1997, International Organization for
Standardization, Geneva, Switzerland.
ISO. (1998). Environmental Management: Life Cycle Assessment: Goal and
Scope Definition and Inventory Analysis, EN ISO 14041:1998, International
Organization for Standardization, Geneva, Switzerland.
ISO. (2000a). Environmental Management: Life Cycle Assessment: Life Cycle
Impact Assessment, EN ISO 14042:2000, International Organization for
Standardization, Geneva, Switzerland.
ISO. (2000b). Environmental Management: Life Cycle Assessment: Life Cycle
Interpretation, EN ISO 14043:2000, International Organization for
Standardization, Geneva, Switzerland.
Johansson, B. (2002). Förpackningens betydelse för produktförluster i hemmet.
Spill uppmätt med hjälp av testgrupp. (The influence of the package for product
losses in the household. Losses measured by a test panel, in Swedish),
Packforsk, Stockholm, Sweden.
Johansson, R. (2001). Personal communication. Arla Foods Ost AB
Falkenbergsmejeriet. SE-311 44 Falkenberg, Sweden.
Jungbluth, N., Tietje, O., and Scholz, R. (2000). Food Purchases: Impacts from
the Consumers´ Point of View Investigated with a Modular LCA, International
Journal of LCA 5(3): 134-142.
54
Karlsson, M., Rohdin, P., Karlsson, F., and Moshfegh, B. (2004).
Energikonsekvenser av strukturerat energieffektivitetstänkande för Arla Foods
(EKSET) (Energy consequences by a structured energy efficiency thinking for
Arla Foods, in Swedish), Department of Energy Systems, Linköping University
of Technology, Linköping, Sweden.
Lindgren, U., and Elmquist, H. (2005). Environmental and economic impacts of
decision-making at an arable farm: An integrative modelling approach. Ambio
34 (4-5): 393-401.
Lorentzon, K., Olsson, P., Reimers, V., and Stadig, M. (1997). Uthållig
livsmedelsproduktion - En energi- och miljöstudie med inriktning mot kyl-, frys-
och helkonservbehandling (Sustainable food production: A study of energy
requirements and environmental consequences by the treatment of
refrigeration, freezing and preservation, in Swedish), SIK: The Swedish Institute
for Food and Biotechnology, Göteborg, Sweden.
Masoni, P., Sára, B., Scartozzi, D., Tarantini, M., and Raggi, A. (1998). A Life
Cycle Assessment Pilot Study in an Italian Dairy Company. Paper presented at:
3rd Int. Conf. on Ecobalace, Tsukuba, Japan.
Nilsson, B., and Lorentzon, K. (1999). Energi- och miljöpåverkan inom mejerier
(The Energy requirements and their related Environmental Impact from Milk
Producing Dairies, in Swedish). SIK: The Swedish Institute for Food and
Biotechnology, Göteborg, Sweden.
55
Pesonen, H.-L., Ekvall, T., Fleisher, G., Huppes, G., Jahn, C., Klos, Z. S.,
Rebitzer, G., Sonnemann, G. W., Tintinelli, A., Weidema, B. P., and Wenzel, H.
(2000). Framework for scenario development in LCA, International Journal of
LCA 5(1): 21–30.
Sedgewick, R. (1988). Algorithms. 2nd edition. Addison-Wesley Publishing
Company. Reading, Massachusetts, USA.
SEPA. (1997a). Fosfor: livsnödvändigt, ändligt och ett miljöproblem
(Phosphorus: Essential, Limited and an Environmental Problem, in Swedish).
Report 4730, Swedish Environmental Protection Agency, Stockholm, Sweden.
SEPA. (1997b). Kväve från land till hav: huvudrapport (Nitrogen from Land to
Sea: Main report, in Swedish). Report 4735. Swedish Environmental Protection
Agency, Stockholm, Sweden.
SEPA. (1997c). Kväveläckage från svensk åkermark : beräkningar av
normalutlakning och möjliga åtgärder : underlagsrapport (Nitrogen Leakage
from Swedish Agricultural Land., in Swedish). Report 4741. Swedish
Environmental Protection Agency, Stockholm, Sweden.
SEPA. (1999). Svensk produktion med miljön i fokus (Swedish production
focused on the environment, in Swedish). Swedish Environmental Protection
Agency, Stockholm, Sweden.
SEPA. (2004). Sweden´s National Inventory Report 2004: Submitted under the
United Nations Framework Convention on Climate Change. Swedish
Environmental Protection Agency, Stockholm, Sweden.
56
Sonesson, U., Dalemo, M., Mingarini, K., and Jönsson, H. (1997). ORWARE: A
simulation model for organic waste handling systems. Part 2: Case study and
simulation results. Resources, Conservation and Recycling 21: 39-54.
Sonesson, U., Janestad, H., and Raaholt, B. (2003). Energy for Preparation and
Storing of Food. SIK Report 2003 No 709. SIK: The Swedish Institute for Food
and Biotechnology, Göteborg, Sweden.
Sonesson, U. Antesson, F., Davis, J., and Sjödén, P.-O. (2005), Home
Transports and Wastage: Environmentally Relevant Household Activities in the
Life Cycle of Food. Ambio 34 (4-5): 371-375.
Stefanis, S. K., Livingston, A. G., and Pistikopoulos, E. N. (1997).
Environmental impact considerations in the optimal design and scheduling of
batch processes. Computers and Chemical Engineering 21(10): 1073-94.
Swedish Board of Agriculture. (2004a). Marknadsöversikt – animalier, Rapport
2003:24, (A review of the market: The yield of meat and dairy products, in
Swedish) Jönköping, Sweden.
Swedish Board of Agriculture. (2004b). Konsumtion av livsmedel och dess
näringsinnehåll –Uppgifter t.o.m. år 2002, Rapport 2004:7 (The consumption and
nutrient contentof food, in Swedish) Jönköping, Sweden.
Swedish Dairy Association. (2000). Vision 2010 Mjölk (Vision 2010 Milk, in
Swedish) Swedish Dairy Association, Stockholm, Sweden.
Swedish Energy Agency. (2004). Energy in Sweden: Facts and Figures 2004.
Swedish Energy Agency, Eskilstuna, Sweden.
57
Udo de Haes, E., van der Voet, E., and Kleijn, R. (1997). Substance flow
analysis (SFA): An analytical tool for integrated chain management: In: From
Paradigm to Practice of Sustainability, pp. 32-42. Paper presented at:
ConAccount workshop, 21-23 January 1997, Leiden, the Netherlands.
Uhlin, H.-E. (1997). Energiflöden i livsmedelskedjan (The energy flow of the
food chain, in Swedish), Vol. 4732, Swedish Environmental Protection Agency,
Stockholm, Sweden.
van der Voet, E., Kleijn, R., van Oers, L., Heijungs, R., Huele, R., and Mulder,
P. (1995). Substance flows through the economy and environment of a region –
Part 1: Systems definition. Environmental Science and Pollution Research 2: 89-
96.
Weidema, B. P., Ekvall, T., Pesonen, H.-L., Rebitzer, G., Sonnemann, G.W.,
and Speilmann M. (2004). Scenarios in life-cycle assessment. Society of
Environmental Toxicology and Chemistry (SETAC), Pensacola, FL, USA.
Wrisberg, N., Udo de Haes, H. A., Triebswetter, U., Eder, P., and Clift, R.
(2002). Analytical tools for environmental design and management in a system
perspective. Kluwer Academic Publishers, Dordrecht, the Netherlands.