Embed Size (px)
Citation preview

Chapter IV
Influence of the nature of media on leaching of CCA
constituents
4.1 Introduction
Preservative treatment is given to wood in order to obtain protection
from the enviromnent in which wood is exposed. Even when there is no attack
from the natural destroying organisms like insects or fungi, deterioration can
occur due to weathering in the natural enviromnent. These forces can act by
increasing the leaching of the preservative in which the wood is treated.
Otherwise, the nature of the media in which the preservative treated wood is
exposed can influence leaching of CCA. The nature of media is influenced by
various factors. These factors include the pH, salinity, water temperature and
movement of water around the exposed specimen. This study deals with the
most important factors, pH and salinity.
4.1.1 Influence of pH
pH of the medium in which the preservative treated wood is exposed is
an important factor which determines the rate of leaching. In normal conditions
pH of the water bodies will be in the range of 6.5 to 8. In certain circumstances
there can be a reduction or increment in the pH that may influence the rate of
62

leaching. This could be because of the formation of complexes. Van Eetvelde
et.al., 1995 observed maximum leaching of chromium and arsenic under
neutral conditions. At the same time, initial losses of copper increased with
decrease in pH. The increase of leaching on increase of acidity is said to be due
the additional hydrogen ions acting in the acid-ion exchange reactions on wood
cell walls. Dahlgren (1975) examined the_ relative leaching of copper as a
function of pH and found that leaching rates exceeding 9% at pH 4.0 were
reduced to very low values (<0.5%) at pH 6.8. Cooper (1990, 1991) also
examined pH effects on the leaching of CCA treated wood. He cautions that
when treated wood is exposed to acidified water, maintained at a low pH, the
CCA losses are increased compared to neutral water.
4.1.2 Influence of salinity
Preservative treated wood is being utilized for construction purposes
especially in the aquatic medium. The salinity of the water in which
preservative treated wood is exposed can be a factor determining the leaching
of the preservative components. Scots pine and beach sap wood blocks treated
with CCA were exposed in cooling towers receiving water from fresh water,
sewage effluent and marine sources with results indicating increased loss of
copper and chromium with increasing conductivity of the surrounding waters
(Irvine et al., 1972). Solutions of higher ionic strength have been shown to
leach higher concentrations of CCA, even when no increase in copper loss was
observed in the salinity range from 0 to 24 ppt. Certain preservative
63

components may leach out easily in the presence of some salt contents in the
saline water because of the possibility of complex formation. Pine sapwood
treated with CCA and leached in salt solutions of varying strength resulted in
increased copper leaching compared to de-ionized control water and leaching
rates increased with salt solution concentration (Placket, 1984).
The present study aims at estimating the influence of acidic, neutral,
alkaline conditions and salinity of the aquatic medium on leaching of CCA
components from treated rubber wood.
4.2 Materials and methods
Rubber wood panels (Type 1), treated to 16 and 42 kg m'3 retentions
were selected for this experiment. This is because they cover both the
minimum and maximum retentions of CCA treatment recommended for fresh
water and saline water conditions. The selected pH includes 2.5, 4.5, 7 and 8.5.
The solutions required for leaching experiment was prepared using de-ionized
water. The water was acidified using hydrochloric acid. Alkaline solution was
prepared using ammonium hydroxide. The panels were immersed in 2750 ml
water having the above mentioned pH and the beakers were placed on the
magnetic stirrer. The stirring speed was standardized to 25-50 cm s'1. The
leachates were collected and the whole solution is replaced at 6, 24, 48, 96,
144, 192, 240, 288 and 336 h. The samples were then analyzed in ICP AES and
the results of each sampling were recorded.
64
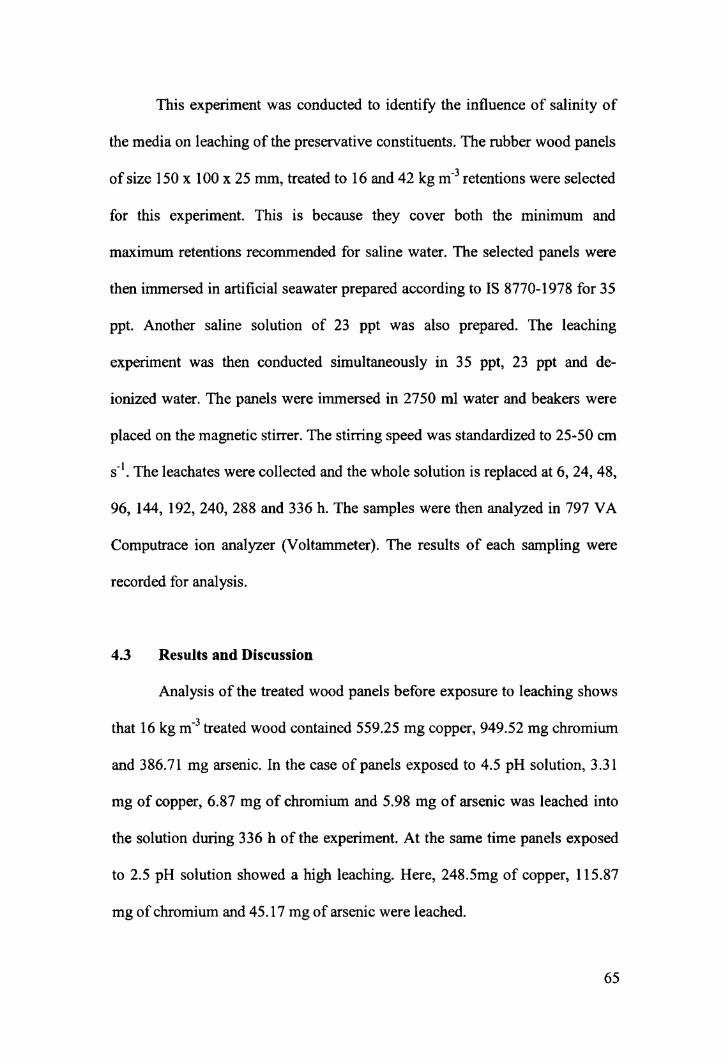
This experiment was conducted to identify the influence of salinity of
the media on leaching of the preservative constituents. The rubber wood panels
of size 150 x 100 x 25 mm, treated to 16 and 42 kg m'3 retentions were selected
for this experiment. This is because they cover both the minimum and
maximum retentions recommended for saline water. The selected panels were
then immersed in artificial seawater prepared according to IS 8770-1978 for 35
ppt. Another saline solution of 23 ppt was also prepared. The leaching
experiment was then conducted simultaneously in 35 ppt, 23 ppt and de
ionized water. The panels were irrnnersed in 2750 ml water and beakers were
placed on the magnetic stirrer. The stirring speed was standardized to 25-50 cm
s". The leachates were collected and the whole solution is replaced at 6, 24, 48,
96, 144, 192, 240, 288 and 336 h. The samples were then analyzed in 797 VA
Computrace ion analyzer (Voltammeter). The results of each sampling were
recorded for analysis.
4.3 Results and Discussion
Analysis of the treated wood panels before exposure to leaching shows
that 16 kg m'3 treated wood contained 559.25 mg copper, 949.52 mg chromium
and 386.71 mg arsenic. In the case of panels exposed to 4.5 pH solution, 3.31
mg of copper, 6.87 mg of chromium and 5.98 mg of arsenic was leached into
the solution during 336 h of the experiment. At the same time panels exposed
to 2.5 pH solution showed a high leaching. Here, 248.5mg of copper, 115.87
mg of chromium and 45.17 mg of arsenic were leached.
65

The analysis of the panel having 42 kgm'3 initial retention showed that
it contained 1287 mg copper, 2567.4 mg chromium and 991.65 mg arsenic.
These panels when exposed to 4.5 pH solution for 336 h, 7.99 mg of copper,
10.23 mg of chromium and 5.86 mg of arsenic were leached. Similarly, when
these panels were exposed to a solution having 2.5 pH, 243.28 mg of copper,
111.12 mg of chromium and 33.54 mg of arsenic were found leached.
Another set of panels exposed in the neutral and alkaline pH also
initially contained the same quantity of copper, chromium and arsenic. The
panels having 16 kg m'3 retention, when exposed to a solution having pH 7, 3.1
mg of copper, 5.25 mg of chromium and 4.1 mg of arsenic were leached.
Another such panel when exposed to a solution of pH 8.5, the quantity of
preservative components leached out slightly reduced to 2.11 mg of copper,
4.54 mg of chromium and 3.57 mg of arsenic. 42 kg m'3 retention panel when
exposed to solution of pH 7, 14.55 mg of copper, 20.96 mg of chromium and
8.28 mg of arsenic were leached. Similarly another set of panels when exposed
to solution of pH 8.5, 7.04 mg of copper, 15.35 mg of chromium and 4.99 mg
of arsenic were leached. The results are shown in graph (Fig. 4.1.1- 4.1.6).
Experiments were conducted to investigate the effect of addition of
humic acids to artificial seawater. The addition of humid acid was reported to
cause increase in the loss of copper and arsenic. This may be explained by the
relative tendency of copper to bind to a range of organic matters (Beacher et
al., 1983; Fleming & Trevos, 1989; Livens, 1991). In the absence of humic
acids, leaching was dominated by chromium. The citric acid buffer system used
66

by Warner and Solomon (1990) caused excessive metal losses not solely
associated with low pH. Cooper (1990) acknowledges that it is possible for
some naturally occurring complex organic acids to accelerate leaching of CCA
components, by an undetermined amount, at pH values < 4.5. The previous
experiments in this regard suggest that more copper and chromium will be
leached from CCA treated wood at low pH. In this study also copper is found
to leach in much higher quantities than chromium and arsenic at high acidic pH
where as chromium is found to leach more in all other pH conditions. Arsenic
leaching does not appear to be as sensitive to pH. The data suggest that normal
pH values (>4.5) expected in open aquatic environments do not influence
leaching rates. The literature clearly demonstrates increased copper losses from
CCA treated wood at very low pH values (<4.5). This study also proved the
same conclusion.
In the case of 16 kg m'3 panels exposed to 34 ppt solution, 2.84 ppm of
copper, 1.39 ppm of chromium and 0.007 ppm of arsenic were leached into the
solution during 336 h of the experiment. At the same time panels exposed to 23
ppt solution showed a high leaching. Here, 3.72 ppm of copper, 1.28 ppm of
chromium and 0.007 ppm of arsenic were leached.
Analysis of the leachate solution of 42 kg m'3 treated panels when
exposed to 34 ppt solution for 336 h showed 1.38 ppm of copper and 1.49 ppm
of chromium. Arsenic was not present in detectable quantities. Similarly, when
these panels were exposed to a solution having 23 ppt, 1.86 ppm of copper and
67

1.55 ppm of chromium were detected. Here also, arsenic was not found in
detectable quantities.
The results of the studies conducted by Lebow et al., 2000, comparing
leaching in de-ionized water and seawater are worth noting. In comparison to
copper, chromium release rates were much lower and relatively insensitive to
the seawater concentration of the leaching solutions. Arsenic release tended to
be greater in the de-ionized water than seawater solution. Unlike chromium, the
greater release in de-ionized water did not appear to decrease over time. The
effect of salinity on the rate of copper release changed with time. For the first
month the rate of release of copper in de-ionized water was greater than or
equal to that in seawater whereas in the remaining months copper release in the
seawater was significantly greater than the release in de-ionized water and
when leaching rates stabilized after 10 to 15 months, the rate of copper release
in seawater was 8 to 25 times greater than that in de-ionized water.
0 Irvine et al7/ (1972) examined the retention of CCA in small wood
blocks exposed to seawater from cooling towers. They found that metals
leached more readily in cooling tower water than in conventional laboratory
leach tests. Irvine and Dahlgren (1976) investigated the effects of salts on the
leaching of CCA components and developed a theoretical mechanism to
explain the increased leaching rates of CCA components exposed to marine
enviromnents. They concluded that at low salinity, sodium chloride has a
coagulating effect on the copper, reducing its rate of leaching. At higher
salinity, complexation of copper and chromium with chlorine and sodium ions
68

results in increased leaching of these metals. At high CCA retentions, loss of
arsenic is shown to lag behind that of chromium and copper due to
complexation of the liberated copper and chromium ions. At lower retentions
(<1.8 lbs/cf.) this trend is reversed and arsenic is more easily leached than
copper. The most complete analysis of salinity effects was found in study
conducted by Irvine and Dahlgren (1976). In the lower tenn (20 weeks in test),
they report relatively low levels of copper loss at salinities less than 10 ppt.
There is a significant increase to approximately twice this loss at 22 ppt. Above
22 ppt, losses increase slightly as salinity increases to 35 ppt. Most of the
leaching data for CCA has been developed in salt water (30 ppt). Irvine and
Dahlgren (1976) did not find significant differences in loss rates at salinities
between 0.0 and 25 ppt after 40 weeks of leaching. However, they observed an
increase of approximately 50% in copper losses at salinities greater than 25 ppt
in the long term (40 weeks).
4.4 Conclusion
pH is found to have much influence on leaching. Similar quantities of
copper, chromium and arsenic were found to leach from both 16 and 42 kg m'3
panels exposed to a highly acidic pH of 2.5. Therefore the percentage leaching
is more from 16 kg m‘3. This shows that, retention has got no influence on
leaching in highly acidic conditions. At the same time leaching reduced to
around 1% at a pH of 4.5. Also retention was found to influence leaching in
69
neutral and alkaline pH. Lowest leaching was found at pH 8.5 in the case of 16
kg m'3 retention and at pH 4.5 in the case of 42 kg m'3 .
Leaching of copper is more prominent than chromium and arsenic in
saline media. Arsenic leaching is found to reduce considerably in saline water.
Also rubber wood treated to lower retentions is found to leach more than higher
retentions in saline water. Higher retentions of preservative treatment are found
more suitable in higher salinities.
7(

Fig. 4.1: Rate of leaching of copper on varying retention at acidic pH
centrat'on nCon
16
Pom
3 3
"' 10
ON)-§O>@
—
-1
1
-1
—P
~
I 15 kg/m3 pH 4.5
n 15 kglm3 pH 2.5
ca 42 kglm3 pH 4.5
cl 42 kg/m3 pH 2.5
I II I l | | 6 24 48 96 144 192 240 288
Duration in hours336
Fig. 4.2: Rate of leaching of chromium on varying retention at acidic pH
PPmConcentration n
16
14
12
10
ON)-l>O5®
-+1
_a
6 24 48 96Duration in hours "
I 16 kg/m3 pH 4.5
I 16 kglm3 pH 2.5
D 42 kg/rn3 pH 4.5
Cl 42 kg/m3 pH 2.5
144 192 240 288 336

Fig. 4.3: Rate of leaching of arsenic on varying retention at acidic pH
Concentrat on n ppm
6
41210
8
6
Ql\)<l->
_
-1
I 16 kg/m3 pH 4.5
I 16 kg/m3 pH 2.5
CI 42 kg/rn3 pH 4.5
D 42 kg/m3 pH 2.5
6 24 48 33696 144 192 240 288Duration in hours
Fig. 4.4: Rate of leaching of copper on varying retention at neutral and
alkaline pH
PPmConcentrafon n
1.4
1.2
1
0.8
0.6
0.4
0.2
O
I 16 kg/rn3 pH 7
I 16 kg/m3 pH 8.5
El 42 kg/m3 pH 7_ D 42 kg/m3 pH 8.5_.
_..
6 24 48 96 144 192 240 288 336Duration in hours

Fig. 4.5: Rate of leaching of chromium on varying retention at neutral and
alkaline pH
PPmConcentration n
1412
1
O8
0.
O4
02O
6
—»
-+
_
-1
_.
6 24 48 96
I 16 kg/rn3 pH 7
I 16 kglm3 pH 8.5
CI 42 kglm3 pH 7
D 42 kg/m3 pH 8.5
Duration in hours144 192 240 288 336
Fig. 4.6: Rate of leaching of arsenic on varying retention at neutral and
alkaline pH
n ppmConcentration
1.4
9.0.9.0 .-‘r\>.r>c>oo-1-to
0
:16 kg/m3 pH 7
I 16kg/m3 pH8.5
cl 42 kg/rn3 pH7_ cl 42 kg/m3 pH 8.5-w
-<
‘
—P
6 24 48 96 1 44 192 240 288Duration in hours
336
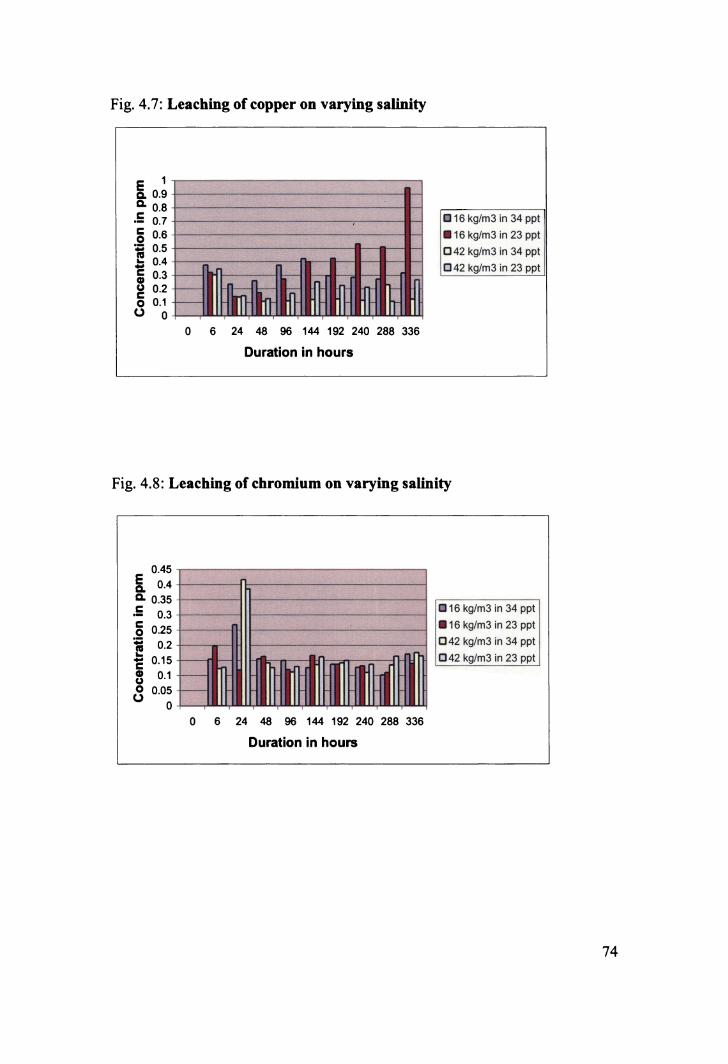
Fig. 4.7: Leaching of copper on varying salinity
n ppmConcentrafonP99999999o-row-n-u1a>~:oocoI I I I I I ll ll
0 6 24 48 96 144 192 240 288 336Duration in hours
I 16 kg/m3 in 34 pptI 16 kg/m3 in 23 pptD42 kglm3 in 34 pptO42 kg/m3 in 23 ppt
Fig. 4.8: Leaching of chromium on varying salinity
PPT"Cocentrat on n
0.45 0.4 —
0.35 0.3
0.25 0.2 ~
0.15 0.1
0.05 0 -. . . I 1 . . . . .0 6 24 48 96 144 192 240 288 336
Duration in hours
I 16 kglm3 in 34 pptI 16 kg/m3 in 23 pptO42 kg/m3 in 34 ppt
D42 kg/m3 in 23 ppt

Fig. 4.9: Leaching of arsenic on varying salinity
n nppmConcentrat o
0
OOO
.035
0.03
.025
0.02
'0-5U1
0.01
.005
0
0 6 24 48 96 144192 240 288 336Duration in hours
I16 kg/m3 in 34 pptI16 kg/m3 in 23 pptD42 kglm3 in 34 ppt
D42 kg/m3 in 23 ppt


![Untitled-2 [biotichealthcare.com] · beta carotene 20%, zinc oxide usp lr grade) 7.5 mg, lycopene powder 10 mg lutein powder 7mg, manganese (ii)sulphate bp img, copper sulphate lr](https://img.pdfslide.us/doc/110x75/5e353e8852042f742f7a0c24/untitled-2-beta-carotene-20-zinc-oxide-usp-lr-grade-75-mg-lycopene-powder.jpg)