Embed Size (px)
Citation preview

EEENNNVVVIIIRRROOONNNMMMEENNTTAALL IIMMPPAAACCCTTT SSSTTTAAATTTEEEMMMEEENNNTTT
APPENDIX O - WATER INFRASTRUCTURE ASSESSMENT
Addendum: This EIS was initially prepared assuming that the safe harbour was to be part of the LindemanGreat Barrier Reef Resort Project. With the commencement of the Great Barrier Reef Marine Park Authority’s(GBRMPA) Dredging Coral Reef Habitat Policy (2016), further impacts on Great Barrier Reef coral reef habitatsfrom yet more bleaching, and the recent impacts from Tropical Cyclone Debbie, the proponent no longer seeks assessment and approval to construct a safe harbour at Lindeman Island. Instead the proponent seeksassessment and approval for upgrades to the existing jetty and additional moorings in sheltered locationsaround the island to enable the resort’s marine craft to obtain safe shelter under a range of wind and waveconditions. Accordingly, remaining references to, and images of, a safe harbour on various figures and mapsin the EIS are no longer current.

Lindeman Great Barrier Reef Resort
Prepared for White Horse Australia Lindeman Pty Ltd Page 1 01/03/2016
Water Infrastructure Assessment - Supporting Information
Lindeman Great Barrier Reef Resort
Prepared for
White Horse Australia Lindeman Pty Ltd
13 February 2017

Prepared for White Horse Australia Lindeman Pty Ltd Version 5 August 2016 Lindeman SMP and Water Balance v2.docx Commercial in Confidence Page 1
Water Infrastructure Assessment -Supporting Information
APPENDIX A MEDLI Modelling Output Reports

Scenario: Lindeman Island Resort Control Scenario.med General Informa onG
ENER
AL IN
FORM
ATIO
N -
FULL
RU
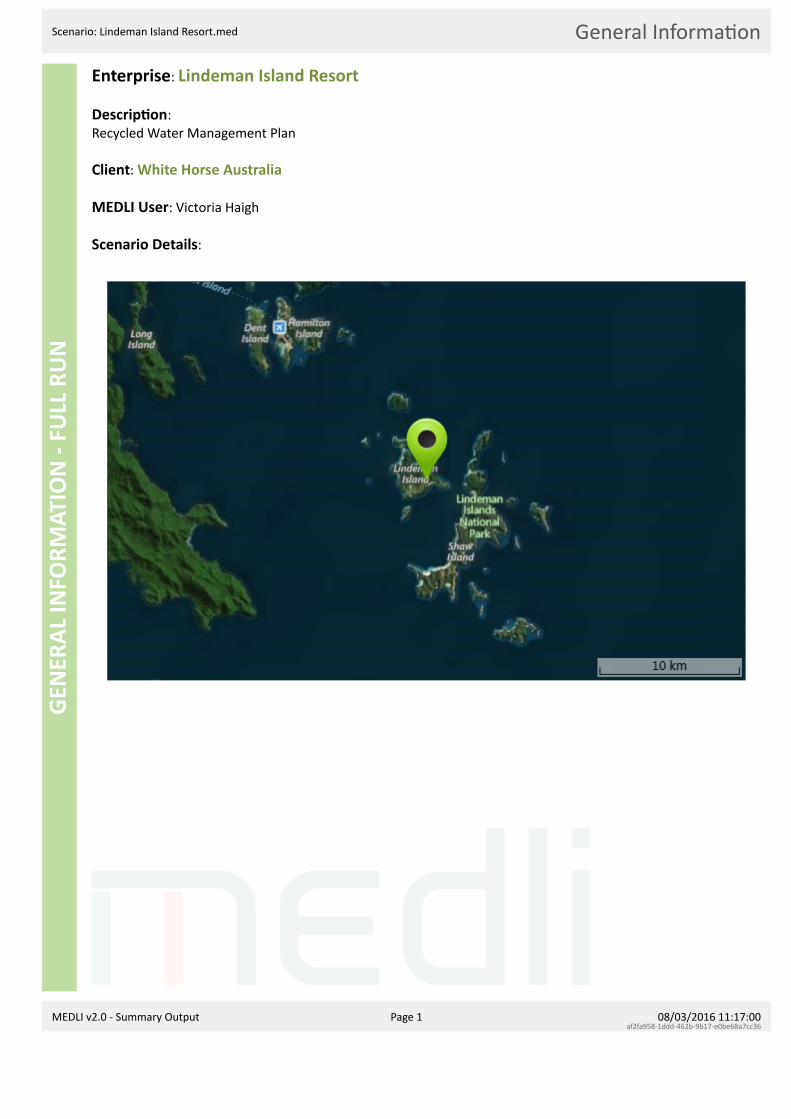
NEnterprise: Lindeman Island Resort
Descrip on:Recycled Water Management Plan
Client: White Horse Australia
MEDLI User: Victoria Haigh
Scenario Details:Control Scenario No Irriga on
MEDLI v2.0 - Summary Output Page 1 08/03/2016 11:16:00af2fa958-1ddd-462b-9b17-e0be68a7cc36

Scenario: Lindeman Island Resort Control Scenario.med Climate & Run PeriodDE
SCRI
PTIO
NClimate Data: Lindeman, -20.45°, 149.05°
Run Period: 01/01/1965 to 31/12/2014 50 years, 0 days
Climate Sta s cs:
5th Percentile 50th Percentile 95th Percentile
Rainfall (mm/year) 915 1568 2440Pan Evaporation (mm/year) 1723 1892 2100
Climate Data: TableChart
DailyMonthly
RainPanMax TempMin TempRadNet Evap
Daily Average Across Run Period
Jan
Feb
Mar
Apr
May
Jun
Jul
Aug Se
p
Oct
Nov Dec
Jan
Feb
Mar 0
5
10
15
20Total: 1596.42mm
Total: 1899.39mm
MEDLI v2.0 - Summary Output Page 2 08/03/2016 11:16:00af2fa958-1ddd-462b-9b17-e0be68a7cc36

Scenario: Lindeman Island Resort Control Scenario.med WastestreamDE
SCRI
PTIO
NE uent type: New Sewage Treatment Plant
Wastestream before any recycling or pretreatment
Average daily quan ty and ow-weighted average quality: TableChart
EffluentTNTPTDSVSTS
Jan
Feb
Mar
Apr
May
Jun
Jul
Aug Se
p
Oct
Nov Dec
360
380
400
420
440
460
Efflu
ent (
m3/
day)
0
100
200
300
400
500
600
700
800
900
1000
Conc
entr
atio
n (m
g/L)
Wastestream a er any recycling and pretreatment if applicable
E uent quan ty: 134631.74 m3/year or 368.61 m3/day (Min-Max: 339.94 - 2437.93)
Flow-weighted average (minimum - maximum) daily e uent quality entering pond system:Concentration (mg/L) Load (kg/year)
Total Nitrogen 4.61 (0.70 - 5.00) 620.80 (620.39 - 622.09)Total Phosphorus 1.84 (0.28 - 2.00) 248.32 (248.16 - 248.84)Total Dissolved Salts 922.22 (139.44 - 1000.00) 124159.69 (124078.10 - 124418.04)Volatile Solids 0.00 (0.00 - 0.00) 0.00 (0.00 - 0.00)Total Solids 0.00 (0.00 - 0.00) 0.00 (0.00 - 0.00)
MEDLI v2.0 - Summary Output Page 3 08/03/2016 11:16:00af2fa958-1ddd-462b-9b17-e0be68a7cc36

Scenario: Lindeman Island Resort Control Scenario.med Pond, Pumps & ShandyingDE
SCRI
PTIO
NPond system: 1 faculta ve pond
Pond system details:
Maximum pond volume (m3)Minimum allowable pond volume (m3)Pond depth at overflow outlet (m)Maximum water surface area (m2)Pond footprint length (m)Pond footprint width (m)Pond catchment area (m2)Average active volume (m3)
Pond 115000.00
371.414.00
3786.9287.8344.31
3891.9914964.92
Irriga on pump limits:Minimum pump rate per area limit (ML/day/ha)Maximum pump rate per area limit (ML/day/ha)
0.000.00
Shandying water:
Annual allocation of fresh water available for shandying (m3/year) 0.00Maximum rate of application of fresh water (ML/day) 0.00Nitrogen concentration (mg/L) 0.00Salinity (dS/m) 0.00Minimum shandy water is used False
MEDLI v2.0 - Summary Output Page 4 08/03/2016 11:16:00af2fa958-1ddd-462b-9b17-e0be68a7cc36

Scenario: Lindeman Island Resort Control Scenario.med LandDE
SCRI
PTIO
NLand: Nominated Irriga on Areas
Area (ha): 11.40
Soil Type: Duplex 2, 3300.00 mm de ned pro le depthProfile Porosity (mm) 1359.62Profile saturation water content (mm) 1327.00Profile drained upper limit (or field capacity) (mm) 1042.20Profile lower storage limit (or permanent wilting point) (mm) 771.20Profile available water capacity (mm) 271.00Profile limiting saturated hydraulic conductivity (mm/hour) 0.10Surface saturated hydraulic conductivity (mm/hour) 10.00Runoff curve number II (coefficient) 82.00Soil evaporation U (mm) 8.00Soil evaporation Cona (mm/sqrt day) 4.00
-3300-3200-3100-3000-2900-2800-2700-2600-2500-2400-2300-2200-2100-2000-1900-1800-1700-1600-1500-1400-1300-1200-1100-1000-900-800-700-600-500-400-300-200-1000
Soil
dept
h (m
m)
0 20 40Soil Moisture Content (%v/v)
Layer 1 (Evaporates to air dry moisture content)BD = 1.54 g/cm3, Porosity = 125.66 mm/layerKsat = 10.00 mm/hour
Layer 2 (Evaporates to lower storage limit)BD = 1.54 g/cm3, Porosity = 418.87 mm/layerKsat = 0.20 mm/hour
Layer 3BD = 1.57 g/cm3, Porosity = 815.09 mm/layerKsat = 0.10 mm/hour
Air Dry (%v/v) Lower Storage Limit (%v/v) Drained Upper Limit (%v/v) Saturated Water Content (%v/v) Porosity (%v/v)
Plant Data: Con nuous Blady Grass PastureAverage monthly cover (%) (minimum - maximum) 26.16 (18.47 - 33.07)Maximum crop factor at 100% cover (mm/mm) (Maximum crop coefficient 0.8 x Pan coefficient 1)
0.80
Non-transpiring Cover Left after Harvest (%) 20.00Maximum potential root depth in defined soil profile (mm) 799.88Salt tolerance Moderately tolerantSalinity threshold EC sat. ext. (dS/m) 1.50Proportion of yield decrease per dS/m increase (%/dS/m) 2.00
MEDLI v2.0 - Summary Output Page 5 08/03/2016 11:16:00af2fa958-1ddd-462b-9b17-e0be68a7cc36

Scenario: Lindeman Island Resort Control Scenario.med Pond WaterPE
RFO
RMAN
CEPond System Water Performance - Over ow: 1 faculta ve pond
Capacity of wet weather storage pond: 15000 m3
Pond System Water Balance (m3/year)
Rain (5591.95)
134631.74
In ow
Evapora on (6473.21)
64296.75
Over ow
Irriga on (0.00)
69153.72 Seepage
Delta Storage (300.00) Recycling: 0.00
OUTPUTSINPUTS
Name Value
Rain 5591.95
Inflow 134631.74
Recycling 0.00
Evaporation 6473.21
Overflow 64296.75
Irrigation 0.00
Seepage 69153.72
Delta Storage 300.00
Over ows Diagnos csVolume of overflow (m3/year) 64296.75No. days pond overflows (days/year) 363.56Average duration of overflow (days) 18178.00Effluent Reuse (Proportion of Inflow + Net Rain Gain that is Irrigated) (%) 0.00Probability of at least 90% reuse (%) 0.00
0 1 2 5 10
20
50
100
200
500
18178
Overflow event duration exceeded (days)
00.020.040.060.080.1
0.120.140.160.180.2
No.
Ove
rflo
w E
vent
s pe
r 10
year
s
0.00 1.89
10.00
20.00
50.00
100.00
200.00
500.00
1000.00
2000.00
5000.00
10000.00
20000.00
50000.00
3214837.66
Overflow volume exceeded (m3)
00.020.040.060.080.1
0.120.140.160.180.2
No.
Ove
rflo
w E
vent
s pe
r 10
year
s
-0.5 -0.4 -0.3 -0.2 -0.1 0 0.1 0.2 0.3 0.4 0.5
Annual Reuse (%)
0102030405060708090
100
Prob
abili
ty O
f Exc
eeda
nce
(%)
Export plots
MEDLI v2.0 - Summary Output Page 6 08/03/2016 11:16:00af2fa958-1ddd-462b-9b17-e0be68a7cc36

Scenario: Lindeman Island Resort Control Scenario.med Pond Nutrient BalancePE
RFO
RMAN
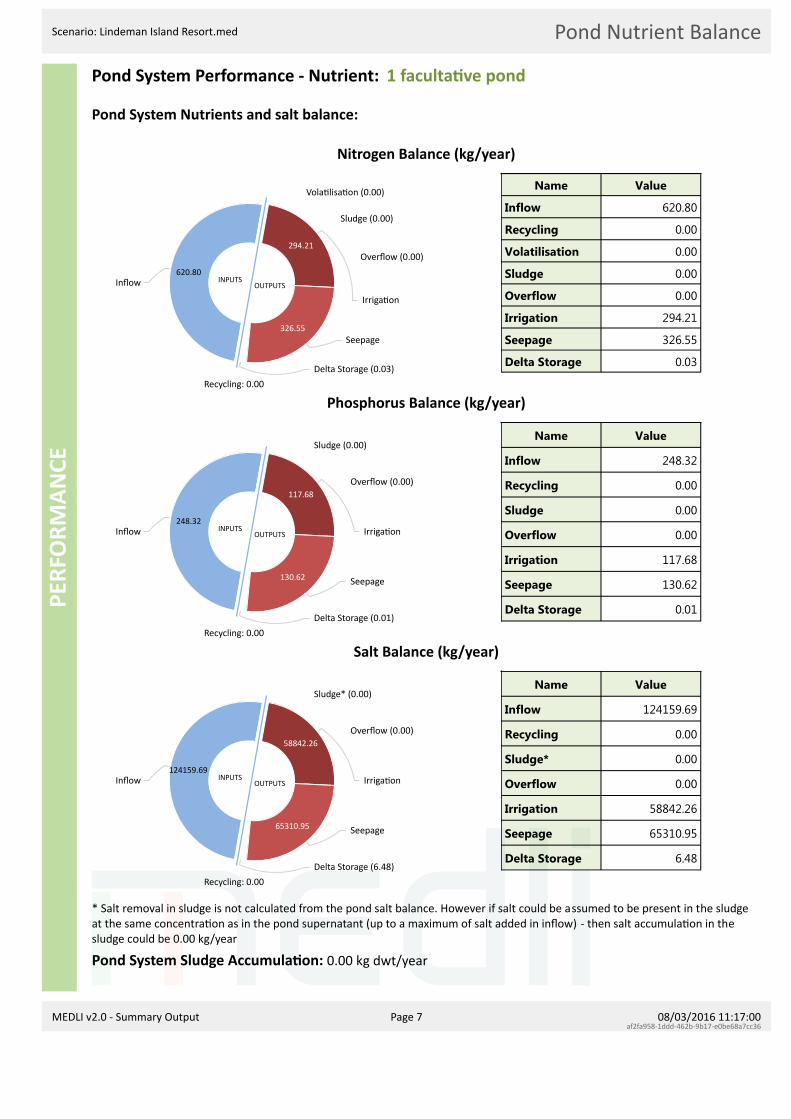
CEPond System Performance - Nutrient: 1 faculta ve pond
Pond System Nutrients and salt balance:
Nitrogen Balance (kg/year)
620.80In ow
Vola lisa on (0.00)
Sludge (0.00)
294.86Over ow
Irriga on (0.00)
324.40Seepage
Delta Storage (1.54) Recycling: 0.00
OUTPUTSINPUTS
Name Value
Inflow 620.80
Recycling 0.00
Volatilisation 0.00
Sludge 0.00
Overflow 294.86
Irrigation 0.00
Seepage 324.40
Delta Storage 1.54
Phosphorus Balance (kg/year)
248.32In ow
Sludge (0.00)
117.94Over ow
Irriga on (0.00)
129.76 Seepage
Delta Storage (0.61) Recycling: 0.00
OUTPUTSINPUTS
Name Value
Inflow 248.32
Recycling 0.00
Sludge 0.00
Overflow 117.94
Irrigation 0.00
Seepage 129.76
Delta Storage 0.61
Salt Balance (kg/year)
124159.69In ow
Sludge* (0.00)
58972.06Over ow
Irriga on (0.00)
64880.25 Seepage
Delta Storage (307.38) Recycling: 0.00
OUTPUTSINPUTS
Name Value
Inflow 124159.69
Recycling 0.00
Sludge* 0.00
Overflow 58972.06
Irrigation 0.00
Seepage 64880.25
Delta Storage 307.38
* Salt removal in sludge is not calculated from the pond salt balance. However if salt could be assumed to be present in the sludgeat the same concentra on as in the pond supernatant (up to a maximum of salt added in in ow) - then salt accumula on in the sludge could be 0.00 kg/year
Pond System Sludge Accumula on: 0.00 kg dwt/year
MEDLI v2.0 - Summary Output Page 7 08/03/2016 11:16:00af2fa958-1ddd-462b-9b17-e0be68a7cc36

Scenario: Lindeman Island Resort Control Scenario.med Pond Nutrient Concentra onsPE
RFO
RMAN
CEPond System Performance - Nutrient: 1 faculta ve pond
Pond Nutrient Concentra ons and Salinity:Average across simulation period
Average nitrogen concentration of pond liquid (mg/L)Average phosphorus concentration of pond liquid (mg/L)Average salinity of pond liquid (dS/m)
Pond 14.691.881.47
Value on final day of simulation periodFinal nitrogen concentration of pond liquid (mg/L)Final phosphorus concentration of pond liquid (mg/L)Final salinity of pond liquid (dS/m)
Pond 15.122.051.60
MEDLI v2.0 - Summary Output Page 8 08/03/2016 11:16:00af2fa958-1ddd-462b-9b17-e0be68a7cc36

Scenario: Lindeman Island Resort Control Scenario.med Irriga onPE
RFO
RMAN
CEIrriga on Performance:
Water Use: (assumes 100% Irriga on E ciency)Pond water irrigated (m3/year) 0.00Average Shandy water irrigation (m3/year) (minimum - maximum) 0.00 (0.00 - 0.00)Total water irrigated (m3/year) 0.00Proportion of irrigation events requiring shandying (% of events) 0.00Proportion of years shandying water allocation of 0 m3/year is exceeded (% of years) 0.00Average exceedance as a proportion of annual shandy water allocation (% of allocation) (minimum - maximum)
0.00 (0.00 - 0.00)
Irriga on Quality:Average nitrogen concentration of irrigation water - before ammonia loss during irrigation (mg/L)
0.00
Average nitrogen concentration of irrigation water - after ammonia loss during irrigation (mg/L)
0.00
Average phosphorus concentration of irrigation water (mg/L) 0.00Average salinity of irrigation water (dS/m) 0.00
Irriga on Diagnos cs (No e uent irriga on occurred!):Proportion Days Irrigation Turned Off (%) 100.00 (Hence no irrigation!)Proportion of days maximum irrigation rate set to zero (%) 100.00 (Hence no irrigation!)Proportion of Days irrigation occurs (%) 0.00
MEDLI v2.0 - Summary Output Page 9 08/03/2016 11:16:00af2fa958-1ddd-462b-9b17-e0be68a7cc36

Scenario: Lindeman Island Resort Control Scenario.med Land Water BalancePE
RFO
RMAN
CELand Performance - Soil Water
Paddock: Nominated Irriga on Areas, 11.4 haSoil Type: Duplex 2, 75.99 mm PAWC at maximum root depth
Water Balance (mm/year): % Total inputsmm/year
1596.42
Rain
Irriga on (0.00)
Delta Soil Water (1.50)
577.00
Soil Evapora on
312.54
Transpira on
404.06
Rain Runo
Irriga on Runo (0.00) 304.32
Deep Drainage
OUTPUTSINPUTS
Name Value
Rain 1596.42
Irrigation 0.00
Soil Evaporation 577.00
Transpiration 312.54
Rain Runoff 404.06Irrigation Runoff
0.00
Deep Drainage 304.32Delta Soil Water -1.50
Average Monthly Totals (mm): TableChart
RainIrrigationSoil EvapTranspn.Rain RunoffIrrigation RunoffDeep DrainageDelta Soil Water
Jan
Feb
Mar
Apr
May
Jun
Jul
Aug Se
p
Oct
Nov Dec
-50
0
50
100
150
200
250
300
mm
Total: 1596.42mm
Total: 577.00mm
Total: 312.54mmTotal: 404.06mm
Total: 304.32mm
Total: -1.50mm
Average Annual Totals (mm/year): TableChart
RainIrrigationSoil EvapTranspn.Rain RunoffIrrigation RunoffDeep DrainageDelta Soil Water
1965 1970
1975 1980
1985 1990
1995 2000
2005 2010
0
500
1000
1500
2000
2500
mm
/yea
r
MEDLI v2.0 - Summary Output Page 10 08/03/2016 11:16:00af2fa958-1ddd-462b-9b17-e0be68a7cc36

Scenario: Lindeman Island Resort Control Scenario.med Land Nutrient BalancePE
RFO
RMAN
CELand Performance - Soil Nutrient
Paddock: Nominated Irriga on Areas, 11.4 ha Soil Type: Duplex 2
Irriga on ammonium vola lisa on losses (kg/ha/year): 0.00Propor on of total nitrogen in irrigated e uent as ammonium (%): 20.00
Nitrogen Balance (kg/ha/year)
Seed (0.91)
Irriga on (0.00) 91.33
Delta Soil N
Denitri ca on (0.57)
Irriga on Runo (0.00)
Rain Runo (0.00) 86.16
Uptake
Leached (5.51)
OUTPUTSINPUTS
Name Value
Seed 0.91
Irrigation 0.00
Denitrification 0.57
Irrigation Runoff
0.00
Rain Runoff 0.00Uptake 86.16Leached 5.51Delta Soil N -91.33
Phosphorus Balance (kg/ha/year)
Seed (0.14)
Irriga on (0.00) 4.29
Delta Soil P Irriga on Runo (0.00)
Rain Runo (0.00)
4.13
Uptake
Leached (0.30)
OUTPUTSINPUTS
Name Value
Seed 0.14
Irrigation 0.00
Irrigation Runoff
0.00
Rain Runoff 0.00
Uptake 4.13
Leached 0.30
Delta Soil P -4.29
MEDLI v2.0 - Summary Output Page 11 08/03/2016 11:16:00af2fa958-1ddd-462b-9b17-e0be68a7cc36

Scenario: Lindeman Island Resort Control Scenario.med Paddock Nutrient ImpactPE
RFO
RMAN
CELand Performance - Soil Nutrient
Paddock: Nominated Irriga on Areas, 11.4 ha Soil Type: Duplex 2
Annual Nutrient Totals (kg/ha):
N irrigationN denitrifiedN removed by plantN irrigation runoffN leachedN organic storedN mineral storedP irrigationP removed by plantP irrigation runoffP leachedP storedTotal N deltaTotal P deltaTotal N storedP adsorbedP dissolved
1965 1970
1975 1980
1985 1990
1995 2000
2005 2010
0
500
1000
1500
2000
2500
3000
3500
4000
4500
Annual Nutrient Leaching Concentra on (mg/L):
Nitrate-NPhosphate-P
1965 1970
1975 1980
1985 1990
1995 2000
2005 2010
0
2
4
6
8
10
12
14
16
18
20
MEDLI v2.0 - Summary Output Page 12 08/03/2016 11:16:00af2fa958-1ddd-462b-9b17-e0be68a7cc36

Scenario: Lindeman Island Resort Control Scenario.med Crop Growth & UptakePE
RFO
RMAN
CEPlant Performance and Nutrients
Paddock: Nominated Irriga on Areas, 11.4 ha Soil Type: Duplex 2
Plant: Con nuous Blady Grass PastureAverage annual shoot dry matter yield (kg/ha/year) 8221.35 (1976.92 - 15373.35)Average monthly plant cover (%) (minimum - maximum) 26.16 (18.47 - 33.07)Average monthly root depth (mm) (minimum - maximum) 516.80 (410.61 - 603.24)
Nutrient Uptake (minimum - maximum):Average annual net nitrogen removed by plant uptake (kg/ha/year) 84.33 (16.01 - 232.87)Average annual net phosphorus removed by plant uptake (kg/ha/year) 3.85 (-0.48 - 39.71)Average annual shoot nitrogen concentration (fraction dwt) 0.01 (0.01 - 0.02)Average annual shoot phosphorus concentration (fraction dwt) 0.000 (0.000 - 0.003)
Average Monthly Yield (kg/ha/year) and Plant Stresses TableChart
Nitrogen DeficiencyTemperature stressWater DeficiencyWaterloggingYield (Crop 1)Yield (Crop 2)
Jan
Feb
Mar
Apr
May
Jun
Jul
Aug Se
p
Oct
Nov Dec
0
0.10.20.30.40.50.60.70.80.9
1
Stre
ss In
dex
(1.0
= F
ull S
tres
s)
0
200
400
600
800
1000
1200
Aver
age
Mon
thly
DW
T Yi
eld
(kg/
ha/y
ear)
Average Annual Yield (kg/ha/year) and Plant Stresses TableChart
Nitrogen DeficiencyTemperature stressWater DeficiencyWaterloggingYield (Crop 1)Yield (Crop 2)
1965 1970
1975 1980
1985 1990
1995 2000
2005 2010 0
0.10.20.30.40.50.60.70.80.9
1
Stre
ss In
dex
(1.0
= F
ull S
tres
s)
0
2000
4000
6000
8000
10000
12000
14000
16000
18000
Aver
age
Annu
al D
WT
Yiel
d (k
g/ha
/yea
r)
No. of harvests/year: 1.30 (normal), 1.50 (forced by crop death due to nitrogen stress (0.06), water stress (1.44))No. days without crop/year (days/year): 38.42 due to water stress (38.42)
MEDLI v2.0 - Summary Output Page 13 08/03/2016 11:16:00af2fa958-1ddd-462b-9b17-e0be68a7cc36
Scenario: Lindeman Island Resort Control Scenario.med Salinity ImpactPE
RFO
RMAN
CELand Performance
Paddock: Nominated Irriga on Areas, 11.4 ha Soil Type: Duplex 2
Plant: Con nuous Blady Grass PastureSalt tolerance Moderately tolerantSalinity threshold EC sat. ext. (dS/m) 1.50Proportion of yield decrease per dS/m increase (%/dS/m) 2.00No. years assumed for leaching to reach steady-state (years) 10.00
Soil Salinity:Average Infiltrate Salinity (dS/m) 0.03
Insu cient deep drainage to run steady state salinity calcula ons.
MEDLI v2.0 - Summary Output Page 14 08/03/2016 11:16:00af2fa958-1ddd-462b-9b17-e0be68a7cc36
Scenario: Lindeman Island Resort Control Scenario.med ClimateDI
AGN
OST
ICS
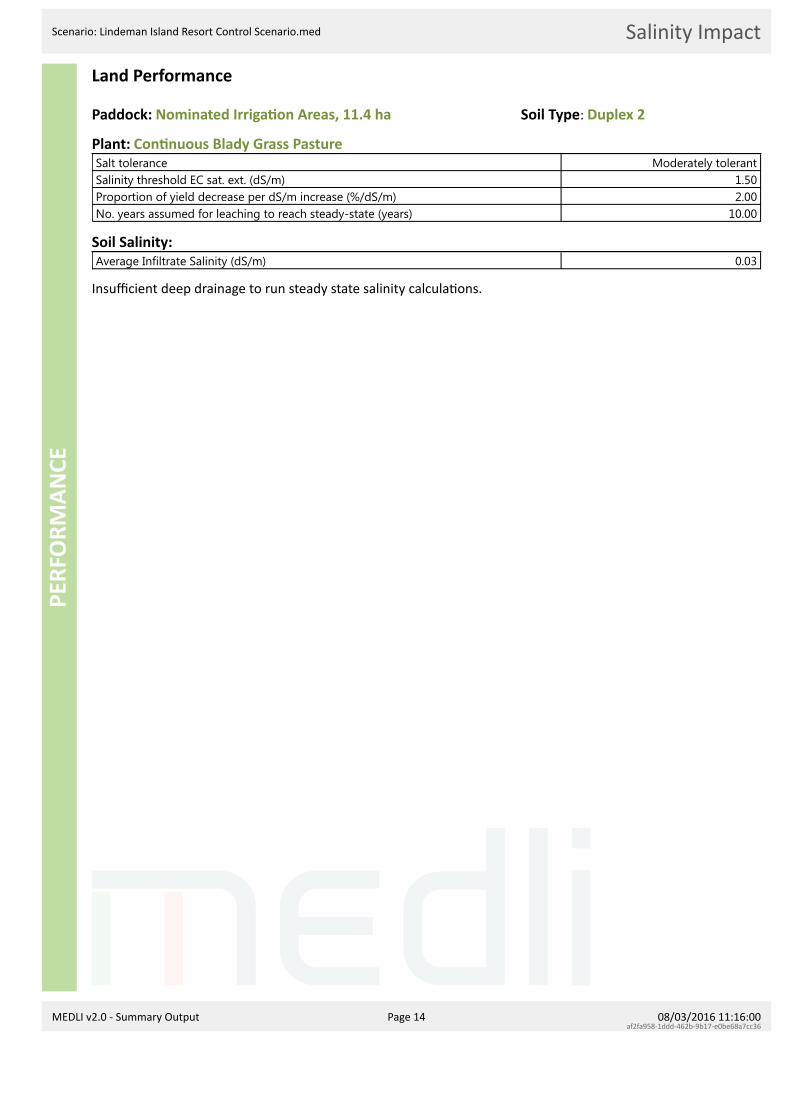
Sustainability Diagnos cs: Lindeman Island Resort
Averaged Historical Climate Data Used in Simula on (mm)
Loca on: Lindeman, -20.45°, 149.05°
Run Period: 01/01/1965 to 31/12/2014 50 years, 0 days
-150-100-50
050
100150200250300350 Net Evap (Evap - Rain) Rain Evap (Pan evap x Pan coeff)
RainEvapNet EvapNet Evap/day
Jan235.5192.9-42.6-1.4
Feb315.0159.4
-155.7-5.5
Mar247.0166.0-81.0-2.6
Apr170.7139.6-31.0-1.0
May144.7118.6-26.1-0.8
Jun84.1
101.117.00.6
Jul56.0
111.355.31.8
Aug31.9
133.8101.9
3.3
Sep25.2
164.4139.2
4.6
Oct38.1
197.5159.3
5.1
Nov75.1
204.4129.3
4.3
Dec173.1210.537.51.2
Year1596.41899.4303.0
0.8
MEDLI v2.0 - Summary Output Page 15 08/03/2016 11:16:00af2fa958-1ddd-462b-9b17-e0be68a7cc36

Scenario: Lindeman Island Resort Control Scenario.med PondDI
AGN
OST
ICS
Sustainability Diagnos cs: Lindeman Island Resort
Pond System: 1 faculta ve pondNew Sewage Treatment Plant - 134631.74 m3/year or 368.61 m3/day generated on averageE uent entering pond system a er any pretreatment and recyclingAverage (Minimum-Maximum) in uent quality calculated for 365.24 non-zero ow days, a er any pretreatment and recycling.
Constituent Concentration (mg/L) Load (kg/year)Total Nitrogen 4.61 (0.70 - 5.00) 620.80 (620.39 - 622.09)Total Phosphorus 1.84 (0.28 - 2.00) 248.32 (248.16 - 248.84)Total Dissolved Salts 922.22 (139.44 - 1000.00) 124159.69 (124078.10 - 124418.04)Volatile Solids 0.00 (0.00 - 0.00) 0.00 (0.00 - 0.00)Total Solids 0.00 (0.00 - 0.00) 0.00 (0.00 - 0.00)
Last pond (Wet weather store): 15000.00 m3Theoretical hydraulic retention time (days) 40.69Average volume of overflow (m3/year) 64296.75No. overflow events per year exceeding threshold* of 1.89 m3 (no./year) 0.02Average duration of overflow (days) 18178.00Effluent Reuse (Proportion of Inflow + Net Rain Gain that is Irrigated) (%) 0.00Probability of at least 90% effluent reuse (%) 0.00Average salinity of last pond (dS/m) 1.47Salinity of last pond on final day of simulation (dS/m) 1.60Ammonia loss from pond system water area (kg/m2/year) 0.00
* The threshold is the volume equivalent to the top 1 mm depth of water of a full pond
Over ow exceedance: TableChart
00.010.020.030.040.050.060.070.080.090.1
0.110.120.130.140.150.160.170.180.190.2
0.21
No.
Ove
rflo
w E
vent
s (e
vent
s/10
yea
rs)
0.00 1.89
10.00
20.00
50.00
100.00
200.00
500.00
1000.00
2000.00
5000.00
10000.00
20000.00
50000.00
3214837.66
Overflow Volume Exceeded (m3)
Export plot
MEDLI v2.0 - Summary Output Page 16 08/03/2016 11:16:00af2fa958-1ddd-462b-9b17-e0be68a7cc36

Scenario: Lindeman Island Resort Control Scenario.med Irriga onDI
AGN
OST
ICS
Sustainability Diagnos cs: Lindeman Island Resort
Irriga on Informa on
Irriga on: 11.4 ha total area (assumed 100% irriga on e ciency)Quantity/year Quantity/ha/year
Total irrigation applied (m3) 0.00 0.00Total nitrogen applied (kg) 0.00 0.00Total phosphorus applied (kg) 0.00 0.00Total salts applied (kg) 0.00 0.00
ShandyingAnnual allocation of fresh water for shandying (m3/year) 0.00Average Shandy water irrigation (m3/year) (minimum - maximum) 0.00 (0.00 - 0.00)Average exceedance as a proportion of annual shandy water allocation (% of allocation) (minimum - maximum)
0.00 (0.00 - 0.00)
Proportion of irrigation events requiring shandying (% of events) 0.00Minimum shandy water is used False
Irriga on IssuesProportion of Days irrigation is turned off (%) 100.00
MEDLI v2.0 - Summary Output Page 17 08/03/2016 11:16:00af2fa958-1ddd-462b-9b17-e0be68a7cc36
Scenario: Lindeman Island Resort Control Scenario.med SoilDI
AGN
OST
ICS
Sustainability Diagnos cs: Lindeman Island Resort
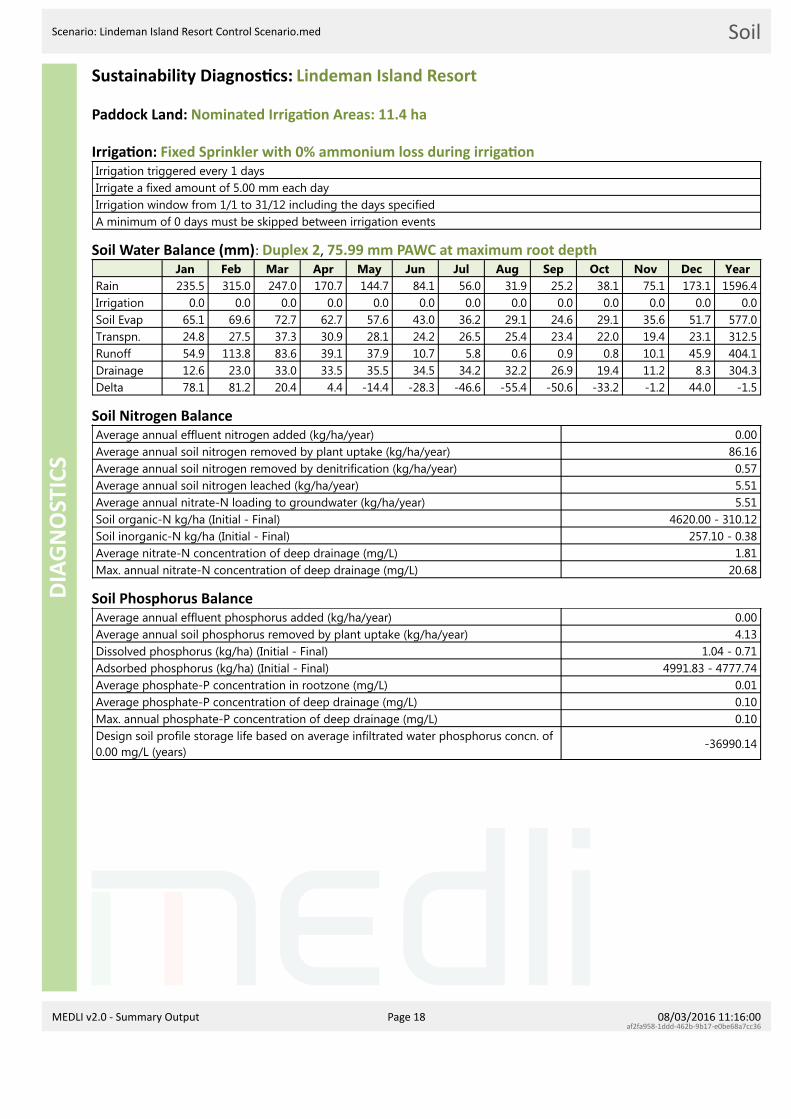
Paddock Land: Nominated Irriga on Areas: 11.4 ha
Irriga on: Fixed Sprinkler with 0% ammonium loss during irriga onIrrigation triggered every 1 daysIrrigate a fixed amount of 5.00 mm each dayIrrigation window from 1/1 to 31/12 including the days specifiedA minimum of 0 days must be skipped between irrigation events
Soil Water Balance (mm): Duplex 2, 75.99 mm PAWC at maximum root depth
RainIrrigationSoil EvapTranspn.RunoffDrainageDelta
Jan235.5
0.065.124.854.912.678.1
Feb315.0
0.069.627.5
113.823.081.2
Mar247.0
0.072.737.383.633.020.4
Apr170.7
0.062.730.939.133.54.4
May144.7
0.057.628.137.935.5
-14.4
Jun84.10.0
43.024.210.734.5
-28.3
Jul56.00.0
36.226.55.8
34.2-46.6
Aug31.90.0
29.125.40.6
32.2-55.4
Sep25.20.0
24.623.40.9
26.9-50.6
Oct38.10.0
29.122.00.8
19.4-33.2
Nov75.10.0
35.619.410.111.2-1.2
Dec173.1
0.051.723.145.98.3
44.0
Year1596.4
0.0577.0312.5404.1304.3
-1.5
Soil Nitrogen BalanceAverage annual effluent nitrogen added (kg/ha/year) 0.00Average annual soil nitrogen removed by plant uptake (kg/ha/year) 86.16Average annual soil nitrogen removed by denitrification (kg/ha/year) 0.57Average annual soil nitrogen leached (kg/ha/year) 5.51Average annual nitrate-N loading to groundwater (kg/ha/year) 5.51Soil organic-N kg/ha (Initial - Final) 4620.00 - 310.12Soil inorganic-N kg/ha (Initial - Final) 257.10 - 0.38Average nitrate-N concentration of deep drainage (mg/L) 1.81Max. annual nitrate-N concentration of deep drainage (mg/L) 20.68
Soil Phosphorus BalanceAverage annual effluent phosphorus added (kg/ha/year) 0.00Average annual soil phosphorus removed by plant uptake (kg/ha/year) 4.13Dissolved phosphorus (kg/ha) (Initial - Final) 1.04 - 0.71Adsorbed phosphorus (kg/ha) (Initial - Final) 4991.83 - 4777.74Average phosphate-P concentration in rootzone (mg/L) 0.01Average phosphate-P concentration of deep drainage (mg/L) 0.10Max. annual phosphate-P concentration of deep drainage (mg/L) 0.10Design soil profile storage life based on average infiltrated water phosphorus concn. of0.00 mg/L (years)
-36990.14
MEDLI v2.0 - Summary Output Page 18 08/03/2016 11:16:00af2fa958-1ddd-462b-9b17-e0be68a7cc36

Scenario: Lindeman Island Resort Control Scenario.med Paddock Nutrient ImpactDI
AGN
OST
ICS
Sustainability Diagnos cs: Lindeman Island Resort
Paddock Land: Nominated Irriga on Areas: 11.4 ha
Irriga on: Fixed Sprinkler with 0% ammonium loss during irriga on
Annual nutrient leachate concentra on (mg/L)
1965 1970 1975 1980 1985 1990 1995 2000 2005 2010
2
4
6
8
10
12
14
16
18
20
Nitrate-N Phosphate-P
Annual Phosphate-P in soil (kg/ha)
1965 1970 1975 1980 1985 1990 1995 2000 2005 2010
500
1000
1500
2000
2500
3000
3500
4000
4500
P adsorbed P dissolved
MEDLI v2.0 - Summary Output Page 19 08/03/2016 11:16:00af2fa958-1ddd-462b-9b17-e0be68a7cc36
Scenario: Lindeman Island Resort Control Scenario.med PlantDI
AGN
OST
ICS
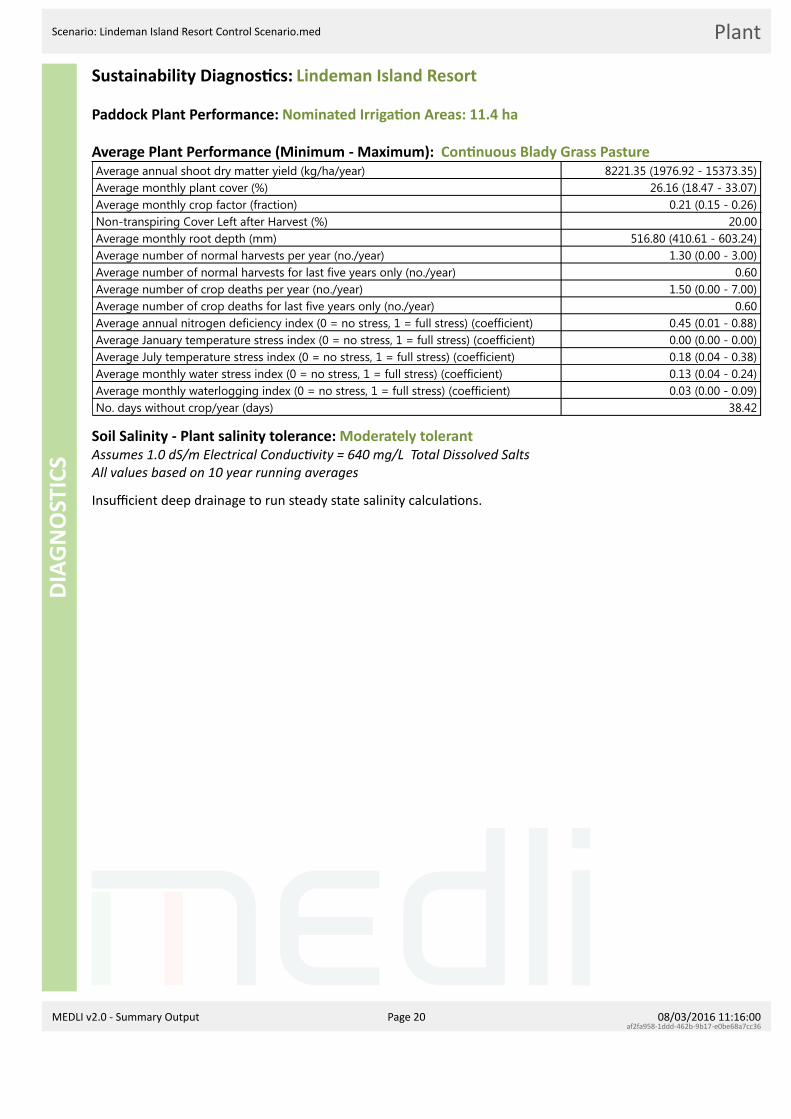
Sustainability Diagnos cs: Lindeman Island Resort
Paddock Plant Performance: Nominated Irriga on Areas: 11.4 ha
Average Plant Performance (Minimum - Maximum): Con nuous Blady Grass PastureAverage annual shoot dry matter yield (kg/ha/year) 8221.35 (1976.92 - 15373.35)Average monthly plant cover (%) 26.16 (18.47 - 33.07)Average monthly crop factor (fraction) 0.21 (0.15 - 0.26)Non-transpiring Cover Left after Harvest (%) 20.00Average monthly root depth (mm) 516.80 (410.61 - 603.24)Average number of normal harvests per year (no./year) 1.30 (0.00 - 3.00)Average number of normal harvests for last five years only (no./year) 0.60Average number of crop deaths per year (no./year) 1.50 (0.00 - 7.00)Average number of crop deaths for last five years only (no./year) 0.60Average annual nitrogen deficiency index (0 = no stress, 1 = full stress) (coefficient) 0.45 (0.01 - 0.88)Average January temperature stress index (0 = no stress, 1 = full stress) (coefficient) 0.00 (0.00 - 0.00)Average July temperature stress index (0 = no stress, 1 = full stress) (coefficient) 0.18 (0.04 - 0.38)Average monthly water stress index (0 = no stress, 1 = full stress) (coefficient) 0.13 (0.04 - 0.24)Average monthly waterlogging index (0 = no stress, 1 = full stress) (coefficient) 0.03 (0.00 - 0.09)No. days without crop/year (days) 38.42
Soil Salinity - Plant salinity tolerance: Moderately tolerantAssumes 1.0 dS/m Electrical Conduc vity = 640 mg/L Total Dissolved SaltsAll values based on 10 year running averages
Insu cient deep drainage to run steady state salinity calcula ons.
MEDLI v2.0 - Summary Output Page 20 08/03/2016 11:16:00af2fa958-1ddd-462b-9b17-e0be68a7cc36

Scenario: Lindeman Island Resort Control Scenario.med Run MessagesDI
AGN
OST
ICS
Run MessagesMessages generated when the scenario was run:This is a Dryland scenarioNo effluent irrigation has occurred!Full run chosen
MEDLI v2.0 - Summary Output Page 21 08/03/2016 11:16:00af2fa958-1ddd-462b-9b17-e0be68a7cc36
Scenario: Lindeman Island Resort.med General Informa onG
ENER
AL IN
FORM
ATIO
N -
FULL
RU
NEnterprise: Lindeman Island Resort
Descrip on:Recycled Water Management Plan
Client: White Horse Australia
MEDLI User: Victoria Haigh
Scenario Details:
MEDLI v2.0 - Summary Output Page 1 08/03/2016 11:17:00af2fa958-1ddd-462b-9b17-e0be68a7cc36

Scenario: Lindeman Island Resort.med Climate & Run PeriodDE
SCRI
PTIO
NClimate Data: Lindeman, -20.45°, 149.05°
Run Period: 01/01/1965 to 31/12/2014 50 years, 0 days
Climate Sta s cs:
5th Percentile 50th Percentile 95th Percentile
Rainfall (mm/year) 915 1568 2440Pan Evaporation (mm/year) 1723 1892 2100
Climate Data: TableChart
DailyMonthly
RainPanMax TempMin TempRadNet Evap
Daily Average Across Run Period
Jan
Feb
Mar
Apr
May
Jun
Jul
Aug Se
p
Oct
Nov Dec
Jan
Feb
Mar 0
5
10
15
20Total: 1596.42mm
Total: 1899.39mm
MEDLI v2.0 - Summary Output Page 2 08/03/2016 11:17:00af2fa958-1ddd-462b-9b17-e0be68a7cc36

Scenario: Lindeman Island Resort.med WastestreamDE
SCRI
PTIO
NE uent type: New Sewage Treatment Plant
Wastestream before any recycling or pretreatment
Average daily quan ty and ow-weighted average quality: TableChart
EffluentTNTPTDSVSTS
Jan
Feb
Mar
Apr
May
Jun
Jul
Aug Se
p
Oct
Nov Dec
360
380
400
420
440
460
Efflu
ent (
m3/
day)
0
100
200
300
400
500
600
700
800
900
1000
Conc
entr
atio
n (m
g/L)
Wastestream a er any recycling and pretreatment if applicable
E uent quan ty: 134631.74 m3/year or 368.61 m3/day (Min-Max: 339.94 - 2437.93)
Flow-weighted average (minimum - maximum) daily e uent quality entering pond system:Concentration (mg/L) Load (kg/year)
Total Nitrogen 4.61 (0.70 - 5.00) 620.80 (620.39 - 622.09)Total Phosphorus 1.84 (0.28 - 2.00) 248.32 (248.16 - 248.84)Total Dissolved Salts 922.22 (139.44 - 1000.00) 124159.69 (124078.10 - 124418.04)Volatile Solids 0.00 (0.00 - 0.00) 0.00 (0.00 - 0.00)Total Solids 0.00 (0.00 - 0.00) 0.00 (0.00 - 0.00)
MEDLI v2.0 - Summary Output Page 3 08/03/2016 11:17:00af2fa958-1ddd-462b-9b17-e0be68a7cc36

Scenario: Lindeman Island Resort.med Pond, Pumps & ShandyingDE
SCRI
PTIO
NPond system: 1 faculta ve pond
Pond system details:
Maximum pond volume (m3)Minimum allowable pond volume (m3)Pond depth at overflow outlet (m)Maximum water surface area (m2)Pond footprint length (m)Pond footprint width (m)Pond catchment area (m2)Average active volume (m3)
Pond 115000.00
371.414.00
3786.9287.8344.31
3891.99409.49
Irriga on pump limits:Minimum pump rate per area limit (ML/day/ha)Maximum pump rate per area limit (ML/day/ha)
0.0010.00
Shandying water:
Annual allocation of fresh water available for shandying (m3/year) 0.00Maximum rate of application of fresh water (ML/day) 0.00Nitrogen concentration (mg/L) 0.00Salinity (dS/m) 0.00Minimum shandy water is used False
MEDLI v2.0 - Summary Output Page 4 08/03/2016 11:17:00af2fa958-1ddd-462b-9b17-e0be68a7cc36

Scenario: Lindeman Island Resort.med LandDE
SCRI
PTIO
NLand: Nominated Irriga on Areas
Area (ha): 11.88
Soil Type: Duplex 2, 3300.00 mm de ned pro le depthProfile Porosity (mm) 1359.62Profile saturation water content (mm) 1327.00Profile drained upper limit (or field capacity) (mm) 1042.20Profile lower storage limit (or permanent wilting point) (mm) 771.20Profile available water capacity (mm) 271.00Profile limiting saturated hydraulic conductivity (mm/hour) 0.10Surface saturated hydraulic conductivity (mm/hour) 10.00Runoff curve number II (coefficient) 82.00Soil evaporation U (mm) 8.00Soil evaporation Cona (mm/sqrt day) 4.00
-3300-3200-3100-3000-2900-2800-2700-2600-2500-2400-2300-2200-2100-2000-1900-1800-1700-1600-1500-1400-1300-1200-1100-1000-900-800-700-600-500-400-300-200-1000
Soil
dept
h (m
m)
0 20 40Soil Moisture Content (%v/v)
Layer 1 (Evaporates to air dry moisture content)BD = 1.54 g/cm3, Porosity = 125.66 mm/layerKsat = 10.00 mm/hour
Layer 2 (Evaporates to lower storage limit)BD = 1.54 g/cm3, Porosity = 418.87 mm/layerKsat = 0.20 mm/hour
Layer 3BD = 1.57 g/cm3, Porosity = 815.09 mm/layerKsat = 0.10 mm/hour
Air Dry (%v/v) Lower Storage Limit (%v/v) Drained Upper Limit (%v/v) Saturated Water Content (%v/v) Porosity (%v/v)
Plant Data: Con nuous Blady Grass PastureAverage monthly cover (%) (minimum - maximum) 0.33 (0.31 - 0.37)Maximum crop factor at 100% cover (mm/mm) (Maximum crop coefficient 0.8 x Pan coefficient 1)
0.80
Non-transpiring Cover Left after Harvest (%) 0.20Maximum potential root depth in defined soil profile (mm) 800.00Salt tolerance Moderately tolerantSalinity threshold EC sat. ext. (dS/m) 1.50Proportion of yield decrease per dS/m increase (%/dS/m) 0.02
MEDLI v2.0 - Summary Output Page 5 08/03/2016 11:17:00af2fa958-1ddd-462b-9b17-e0be68a7cc36

Scenario: Lindeman Island Resort.med Pond WaterPE
RFO
RMAN
CEPond System Water Performance - Over ow: 1 faculta ve pond
Capacity of wet weather storage pond: 15000 m3
Pond System Water Balance (m3/year)
Rain (5591.95)
134631.74
In ow
Evapora on (6354.05)
Over ow (0.00)
65980.72
Irriga on
67881.48 Seepage
Delta Storage (7.43) Recycling: 0.00
OUTPUTSINPUTS
Name Value
Rain 5591.95
Inflow 134631.74
Recycling 0.00
Evaporation 6354.05
Overflow 0.00
Irrigation 65980.72
Seepage 67881.48
Delta Storage 7.43
Over ows Diagnos csVolume of overflow (m3/year) 0.00No. days pond overflows (days/year) 0.00Average duration of overflow (days) 0.00Effluent Reuse (Proportion of Inflow + Net Rain Gain that is Irrigated) (%) 0.49Probability of at least 90% reuse (%) 0.00
0
Overflow event duration exceeded (days)
-0.5-0.4-0.3-0.2-0.1
00.10.20.30.40.5
No.
Ove
rflo
w E
vent
s pe
r 10
year
s
0.00
Overflow volume exceeded (m3)
-0.5-0.4-0.3-0.2-0.1
00.10.20.30.40.5
No.
Ove
rflo
w E
vent
s pe
r 10
year
s
0.470.48
0.490.5 0.51
0.520.53
0.54
Annual Reuse (%)
0102030405060708090
100
Prob
abili
ty O
f Exc
eeda
nce
(%)
Export plots
MEDLI v2.0 - Summary Output Page 6 08/03/2016 11:17:00af2fa958-1ddd-462b-9b17-e0be68a7cc36
Scenario: Lindeman Island Resort.med Pond Nutrient BalancePE
RFO
RMAN
CEPond System Performance - Nutrient: 1 faculta ve pond
Pond System Nutrients and salt balance:
Nitrogen Balance (kg/year)
620.80In ow
Vola lisa on (0.00)
Sludge (0.00)
Over ow (0.00) 294.21
Irriga on
326.55Seepage
Delta Storage (0.03) Recycling: 0.00
OUTPUTSINPUTS
Name Value
Inflow 620.80
Recycling 0.00
Volatilisation 0.00
Sludge 0.00
Overflow 0.00
Irrigation 294.21
Seepage 326.55
Delta Storage 0.03
Phosphorus Balance (kg/year)
248.32In ow
Sludge (0.00)
Over ow (0.00) 117.68
Irriga on
130.62 Seepage
Delta Storage (0.01) Recycling: 0.00
OUTPUTSINPUTS
Name Value
Inflow 248.32
Recycling 0.00
Sludge 0.00
Overflow 0.00
Irrigation 117.68
Seepage 130.62
Delta Storage 0.01
Salt Balance (kg/year)
124159.69In ow
Sludge* (0.00)
Over ow (0.00) 58842.26
Irriga on
65310.95 Seepage
Delta Storage (6.48) Recycling: 0.00
OUTPUTSINPUTS
Name Value
Inflow 124159.69
Recycling 0.00
Sludge* 0.00
Overflow 0.00
Irrigation 58842.26
Seepage 65310.95
Delta Storage 6.48
* Salt removal in sludge is not calculated from the pond salt balance. However if salt could be assumed to be present in the sludgeat the same concentra on as in the pond supernatant (up to a maximum of salt added in in ow) - then salt accumula on in the sludge could be 0.00 kg/year
Pond System Sludge Accumula on: 0.00 kg dwt/year
MEDLI v2.0 - Summary Output Page 7 08/03/2016 11:17:00af2fa958-1ddd-462b-9b17-e0be68a7cc36

Scenario: Lindeman Island Resort.med Pond Nutrient Concentra onsPE
RFO
RMAN
CEPond System Performance - Nutrient: 1 faculta ve pond
Pond Nutrient Concentra ons and Salinity:Average across simulation period
Average nitrogen concentration of pond liquid (mg/L)Average phosphorus concentration of pond liquid (mg/L)Average salinity of pond liquid (dS/m)
Pond 14.531.811.42
Value on final day of simulation periodFinal nitrogen concentration of pond liquid (mg/L)Final phosphorus concentration of pond liquid (mg/L)Final salinity of pond liquid (dS/m)
Pond 14.361.741.36
MEDLI v2.0 - Summary Output Page 8 08/03/2016 11:17:00af2fa958-1ddd-462b-9b17-e0be68a7cc36

Scenario: Lindeman Island Resort.med Irriga onPE
RFO
RMAN
CEIrriga on Performance:
Water Use: (assumes 100% Irriga on E ciency)Pond water irrigated (m3/year) 65980.72Average Shandy water irrigation (m3/year) (minimum - maximum) 0.00 (0.00 - 0.00)Total water irrigated (m3/year) 65980.72Proportion of irrigation events requiring shandying (% of events) 0.00Proportion of years shandying water allocation of 0 m3/year is exceeded (% of years) 0.00Average exceedance as a proportion of annual shandy water allocation (% of allocation) (minimum - maximum)
0.00 (0.00 - 0.00)
Irriga on Quality:Average nitrogen concentration of irrigation water - before ammonia loss during irrigation (mg/L)
4.46
Average nitrogen concentration of irrigation water - after ammonia loss during irrigation (mg/L)
4.46
Average phosphorus concentration of irrigation water (mg/L) 1.78Average salinity of irrigation water (dS/m) 1.39
Irriga on Diagnos cs:Proportion of Days irrigation occurs (%) 1.00
MEDLI v2.0 - Summary Output Page 9 08/03/2016 11:17:00af2fa958-1ddd-462b-9b17-e0be68a7cc36

Scenario: Lindeman Island Resort.med Land Water BalancePE
RFO
RMAN
CELand Performance - Soil Water
Paddock: Nominated Irriga on Areas, 11.88 haSoil Type: Duplex 2, 76.00 mm PAWC at maximum root depth
Water Balance (mm/year): % Total inputsmm/year
1596.42
Rain
555.39
Irriga on
Delta Soil Water (0.76)
743.38
Soil Evapora on
465.20
Transpira on
572.53
Rain Runo
Irriga on Runo (3.31) 368.16
Deep Drainage
OUTPUTSINPUTS
Name Value
Rain 1596.42
Irrigation 555.39
Soil Evaporation 743.38
Transpiration 465.20
Rain Runoff 572.53Irrigation Runoff
3.31
Deep Drainage 368.16Delta Soil Water -0.76
Average Monthly Totals (mm): TableChart
RainIrrigationSoil EvapTranspn.Rain RunoffIrrigation RunoffDeep DrainageDelta Soil Water
Jan
Feb
Mar
Apr
May
Jun
Jul
Aug Se
p
Oct
Nov Dec
-50
0
50
100
150
200
250
300
mm
Total: 1596.42mm
Total: 555.39mmTotal: 743.38mmTotal: 465.20mmTotal: 572.53mm
Total: 3.31mmTotal: 368.16mmTotal: -0.76mm
Average Annual Totals (mm/year): TableChart
RainIrrigationSoil EvapTranspn.Rain RunoffIrrigation RunoffDeep DrainageDelta Soil Water
1965 1970
1975 1980
1985 1990
1995 2000
2005 2010
0
500
1000
1500
2000
2500
mm
/yea
r
MEDLI v2.0 - Summary Output Page 10 08/03/2016 11:17:00af2fa958-1ddd-462b-9b17-e0be68a7cc36

Scenario: Lindeman Island Resort.med Land Nutrient BalancePE
RFO
RMAN
CELand Performance - Soil Nutrient
Paddock: Nominated Irriga on Areas, 11.88 ha Soil Type: Duplex 2
Irriga on ammonium vola lisa on losses (kg/ha/year): 0.00Propor on of total nitrogen in irrigated e uent as ammonium (%): 0.20
Nitrogen Balance (kg/ha/year)
Seed (0.23)
24.77
Irriga on
96.16
Delta Soil N
Denitri ca on (1.41)
Irriga on Runo (0.07)
Rain Runo (0.00) 115.08
Uptake
Leached (4.59)
OUTPUTSINPUTS
Name Value
Seed 0.23
Irrigation 24.77
Denitrification 1.41
Irrigation Runoff
0.07
Rain Runoff 0.00Uptake 115.08Leached 4.59Delta Soil N -96.16
Phosphorus Balance (kg/ha/year)
Seed (0.03)
9.91
Irriga on
3.56Delta Soil P
Irriga on Runo (0.03)
Rain Runo (0.00)
13.12
Uptake
Leached (0.36)
OUTPUTSINPUTS
Name Value
Seed 0.03
Irrigation 9.91
Irrigation Runoff
0.03
Rain Runoff 0.00
Uptake 13.12
Leached 0.36
Delta Soil P -3.56
MEDLI v2.0 - Summary Output Page 11 08/03/2016 11:17:00af2fa958-1ddd-462b-9b17-e0be68a7cc36

Scenario: Lindeman Island Resort.med Paddock Nutrient ImpactPE
RFO
RMAN
CELand Performance - Soil Nutrient
Paddock: Nominated Irriga on Areas, 11.88 ha Soil Type: Duplex 2
Annual Nutrient Totals (kg/ha):
N irrigationN denitrifiedN removed by plantN irrigation runoffN leachedN organic storedN mineral storedP irrigationP removed by plantP irrigation runoffP leachedP storedTotal N deltaTotal P deltaTotal N storedP adsorbedP dissolved
1965 1970
1975 1980
1985 1990
1995 2000
2005 2010
0
500
1000
1500
2000
2500
3000
3500
4000
4500
Annual Nutrient Leaching Concentra on (mg/L):
Nitrate-NPhosphate-P
1965 1970
1975 1980
1985 1990
1995 2000
2005 2010
0
2
4
6
8
10
12
14
16
18
MEDLI v2.0 - Summary Output Page 12 08/03/2016 11:17:00af2fa958-1ddd-462b-9b17-e0be68a7cc36

Scenario: Lindeman Island Resort.med Crop Growth & UptakePE
RFO
RMAN
CEPlant Performance and Nutrients
Paddock: Nominated Irriga on Areas, 11.88 ha Soil Type: Duplex 2
Plant: Con nuous Blady Grass PastureAverage annual shoot dry matter yield (kg/ha/year) 10866.83 (5253.54 - 20597.28)Average monthly plant cover (%) (minimum - maximum) 0.33 (0.31 - 0.37)Average monthly root depth (mm) (minimum - maximum) 693.32 (668.82 - 733.90)
Nutrient Uptake (minimum - maximum):Average annual net nitrogen removed by plant uptake (kg/ha/year) 114.62 (29.91 - 381.93)Average annual net phosphorus removed by plant uptake (kg/ha/year) 13.05 (4.94 - 49.16)Average annual shoot nitrogen concentration (fraction dwt) 0.01 (0.01 - 0.02)Average annual shoot phosphorus concentration (fraction dwt) 0.001 (0.001 - 0.003)
Average Monthly Yield (kg/ha/year) and Plant Stresses TableChart
Nitrogen DeficiencyTemperature stressWater DeficiencyWaterloggingYield (Crop 1)Yield (Crop 2)
Jan
Feb
Mar
Apr
May
Jun
Jul
Aug Se
p
Oct
Nov Dec
0
0.10.20.30.40.50.60.70.80.9
1
Stre
ss In
dex
(1.0
= F
ull S
tres
s)
0
200
400
600
800
1000
1200
Aver
age
Mon
thly
DW
T Yi
eld
(kg/
ha/y
ear)
Average Annual Yield (kg/ha/year) and Plant Stresses TableChart
Nitrogen DeficiencyTemperature stressWater DeficiencyWaterloggingYield (Crop 1)Yield (Crop 2)
1965 1970
1975 1980
1985 1990
1995 2000
2005 2010 0
0.10.20.30.40.50.60.70.80.9
1
Stre
ss In
dex
(1.0
= F
ull S
tres
s)
0
5000
10000
15000
20000
Aver
age
Annu
al D
WT
Yiel
d (k
g/ha
/yea
r)
No. of harvests/year: 2.00 (normal), 0.36 (forced by crop death due to nitrogen stress (0.02), water stress (0.12), waterlogging (0.22))No. days without crop/year (days/year): 4.58 due to water stress (3.38), waterlogging (1.20)
MEDLI v2.0 - Summary Output Page 13 08/03/2016 11:17:00af2fa958-1ddd-462b-9b17-e0be68a7cc36

Scenario: Lindeman Island Resort.med Salinity ImpactPE
RFO
RMAN
CELand Performance
Paddock: Nominated Irriga on Areas, 11.88 ha Soil Type: Duplex 2
Plant: Con nuous Blady Grass PastureSalt tolerance Moderately tolerantSalinity threshold EC sat. ext. (dS/m) 1.50Proportion of yield decrease per dS/m increase (%/dS/m) 0.02No. years assumed for leaching to reach steady-state (years) 10.00
Soil Salinity:Salinity of infiltrated water (Average salinity of rainwater = 0.03 dS/m) (dS/m) 0.51Salt added by rainfall (kg/ha/year) 196.59Average annual effluent salt added & leached at steady state (kg/ha/year) 5135.33Average leaching fraction based on 10 year running averages (fraction) 0.44Average water-uptake-weighted rootzone salinity sat. ext. (dS/m) 0.52Salinity of the soil solution (at drained upper limit) at base of rootzone (dS/m) 2.18Relative crop yield expected due to salinity (%) 1.00Proportion of years that crop yields would be expected to fall below 90% of potential due to salinity (%)
0.00
Average Annual Rootzone Salinity and Rela ve Yield: TableChartAll values based on 10 year running averages
Weighted Average Rootzone Salinity sat. ext.
Salinity at Base of Rootzone
Relative Yield
0
0.5
1
1.5
2
2.5
Salin
ity (d
S/m
)
0
0.2
0.4
0.6
0.8
1
1.2
Rela
tive
Yiel
d (%
)
1965 1969
1973 1977
1981 1985
1989 1993
1997 2001
2005
MEDLI v2.0 - Summary Output Page 14 08/03/2016 11:17:00af2fa958-1ddd-462b-9b17-e0be68a7cc36

Scenario: Lindeman Island Resort.med ClimateDI
AGN
OST
ICS
Sustainability Diagnos cs: Lindeman Island Resort
Averaged Historical Climate Data Used in Simula on (mm)
Loca on: Lindeman, -20.45°, 149.05°
Run Period: 01/01/1965 to 31/12/2014 50 years, 0 days
-150-100-50
050
100150200250300350 Net Evap (Evap - Rain) Rain Evap (Pan evap x Pan coeff)
RainEvapNet EvapNet Evap/day
Jan235.5192.9-42.6-1.4
Feb315.0159.4
-155.7-5.5
Mar247.0166.0-81.0-2.6
Apr170.7139.6-31.0-1.0
May144.7118.6-26.1-0.8
Jun84.1
101.117.00.6
Jul56.0
111.355.31.8
Aug31.9
133.8101.9
3.3
Sep25.2
164.4139.2
4.6
Oct38.1
197.5159.3
5.1
Nov75.1
204.4129.3
4.3
Dec173.1210.537.51.2
Year1596.41899.4303.0
0.8
MEDLI v2.0 - Summary Output Page 15 08/03/2016 11:17:00af2fa958-1ddd-462b-9b17-e0be68a7cc36

Scenario: Lindeman Island Resort.med PondDI
AGN
OST
ICS
Sustainability Diagnos cs: Lindeman Island Resort
Pond System: 1 faculta ve pondNew Sewage Treatment Plant - 134631.74 m3/year or 368.61 m3/day generated on averageE uent entering pond system a er any pretreatment and recyclingAverage (Minimum-Maximum) in uent quality calculated for 365.24 non-zero ow days, a er any pretreatment and recycling.
Constituent Concentration (mg/L) Load (kg/year)Total Nitrogen 4.61 (0.70 - 5.00) 620.80 (620.39 - 622.09)Total Phosphorus 1.84 (0.28 - 2.00) 248.32 (248.16 - 248.84)Total Dissolved Salts 922.22 (139.44 - 1000.00) 124159.69 (124078.10 - 124418.04)Volatile Solids 0.00 (0.00 - 0.00) 0.00 (0.00 - 0.00)Total Solids 0.00 (0.00 - 0.00) 0.00 (0.00 - 0.00)
Last pond (Wet weather store): 15000.00 m3Theoretical hydraulic retention time (days) 40.69Average volume of overflow (m3/year) 0.00No. overflow events per year exceeding threshold* of 1.89 m3 (no./year) 0.00Average duration of overflow (days) 0.00Effluent Reuse (Proportion of Inflow + Net Rain Gain that is Irrigated) (%) 0.49Probability of at least 90% effluent reuse (%) 0.00Average salinity of last pond (dS/m) 1.42Salinity of last pond on final day of simulation (dS/m) 1.36Ammonia loss from pond system water area (kg/m2/year) 0.00
* The threshold is the volume equivalent to the top 1 mm depth of water of a full pond
Over ow exceedance: TableChart
-0.5-0.45-0.4
-0.35-0.3
-0.25-0.2
-0.15-0.1
-0.050
0.050.1
0.150.2
0.250.3
0.350.4
0.450.5
No.
Ove
rflo
w E
vent
s (e
vent
s/10
yea
rs)
0.00
Overflow Volume Exceeded (m3)
Export plot
MEDLI v2.0 - Summary Output Page 16 08/03/2016 11:17:00af2fa958-1ddd-462b-9b17-e0be68a7cc36
Scenario: Lindeman Island Resort.med Irriga onDI
AGN
OST
ICS
Sustainability Diagnos cs: Lindeman Island Resort
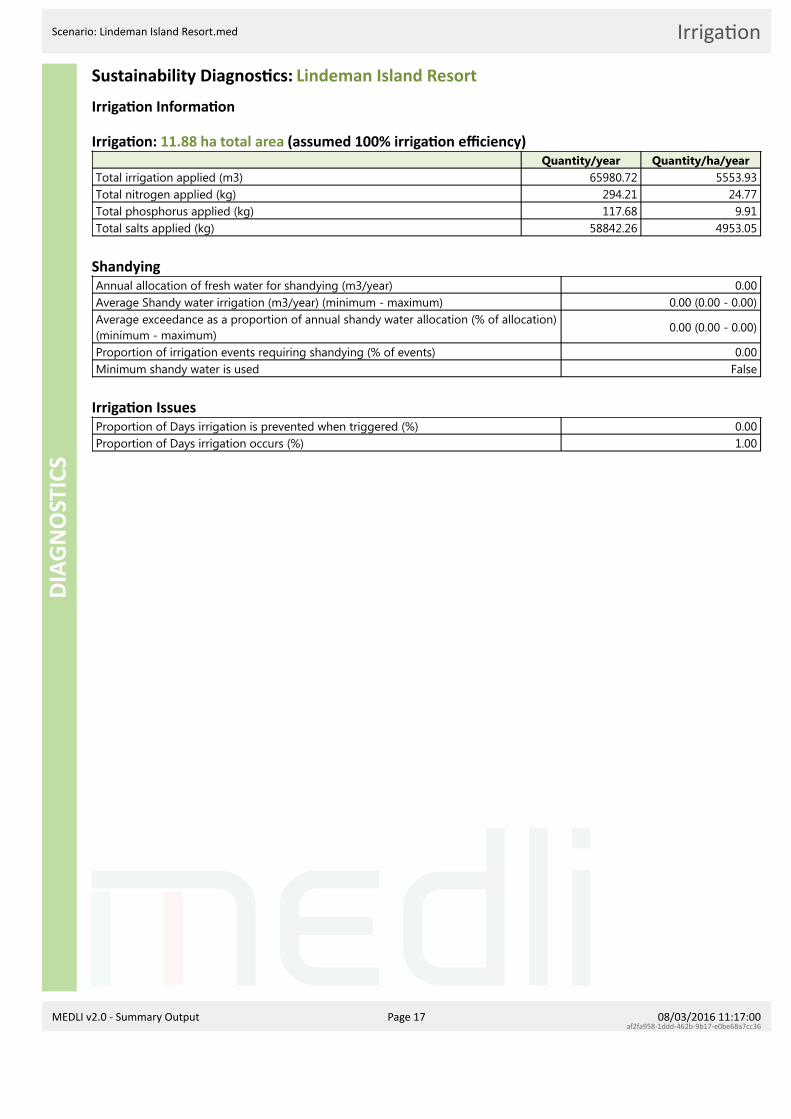
Irriga on Informa on
Irriga on: 11.88 ha total area (assumed 100% irriga on e ciency)Quantity/year Quantity/ha/year
Total irrigation applied (m3) 65980.72 5553.93Total nitrogen applied (kg) 294.21 24.77Total phosphorus applied (kg) 117.68 9.91Total salts applied (kg) 58842.26 4953.05
ShandyingAnnual allocation of fresh water for shandying (m3/year) 0.00Average Shandy water irrigation (m3/year) (minimum - maximum) 0.00 (0.00 - 0.00)Average exceedance as a proportion of annual shandy water allocation (% of allocation) (minimum - maximum)
0.00 (0.00 - 0.00)
Proportion of irrigation events requiring shandying (% of events) 0.00Minimum shandy water is used False
Irriga on IssuesProportion of Days irrigation is prevented when triggered (%) 0.00Proportion of Days irrigation occurs (%) 1.00
MEDLI v2.0 - Summary Output Page 17 08/03/2016 11:17:00af2fa958-1ddd-462b-9b17-e0be68a7cc36

Scenario: Lindeman Island Resort.med SoilDI
AGN
OST
ICS
Sustainability Diagnos cs: Lindeman Island Resort
Paddock Land: Nominated Irriga on Areas: 11.88 ha
Irriga on: Fixed Sprinkler with 0% ammonium loss during irriga onIrrigation triggered every 1 daysIrrigate a fixed amount of 5.00 mm each dayIrrigation window from 1/1 to 31/12 including the days specifiedA minimum of 0 days must be skipped between irrigation events
Soil Water Balance (mm): Duplex 2, 76.00 mm PAWC at maximum root depth
RainIrrigationSoil EvapTranspn.Rain RunoffIrr. RunoffDrainageDelta
Jan235.555.174.446.869.00.1
18.881.6
Feb315.059.877.340.7
149.50.3
26.181.0
Mar247.056.780.641.8
123.50.8
34.122.9
Apr170.749.870.937.165.00.8
35.011.8
May144.749.364.231.960.20.8
36.90.0
Jun84.143.255.025.025.30.2
36.0-14.2
Jul56.041.954.127.310.50.2
37.2-31.5
Aug31.939.149.833.71.10.0
36.7-50.3
Sep25.236.446.541.20.80.0
34.5-61.4
Oct38.137.951.543.00.40.0
32.3-51.2
Nov75.139.553.548.714.10.1
23.5-25.2
Dec173.146.665.648.053.20.1
17.135.7
Year1596.4555.4743.4465.2572.5
3.3368.2
-0.8
Soil Nitrogen BalanceAverage annual effluent nitrogen added (kg/ha/year) 24.77Average annual soil nitrogen removed by plant uptake (kg/ha/year) 115.08Average annual soil nitrogen removed by denitrification (kg/ha/year) 1.41Average annual soil nitrogen leached (kg/ha/year) 4.59Average annual nitrate-N loading to groundwater (kg/ha/year) 4.59Soil organic-N kg/ha (Initial - Final) 4620.00 - 68.63Soil inorganic-N kg/ha (Initial - Final) 257.10 - 0.25Average nitrate-N concentration of deep drainage (mg/L) 1.25Max. annual nitrate-N concentration of deep drainage (mg/L) 19.40
Soil Phosphorus BalanceAverage annual effluent phosphorus added (kg/ha/year) 9.91Average annual soil phosphorus removed by plant uptake (kg/ha/year) 13.12Dissolved phosphorus (kg/ha) (Initial - Final) 1.04 - 0.71Adsorbed phosphorus (kg/ha) (Initial - Final) 4991.83 - 4814.06Average phosphate-P concentration in rootzone (mg/L) 0.01Average phosphate-P concentration of deep drainage (mg/L) 0.10Max. annual phosphate-P concentration of deep drainage (mg/L) 0.10Design soil profile storage life based on average infiltrated water phosphorus concn. of0.63 mg/L (years)
295.74
MEDLI v2.0 - Summary Output Page 18 08/03/2016 11:17:00af2fa958-1ddd-462b-9b17-e0be68a7cc36

Scenario: Lindeman Island Resort.med Paddock Nutrient ImpactDI
AGN
OST
ICS
Sustainability Diagnos cs: Lindeman Island Resort
Paddock Land: Nominated Irriga on Areas: 11.88 ha
Irriga on: Fixed Sprinkler with 0% ammonium loss during irriga on
Annual nutrient leachate concentra on (mg/L)
1965 1970 1975 1980 1985 1990 1995 2000 2005 2010
2
4
6
8
10
12
14
16
18
Nitrate-N Phosphate-P
Annual Phosphate-P in soil (kg/ha)
1965 1970 1975 1980 1985 1990 1995 2000 2005 2010
500
1000
1500
2000
2500
3000
3500
4000
4500
P adsorbed P dissolved
MEDLI v2.0 - Summary Output Page 19 08/03/2016 11:17:00af2fa958-1ddd-462b-9b17-e0be68a7cc36

Scenario: Lindeman Island Resort.med PlantDI
AGN
OST
ICS
Sustainability Diagnos cs: Lindeman Island Resort
Paddock Plant Performance: Nominated Irriga on Areas: 11.88 ha
Average Plant Performance (Minimum - Maximum): Con nuous Blady Grass PastureAverage annual shoot dry matter yield (kg/ha/year) 10866.83 (5253.54 - 20597.28)Average monthly plant cover (%) 0.33 (0.31 - 0.37)Average monthly crop factor (fraction) 0.26 (0.24 - 0.29)Non-transpiring Cover Left after Harvest (%) 0.20Average monthly root depth (mm) 693.32 (668.82 - 733.90)Average number of normal harvests per year (no./year) 2.00 (0.00 - 4.00)Average number of normal harvests for last five years only (no./year) 0.80Average number of crop deaths per year (no./year) 0.36 (0.00 - 2.00)Average number of crop deaths for last five years only (no./year) 0.80Average annual nitrogen deficiency index (0 = no stress, 1 = full stress) (coefficient) 0.49 (0.05 - 0.78)Average January temperature stress index (0 = no stress, 1 = full stress) (coefficient) 0.00 (0.00 - 0.00)Average July temperature stress index (0 = no stress, 1 = full stress) (coefficient) 0.18 (0.04 - 0.38)Average monthly water stress index (0 = no stress, 1 = full stress) (coefficient) 0.05 (0.00 - 0.15)Average monthly waterlogging index (0 = no stress, 1 = full stress) (coefficient) 0.08 (0.00 - 0.21)No. days without crop/year (days) 4.58
Soil Salinity - Plant salinity tolerance: Moderately tolerantAssumes 1.0 dS/m Electrical Conduc vity = 640 mg/L Total Dissolved SaltsAll values based on 10 year running averagesSalinity of infiltrated water (Average salinity of rainwater = 0.03 dS/m) (dS/m) 0.51Salt added by rainfall (kg/ha/year) 196.59Average annual effluent salt added & leached at steady state (kg/ha/year) 5135.33Average leaching fraction based on 10 year running averages (fraction) 0.44Average water-uptake-weighted rootzone salinity sat. ext. (dS/m) 0.52Salinity of the soil solution (at drained upper limit) at base of rootzone (dS/m) 2.18Relative crop yield expected due to salinity (%) 1.00Proportion of years that crop yields would be expected to fall below 90% of potential due to salinity (%)
0.00
MEDLI v2.0 - Summary Output Page 20 08/03/2016 11:17:00af2fa958-1ddd-462b-9b17-e0be68a7cc36

Scenario: Lindeman Island Resort.med Run MessagesDI
AGN
OST
ICS
Run MessagesMessages generated when the scenario was run:Full run chosen
MEDLI v2.0 - Summary Output Page 21 08/03/2016 11:17:00af2fa958-1ddd-462b-9b17-e0be68a7cc36

Lindeman Island Great Barrier Reef Resort Project Stormwater Management Plan and Water Balance Modelling
Prepared for White Horse Australia Lindeman Pty Ltd Version 5 August 2016 Lindeman SMP and Water Balance v2.docx Commercial in Confidence Page 1
Water Infrastructure Assessment -Supporting Information
APPENDIX B Nominated Irrigation Areas

XNote: A safe harbour is no longer proposed.

Lindeman Island Great Barrier Reef Resort Project Stormwater Management Plan and Water Balance Modelling
Prepared for White Horse Australia Lindeman Pty Ltd Version 5 August 2016 Lindeman SMP and Water Balance v2.docx Commercial in Confidence Page 1
Water Infrastructure Assessment -Supporting Information
APPENDIX C Recycled Water Service Areas

XNote: A safe harbour is no longer proposed.
Lindeman Island Great Barrier Reef Resort Project Stormwater Management Plan and Water Balance Modelling
Prepared for White Horse Australia Lindeman Pty Ltd Version 5 August 2016 Lindeman SMP and Water Balance v2.docx Commercial in Confidence Page 1
Water Infrastructure Assessment -Supporting Information
APPENDIX D Proposed Water and Sewer Infrastructure

XNote: A safe harbour is no longer proposed.

XNote: A safe harbour is no longer proposed.

Note: A safe harbour is no longer proposed.
X