Embed Size (px)
Citation preview

IOSR Journal Of Environmental Science, Toxicology And Food Technology (IOSR-JESTFT)
e-ISSN: 2319-2402,p- ISSN: 2319-2399. Volume 6, Issue 2 (Sep. - Oct. 2013), PP 72-89 www.Iosrjournals.Org
www.iosrjournals.org 72 | Page
Environmental Impact from Lead-Zinc Mining and Lead-Arsenic
Toxicity Effects in Arufu Area, Ne Nigeria.
Ekeleme, I. A.1, Olorunyomi, A. E.
2 and Uzoegbu, M. U.
3
Petroleum Trust and Development Fund, Chair, Department of Geology and Mining, University of Jos, PMB
2084, Jos, Nigeria. Petroleum Trust and Development Fund, Chair, Department of Geology and Mining, University of Jos, PMB
2084, Jos, Nigeria.
Geology Programme, Abubakar Tafawa Balewa University, P. M. B 0248, Bauchi, Nigeria.
Abstract: The six Upper Cretaceous lithogenic formations that formed the stratigraphic succession in the Arufu
area are made up of Albian Arufu, Uomba and Gboko Formations i.e the Asu River Group. This is overlain by
the Cenomanian –Turonian Keana and Awe Formations and the Cenomanain –Turonian Ezeaku Formation.
The Ezeaku Formation is conterminous with the Konshisha River Group and the Wadata Limestone in the
Makurdi area. The aim of this investigation is to reveal the impact of lead-zinc mining and highlight the effects
of lead-arsenic to human health. Fifty soil and stream samples were analyzed using the Inductively Coupled
Plasma – Optical Emission Spectroscopy (ICP-OES) technique. The values for the concentrations of the three
elements ranges from; As (0 - 97.19ppm), Cd (0 - 4.653ppm), Pb (3.357 - 59660ppm). Multiple correlation and regression analysis of the geochemical data showed a relationship between Pb and As and significant
regression of Pb on As and Cd. Results of the Index of geoaccumulation (Igeo), Contamination Factor (CF) and
Degree of Contamination (Cdeg) indicate moderate to high Pb and As contamination. The values obtained
indicates As, Pb and Cd have concentrations above maximum permitted levels of 0.01ppm, 0.01ppm and
0.003ppm respectively in water for human consumption, and above the threshold of contamination of 15ppm
and 20ppm for As and Pb respectively. This suggests that more people will be at risk of pollutants as lead – zinc
exploitation proceeds. Lead and arsenic values15ppm and 20ppm were found exceeded the threshold 0.01ppm,
0.01ppm and 0.003ppm set by Standard Organization of Nigeria which is potentially highly toxic to biological
systems and in water for human consumption. Fresh and old mining sites across the area should be revisited
with the aim of assessing the level of environmental risk they pose to the health of the people in those
communities and putting up measures to contain it.
Keywords: Cretaceous, mining, lead-arsenic, contamination, concentration, toxic.
I. Introduction The studied area is characterized by low-lying topography with an average height of about 152m above
the sea level. The major river flowing through the area is the River Benue with its tributaries extending across
the area. The pattern of drainage within the area covered is dendritic. Due to alternating periods of rainfall and
dry seasons, most of the streams are seasonal; they overflow their banks during the raining season and become
dried during long dry season. The main tributary that drains the area is River Uchembe. The tributaries of this
river run in the southeast direction and are structurally controlled. The dominant rock type around Arufu are
sedimentary rocks of the Asu River Group formation with a few indications of the Keana Formation
characterized by coarse-grained sandstone and bands of shale in the area east of Arufu. Further down in the
southern and south-eastern parts of the area reveals more exposures of gneisses. However, extensive superficial
cover and poor exposures of the carbonate rocks made it difficult to establish the contact relationship pattern between the basement rocks and the Asu River Group.
Offodile (1976) work in the Upper, Middle and Lower Benue Trough reported that the area consists of
sediments of the Cretaceous age (136 ± 25 Ma) and surrounded by the Pan African Precambrian Basement
Complex (600 ± 150 Ma). He also observed that the region has three stratigraphical correlations; an upper or
northeastern region; middle Benue region or the Lafia-Muri area and the lower or southwestern part of Makurdi
(Fig. 2). He discussed the stratigraphic sequence of the Middle Benue trough under two sections of the
Cretaceous Age.
i. Lower Cretaceous (which is represented by the Asu River Group and consists of dark shales, siltstones and fine grained sandstones) passing upwards into shales and limestones of the Upper Albian substage.

Environmental Impact From Lead-Zinc Mining And Lead-Arsenic Toxicity Effects In Arufu Area, Ne
www.iosrjournals.org 73 | Page
ii Upper Cretaceous; which shows that the Asu River Group is immediately overlain by the Keana
Sandstones which consists mainly of poorly sorted felspathic, coarse grained, gritty, commonly arkosic,
pebbly sandstones.
The Middle Benue valley is subdivided into two parts which are: An Upper or northern part, which covers Bashar, Amar, Muri and Zurak areas and a Lower or Southern part which covers Lafia, Keana, Awe and Arufu
area (Cratchey and Jones, 1965). They suggested the stratigraphic sequence in the Middle Benue valley given in
Fig. 3.
Fig. 1: Geological map of Nigeria showing the studied location (modified from
Obaje, 2009)
Studied Area
Fig. 2: Geological map of the Benue Trough, showing the units of the Middle Benue and Upper Benue
subdivisions and lead-zinc occurrences. (modified from Cratchley and Jones, 1965 & Whiteman, 1982).
N

Environmental Impact From Lead-Zinc Mining And Lead-Arsenic Toxicity Effects In Arufu Area, Ne
www.iosrjournals.org 74 | Page
Fig. 3: Stratigraphic Sequence in the Middle Benue valley (After Cratchley and Jones, 1965)
GEOLOGICAL STAGES
MIDDLE BENUE
KEANA-AWE-ARUFU AREA BASHAR-MURI-AMAR AREA
Maastrichtian
?
Lafia Sandstone
?
Marine Deposits
Gombe sandstone
?
Kumberi Formation
Senonian
Campanian
Santonian
Coniacian
TuronianUpper
Lower
Cenomanian Transition Deposit “Passage beds”
Keana sandstone Muri sandstone
AlbianAsu River Group Marine deposits
Palaeozoic and Pre-Cambrian Crystalline Basement
They also recognized a transitional zone (beds) overlying the Keana sandstone. These transitional beds are
overlain by an unnamed marine formation consisting of shales, clays, siltstones and shelly limestones with some
coals. Farrington (1952) described the lead-zinc mineralization of the Abakaliki fold belt pointing to its close
association with the dioritic intrusive and albitized dolerites. He stated that the lead-zinc deposits are mainly
fracture filling veins which form parts of fractured or sheeted zones. Farrington (1952) summarized ore genesis
as follows for both Abakaliki and Benue areas:
i. Early intrusives are un-mineralized by sulphides (except for pyrite) but dolerites and porphyries are cut by
ore bearing veins.
ii. Dolerites are albitized suggesting that emanations were active shortly after emplacement.
iii. Mineralization and intrusion both favour anticlinical structures.
iv. Dioritic intrusions are commonly associated with lead-zinc veins. v. Mineralization west of Ishiagu is less than 4 miles from and at the same elevation as the base of mineralized
and unintruded sediments of Coniacian age.
He believed in a magmatic hydrothermal origin but Whiteman (1982) suggests the more likely sources
were hot brines which leached metals from sediments and Basement Complex. Some brine springs are known in
the Abakaliki area and in the Benue Trough to the northeast. Whiteman (1982) suggests that the igneous bodies,
because presumably they were warmer than the country rocks acted as sources of heat aiding movements of hot
brine mineralizing fluids, and eventually became the loci for mineralization. Olade (1976) thinks that the ore
solutions started as connate brines mobilized by geothermal heat from mantle plume activity during Cretaceous
rifting. These solutions were able to leach chlorides from the sediments and evaporites, as well as base metals
from clays and feldspars which combined with sulphur to form ores along permeable zones. Olade (1976)
suggested also that the age of the mineralization is pre-Turonian. He thinks that the lead-zinc ores occur mainly
in Albian sediments. Akande (1989) suggested a model which interpretes the Nigerian deposits in the Abakaliki, Ishiagu, Arufu–Akwana, Gombe and Zurak districts as distinct epigenetic ore bodies controlled by fractures
which were formed about ninety (90) million years ago. The model suggests that the primary ore target should
be the Asu River Group sediments in which the metal ore bodies are stratabound. Adikwu-Brown and Ogezi
(1991) reported the adverse effects of lead mining in the Upper Benue Trough. They observed that lead mines

Environmental Impact From Lead-Zinc Mining And Lead-Arsenic Toxicity Effects In Arufu Area, Ne
www.iosrjournals.org 75 | Page
pollute water sources in the area with cadmium. Lar and Sallau (2005) analyzed the trace elements in water and
stream sediments from the Keana brines field, middle Benue Trough. They indicated that high concentrations of
elements such as As, Pb, Ni and Cr were discovered in refined salt, while the concentration of Cd in well water was above WHO (World Health Organization) admissible limits. Ntekim (2008) carried out statistical analysis
of trace elements concentrations in shale and carbonate sediments in Guyuk, North-eastern Nigeria. They
observed that there are strong associations between trace elements such as Cu, Cr, Ni and Co and the process of
mineralization in the area. They also observed that the trace elements have potential for use as mineralization
indicators. This paper deals with determining the concentration of base metals (Pb, Ni, Cu,) in the soils and
stream sediments within the locality, highlighting the possible toxicity effects on man, animals and crops of the
area and to examine the mineralization potential of the area based on elemental analysis using ICP-OES.
II. Regional Geologic Setting The Benue Trough of Nigeria is a rift basin in central West Africa that extends NNE – SSW for about
800 Km in length and 150 Km in width. The southern limit is the northern boundary of the Niger Delta, while
the northern limit is the southern boundary of the Chad Basin (Fig. 4).
The trough contains up to 6000m of Cretaceous – Tertiary sediments of which those predating the mid-
Santonian have been compressionally folded, faulted, and uplifted in several places. Compressional folding
during the mid-Santonian tectonic episode affected the whole of the Benue Trough and was quite intense,
producing over 100 anticlines and synclines (Benkhelil, 1989).The Benue Trough is arbitrarily subdivided into a
Lower, Middle and Upper portions (Fig. 1). No concrete line of subdivision can be drawn to demarcate the
individual portions, but major localities (towns/settlements) that constitute the depocentres of the different
portions have been well documented (Obaje, 2009). The depocentres of the Lower Benue Trough comprised
mainly the areas around Nkalagu and Abakaliki, while those of the Anambra Basin centre are around Enugu, Awka and Okigwe. The Middle Benue Trough comprises the areas from Makurdi through Yandev, Lafia, Obi,
Jangwa to Wukari. In the Upper Benue Trough, the depocentres comprise Pindiga, Gombe, Nafada, Ashaka (in
the Gongola arm) and Bambam, Tula, Jessu, Dukul, Numanha (in the Yola arm), (Obaje, 2009).
In the Middle Benue Trough, around the Obi/Lafia area, six Upper Cretaceous lithogenic formations
comprise the stratigraphic succession (Fig. 5). This succession is made up of Albian Arufu, Uomba and Gboko
Formations, generally referred to as the Asu River Group (Offodile, 1976; Nwajide, 1990). These are overlain
by the Cenomanian –Turonian Keana and Awe
Formations and the Cenomanain –Turonian Ezeaku Formation. The Ezeaku Formation is coterminous with the
Konshisha River Group and the Wadata Limestone in the Makurdi area. The Late Turonian-Early Santonian
coal-bearing Awgu Formation lies conformably on the Ezeaku Formation. In the Makurdi area, the Makurdi

Environmental Impact From Lead-Zinc Mining And Lead-Arsenic Toxicity Effects In Arufu Area, Ne
www.iosrjournals.org 76 | Page
Sandstone interfingers with the Awgu Formation. The mid-Santonain was a period of folding throughout the
Benue Trough. The post-folding Campano-Maastrichtian Lafia Formation ended the sedimentation in the
Middle Benue Trough, after which widespread volcanic activities took over in the Tertiary.
The entire area reveals that the northern parts of Arufu have few outcrops of gneiss inliers which form a part of
the Pan-African basement. The dominant rock types around Arufu are sedimentary
Fig. 5: Stratigraphic successions in the Middle Benue Trough (After Obaje, 2009)
Fig. 6: Local geology in the Arufu and Akwana areas (After Akande, 1988)
To
Wukari
To
Makurdi
To
Abedi

Environmental Impact From Lead-Zinc Mining And Lead-Arsenic Toxicity Effects In Arufu Area, Ne
www.iosrjournals.org 77 | Page
rocks of the Asu River Group formation with a few indications of the Keana Formation characterized by coarse-
grained sandstone and bands of shale in the area east of Arufu. However, further down in the southern and
south-eastern parts of the studied area reveals more exposures of Gneisses (Fig. 6). The purpose of this paper is to reveal the impact of lead-zinc mining and highlight the effects of lead-arsenic to human health.
III. Materials And Methods The sampling intensity varied; at least three samples were obtained from most of the sample locations
at intervals of 2m to 6m and five samples around mineralized veins or mine sites at intervals of 50cm, 1m, 4m,
20m and 75m respectively. The stream sediment samples were taken at the base of dried stream and at about
30cm to 50cm from the edge of the streams.
Precautions were taken to minimize contamination of samples during collection, preparation and
analysis. Photographs of features as well as structural measurements were taken and all the observations and data obtained were recorded. The structural elements measured are mineralized veins and joints in altered
carbonates, foliations and quartz veins in the gneisses. The collected samples were dried in the oven easy
disintegrated to allow for homogenization. The samples were disintegrated using mortar and pestle which were
properly cleaned with distilled water, methylated spirits and tissue paper in between each sample to prevent
contamination. The fine powdery products were packed in labelled air-tight sample bags for easy identification. The collected and prepared samples were forwarded to the Geochemistry Laboratory of the Department of
Geology and Mining, University of Jos for analyses. A total of 50 soil samples were analyzed for Lead, Arsenic
and Cadmium using the ICP-OES machine. The disintegrated samples were decomposed using aqua regia. The
conventional aqua regia digestion procedure consists of digesting soil samples on a hotplate with a 3:1 mixture
of HCl and HNO3. The nitric acid reacts with concentrated HCl to form aqua regia (nitrosyl chloride and
chlorine): HNO3 (aq) + 3 HCl (aq) → NOCl (g) + Cl2 (g) + 2 H2O (l). The digested samples were then analyzed
using the Inductively Coupled Plasma - Optical Emission Spectroscopy (ICP-OES) machine. With the ICP-OES
multi-element capabilities were detected.
IV. Results And Discussion A total of 50 soil samples analyzed for the three elements (Table 1). The concentrations for the
selected elements ranges with As(0 - 97.19ppm), Cd(0 - 4.653ppm), Pb(3.357 - 59660ppm). The mean values
are 9.072, 0.227 and 3656.7 respectively. The multiple correlation and regression values are used to show the
relationships between concentrations of the different elements in the samples as well as detect the variation in
their concentration with respect to that of lead (Pb). Regression of lead against three elements arsenic and
cadmium reveals significant regression of lead on arsenic and cadmium as 0.0000 and 0.0149 values
respectively. Other elements show values higher than the acceptable 0.05 significant levels (Fig. 7). The correlation of lead against other elements is generally low with the exception of arsenic. This may indicate some
sorts of geochemical restrictions on distribution and concentrations of the elements. It is also significant
considering that the elements associated with lead – zinc mineralization are arsenic, silver, gold,
Sample Name
As (ppm) Cd (ppm) Pb (ppm)
As
Cd Pb
Ar1 (0.5m) 0.0 0.0 802.8
0.0 0.0 6.7
Ar1 (3m) 0.0 4.7 797.4
0.0 1.7 6.7
Ar1 (6m) 15.9 1.7 1774.0
2.8 1.0 7.5
Ar2 (S3) 0.0 1.4 274.4
0.0 0.9 5.6
Ar2 (S2) 0.0 1.8 109.0
0.0 1.0 4.7
Ar3 0.0 0.0 124.2
0.0 0.0 4.8
Ar4 (S1) 0.0 0.0 66.3
0.0 0.0 4.2
Ar4 (S3) 18.9 0.0 57.6
3.0 0.0 4.1
Ar6 0.0 0.0 41.4
0.0 0.0 3.7
Ar8 (3m) 74.7 0.0 47790.0
4.3 0.0 10.8
Ar8 (5m) 70.1 0.2 59660.0
4.3 0.2 11.0
Ar8 (0.5m) 62.2 0.6 44480.0
4.1 0.5 10.7
Ar9 1.7 0.0 79.2
1.0 0.0 4.4
Ar10 (1m) 0.0 0.0 256.6
0.0 0.0 5.6
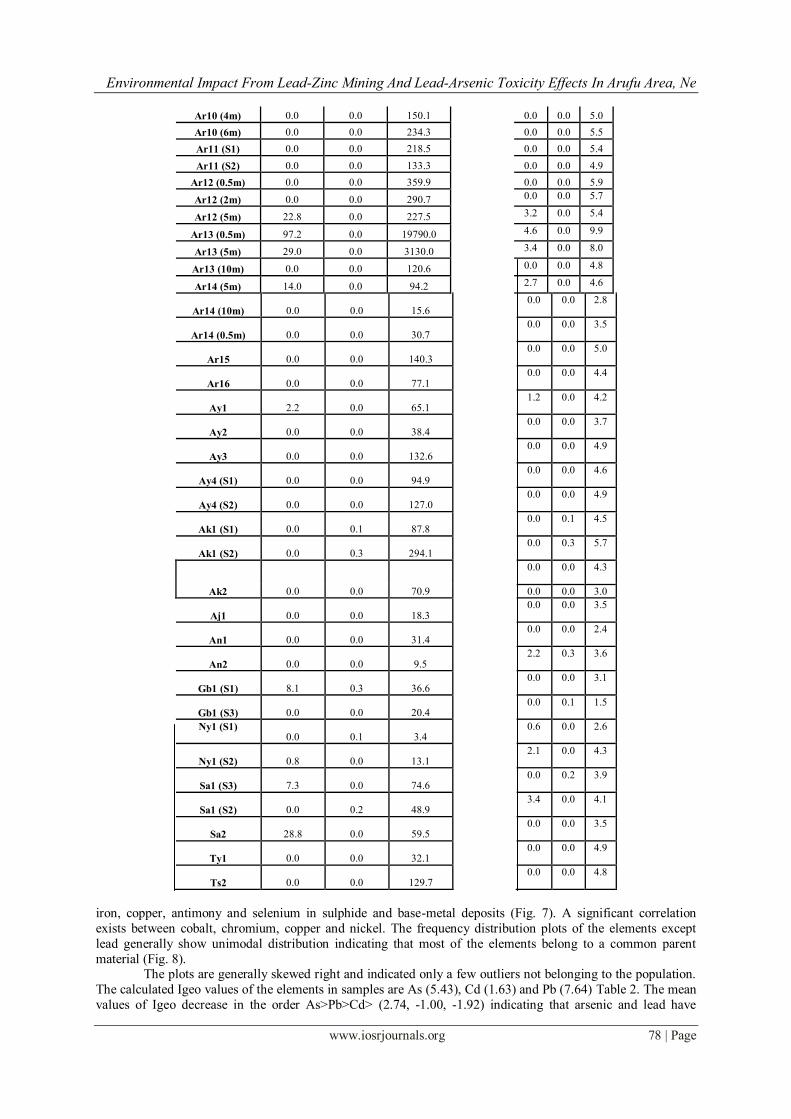
Table 1: Results of the Sample (A) and Statistical (B) data of 50 soil samples from the studied area
A B
Environmental Impact From Lead-Zinc Mining And Lead-Arsenic Toxicity Effects In Arufu Area, Ne
www.iosrjournals.org 78 | Page
Ar10 (4m) 0.0 0.0 150.1
0.0 0.0 5.0
Ar10 (6m) 0.0 0.0 234.3
0.0 0.0 5.5
Ar11 (S1) 0.0 0.0 218.5
0.0 0.0 5.4
Ar11 (S2) 0.0 0.0 133.3
0.0 0.0 4.9
Ar12 (0.5m) 0.0 0.0 359.9
0.0 0.0 5.9
Ar12 (2m) 0.0 0.0 290.7
0.0 0.0 5.7
Ar12 (5m) 22.8 0.0 227.5
3.2 0.0 5.4
Ar13 (0.5m) 97.2 0.0 19790.0
4.6 0.0 9.9
Ar13 (5m) 29.0 0.0 3130.0
3.4 0.0 8.0
Ar13 (10m) 0.0 0.0 120.6
0.0 0.0 4.8
Ar14 (5m) 14.0 0.0 94.2
2.7 0.0 4.6
Ar14 (10m) 0.0 0.0 15.6
0.0 0.0 2.8
Ar14 (0.5m) 0.0 0.0 30.7
0.0 0.0 3.5
Ar15 0.0 0.0 140.3
0.0 0.0 5.0
Ar16 0.0 0.0 77.1
0.0 0.0 4.4
Ay1 2.2 0.0 65.1
1.2 0.0 4.2
Ay2 0.0 0.0 38.4
0.0 0.0 3.7
Ay3 0.0 0.0 132.6
0.0 0.0 4.9
Ay4 (S1) 0.0 0.0 94.9
0.0 0.0 4.6
Ay4 (S2) 0.0 0.0 127.0
0.0 0.0 4.9
Ak1 (S1) 0.0 0.1 87.8
0.0 0.1 4.5
Ak1 (S2) 0.0 0.3 294.1
0.0 0.3 5.7
Ak2 0.0 0.0 70.9
0.0 0.0 4.3
0.0 0.0 3.0
Aj1 0.0 0.0 18.3
0.0 0.0 3.5
An1 0.0 0.0 31.4
0.0 0.0 2.4
An2 0.0 0.0 9.5
2.2 0.3 3.6
Gb1 (S1) 8.1 0.3 36.6
0.0 0.0 3.1
Gb1 (S3) 0.0 0.0 20.4
0.0 0.1 1.5
Ny1 (S1) 0.0 0.1 3.4
0.6 0.0 2.6
Ny1 (S2) 0.8 0.0 13.1
2.1 0.0 4.3
Sa1 (S3) 7.3 0.0 74.6
0.0 0.2 3.9
Sa1 (S2) 0.0 0.2 48.9
3.4 0.0 4.1
Sa2 28.8 0.0 59.5
0.0 0.0 3.5
Ty1 0.0 0.0 32.1
0.0 0.0 4.9
Ts2 0.0 0.0 129.7
0.0 0.0 4.8
iron, copper, antimony and selenium in sulphide and base-metal deposits (Fig. 7). A significant correlation
exists between cobalt, chromium, copper and nickel. The frequency distribution plots of the elements except
lead generally show unimodal distribution indicating that most of the elements belong to a common parent
material (Fig. 8). The plots are generally skewed right and indicated only a few outliers not belonging to the population.
The calculated Igeo values of the elements in samples are As (5.43), Cd (1.63) and Pb (7.64) Table 2. The mean
values of Igeo decrease in the order As>Pb>Cd> (2.74, -1.00, -1.92) indicating that arsenic and lead have

Environmental Impact From Lead-Zinc Mining And Lead-Arsenic Toxicity Effects In Arufu Area, Ne
www.iosrjournals.org 79 | Page
significant concentrations. This is buttressed by the Contamination Factor (CF) which shows mean values
decrease in the order Pb>As> Cd (298, 65, 5) Table 2. The mean values also decreases in the same order as
18.29>6.05>0.15. The degree of contamination (Cdeg) ranges from 0.086 to 345.7 with mean value of 26.16 indicating a low to moderate degree of contamination. However, high degree of contamination is observed in the
immediate vicinity of the Arufu village with peak values greater than 200 Cdeg.
Statistical analyses which involve histogram and cumulative frequency plots, correlation and regression
analysis were carried out on the result obtained from the laboratory. Furthermore, quantification of
contamination indices such as contamination factor (CF) and Index of geoaccumulation (Igeo) were used to
determine the relationships in the concentrations and distribution patterns of the elements analyzed which will
help in the interpretation of results obtained.
Statistical analyses which involve histogram and cumulative frequency plots and regression analysis
were carried out (Table 1). Further quantification of contamination indices such as contamination factor (CF)
and Index of geoaccumulation (Igeo) were also undertaken (Table 2). The aim was to see if there are
relationships in the concentrations and distribution patterns of the elements analyzed which will help to adequately interpret the result.
Table 2: Results of the Index of geoaccumulation (IGEO), Contamination Factor (CF) and
Contamination Degree (Cdeg).
Igeo CF Cdeg
(Total)
Sample
Location As Cd Pb As Cd Pb
Ar1 (0.5m) - - 1.4 0.0 0.0 4.0 4.0
Ar1 (3m) - 1.6 1.4 0.0 4.7 4.0 8.7
Ar1 (6m) 2.8 0.2 2.6 10.6 1.7 8.9 21.2
Ar2 (S3) - -0.1 -0.1 0.0 1.4 1.4 2.8
Ar2 (S2) - 0.2 -1.5 0.0 1.8 0.5 2.4
Ar3 - - -1.3 0.0 0.0 0.6 0.6
Ar4 (S1) - - -2.2 0.0 0.0 0.3 0.3
Ar4 (S3) 3.1 - -2.4 12.6 0.0 0.3 12.9
Ar6 - - -2.9 0.0 0.0 0.2 0.2
Ar8 (3m) 5.1 - 7.3 49.8 0.0 239.0 288.8
Ar8 (5m) 5.0 -2.6 7.6 46.7 0.2 298.3 345.2
Ar8 (0.5m) 4.8 -1.4 7.2 41.4 0.6 222.4 264.4
Ar9 -0.4 - -1.9 1.1 0.0 0.4 1.5
Ar10 (1m) - - -0.2 0.0 0.0 1.3 1.3
Ar10 (4m) - - -1.0 0.0 0.0 0.8 0.8
Ar10 (6m) - - -0.4 0.0 0.0 1.2 1.2
Ar11 (S1) - - -0.5 0.0 0.0 1.1 1.1
Ar11 (S2) - - -1.2 0.0 0.0 0.7 1.1
Ar12 (0.5m) - - 0.3 0.0 0.0 1.8 1.8
Ar12 (2m) - - 0.0 0.0 0.0 1.5 1.5
Ar12 (5m) 3.3 - -0.4 15.2 0.0 1.1 16.3
Ar13 (0.5m) 5.4 - 6.0 64.8 0.0 99.0 163.8
Ar13 (5m) 3.7 - 3.4 19.4 0.0 15.7 35.1
Ar13 (10m) - - -1.3 0.0 0.0 0.6 0.6
Ar14 (5m) 2.6 - -1.7 9.4 0.0 0.5 9.9
Ar14 (10m) - - -4.3 0.0 0.0 0.1 0.1
Ar14 (0.5m) - - -3.3 0.0 0.0 0.2 0.2
Ar15 - - -1.1 0.0 0.0 0.7 0.7
Ar16 - - -2.0 0.0 0.0 0.4 0.4
Ay1 0.0 - -2.2 1.5 0.0 0.3 1.8
Ay2 - - -3.0 0.0 0.0 0.2 0.2
Ay3 - - -1.2 0.0 0.0 0.7 0.7
Ay4 (S1) - - -1.7 0.0 0.0 0.5 0.5
Ay4 (S2) - - -1.2 0.0 0.0 0.6 0.6
Ak1 (S1) - -4.2 -1.8 0.0 0.1 0.4 0.5
Ak1 (S2) - -2.4 0.0 0.0 0.3 1.5 1.8
Ak2 - - -2.1 0.0 0.0 0.4 0.4

Environmental Impact From Lead-Zinc Mining And Lead-Arsenic Toxicity Effects In Arufu Area, Ne
www.iosrjournals.org 80 | Page
Aj1 - - -4.0 0.0 0.0 0.1 0.1
An1 - - -3.3 0.0 0.0 0.2 0.2
An2 - - -5.0 0.0 0.0 0.0 0.0
Gb1 (S1) 1.8 -2.2 -3.0 5.4 0.3 0.2 5.9
Gb1 (S3) - -5.1 -3.9 0.0 0.0 0.1 0.1
Ny1 (S1) - -4.6 -6.5 0.0 0.1 0.0 0.1
Ny1 (S2) -1.5 - -4.5 0.5 0.0 0.1 0.6
Sa1 (S3) 1.7 - -2.0 4.9 0.0 0.4 5.3
Sa1 (S2) - -2.6 -2.6 0.0 0.2 0.2 0.4
Sa2 3.7 - -2.3 19.2 0.0 0.3 19.5
Ty1 - - -3.2 0.0 0.0 0.2 0.2
Ts2 - - -1.2 0.0 0.0 0.6 0.6
Ts1 - - -1.3 0.0 0.0 0.6 0.6
Fig. 7: Chart reflecting the result of Regression analysis indicating the relationship between As, Cd and
Pb across the area.

Environmental Impact From Lead-Zinc Mining And Lead-Arsenic Toxicity Effects In Arufu Area, Ne
www.iosrjournals.org 81 | Page
0 1 2 3 4 5
0
5
10
15
20
25
30
35
Freq
uenc
y
As (natural log)ppm
As (conc.)
-0.2 0.0 0.2 0.4 0.6 0.8 1.0 1.2 1.4 1.6 1.8
0
10
20
30
40
Freq
uenc
y
Cd (natural log)ppm
Cd (conc.)
2 4 6 8 10 12
0
5
10
15
20
Freq
uenc
y
Pb (natural log)ppm
Pb(conc.)
Fre
qu
ency
Base Metals
Geochemical maps for the area are presented below in form of contours. The purpose is to indicate the
distribution and concentrations of each of the elements analyzed in the area.
Arsenic
Arsenic concentrations within the studied area (Table 1) range from 0 to 97.19ppm with a mean value
of 9.072ppm. Forty (40) of the samples (representing 80%) have values within the range of 0 and 10ppm.
Samples with greater than average arsenic content were those around mine pits. There was a positive correlation between the concentration of Arsenic and Lead. The bivariate scatter
plot (Fig. 7) also predicts that with increasing concentration of arsenic in the study area, more lead will be
discovered. The geochemical map indicates the distribution and concentration of arsenic the studied area (Fig.
9). The value of the Igeo 5.43 (Table 2) showed moderate to high contaminations of arsenic in soils around areas
where active mining is going on or have been done over the years. This is also supported by the result obtained
from the calculation of the contamination factor 6.05 (Table 2) which shows very high contamination factor
(Fig. 10). Most environmental arsenic problems are the result of mobilization under natural conditions.
However, man through mining activity has added more arsenic problem to the area. Mining-related arsenic
problems in water and the environment have been identified in many parts of the world, including Ghana,
Greece, Thailand and the USA (Smedley and Kinniburgh, 2002). Arsenic occurs as a major constituent in more
than 200 minerals, including elemental arsenic, arsenides, sulphides and oxides. The greatest concentrations of
these minerals occur in mineralized areas. As the chemistry of arsenic follows closely that of sulphur, the greatest concentrations of the element tend to occur in sulphide minerals of which pyrite is the most abundant
(Smedley and Kinniburgh, 2002). Arsenic is present in the crystal structure of many sulphide minerals as a
substitute for Sulphur. Arsenic can also substitute for Si4+, Al3+, Fe3+ and Ti4+ in many mineral structures and is
present in other rock-forming minerals at much lower concentrations. Carbonate minerals usually contain less
Fig. 8: Frequency distribution of Base metal values

Environmental Impact From Lead-Zinc Mining And Lead-Arsenic Toxicity Effects In Arufu Area, Ne
www.iosrjournals.org 82 | Page
than 10ppm arsenic. Arsenic concentrations in igneous rocks are generally low. Ure and Berrow (1982) quoted
an average value of 1.5ppm for all igneous rock types (undistinguished). Arsenic concentrations in metamorphic
rocks tend to reflect the concentrations in their igneous and sedimentary precursors. Most contain around 5ppm or less. Pelitic rocks (slates, phyllites) typically have the highest concentrations with an average value of 18ppm.
The concentration of arsenic in sedimentary rocks is typically in the range 5-10 ppm (Wester, 1999). The
background level in top-soils is typically low, but generally higher than that of the parent material (Norrish,
1975) and occasionally exceeds the threshold of contamination of 15 ppm as given by the NRCC (National
Research Council of Canada) (NRCC, 1978b). Arsenic minerals and compounds are soluble, but there is limited
movement of arsenic in soil because it is absorbed by hydroxides, clays and organic matter (Kabata-Pendias and
Pendias, 1992), and retained by iron oxides (Norrish, 1975). Therefore, its mobility is highest in sandy soils and
lowest in fine textured soils and those high in iron (NRCC, 1978)
Arsenic concentrations much higher than baseline values have been found in sediments and soils
contaminated by the products of mining activity, including mine tailings and effluent. Concentrations in tailings
piles and tailings-contaminated soils can reach up to several thousand ppm. Humans can be exposed to arsenic through ingestion of arsenic-containing water, food, and drugs (such as Fowler’s solution containing 1% of
potassium arsenite used to treat psoriasis and arsenic trioxide used to treat leukemia). Airborne arsenic can be
absorbed into the bloodstream in workers involved in the processing of copper, gold, and lead ores; in the
production and use of arsenic-containing pesticides. Water contamination is the most common source of arsenic
exposure (Weinstein, 1997). Of concern today are the skin lesions and cancers observed
Fig. 9: The distribution and concentration of Arsenic distribution in the area.
524000 525000 526000 527000 528000 529000 530000 531000
860000
861000
862000
863000
864000
865000
866000
867000
868000
869000
0 1000 2000 3000 4000
-1
-0.6
-0.2
0.2
0.6
1
1.4
1.8
2.2
2.6
3
3.4
3.8
4.2
Fig. 4.2: Arsenic distribution Map
Ajimi
Tsejombo
Ijoho
Tyoban
Tsevii
Adodo
Gbelem
Tsegen
Anyiin
Tseuper
ARUFU
N

Environmental Impact From Lead-Zinc Mining And Lead-Arsenic Toxicity Effects In Arufu Area, Ne
www.iosrjournals.org 83 | Page
Fig. 10: The Arsenic contamination map for (a) IGEO and (b) CF values
among the millions of people drinking arsenic-rich well water, especially in West Bengal and Bangladesh.
Chronic arsenic poisoning may affect many organ systems. For example, in affected
populations in Taiwan and India, ingestion of drinking water high in arsenic has been associated with a variety
of skin lesions, which include increased or decreased pigmentation and keratosis. Gangrene has also been
reported (blackfoot disease). The carcinogenic role of arsenic has been suggested in a range of studies: exposure
increases the risk of cancer of the skin, lung, liver, bladder, and kidneys (Weinstein, 1997). In recent years,
long-term exposure to arsenic from drinking water has also been found to be highly associated with
hypertension and diabetes mellitus (Tseng, 1999). The maximum permitted concentration of arsenic in drinking water is 0.01 mg/L (≈ 0.01 ppm). Arsenic is not a requirement for animals or humans. It can be toxic to
plants in leaf concentrations of 5-20 ppm (dry weight basis) with symptoms including wilting, reduced growth
and root discolouration (Kabata-Pendias and Pendias, 1992). It is unlikely that phytotoxic arsenic levels will
result in the poisoning of consumers because plants will cease to grow if roots have absorbed too much arsenic,
and fruits and seeds will not have elevated levels (NRCC, 1978).
Cadmium
Cadmium concentrations within the study area (Table 1) range from 0 to 4.653ppm with a mean value
of 0.227ppm. This is also reflected by the bivariate scatter plot (Fig. 7). The geochemical map indicates the
distribution and concentration of cadmium the studied area (Fig.11). The value of the Igeo 1.63 (Table 2)
showed that the soils have low to moderate levels of contamination. This is also supported by the result obtained from the calculation of the contamination factor 5.00 (Table 2) which indicated low to moderate contamination
factor (Figs. 12).
A
B

Environmental Impact From Lead-Zinc Mining And Lead-Arsenic Toxicity Effects In Arufu Area, Ne
www.iosrjournals.org 84 | Page
Fig. 11: The distribution and concentration of Cadmium distribution in the area.
524000 525000 526000 527000 528000 529000 530000 531000
860000
861000
862000
863000
864000
865000
866000
867000
868000
869000
-0.1
0
0.1
0.2
0.3
0.4
0.5
0.6
0.7
0.8
0.9
0 1000 2000 3000 4000
Ajim
i
Tsejom
bo
Ijoho
Tyoban
Tsevii
Adodo
Gbelem
Tsegen
Anyiin
Tseupe
r
ARUFU
N

Environmental Impact From Lead-Zinc Mining And Lead-Arsenic Toxicity Effects In Arufu Area, Ne
www.iosrjournals.org 85 | Page
Fig. 12: The Cadmium contamination map for (a) IGEO and (b) CF values
The samples from locations Ar1 and Ar2 in particular, indicate moderate levels of contamination. This raises
health concerns about the inhabitants of the area considering that the maximum level of Cadmium permitted in
water for human consumption is 0.003 mg/L (≈0.003 ppm). Cadmium is present mainly in organic-rich shales
(0.22-0.30 ppm), and in igneous rocks. It is highest in mafic units (0.13-0.22 ppm) (Kabata-Pendias and
Pendias, 1992). Cadmium can be found primarily in sulphide minerals such as sphalerite and pyrite. Upon
weathering, these minerals will release Cd2+ into solution. It is in this form that Cadmium is taken up by plants,
although content in solution will be low, as Cd2+ will form complex ions and organic chelates in soil. Its
mobility will then be controlled primarily by pH and redox potential (Kabata-Pendias and Pendias, 1992).
Cadmium is most mobile at pH 4.5-5.5 (Kabata-Pendias and Pendias, 1992). With no known biological
functions, the main concern regarding cadmium is its role as a toxicant. It can rapidly accumulate in livestock and other animals, particularly in kidneys and other organs, creating a potential hazard for human consumption
(CCREM, 1995). Cadmium is phytotoxic at leaf levels of 5- 30 ppm (Kabata-Pendias and Pendias, 1992) but it
can accumulate within edible portions of the plant to sub-toxic levels without resulting in any plant distress
(Alloway, 1990). Cadmium can be taken up by plants through leaves or roots but soluble soil Cd is readily
available (Kabata-Pendias and Pendias, 1992) and it is thought that this is the main source of plant Cd (FAO,
1992). Actual phytotoxicity can occur on polluted soils, but it is rare (Alloway, 1990), and Cadmium is
generally not harmful to plants (FAO, 1992). Accumulation of Cadmium in animals can cause disease if it
replaces Zinc in enzymes; symptoms of toxicity include renal degradation, emphysema, intestinal dysfunctions
and anaemia (Lagerwerff, 1972). Cadmium is known to be more toxic to an animal if dietary calcium is low
(CCREM, 1995).
Lead
Lead concentrations within the study area (Table 1) range from 3.357 to 59660ppm with a mean value
of 3656.7ppm. Arsenic concentrations show a strong correlation with the concentrations of Lead. This is also
indicated in the bivariate scatter plot (Fig. 7). The geochemical map indicates the distribution and concentration
of cadmium the studied area (Fig. 13). The values of the Igeo 7.64 (Table 2) for samples around mining sites
show a range from moderate to extreme lead contamination. This is corroborated by the result obtained from the
calculation of the contamination factor 18.29 (Table 2) which shows moderate to very high contamination factor
(Figs. 14). Those used as control samples obtained from other locations around shows they are largely
uncontaminated.
Lead occurs as a sulphide in rocks and replaces K, Ba, Sr and Ca in minerals (Norrish, 1975). The
largest presence of lead occurs in argillaceous sediments (20-40 ppm) and shales (18-25 ppm), but amounts are
also high in felsic rocks (15-24 ppm). The overall range of lead in world soils is 3-189 ppm with a range in
A
B

Environmental Impact From Lead-Zinc Mining And Lead-Arsenic Toxicity Effects In Arufu Area, Ne
www.iosrjournals.org 86 | Page
means of 10-67 ppm and an overall average level of 32 ppm (Kabata-Pendias and Pendias, 1992). A threshold of
contamination of 20 ppm has been suggested based on the low lead levels found in Alaskan soils (range of
means: 22-28 ppm) (Kabata- Pendias and Pendias, 1992). Least mobile of the heavy metals, lead accumulates in the surface horizons of soils and is not usually
leached (Davies, 1990). Its concentration in solution is low, and this limited amount is available for plant uptake
(Davies, 1990). It exists in soil solution mainly as Pb2+, but it may also occur in the Pb4+ oxidation state. Soil is
mainly associated with organic matter, clay minerals and oxides of Manganese, Iron and Aluminum (Kabata-
Pendias and Pendias, 1992). Lead is most
Fig. 13: The distribution and concentration of Lead distribution in the area.
available under acid conditions (particularly in sandy soil) (NRCC, 1978a) and precipitates as hydroxides,
phosphates and carbonates as pH increases (Lagerwerff, 1972). In association with Manganese oxides, the
solubility of lead decreases as Pb2+ is oxidized to Pb4+ (McBride, 1994).
Lead is a non essential element for plants, animals and humans. It is toxic to plants at leaf levels of 30-300 ppm (dry weight basis), at which point plants exhibit dark green leaves, wilting, and stunted foliage and
524000 525000 526000 527000 528000 529000 530000 531000
860000
861000
862000
863000
864000
865000
866000
867000
868000
869000
2
3
4
5
6
7
8
9
10
0 1000 2000 3000 4000
Ajimi
Tsejombo
Ijoho
Tyoban
Tsevii
Adodo
Gbelem
Tsegen
Anyiin
Tseuper
ARUFU
Ajimi
Tsejombo
Ijoho
Tyoban
Tsevii
Adodo
Gbelem
Tsegen
Anyiin
Tseuper
ARUFU
N

Environmental Impact From Lead-Zinc Mining And Lead-Arsenic Toxicity Effects In Arufu Area, Ne
www.iosrjournals.org 87 | Page
roots (Kabata-Pendias and Pendias, 1992). Although lead can be absorbed through roots and foliage
(Lagerwerff, 1972) phytotoxicities are rarely observed under field conditions. Lead is highly toxic to animals at
a level of 30ppm in diet on a dry weight basis (FAO, 1992) and leads to efficiency problems in red blood cell synthesis (NRCC, 1978a). Translocation of lead within plants is low (McBride, 1994; Kabata-Pendias and
Pendias, 1992), so the main health concern for humans and animals is ingestion of soil with plants (McBride,
1994), although elevated Lead levels in root crops may be a problem. The guideline established for Lead in
water for human consumption is 0.01 mg/L (≈ 0.01 ppm).
The wide range in concentration of total trace elements investigated in this area reflects the interaction of at least
two factors:
i. The varied nature of the physical and chemical composition of soil parent materials, and
ii. The source of the mineralogic contribution to the soil parent material.
. Lead and arsenic were found to be present in some soil samples in amounts exceeding the higher
limits of the levels found in soils and are potentially highly toxic to biological systems and therefore of
environmental concern. The analysis showed these elements have concentrations above maximum permitted levels of 0.01ppm, 0.01ppm and 0.003ppm respectively in water for human consumption and above the
threshold of contamination of 15ppm and 20ppm for As and
Fig. 14: The Lead contamination map for (a) IGEO and (b) CF values
Pb respectively. This is buttressed by the values of the Index of Geoaccumulation (Igeo), Contamination Factor
(CF) and Degree of Contamination (Cdeg) which indicates moderate to high lead and arsenic contamination of
the soils. The most important ores of several base metals such as lead, zinc, and copper are sulphide minerals. The sulphide ore minerals represent the most serious threat of environmental contamination, because they are
fairly easily oxidized in the presence of air to considerably more soluble sulphates. As a result, soils, surface and
groundwater in the vicinity of the weathering sulphide minerals can be severely contaminated. Although tailings
left after exploitation of the minerals are sources of environmental contamination it is the subsequent processing
of the ores that results in the greatest environmental problems.
Environmental Impacts and Toxicity
Mining operations involve excavations that disturb the topography and alter the aesthetics of the area
involved. The excavations involve removal of vegetation cover, destruction of wildlife habitats and accelerated
erosion. The land is rendered unsuitable for agriculture and the beauty is destroyed. To minimize these effects to
the host communities it is important to take some measures such as;
A
B
Environmental Impact From Lead-Zinc Mining And Lead-Arsenic Toxicity Effects In Arufu Area, Ne
www.iosrjournals.org 88 | Page
Clearing of the vegetation in sequence in order to avoid destruction and generation of large biomass at the
same time.
A watershed management plan has to be developed to compensate for the loss of wildlife habitat.
Compensation as agreed with the community should be made for lost crops and economic trees.
Alternative farming sites should also be made for displaced farmers.
Mining operations leave behind shallow and deep pits. This was observed in parts of the study area where past
and ongoing mining operations are concentrated (Plates 4.2a and 4.2b). Some of the pits form a chain extending
over several kilometres of land. With repeated rainfall or inflow of water from the streams these pits become
death traps for unsuspecting people and animals. This refers to the water that drains from the mines. Lead and
zinc are mined as sulphide ores. When sulphur gets oxidized, a by-product of the oxidation process is
Tetraoxosulphate VI acid (H2SO4). The resultant runoff from the mines and waste piles (known as acid mine
drainage or acid rock drainage) are acidic solutions that can chemically attack other ore minerals and rocks to
produce a cocktail of elements that can have a serious environmental impact on receiving rivers and streams.
This can reduce biological activity or result in death of living organisms in the area. Noise and vibrations are generated when machines are in operation and during blasting. Stress and shock could result to some residents
living in the vicinity. Adequate measures should be taken by mining firms to reduce the direct effect of vibration and noise on the host communities. Such measures include:
Utilization of latest technology, which guarantee low noise levels. Noise is further attenuated by the use
of mufflers and silencers as dampeners. The use of ear defenders should be made mandatory for all
workers on site
Equipment, machinery and tools are serviced regularly to ensure low noise emission.
Airborne particles result from blasting, excavation, transportation and wind erosion of loose fine material.
Excessive silica dust results in a lung disease called silicosis. Particles of lead and zinc are also uplifted and
easily transported into the immediate environment thereby increasing the levels of contamination.
There were indications of outliers in the data thus it was normalized by log transformation to make them
suitable for statistical analysis (Table 1). Lead and arsenic were found to be present in some soil samples in
amounts exceeding the higher limits of the levels found in soils and are potentially highly toxic to biological systems and therefore of environmental concern. The analysis showed these elements have concentrations above
maximum permitted levels of 0.01ppm, 0.01ppm and 0.003ppm respectively in water for human consumption (
Standard Organization of Nigeria, 2007) and above the threshold of contamination of 15ppm and 20ppm for As
and Pb respectively. This is buttressed by the result of the Index of Geoaccumulation (Igeo), Contamination
Factor (CF) and Degree of Contamination (Cdeg) which indicates moderate to high lead and arsenic
contamination of the soils. Arsenic and cadmium show significant correlations with lead. The result of the
geochemical data showed significant regression of lead on arsenic and cadmium as 0.0000 and 0.0149 values
respectively indicating a P-value <0.05 and adjusted R2 value of 50% suggesting that concentrations of arsenic
and cadmium in particular are suitable for prediction of the various concentrations of lead across the area.
The most important ores of several base metals such as lead, zinc, and copper are sulphide minerals. The
sulphide ore minerals represent the most serious threat of environmental contamination, because they are fairly
easily oxidized in the presence of air to considerably more soluble sulphates. As a result, soils, surface and groundwater in the vicinity of the weathering sulphide minerals can be severely contaminated. Although tailings
left after exploitation of the minerals are sources of environmental contamination it is the subsequent processing
of the ores that results in the greatest environmental problems.
V. Conclusion The distributions and concentrations of arsenic, cadmium and lead in the soil samples identified
potential risks associated with lead-zinc mineralization and mining due to enrichment of these elements in the
surface soils and continuous exposures of human beings and animals to these risks. The concentrations of
arsenic and lead are higher than permissible levels and pose a threat to the health of the communities where mining activities are ongoing or were carried out. The observed significant regression and correlations of lead
and arsenic reveals a close association between the elements during the process of mineralization. Lead and
arsenic found in the soil samples were found exceeded the amounts given by Standard Organization of Nigeria
(SON, 2007) as normal levels found in soils which are potentially and highly toxic to biological systems and
therefore of environmental concern. The result obtained showed that these elements As, Cd and Pb have
concentrations above maximum permitted levels of 0.01ppm, 0.01ppm and 0.003ppm respectively in water for
human consumption (Standard Organization of Nigeria, 2007) and above the threshold of contamination of
15ppm and 20ppm for As and Pb respectively. This is buttressed by the result of the Index of Geoaccumulation
(Igeo), Contamination Factor (CF) and Degree of Contamination (Cdeg) which indicates moderate to high lead
and arsenic contamination of the soils, surface and underground waters.

Environmental Impact From Lead-Zinc Mining And Lead-Arsenic Toxicity Effects In Arufu Area, Ne
www.iosrjournals.org 89 | Page
Acknowledgements Thanks are expressed to my supervisor and advices and contributions of Prof. E.C. Ashano, Prof. U.A.
Lar, Prof. E.O. Ogezi, Mr. Agada, and Mrs Ifeoma. My gratitude also goes to the management and staff of
University of Jos for the enabling environment for learning.
References [1]. Adikwu-Brown, M.E. and Ogezi, A.E. (1991): Heavy metal pollution from mining practices: A case study of Zurak, Journal of
mining and Geology, 7(2), 205-211.
[2]. Akande, S.O. (1988): Mineralogical, Fluid Inclusion and Genesis of the Arufu and Akwana Pb-Zn-F mineralization, middle Benue
Trough, Nigeria. Journal African Earth Sciences, 7, 167-180.
[3]. Akande, S.O. (1989): Mineralogical, Textural and Paragenetic studies of the lead-zinc-copper mineralization, lower Benue Trough
and their genetic implications. Journal African Earth Sciences, 9, 23-29.
[4]. Alloway, B.J. (1990): Cadmium; Heavy Metals in Soils. In: B. J. Alloway (ed.). Blackie and Son Ltd.,Bishopbriggs, Glasgow. 100-
124.
[5]. Benkhelil, J. (1989): The origin and evolution of the Cretaceous Benue Trough (Nigeria). Journal of African Earth Science, 8, 251-
259.
[6]. CCREM (1995): Canadian Water Quality Guidelines. March 1987.
[7]. Canadian Council of Resource and Environment Ministers. Environment Canada, Ottawa.
[8]. Cratchley and Jones, G.P. (1965): A Review of the Geology of the Cretaceous of the Benue Valley. In Geology of Nigeria. Kogbe,
C.A. (ed) 2nd
Edition. Rock View (Nig) Ltd., Jos. 368-369.
[9]. Davies, B. E. (1990): Lead. In Heavy Metals in Soils, B. J. Alloway (ed.). Blackie and Son Ltd., Bishopbriggs, Glasgow. 177-196.
[10]. FAO Soils Bulletin 65. (1992): Status of Cadmium, Lead, Cobalt and Selenium in Soils and Plants of Thirty Countries.
[11]. Farrington, J.L. (1952): A preliminary description of the Nigerian Lead-Zinc Field. In Nigeria; It’s Petroleum Geology, Resources
and Potential, Vol.2, pp. 178-179 (A.J Whiteman, 1982). Graham & Trotman Ltd, Sterling House, London).
[12]. Kabata-Pendias, A. and Pendias, H. (1992): Trace Elements in Soils and Plants, 2nd ed., CRC Press, Inc., Boca Raton, Florida. pp.
365.
[13]. Lagerwerff, J.V. (1972): Lead, Mercury, and Cadmium as Environmental Contaminants. In Micronutrients in Agriculture, Soil
Science Society of America, Inc., Madison, Wisconsin, 596-636.
[14]. Lar, U.A. and Sallau, A.K. (2005): Trace element geochemistry of the Keana brines field, middle Benue trough, Nigeria. Journal of
Environmental Geochemistry and Health, 27(4), 331-339.
[15]. McBride, M.B. (1994): Environmental Chemistry of Soils. Oxford University Press, Inc. New York, 326-339.
[16]. Norrish, K. (1975): The Geochemistry and Mineralogy of Trace Elements. In Status of Selected Trace Elements in Agricultural Soils
of Southern Manitoba. Canada, Haluschak, P., et.al. 1998. Technical Report, pp 20.
[17]. NRCC. (1978a): Effects of Lead in the Environment - Quantitative Aspects. Associate Committee on Scientific Criteria for
Environmental Quality, National Research Council of Canada, Ottawa. NRCC No. 16736. pp 779.
[18]. NRCC. (1978b): Effects of Arsenic in the Canadian Environment. Associate Committee on Scientific Criteria for Environmental
Quality, National Research Council of Canada, Ottawa. NRCC No.15391. 349 pp.43
[19]. Ntekim, E.E. (2008): Statistical Analysis of Trace Element Concentrations In Shale-Carbonate Sediments from Northeastern,
Nigeria. Global Journal of Geological Sciences, 6(2), 95-104.
[20]. Nwajide, C.S. (1990): Sedimentation and Paleogeography of the Central Benue Trough, Nigeria. In The Benue trough structure and
evolution. Ofoegbu C.O. (ed) Vieweg, Braunschweig, 19–38
[21]. Obaje, N.G. (2009): Geology and Mineral Resources of Nigeria. Lecture Notes in Earth Sciences 120, Springer-Verlag Berlin
Heidelberg, 57-63
[22]. Obaje, N.G., Attah, D. O., Opeloye, S.A. and Moumouni, A. (2006), Geochemical evaluation of the hydrocarbon prospects of sedimentary
basins in Northern Nigeria. Geochemical Journal., 40, 227 – 243.
[23]. Offodile, M.E. (1976): Stratigraphy of the Keana-Awe area of the Middle Benue region of Nigeria. Bull. of Geology Inst. of the
Univ. of Uppsala N.S. Vol.7, 37-66.
[24]. Olade, M.A., (1976): The genesis of lead and zinc deposits in Nigeria’s Benue (Aulacogen). In Nigeria; Its Petroleum Geology,
Resources and Potential, Vol.2, pp. 179 (A.J Whiteman, 1982). Graham & Trotman Ltd, Sterling House, London).
[25]. Smedley, P.L., and Kinniburgh, D.G. (2002): A Review of the Source, Behaviour and Distribution of Arsenic in Natural Waters.
Applied Geochemistry, 17, 517–568.
[26]. Standards Organization of Nigeria (2007): Nigerian Standard for Drinking-water Quality, Standards Organization of Nigeria (SON)
NIS 554: 2007, Wuse Zone 7, Abuja, Nigeria.
[27]. Tisdale, S.L. (1985): Soil Fertility and Fertilizers. 4th ed. MacMillan Publishing Co. New York. pp 358-403.
[28]. Tseng, C.H. (1999): Chronic Arsenic Intoxication in Asia: Current Perspectives. J. Intern. Med. Taiwan, 10, 224–229.
[29]. Ure, A., and Berrow, M. (1982): The Elemental Constituents of Soils. In Environmental Chemistry (H. J. M. Bowen, Ed.), Royal
Society of Chemistry, London, 94–203.
[30]. Weinstein, P. (1997): The Mount Ruapehu Eruption, 1996: A Review of Potential Health Effects, Australia. New Zealand Journal of
Public Health, 21(7), 773–778.
[31]. Webster, J.G. (1999): Arsenic. In Encyclopaedia of Geochemistry (C. P. Marshall and R. W. Fairbridge, Eds.), Chapman and Hall,
London, 21–22.
[32]. Whiteman, A. (1982): Nigeria: Its Petroleum Geology Resources and Potentials. Vols. 1 and 2 Graham and Trotman, London, pp.
349.
[33]. World Health Organization (WHO) Standards (2011): Guidelines for Drinking-water Quality, 4th Edition. WHO Press, 20 Avenue
Appia, 1211 Geneva 27, Switzerland.
[34]. Wright, J.B. (1968): South Atlantic Continental Drift and Benue Trough. Tectonophysics, 301-310