Embed Size (px)
Citation preview
Contents lists available at ScienceDirect
Environmental Impact Assessment Review
journal homepage: www.elsevier.com/locate/eiar
Quantifying impact reduction due to avoidance, minimization andrestoration for a natural gas pipeline in the Peruvian Andes
C.T. Sahleya,⁎, B. Vildosob, C. Casarettob, P. Taborgab, K. Ledesmaa, R. Linares-Palominoa,G. Mamanic, F. Dallmeierd, A. Alonsod
a Smithsonian Conservation Biology Institute, Los Libertadores 215, San Isidro, Lima, Perub Peru LNG, Av. Victor Andres Belaunde 147 Via real 185. Torre Real Doce Piso 1. San Isidro, Lima, Peruc Grandes Montañas, Urb. Musa, Etapa III, Pasaje Las Fresas 257, Mza. 2 Lte. 6, La Molina, Lima, Perud Center for Conservation and Sustainability, Smithsonian Conservation Biology Institute, National Zoological Park, 1100 Jefferson Dr. Suite 3123, Washington DC 20560-0705, USA
A R T I C L E I N F O
Keywords:Key words: Mitigation hierarchyLinear infrastructure projectsImpact assessmentMitigationBiodiversity monitoring and assessmentBiodiversity action plan
A B S T R A C T
We present monitoring methods and quantitative biodiversity data to document components of the mitigationhierarchy. We estimated avoidance, minimization, restoration and impact reduction in quality hectares for the25 m wide right of way of a 408 km natural gas buried pipeline that crosses 14 Ecological Landscape Units(ELUs) in the tropical Andes of Peru. We found that applying the mitigation hierarchy as part of a comprehensivebiodiversity action plan substantially reduced impacts on biodiversity in all habitats studied. Avoidance andright of way minimization contributed to significant impact reduction. We quantified impact reduction duringconstruction and operation on the right of way of the pipeline over a five-year period and found that restorationwas the greatest contributor to reducing impacts. We documented that most ELUs have a positive restorationtrajectory. We also documented how monitoring over large scale spatial scales, in combination with site-specificmonitoring, generated data for management to determine restoration priorities and impact mitigation. A bio-diversity action plan that incorporated the mitigation hierarchy and a science-based biodiversity monitoring andassessment program contributed to biodiversity management of the project and played an important role inminimizing and managing impacts.
1. Introduction
As infrastructure and development projects continue to be im-plemented worldwide (Battacharya et al. 2012), biodiversity rich areasare increasingly at risk of experiencing negative impacts on biodiversityand ecosystems services (Benchimol and Peres 2015, Finer et al. 2008,Winemiller et al. 2016). Reducing impacts due to project design andconstruction is a critical component of conservation and development,and entails participation and investment in funds and expertise by thepublic, private, and non-profit sectors (Business and Biodiversity OffsetsProgramme 2012, Saenz et al. 2013) as well as “mainstreaming” bio-diversity conservation and management outside of protected areas(Redford et al. 2015).
Several strategies have been proposed to implement best-practicesand mitigate project impacts to safeguard biodiversity and attain “nonet loss” (Business and Biodiversity Offsets Programme 2012,Villarroya et al. 2014). In addition to the Environmental and SocialImpact Assessments (ESIA) as a tool to determine the potential impacts
on biodiversity (Energy and Biodiversity Initiative 2003), the project-lending sector is providing standards for biodiversity and ecosystemservices standards and implementation of the mitigation hierarchy(International Finance Corporation 2012, World Resources Institute2008).
The mitigation hierarchy framework is a best-practice approach fordevelopment projects that manages risks and potential impacts to bio-diversity and ecosystem services (Cross Sector Biodiversity Initiative,2015). It encompasses four components that can contribute to reduce,manage and offset project impacts: avoidance of sensitive habitat,minimization of impacts, restoration of habitat, and offsetting projectimpacts if necessary. Avoidance measures are taken to prevent impactsfrom the planning and beginning of a project and may include mod-ifications in spatial or temporal placement of elements of the infra-structure to minimize impacts. Minimization includes measures takento reduce the duration, intensity and/or extent of impacts that cannotbe avoided. Restoration measures are those taken to restore impactedecosystems following exposure to impacts not avoided or minimized
http://dx.doi.org/10.1016/j.eiar.2017.06.003Received 6 December 2016; Received in revised form 14 June 2017; Accepted 15 June 2017
⁎ Corresponding author at: 9099 Woodcrest Dr., Brecksville, OH 44141, USA.E-mail address: [email protected] (C.T. Sahley).
Environmental Impact Assessment Review 66 (2017) 53–65
0195-9255/ Published by Elsevier Inc. This is an open access article under the CC BY-NC-ND license (http://creativecommons.org/licenses/BY-NC-ND/4.0/).
MARK
and are a response variable to avoidance, minimization and adaptivemanagement efforts. Finally, offsets as a last resource, are measurestaken to compensate for any residual, significant, adverse impacts thatcannot be avoided, minimized and/or restored/rehabilitated, in orderto achieve no net loss or a net gain in biodiversity (Business andBiodiversity Offsets Programme 2012).
Although a stated condition for offsets is that the mitigation hier-archy be applied first (International Finance Corporation 2012), andoffsets be utilized as a last result, little qualitative and quantitativeinformation exists on the application of the mitigation hierarchy priorto offset design (Kiesecker et al. 2010). The application of offset mea-sures has received a lot of attention with regard to the mitigationhierarchy (Gardner et al. 2013, The Biodiversity Consultancy and Faunaand Flora International, 2012a, b, Villarroya et al. 2014), yet applica-tion of offsets is still controversial (Bull et al. 2013, Maron et al. 2012,Quetier et al. 2014), and few studies exist that show their long-termefficacy or sustainability (Curran et al. 2014, Moreno-Mateos et al.2015). For example, habitat restoration offsets may lead to a net loss ofbiodiversity (Curran et al. 2014) while a number of theoretical andpractical issues ranging from use of appropriate currencies, determininghabitat equivalencies, longevity, uncertainty and others (Bull et al.2013) make designing offsets a challenge. Moreno-Mateos et al. (2015)make the claim that multiple ecological, regulatory and ethical lossescan occur when evaluating offsets and argue for greater transparency indocumenting biodiversity losses. Because application of avoidance,minimization, and restoration/rehabilitation are critical components ofa biodiversity strategy or action plan, and may influence offset planningas well as landscape level land-use planning (Saenz et al. 2013), carefulimplementation and quantification of the mitigation hierarchy is crucialfor biodiversity conservation in the area of influence of a project.Furthermore, quantifying the effects of impacts on species, habitats,and ecological processes becomes indispensable for quantifying re-sidual impacts of a project.
Monitoring programs for indicator species and habitats during allphases of a project is a useful approach to quantify residual impacts andguide restoration decisions (Alonso et al. 2013, Lindenmayer 1999).Habitats and biodiversity can be restored more effectively if projectmanagers utilize monitoring programs within an adaptive managementframework, especially when the mitigation hierarchy is applied. Whenimpacts can be reduced and restoration activities are informed by ap-propriate monitoring techniques that suit the scale of the project,measure appropriate indicators, and assess aspects or proxies of eco-system functionality, then impact reduction targets and positive re-storation trajectories may be attained.
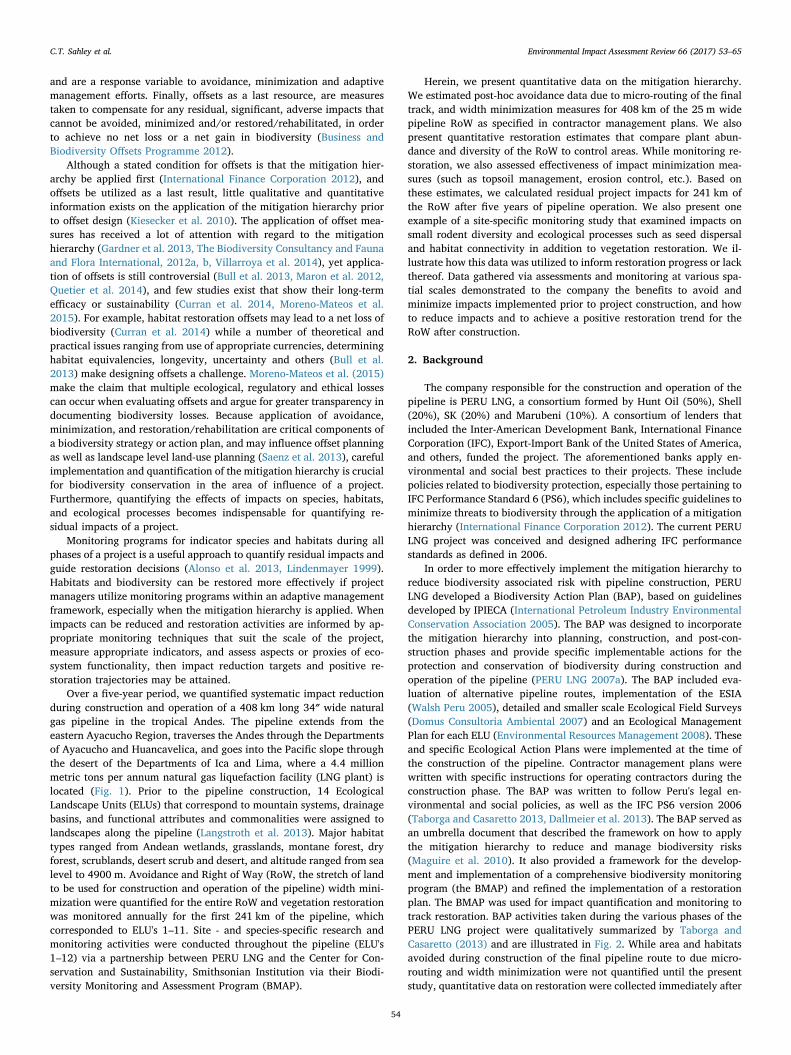
Over a five-year period, we quantified systematic impact reductionduring construction and operation of a 408 km long 34″ wide naturalgas pipeline in the tropical Andes. The pipeline extends from theeastern Ayacucho Region, traverses the Andes through the Departmentsof Ayacucho and Huancavelica, and goes into the Pacific slope throughthe desert of the Departments of Ica and Lima, where a 4.4 millionmetric tons per annum natural gas liquefaction facility (LNG plant) islocated (Fig. 1). Prior to the pipeline construction, 14 EcologicalLandscape Units (ELUs) that correspond to mountain systems, drainagebasins, and functional attributes and commonalities were assigned tolandscapes along the pipeline (Langstroth et al. 2013). Major habitattypes ranged from Andean wetlands, grasslands, montane forest, dryforest, scrublands, desert scrub and desert, and altitude ranged from sealevel to 4900 m. Avoidance and Right of Way (RoW, the stretch of landto be used for construction and operation of the pipeline) width mini-mization were quantified for the entire RoW and vegetation restorationwas monitored annually for the first 241 km of the pipeline, whichcorresponded to ELU's 1–11. Site - and species-specific research andmonitoring activities were conducted throughout the pipeline (ELU's1–12) via a partnership between PERU LNG and the Center for Con-servation and Sustainability, Smithsonian Institution via their Biodi-versity Monitoring and Assessment Program (BMAP).
Herein, we present quantitative data on the mitigation hierarchy.We estimated post-hoc avoidance data due to micro-routing of the finaltrack, and width minimization measures for 408 km of the 25 m widepipeline RoW as specified in contractor management plans. We alsopresent quantitative restoration estimates that compare plant abun-dance and diversity of the RoW to control areas. While monitoring re-storation, we also assessed effectiveness of impact minimization mea-sures (such as topsoil management, erosion control, etc.). Based onthese estimates, we calculated residual project impacts for 241 km ofthe RoW after five years of pipeline operation. We also present oneexample of a site-specific monitoring study that examined impacts onsmall rodent diversity and ecological processes such as seed dispersaland habitat connectivity in addition to vegetation restoration. We il-lustrate how this data was utilized to inform restoration progress or lackthereof. Data gathered via assessments and monitoring at various spa-tial scales demonstrated to the company the benefits to avoid andminimize impacts implemented prior to project construction, and howto reduce impacts and to achieve a positive restoration trend for theRoW after construction.
2. Background
The company responsible for the construction and operation of thepipeline is PERU LNG, a consortium formed by Hunt Oil (50%), Shell(20%), SK (20%) and Marubeni (10%). A consortium of lenders thatincluded the Inter-American Development Bank, International FinanceCorporation (IFC), Export-Import Bank of the United States of America,and others, funded the project. The aforementioned banks apply en-vironmental and social best practices to their projects. These includepolicies related to biodiversity protection, especially those pertaining toIFC Performance Standard 6 (PS6), which includes specific guidelines tominimize threats to biodiversity through the application of a mitigationhierarchy (International Finance Corporation 2012). The current PERULNG project was conceived and designed adhering IFC performancestandards as defined in 2006.
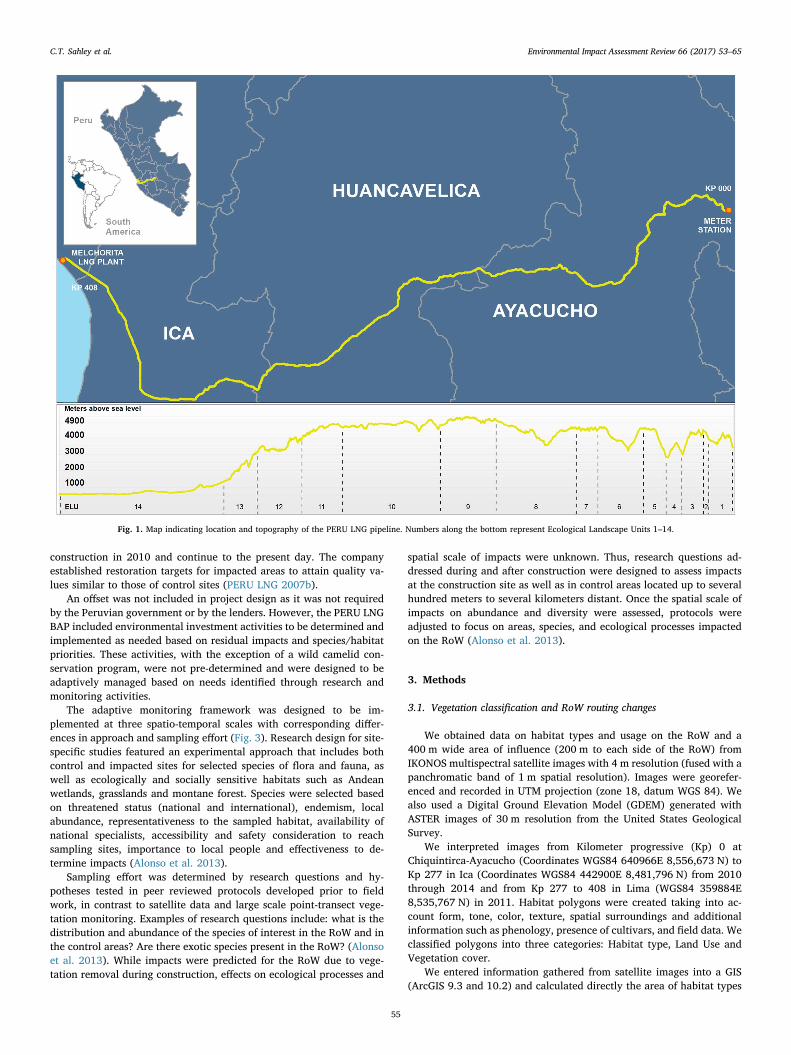
In order to more effectively implement the mitigation hierarchy toreduce biodiversity associated risk with pipeline construction, PERULNG developed a Biodiversity Action Plan (BAP), based on guidelinesdeveloped by IPIECA (International Petroleum Industry EnvironmentalConservation Association 2005). The BAP was designed to incorporatethe mitigation hierarchy into planning, construction, and post-con-struction phases and provide specific implementable actions for theprotection and conservation of biodiversity during construction andoperation of the pipeline (PERU LNG 2007a). The BAP included eva-luation of alternative pipeline routes, implementation of the ESIA(Walsh Peru 2005), detailed and smaller scale Ecological Field Surveys(Domus Consultoria Ambiental 2007) and an Ecological ManagementPlan for each ELU (Environmental Resources Management 2008). Theseand specific Ecological Action Plans were implemented at the time ofthe construction of the pipeline. Contractor management plans werewritten with specific instructions for operating contractors during theconstruction phase. The BAP was written to follow Peru's legal en-vironmental and social policies, as well as the IFC PS6 version 2006(Taborga and Casaretto 2013, Dallmeier et al. 2013). The BAP served asan umbrella document that described the framework on how to applythe mitigation hierarchy to reduce and manage biodiversity risks(Maguire et al. 2010). It also provided a framework for the develop-ment and implementation of a comprehensive biodiversity monitoringprogram (the BMAP) and refined the implementation of a restorationplan. The BMAP was used for impact quantification and monitoring totrack restoration. BAP activities taken during the various phases of thePERU LNG project were qualitatively summarized by Taborga andCasaretto (2013) and are illustrated in Fig. 2. While area and habitatsavoided during construction of the final pipeline route to due micro-routing and width minimization were not quantified until the presentstudy, quantitative data on restoration were collected immediately after
C.T. Sahley et al. Environmental Impact Assessment Review 66 (2017) 53–65
54
construction in 2010 and continue to the present day. The companyestablished restoration targets for impacted areas to attain quality va-lues similar to those of control sites (PERU LNG 2007b).
An offset was not included in project design as it was not requiredby the Peruvian government or by the lenders. However, the PERU LNGBAP included environmental investment activities to be determined andimplemented as needed based on residual impacts and species/habitatpriorities. These activities, with the exception of a wild camelid con-servation program, were not pre-determined and were designed to beadaptively managed based on needs identified through research andmonitoring activities.
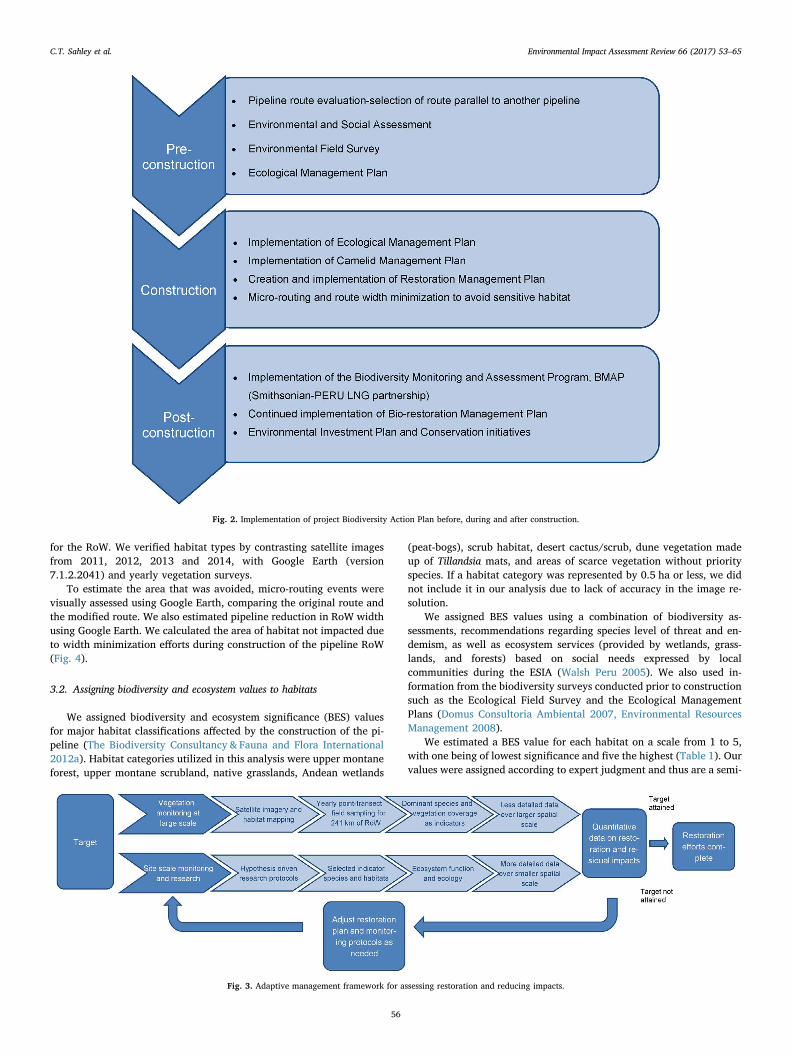
The adaptive monitoring framework was designed to be im-plemented at three spatio-temporal scales with corresponding differ-ences in approach and sampling effort (Fig. 3). Research design for site-specific studies featured an experimental approach that includes bothcontrol and impacted sites for selected species of flora and fauna, aswell as ecologically and socially sensitive habitats such as Andeanwetlands, grasslands and montane forest. Species were selected basedon threatened status (national and international), endemism, localabundance, representativeness to the sampled habitat, availability ofnational specialists, accessibility and safety consideration to reachsampling sites, importance to local people and effectiveness to de-termine impacts (Alonso et al. 2013).
Sampling effort was determined by research questions and hy-potheses tested in peer reviewed protocols developed prior to fieldwork, in contrast to satellite data and large scale point-transect vege-tation monitoring. Examples of research questions include: what is thedistribution and abundance of the species of interest in the RoW and inthe control areas? Are there exotic species present in the RoW? (Alonsoet al. 2013). While impacts were predicted for the RoW due to vege-tation removal during construction, effects on ecological processes and
spatial scale of impacts were unknown. Thus, research questions ad-dressed during and after construction were designed to assess impactsat the construction site as well as in control areas located up to severalhundred meters to several kilometers distant. Once the spatial scale ofimpacts on abundance and diversity were assessed, protocols wereadjusted to focus on areas, species, and ecological processes impactedon the RoW (Alonso et al. 2013).
3. Methods
3.1. Vegetation classification and RoW routing changes
We obtained data on habitat types and usage on the RoW and a400 m wide area of influence (200 m to each side of the RoW) fromIKONOS multispectral satellite images with 4 m resolution (fused with apanchromatic band of 1 m spatial resolution). Images were georefer-enced and recorded in UTM projection (zone 18, datum WGS 84). Wealso used a Digital Ground Elevation Model (GDEM) generated withASTER images of 30 m resolution from the United States GeologicalSurvey.
We interpreted images from Kilometer progressive (Kp) 0 atChiquintirca-Ayacucho (Coordinates WGS84 640966E 8,556,673 N) toKp 277 in Ica (Coordinates WGS84 442900E 8,481,796 N) from 2010through 2014 and from Kp 277 to 408 in Lima (WGS84 359884E8,535,767 N) in 2011. Habitat polygons were created taking into ac-count form, tone, color, texture, spatial surroundings and additionalinformation such as phenology, presence of cultivars, and field data. Weclassified polygons into three categories: Habitat type, Land Use andVegetation cover.
We entered information gathered from satellite images into a GIS(ArcGIS 9.3 and 10.2) and calculated directly the area of habitat types
Fig. 1. Map indicating location and topography of the PERU LNG pipeline. Numbers along the bottom represent Ecological Landscape Units 1–14.
C.T. Sahley et al. Environmental Impact Assessment Review 66 (2017) 53–65
55
for the RoW. We verified habitat types by contrasting satellite imagesfrom 2011, 2012, 2013 and 2014, with Google Earth (version7.1.2.2041) and yearly vegetation surveys.
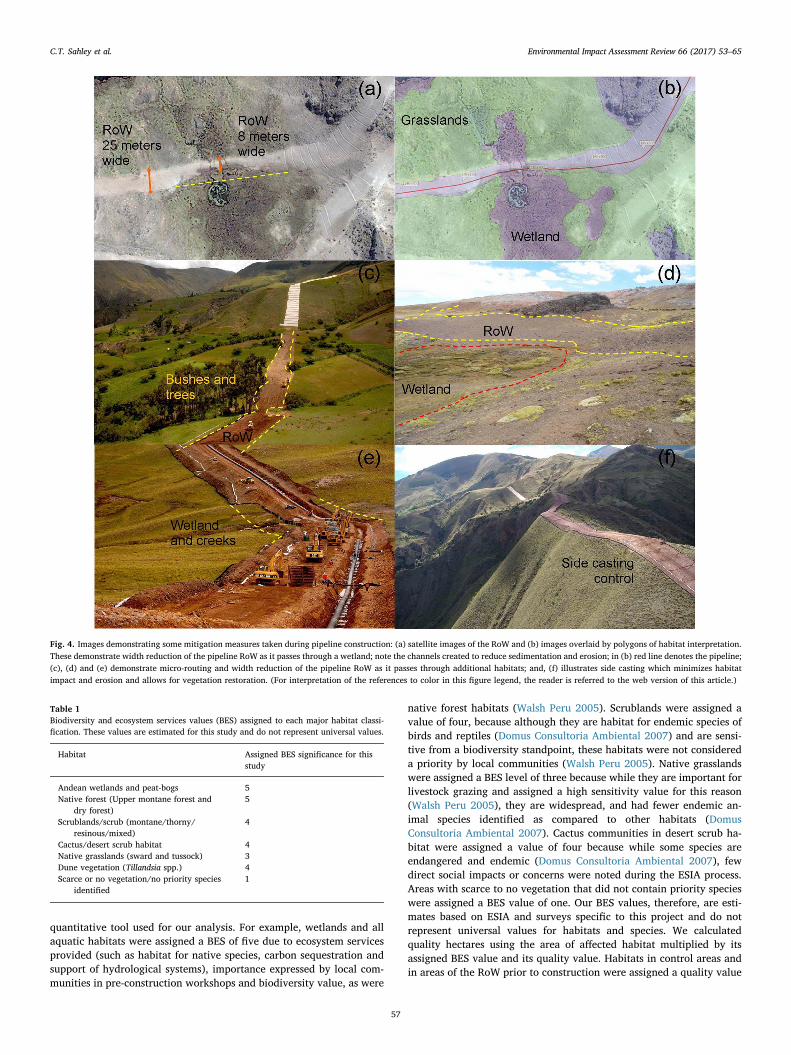
To estimate the area that was avoided, micro-routing events werevisually assessed using Google Earth, comparing the original route andthe modified route. We also estimated pipeline reduction in RoW widthusing Google Earth. We calculated the area of habitat not impacted dueto width minimization efforts during construction of the pipeline RoW(Fig. 4).
3.2. Assigning biodiversity and ecosystem values to habitats
We assigned biodiversity and ecosystem significance (BES) valuesfor major habitat classifications affected by the construction of the pi-peline (The Biodiversity Consultancy & Fauna and Flora International2012a). Habitat categories utilized in this analysis were upper montaneforest, upper montane scrubland, native grasslands, Andean wetlands
(peat-bogs), scrub habitat, desert cactus/scrub, dune vegetation madeup of Tillandsia mats, and areas of scarce vegetation without priorityspecies. If a habitat category was represented by 0.5 ha or less, we didnot include it in our analysis due to lack of accuracy in the image re-solution.
We assigned BES values using a combination of biodiversity as-sessments, recommendations regarding species level of threat and en-demism, as well as ecosystem services (provided by wetlands, grass-lands, and forests) based on social needs expressed by localcommunities during the ESIA (Walsh Peru 2005). We also used in-formation from the biodiversity surveys conducted prior to constructionsuch as the Ecological Field Survey and the Ecological ManagementPlans (Domus Consultoria Ambiental 2007, Environmental ResourcesManagement 2008).
We estimated a BES value for each habitat on a scale from 1 to 5,with one being of lowest significance and five the highest (Table 1). Ourvalues were assigned according to expert judgment and thus are a semi-
Fig. 2. Implementation of project Biodiversity Action Plan before, during and after construction.
Fig. 3. Adaptive management framework for assessing restoration and reducing impacts.
C.T. Sahley et al. Environmental Impact Assessment Review 66 (2017) 53–65
56
quantitative tool used for our analysis. For example, wetlands and allaquatic habitats were assigned a BES of five due to ecosystem servicesprovided (such as habitat for native species, carbon sequestration andsupport of hydrological systems), importance expressed by local com-munities in pre-construction workshops and biodiversity value, as were
native forest habitats (Walsh Peru 2005). Scrublands were assigned avalue of four, because although they are habitat for endemic species ofbirds and reptiles (Domus Consultoria Ambiental 2007) and are sensi-tive from a biodiversity standpoint, these habitats were not considereda priority by local communities (Walsh Peru 2005). Native grasslandswere assigned a BES level of three because while they are important forlivestock grazing and assigned a high sensitivity value for this reason(Walsh Peru 2005), they are widespread, and had fewer endemic an-imal species identified as compared to other habitats (DomusConsultoria Ambiental 2007). Cactus communities in desert scrub ha-bitat were assigned a value of four because while some species areendangered and endemic (Domus Consultoria Ambiental 2007), fewdirect social impacts or concerns were noted during the ESIA process.Areas with scarce to no vegetation that did not contain priority specieswere assigned a BES value of one. Our BES values, therefore, are esti-mates based on ESIA and surveys specific to this project and do notrepresent universal values for habitats and species. We calculatedquality hectares using the area of affected habitat multiplied by itsassigned BES value and its quality value. Habitats in control areas andin areas of the RoW prior to construction were assigned a quality value
Fig. 4. Images demonstrating some mitigation measures taken during pipeline construction: (a) satellite images of the RoW and (b) images overlaid by polygons of habitat interpretation.These demonstrate width reduction of the pipeline RoW as it passes through a wetland; note the channels created to reduce sedimentation and erosion; in (b) red line denotes the pipeline;(c), (d) and (e) demonstrate micro-routing and width reduction of the pipeline RoW as it passes through additional habitats; and, (f) illustrates side casting which minimizes habitatimpact and erosion and allows for vegetation restoration. (For interpretation of the references to color in this figure legend, the reader is referred to the web version of this article.)
Table 1Biodiversity and ecosystem services values (BES) assigned to each major habitat classi-fication. These values are estimated for this study and do not represent universal values.
Habitat Assigned BES significance for thisstudy
Andean wetlands and peat-bogs 5Native forest (Upper montane forest and
dry forest)5
Scrublands/scrub (montane/thorny/resinous/mixed)
4
Cactus/desert scrub habitat 4Native grasslands (sward and tussock) 3Dune vegetation (Tillandsia spp.) 4Scarce or no vegetation/no priority species
identified1
C.T. Sahley et al. Environmental Impact Assessment Review 66 (2017) 53–65
57
of one, while habitats impacted by the RoW were assigned a qualityvalue equivalent to its degree of restoration based on plant diversityand vegetation cover (i.e. a value less than one).
We did not include BES values for rivers and streams in our analysisbecause of the difficulty of assessing an area of impact to them. Datafrom the BMAP, however, determined that no biodiversity impactscould be detected due to the RoW crossing streams (Alonso et al. 2013).
We designated a spatial impact scale value of zero if no impact wasdetected within or outside of the RoW, scale value of one to areas wherebiodiversity and vegetation cover was affected at a local scale (within10 m). Our scale included a potential impact scale value of two if theimpact was wider in scale (> 10 m< 1000 m) with a demonstratedreduction in biodiversity or vegetation cover at a regional scale. Wefound all impacts to be site-specific and limited to the RoW (Alonsoet al. 2013) and therefore they were assigned an impact scale value ofone.
3.3. Monitoring vegetation restoration
Impacts related to site-based recovery of biodiversity on a temporalscale were tracked yearly through the vegetation monitoring and theBMAP site- and species-species specific protocols. We used point-linetransect data from ELUs 1–11 (241 km) assessed annually, from 2010 to2014, by the company's bio-restoration program. We evaluated onehundred points for each 500 m section of the RoW on ELUs 1–11, de-termining plant species composition within a one inch diameter ring aswell as relative vegetation cover for each 100 points. Two transectswere evaluated inside the RoW per kilometer and two transects10–50 m outside the RoW as control sites. Plant species compositionand vegetation cover inside the RoW relative to control sites wereutilized for assessing habitat quality.
3.4. Quantifying avoidance in quality hectares
We used satellite images data entered in ArcGIS to calculate the areaof habitat polygons present on the RoW along the pipeline route(Fig. 4b). We then used vegetation cover data to determine a measure ofthe habitat type in quality hectares for both the original route and thefinal route. We used a GIS model to calculate the habitat not impactedand habitat impacted due to micro-routing and route width minimiza-tion. We used the original pipeline route with a 12.5 m buffer to gen-erate the quality hectares of potential impact of the RoW. We used thesame method to determine the quality hectares avoided (route withmicro-routing to avoid sensitive habitats) for the final route.
Once we obtained the data of habitat potentially impacted by theoriginal ROW, the quality hectares reduced through micro-routing andwidth minimization for the revised route, and data on restoration ofvegetation for ELU's 1–11 from 2010 to 2014, we calculated remainingimpacts. For ELU's 12–14, where restoration monitoring did not reg-ularly occur, we calculated impacts based on avoidance and widthminimization actions only.
Our estimate of impacts was calculated using quality hectares;however, unlike projects that compare habitat quality in the projectarea to an offset area (The Biodiversity Consultancy and Fauna andFlora International 2012b), we compared impacted areas to controlsites, which served as a baseline for monitoring. We first multipliedhabitat area to be impacted by RoW construction by its BES value,which provided each habitat with a priority value. Because the qualityof the habitat is compared to non-impacted, control sites (assigned aquality value of 1), all habitats were assigned a value of 1 prior toconstruction. After RoW construction, habitat quality was assessed bycomparing vegetation abundance and diversity inside the RoW to ve-getation abundance and diversity in control plots via a restoration index(see below). Our residual impact calculations therefore, take into ac-count the quality hectares of habitat impacted (at time of construction)and the reduction in impacts over time due to restoration activities.
3.5. Calculation of impacts due to construction of the RoW
We used the following formulas (impact values in quality hectares)to calculate:
Impact of the original route (ARoWo)Area of original RoW (25 m) ∗ Impact scale value ∗ BES value of
habitat ∗ Quality (value of 1).Impact avoided with micro-routing (ARoWa)Area of original RoW avoided with micro-routing ∗ Impact scale
value ∗ BES value of habitat ∗ Quality (value of 1).Minimized impact (ARoWm)Area of original RoW with width minimization ∗ Impact scale
value ∗ BES value of habitat ∗ Quality (value of 1).Restoration index (quality value post-construction) (QRi)
= − +Q RoWnvc C nvc RoWnsr C nsr1 {( ) ( )} 2Ri n( )
Where:
RoW nvc proportion of native vegetation cover in RoW sample
C nvc proportion of native vegetation cover in Control sample
RoW nsr native species richness in RoW sample
C nsr native species richness in Control sample.The formula to determine residual impact in quality hectares for the
PERU LNG RoW for each year was therefore:
∑ ∑
∑
= −
+
∗ ∗ ∗ ∗ ∗ ∗
∗ ∗ ∗ ∗
ARoW IS BES Q ARoW IS BES Q
ARoW IS BES Q
Q
Residual impact
[ ( ) { ( )
( ) } ]
n
o a
m
Ri n( )
Where:
IS Impact scale value
BES BES significance
Q Quality value (value of 1 for habitats prior to impact)
ARoWo Area of Original RoW (before construction)
ARoWa Areas added or avoided due to habitat prioritization bymicro-routing (during construction)
ARoWm Area further avoided by width minimization (during con-struction)
QRi Restoration index (serves as quality measure post-construc-tion)
n Year.We calculated a restoration index for each 500 m section along the
RoW for ELUs 1–11 for each year of monitoring. To examine restorationtrajectories, we calculated correlation coefficients between restorationindices and year for habitats in ELU's combined.
3.6. Site specific monitoring through the Biodiversity Monitoring andAssessment Program (BMAP): small rodents in montane forest
ELU 1 of the RoW contains montane rainforest which was assigned aBES value of five since it was designated as a sensitive habitat in theESIA (Walsh Peru 2005). Soon after pipeline construction, small rodentpopulations were monitored via live-capture and marking. Pachecoet al. (2013) and Salas et al. (2013) did not find differences in theabundance and diversity of the small rodents in the RoW as comparedto nearby control sites. As the RoW recovered its vegetation, themonitoring protocol incorporated rodent diet and found the communityof rodents to be seed dispersers (Sahley et al. 2015, 2016) demon-strating their importance to ecosystem health.
C.T. Sahley et al. Environmental Impact Assessment Review 66 (2017) 53–65
58
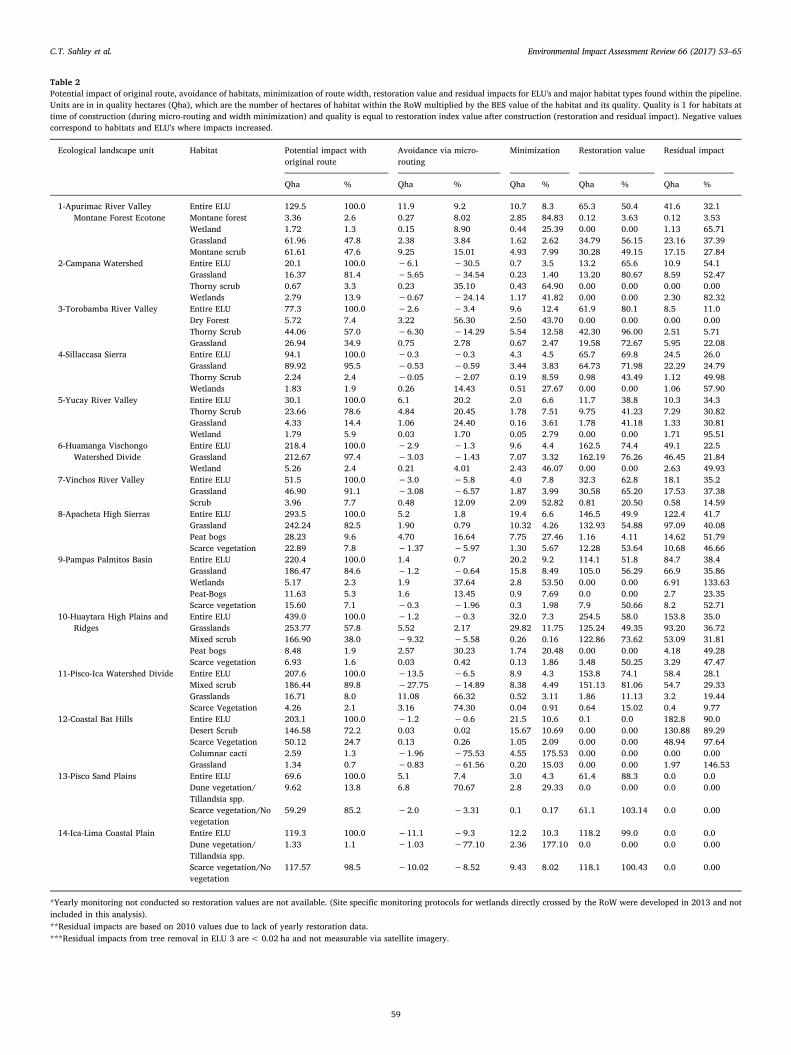
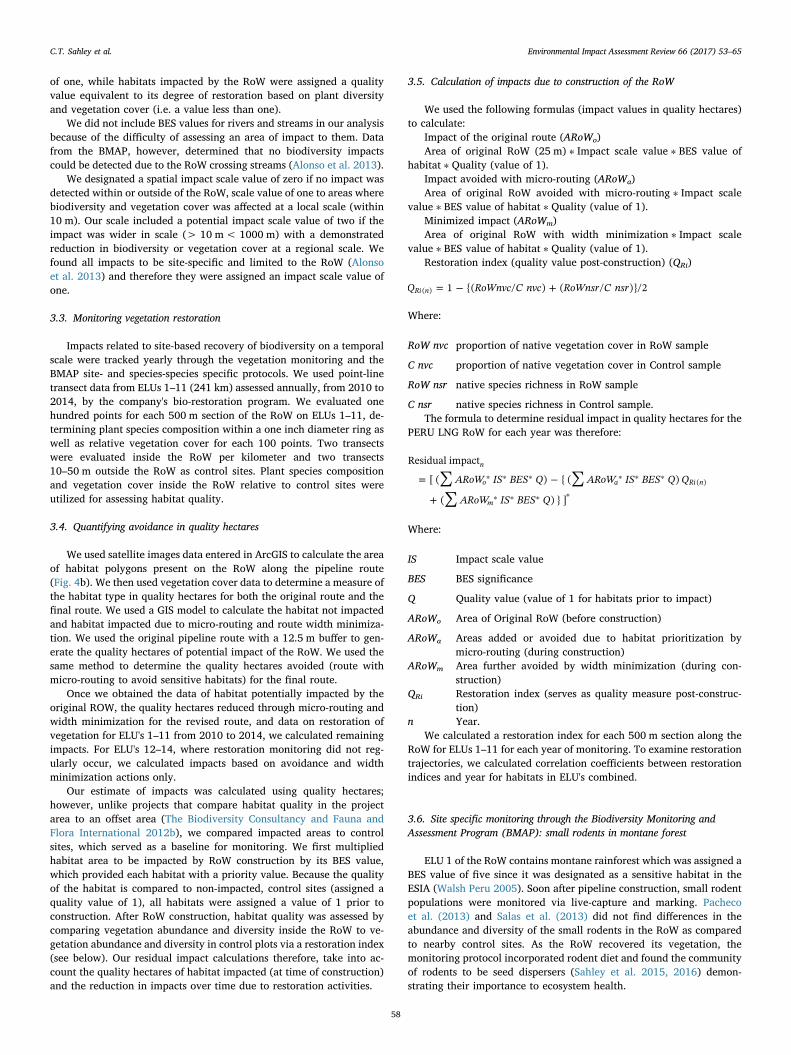
Table 2Potential impact of original route, avoidance of habitats, minimization of route width, restoration value and residual impacts for ELU's and major habitat types found within the pipeline.Units are in in quality hectares (Qha), which are the number of hectares of habitat within the RoW multiplied by the BES value of the habitat and its quality. Quality is 1 for habitats attime of construction (during micro-routing and width minimization) and quality is equal to restoration index value after construction (restoration and residual impact). Negative valuescorrespond to habitats and ELU's where impacts increased.
Ecological landscape unit Habitat Potential impact withoriginal route
Avoidance via micro-routing
Minimization Restoration value Residual impact
Qha % Qha % Qha % Qha % Qha %
1-Apurimac River ValleyMontane Forest Ecotone
Entire ELU 129.5 100.0 11.9 9.2 10.7 8.3 65.3 50.4 41.6 32.1Montane forest 3.36 2.6 0.27 8.02 2.85 84.83 0.12 3.63 0.12 3.53Wetland 1.72 1.3 0.15 8.90 0.44 25.39 0.00 0.00 1.13 65.71Grassland 61.96 47.8 2.38 3.84 1.62 2.62 34.79 56.15 23.16 37.39Montane scrub 61.61 47.6 9.25 15.01 4.93 7.99 30.28 49.15 17.15 27.84
2-Campana Watershed Entire ELU 20.1 100.0 −6.1 −30.5 0.7 3.5 13.2 65.6 10.9 54.1Grassland 16.37 81.4 −5.65 −34.54 0.23 1.40 13.20 80.67 8.59 52.47Thorny scrub 0.67 3.3 0.23 35.10 0.43 64.90 0.00 0.00 0.00 0.00Wetlands 2.79 13.9 −0.67 −24.14 1.17 41.82 0.00 0.00 2.30 82.32
3-Torobamba River Valley Entire ELU 77.3 100.0 −2.6 −3.4 9.6 12.4 61.9 80.1 8.5 11.0Dry Forest 5.72 7.4 3.22 56.30 2.50 43.70 0.00 0.00 0.00 0.00Thorny Scrub 44.06 57.0 −6.30 −14.29 5.54 12.58 42.30 96.00 2.51 5.71Grassland 26.94 34.9 0.75 2.78 0.67 2.47 19.58 72.67 5.95 22.08
4-Sillaccasa Sierra Entire ELU 94.1 100.0 −0.3 −0.3 4.3 4.5 65.7 69.8 24.5 26.0Grassland 89.92 95.5 −0.53 −0.59 3.44 3.83 64.73 71.98 22.29 24.79Thorny Scrub 2.24 2.4 −0.05 −2.07 0.19 8.59 0.98 43.49 1.12 49.98Wetlands 1.83 1.9 0.26 14.43 0.51 27.67 0.00 0.00 1.06 57.90
5-Yucay River Valley Entire ELU 30.1 100.0 6.1 20.2 2.0 6.6 11.7 38.8 10.3 34.3Thorny Scrub 23.66 78.6 4.84 20.45 1.78 7.51 9.75 41.23 7.29 30.82Grassland 4.33 14.4 1.06 24.40 0.16 3.61 1.78 41.18 1.33 30.81Wetland 1.79 5.9 0.03 1.70 0.05 2.79 0.00 0.00 1.71 95.51
6-Huamanga VischongoWatershed Divide
Entire ELU 218.4 100.0 −2.9 −1.3 9.6 4.4 162.5 74.4 49.1 22.5Grassland 212.67 97.4 −3.03 −1.43 7.07 3.32 162.19 76.26 46.45 21.84Wetland 5.26 2.4 0.21 4.01 2.43 46.07 0.00 0.00 2.63 49.93
7-Vinchos River Valley Entire ELU 51.5 100.0 −3.0 −5.8 4.0 7.8 32.3 62.8 18.1 35.2Grassland 46.90 91.1 −3.08 −6.57 1.87 3.99 30.58 65.20 17.53 37.38Scrub 3.96 7.7 0.48 12.09 2.09 52.82 0.81 20.50 0.58 14.59
8-Apacheta High Sierras Entire ELU 293.5 100.0 5.2 1.8 19.4 6.6 146.5 49.9 122.4 41.7Grassland 242.24 82.5 1.90 0.79 10.32 4.26 132.93 54.88 97.09 40.08Peat bogs 28.23 9.6 4.70 16.64 7.75 27.46 1.16 4.11 14.62 51.79Scarce vegetation 22.89 7.8 −1.37 −5.97 1.30 5.67 12.28 53.64 10.68 46.66
9-Pampas Palmitos Basin Entire ELU 220.4 100.0 1.4 0.7 20.2 9.2 114.1 51.8 84.7 38.4Grassland 186.47 84.6 −1.2 −0.64 15.8 8.49 105.0 56.29 66.9 35.86Wetlands 5.17 2.3 1.9 37.64 2.8 53.50 0.00 0.00 6.91 133.63Peat-Bogs 11.63 5.3 1.6 13.45 0.9 7.69 0.0 0.00 2.7 23.35Scarce vegetation 15.60 7.1 −0.3 −1.96 0.3 1.98 7.9 50.66 8.2 52.71
10-Huaytara High Plains andRidges
Entire ELU 439.0 100.0 −1.2 −0.3 32.0 7.3 254.5 58.0 153.8 35.0Grasslands 253.77 57.8 5.52 2.17 29.82 11.75 125.24 49.35 93.20 36.72Mixed scrub 166.90 38.0 −9.32 −5.58 0.26 0.16 122.86 73.62 53.09 31.81Peat bogs 8.48 1.9 2.57 30.23 1.74 20.48 0.00 0.00 4.18 49.28Scarce vegetation 6.93 1.6 0.03 0.42 0.13 1.86 3.48 50.25 3.29 47.47
11-Pisco-Ica Watershed Divide Entire ELU 207.6 100.0 −13.5 −6.5 8.9 4.3 153.8 74.1 58.4 28.1Mixed scrub 186.44 89.8 −27.75 −14.89 8.38 4.49 151.13 81.06 54.7 29.33Grasslands 16.71 8.0 11.08 66.32 0.52 3.11 1.86 11.13 3.2 19.44Scarce Vegetation 4.26 2.1 3.16 74.30 0.04 0.91 0.64 15.02 0.4 9.77
12-Coastal Bat Hills Entire ELU 203.1 100.0 −1.2 −0.6 21.5 10.6 0.1 0.0 182.8 90.0Desert Scrub 146.58 72.2 0.03 0.02 15.67 10.69 0.00 0.00 130.88 89.29Scarce Vegetation 50.12 24.7 0.13 0.26 1.05 2.09 0.00 0.00 48.94 97.64Columnar cacti 2.59 1.3 −1.96 −75.53 4.55 175.53 0.00 0.00 0.00 0.00Grassland 1.34 0.7 −0.83 −61.56 0.20 15.03 0.00 0.00 1.97 146.53
13-Pisco Sand Plains Entire ELU 69.6 100.0 5.1 7.4 3.0 4.3 61.4 88.3 0.0 0.0Dune vegetation/Tillandsia spp.
9.62 13.8 6.8 70.67 2.8 29.33 0.0 0.00 0.0 0.00
Scarce vegetation/Novegetation
59.29 85.2 −2.0 −3.31 0.1 0.17 61.1 103.14 0.0 0.00
14-Ica-Lima Coastal Plain Entire ELU 119.3 100.0 −11.1 −9.3 12.2 10.3 118.2 99.0 0.0 0.0Dune vegetation/Tillandsia spp.
1.33 1.1 −1.03 −77.10 2.36 177.10 0.0 0.00 0.0 0.00
Scarce vegetation/Novegetation
117.57 98.5 −10.02 −8.52 9.43 8.02 118.1 100.43 0.0 0.00
*Yearly monitoring not conducted so restoration values are not available. (Site specific monitoring protocols for wetlands directly crossed by the RoW were developed in 2013 and notincluded in this analysis).**Residual impacts are based on 2010 values due to lack of yearly restoration data.***Residual impacts from tree removal in ELU 3 are< 0.02 ha and not measurable via satellite imagery.
C.T. Sahley et al. Environmental Impact Assessment Review 66 (2017) 53–65
59
4. Results
4.1. Summary of mitigation hierarchy efforts by Ecological Landscape Unit(ELU)
We found that application of the mitigation hierarchy to the pipe-line RoW during construction and post-construction led to a substantialreduction in residual impacts for all ELU's (Table 2). We found thatrestoration resulted in the greatest reduction of residual impacts in theoptimum pipeline corridor, followed by avoidance via micro-routing incombination with RoW width minimization (Fig. 5). Avoidance ofpriority habitats could entail additional impacts in lower priority ha-bitats. We found that residual impacts were largest in ELUs 8, 9, and 10,primarily composed of grassland habitats located at high altitudes withlow rainfall regimes and where cold temperatures (below freezingpoint) are frequent. The eastern Andean ELUs (primarily forest andscrub habitat) had considerably fewer residual impacts. The PacificWatershed ELUs, which were not subject to a restoration program, hadfew residual impacts with the exception of ELU 12 (primarily desert/cactus scrub).
4.2. Avoidance via micro-routing and width reduction of the RoW
Micro-routing adjustments made during construction of the pipelineRoW led to a proportionally greater avoidance of high BES habitatssuch as montane forest, dry forest, montane shrub and Andean wetlandas compared to medium BES habitat such as grassland (Table 2).Avoidance through micro-routing (done for purposes of avoidingpriority habitats, villages, and archeological remains) slightly increasedimpacts on some natural habitats for 7 out of 10 ELU's (ELU's 2, 3, 6, 7,8, 11, 14). These habitats were grasslands (BES value of 3, 7/16 cases),areas of scarce vegetation (BES value of 1, 4/16 cases), scrub vegetation(BES value of 4, 5/16 cases), vegetation dominated by columnar cacti(BES value of 4, 1/16 cases) and in one case a small increase occurred ina wetland (BES value of 5, 1/16 cases). Thus, avoidance of priorityhabitats can lead to greater impacts in lower priority habitats. Widthreduction of the RoW lessened impacts in all ELU's and habitats, so thatthe combination of avoidance and width reduction (actual footprint)resulted in a reduction of impacts. When habitat types are combinedirrespective of ELU, high BES habitats such as dry and upper montane
forests as well as Tillandsia vegetation have high avoidance values andcorrespondingly zero to small amounts of residual habitat by area, eventhough for dry forest and montane forest, trees located directly in theRoW were removed (42 and 25 trees, respectively). Replanting of thesetrees within the RoW is not feasible, due to pipeline integrity needs.BMAP personnel (see below) are collecting data to evaluate and offerguidance on how to minimize impacts via restoration. Grassland hadthe lowest avoidance and width minimization values. Residual impacts,as measured by vegetation cover and plant species diversity range, fromzero or near zero for Tillandsia vegetation, dry forest vegetation, andmontane forest to more intermediate values for scrubland, wetland,upper montane scrub, and grassland. Desert-cactus scrub had thehighest level of residual impacts even with comparable values foravoidance and width minimization.
4.3. Vegetation restoration
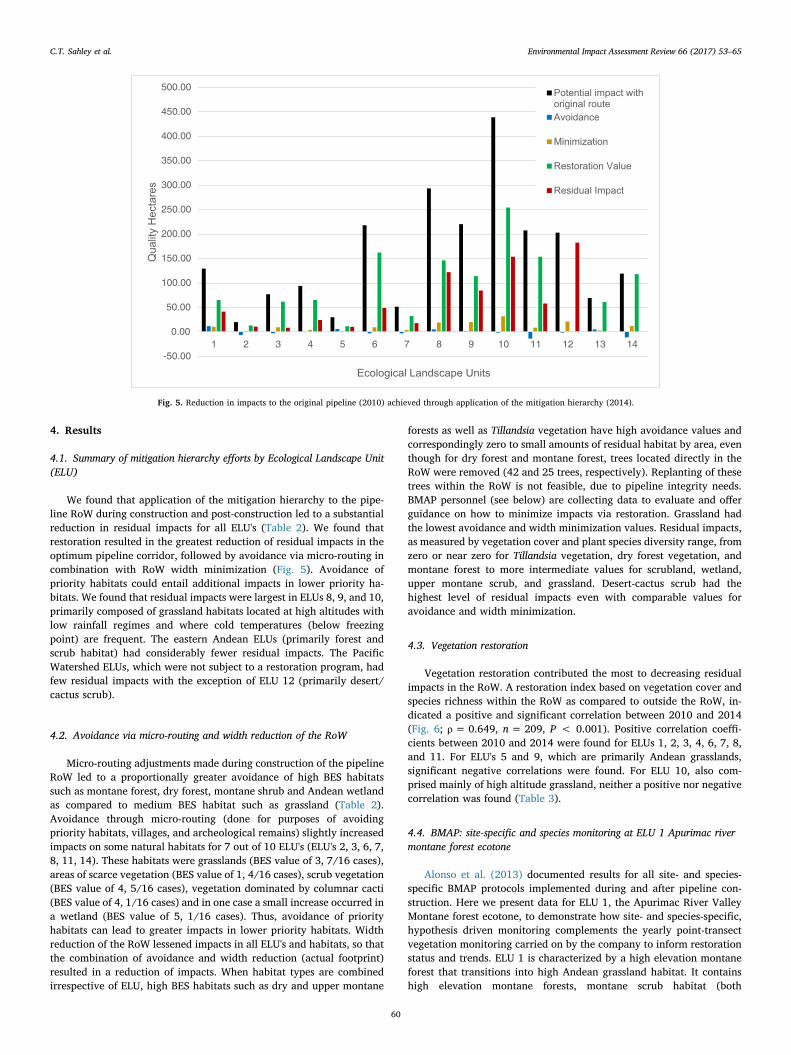
Vegetation restoration contributed the most to decreasing residualimpacts in the RoW. A restoration index based on vegetation cover andspecies richness within the RoW as compared to outside the RoW, in-dicated a positive and significant correlation between 2010 and 2014(Fig. 6; ρ= 0.649, n= 209, P < 0.001). Positive correlation coeffi-cients between 2010 and 2014 were found for ELUs 1, 2, 3, 4, 6, 7, 8,and 11. For ELU's 5 and 9, which are primarily Andean grasslands,significant negative correlations were found. For ELU 10, also com-prised mainly of high altitude grassland, neither a positive nor negativecorrelation was found (Table 3).
4.4. BMAP: site-specific and species monitoring at ELU 1 Apurimac rivermontane forest ecotone
Alonso et al. (2013) documented results for all site- and species-specific BMAP protocols implemented during and after pipeline con-struction. Here we present data for ELU 1, the Apurimac River ValleyMontane forest ecotone, to demonstrate how site- and species-specific,hypothesis driven monitoring complements the yearly point-transectvegetation monitoring carried on by the company to inform restorationstatus and trends. ELU 1 is characterized by a high elevation montaneforest that transitions into high Andean grassland habitat. It containshigh elevation montane forests, montane scrub habitat (both
-50.00
0.00
50.00
100.00
150.00
200.00
250.00
300.00
350.00
400.00
450.00
500.00
1 2 3 4 5 6 7 8 9 10 11 12 13 14
Quality
Hecta
res
Ecological Landscape Units
Potential impact with
original route
Avoidance
Minimization
Restoration Value
Residual Impact
Fig. 5. Reduction in impacts to the original pipeline (2010) achieved through application of the mitigation hierarchy (2014).
C.T. Sahley et al. Environmental Impact Assessment Review 66 (2017) 53–65
60
comprising 24% of the RoW), tussock and sward forming grasslands,and one wetland (Domus Consultoria Ambiental 2007, Langstroth et al.2013).
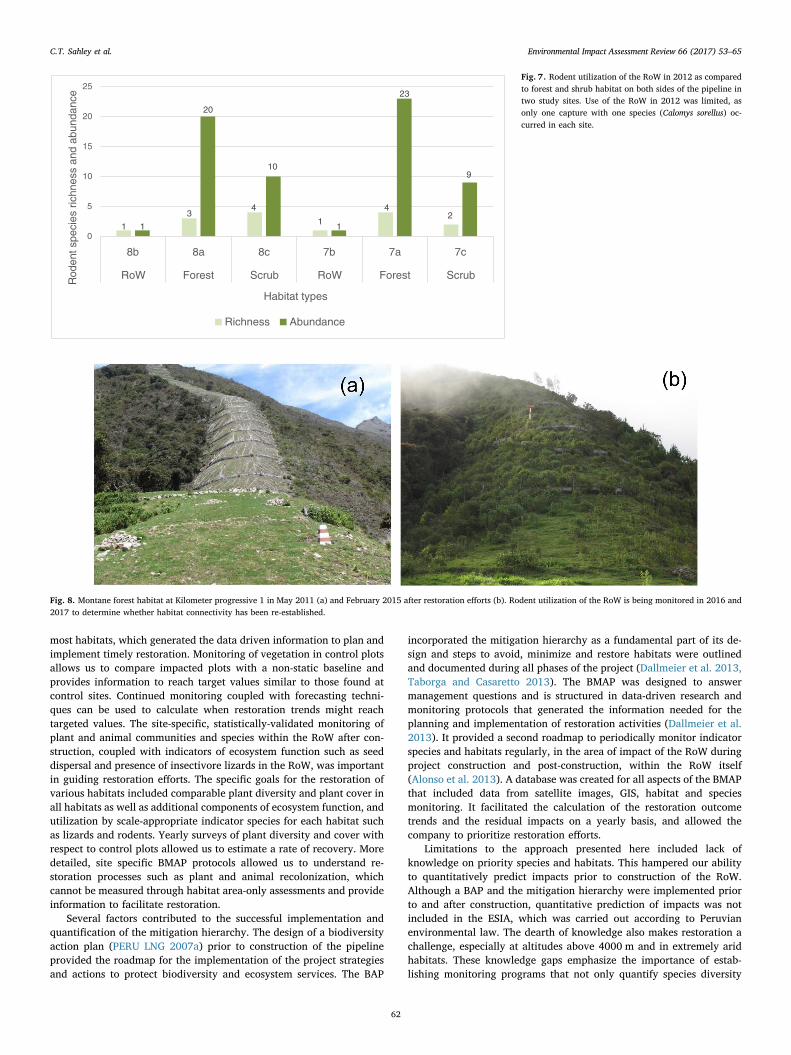
While total number of hectares of upper montane forest was rela-tively small in the RoW construction area, this habitat was identified ashighly sensitive in the ESIA (Walsh Peru 2005). The Ecological FieldSurvey (Domus Consultoria Ambiental 2007) and subsequent BMAPresearch protocols confirmed the presence of endemic species of birdsand small mammals, as well as a high diversity of plant species(Pacheco et al. 2013, Servat et al. 2013, Salas et al. 2013). Impactsduring RoW construction on lizards were not detected (Gutierrez et al.2013), and negative impacts on rodent abundance and diversity werenot found (Pacheco et al. 2013, Salas et al. 2013). However, due topipeline construction a reduction in utilization of the RoW by rodentsand subsequent rodent-mediated seed dispersal was detected (Fig. 7;Sahley et al. 2016).
Based on these findings, the BMAP adapted the rodent communitymonitoring program to include diet and seed dispersal studies (Sahleyet al. 2015, 2016). Plant species that produced fruits that rodents wereconsuming were grown in nurseries and then planted in the RoW torestore connectivity and promote seed dispersal services in the RoWwhich, in turn, increased small mammal utilization of the RoW,
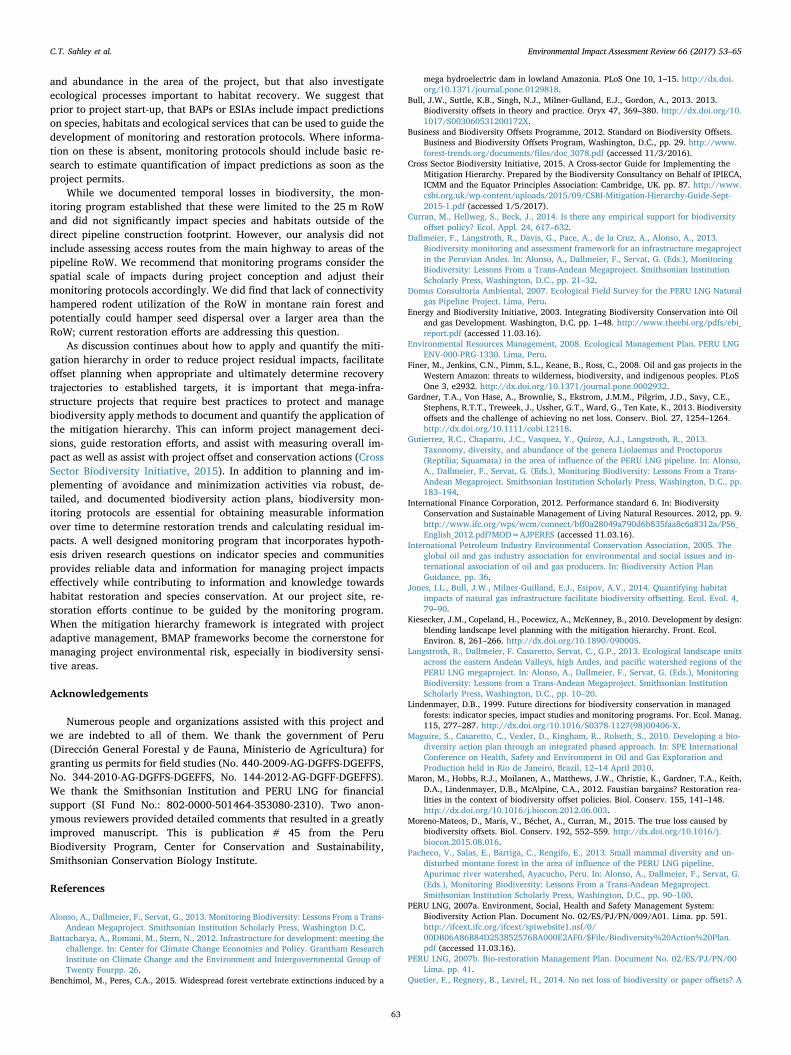
enhanced ecosystem function and biodiversity recovery (Pacheco et al.2013, Sahley et al. 2015, 2016, Servat et al. 2013; Fig.8).
This information was used to guide shrub re-planting efforts. Forexample, in 2014, two shrub species utilized by rodents were planted inthree different corridor designs in order to facilitate rodents crossingthe RoW. Site-specific monitoring protocols were adaptively adjusted tomonitor improvements in landscape connectivity and also provide ad-ditional data to set targets that measure restoration success, such ashabitat connectivity and effective seed dispersal.
5. Discussion
In this study we quantified avoidance, minimization, restoration,and residual impacts of the mitigation hierarchy for a natural gas pi-peline RoW located in the tropical Andes. We found that avoidancecombined with width minimization of the RoW contributed to reducingimpacts in all ELU's. High BES value habitats especially benefitted, andin most cases, restoration further reduced residual impacts over timeresulting in a positive restoration trajectory along most of the RoW.Measuring restoration was crucial as it is a response variable that allowsassessment of the effectiveness of mitigation measures as well as spe-cific restoration activities. Biodiversity impacts were limited to the pi-peline RoW (Alonso et al. 2013) similar to findings of Jones et al.(2014) who documented impacts limited to areas of the physical in-frastructure of a natural gas pipeline in Uzbekistan.
The vegetation restoration program combined with a site-specificand hypothesis-driven BMAP was used in an adaptive managementframework to inform and guide yearly company restoration efforts.These efforts measured impact on species as well as components ofecosystem health and function such as seed dispersal (Sahley et al.2016) that were not measured by analysis of satellite imagery or ve-getation surveys. Current restoration efforts at the site have in-corporated restoration of connectivity as a target with rodent utilizationof the RoW being an important indicator. This is an example whereoriginal site monitoring protocols emphasizing diversity and abundanceof species have been adjusted to include additional components basedon research results. Restoration efforts are currently ongoing as residualimpacts continue to decrease.
The spatial scale vegetation monitoring (point-transect monitoringfor ELU's 1–11) on a yearly basis provided information on restorationtrends. It allowed us to estimate residual impacts on a yearly basis for
Fig. 6. Scatterplot for restoration indices for all ELU's combined for2010–2014. The restoration index is significantly and positively cor-related with year. This indicates that if present trends continue, re-sidual impacts will continue to decrease.
Table 3Correlation coefficients and P values for Ecological landscape units 1–11.
Ecological Landscape Unit(ELU)
Number ofsamples (n)
Correlationcoefficient (ρ)
P value
1-Apurimac River ValleyMontane Forest Ecotone
209 0.616 P < 0.01
2-Campana Watershed 50 0.643 P < 0.0013-Torobamba River Valley 200 0.451 P < 0.0014-Sillaccasa Sierra 126 0.356 P < 0.0015-Yucay River Valley 146 −0.185 P < 0.056-Huamanga-Vischongo 298 0.652 P < 0.0017-Vinchos River Valley 134 0.326 P < 0.0058-Apacheta High Sierras 420 0.196 P < 0.0019-Pampas Palmitos Basin 238 −0.192 P < 0.00110-Huaytara High Plains and
Ridges542 0.004 P= 0.917
11-Pisco-Ica WatershedDivide
210 0.416 P= 0.001
C.T. Sahley et al. Environmental Impact Assessment Review 66 (2017) 53–65
61
most habitats, which generated the data driven information to plan andimplement timely restoration. Monitoring of vegetation in control plotsallows us to compare impacted plots with a non-static baseline andprovides information to reach target values similar to those found atcontrol sites. Continued monitoring coupled with forecasting techni-ques can be used to calculate when restoration trends might reachtargeted values. The site-specific, statistically-validated monitoring ofplant and animal communities and species within the RoW after con-struction, coupled with indicators of ecosystem function such as seeddispersal and presence of insectivore lizards in the RoW, was importantin guiding restoration efforts. The specific goals for the restoration ofvarious habitats included comparable plant diversity and plant cover inall habitats as well as additional components of ecosystem function, andutilization by scale-appropriate indicator species for each habitat suchas lizards and rodents. Yearly surveys of plant diversity and cover withrespect to control plots allowed us to estimate a rate of recovery. Moredetailed, site specific BMAP protocols allowed us to understand re-storation processes such as plant and animal recolonization, whichcannot be measured through habitat area-only assessments and provideinformation to facilitate restoration.
Several factors contributed to the successful implementation andquantification of the mitigation hierarchy. The design of a biodiversityaction plan (PERU LNG 2007a) prior to construction of the pipelineprovided the roadmap for the implementation of the project strategiesand actions to protect biodiversity and ecosystem services. The BAP
incorporated the mitigation hierarchy as a fundamental part of its de-sign and steps to avoid, minimize and restore habitats were outlinedand documented during all phases of the project (Dallmeier et al. 2013,Taborga and Casaretto 2013). The BMAP was designed to answermanagement questions and is structured in data-driven research andmonitoring protocols that generated the information needed for theplanning and implementation of restoration activities (Dallmeier et al.2013). It provided a second roadmap to periodically monitor indicatorspecies and habitats regularly, in the area of impact of the RoW duringproject construction and post-construction, within the RoW itself(Alonso et al. 2013). A database was created for all aspects of the BMAPthat included data from satellite images, GIS, habitat and speciesmonitoring. It facilitated the calculation of the restoration outcometrends and the residual impacts on a yearly basis, and allowed thecompany to prioritize restoration efforts.
Limitations to the approach presented here included lack ofknowledge on priority species and habitats. This hampered our abilityto quantitatively predict impacts prior to construction of the RoW.Although a BAP and the mitigation hierarchy were implemented priorto and after construction, quantitative prediction of impacts was notincluded in the ESIA, which was carried out according to Peruvianenvironmental law. The dearth of knowledge also makes restoration achallenge, especially at altitudes above 4000 m and in extremely aridhabitats. These knowledge gaps emphasize the importance of estab-lishing monitoring programs that not only quantify species diversity
1
34
1
42
1
20
10
1
23
9
0
5
10
15
20
25
8b 8a 8c 7b 7a 7c
RoW Forest Scrub RoW Forest ScrubRod
ent s
peci
es r
ichn
ess
and
abun
danc
e
Habitat types
Richness Abundance
Fig. 7. Rodent utilization of the RoW in 2012 as comparedto forest and shrub habitat on both sides of the pipeline intwo study sites. Use of the RoW in 2012 was limited, asonly one capture with one species (Calomys sorellus) oc-curred in each site.
Fig. 8. Montane forest habitat at Kilometer progressive 1 in May 2011 (a) and February 2015 after restoration efforts (b). Rodent utilization of the RoW is being monitored in 2016 and2017 to determine whether habitat connectivity has been re-established.
C.T. Sahley et al. Environmental Impact Assessment Review 66 (2017) 53–65
62
and abundance in the area of the project, but that also investigateecological processes important to habitat recovery. We suggest thatprior to project start-up, that BAPs or ESIAs include impact predictionson species, habitats and ecological services that can be used to guide thedevelopment of monitoring and restoration protocols. Where informa-tion on these is absent, monitoring protocols should include basic re-search to estimate quantification of impact predictions as soon as theproject permits.
While we documented temporal losses in biodiversity, the mon-itoring program established that these were limited to the 25 m RoWand did not significantly impact species and habitats outside of thedirect pipeline construction footprint. However, our analysis did notinclude assessing access routes from the main highway to areas of thepipeline RoW. We recommend that monitoring programs consider thespatial scale of impacts during project conception and adjust theirmonitoring protocols accordingly. We did find that lack of connectivityhampered rodent utilization of the RoW in montane rain forest andpotentially could hamper seed dispersal over a larger area than theRoW; current restoration efforts are addressing this question.
As discussion continues about how to apply and quantify the miti-gation hierarchy in order to reduce project residual impacts, facilitateoffset planning when appropriate and ultimately determine recoverytrajectories to established targets, it is important that mega-infra-structure projects that require best practices to protect and managebiodiversity apply methods to document and quantify the application ofthe mitigation hierarchy. This can inform project management deci-sions, guide restoration efforts, and assist with measuring overall im-pact as well as assist with project offset and conservation actions (CrossSector Biodiversity Initiative, 2015). In addition to planning and im-plementing of avoidance and minimization activities via robust, de-tailed, and documented biodiversity action plans, biodiversity mon-itoring protocols are essential for obtaining measurable informationover time to determine restoration trends and calculating residual im-pacts. A well designed monitoring program that incorporates hypoth-esis driven research questions on indicator species and communitiesprovides reliable data and information for managing project impactseffectively while contributing to information and knowledge towardshabitat restoration and species conservation. At our project site, re-storation efforts continue to be guided by the monitoring program.When the mitigation hierarchy framework is integrated with projectadaptive management, BMAP frameworks become the cornerstone formanaging project environmental risk, especially in biodiversity sensi-tive areas.
Acknowledgements
Numerous people and organizations assisted with this project andwe are indebted to all of them. We thank the government of Peru(Dirección General Forestal y de Fauna, Ministerio de Agricultura) forgranting us permits for field studies (No. 440-2009-AG-DGFFS-DGEFFS,No. 344-2010-AG-DGFFS-DGEFFS, No. 144-2012-AG-DGFF-DGEFFS).We thank the Smithsonian Institution and PERU LNG for financialsupport (SI Fund No.: 802-0000-501464-353080-2310). Two anon-ymous reviewers provided detailed comments that resulted in a greatlyimproved manuscript. This is publication # 45 from the PeruBiodiversity Program, Center for Conservation and Sustainability,Smithsonian Conservation Biology Institute.
References
Alonso, A., Dallmeier, F., Servat, G., 2013. Monitoring Biodiversity: Lessons From a Trans-Andean Megaproject. Smithsonian Institution Scholarly Press, Washington D.C.
Battacharya, A., Romani, M., Stern, N., 2012. Infrastructure for development: meeting thechallenge. In: Center for Climate Change Economics and Policy. Grantham ResearchInstitute on Climate Change and the Environment and Intergovernmental Group ofTwenty Fourpp. 26.
Benchimol, M., Peres, C.A., 2015. Widespread forest vertebrate extinctions induced by a
mega hydroelectric dam in lowland Amazonia. PLoS One 10, 1–15. http://dx.doi.org/10.1371/journal.pone.0129818.
Bull, J.W., Suttle, K.B., Singh, N.J., Milner-Gulland, E.J., Gordon, A., 2013. 2013.Biodiversity offsets in theory and practice. Oryx 47, 369–380. http://dx.doi.org/10.1017/S003060531200172X.
Business and Biodiversity Offsets Programme, 2012. Standard on Biodiversity Offsets.Business and Biodiversity Offsets Program, Washington, D.C., pp. 29. http://www.forest-trends.org/documents/files/doc_3078.pdf (accessed 11/3/2016).
Cross Sector Biodiversity Initiative, 2015. A Cross-sector Guide for Implementing theMitigation Hierarchy. Prepared by the Biodiversity Consultancy on Behalf of IPIECA,ICMM and the Equator Principles Association: Cambridge, UK. pp. 87. http://www.csbi.org.uk/wp-content/uploads/2015/09/CSBI-Mitigation-Hierarchy-Guide-Sept-2015-1.pdf (accessed 1/5/2017).
Curran, M., Hellweg, S., Beck, J., 2014. Is there any empirical support for biodiversityoffset policy? Ecol. Appl. 24, 617–632.
Dallmeier, F., Langstroth, R., Davis, G., Pace, A., de la Cruz, A., Alonso, A., 2013.Biodiversity monitoring and assessment framework for an infrastructure megaprojectin the Peruvian Andes. In: Alonso, A., Dallmeier, F., Servat, G. (Eds.), MonitoringBiodiversity: Lessons From a Trans-Andean Megaproject. Smithsonian InstitutionScholarly Press, Washington, D.C., pp. 21–32.
Domus Consultoria Ambiental, 2007. Ecological Field Survey for the PERU LNG Naturalgas Pipeline Project. Lima, Peru.
Energy and Biodiversity Initiative, 2003. Integrating Biodiversity Conservation into Oiland gas Development. Washington, D.C. pp. 1–48. http://www.theebi.org/pdfs/ebi_report.pdf (accessed 11.03.16).
Environmental Resources Management, 2008. Ecological Management Plan. PERU LNGENV-000-PRG-1330. Lima, Peru.
Finer, M., Jenkins, C.N., Pimm, S.L., Keane, B., Ross, C., 2008. Oil and gas projects in theWestern Amazon: threats to wilderness, biodiversity, and indigenous peoples. PLoSOne 3, e2932. http://dx.doi.org/10.1371/journal.pone.0002932.
Gardner, T.A., Von Hase, A., Brownlie, S., Ekstrom, J.M.M., Pilgrim, J.D., Savy, C.E.,Stephens, R.T.T., Treweek, J., Ussher, G.T., Ward, G., Ten Kate, K., 2013. Biodiversityoffsets and the challenge of achieving no net loss. Conserv. Biol. 27, 1254–1264.http://dx.doi.org/10.1111/cobi.12118.
Gutierrez, R.C., Chaparro, J.C., Vasquez, Y., Quiroz, A.J., Langstroth, R., 2013.Taxonomy, diversity, and abundance of the genera Liolaemus and Proctoporus(Reptilia; Squamata) in the area of influence of the PERU LNG pipeline. In: Alonso,A., Dallmeier, F., Servat, G. (Eds.), Monitoring Biodiversity: Lessons From a Trans-Andean Megaproject. Smithsonian Institution Scholarly Press, Washington, D.C., pp.183–194.
International Finance Corporation, 2012. Performance standard 6. In: BiodiversityConservation and Sustainable Management of Living Natural Resources. 2012, pp. 9.http://www.ifc.org/wps/wcm/connect/bff0a28049a790d6b835faa8c6a8312a/PS6_English_2012.pdf?MOD=AJPERES (accessed 11.03.16).
International Petroleum Industry Environmental Conservation Association, 2005. Theglobal oil and gas industry association for environmental and social issues and in-ternational association of oil and gas producers. In: Biodiversity Action PlanGuidance, pp. 36.
Jones, I.L., Bull, J.W., Milner-Guilland, E.J., Esipov, A.V., 2014. Quantifying habitatimpacts of natural gas infrastructure facilitate biodiversity offsetting. Ecol. Evol. 4,79–90.
Kiesecker, J.M., Copeland, H., Pocewicz, A., McKenney, B., 2010. Development by design:blending landscape level planning with the mitigation hierarchy. Front. Ecol.Environ. 8, 261–266. http://dx.doi.org/10.1890/090005.
Langstroth, R., Dallmeier, F. Casaretto, Servat, C., G.P., 2013. Ecological landscape unitsacross the eastern Andean Valleys, high Andes, and pacific watershed regions of thePERU LNG megaproject. In: Alonso, A., Dallmeier, F., Servat, G. (Eds.), MonitoringBiodiversity: Lessons from a Trans-Andean Megaproject. Smithsonian InstitutionScholarly Press, Washington, D.C., pp. 10–20.
Lindenmayer, D.B., 1999. Future directions for biodiversity conservation in managedforests: indicator species, impact studies and monitoring programs. For. Ecol. Manag.115, 277–287. http://dx.doi.org/10.1016/S0378-1127(98)00406-X.
Maguire, S., Casaretto, C., Vexler, D., Kingham, R., Rolseth, S., 2010. Developing a bio-diversity action plan through an integrated phased approach. In: SPE InternationalConference on Health, Safety and Environment in Oil and Gas Exploration andProduction held in Rio de Janeiro, Brazil, 12–14 April 2010.
Maron, M., Hobbs, R.J., Moilanen, A., Matthews, J.W., Christie, K., Gardner, T.A., Keith,D.A., Lindenmayer, D.B., McAlpine, C.A., 2012. Faustian bargains? Restoration rea-lities in the context of biodiversity offset policies. Biol. Conserv. 155, 141–148.http://dx.doi.org/10.1016/j.biocon.2012.06.003.
Moreno-Mateos, D., Maris, V., Béchet, A., Curran, M., 2015. The true loss caused bybiodiversity offsets. Biol. Conserv. 192, 552–559. http://dx.doi.org/10.1016/j.biocon.2015.08.016.
Pacheco, V., Salas, E., Barriga, C., Rengifo, E., 2013. Small mammal diversity and un-disturbed montane forest in the area of influence of the PERU LNG pipeline,Apurimac river watershed, Ayacucho, Peru. In: Alonso, A., Dallmeier, F., Servat, G.(Eds.), Monitoring Biodiversity: Lessons From a Trans-Andean Megaproject.Smithsonian Institution Scholarly Press, Washington, D.C., pp. 90–100.
PERU LNG, 2007a. Environment, Social, Health and Safety Management System:Biodiversity Action Plan. Document No. 02/ES/PJ/PN/009/A01. Lima. pp. 591.http://ifcext.ifc.org/ifcext/spiwebsite1.nsf/0/00DB06A86B84D253852576BA000E2AF0/$File/Biodiversity%20Action%20Plan.pdf (accessed 11.03.16).
PERU LNG, 2007b. Bio-restoration Management Plan. Document No. 02/ES/PJ/PN/00Lima. pp. 41.
Quetier, F., Regnery, B., Levrel, H., 2014. No net loss of biodiversity or paper offsets? A
C.T. Sahley et al. Environmental Impact Assessment Review 66 (2017) 53–65
63
critical review of the French no net loss policy. Environ. Sci. Pol. 38, 120–131.Redford, K.H., Huntley, B.J., Roe, D., Hammond, T., Zimsky, M., Lovejoy, T.E., da
Fonseca, G.A.B., Rodriguez, C.M., Cowling, R.M., 2015. Mainstreaming biodiversity:conservation for the twenty-first century. Front. Ecol. Evol. 3, 1–7. http://dx.doi.org/10.3389/fevo.2015.00137.
Saenz, S., Walschburger, T., Gonzalez, J.C., Leon, J., McKenney, B., Kiesecker, J., 2013.Development by design in Colombia: making mitigation decisions consistent withconservation outcomes. PLoS One 8, e81831. http://dx.doi.org/10.1371/journal.pone.0081831.
Sahley, C., Cervantes, K., Pacheco, V., Salas, E., Paredes, D., Alonso, A., 2015. Diet of asigmodontine rodent assemblage in a Peruvian montane forest. J. Mammal. 96,1071–1080.
Sahley, C., Cervantes, K., Salas, E., Paredes, D., Pacheco, V., Alonso, A., 2016. Primaryseed dispersal by a sigmodontine rodent assemblage in a Peruvian montane rain-forest. J. Trop. Biol. 32, 125–134.
Salas, E., Barriga, C., Rengifo, E., Pacheco, V., 2013. Assessment of the impact of thePERU LNG Pipeline on Sigmodontine rodent populations in a montane forest ofAyacucho, Peru. In: Alonso, A., Dallmeier, F., Servat, G. (Eds.), MonitoringBiodiversity: Lessons From a Trans-Andean Megaproject. Smithsonian InstitutionScholarly Press, Washington, D.C., pp. 101–109.
Servat, G., Feria, T.P., Hurtado, N., Mendoza, W., Alcocer, R., 2013. Potential distributionand habitat characterization of atlapetes melanopsis (Aves: Emberizidae) in a mon-ante forest ecotone of the Apurimac river valley. In: Alonso, A., Dallmeier, F., Servat,G. (Eds.), Monitoring Biodiversity: Lessons From a Trans-Andean Megaproject.Smithsonian Institution Scholarly Press, Washington, D.C., pp. 141–153 2013.
Taborga, P., Casaretto, C., 2013. Mitigation hierarchy for biodiversity conservation. In:IAIA13 Conference Proceedings; Impact Assessment for the Next Generation, pp. 6.http://conferences.iaia.org/2013/pdf/Final%20papers%20review%20process%2013/MITIGATION%20HIERARCHY%20FOR%20BIODIVERSITY%20CONSERVATION%20.pdf (accessed 11.03.16).
The Biodiversity Consultancy and Fauna and Flora International, 2012a. Net positiveimpact forecast for the Oyu Tolgoi project. In: ESIA Appendix. 5. pp. 1–28. http://ot.mn/environmental-social-impact-assessment/ (accessed 11.03.16).
The Biodiversity Consultancy and Fauna and Flora International, 2012b. ESIA Appendix 4Biodiversity Offsets Strategy for the Oyu Tolgoi Project. ESIA Oyo Tolgoi Proj. 55. pp.1–55. http://ot.mn/environmental-social-impact-assessment/ (accessed 11.03.16).
Villarroya, A., Barros, A.C., Kiesecker, J., 2014. Policy development for environmentallicensing and biodiversity offsets in Latin America. PLoS One 2014, 9, e107144 .http://dx.doi.org/10.1371/journal.pone.0107144.
Walsh Peru, 2005. Environmental and Social Impact Assessment of the Natural GasPipeline Project From Ayacucho to the Liquefaction Plant. Walsh Peru, Lima, Peru.
Winemiller, K.O., McIntyre, P.B., Castello, L., Fluet-Chouinard, E., Giarrizzo, T., Nam, S.,Baird, I.G., Darwall, W., Lujan, N.K., Harrison, I., Stiassny, M.L.J., Silvano, R.A.M.,Fitzgerald, D.B., Pelicice, F.M., Agostinho, A.A., Gomes, L.C., Albert, J.S., Baran, E.,Petrere, M., Zarfl, C., Mulligan, M., Sullivan, J.P., Arantes, C.C., Sousa, L.M., Koning,A.A., Hoeinghaus, D.J., Sabaj, M., Lundberg, J.G., Armbruster, J., Thieme, M.L.,Petry, P., Zuanon, J., Vilara, G.T., Snoeks, J., Ou, C., Rainboth, W., Pavanelli, C.S.,Akama, A., van Soesbergen, A., Saenz, L., 2016. Balancing hydropower and biodi-versity in the Amazon, Congo, and Mekong. Science 351, 128–129. http://dx.doi.org/10.1126/science.aac7082.
World Resources Institute, 2008. Ecosystem services. In: A Guide for Decision Makers, pp.1–96.
C. T Sahley is an ecologist and conservation biologistwho has worked extensively in Latin America. She stu-died bat and hummingbird pollination of columnar cactifor her PhD at the University of Miami and later foundeda non-profit conservation organization in Peru thatworked with local communities in the Peruvian Andes todevelop sustainable wildlife management strategies. Sheworked as the Managing Director of the Andean andMarine Biodiversity and Assessment Program of theSmithsonian Conservation Biology Institute in Peru forthree years where she assisted with developing and im-plementing biodiversity and monitoring programs toquantify and reduce project impacts. She currently worksas a biodiversity research consultant.
B. Vildoso holds a BSc. in Biology - Ecology and is currentlyfinishing a MSc. degree in Applied Ecology both from theNational Agrarian La Molina University. He has10 years ofexperience in development and execution of environmentalimpacts assessments, mitigation management plans, biodi-versity monitoring, restoration and workshops with commu-nities, in marine and terrestrial ecosystems of Perú. The lastfour years he has been working as the environmental pro-grams representative at Hunt LNG, focused on the applicationof ecological restoration from results of biodiversity mon-itoring and the application and quantification of the mitiga-tion hierarchy to minimize impacts to biodiversity and eco-system services.Mail: [email protected]: Av. Victor A. Belaunde 147, Tower 12, 2nd Floor,San Isidro, Perú.
C. Casaretto is a Peruvian biologist who graduated fromLa Molina Agrarian University. She obtained her master'sdegree in Natural Resources Management from UtrechtUniversity, The Netherlands. She started her professionalcareer developing biodiversity conservation programs inprotected areas. She has worked with conservation pro-jects in Costa Rica and Vietnam and has assisted withdeveloping environmental impact assessments for the oiland gas sector. In 2008 she started working for Peru LNGas Environmental Coordinator and later worked as theirEnvironmental Manager for four years. She currentlyworks as an independent consultant.
P. Taborga is a Civil Engineer with twenty years of ex-perience in energy, oil & gas and transportation projectsin Peru and Bolivia. He has an MSc. Degree inEnvironmental Engineering from UK's NewcastleUniversity. Since 2007, Mr. Taborga works for Hunt LNGOperating Company, operator of PERU LNG, a 408 kmpipeline across the Andes, an LNG Facility in the coastand a marine terminal. Pablo is PERU LNG's QHSEManager and oversees the implementation of the miti-gation hierarchy, biodiversity monitoring programs andconservation initiatives. He has valuable experience inEnvironmental Impacts Assessments and in implementingEnvironmental, Health and Safety management systemsto control risks and impacts in large infrastructure pro-jects.
R. Linares-Palomino has a PhD in Biodiversity andEcology from the University of Göttingen and is theManaging Director of the Biodiversity Monitoring andAssessment Program, a collaboration between theSmithsonian Institution's Center for Conservation andSustainability and PERU LNG to manage biodiversity re-lated issues during construction and operation of a trans-Andean gas pipeline. His scientific interests center aroundunderstanding the ecology of tropical Andean habitatsand their species under natural and modified conditions,and to apply this acquired information towards im-plementing and improving restoration and conservationactions.Email: [email protected]
K. Ledesma holds a bachelor's degree in forestry sciencesfrom Universidad Nacional Agraria, in Peru, and a mas-ter's degree in biological sciences from Florida AtlanticUniversity. She works as Program Coordinator for theBiodiversity Monitoring and Assessment Program(BMAP), Smithsonian Institution in Peru. She also con-ducts research on the ecology and distribution of a speciesof the viscacha (Lagidium) in the highlands of northernPeru and has authored two publications about a newspecies of viscacha.Email: [email protected]
C.T. Sahley et al. Environmental Impact Assessment Review 66 (2017) 53–65
64
G. Mamani has an engineering degree in animal hus-bandry from National Agrarian University La Molina(UNALM). He has an M.Sc. in management and con-servation of grasslands from UNALM, and is currentlyfinishing a PhD in ecology and rangeland management atthe same university. He has 16 years of experiencestudying camelids and grasslands. He has worked on re-search and management of grasslands in The MachuPicchu Program in Cusco and The Mountain Institute inAncash, Peru. He is a researcher and regional coordinatorof the Instituto Nacional de Inovación Agraria of Perusince 2003. He works as a consultant for private compa-nies and regional governments.Mail: [email protected]: Urb. Musa, Etapa III, Pasaje Las Fresas 257, Mza.2 Lte. 6, La Molina, Lima
F. Dallmeier is the Director, Center for Conservation andSustainability, SCBI of the Smithsonian Institution. Heoversees the international programs vision for the Centerfor Conservation and Sustainability with offices inWashington D.C., Peru and Gabon. He provides seniorpolicy advice and works with academia, governments,NGOs and the private and public sectors. He worksworldwide on critical habitats, protected areas, biodi-versity offsets, research and monitoring, “no net loss” and“net positive impact” for smart and green infrastructureprojects in sensitive habitats. Dr. Dallmeier received hisundergraduate degree in biology in 1977 from theUniversidad Central de Venezuela and his WildlifeBiology masters degree in 1984 and Ph.D. in 1986 fromColorado State University. Email: [email protected]
A. Alonso is a conservation biologist with theSmithsonian Conservation Biology Institute. He studiedthe ecology and conservation of monarch butterflies asthey overwinter in Mexico for his PhD at the University ofFlorida. Alfonso's current position of Managing Directorfor Field Programs focuses to integrate conservationneeds with development priorities to sustain biodiversity.He develops assessment and monitoring programs tominimize impacts on biodiversity during oil and gasmega-infrastructure projects. Alfonso enjoys giving lec-tures and working with people, and has extensive re-search travel in America, Africa and Asia. Alfonso haspublished> 50 peer reviewed articles and 5 books.
C.T. Sahley et al. Environmental Impact Assessment Review 66 (2017) 53–65
65