Embed Size (px)
Citation preview
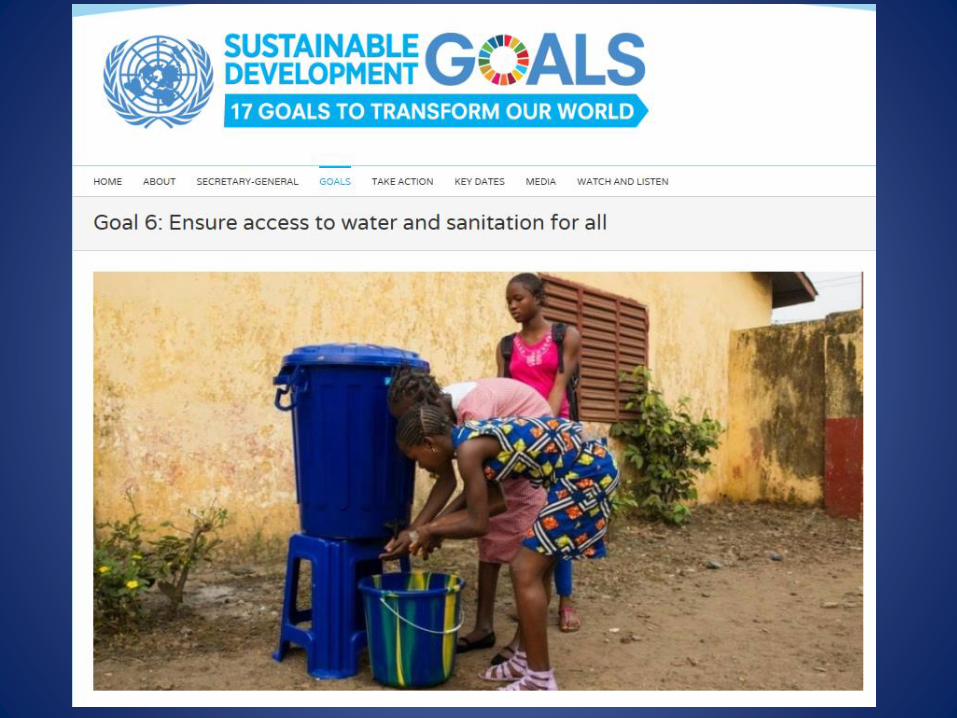
Environmental Health: Impact of Indoor plumbed water
International Meeting on Indigenous Child Health April 2017
Tom Hennessy
Timothy Thomas
Centers for Disease Control and Prevention/Arctic Investigations Program
Alaska Native Tribal Health Consortium

Faculty/Presenter Disclosure
• Tom Hennessy has no relevant financial relationships with the manufacturer(s) of commercial services discussed in this CME activity
• Timothy Thomas has no relevant financial relationships with the manufacturer(s) of commercial services discussed in this CME activity
Is water and sanitation service only a problem of the developing world?
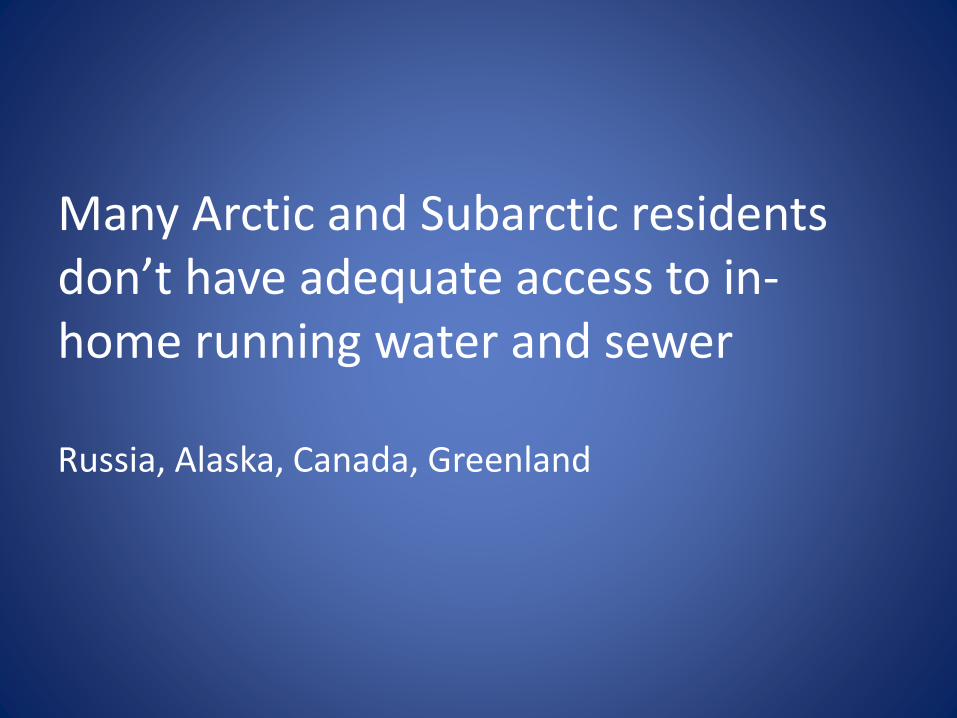
Many Arctic and Subarctic residents don’t have adequate access to in-home running water and sewer
Russia, Alaska, Canada, Greenland
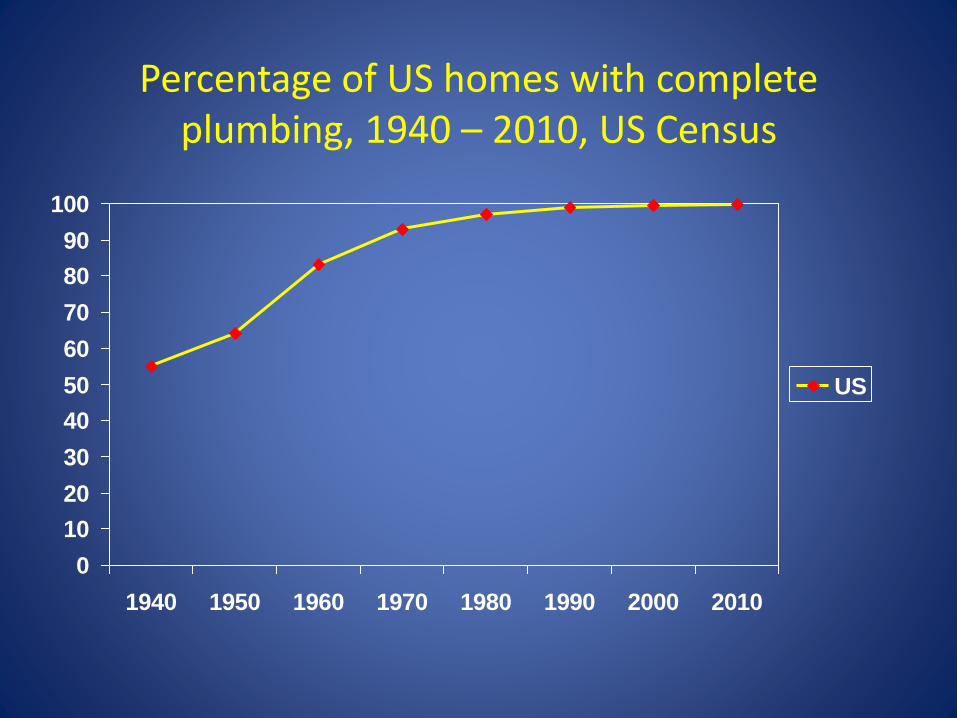
Percentage of US homes with complete plumbing, 1940 – 2010, US Census
0
10
20
30
40
50
60
70
80
90
100
1940 1950 1960 1970 1980 1990 2000 2010
US
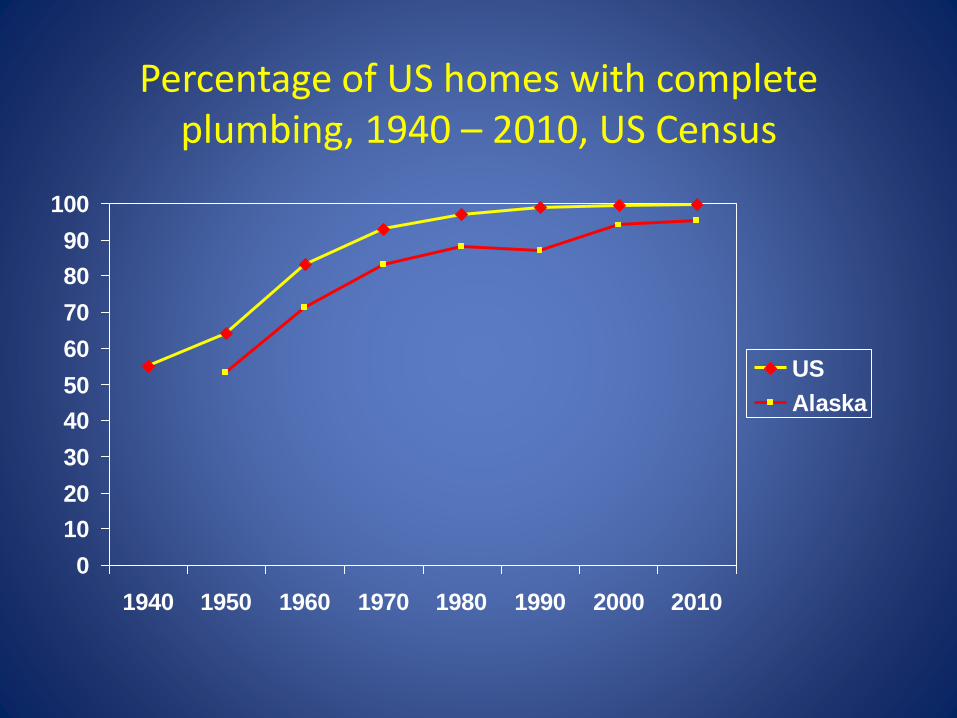
Percentage of US homes with complete plumbing, 1940 – 2010, US Census
0
10
20
30
40
50
60
70
80
90
100
1940 1950 1960 1970 1980 1990 2000 2010
US
Alaska
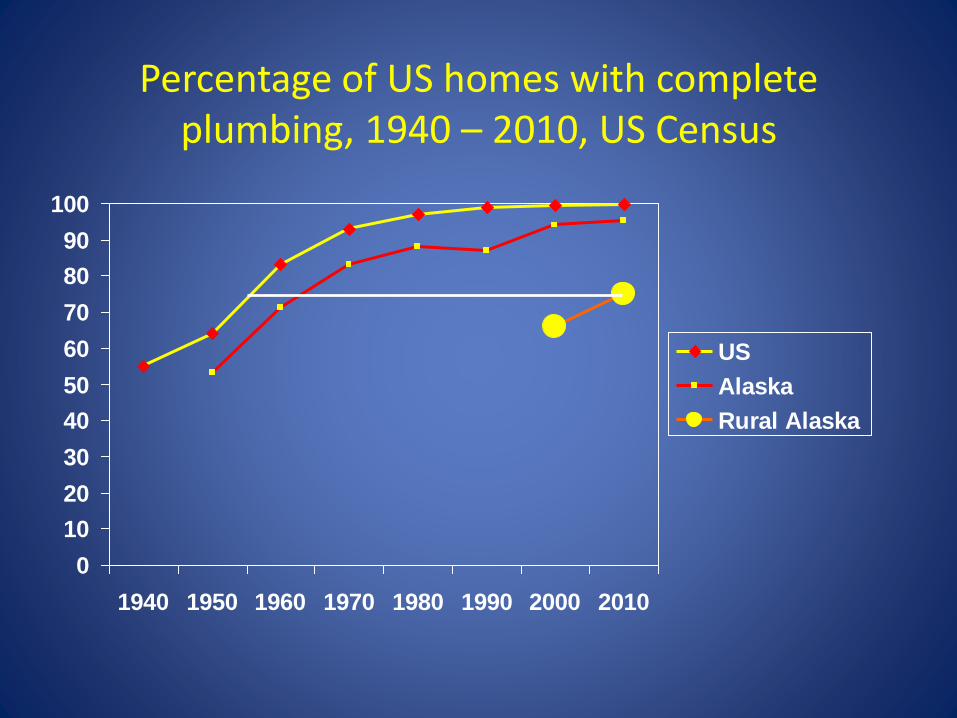
Percentage of US homes with complete plumbing, 1940 – 2010, US Census
0
10
20
30
40
50
60
70
80
90
100
1940 1950 1960 1970 1980 1990 2000 2010
US
Alaska
Rural Alaska
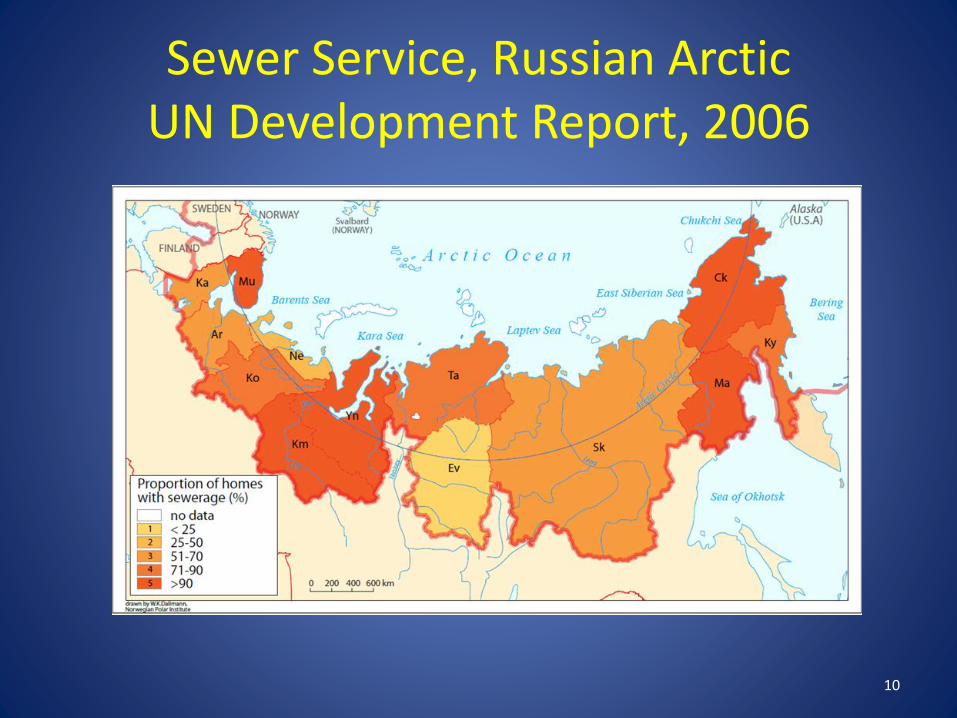
Sewer Service, Russian ArcticUN Development Report, 2006
10
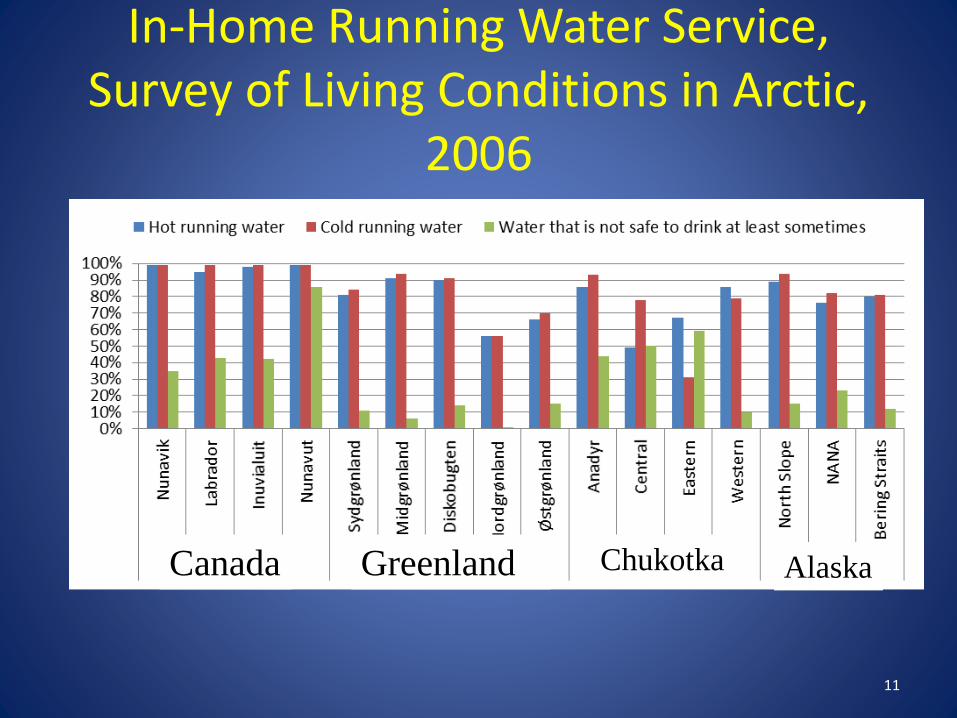
In-Home Running Water Service, Survey of Living Conditions in Arctic,
2006
11
Canada Greenland Chukotka Alaska
Main Message #1
• The Sustainable Development Goal for water and sanitation has not been met in the Circumpolar North
– Alaska, Canada, Greenland, Russia
12

Arctic Council Water/Sanitation Project
– “Improving Health through Safe and Affordable Access to Household Running Water and Sewer in Arctic and Sub-Arctic communities.”
– Objectives:
a) Promote innovations in water and sewer technologies and services provision.
b)Document the status of water and sewer service and associated health outcomes.
c) Describe climate-related vulnerabilities and adaptation strategies for community water and sewer systems and source water protection.
a) Water and sanitation survey, open until Sep 30, 2016
b) Jonathan Bressler in Climate Change session
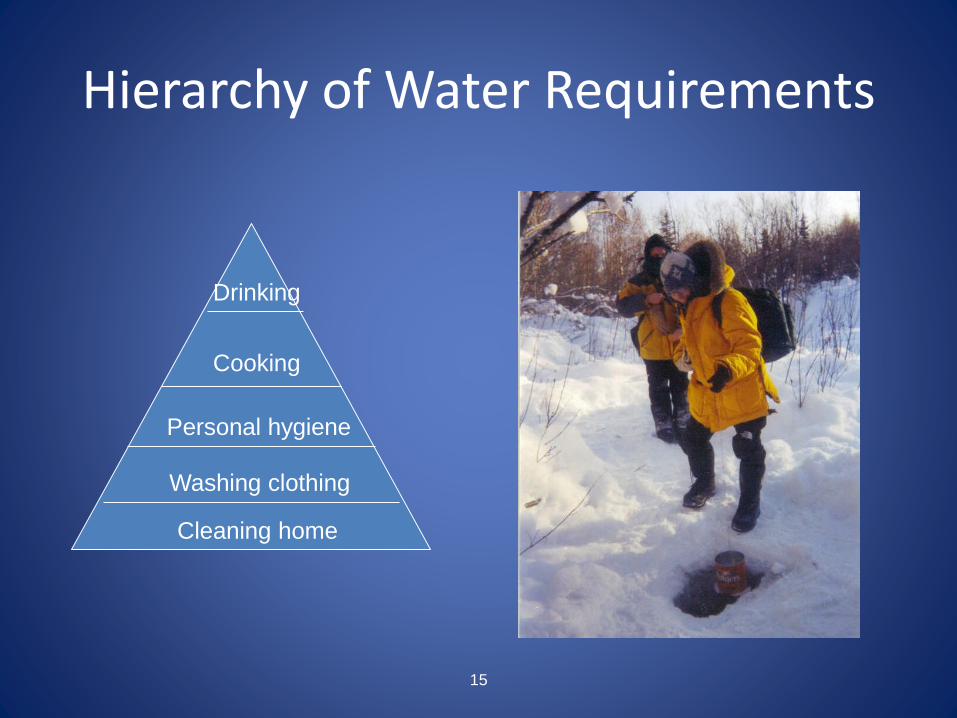
Hierarchy of Water Requirements
15
Drinking
Cooking
Personal hygiene
Washing clothing
Cleaning home
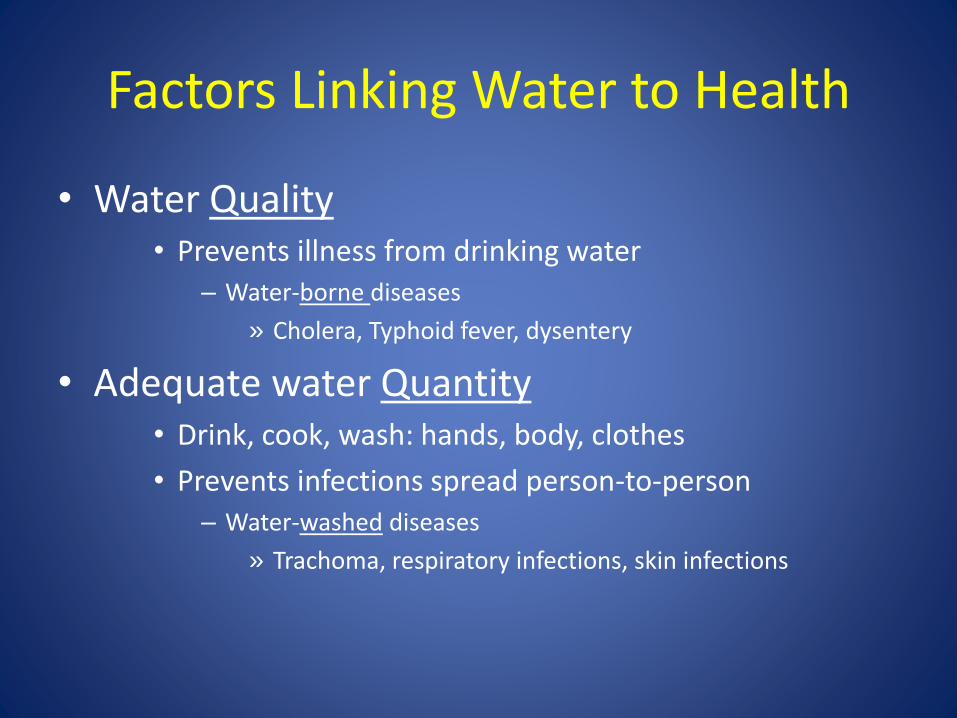
Factors Linking Water to Health
• Water Quality• Prevents illness from drinking water
– Water-borne diseases
» Cholera, Typhoid fever, dysentery
• Adequate water Quantity• Drink, cook, wash: hands, body, clothes
• Prevents infections spread person-to-person– Water-washed diseases
» Trachoma, respiratory infections, skin infections
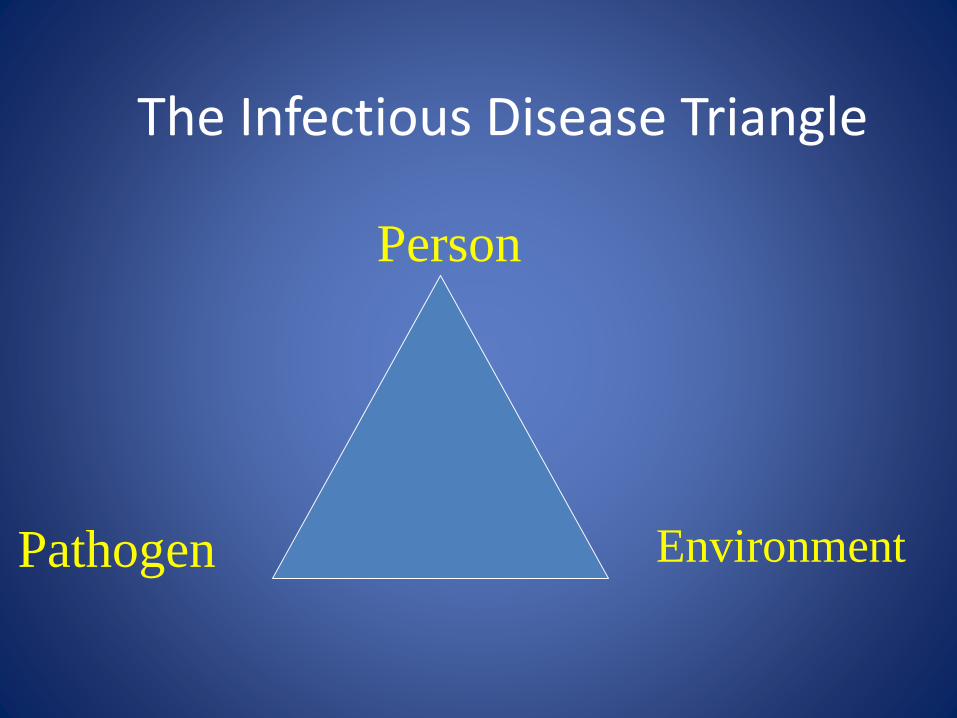
Person
Pathogen Environment
The Infectious Disease Triangle
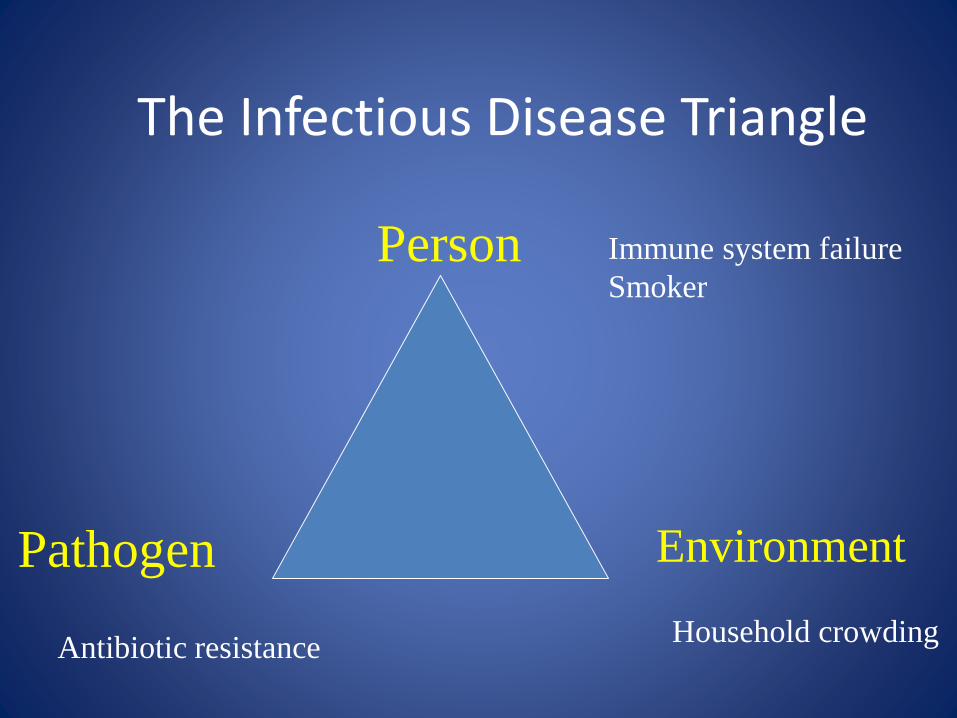
Person
Pathogen Environment
The Infectious Disease Triangle
Immune system failure
Smoker
Antibiotic resistanceHousehold crowding
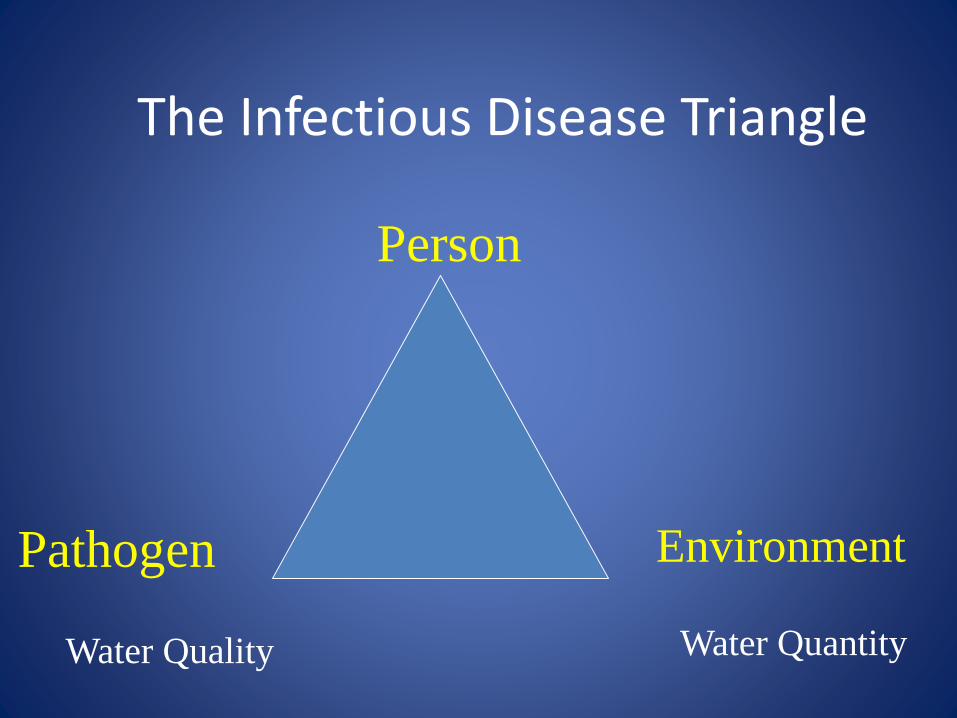
Person
Pathogen Environment
The Infectious Disease Triangle
Water Quality Water Quantity
20
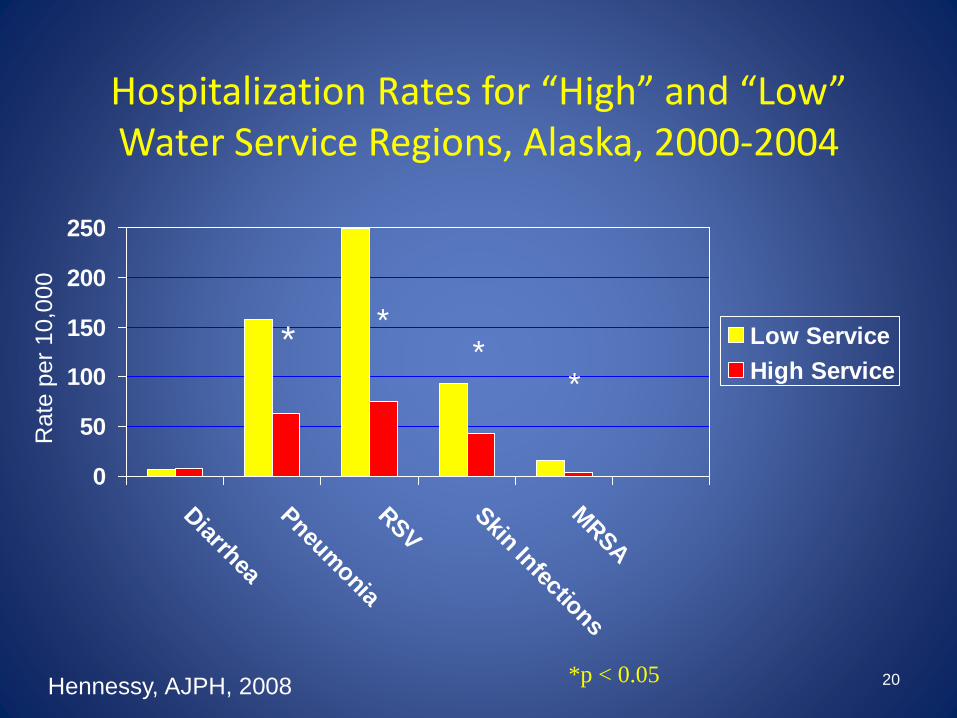
Hospitalization Rates for “High” and “Low” Water Service Regions, Alaska, 2000-2004
0
50
100
150
200
250
Diarrhea
Pneum
onia
RSV
Skin Infections
MRSA
Low Service
High Service* *
*
*
Hennessy, AJPH, 2008
Rate
per
10,0
00
*p < 0.05
0
50
100
150
200
250
Diarrhea
Pneum
onia
Resp S
yncytial Virus
Skin Infections
Methicillin R
S.aureus
Low Service
High Service
21
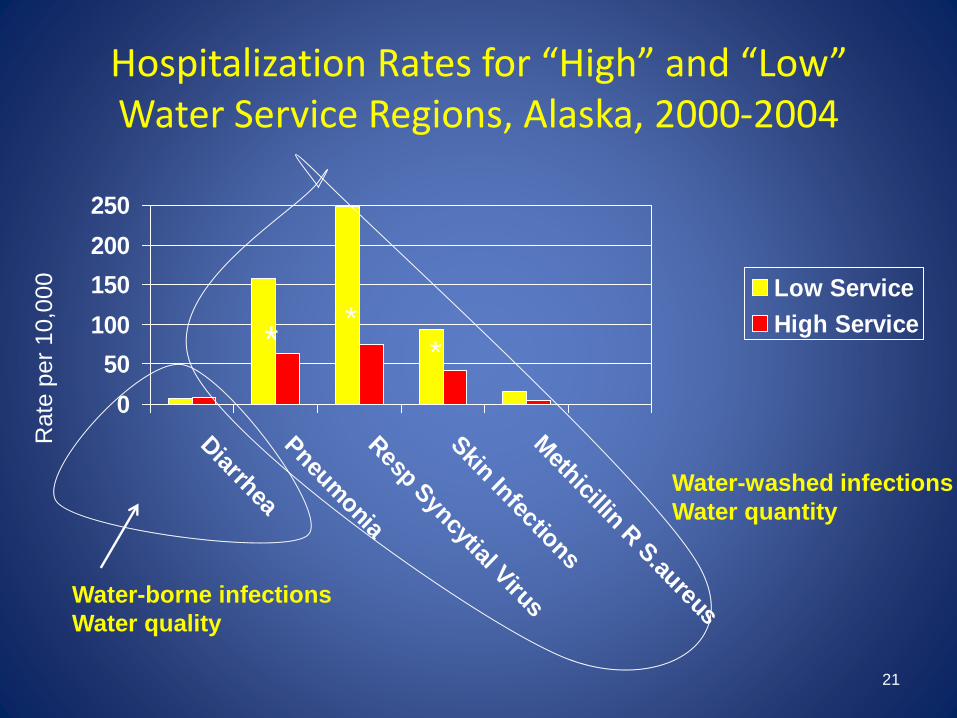
Hospitalization Rates for “High” and “Low” Water Service Regions, Alaska, 2000-2004
* **
Rate
per
10,0
00
Water-borne infections
Water quality
Water-washed infections
Water quantity
Main Message #2
• For health, water quantity is as important as water quality.
23
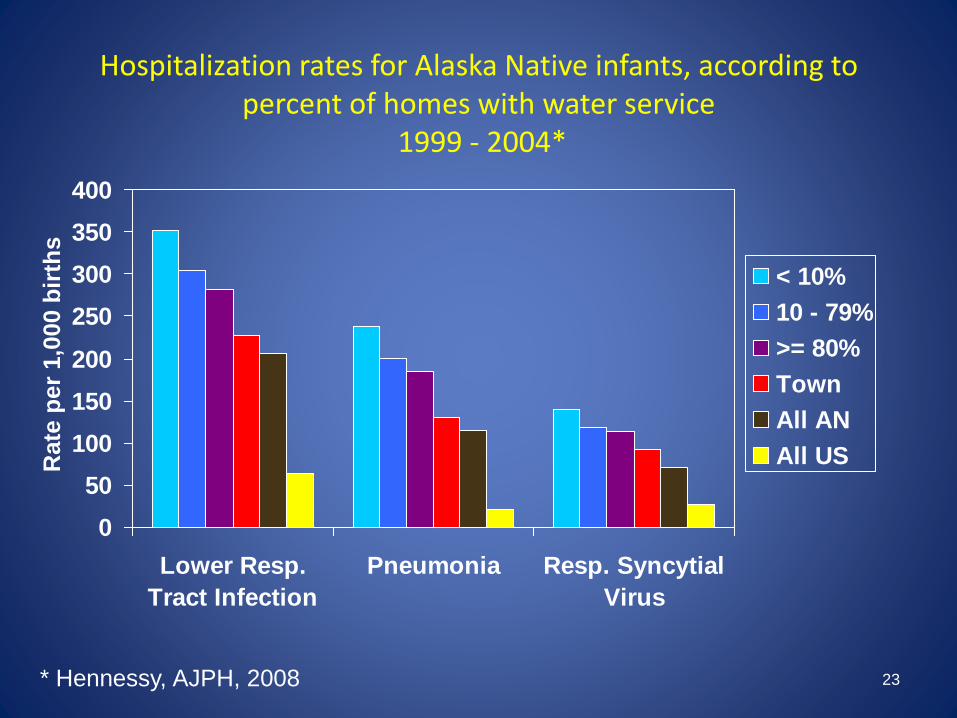
Hospitalization rates for Alaska Native infants, according to percent of homes with water service
1999 - 2004*
0
50
100
150
200
250
300
350
400
Lower Resp.
Tract Infection
Pneumonia Resp. Syncytial
Virus
< 10%
10 - 79%
>= 80%
Town
All AN
All USRate
per
1,0
00 b
irth
s
* Hennessy, AJPH, 2008
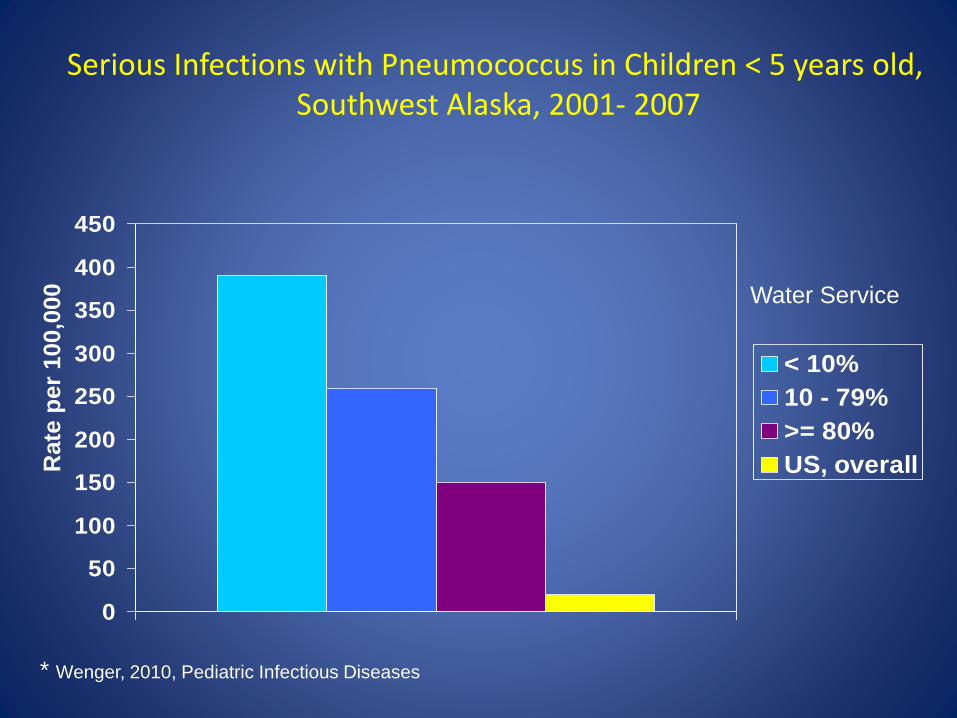
Serious Infections with Pneumococcus in Children < 5 years old,Southwest Alaska, 2001- 2007
0
50
100
150
200
250
300
350
400
450
< 10%
10 - 79%
>= 80%
US, overallRate
per
100,0
00 Water Service
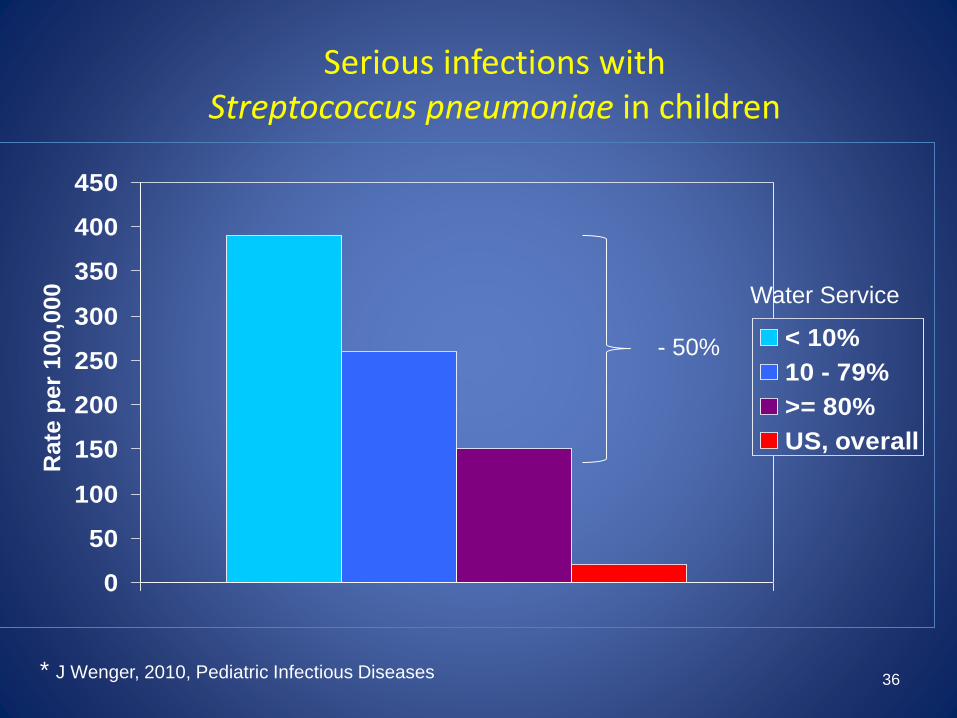
* Wenger, 2010, Pediatric Infectious Diseases
How water helps to prevent Respiratory Infections
– Transmitted by
• Cough/sneeze droplets
• Contaminated hands or surfaces
– Transmission prevented by
• Hand washing, surface cleaning
– Other factors play a role
• Crowding, vaccinations, cough/sneeze hygiene, breastfeeding
25
26
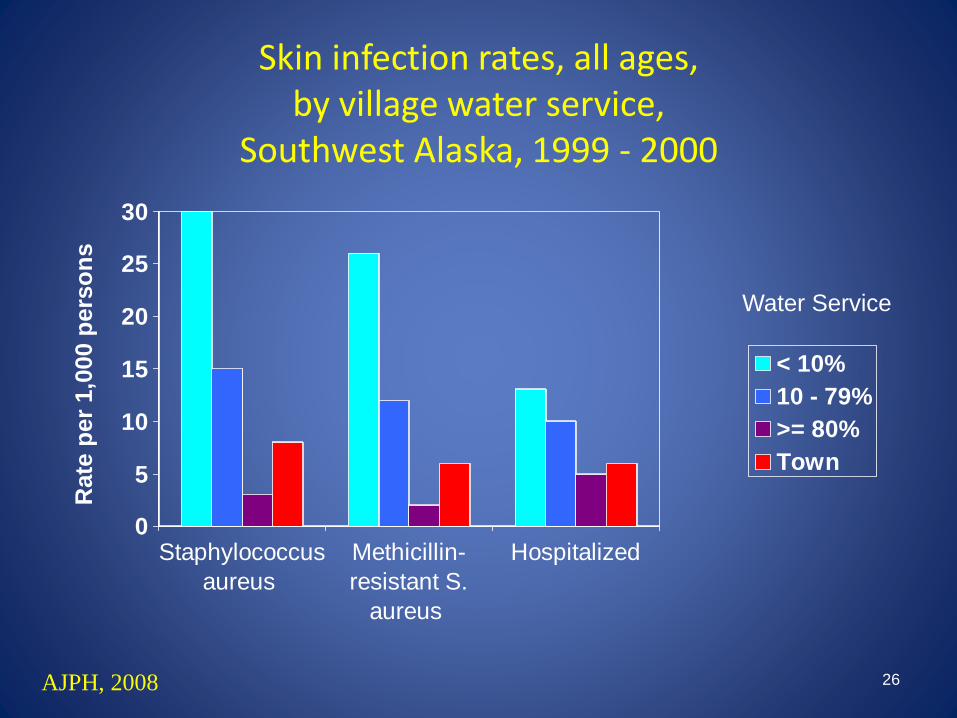
Skin infection rates, all ages, by village water service,
Southwest Alaska, 1999 - 2000
0
5
10
15
20
25
30
Staphylococcus
aureus
Methicillin-
resistant S.
aureus
Hospitalized
< 10%
10 - 79%
>= 80%
Town
Rate
pe
r 1
,000 p
ers
on
s
Water Service
AJPH, 2008
How water helps to preventSkin Infections (Boils and Impetigo)
– Spread by• Person to person contact
• Self inoculation
• Contaminated surfaces or objects (laundry, sauna benches)
– Spread prevented by • Hand and body hygiene
• Cleaning home environment and saunas
• Laundry (bleach, hot water)
– Other factors• Crowding, long lasting colonization of skin,
• Antibiotic use
27
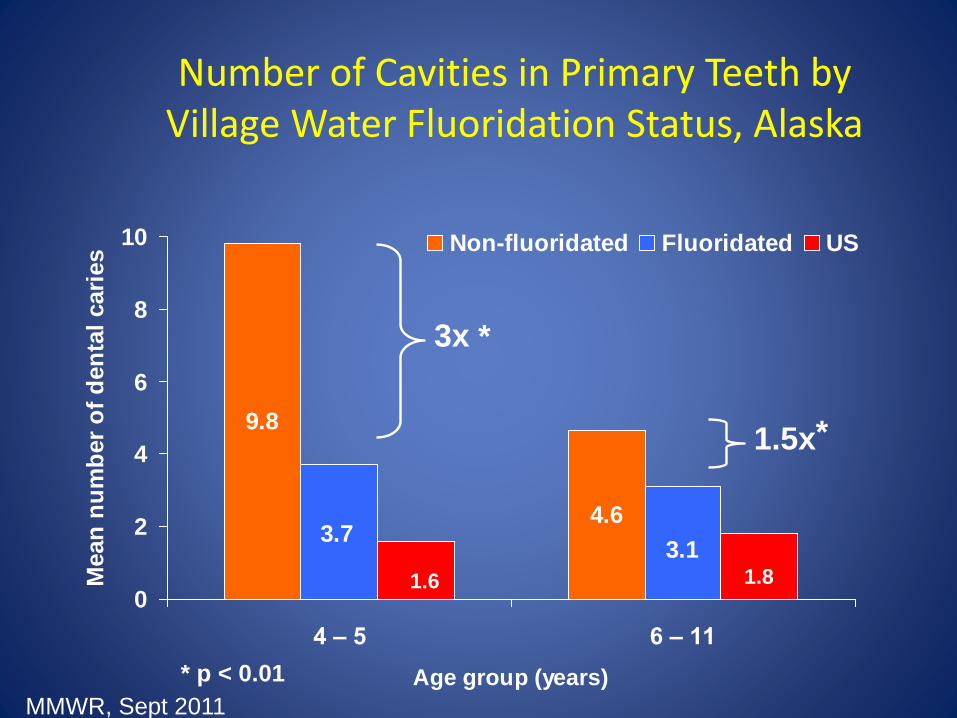
Number of Cavities in Primary Teeth by Village Water Fluoridation Status, Alaska
4.6
9.8
3.73.1
0
2
4
6
8
10
4 – 5 6 – 11
Age group (years)
Mean
nu
mb
er
of
den
tal
cari
es
Non-fluoridated Fluoridated US
*
*
* p < 0.01
3x
1.5x
1.6 1.8
MMWR, Sept 2011
How water helps to prevent Dental Cavities
– Caused by excess Strep. mutans bacteria
• Produces acid and destroys tooth enamel
– Prevented through
• Water for brushing teeth
• Fluoridated water – only available in piped distribution systems
• Good tasting water may decrease soda drinking
– Other factors
• Dietary sugar, use of toothpaste, strength of tooth enamel, access to dental care
29
How water helps to prevent Gastroenteritis (Diarrhea)
– Germs spread through• Contaminated water or food
• Person to person
– Transmission prevented through • Providing and protecting drinking water
• Cleaning food preparation surfaces, utensils, dishes
• Hand hygiene
– Other factors• Contaminated food, cooking temperatures, cross-
contamination, storage of foods
30
Main Message #3
• The health benefits of running water includes prevention of:
– Respiratory infections
– Skin infections
– Dental cavities, and
– Diarrhea
31
How much disease can we prevent by adequate water service?
32
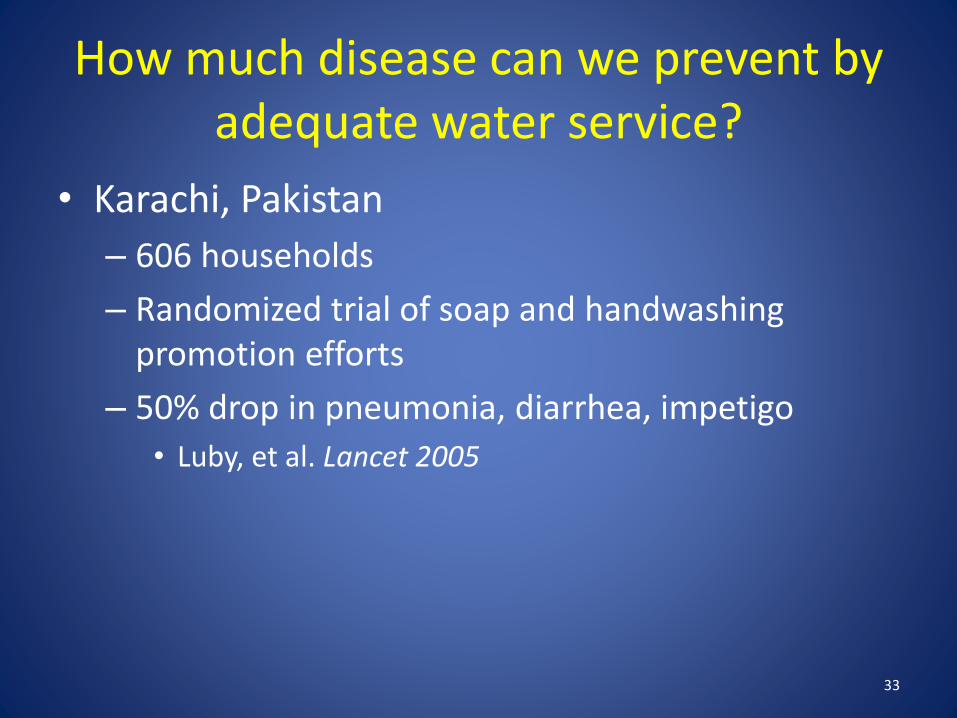
How much disease can we prevent by adequate water service?
• Karachi, Pakistan
– 606 households
– Randomized trial of soap and handwashing promotion efforts
– 50% drop in pneumonia, diarrhea, impetigo
• Luby, et al. Lancet 2005
33
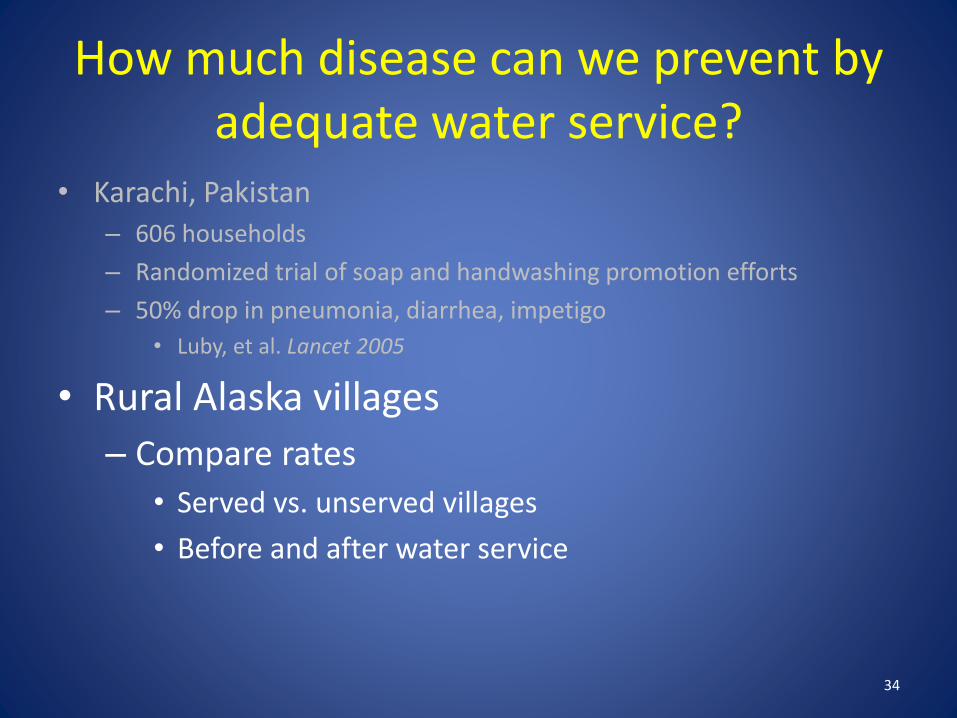
How much disease can we prevent by adequate water service?
• Karachi, Pakistan – 606 households
– Randomized trial of soap and handwashing promotion efforts
– 50% drop in pneumonia, diarrhea, impetigo
• Luby, et al. Lancet 2005
• Rural Alaska villages
– Compare rates
• Served vs. unserved villages
• Before and after water service
34
35
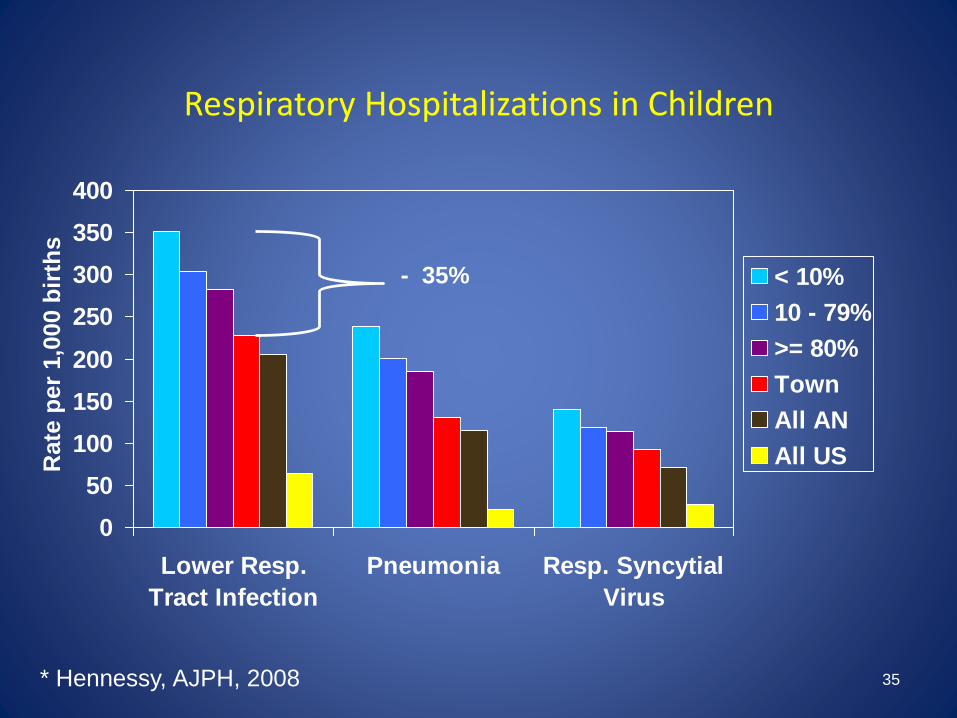
Respiratory Hospitalizations in Children
0
50
100
150
200
250
300
350
400
Lower Resp.
Tract Infection
Pneumonia Resp. Syncytial
Virus
< 10%
10 - 79%
>= 80%
Town
All AN
All USRate
per
1,0
00 b
irth
s
* Hennessy, AJPH, 2008
- 35%
36
Serious infections with Streptococcus pneumoniae in children
0
50
100
150
200
250
300
350
400
450
< 10%
10 - 79%
>= 80%
US, overall
Rate
per
100,0
00 Water Service
* J Wenger, 2010, Pediatric Infectious Diseases
- 50%
37
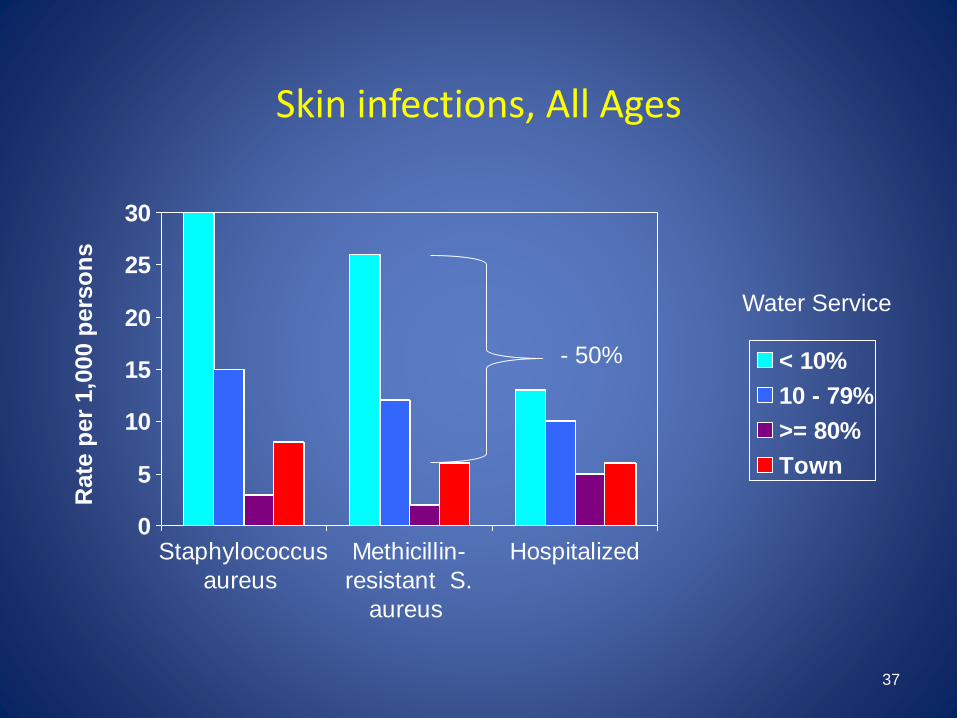
Skin infections, All Ages
0
5
10
15
20
25
30
Staphylococcus
aureus
Methicillin-
resistant S.
aureus
Hospitalized
< 10%
10 - 79%
>= 80%
Town
Rate
pe
r 1
,000 p
ers
on
s
Water Service
- 50%
Main Message #4
• We can prevent a lot of illness and suffering by providing adequate water and sanitation.
– 35% to 50% fewer infections
38
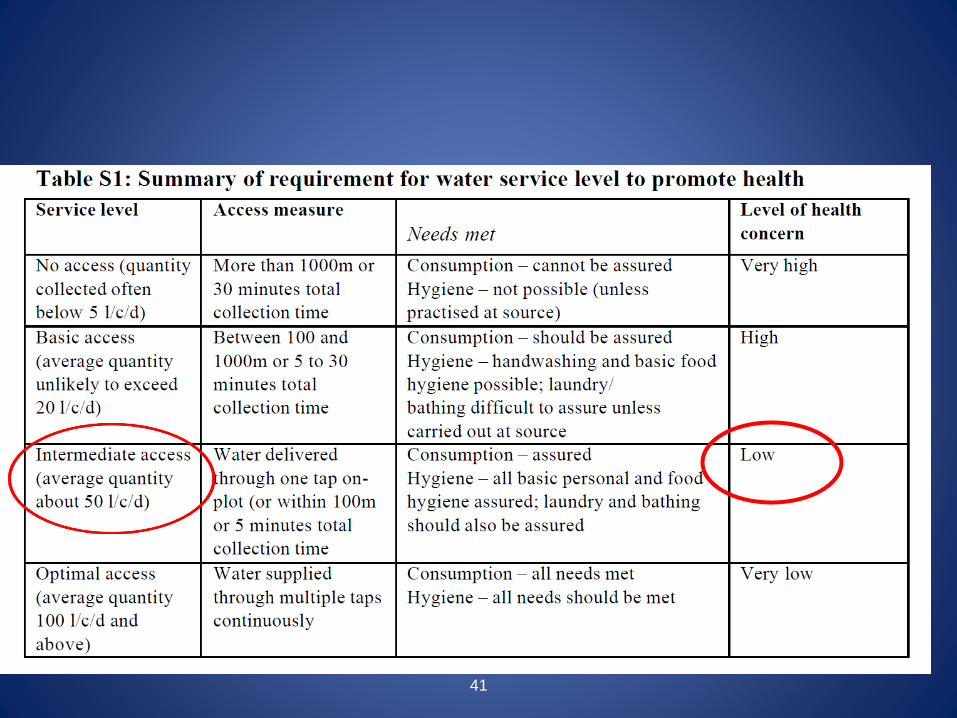
How much water is enough to improve health?
39
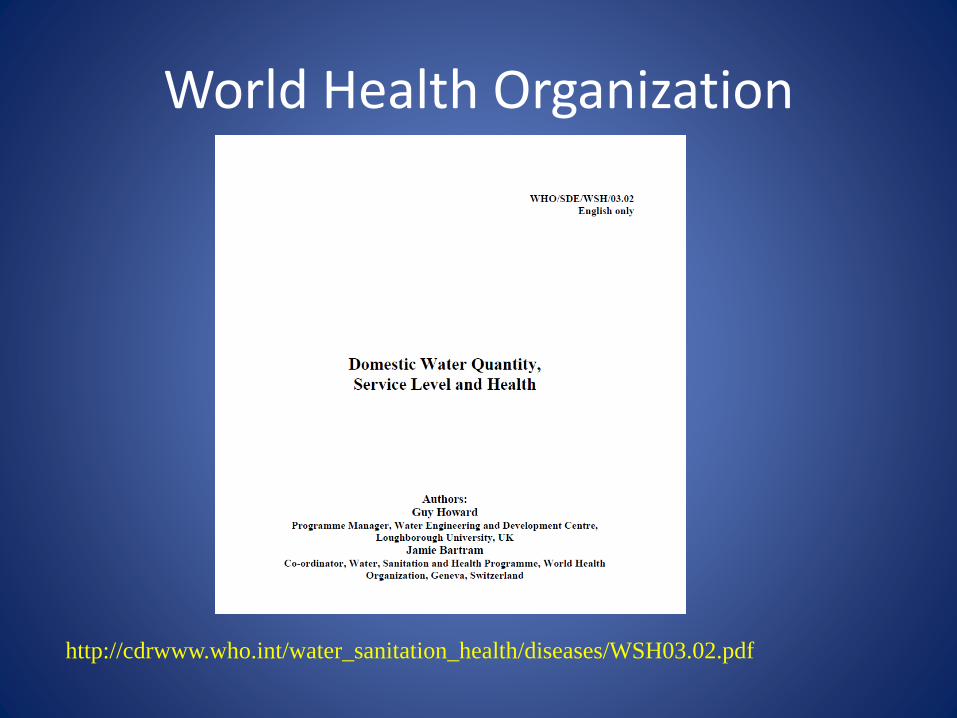
http://cdrwww.who.int/water_sanitation_health/diseases/WSH03.02.pdf
World Health Organization
41
Is 50 Liters or 13 gallons per person per day needed to protect health?
• Could we conserve water?– Low-flow faucets
– Water recycling
– Separating or dry toilets
• Is all water needed in home?– Community facility for
• laundry, shower / bathing, sauna
– Home: drinking, toilet, cooking, handwashing, home cleaning
42
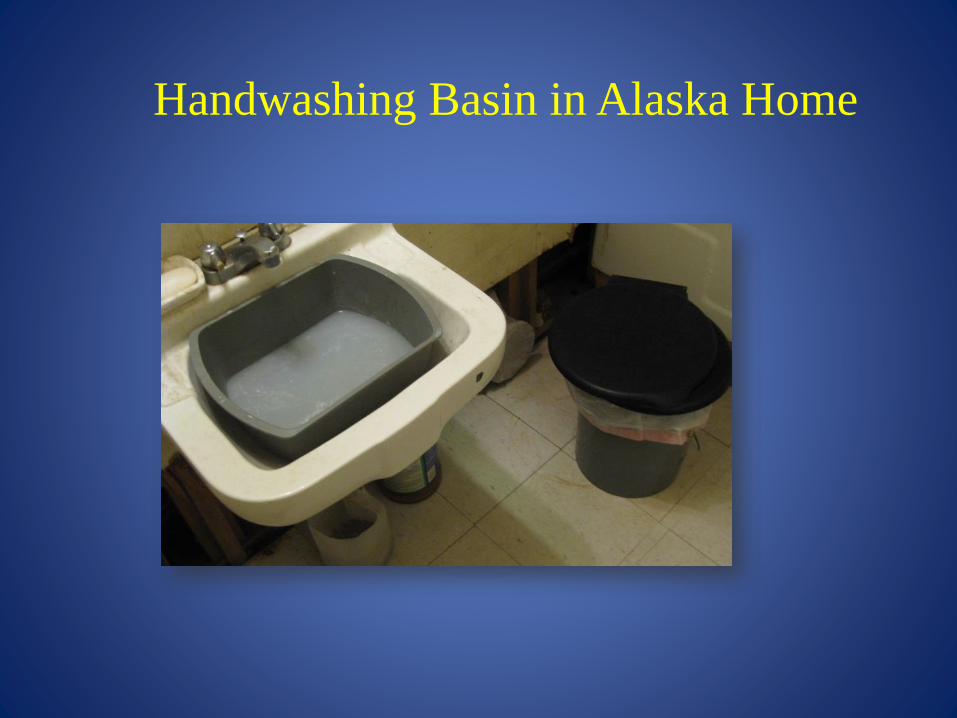
Handwashing Basin in Alaska Home

What is the “Return on Investment” for Providing
Water and Sewer Service?
What is the Return on Investment for Water/sewer services?
• Direct health costs
– Use rate differences to calculate costs of
• Excess hospitalizations, clinic visits
– Quality of Life measures
• Quality Adjusted Life Years
45
Return on Investment, continued
• Indirect costs– Being ill or caring for an ill family member
• Missed work – loss of income or job
• Missed school – lower educational success
• Less subsistence or cultural activity
– Hauling water and waste• Opportunity cost of time
• Reduced tourism or business opportunities
– Water insecurity• Stress, mental health effects
46
The Human Cost
• A child born in November, returns to a village that has no running water…
• A child lives in a village with no running water, or where water has an unpleasant taste…
47
Main Message #5
• Water and sewer service is a fundamental issue of health and social justice.
• The costs connected with lack of service are mostly unmeasured.
• These costs are being paid by the people living in communities without water service and also by the rest of society.
48
Healthy Alaskans 2020 (HA2020)
Public health initiative to improve health and ensure health equity
25 health priorities• Measureable targets to reach by 2020
• Provides strategies and specific actions
• Identifies key partners across the state to engage in the work
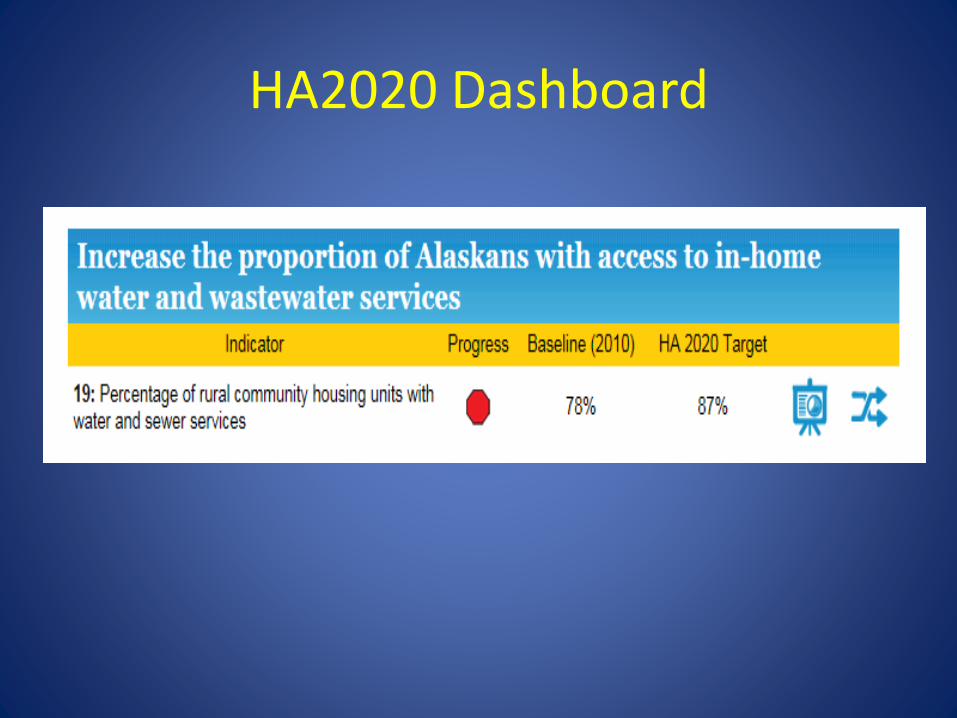
HA2020 Dashboard
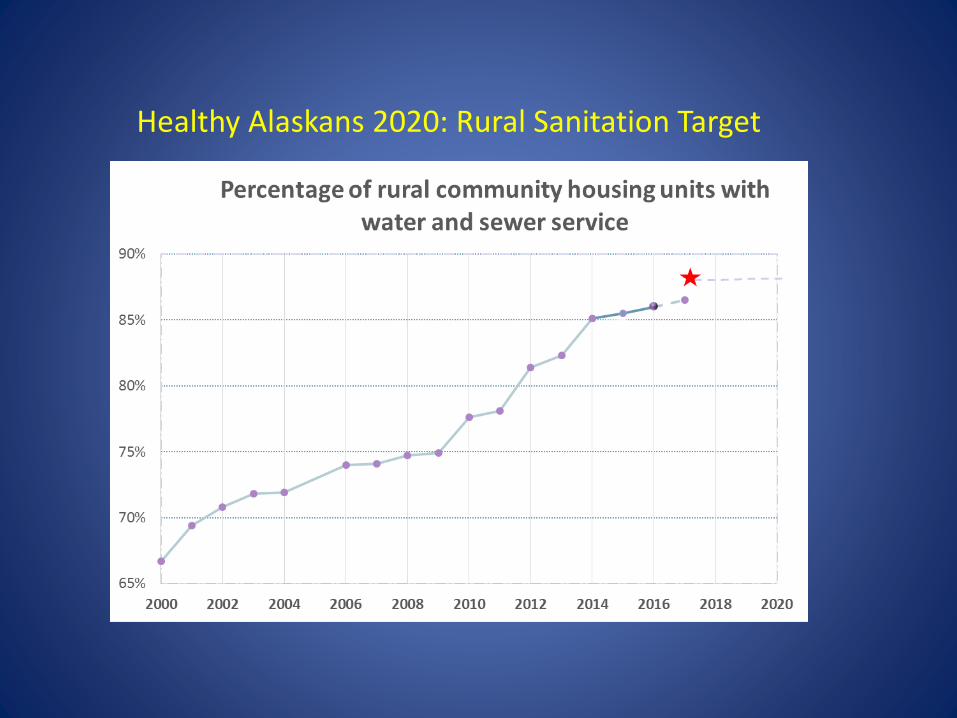
Healthy Alaskans 2020: Rural Sanitation Target
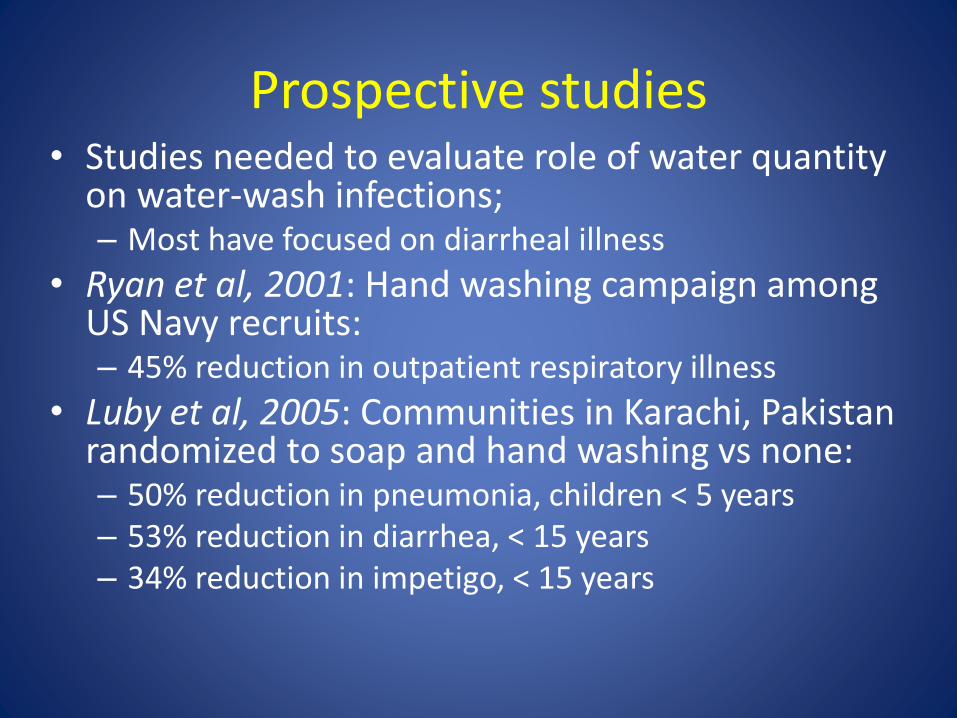
Prospective studies• Studies needed to evaluate role of water quantity
on water-wash infections;– Most have focused on diarrheal illness
• Ryan et al, 2001: Hand washing campaign among US Navy recruits:– 45% reduction in outpatient respiratory illness
• Luby et al, 2005: Communities in Karachi, Pakistan randomized to soap and hand washing vs none:– 50% reduction in pneumonia, children < 5 years – 53% reduction in diarrhea, < 15 years– 34% reduction in impetigo, < 15 years
Impact of In-home Piped Water on Rates of Infectious Disease
• Four villages (A-D) in western Alaska received funding and met requirements for completion of piped water installation 2007/2008
• Opportunity to conduct a prospective cohort study
• Objective: – Assess rates of water-wash and water-borne
• acute gastrointestinal (GI), respiratory and skin infections
• before and after installation of in-home sanitation services
• Study approved by:– CDC, Alaska Area IRB
– Alaska Native Tribal authorities and participating villages
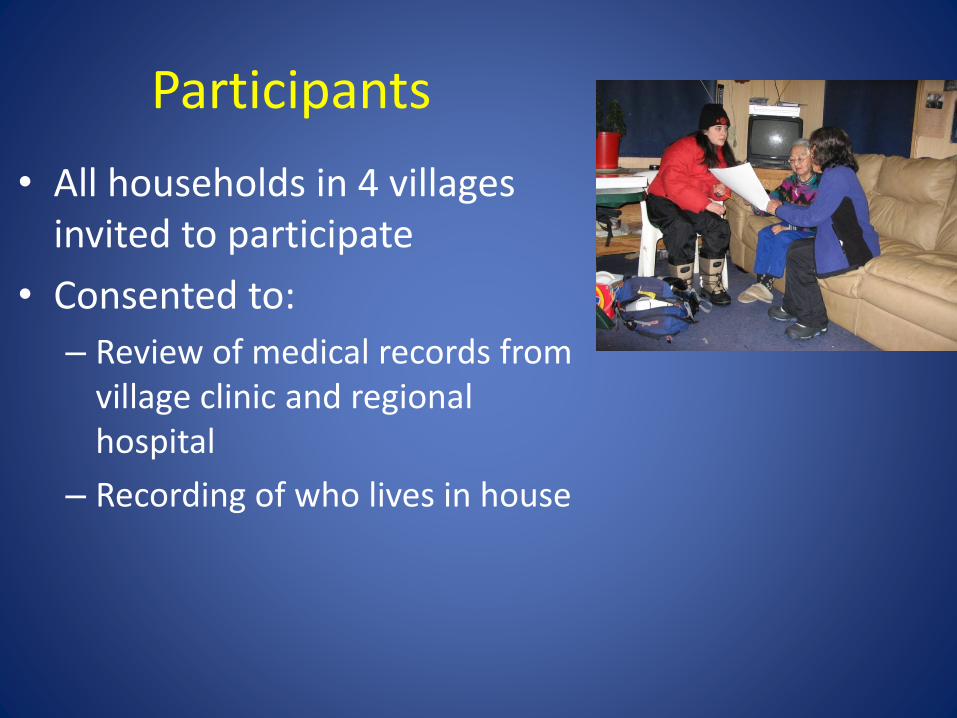
Participants
• All households in 4 villages invited to participate
• Consented to:
– Review of medical records from village clinic and regional hospital
– Recording of who lives in house
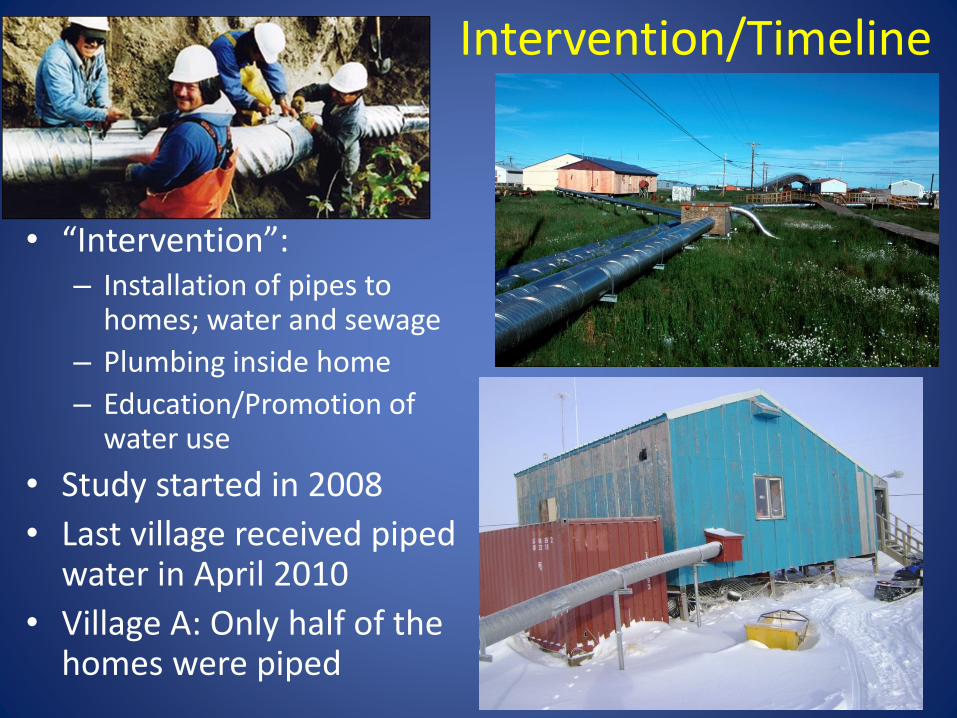
Intervention/Timeline
• “Intervention”:– Installation of pipes to
homes; water and sewage
– Plumbing inside home
– Education/Promotion of water use
• Study started in 2008
• Last village received piped water in April 2010
• Village A: Only half of the homes were piped
Health Outcomes
• Review of electronic medical record
– Village clinic and hospital visits
– ICD-9 codes for acute GI, respiratory and skin infections
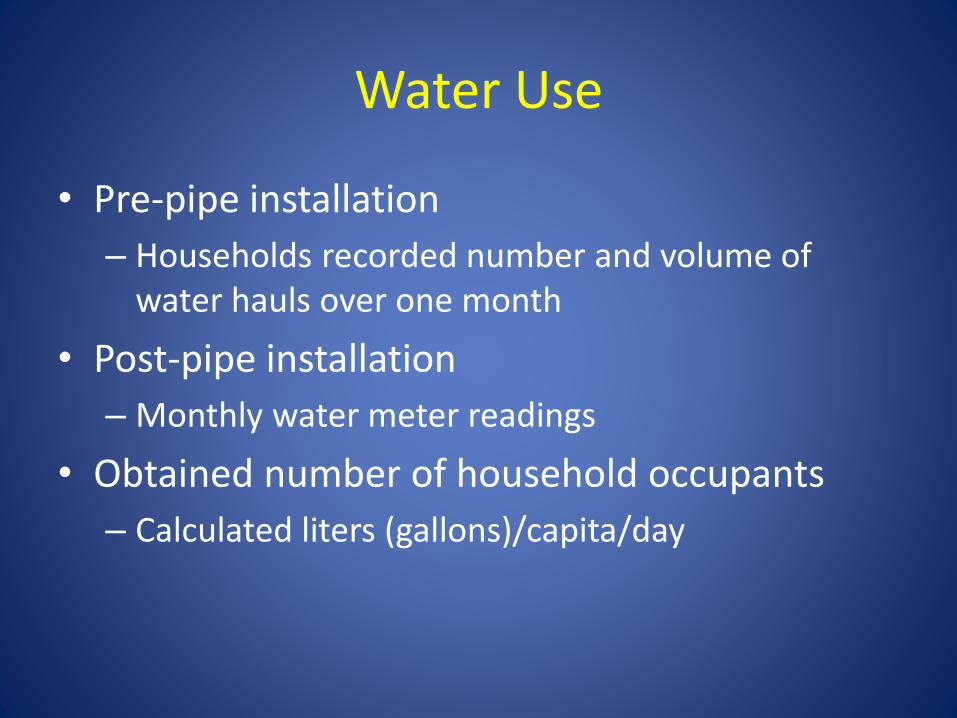
Water Use
• Pre-pipe installation
– Households recorded number and volume of water hauls over one month
• Post-pipe installation
– Monthly water meter readings
• Obtained number of household occupants
– Calculated liters (gallons)/capita/day
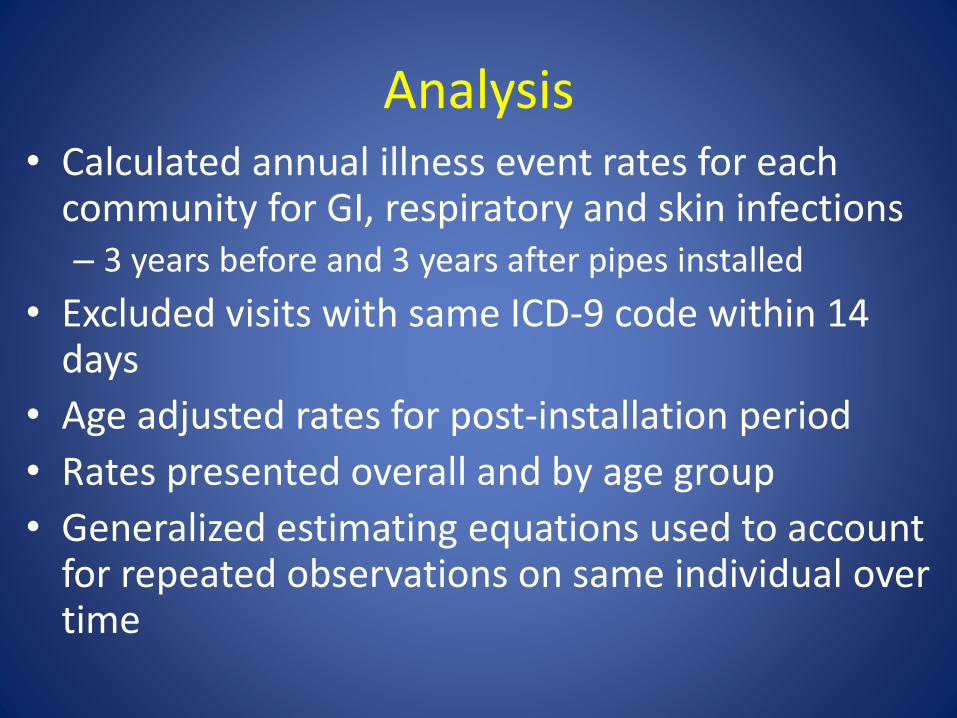
Analysis• Calculated annual illness event rates for each
community for GI, respiratory and skin infections– 3 years before and 3 years after pipes installed
• Excluded visits with same ICD-9 code within 14 days
• Age adjusted rates for post-installation period
• Rates presented overall and by age group
• Generalized estimating equations used to account for repeated observations on same individual over time
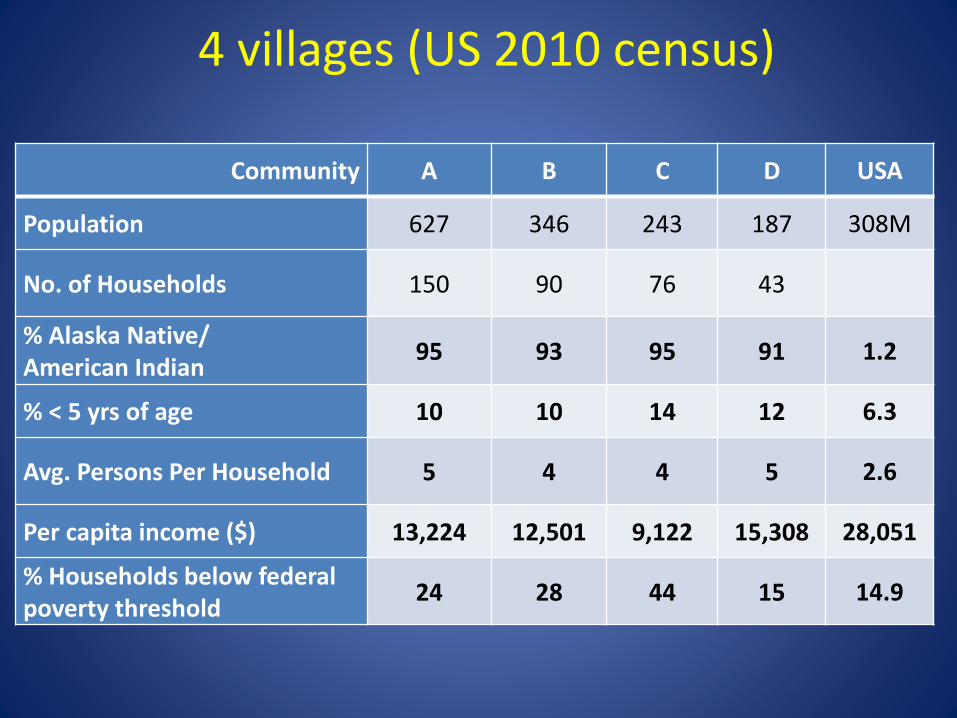
4 villages (US 2010 census)
Community A B C D USA
Population 627 346 243 187 308M
No. of Households 150 90 76 43
% Alaska Native/American Indian
95 93 95 91 1.2
% < 5 yrs of age 10 10 14 12 6.3
Avg. Persons Per Household 5 4 4 5 2.6
Per capita income ($) 13,224 12,501 9,122 15,308 28,051
% Households below federal poverty threshold
24 28 44 15 14.9

Study participants
Population Total
2010 Census 1403
Enrolled (% of total) 1048 (75%)
Outcome data (pre) 1010
Outcome data (post) 975
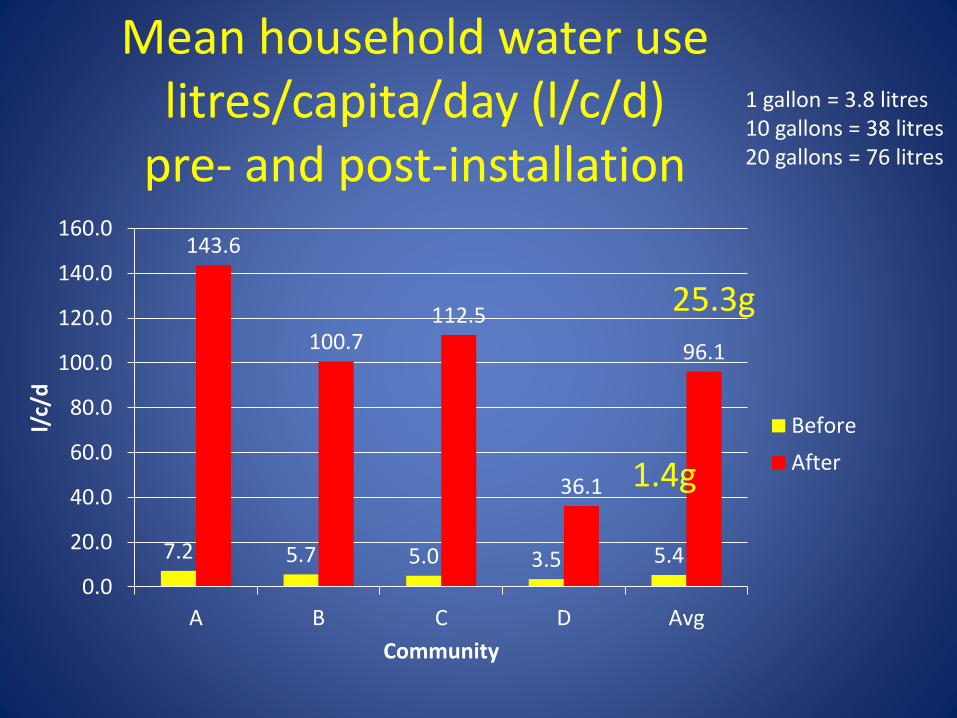
Mean household water use litres/capita/day (l/c/d)
pre- and post-installation
7.2 5.7 5.0 3.5 5.4
143.6
100.7112.5
36.1
96.1
0.0
20.0
40.0
60.0
80.0
100.0
120.0
140.0
160.0
A B C D Avg
l/c/
d
Community
Before
After1.4g
25.3g
1 gallon = 3.8 litres10 gallons = 38 litres20 gallons = 76 litres
0
200
400
600
800
1000
1200
1400
1600
GI Resp Skin
Pre-Piped
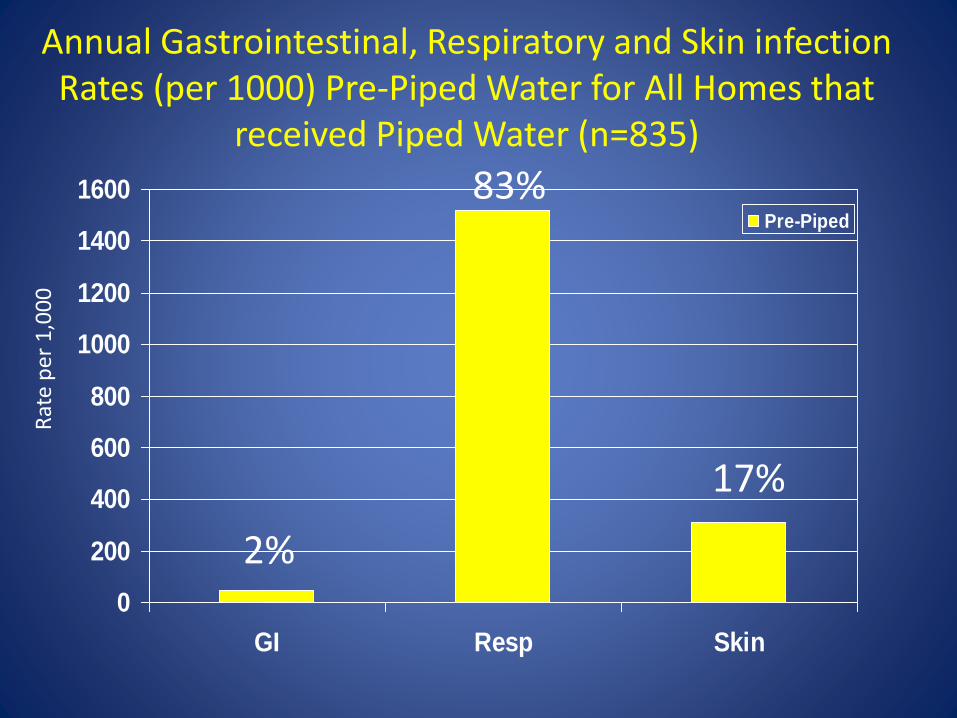
Annual Gastrointestinal, Respiratory and Skin infection Rates (per 1000) Pre-Piped Water for All Homes that
received Piped Water (n=835)
Rat
e p
er 1
,00
0
2%
17%
83%
0
200
400
600
800
1000
1200
1400
1600
GI Resp Skin
Pre-Piped
Post-Piped
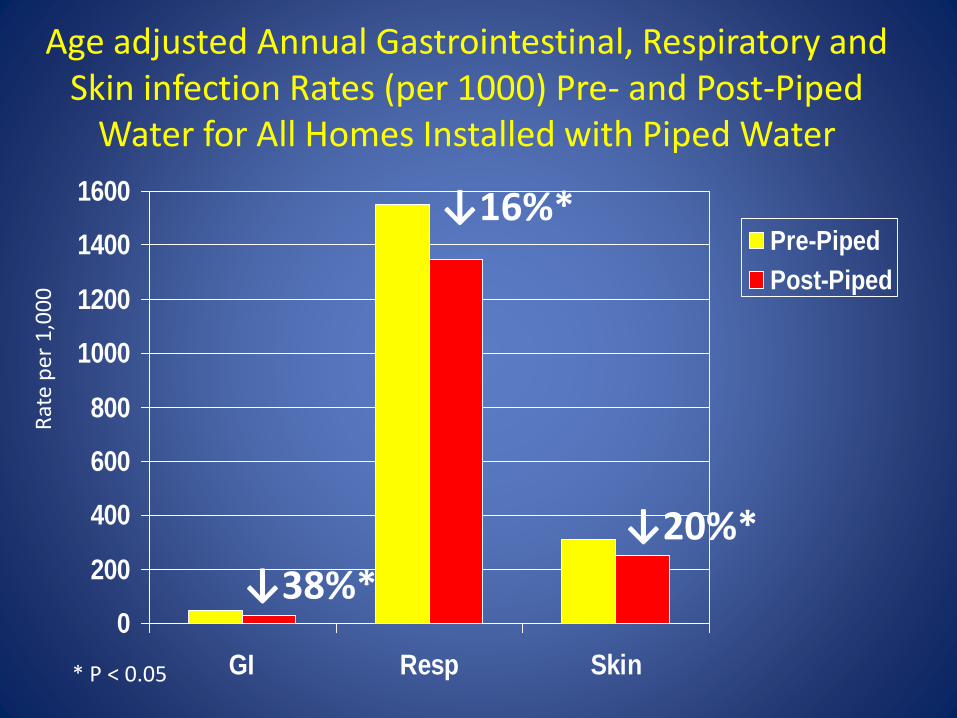
Age adjusted Annual Gastrointestinal, Respiratory and Skin infection Rates (per 1000) Pre- and Post-Piped
Water for All Homes Installed with Piped Water
* P < 0.05
Rat
e p
er 1
,00
0
↓16%*
↓20%*
↓38%*
0
500
1000
1500
2000
2500
3000
GI Resp Skin GI Resp Skin GI Resp Skin GI Resp Skin
Pre-Piped
Post-Piped
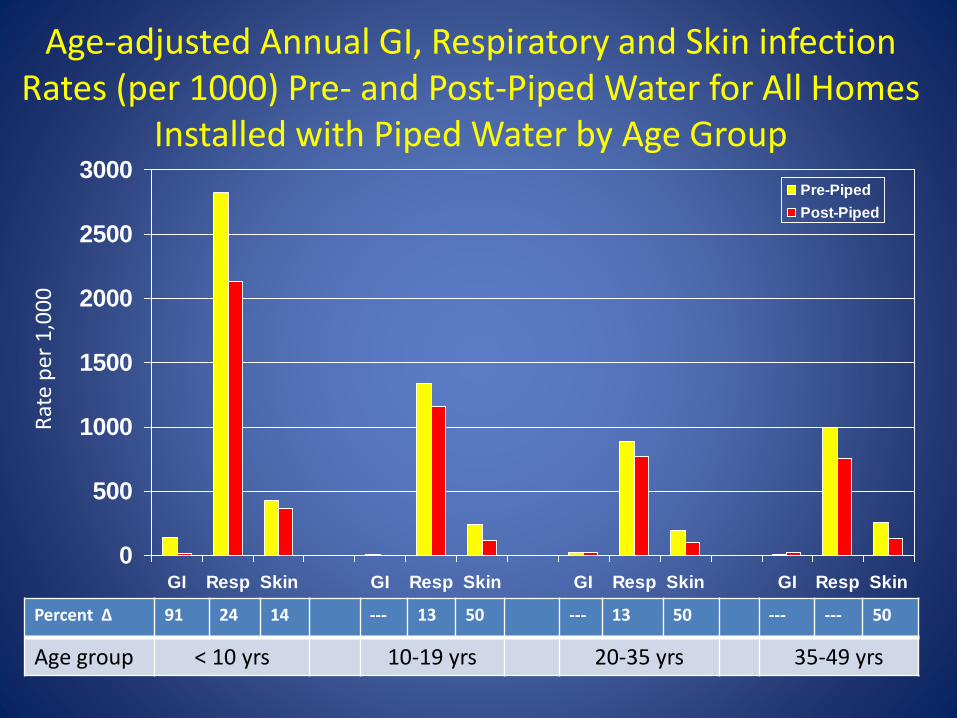
Age-adjusted Annual GI, Respiratory and Skin infection Rates (per 1000) Pre- and Post-Piped Water for All Homes
Installed with Piped Water by Age Group
Rat
e p
er 1
,00
0
Percent Δ 91 24 14 --- 13 50 --- 13 50 --- --- 50
Age group < 10 yrs 10-19 yrs 20-35 yrs 35-49 yrs
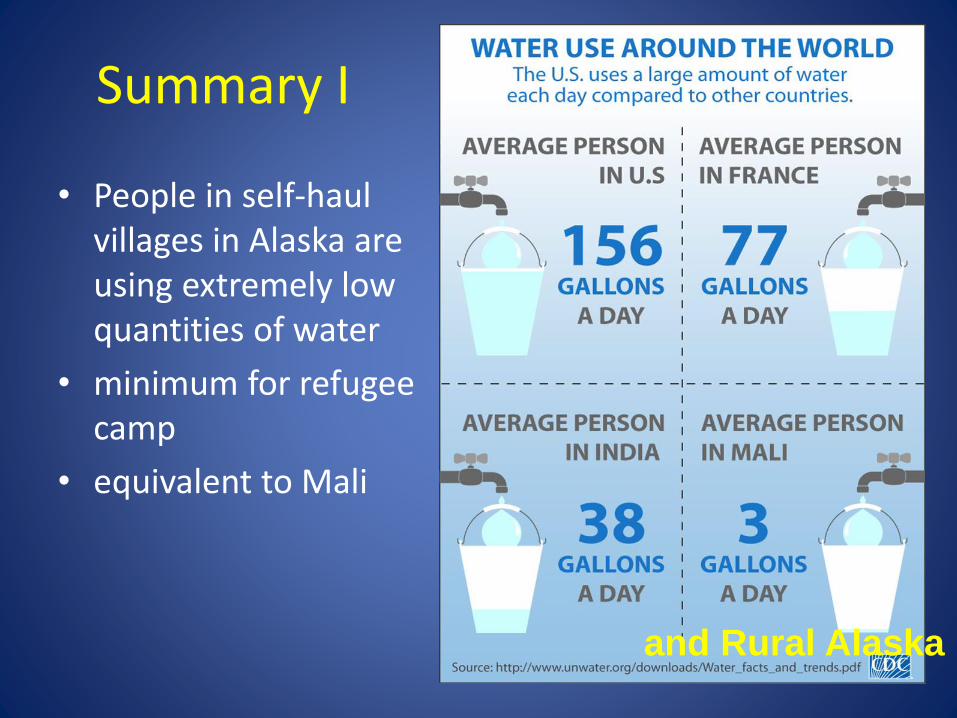
Summary I
• People in self-haul villages in Alaska are using extremely low quantities of water
• minimum for refugee camp
• equivalent to Mali
and Rural Alaska
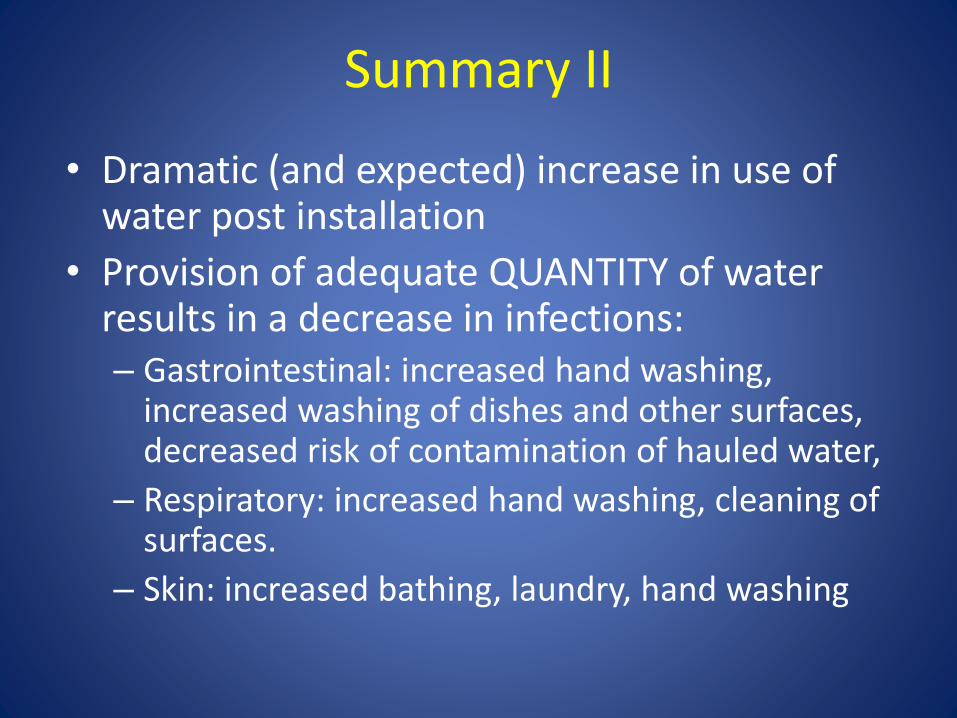
Summary II
• Dramatic (and expected) increase in use of water post installation
• Provision of adequate QUANTITY of water results in a decrease in infections:– Gastrointestinal: increased hand washing,
increased washing of dishes and other surfaces, decreased risk of contamination of hauled water,
– Respiratory: increased hand washing, cleaning of surfaces.
– Skin: increased bathing, laundry, hand washing
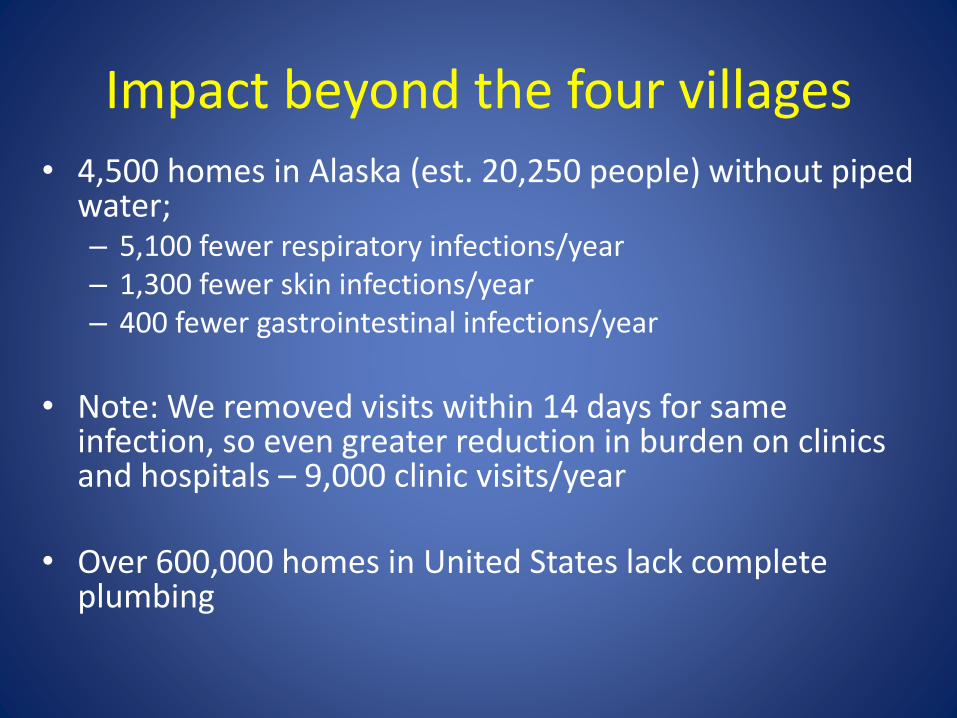
Impact beyond the four villages
• 4,500 homes in Alaska (est. 20,250 people) without piped water; – 5,100 fewer respiratory infections/year– 1,300 fewer skin infections/year– 400 fewer gastrointestinal infections/year
• Note: We removed visits within 14 days for same infection, so even greater reduction in burden on clinics and hospitals – 9,000 clinic visits/year
• Over 600,000 homes in United States lack complete plumbing
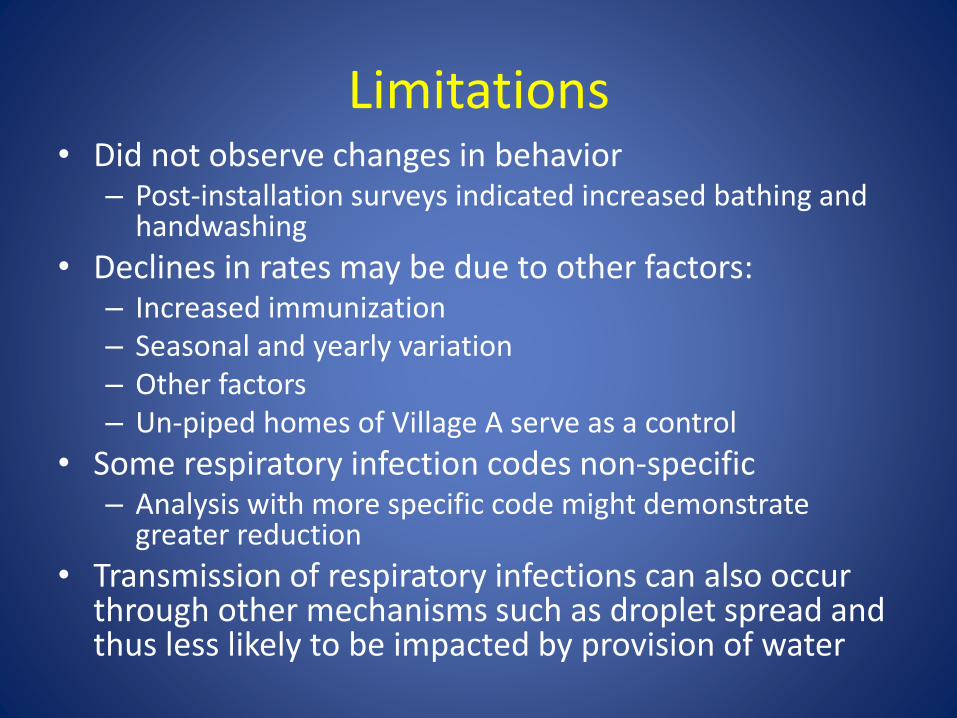
Limitations• Did not observe changes in behavior
– Post-installation surveys indicated increased bathing and handwashing
• Declines in rates may be due to other factors:– Increased immunization– Seasonal and yearly variation– Other factors– Un-piped homes of Village A serve as a control
• Some respiratory infection codes non-specific– Analysis with more specific code might demonstrate
greater reduction
• Transmission of respiratory infections can also occur through other mechanisms such as droplet spread and thus less likely to be impacted by provision of water
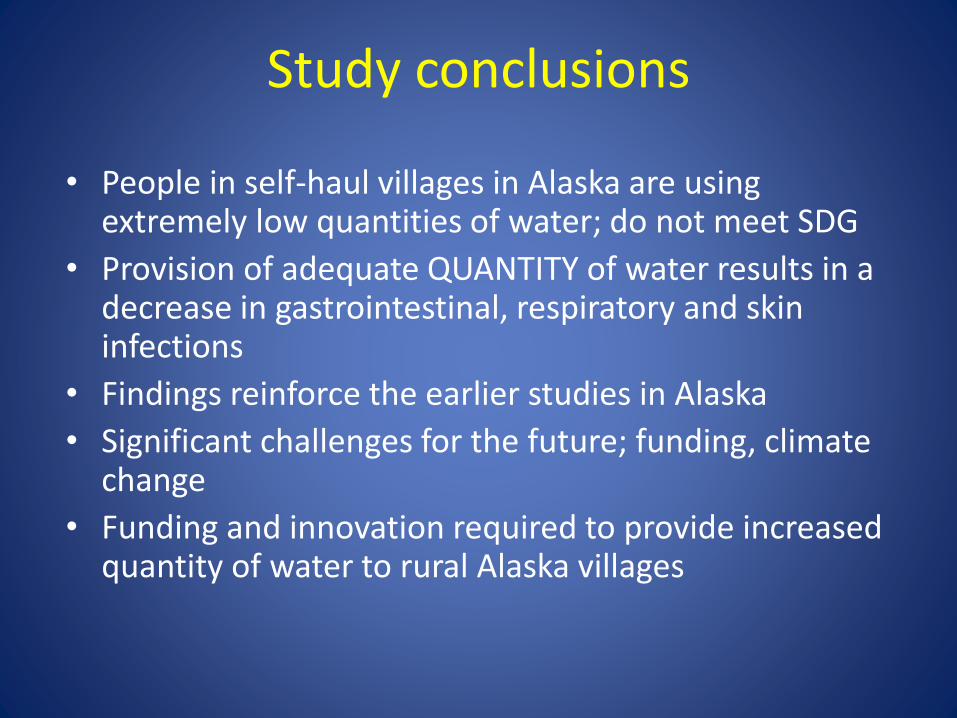
Study conclusions
• People in self-haul villages in Alaska are using extremely low quantities of water; do not meet SDG
• Provision of adequate QUANTITY of water results in a decrease in gastrointestinal, respiratory and skin infections
• Findings reinforce the earlier studies in Alaska
• Significant challenges for the future; funding, climate change
• Funding and innovation required to provide increased quantity of water to rural Alaska villages
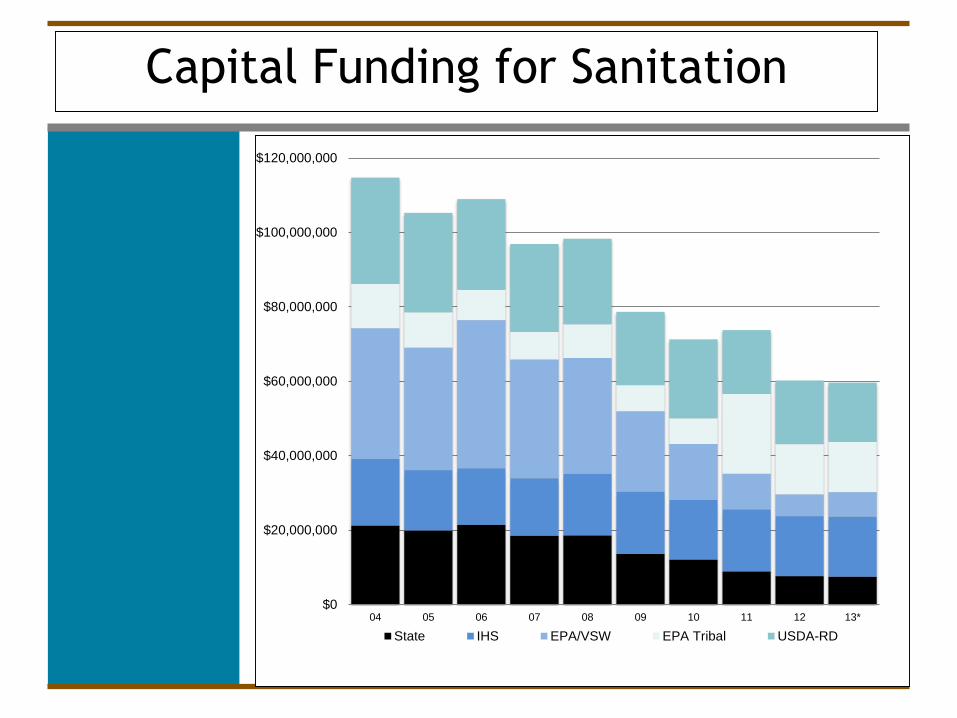
Capital Funding for Sanitation
$0
$20,000,000
$40,000,000
$60,000,000
$80,000,000
$100,000,000
$120,000,000
04 05 06 07 08 09 10 11 12 13*
State IHS EPA/VSW EPA Tribal USDA-RD
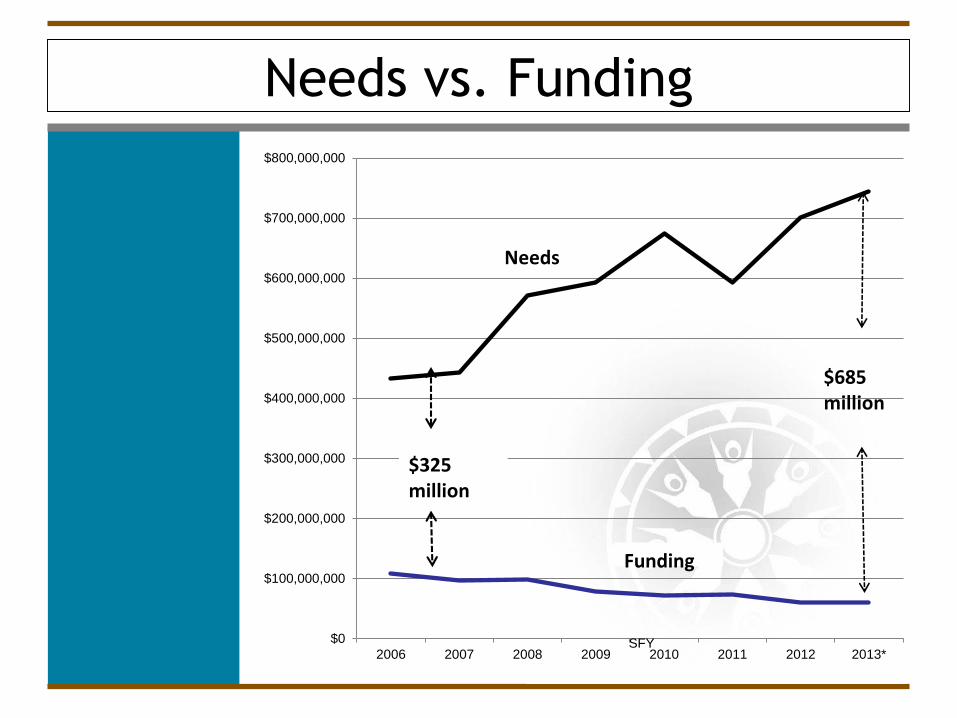
Needs vs. Funding
$0
$100,000,000
$200,000,000
$300,000,000
$400,000,000
$500,000,000
$600,000,000
$700,000,000
$800,000,000
2006 2007 2008 2009 2010 2011 2012 2013*SFY
$685 million
$325 million
Funding
Needs
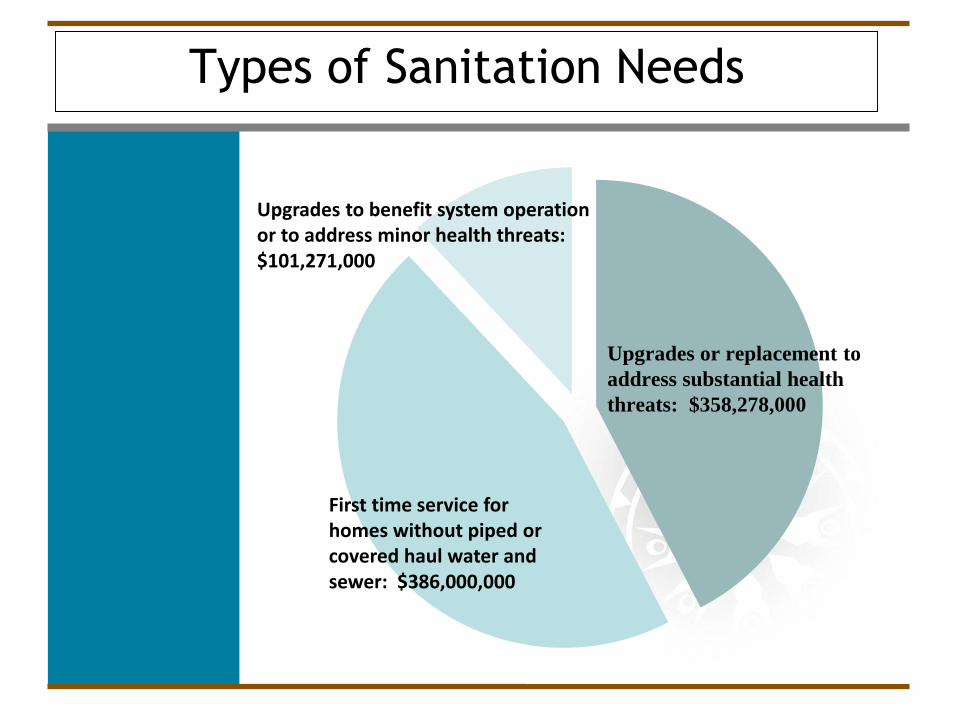
Types of Sanitation Needs
Upgrades or replacement to
address substantial health
threats: $358,278,000
Upgrades to benefit system operation or to address minor health threats: $101,271,000
First time service for homes without piped or covered haul water and sewer: $386,000,000
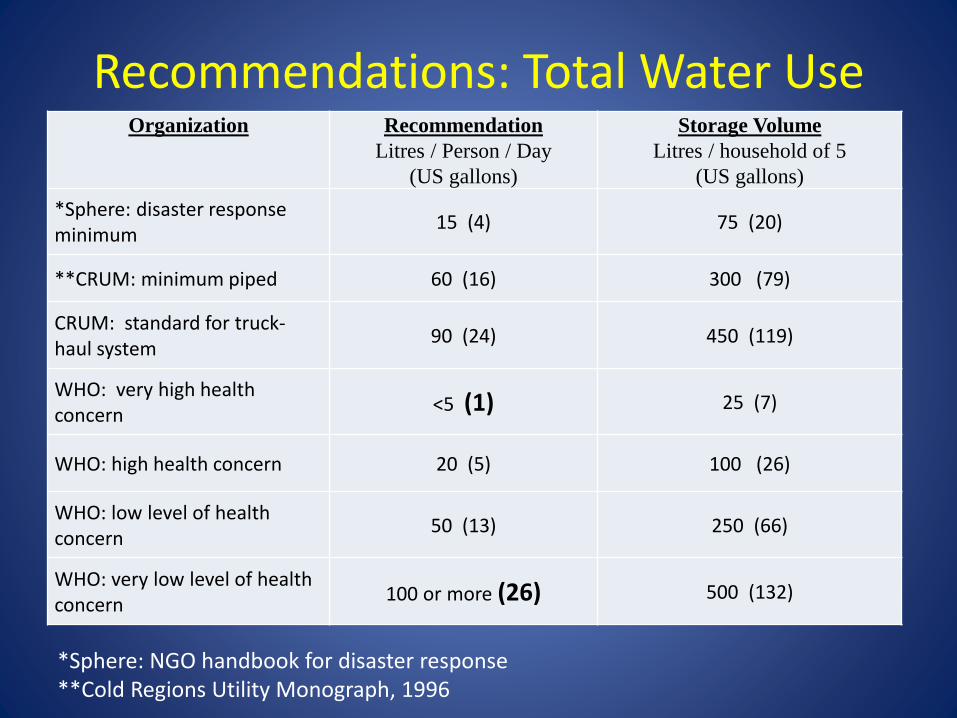
Recommendations: Total Water UseOrganization Recommendation
Litres / Person / Day
(US gallons)
Storage Volume
Litres / household of 5
(US gallons)
*Sphere: disaster response minimum
15 (4) 75 (20)
**CRUM: minimum piped 60 (16) 300 (79)
CRUM: standard for truck-haul system
90 (24) 450 (119)
WHO: very high health concern
<5 (1) 25 (7)
WHO: high health concern 20 (5) 100 (26)
WHO: low level of health concern
50 (13) 250 (66)
WHO: very low level of health concern
100 or more (26) 500 (132)
*Sphere: NGO handbook for disaster response**Cold Regions Utility Monograph, 1996
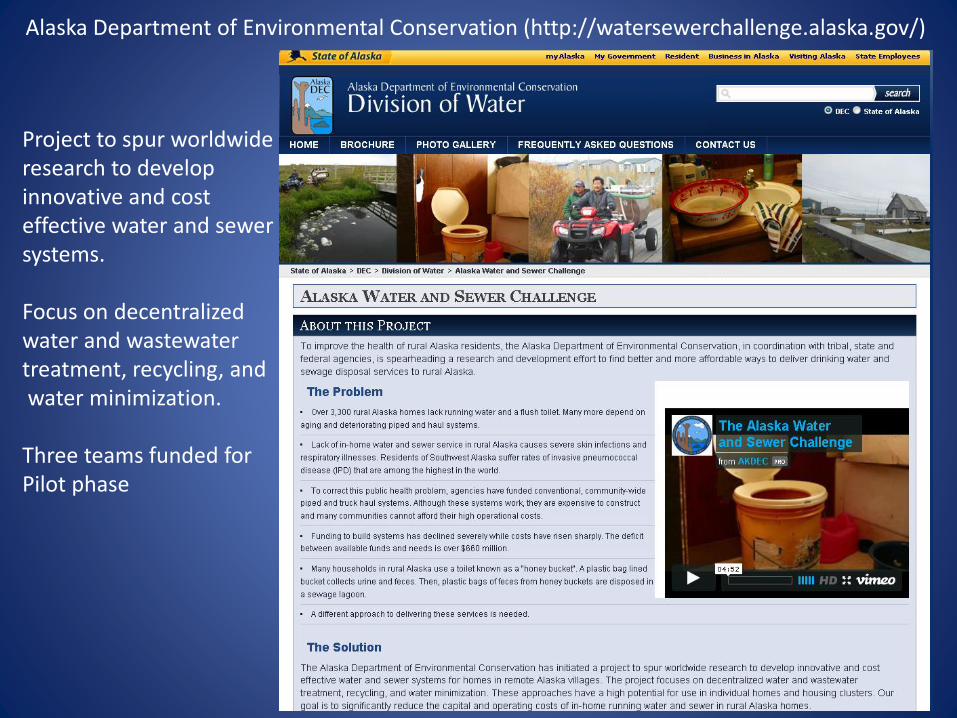
Alaska Department of Environmental Conservation (http://watersewerchallenge.alaska.gov/)
Project to spur worldwide research to develop innovative and cost effective water and sewer systems.
Focus on decentralized water and wastewater treatment, recycling, andwater minimization.
Three teams funded for Pilot phase
Alaska Challenge
Alternative Approaches to Sanitation
Mia Heavener, P.E.Senior Civil EngineerANTHC, DEHE
Kivalina
Alternative Approaches to Sanitation
Mia Heavener, P.E.Senior Civil EngineerANTHC, DEHE
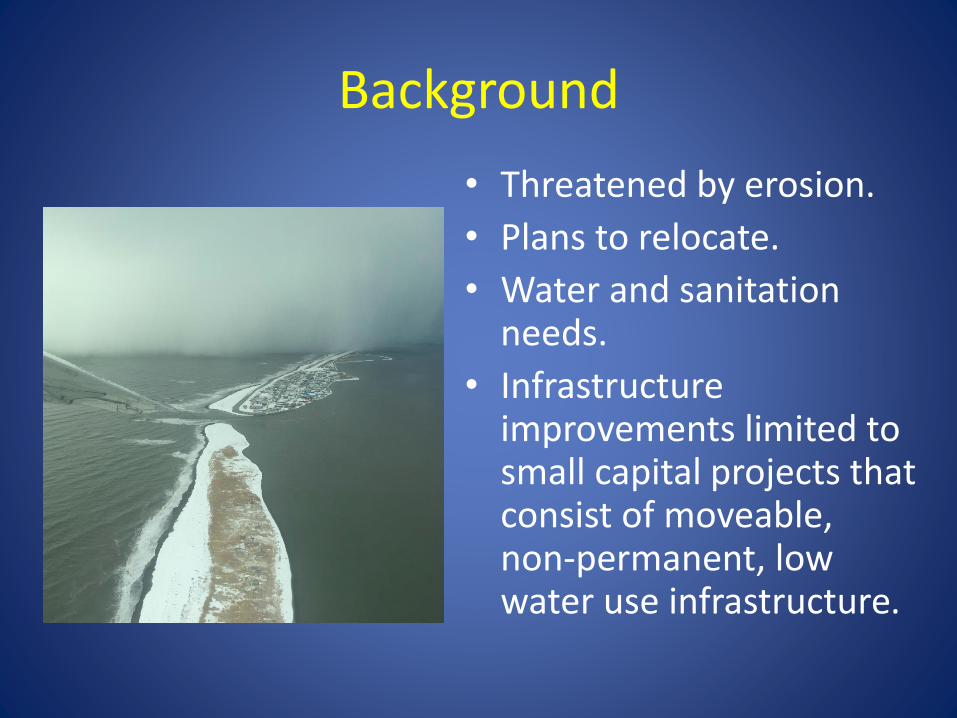
Background
• Threatened by erosion.
• Plans to relocate.
• Water and sanitation needs.
• Infrastructure improvements limited to small capital projects that consist of moveable, non-permanent, low water use infrastructure.
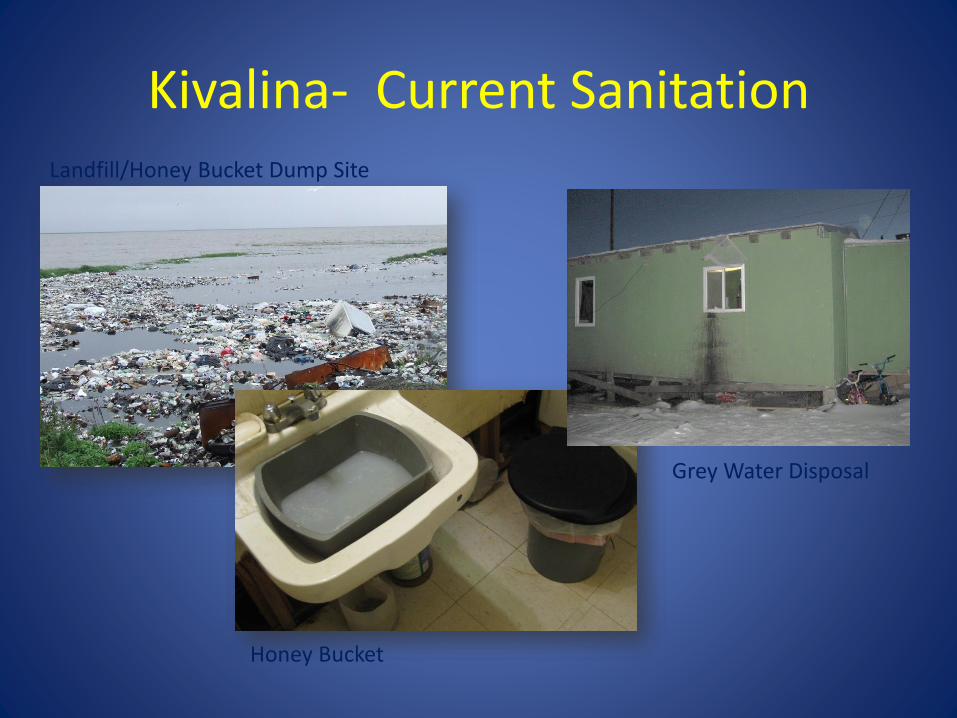
Kivalina- Current SanitationLandfill/Honey Bucket Dump Site
Honey Bucket
Grey Water Disposal
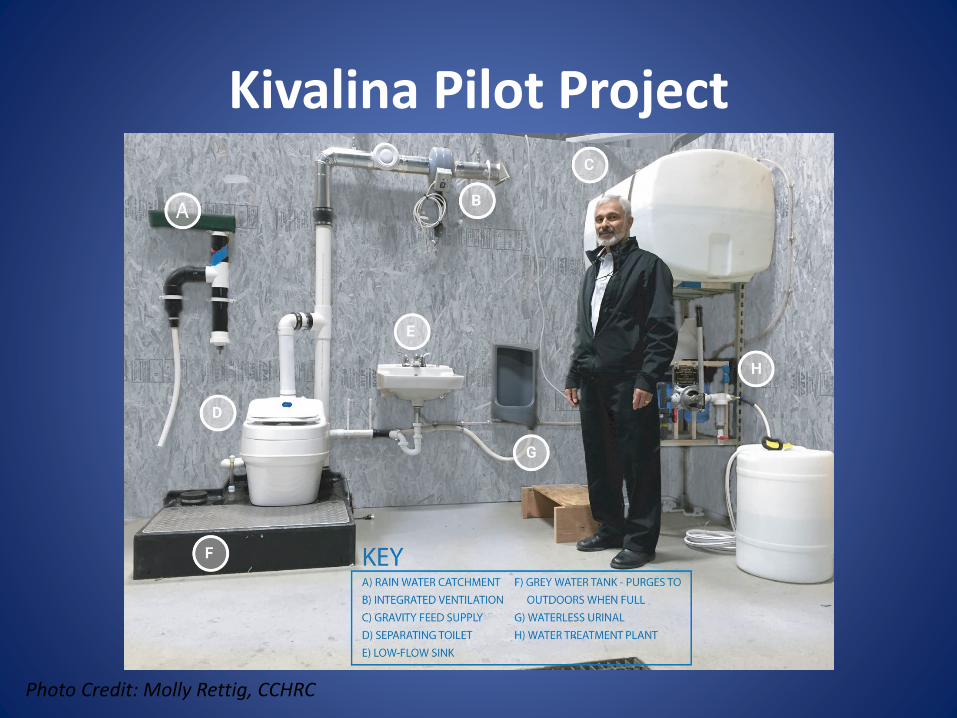
Kivalina Pilot Project
Photo Credit: Molly Rettig, CCHRC
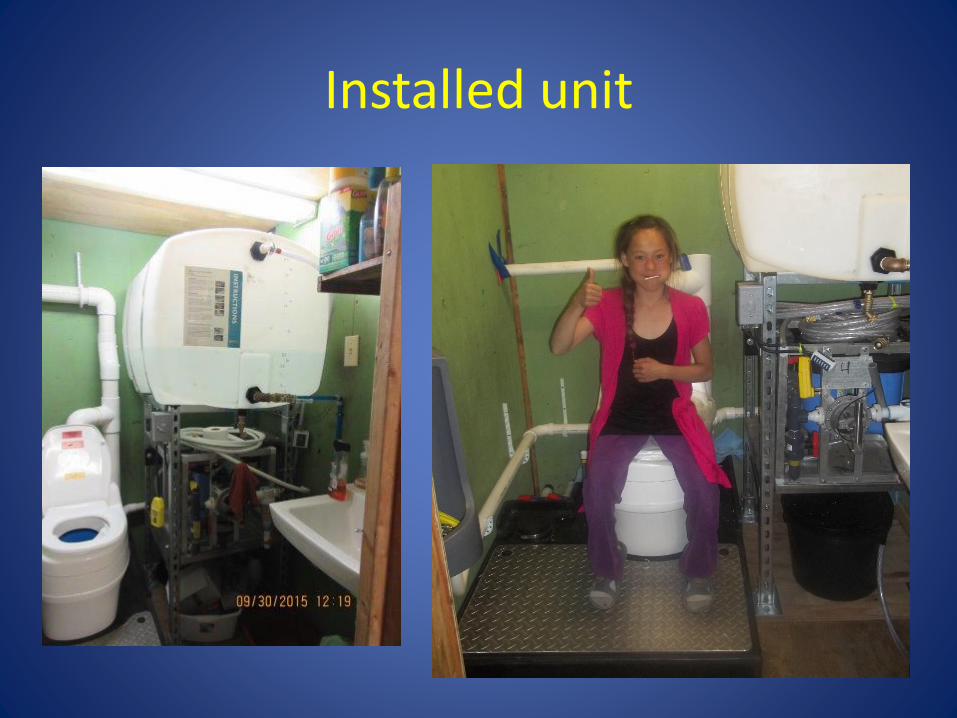
Installed unit
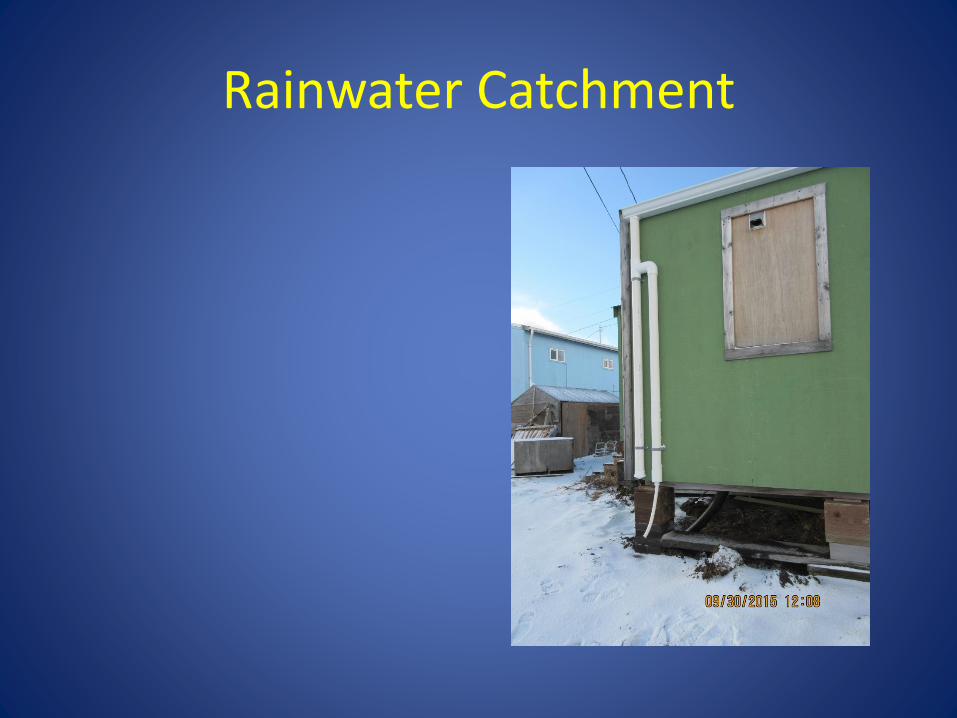
Rainwater Catchment
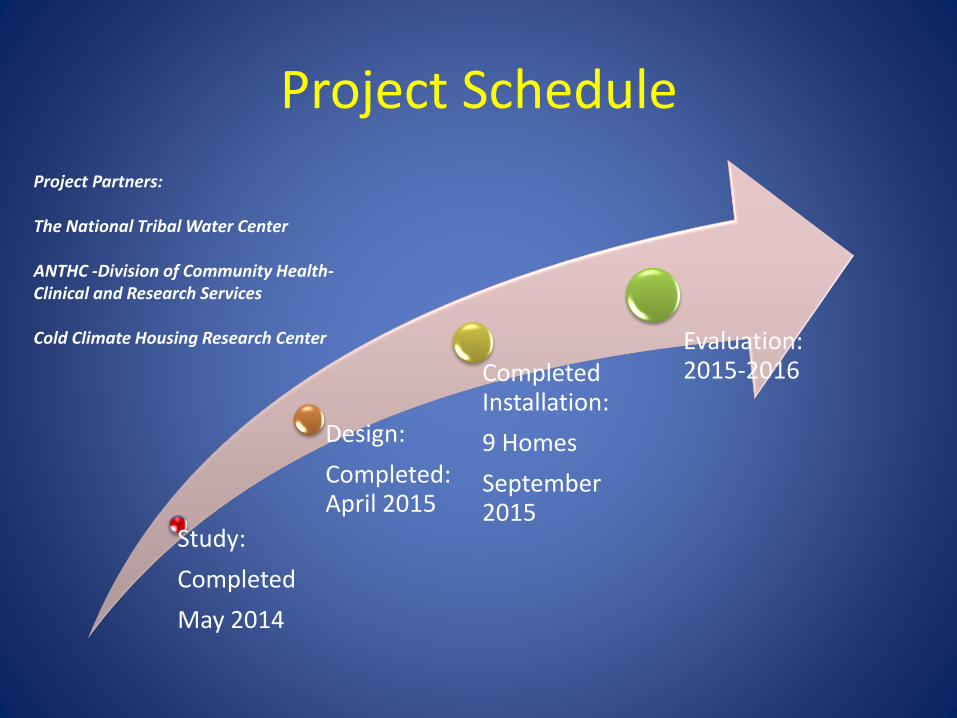
Project Schedule
Study:
Completed
May 2014
Design:
Completed: April 2015
Completed Installation:
9 Homes
September 2015
Evaluation: 2015-2016
Project Partners:
The National Tribal Water Center
ANTHC -Division of Community Health-Clinical and Research Services
Cold Climate Housing Research Center
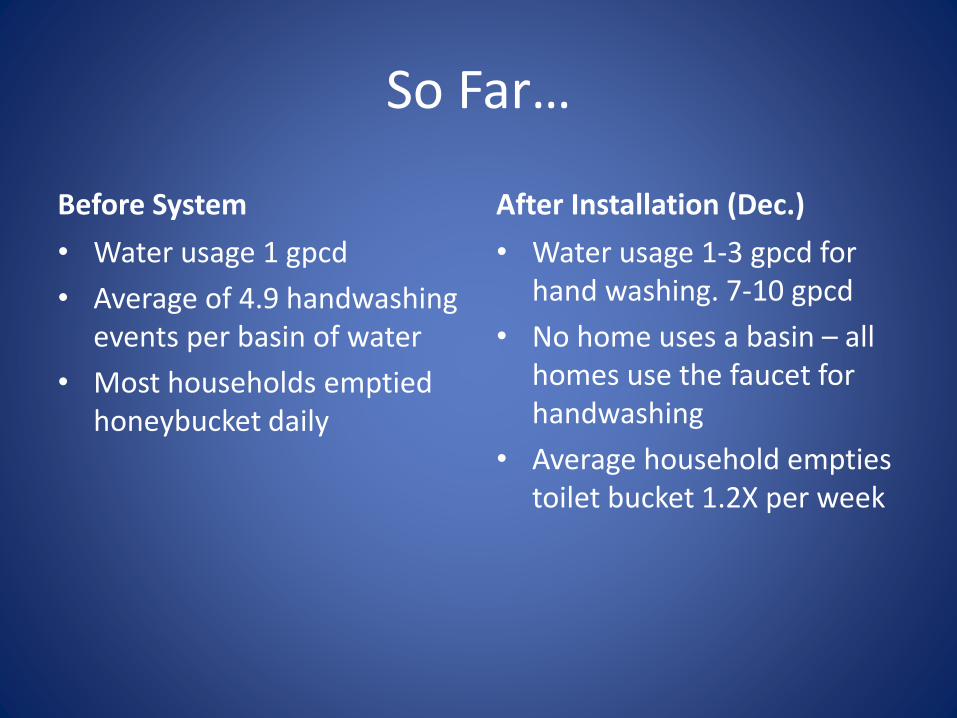
Before System After Installation (Dec.)
• Water usage 1 gpcd
• Average of 4.9 handwashingevents per basin of water
• Most households emptied honeybucket daily
• Water usage 1-3 gpcd for hand washing. 7-10 gpcd
• No home uses a basin – all homes use the faucet for handwashing
• Average household empties toilet bucket 1.2X per week
So Far…
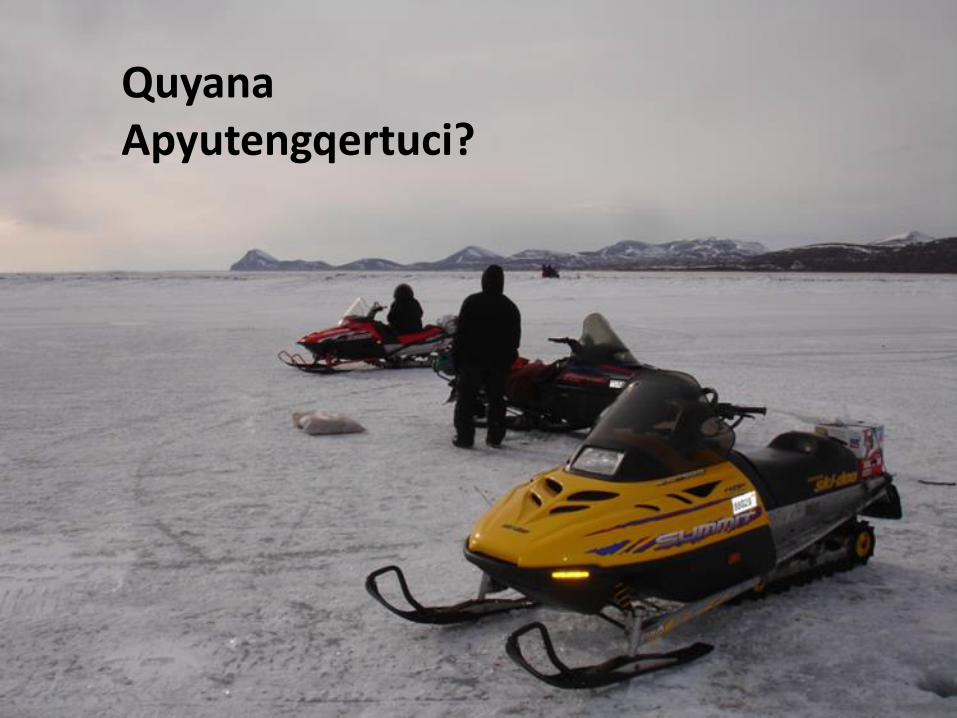
QuyanaApyutengqertuci?
85
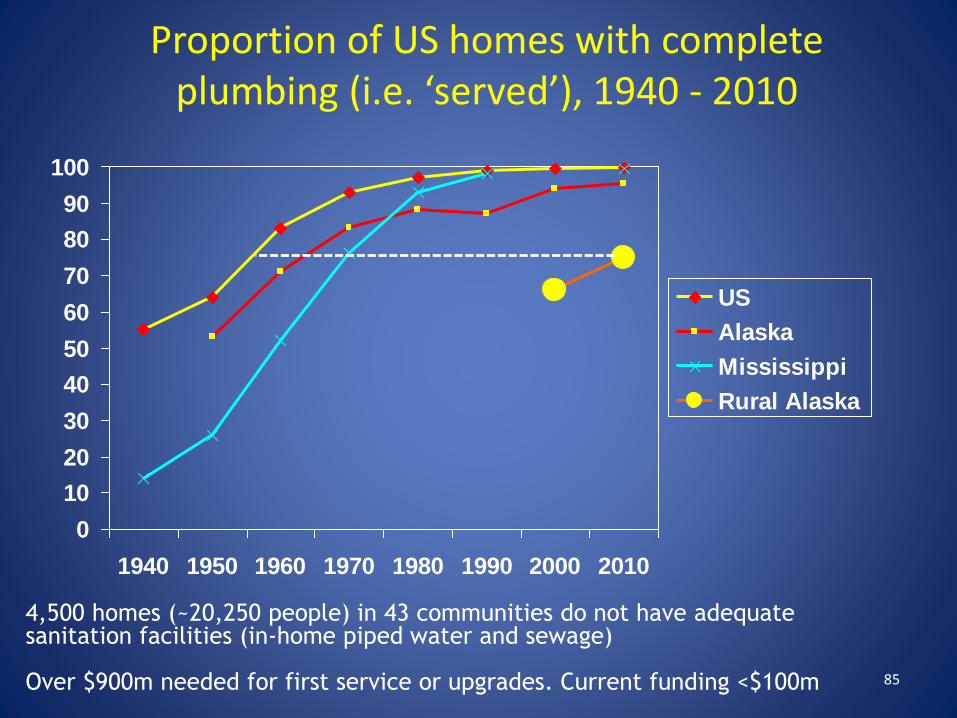
Proportion of US homes with complete plumbing (i.e. ‘served’), 1940 - 2010
0
10
20
30
40
50
60
70
80
90
100
1940 1950 1960 1970 1980 1990 2000 2010
US
Alaska
Mississippi
Rural Alaska
4,500 homes (~20,250 people) in 43 communities do not have adequate sanitation facilities (in-home piped water and sewage)
Over $900m needed for first service or upgrades. Current funding <$100m
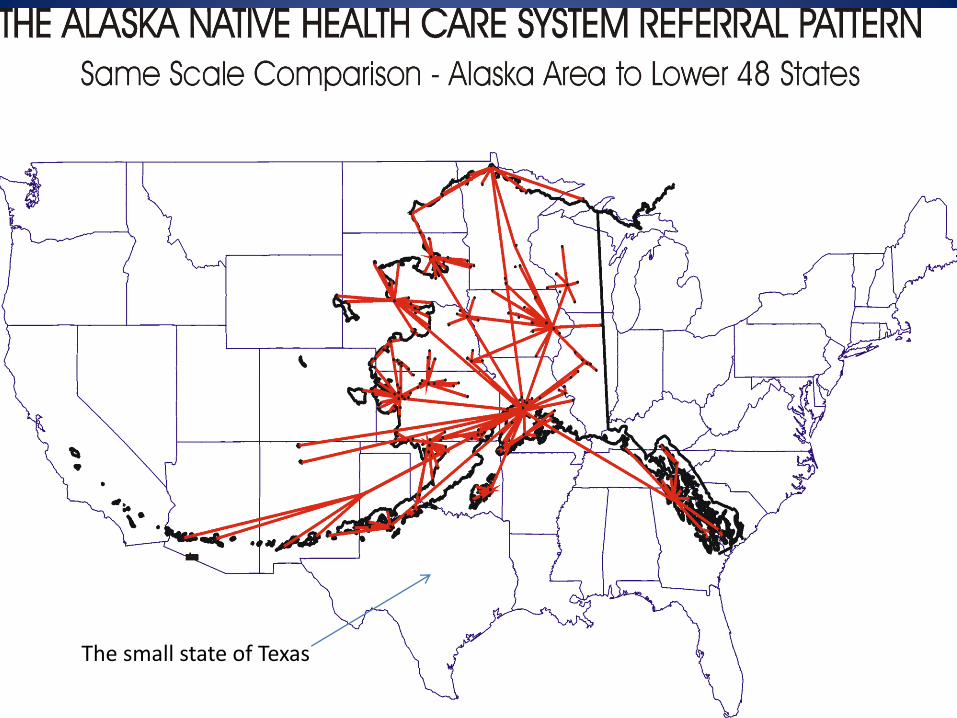
The small state of Texas
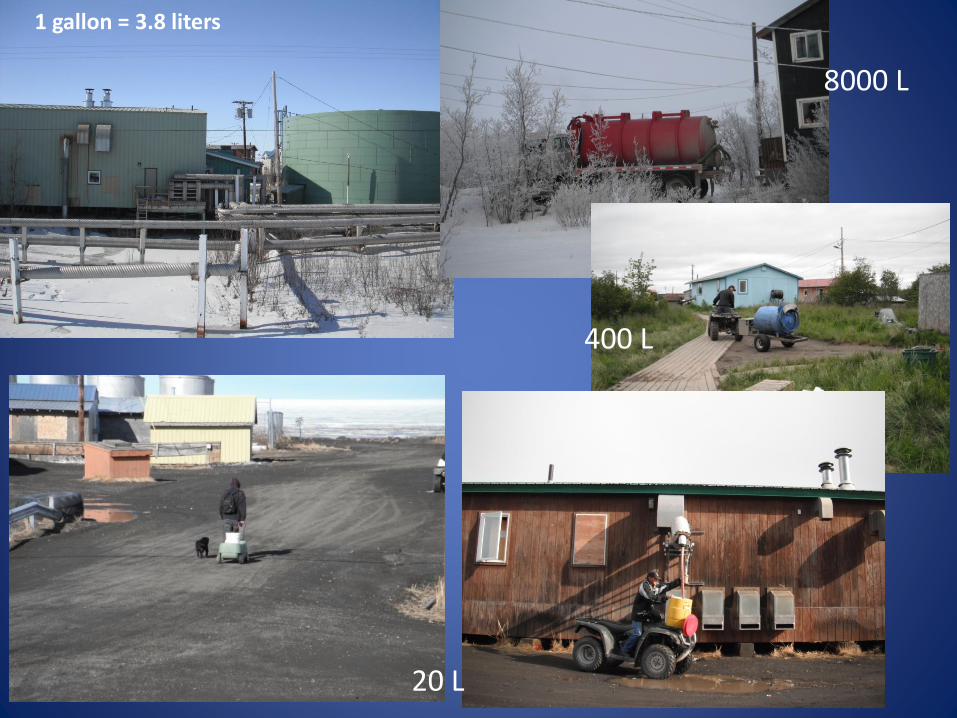
20 L
400 L
8000 L
1 gallon = 3.8 liters
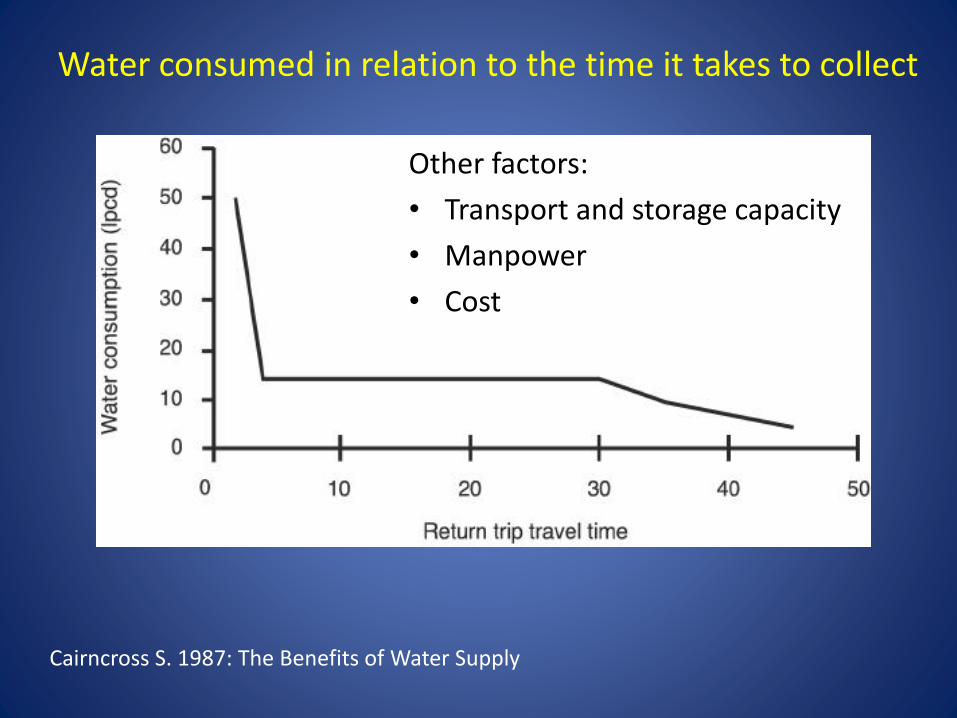
Water consumed in relation to the time it takes to collect
Other factors:
• Transport and storage capacity
• Manpower
• Cost
Cairncross S. 1987: The Benefits of Water Supply
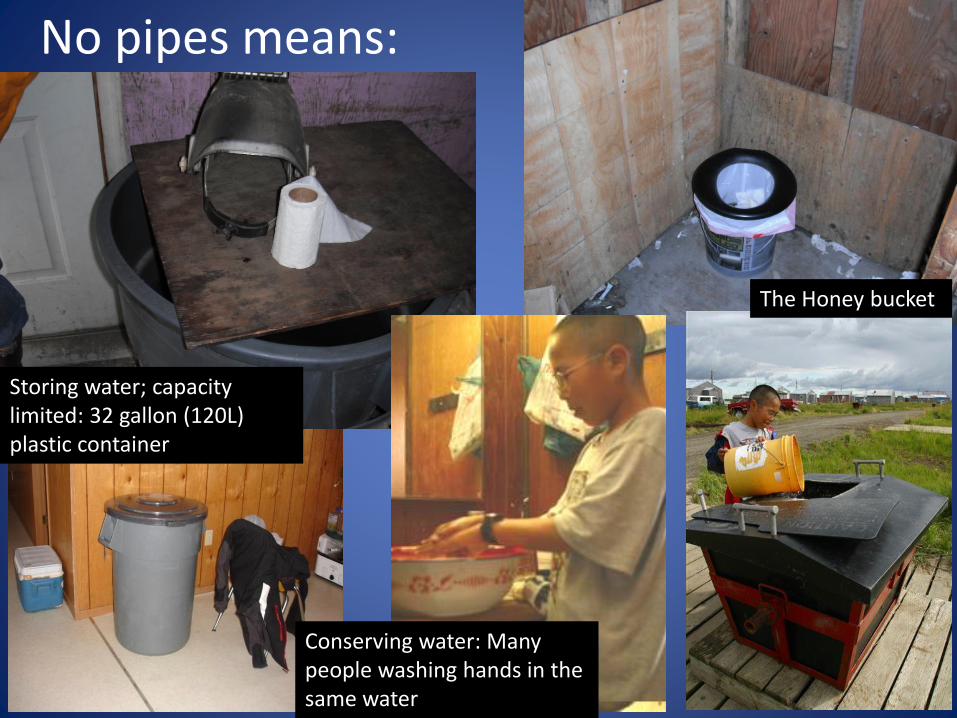
No pipes means:
Storing water; capacity limited: 32 gallon (120L) plastic container
Conserving water: Many people washing hands in the same water
The Honey bucket
91
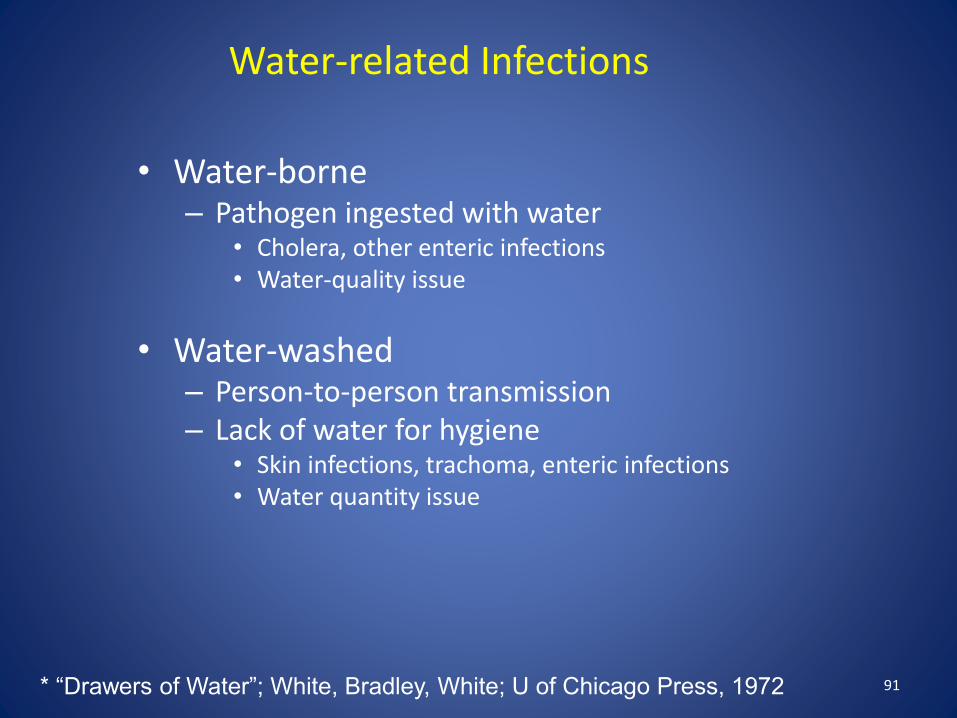
Water-related Infections
• Water-borne– Pathogen ingested with water
• Cholera, other enteric infections• Water-quality issue
• Water-washed– Person-to-person transmission– Lack of water for hygiene
• Skin infections, trachoma, enteric infections• Water quantity issue
* “Drawers of Water”; White, Bradley, White; U of Chicago Press, 1972
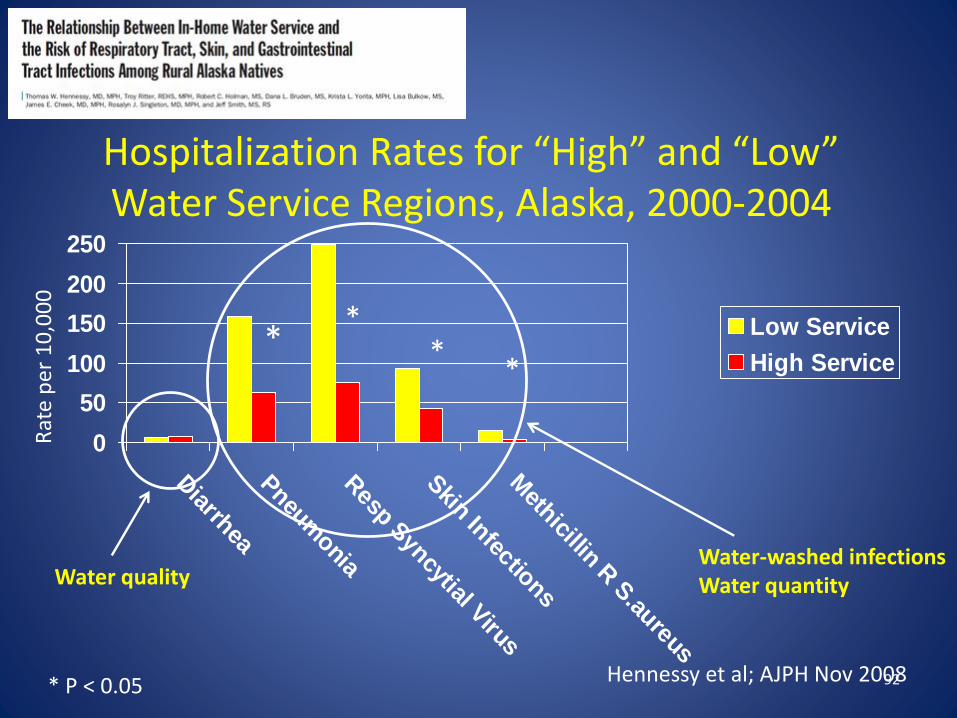
0
50
100
150
200
250
Diarrhea
Pneum
onia
Resp S
yncytial Virus
Skin Infections
Methicillin R
S.aureus
Low Service
High Service
92
* **
*
* P < 0.05
Rat
e p
er 1
0,0
00
Water qualityWater-washed infectionsWater quantity
Hennessy et al; AJPH Nov 2008
Hospitalization Rates for “High” and “Low” Water Service Regions, Alaska, 2000-2004
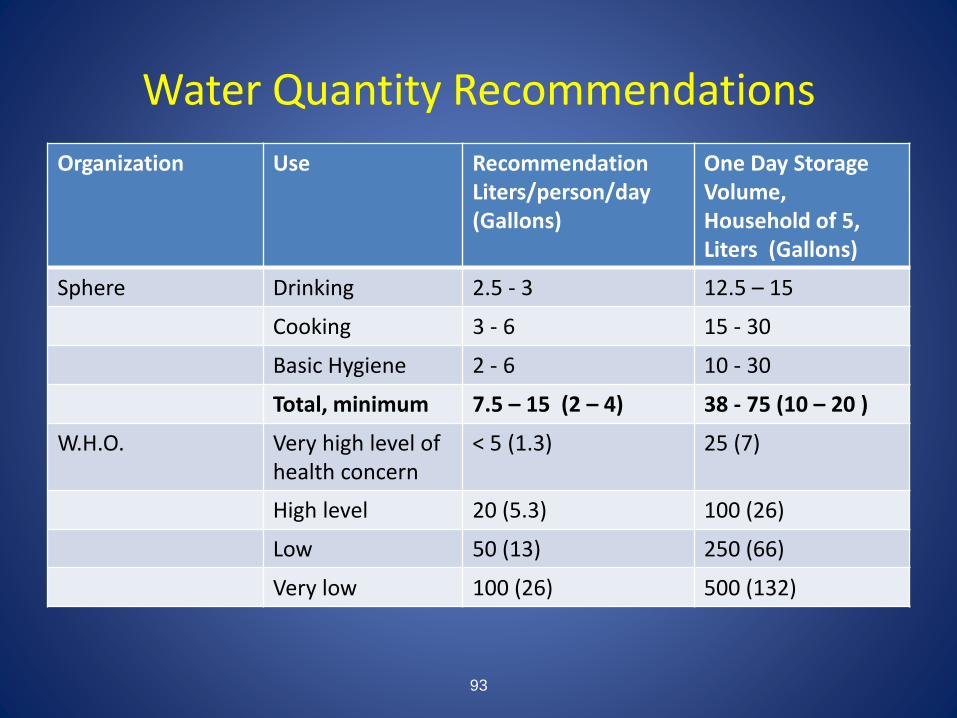
Water Quantity Recommendations
Organization Use RecommendationLiters/person/day(Gallons)
One Day StorageVolume, Household of 5,Liters (Gallons)
Sphere Drinking 2.5 - 3 12.5 – 15
Cooking 3 - 6 15 - 30
Basic Hygiene 2 - 6 10 - 30
Total, minimum 7.5 – 15 (2 – 4) 38 - 75 (10 – 20 )
W.H.O. Very high level of health concern
< 5 (1.3) 25 (7)
High level 20 (5.3) 100 (26)
Low 50 (13) 250 (66)
Very low 100 (26) 500 (132)
93
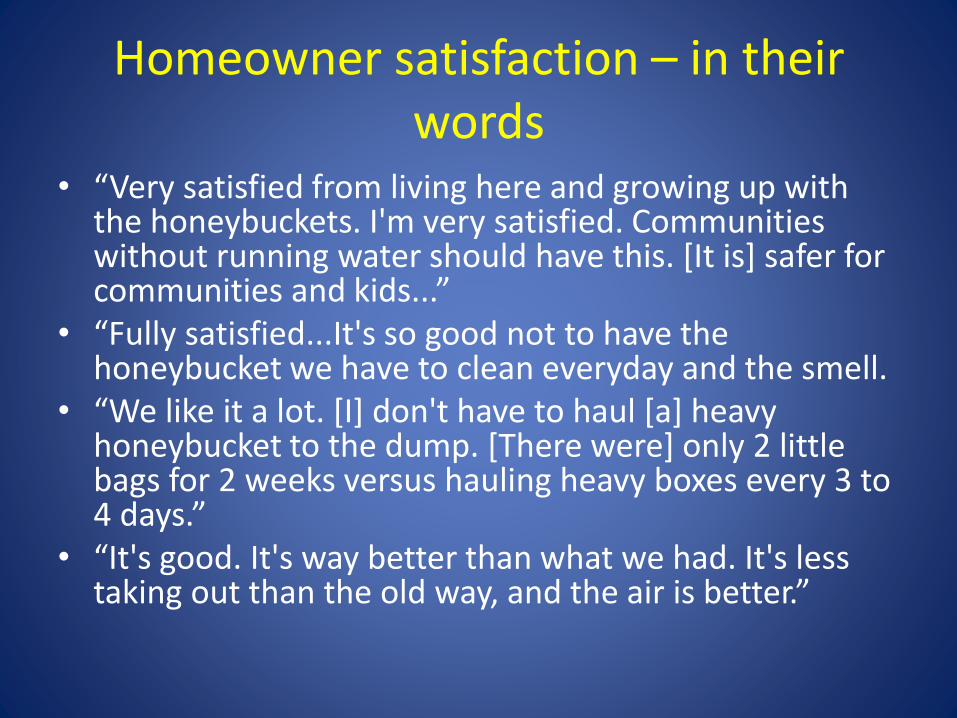
Homeowner satisfaction – in their words
• “Very satisfied from living here and growing up with the honeybuckets. I'm very satisfied. Communities without running water should have this. [It is] safer for communities and kids...”
• “Fully satisfied...It's so good not to have the honeybucket we have to clean everyday and the smell.
• “We like it a lot. [I] don't have to haul [a] heavy honeybucket to the dump. [There were] only 2 little bags for 2 weeks versus hauling heavy boxes every 3 to 4 days.”
• “It's good. It's way better than what we had. It's less taking out than the old way, and the air is better.”
Lessons Learned
• Simplicity
• Constant Communication
• Repetition and Response
Evaluation Period
• Environmental Health
Homeowner Satisfaction & Acceptance
Water Usage
• Engineering
Water Usage
Ground Temperatures
Gray water quality