Embed Size (px)
Citation preview

Ministry of Local Government and Rural Development
ENVIRONMENTAL HEALTH AND SANITATION DIRECTORATE
National Environmental Sanitation Strategy and Acti on Plan
NESSAP
Materials in Transition
March 2010
Government of Ghana
National Environmental Sanitation Strategy and Action Plan (NESSAP) 2010 - 2015 ii
The proportion of Waste Electrical and Electronic Equipment (WEEE) and plastic wastes is increasing and constitute a source of major nuisance that affects the amenity of communities. There is great potential for job creation through improved handling of these components.
Biodegradable Organic Fraction (BOF) constitutes the largest proportion of solid waste. It has great potential for compost production and creation of jobs while minimizing pollution of the environment from poor disposal of refuse. MINTing this portion is significant in meeting MDGs.
Wastewater is used in urban agriculture and depending on the season, it supports 47 -162 ha of vegetable production and up to 800 ha of Maize in Accra. Many residents rely on this source of “greens”.
Uncontrolled discharge of septage and faecal sludges is polluting our beaches, rivers and water courses – a main cause of cholera and typhoid outbreak. Decentralised Treatment, Re-use and Recovery (DETERR) systems will provide on-plot treatment and yield biogas. Solving these will improve tourism along beaches and the coast.
A large number of people - more than 20,000 households of which 5,200 are in Accra alone - rely on banned pan latrines..Close to 5.2 million people will have to be provided with improved household facilities from 2010 till 2015.
In Ghana there is a heavy reliance on open drains for sullage and ‘grey’ water conveyance. Poor Solid Waste Management makes the maintenance of these drains more difficult
Materials in Transition = MINT. MINTing is the underlying philosophy for creating awareness for change of attitude towards the handling and disposal of all types of waste by demonstrating that there is value in all the components of wastes. MINTing will create ‘green collar’ jobs and has the potential to reduce MMDAs’ cost for waste management.
National Environmental Sanitation Strategy and Action Plan (NESSAP) 2010 - 2015 iii
Table of Contents
PREFACE VIII
ACKNOWLEDGEMENTS X
ACRONYMS AND ABBREVIATIONS XI
EXECUTIVE SUMMARY XIII
1. BACKGROUND AND INTRODUCTION - 1 -
1.1 Framework for the NESSAP - 1 - 1.2 The Revised Environmental Sanitation Policy (2009) - 3 -
1.2.1 Policy Focus Areas - 4 - 1.3 Structure of the National Environmental Sanitation Strategy and Action Plan (NESSAP) - 4 -
2. NATIONAL PROFILE - 7 -
2.1 Socio-economic characteristics - 7 - 2.1.1 Distribution of the urban/rural population - 7 -
2.2 Environmental Overview - 8 - 2.2.1 Major Environmental Concerns - 9 -
2.3 Governance System (Institutional Arrangements) - 10 - 2.3.1 Sector Co-ordination - 11 - 2.3.2 Key Sector Institutions and Agencies - 12 -
2.3.2 Legal and Regulatory Framework for Local Governance - 13 - 2.3.3 The Local Government Service - 14 -
3. CURRENT STATE OF ENVIRONMENTAL SANITATION - 20 -
3.1 Overview of Solid Waste Management - 21 - 3.1.1 Sources of Municipal Solid Wastes - 21 - 3.1.2. Solid Waste Collection and Transport - 23 -
3.1.3 Treatment and Disposal of Solid Waste - 24 -
3.2 Overview of Excreta Management - 24 - 3.2.1 Household Access to improved sanitation (by technology options) - 25 -
3.2.1 Excreta Treatment and Disposal Technologies - 28 - 3.3 Overview of Storm Water Drainage and Sullage Conveyance - 32 -
3.3.1 Drainage Plans and On-going Interventions - 34 - 3.4 Environmental Sanitation Education and Enforcement Management - 37 -
3.4.1 Environmental Sanitation and Hygiene Promotion - 38 - 3.4.2 Enforcement Management - 41 -
3.5 Management of Health-Care and Special Industrial Wastes - 42 - 3.5.1 Major sources of HCW and handling methods - 43 - 3.5.2 Special Industrial Wastes - 44 -
3.6 Effects on environment and health - 44 - 3.6.1 Malaria - 46 - 3.6.2 HIV/AIDS - 46 - 3.6.3 Climate Change and Global Warming - 47 -
3.7 Gender, Poverty and Governance Sensitiveness - 49 - 3.8 Financing of Environmental Sanitation Infrastructure and Services - 49 -
3.8.1 Legal framework on Local Government Finance - 50 - 3.8.2 Public Finance and Share to Local Government - 51 - 3.8.3 Sources of Revenues and Expenditure Categories - 52 -
National Environmental Sanitation Strategy and Action Plan (NESSAP) 2010 - 2015 iv
4. NATIONAL OBJECTIVES AND STRATEGIES 63
4.1 The Medium Term Development Policy Framework (MTDPF, 2010 – 2013) and Growth and Poverty Reduction Strategy (GPRS-II) 63
4.2 Decentralisation 63
4.4 Underlying operational principles of the NESSAP 64
4.5 Objectives of the Environmental Sanitation Policy (Revised, 2009) 64
4.6 Measures, action plans and strategies 67
4.6.1 Capacity Development 67
4.6.2 Information, Education and Communication 72
4.6.3 Legislation and Regulation 74
4.6.4 Sustainable Financing and Cost Recovery 77
4.6.5 Levels of Service 80
4.6.6 Research and Development 89
4.6.7 Monitoring and Evaluation 90
4.7 Linking National Strategies to DESSAPs 92
4.8 Environmental Implications of Proposed Strategies 93 4.9 Implications of NESSAP Targets and MDGs 93
5. REQUIREMENTS FOR IMPROVING SERVICES AND INFRASTR UCTURE 96
5.1 General Introduction 96
5.2 Options for Enabling Elements 97
5.3. Options for Levels of Services 97
5.3.1 Incremental Service Improvement Options (ISIOs) 98 5.4 Requirements for improving Enabling Elements 107
5.5 Requirements for improving Levels of Service 114
5.5.1 Solid Waste Management 114
5.5.2 Excreta (Liquid Waste) Management 119
5.5.3 Stormwater Drainage and Sullage Conveyance 121
5.5.4 Health-Care Facility Wastes 122
5.5.5 Summary of Costs for Enabling Elements and Levels of Service 122
6.0 IMPLEMENTATION PLAN - 128 -
6.1 Implementation Packages - 128 - 6.1.1 Institutional Development and Capacity Enhancement Programme - 128 -
6.1.2 Community Participation and Public Awareness Programme - 128 -
6.1.3 Local Services Improvement Programme - 130 -
6.1.4 Research, Performance Monitoring and Governance Programme - 130 -
6.2 Institutional Arrangements - 132 - 6.3 RESULTS-BASED MONITORING & EVALUATION (M & E) - 133 -
ANNEXES - 138 -
Annex 1: Data Tables - 138 - Table A1: Locality Characteristics – Environmental Sanitation Services - 138 -
Analysis of NESSAP Targets and Minimum ISIOs for Services - 138 - Annex 3:Summary of Consultations - (National/Region Workshops, FGDs and KPIs) - 139 -
National Environmental Sanitation Strategy and Action Plan (NESSAP) 2010 - 2015 v
List of Tables Table ES2: NESSAP Implementation Programmes ........................................................................................... xxii Figure 1: FRAMEWORK FOR ENVIRONMENTAL SANITATION DEVELOPMENT IN GHANA .......... - 2 - Table 2.2: GDP Growth Rates (%): 2002- 2008 ................................................................................................ - 8 - Table 2.3: Key Environmental Problems in Ghana ........................................................................................... - 9 - Figure2.1: Structure of the New Local Government System ........................................................................... - 10 - Figure 2.2: Organizational collaboration between agencies for delivering aspects of environmental sanitation services ............................................................................................................................................................ - 15 - Figure 3.1: Benefits of investments in communal environmental sanitation ................................................... - 20 - go beyond toilets (Source: Human Development Report, UNDP 2006) ......................................................... - 20 - Table 3.1: Municipal Solid Waste Data for 5 Largest Cities, 2004 – 2010 ..................................................... - 21 - Figure 3.1: Estimation of Primary Sources of Solid Wastes. L.Y. Salifu (2006) ........................................... - 22 - Figure 3.2: Average Composition of Solid Waste Stream, GAMA. Baseline Surveys, MMDAs, 2008. ....... - 22 - Figure 3.3: Varying Composition of Solid Waste Stream, GAMA. AMA (2004). Baseline Survey, MMDAs, 2008. ................................................................................................................................................................ - 22 - Table 3.2: Coverage of Refuse Collection and Disposal (National and Regional Averages) .......................... - 23 - Table 3.3: Coverage of Refuse Collection and Disposal (National and Regional Averages) .......................... - 23 - Figure 3.4: Estimation Solid Waste Collection and Disposal Methods, MMDAs DESSAP Surveys, 2008 ... - 24 - Table 3.4.: Average Coverage Data for Sanitation in Regions ........................................................................ - 25 - Table 3.5: Household Access to Excreta Disposal Facility (National and Regional Averages) ...................... - 25 - Table 3.6: Distribution of households by locality and type of toilet facility, 2006.......................................... - 26 - Table 3.7 Distribution of Household Sanitation Facilities ............................................................................... - 27 - Figure 3.5: Estimation of Household Use of Excreta Disposal Facilities, MMDAs DESSSAP Surveys, 2008 . - 27 - Table 3.9: Sanitation coverage and requirements to meet MDG and NESSAP Targets .................................. - 28 - Table 3.5: Use of sanitary means of excreta disposal (MICS 2006) ................................................................ - 30 - Table 3.6: A snapshot of the status of selected Sewerage Systems, Accra, Kumasi and Tema ....................... - 31 - Table 3.10: Disposal of Sullage (“grey water”, non-faecal liquid waste) ........................................................ - 33 - Table 3.11: Disposal of Sullage (“grey water”, non-faecal liquid waste) ........................................................ - 33 - Table 3.12: Drainage basins of Accra and the extent of improvement ............................................................ - 35 - Table 3.13: Drainage basins of Tema and extent of improvement .................................................................. - 35 - Table 3.14: Drainage basins and extent of improvement - Takoradi ............................................................... - 36 - Table 3.15: Tamale drains .............................................................................................................................. - 37 - Table 3.16: Public Expenditure and Revenue Trends. ..................................................................................... - 51 - Table 3.16: MMDAs Share of Total Public Expenditure ................................................................................ - 51 - Table 3.17: MMDA share of Total public Revenue ........................................................................................ - 51 - Figure 3.6: Main sources of revenue/allocations to MMDAs, 2008. ............................................................... - 52 - Table 3.18: Total MMDA Revenues and Expenditures, 2004 – 2007 (GH¢) ................................................. - 53 - Table 3.19: Revenues and Expenditures of 5 Metropolitan Assemblies 2004 - 2007 ..................................... - 54 - Table 3.20: Grants and Donor Support MMDAs (GH¢ million) ..................................................................... - 55 - Table 3.21: Overview of the DACF releases to MMDAs ................................................................................ - 56 - Table 3.22: Details of DACF and other Transfers to Special Sanitation Fund- ............................................... - 57 - Table 3.23: Total HIPC FUNDS Released to MMDAs ................................................................................... - 57 - Table 3.24: Sanitation investments and operational costs in Ghana in 2007 ................................................... - 57 - Table 3.25: Major Environmental Sanitation Sector Projects and Sources of Funding ....................................... 59 Table 4.1 Focus Area: A. Capacity Development ................................................................................................ 68 Table 4.2 Focus Area: B. Information, Education and Communication ............................................................... 73 Table 4.3 Focus Area: C Legislation and Regulation ........................................................................................... 75 Table 4.4 Focus Area: D Sustainable financing and cost recovery ....................................................................... 77 Figure 3.6: Value Chain Map - Compost .............................................................................................................. 81 Figure 3.7: Value Chain Map - Thin Film Plastics ............................................................................................... 82 Figure 3.9: Value Chain Map - Ferrous Metals .................................................................................................... 83 Figure 3.10: Value Chain Map, E-Waste .............................................................................................................. 84 Table 4.5 Focus Area: E Levels of Service........................................................................................................... 85 Table 4.6 Focus Area: F - Research and Development ......................................................................................... 89 Table 4.7 Focus Area: G – Monitoring and Evaluation ........................................................................................ 91 Figure 4.1: The link between Environmental Sanitation and MDGs .................................................................... 93 Table 6.1: Classification of Localities (adapted from GLG, 2002) ...................................................................... 96 Figure 5.1: Model of process flow for measures, actions and implementation packages (NESSAP/SESIP) ....... 99 Table 5.2: Typical Housing Segments, Collection/Transport Service Modes .................................................... 102
National Environmental Sanitation Strategy and Action Plan (NESSAP) 2010 - 2015 vi
Table 5.3: Typical Refuse Collection Vehicles (RCVs) for Service Modes ....................................................... 103 Table 5.4: Phasing of ISIOs for Landfills ........................................................................................................... 104 Table 5.5: MSW recovery, treatment and disposal facility operations ............................................................... 104 Table 5.6:Types of Excreta Disposal/Treatment Technologies .......................................................................... 105 Table 5.7: ISIOs for Managing HCF Wastes ...................................................................................................... 107 Table 5.8: Costs for Implementing Capacity Development Measures of Enabling Elements ............................ 108 Table 5.9: Costs for Implementing IEC Measures of Enabling Elements .......................................................... 108 Table 5.10: Costs for Implementing Legislation and Regulation Measures of Enabling Elements .................... 110 Table 5.11: Costs for Implementing Financing and Cost-Recovery Measures of Enabling Elements ............... 111 Table 5.12: Costs for Implementing Research and Development Measures of Enabling Elements ................... 112 Table 5.13: Costs for Implementing M&E Measures of Enabling Elements ...................................................... 113 Table 5.13: Costs for Implementing M&E Measures of Enabling Elements ...................................................... 113 Table 5.14: Planning Framework for “minimum” ISIOs (2010 – 2015) ............................................................ 115 Table 5.15:Requirements for Sweeping/Cleansing of Selected Public Streets and Spaces ................................ 116 Table 5.16: Investment and O&M Costs for Minimum ISIO for Landfills ........................................................ 117 Table 5.17: Investment and O&M Costs for Compost Plants (Corresponding to MRFs) .................................. 118 Table 5:19: Estimated Costs for Bio-gas Plants and Accessories at Selected Regional HCFs ........................... 122 Table 5.20A: Costs for Implementing measures for Levels of Service ......................................................... - 124 - Table 5.20B: Costs for Implementing measures for Levels of Service (cont’d) ............................................ - 125 - Table 5.21: Summary Costs for Implementing Improvement Measures(2010 – 2015) ................................. - 126 - Table 6.1: Institutional Development and Capacity Enhancement Programme (2010 – 2015) ..................... - 128 - FIGURE 6.1: IMPLEMENTATION TIERS FOR NESSAP/SESIP/DESSAP ............................................. - 129 - Table 6.2: Community Participation and Public Awarenes Programme (2010 - 2015) ................................. - 130 - Table 6.3: Local Services Improvement Programme (2010 - 2015) .............................................................. - 131 - Table 6.4: Research, Performance Monitoring and Governance Programme (2010 - 2015) ......................... - 132 - Table 6.6: Indicators for Results-Based M&E for Capacity Development.................................................... - 133 - Table 6.7: Indicators for R-B M&E for IEC .................................................................................................. - 135 - Table 6.8: Indicators for R-B M&E for Legislation and Regulation ............................................................. - 136 - Table 6.8: Indicators for Results-Based M&E for Sustainable Financing and Cost Recovery ...................... - 137 - Table 6.9: Indicators for Results-Based M&E for Levels of Service ............................................................ - 137 -
National Environmental Sanitation Strategy and Action Plan (NESSAP) 2010 - 2015 vii
List of Figures Figure 1: FRAMEWORK FOR ENVIRONMENTAL SANITATION DEVELOPMENT IN GHANA .......... - 2 - Figure2.1: Structure of the New Local Government System ........................................................................... - 10 - Figure 2.2: Organizational collaboration between agencies for delivering aspects of environmental sanitation services ............................................................................................................................................................ - 15 - Figure 3.1: Benefits of investments in communal environmental sanitation ................................................... - 20 - go beyond toilets (Source: Human Development Report, UNDP 2006) ......................................................... - 20 - Figure 3.1: Estimation of Primary Sources of Solid Wastes. L.Y. Salifu (2006) ........................................... - 22 - Figure 3.2: Average Composition of Solid Waste Stream, GAMA. Baseline Surveys, MMDAs, 2008. ....... - 22 - Figure 3.3: Varying Composition of Solid Waste Stream, GAMA. AMA (2004). Baseline Survey, MMDAs, 2008. ................................................................................................................................................................ - 22 - Figure 3.4: Estimation Solid Waste Collection and Disposal Methods, MMDAs DESSAP Surveys, 2008 ... - 24 - Figure 3.6: Main sources of revenue/allocations to MMDAs, 2008. ............................................................... - 52 - Figure 3.6: Value Chain Map - Compost .............................................................................................................. 81 Figure 3.7: Value Chain Map - Thin Film Plastics ............................................................................................... 82 Figure 3.9: Value Chain Map - Ferrous Metals .................................................................................................... 83 Figure 3.10: Value Chain Map, E-Waste .............................................................................................................. 84 Figure 4.1: The link between Environmental Sanitation and MDGs .................................................................... 93 Figure 5.1: Model of process flow for measures, actions and implementation packages (NESSAP/SESIP) ....... 99 Figure 6.1: Implementation Tiers for NESSAP/SESIP/DESSAP.................................................................. - 129 -
List of Boxes Box ES1: Details of Enabling Elements and Levels of Service........................................................................... xxi Box 3.2: Overview of Environmental Sanitation Legislation in Ghana .......................................................... - 43 - Box 3.3: Integration of environmental sanitation services is essential: ........................................................... - 45 - Box 3.4: Balancing Gender, Wealth and Location for Improving Sanitation .................................................. - 49 - Box 5.1: Details of Enabling Elements and Levels of Service ............................................................................. 96
National Environmental Sanitation Strategy and Action Plan (NESSAP) 2010 - 2015 viii
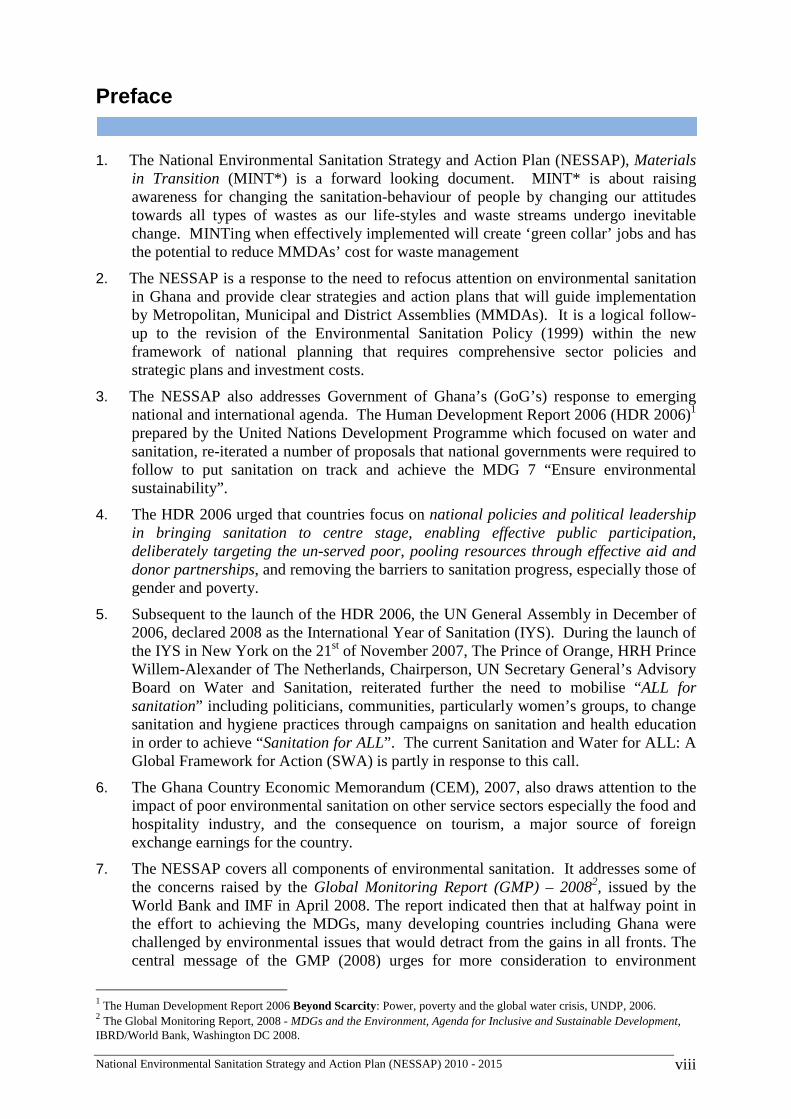
Preface
1. The National Environmental Sanitation Strategy and Action Plan (NESSAP), Materials in Transition (MINT*) is a forward looking document. MINT* is about raising awareness for changing the sanitation-behaviour of people by changing our attitudes towards all types of wastes as our life-styles and waste streams undergo inevitable change. MINTing when effectively implemented will create ‘green collar’ jobs and has the potential to reduce MMDAs’ cost for waste management
2. The NESSAP is a response to the need to refocus attention on environmental sanitation in Ghana and provide clear strategies and action plans that will guide implementation by Metropolitan, Municipal and District Assemblies (MMDAs). It is a logical follow-up to the revision of the Environmental Sanitation Policy (1999) within the new framework of national planning that requires comprehensive sector policies and strategic plans and investment costs.
3. The NESSAP also addresses Government of Ghana’s (GoG’s) response to emerging national and international agenda. The Human Development Report 2006 (HDR 2006)1 prepared by the United Nations Development Programme which focused on water and sanitation, re-iterated a number of proposals that national governments were required to follow to put sanitation on track and achieve the MDG 7 “Ensure environmental sustainability”.
4. The HDR 2006 urged that countries focus on national policies and political leadership in bringing sanitation to centre stage, enabling effective public participation, deliberately targeting the un-served poor, pooling resources through effective aid and donor partnerships, and removing the barriers to sanitation progress, especially those of gender and poverty.
5. Subsequent to the launch of the HDR 2006, the UN General Assembly in December of 2006, declared 2008 as the International Year of Sanitation (IYS). During the launch of the IYS in New York on the 21st of November 2007, The Prince of Orange, HRH Prince Willem-Alexander of The Netherlands, Chairperson, UN Secretary General’s Advisory Board on Water and Sanitation, reiterated further the need to mobilise “ALL for sanitation” including politicians, communities, particularly women’s groups, to change sanitation and hygiene practices through campaigns on sanitation and health education in order to achieve “Sanitation for ALL”. The current Sanitation and Water for ALL: A Global Framework for Action (SWA) is partly in response to this call.
6. The Ghana Country Economic Memorandum (CEM), 2007, also draws attention to the impact of poor environmental sanitation on other service sectors especially the food and hospitality industry, and the consequence on tourism, a major source of foreign exchange earnings for the country.
7. The NESSAP covers all components of environmental sanitation. It addresses some of the concerns raised by the Global Monitoring Report (GMP) – 20082, issued by the World Bank and IMF in April 2008. The report indicated then that at halfway point in the effort to achieving the MDGs, many developing countries including Ghana were challenged by environmental issues that would detract from the gains in all fronts. The central message of the GMP (2008) urges for more consideration to environment
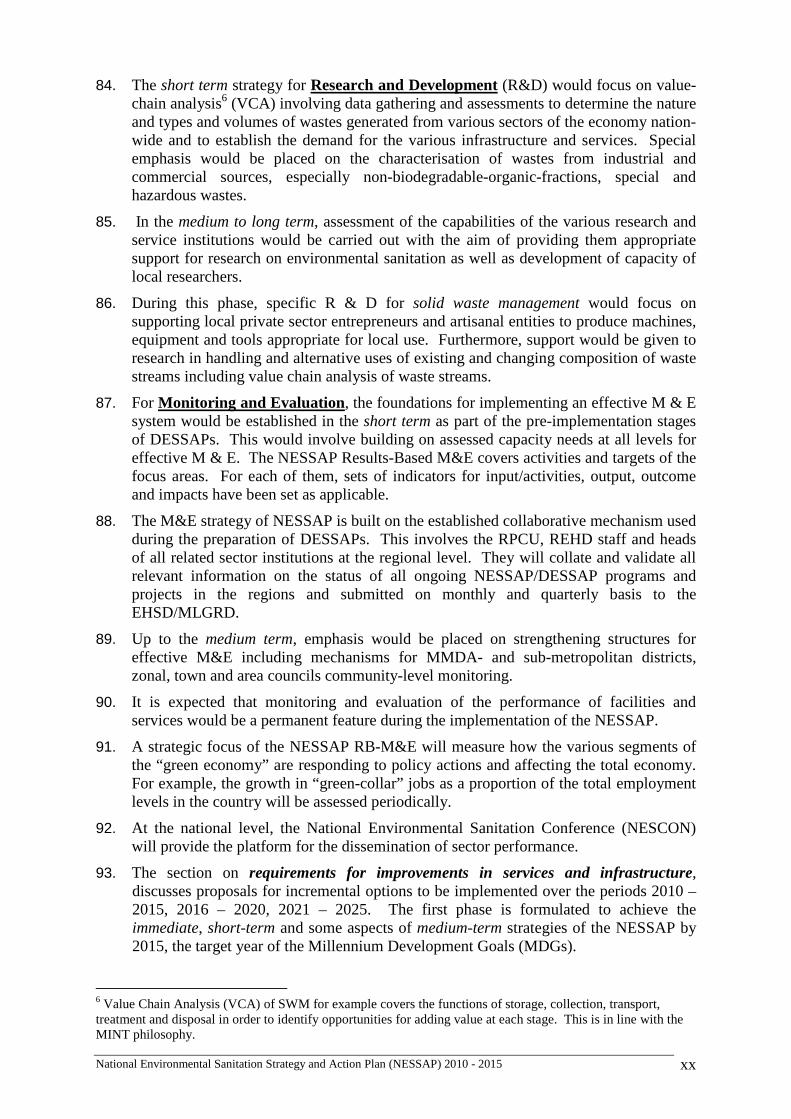
1 The Human Development Report 2006 Beyond Scarcity: Power, poverty and the global water crisis, UNDP, 2006. 2 The Global Monitoring Report, 2008 - MDGs and the Environment, Agenda for Inclusive and Sustainable Development, IBRD/World Bank, Washington DC 2008.

National Environmental Sanitation Strategy and Action Plan (NESSAP) 2010 - 2015 ix
dimensions of sanitation including looking out for the effects of poor environmental sanitation on the pollution of water sources and contribution to carbon emissions and thus global warming.
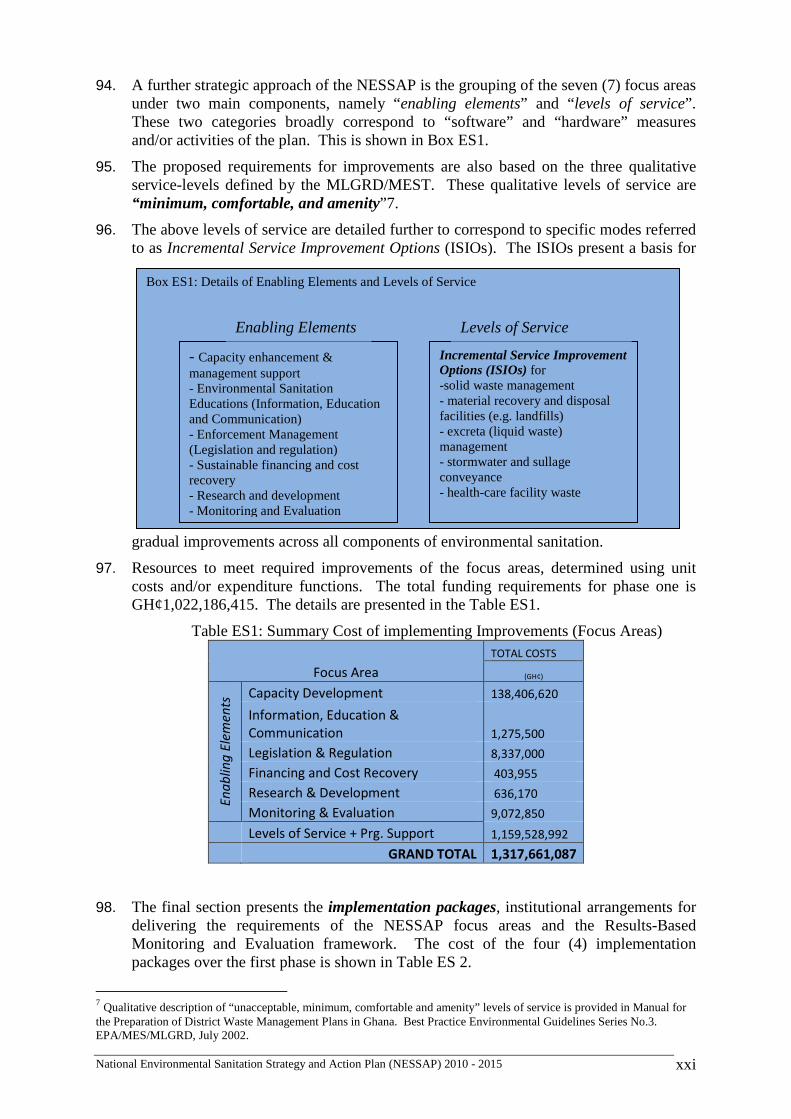
8. The need to consider environmental sanitation broadly as part of national development agenda is also secured by the current Medium-Term Development Policy Framework (MTDPF, 2010 – 2013). The main environmental strategies of the MTDPF address a number of the key issues including establishment of an environmental sanitation investment fund.
9. Since 2004 the Ministry of Local Government and Rural Development (MLGRD), through the Policy Directorate and later the Environmental Health and Sanitation Directorate, has worked with sector stakeholders to review and revise the Environmental Sanitation Policy, first published in 1999. The Revised Environmental Sanitation Policy (2009) was prepared through wide consultations at regional and national levels with stakeholders from districts, traditional authorities, NGOs, development partners, ministries, departments and agencies.
10. The preparation of the NESSAP was in phases and carried out within the context of Ghana’s decentralised framework of administration and policy implementation. MMDAs completed an initial stage of gathering baseline data that informed the preparation of District-level Environmental Sanitation Strategies and Action Plans (DESSAPs), partially guided by the strategies and actions plans proposed in the initial version of the NESSAP (Preliminary NESSAP, September 2008).
11. The final NESSAP presents as much information as was reported by the MMDAs on the state of the environmental sanitation infrastructure and services. It also defines resources required and implementation packages covering all the components of environmental sanitation. An accompanying Strategic Environmental Sanitation Investment Plan (SESIP) provides further details of funding requirements and the framework for allocating estimated funding-gaps for projected improvements by 2015.
12. The NESSAP therefore provides the basis for MMDAs to commence incremental improvements for all aspects of environmental sanitation that can be measured and tracked towards Government of Ghana’s vision of achieving middle-income status by 2020.
13. The NESSAP in addition serves as a useful reference as it presents background information from different sources and detail analysis for incremental service improvement options for the various components of environmental sanitation.
National Environmental Sanitation Strategy and Action Plan (NESSAP) 2010 - 2015 x
Acknowledgements
14. The NESSAP is the result of the efforts of a wide range of stakeholders.
15. The framework for the NESSAP received inputs and comments from members of NESPOCC3, staff of Ministries, Departments and Agencies (MDAs) as well as development partners. Following the participatory manner in which the revision of the Environmental Sanitation Policy (Revised, 2009) was carried out, the preparation of DESSAPs was made possible through Regional-level facilitation and consultations.
16. In this regard the following deserve special mention: Regional Coordinating Councils (RCCs), Regional Planning and Coordinating Units (RPCUs), the Regional Environmental Health and Sanitation Directorates (REHSDs), the regional offices of; Environmental Protection Agency (EPA), Hydrological Services Department (HSD), Town and Country Planning Department (TCPD), Ghana Health Service (GHS), Ghana Education Service (GES), Ghana Statistical Service, Community Water and Sanitation Agency (CWSA), Ghana Tourist Board (GTB) and the Ministry of Women and Children (MOWAC)/Department of Women (DOW).
17. The coordinating roles of the of expanded District Planning Coordinating Units (DPCUs) and the support of Metropolitan, Municipal and District Chief Executives (MMDCEs) and Assembly members of the various MMDAs represent real ownership at the decentralized local government level and deserve commendation.
18. The Royal Netherlands Embassy (RNE) provided funding for the preparation of the NESSAP as part of the “Support to the Establishment of the Environmental Health and Sanitation Directorate (EHSD)” in the MLGRD. The preparatory phase of the programme was managed as part of the Policy Monitoring and Management Support (PMMS, 2004 - 2008) component of the second-phase of the Water and Sanitation Sector Programme Support (WSSPSII) funded by Danida.
19. The preparation of the NESSAP was carried out by a core specialist team of WasteCare Associates involving environmental, planning and institutional, legal, finance, IT and public health engineering experts, with specific inputs from other local and international experts.
20. The MLGRD and the Environmental Health and Sanitation Directorate (EHSD) wish to express their appreciation to all who have contributed in diverse ways to supporting these efforts.
3 The National Environmental Sanitation Policy Coordination Council (NESPoCC) comprising MMDAs, key MDAs and the private sector is responsible for coordinating policy implementation.
National Environmental Sanitation Strategy and Action Plan (NESSAP) 2010 - 2015 xi
Acronyms and Abbreviations
CLTS Community-Led Total Sanitation CWSA - Community Water and Sanitation Agency DANIDA Danish International Development Assistance DESSAP District Environmental Sanitation Strategy and Action Plan DP - Development Partners DPCU - District Planning Coordinating Unit DWSP - District Water and Sanitation Plan EHSD - Environmental Health and Sanitation Directorate EPA - Environmental Protection Agency ESSA - Environmental Sanitation Assessment and Audit FGD - Focus Group Discussion GPRSII - Growth and Poverty Reduction Strategy GoG - Government of Ghana GWCL - Ghana Water Company Limited IEC - Information, Education and Communication ILGS - Institute of Local Government Service IWRM - Integrated Water Resources Management KPI - Key Person Interview LGS - Local Government Service LGSS - Local Government Service Secretariat MDG - Millennium Development Goal MINT* Materials in Transition MLGRD - Ministry of Local Government, Rural Development MDA - Ministries, Departments and Agencies MMDA - Metropolitan, Municipal and District Assembly MMDCEs Metropolitan, Municipal and District Chief Executives MoFEP - Ministry of Finance and Economic Planning M & E - Monitoring & Evaluation MoE - Ministry of Education MOFA - Ministry of Food and Agriculture MTDPF - Medium Term Development Policy Framework (2010-13) MWRWH - Ministry of Water Resources, Works and Housing NCWSP - National Community Water and Sanitation Programme NDPC - National Development Planning Commission NESIF National Environmental Sanitation Investment Fund NESSAP National Environmental Sanitation Strategy and Action Plan NGO - Non- Governmental Organization PMMS - Policy Monitoring and Management Support PPPPPs - Policies, Plans, Programmes, Projects and Products PURC - Public Utilities Regulatory Commission RCC - Regional Coordinating Council RNE - Royal Netherlands Embassy RPCU - Regional Planning Coordinating Unit RWST - Regional Water and Sanitation Team SEA - Strategic Environmental Assessment SESIP - Strategic Environmental Sanitation Investment Plan SHEP/GES - School Health Education Programme of Ghana Education Service SSHE - School Sanitation and Hygiene Education
National Environmental Sanitation Strategy and Action Plan (NESSAP) 2010 - 2015 xii
SIF - Social Investment Fund UNDP United Nations Development Porgramme UNICEF - United Nations Children Fund WD - Water Directorate WRC - Water Resources Commission
National Environmental Sanitation Strategy and Action Plan (NESSAP) 2010 - 2015 xiii
Executive Summary
21. This National Environmental Sanitation Strategy and Action Plan (NESSAP), Materials in Transition (MINT*) serves as a driver for changing the perception of Ghanaians on all types of wastes - both liquid and solid and thus affect our sanitation-behaviour. The philosophy of MINT* is that waste is a material resource which is not to be discarded but value added on at various stages while in transition within the production and consumption cycles.
22. MINTing also has the potential of creating ‘green collar’ jobs and reducing MMDAs cost of managing wastes.
23. Improving the delivery of environmental sanitation services is one of the key challenges of our times. The immediate impact of poor services is often felt and seen by many residents and so Metropolitan, Municipal and District Chief Executives (MMDCEs) are engaged daily and costs take about a third of municipal budgets besides periodic support from District Assemblies Common Fund (DACF), Highly Indebted and Poor Countries (HIPC) and other sources.
24. Environmental sanitation is considered as a major component of the current Medium-Term Development Policy Framework (MTDPF, 2010 – 2013) as well as the previous Growth and Poverty and Reduction Strategy (GPRSII, 2006 -2009). This is adequately captured under the Expanded Development of Production Infrastructure pillar of the MTDPF (2010 – 2013).
25. While creating awareness for change in environmental sanitation behaviour of all citizens and improving enforcement management are important strategies that can remedy the poor situation of services, improving the knowledge and expertise of sector staff is critical. The Environmental Sanitation Policy (Revised, 2009) supports the above goal and recommends institutional strengthening and capacity enhancement of sector institutions and staff as an important requirement.
26. The National Environmental Sanitation Strategy and Action Plan (NESSAP) is in response to the need to refocus environmental sanitation sector in Ghana to meet MTDPF (2010 – 2013) objectives as well as those of MDGs and other recent international initiatives such as the Sanitation and Water for ALL: a Global Framework for Action (SWA).
27. The NESSAP is a first-time attempt at providing strategic proposals and action plans with a country-wide scope. Hitherto interventions have been carried out by implementing specific projects only.
28. The ESP (2009) defines the implementation roles of key stakeholders. The NESSAP is to guide all sector actors - Ministries, Departments and Agencies (MDAs), Metropolitan, Municipal and District Assemblies (MMDAs), Private Sector, Development Partners, NGOs, Traditional Authorities and the media – to achieve incremental improvements over the long-term planning horizon, 2008 – 2025.
29. The NESSAP is a first attempt at translating the measures of the objectives of the Revised ESP (2009) into actionable targets and implementation packages. It was prepared in phases and carried out within the context of Ghana’s decentralised framework of administration and policy implementation.
30. Adopting a “top-down, bottom-up” planning approach, an overview of the existing situation, focus areas of the revised policy and the strategies and actions to meet policy
National Environmental Sanitation Strategy and Action Plan (NESSAP) 2010 - 2015 xiv
Advocacy, Education & Communication
Pol
icy
PoI
P
Enf
orce
men
t M
gt.
On-
goin
g,
plan
ned
&
imm
edia
te
proj
ects
National Strategy & Investment Plan
NE
SS
AP
SE
SIP
Join
t M
onito
ring
&
perf
orm
ance
re
view
s
Programme for harmonizing & aligning
procedures
Alig
nmen
t of
reso
urce
flow
s
Par
tner
ship
ar
rang
emen
ts
with
DP
s
Inst
itutio
nal S
tren
gthe
ning
&
Pro
gram
me
Mgt
. Sup
port
(in
cl.
NE
SP
oCC
)
Awareness raising for behavioural change
Strategic
interventions
Coordination, collaboration and
partnership building)
A B C
objectives were initially described. This provided the national-level “top-down” strategic proposals.
31. As an essential element of the process of completing the NESSAP and following National Development Planning Commission (NDPC) guidelines for preparing plans for implementation at district-level, MMDAs carried out a comprehensive baseline data collection. This first-time effort of collecting data country-wide informs the preparation of District-level Environmental Sanitation Strategies and Action Plans (DESSAPs).
32. Targets differ from district to district and this influences district-specific strategies and action plans. The DESSAPs provide the district-level “bottom-up” data and strategies for updating the NESSAP periodically.
33. Besides the NESSAP a related Strategic Environmental Sanitation Investment Plan (SESIP) is also being prepared to provide the framework for financing the deficits and projected improvements in environmental sanitation infrastructure and services.
34. It is expected that with the NESSAP and SESIP in place, and DESSAPs finalised and harmonised with Medium-term Development Plans (MTDPs), MMDAs shall commence a process of incremental improvements in all aspects of environmental sanitation.
35. It is also expected that through vigorous expression of the need to undertake these environmental sanitation improvements substantial funding will be made available for implementing the MTDPs of MMDAs.
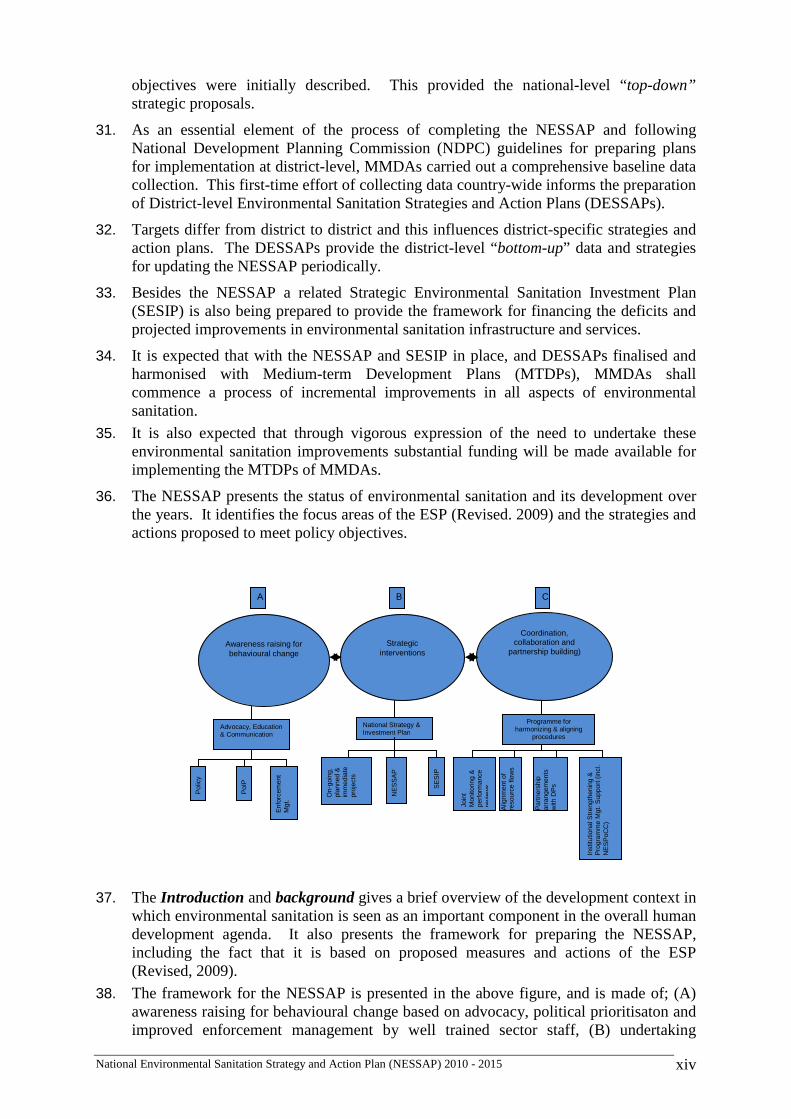
36. The NESSAP presents the status of environmental sanitation and its development over the years. It identifies the focus areas of the ESP (Revised. 2009) and the strategies and actions proposed to meet policy objectives.
37. The Introduction and background gives a brief overview of the development context in which environmental sanitation is seen as an important component in the overall human development agenda. It also presents the framework for preparing the NESSAP, including the fact that it is based on proposed measures and actions of the ESP (Revised, 2009).
38. The framework for the NESSAP is presented in the above figure, and is made of; (A) awareness raising for behavioural change based on advocacy, political prioritisaton and improved enforcement management by well trained sector staff, (B) undertaking
National Environmental Sanitation Strategy and Action Plan (NESSAP) 2010 - 2015 xv
strategic interventions based on DESSAPs, NESSAP and SESIP that recognises on-going and planned projects, and (C) ensuring effective coordination, collaboration and partnership building amongst all key sector stakeholders.
39. In line with the definition of the components of environmental sanitation in the ESP (Revised, 2009), the NESSAP strategies and action plans cover;
(a) Solid Waste Management; (b) Excreta (Liquid Waste) Management (c) Storm-water Drainage and Sullage Conveyance; (d) Environmental Sanitation Education and Enforcement Management (e) Health-care and Special Industrial Wastes;
40. The policy focus areas are: i. Capacity Development ii. Information, Education and Communication iii. Legislation and Regulation iv. Levels of Service v. Sustainable Financing and Cost Recovery vi. Research and Development vii. Monitoring and Evaluation
41. The national profile provides a summary of geographical information about Ghana, socio-economic data and key environmental issues and how these relate to the state of environmental sanitation. The institutional context of environmental sanitation is also presented covering the main sector Ministries, Department and Agencies (MDAs) and how they relate to MMDAs. The legal and regulatory framework for the sector is also discussed including the role of the Local Government Service.
42. The current state of environmental sanitation presents an overview of situational analysis and is derived from many sources including review of project documents, 2000 Population and Housing Census, Multiple Indicator Cluster Survey (MICS, 2006), Annual Progress Reports (2007,2008) of GPRSII, Ghana Demographic and Health Survey (GDHS, 2008) and baseline data gathered by MMDAs. The detail of information differs from one component to the other. It is expected that as Metropolitan, Municipal and District Assemblies (MMDAs) update their DESSAPs annually, the quality of information will improve.
43. For solid wastes, the 2000 Housing and Population Census reports that on the national level, 4.8% of households have their waste collected directly from their dwelling, 7.9% burn their household refuse, 57.6% use various household receptacles for storage and send it to designated public dumps including communal-container stations or sanitary sites. It is reported that 25.9% of households dump their refuse at unspecified locations including vacant lots, drains, embankment of water courses, rivers, lakes and wetlands.
44. From data collected in 2008 by MMDAs for the preparation of DESSAPs more than 70% of residents resort to indiscriminate means of disposing of their refuse.
45. Available data for Ghana’s five largest cities show that collection and transport ratios (waste collected and transported to disposal/waste generated) for refuse is gradually improving over the last few years - Accra 70%, Kumasi 75%, Sekondi-Takoradi 60%, Tamale 55% and Tema 68%.
46. The poor disposal of refuse both in communities and its management at final disposal sites remain a bottle-neck faced by all MMDAs. Crude, open dumping is the practice in almost all communities. In the few cases where controlled-dumping is practiced, environmental impact whether immediate or long-term are ignored. Implementing
National Environmental Sanitation Strategy and Action Plan (NESSAP) 2010 - 2015 xvi
improved site management procedures is therefore, often only in reaction to public outcry and threat of closure of operations by nearby communities.
47. Kumasi and Tamale are the only two cities with engineered landfills. Accra, the capital city, has no engineered disposal site and refuse is disposed off in abandoned quarries in adjoining districts.
48. For excreta management i.e. the “hygienic disposal of human excreta” the options available include the use of on-site and off-site systems - pit latrines, VIPs, K-VIPs, WC/Septic Tanks, Aqua Privies, variations of ecological sanitation facilities and waterborne sewerage systems.
49. From surveys carried out by Environmental Health and Sanitation Directorates (EHSDs) of MMDAs in 2008/2009 about 45% of households use flush toilets (water closets connected to cesspits and septic tanks mostly without drain fields), 17% rely on pit latrines, 23% use VIPs, 1% use aqua-privies (or septic-tank latrines), 7% use KVIPs, 4% resort to other means (including open-defaecation and wrap-and-throw), and 17% rely on pit-latrines. The use of unhygienic and health-threatening pan (or bucket) latrines still exist accounting for about 3% of household usage, especially in quarters of government ministries and police barracks in regional and district capitals. There are close to 5,200 pan (bucket) latrines in the Greater Accra Metropolitan Area (GAMA) alone out of about 20,000 country-wide. The use of public toilets is still prevalent with 30% of households relying on various public toilets - WCs, KVIPs and Aqua Privies.
50. The national average for sewerage coverage has persistently being as as low as 4.5%. Tema is the only municipality with a comprehensive sewerage system. Accra and Kumasi have limited sewerage. The treatment facilities for both the Accra and Tema systems as is typical of many sewage and septage/faecal sludge treatment facilities, are non-functional.
51. In terms of sanitation coverage, available figures give average national coverage of about 554%, with wide variations in regional coverage between Upper Eastern Region (10%) and, say, Greater Accra Region (80%). However, it is important to note that growth of population in rural and peri-urban and low-income communities, will off-set greatly the progress and gains that are being achieved.
52. The section on the overview also discusses environment and health impacts focusing on malaria, HIV/AIDS and Global Warming. The section also discusses gender, poverty and governance issues and how they are influenced by improving environmental sanitation services, and importantly, the financial administration framework and how these affect MMDAs and funding allocations to the sector.
53. In the past ten years the drainage situation in Ghana’s largest cities has improved somewhat with the provision of primary drainage infrastructure as part of the Urban Environmental Sanitation Project (UESP) series5 and improvement of roadside drains in a number of towns.
54. Overall, there is a dire deficit in drainage infrastructure in Ghana and urgent action is required if the contribution of improved drainage to communal well-being is to be realized. Flooding and flood-related loss and destruction of properties, traffic disruption and displacement of persons is a regular occurrence during rainy seasons and the approach of rainy seasons is now viewed with anxiety and insecurity by many a resident of all cities and large towns.
4 This includes “shared facilities" at the household level. The WHO/UNICEF Joint Monitoring Program (JMP) does not regard shared facilities as improved facilities. 5 The UESP series Phase 1 (1996 – 2002) and Phase II (2004 – 2010) financed by GoG/World Bank.
National Environmental Sanitation Strategy and Action Plan (NESSAP) 2010 - 2015 xvii
55. Implementing effective awareness raising strategies for improving environmental sanitation behaviour is an important part of the NESSAP. Therefore, the section on environmental sanitation education and enforcement management presents the many approaches employed in the sector.
56. The currently low level (about 40%) of the population with access to improved sanitation facilities at household level, and the continued presence of pan-latrines in houses (3% nationally), which was banned about a decade ago all illustrate ineffective application of enforcement and sanctioning systems which hitherto were the main vehicles for ensuring compliance.
57. The key players in environmental health/hygiene education in Ghana are the MoH, the MLGRD and the Ministry of Education, (MoE). Participatory methods like Participatory Learning and Action (PLA), SARAR and Participatory Hygiene and Sanitation Transformation (PHAST) and others are applied extensively to facilitate hygiene education especially within the water and sanitation sector.
58. Community-Led Total Sanitation (CLTS) is emerging as an effective means of mobilizing communities that have the potential of triggering individual and collective communal action to improve environmental sanitation and is proving to be effective for considering issues beyond mere “toiletisation”. The broadening of the scope of sanitation beyond “hygienic disposal of excreta” to include wastewater (sullage) as proposed by the IYS framework provides opportunity to adapting CLTS for application in the Ghana context learning from experiences of other countries that have set the pace.
59. Ghana’s Public-Private Partnership for Hand-washing with Soap initiative has achieved much acclaim and will be integrated in CLTS methods to be developed and adopted locally, and in School Sanitation and Hygiene Education (SSHE) programmes.
60. The Expanded Sanitary Inspections, Compliance Management and Enforcement (ESICOME) programme was initiated in 1999 to revisit the previously effective colonial and post-independence sanitary inspection and enforcement of bye-laws and therefore covers premises inspection; environmental hygiene education, dissemination of sanitary information, and enforcement of sanitary regulations.
61. Health-Care Wastes and Special Industrial Hazardous Wastes are discussed in the NESSAP together to bring to the fore the need for special handling of this category of wastes which is currently not given much attention by MMDAs who are responsible for waste management and agencies such as EPA which has the legal mandate to ensure adherence to standards and compliance to regulations.
62. The bulk of wastes generated from Health-Care Facilities (HCFs) are generally not hazardous but need more careful handling because of the risk of contamination. Currently, information on the sources of HealthCare Waste (HCW) and the level of management practice is inadequate. The hazardous component e.g. pathological waste, pharmaceuticals and sharps which require special handling and management are currently, in the main, mixed with the municipal refuse and transported to refuse dumps.
63. Information on Special industrial hazardous wastes from industry and some specialised artisanal operations is inadequate. These categories of wastes are hazardous if they either pose substantial or potential threats to public health and/or the environment due to being flammable, oxidising, corrosive, toxic, alkaline, radioactive and/or explosive.
64. In this NESSAP new sources of waste of indeterminate long-term effect is classified as hazardous until declassified by the relevant authority such as the EPA; included in this category are various waste-electrical and electronic equipment (WEEE), electromagnetic
National Environmental Sanitation Strategy and Action Plan (NESSAP) 2010 - 2015 xviii
cards used for telephony and other identification-transactions such as Automatic-Teller-Machines (ATMs), spent energy-saving CFC bulbs (contains mercury), CPUs, batteries, etc. Systematic gathering and analyses of the waste stream from many industries and such sources is not carried out by the relevant authority and, in the short term, hinders the development of any meaningful strategies besides instituting measures for collecting information on, and characterising them.
65. The NESSAP presents the current modes of financial administration at MMDAs as well as the various sources of revenue for development including environmental sanitation. The main sources of revenue for the MMDAs are allocations from the DACF, Internally Generated Funds (IGFs), donor support and other special funds such as HIPC, LEAP, Capitation Grant etc.
66. For the period 2004 – 2007 the total public expenditure grew from GH¢2.19 billion to GH¢4.25 billion. During this same period the average share of total MMDA expenditure was about 5.5%. The nominal allocation by MMDAs for environmental ranges from 15% to 30% of total revenue.
67. The core of the NESSAP is the section which deals with the main national-level objectives and strategies.
68. The main challenge facing the sector is institutional strengthening and capacity enhancement. The strategies for capacity development in the short-term include institutional strengthening focused on the establishment of the Environmental Health and Sanitation Directorate (EHSD) to enable it effectively facilitate implementation of strategies by MMDAs.
69. The medium-term strategies are intended to improve the human resource base within the “green economy” sector. To ensure a steady supply of high grade “green collar” staff and stem the high rate of “cross-over” to other sectors.
70. In the long-term, it is envisaged that building on the above strategies will enable the appointment of key staff including public health engineers and planners at REHSDs, public health and drain maintenance engineers at metropolitan and municipal assemblies, and at the minimum an environmental health technologist per district by 2020.
71. For Information, Education and Communication, the short-term will involve the implementation of the Communication Plan for the ESP (Revised, 2009) to ensure widespread dissemination. It is proposed that the day designated as Environmental Sanitation Day (ENSADA) within the environmental sanitation week should be designed to coincide with an existing statutorily public holiday such as the May Day or AU Day.
72. In the short- to medium-term, the core strategies for IEC have to deal with how Environmental Sanitation Education and Enforcement Management is effectively achieved through the engagement and participation of individuals, households and communities. Reinforcing SHEP activities and mainstreaming hand-washing initiative as part of School Sanitation and Hygiene Education (SSHE) as well as Community-Led Total Sanitation (CLTS) will be adapted and rolled out country-wide. Reintroduction of the ESICOME programme and linking it to the NYEP “sanitation guards” and Eco-brigade modules will be strategic components for enhancing enforcement management.
73. With regards to Legislation and Regulation, the short-term strategy will focus on strengthening the legal framework to improve environmental sanitation and will include assessing relevant bye-laws to identify gaps and improve them where necessary.
National Environmental Sanitation Strategy and Action Plan (NESSAP) 2010 - 2015 xix
Typical areas that need to be catered for include preparation of model bye-laws on environmental sanitation and made available to all MMDAs to ensure consistency in their application.
74. In the medium term, in support of enforcement of environmental regulations the existing process of building and development permitting by MMDAs will be updated to include the relevant sections of the Environmental Assessment Regulations, 1999 (LI1652). Dissemination of these updated processes will be carried out as part of environmental sanitation education.
75. To improve the general enforcement mechanism and prosecution of environmental sanitation offences, the Judicial Service will be supported to train members of the bench on relevant legislation.
76. In the long-term it is expected that Sanitation Courts will be established to deal with environmental cases.
77. Sustainable financing and cost recovery strategies in the short-term, will involve the facilitation and the provision of appropriate incentives that gives investor-confidence to induce injection of capital by the private sector in improving services including provision of public toilets, refuse collection and cesspit-emptying vehicles, and construction of treatment and disposal facilities.
78. As a rule the “polluter-pays-principle” will be applied in determining levies, fees and fines, adequate for meeting the costs of services incident on various components and sources of the waste stream.
79. To ensure systematic funding for DESSAPs within the MTDP framework, MMDAs shall set up and operate a dedicated fund for environmental sanitation. As a transitional measure to operating the dedicated fund, MMDAs shall be required to establish separate budget lines for the components of services and manage revenues for such services separately and exclusively.
80. Once the SESIP becomes operational and the national and MMDA funding sources are in place these will provide the needed financing over the medium- to long-term period for the NESSAP. Government will progressively increase its share of allocations of the DACF targeted to environmental sanitation. As part of medium-term strategies government will set up an institutional mechanism for the effective management of investments in the sector.
81. In order to ensure sustainable financing of services and gradually improve levels of services, direct cost-recovery shall be applied. Consideration will be given to affordability, differential tariffs, cross-subsidisation and MINTing. MMDAs will also establish participatory procedures for setting tariffs involving private sector operators and user-groups.
82. Levels of Services vary for different communities and need to be appropriately targeted in the DESSAPs. In the short-term, Districts will incorporate their DESSAPs in the next MTDPs which will become operational from 2010. The first round of DESSAPs will target achieving “minimum” levels of service by the end of 2015.
83. In the medium-term, it is expected that the involvement of the private sector will bring innovation and improve levels of service beyond “minimum” levels. MMDAs shall regulate and assess the performance of private operators and be able to intervene and restore services promptly in the event of breakdown of services.
National Environmental Sanitation Strategy and Action Plan (NESSAP) 2010 - 2015 xx
84. The short term strategy for Research and Development (R&D) would focus on value-chain analysis6 (VCA) involving data gathering and assessments to determine the nature and types and volumes of wastes generated from various sectors of the economy nation-wide and to establish the demand for the various infrastructure and services. Special emphasis would be placed on the characterisation of wastes from industrial and commercial sources, especially non-biodegradable-organic-fractions, special and hazardous wastes.
85. In the medium to long term, assessment of the capabilities of the various research and service institutions would be carried out with the aim of providing them appropriate support for research on environmental sanitation as well as development of capacity of local researchers.
86. During this phase, specific R & D for solid waste management would focus on supporting local private sector entrepreneurs and artisanal entities to produce machines, equipment and tools appropriate for local use. Furthermore, support would be given to research in handling and alternative uses of existing and changing composition of waste streams including value chain analysis of waste streams.
87. For Monitoring and Evaluation , the foundations for implementing an effective M & E system would be established in the short term as part of the pre-implementation stages of DESSAPs. This would involve building on assessed capacity needs at all levels for effective M & E. The NESSAP Results-Based M&E covers activities and targets of the focus areas. For each of them, sets of indicators for input/activities, output, outcome and impacts have been set as applicable.
88. The M&E strategy of NESSAP is built on the established collaborative mechanism used during the preparation of DESSAPs. This involves the RPCU, REHD staff and heads of all related sector institutions at the regional level. They will collate and validate all relevant information on the status of all ongoing NESSAP/DESSAP programs and projects in the regions and submitted on monthly and quarterly basis to the EHSD/MLGRD.
89. Up to the medium term, emphasis would be placed on strengthening structures for effective M&E including mechanisms for MMDA- and sub-metropolitan districts, zonal, town and area councils community-level monitoring.
90. It is expected that monitoring and evaluation of the performance of facilities and services would be a permanent feature during the implementation of the NESSAP.
91. A strategic focus of the NESSAP RB-M&E will measure how the various segments of the “green economy” are responding to policy actions and affecting the total economy. For example, the growth in “green-collar” jobs as a proportion of the total employment levels in the country will be assessed periodically.
92. At the national level, the National Environmental Sanitation Conference (NESCON) will provide the platform for the dissemination of sector performance.
93. The section on requirements for improvements in services and infrastructure, discusses proposals for incremental options to be implemented over the periods 2010 – 2015, 2016 – 2020, 2021 – 2025. The first phase is formulated to achieve the immediate, short-term and some aspects of medium-term strategies of the NESSAP by 2015, the target year of the Millennium Development Goals (MDGs).
6 Value Chain Analysis (VCA) of SWM for example covers the functions of storage, collection, transport, treatment and disposal in order to identify opportunities for adding value at each stage. This is in line with the MINT philosophy.
National Environmental Sanitation Strategy and Action Plan (NESSAP) 2010 - 2015 xxi
Box ES1: Details of Enabling Elements and Levels of Service
- Capacity enhancement & management support - Environmental Sanitation Educations (Information, Education and Communication) - Enforcement Management (Legislation and regulation) - Sustainable financing and cost recovery - Research and development - Monitoring and Evaluation
Enabling Elements
Incremental Service Improvement Options (ISIOs) for -solid waste management - material recovery and disposal facilities (e.g. landfills) - excreta (liquid waste) management - stormwater and sullage conveyance - health-care facility waste
Levels of Service
94. A further strategic approach of the NESSAP is the grouping of the seven (7) focus areas under two main components, namely “enabling elements” and “levels of service”. These two categories broadly correspond to “software” and “hardware” measures and/or activities of the plan. This is shown in Box ES1.
95. The proposed requirements for improvements are also based on the three qualitative service-levels defined by the MLGRD/MEST. These qualitative levels of service are “minimum, comfortable, and amenity”7.
96. The above levels of service are detailed further to correspond to specific modes referred to as Incremental Service Improvement Options (ISIOs). The ISIOs present a basis for
gradual improvements across all components of environmental sanitation.
97. Resources to meet required improvements of the focus areas, determined using unit costs and/or expenditure functions. The total funding requirements for phase one is GH¢1,022,186,415. The details are presented in the Table ES1.
Table ES1: Summary Cost of implementing Improvements (Focus Areas)
Focus Area
TOTAL COSTS
(GH¢)
En
ab
lin
g E
lem
en
ts Capacity Development 138,406,620
Information, Education &
Communication 1,275,500
Legislation & Regulation 8,337,000
Financing and Cost Recovery 403,955
Research & Development 636,170
Monitoring & Evaluation 9,072,850
Levels of Service + Prg. Support 1,159,528,992
GRAND TOTAL 1,317,661,087
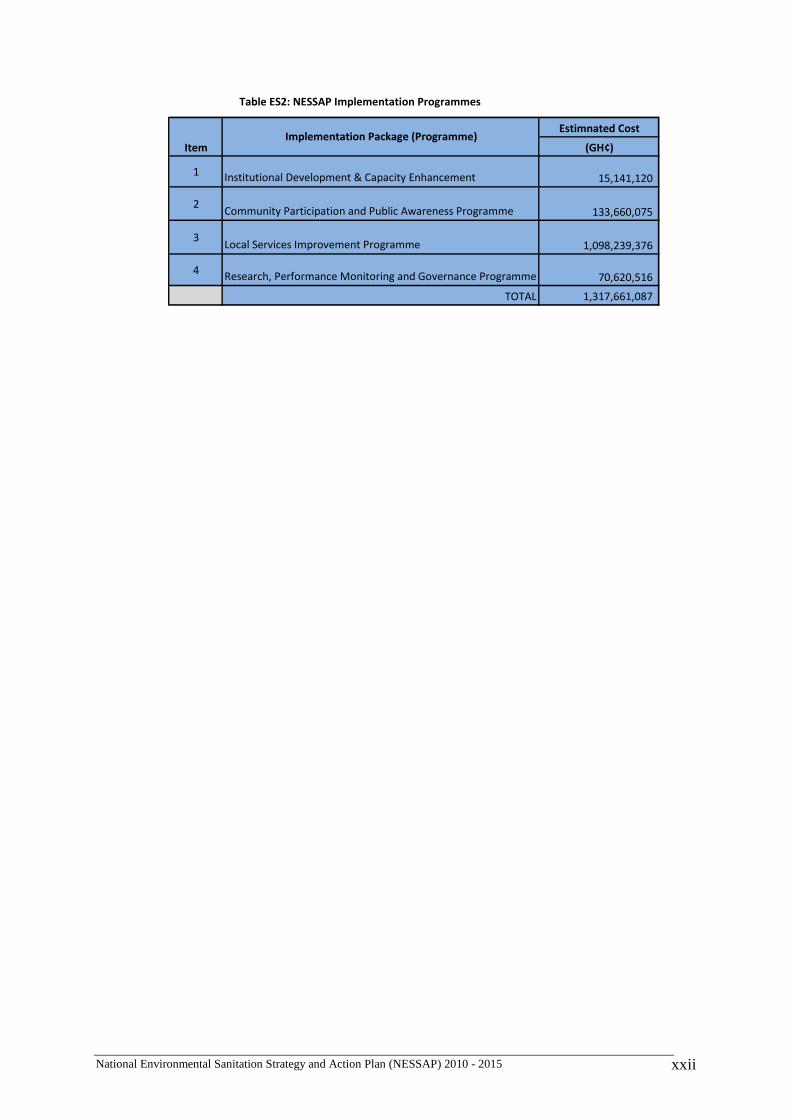
98. The final section presents the implementation packages, institutional arrangements for delivering the requirements of the NESSAP focus areas and the Results-Based Monitoring and Evaluation framework. The cost of the four (4) implementation packages over the first phase is shown in Table ES 2.
7 Qualitative description of “unacceptable, minimum, comfortable and amenity” levels of service is provided in Manual for the Preparation of District Waste Management Plans in Ghana. Best Practice Environmental Guidelines Series No.3. EPA/MES/MLGRD, July 2002.
National Environmental Sanitation Strategy and Action Plan (NESSAP) 2010 - 2015 xxii
Estimnated Cost
(GH¢)
1Institutional Development & Capacity Enhancement 15,141,120
2Community Participation and Public Awareness Programme 133,660,075
3Local Services Improvement Programme 1,098,239,376
4Research, Performance Monitoring and Governance Programme 70,620,516
TOTAL 1,317,661,087
ItemImplementation Package (Programme)
Table ES2: NESSAP Implementation Programmes
National Environmental Sanitation Strategy and Action Plan (NESSAP) 2010 - 2015 xxiii
1 Background and Introduction
National Environmental Sanitation Strategy and Action Plan (NESSAP) 2010 - 2015 - 1 -
1. Background and Introduction
99. Effective delivery of environmental sanitation services remains one of the major intractable challenges facing Metropolitan, Municipal and District Assemblies (MMDAs). The impact of poor environmental sanitation is immediate – unsightly littering, foul-smelling excreta-laden and choked gutters, stagnant pools of water and flooding during rains, vermin and rodents on mounds of refuse dumps, and the attendant prevalence of malaria, cholera, diarrhoea and typhoid in all communities.
100. The fact is that environmental sanitation services continue to take more than 35% of municipal budgets besides periodic support from the District Asemblies’ Common Fund8 (DACF), the Highly Indebted Poor Countries (HIPC) sources, and other specific-project interventions by Development Partners. The picture emerging is that the burden of managing environmental sanitation services (even at current poor levels) is hindering improvement and development of other services in communities, towns and cities.
101. Ghana is aspiring to reach middle-income status by 2020, with expected threefold increase in GDP from current levels of US$450 - 650. The enlarged Ghanaian economy and improved incomes will lead to increases in all types of waste streams and further deterioration of services if effective strategies and plans are not put in place.
102. Environmental sanitation is considered as a major component of the Human Resource pillar of the GPRSII (2006 - 2009) as well as the current Medium-Term Development Policy Framework (MTDPF, 2010 – 2013). The Expanded Development of Production Infrastructure pillar of the MTDPF prioritises environmental sanitation services as a key requirement for improving quality of life.
103. The Environmental Sanitation Policy (Revised, 2009) categorises environmental sanitation as part of essential services.
104. The Ministry of Local Government and Rural Development (MLGRD) introduced a number of measures for improving and sustaining services by Metropolitan, Municipal and District Assemblies (MMDAs). Among others, MMDAs were to improve revenue mobilization, increase the proportion of house-to-house (door-to-door) services for improving paid-for refuse collection and aggressively promote household latrines.
105. These measures would contribute to improving environmental sanitation services, however, considering the progress achieved by other sectors that have national programmes such as water and health, a very important element that was still missing is a nationally-owned strategy that provides coherent and effective strategies for implementing policy measures as well as harnessing the required resources.
106. The MLGRD/Environmental Health and Sanitation Directorate (EHSD) therefore led the development of a comprehensive National Environmental Sanitation Strategy and Action Plan (NESSAP) and a Strategic Environmental Sanitation Investment Plan (SESIP). These are expected to facilitate gradual reversal of the deficits in services through effective implementation by MMDAs and other stakeholders.
1.1 Framework for the NESSAP 107. The NESSAP was developed in phases through a highly participatory process. The
framework for the NESSAP evolved from reviews of relevant national and international
8 DACF is financed through not less than 5% (7.5% since January 2008) of the revenue resources of Ghana.
1
National Environmental Sanitation Strategy and Action Plan (NESSAP) 2010 - 2015 - 2 -
level processes as well as consultations with a wide range of stakeholders at district, regional and national levels.
108. An important outcome of the NESSAP formulation process is the adoption of Materials in Transition (MINT*) as a central philosophy which underlies the strategies and actions. MINT* is about engendering and changing perceptions on all types of wastes - both liquid and solid. The philosophy of MINT* is that waste is a material resource which is not discarded but value is added on at various stages in transition within the production and consumption cycle.
109. There is evidence that aesthetics – the appearance of a locality and the absence or presence of nuisance – influences behaviour that can add more to pollution and its impacts on health and costs. So also is the knowledge of the value-chains within wastes streams impact on our attitudes and how we regard discarded materials.
110. For example, biogas from excreta can serve as fuel and organic fractions which form the bulk of household solid waste can be converted to compost. Ultimately, even waste placed in a landfill is deemed to be in transition until it is mined at a future date for appropriate re-use, recycling or recovery.
111. MINTing also has the potential of creating ‘green collar’ jobs and reducing MMDAs cost of managing wastes. Value-chain analysis of the various waste streams reveals that there are numerous job opportunities within all the wastes management functions. These include value-pickers, buy-back centre operators, converters, urine collectors.
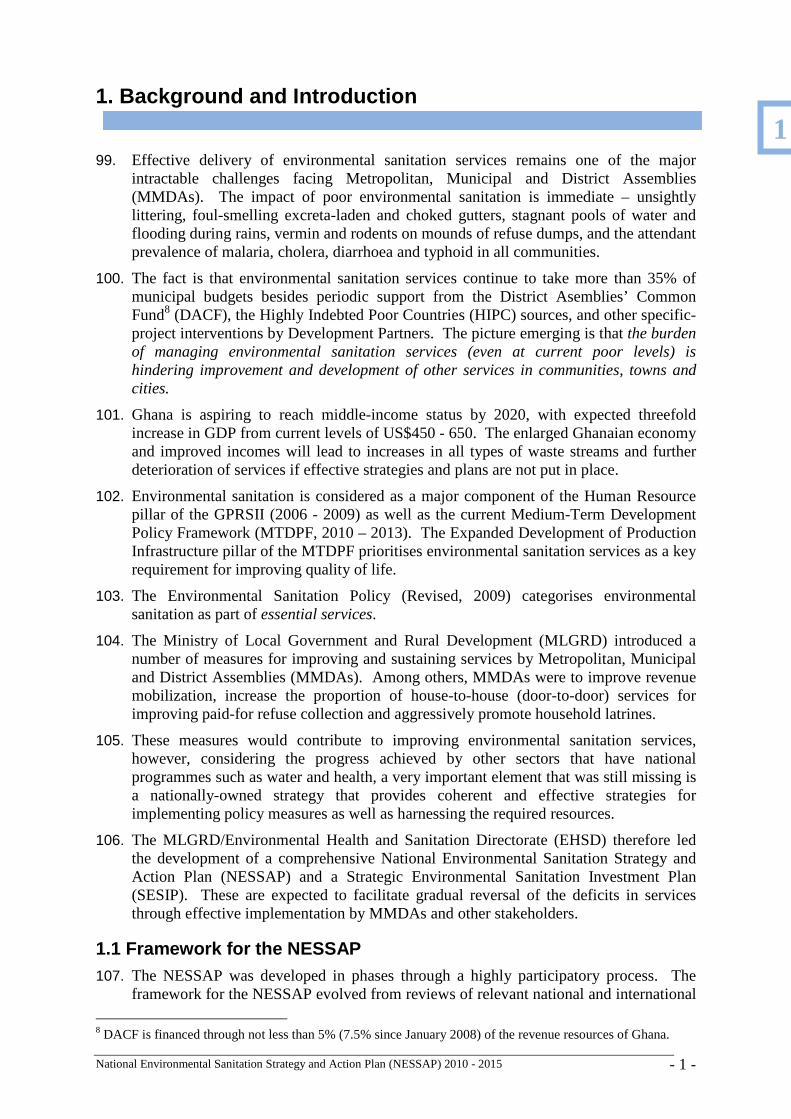
112. Figure 1.1 shows the main elements for improving environmental sanitation. Firstly, raising awareness for change in sanitation-behaviour and attitudes towards all wastes encompassing advocacy at the highest political levels, effectively implementing policies, and enhancing environmental sanitation education and enforcement management. Secondly, pursuing a phased programme for incremental improvements in all aspects of environmental sanitation services targeting the reduction of wastes for final disposal. Thirdly, ensuring effective coordination of, and collaboration among, sector stakeholders for country-wide adoption of policies, plans and programmes.
Advocacy, Education & Communication
Pol
icy
PoI
P
Enf
orce
men
t M
gt. O
n-go
ing,
pl
anne
d &
im
med
iate
pr
ojec
ts
National Strategy & Investment Plan
NE
SS
AP
SE
SIP
Join
t M
onito
ring
&
perf
orm
ance
re
view
s
Programme for harmonizing & aligning
procedures
Alig
nmen
t of
reso
urce
flow
s
Par
tner
ship
ar
rang
emen
ts
with
DP
s
Inst
itutio
nal S
tren
gthe
ning
&
Pro
gram
me
Mgt
. Sup
port
(in
cl. N
ES
PoC
C)
Awareness raising for behavioural change
Strategic interventions
Effective coordination, collaboration and
partnership building
A B C
Figure 1: FRAMEWORK FOR ENVIRONMENTAL SANITATION DEVELOPMENT IN GHANA
1
National Environmental Sanitation Strategy and Action Plan (NESSAP) 2010 - 2015 - 3 -
113. The preparation of the NESSAP commenced in September 2007 with Key Person Interviews (KPIs) and Focus Group Discussions (FGDs) amongst key sector stakeholders and deliberations at the level of the National Environmental Sanitation Policy Coordination Council (NESPoCC) to formalise the approach.
114. In accordance with Ghana’s decentralised system of governance and implementation management, national policies take effect at district level. Therefore, strategies, plans, programmes and projects to meet policy objectives are based on and derived from the aspirations of district level actors. To meet this basic principle a Handbook for preparing District Environmental Sanitation Strategy and Action Plan (DESSAP) was produced.
115. The DESSAPs prepared by MMDAs, with facilitation and coordination by regional-level institutions, provide the scale of the needed improvements in infrastructure and services of all districts of Ghana. The NESSAP is therefore a dynamic document and will be updated as more data and information is gathered and the levels of services improve in line with the objectives and measures of the Revised Environmental Sanitation Policy (2009).
116. The National Environmental Sanitation Strategy and Action Plan (NESSAP) - Materials in Transition (MINT*), translates the measures derived from the objectives of the ESP (Revised, 2009) into strategies and planned activities. The NESSAP thus provides the basis for the systematic implementation of interventions for improving environmental sanitation infrastructure and services in Ghana following laid down planning processes.
1.2 The Revised Environmental Sanitation Policy (2009) 117. The Environmental Sanitation Policy (Revised, 2009) responds to the various reviews
carried out to assess how effectively the previous policy published in 1999 has been implemented. The revised policy objectives and measures are presented in a way that enhances strategic planning and subsequent implementation.
118. The broad principles underlying Ghana’s Environmental Sanitation Policy (Revised, 2009) are: • The principle of environmental sanitation services as a public good; • The principle of environmental sanitation services as an economic good; • The polluter-pays-principle; • The principle of cost recovery to ensure value-for-money ensuring economy,
effectiveness and efficiency; • The principle of subsidiarity in order to ensure participatory decision-making at the
lowest appropriate level in society; • The principle of improving equity and gender sensitivity; • The principle of recognizing indigenous knowledge, diversity of religious and cultural
practices; • The precautionary principle that seeks to minimize activities that have the potential to
negatively affect the integrity of all environmental resources; • The principle of community participation and social intermediation
119. The ESP defines the principal components of environmental sanitation to include; (f) Collection and sanitary disposal of wastes, including solid wastes, liquid wastes, excreta,
industrial wastes, health-care and other hazardous wastes; (g) Storm-water drainage;
1
National Environmental Sanitation Strategy and Action Plan (NESSAP) 2010 - 2015 - 4 -
(h) Cleansing of thoroughfares, markets and other public spaces; (i) Control of pests and vectors of disease; (j) Food hygiene; (k) Environmental sanitation education; (l) Inspection and enforcement of sanitary regulations; (m) Disposal of the dead; (n) Control of rearing and straying of animals; (o) Monitoring the observance of environmental standards
1.2.1 Policy Focus Areas 120. In order to provide a clear basis for achieving the overall goal of the sector, the policy
provides strategic elements under seven (7) policy focus areas, as follows: - Capacity Development - Information, Education and Communication - Legislation and Regulation - Levels of Service - Sustainable Financing and Cost Recovery - Research and Development
- Monitoring and Evaluation
121. The various strategies and action plans of the NESSAP are derived from the objectives and measures under the above focal areas. These are presented in detail in Chapter 4 of this document.
1.3 Structure of the National Environmental Sanitation Str ategy and Action Plan (NESSAP) 122. The contents of the NESSAP are arranged in a manner that gives readers a gradual
introduction of the key challenges and issues of the environmental sanitation sector, followed by the strategies and plans required for addressing policy objectives and actions.
123. The background and introduction gives a brief overview of the existing situation and efforts made, so far, and the need for the NESSAP. The background also gives the processes followed in developing the NESSAP and how it is derived from, and based on the ESP (Revised, 2009). The main principles and focus areas of the policy are presented.
124. The second chapter provides a summary of geographical information about Ghana, socio-economic data and key environmental issues and how these relate to environmental sanitation. The main sector Ministries, Department and Agencies (MDAs) are provided, as well as how they relate to MMDAs, especially the issue of decentralized departments and how they fit in the operationalised Local Government Service.
125. Chapter 3 presents the state of environmental sanitation services in Ghana. It treats all the key components of environmental sanitation defined in the ESP (Revised, 2009): solid waste, excreta (faecal liquid waste), stormwater drainage and sullage conveyance, environmental sanitation education and enforcement management, health-care and special industrial wastes.
126. The information provided is based mainly on data from the 2000 Population and Housing Census and updates from other documents such as the Multiple Indicator Cluster Survey (MICS, 2006), Annual Performance Reviews (APRs) of the GPRSII,
1
National Environmental Sanitation Strategy and Action Plan (NESSAP) 2010 - 2015 - 5 -
Ghana Demographic and Health Survey (2008) and baseline data gathered by districts, in 2008/2009, as part of the preparation of DESSAPs.
127. The chapter concludes with discussions of environment and health impacts, gender, poverty and governance issues and how they are influenced by improving environmental sanitation services, and importantly, the financial administration framework and how these affect MMDAs and funding allocations to the sector.
128. Chapter 4 deals with the main national-level strategies including those on institutional restructuring that affect capacity development, identified as the main challenge facing the sector.
129. The core strategies and action plans proposed for meeting the objectives under the main focus areas of the ESP (Revised 2009) are provided in this chapter. This section in essence outlines the Policy Implementation Plan (PoIP) based on national perspectives.
130. The fourth chapter ends with a discussion on the link between the NESSAP and DESSAPs prepared by MMDAs. It is expected that as MMDAs implement their DESSAPs, changing conditions on the ground will inform national strategies and targets which will be amended during periodic planning cycles.
131. Chapter 5 of the NESSAP presents the requirements for improving environmental sanitation based on the measures and strategies of the previous chapter.
132. In order not to lose the important aspects of institutional capacity building and other factors that enhance delivery of services, a further categorisation of the focus areas and components into “enabling elements” and “levels of service” is presented in this chapter – these correspond to “software” and “hardware” measures respectively.
133. The fifth chapter also covers the options for the above categories and introduces the model for translating policy objectives to measures and then to implementation packages. The concept of Incremental Service Improvement Options (ISIOs) is also introduced. The chapter ends with initial costing of the various activities emanating from the measures, the corresponding strategies and ISIOs.
134. Chapter 6 presents the implementation programmes of the NESSAP. It covers packages for “enabling elements” and “levels of service” and corresponding time-lines.
135. The sixth and concluding chapter also discusses institutional arrangements for implementing the NESSAP based on relevant regulations (e.g. Local Government Act, 1993 (Act 462). The chapter concludes with the presentation of Result-based Monitoring and Evaluation (R-B M&E) indicators of the key activities under the focus areas of the NESSAP.
136. The Annexes to the NESSAP provide further information including the key consultations held and additional background information.
1
National Environmental Sanitation Strategy and Action Plan (NESSAP) 2010 - 2015 - 6 -
2 National Profile
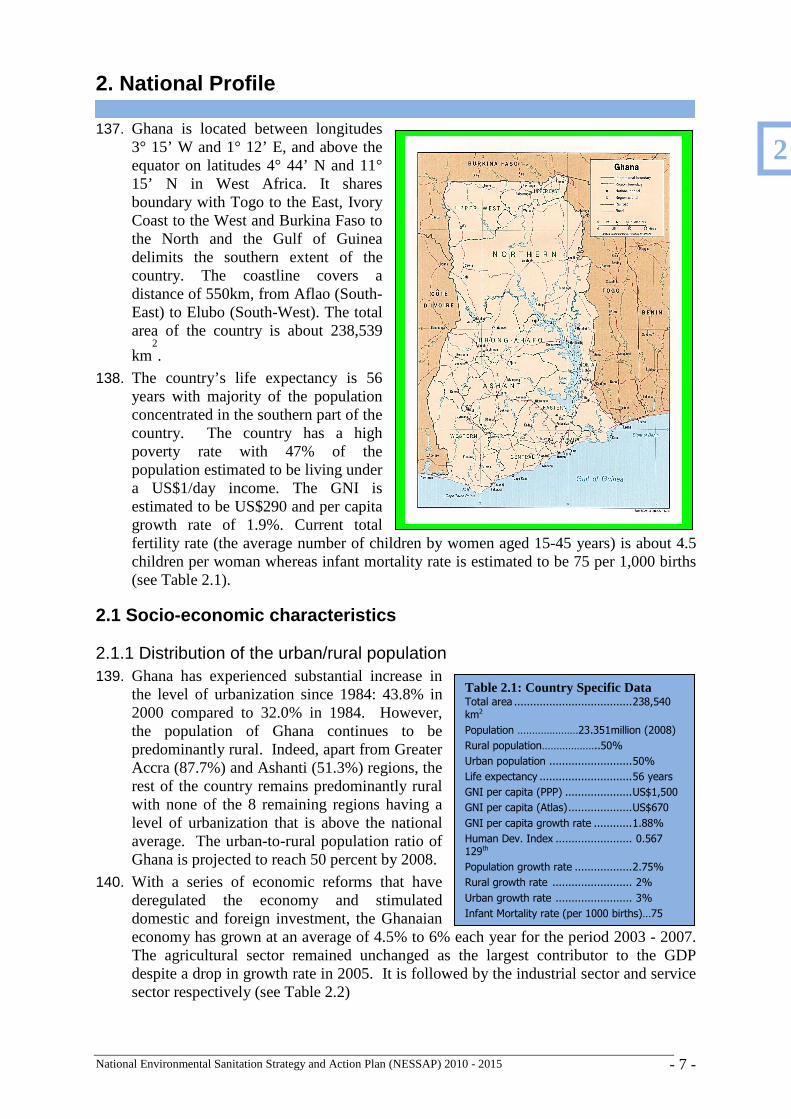
National Environmental Sanitation Strategy and Action Plan (NESSAP) 2010 - 2015 - 7 -
2. National Profile
137. Ghana is located between longitudes 3° 15’ W and 1° 12’ E, and above the equator on latitudes 4° 44’ N and 11° 15’ N in West Africa. It shares boundary with Togo to the East, Ivory Coast to the West and Burkina Faso to the North and the Gulf of Guinea delimits the southern extent of the country. The coastline covers a distance of 550km, from Aflao (South-East) to Elubo (South-West). The total area of the country is about 238,539
km2.
138. The country’s life expectancy is 56 years with majority of the population concentrated in the southern part of the country. The country has a high poverty rate with 47% of the population estimated to be living under a US$1/day income. The GNI is estimated to be US$290 and per capita growth rate of 1.9%. Current total fertility rate (the average number of children by women aged 15-45 years) is about 4.5 children per woman whereas infant mortality rate is estimated to be 75 per 1,000 births (see Table 2.1).
2.1 Socio-economic characteristics
2.1.1 Distribution of the urban/rural population 139. Ghana has experienced substantial increase in
the level of urbanization since 1984: 43.8% in 2000 compared to 32.0% in 1984. However, the population of Ghana continues to be predominantly rural. Indeed, apart from Greater Accra (87.7%) and Ashanti (51.3%) regions, the rest of the country remains predominantly rural with none of the 8 remaining regions having a level of urbanization that is above the national average. The urban-to-rural population ratio of Ghana is projected to reach 50 percent by 2008.
140. With a series of economic reforms that have deregulated the economy and stimulated domestic and foreign investment, the Ghanaian economy has grown at an average of 4.5% to 6% each year for the period 2003 - 2007. The agricultural sector remained unchanged as the largest contributor to the GDP despite a drop in growth rate in 2005. It is followed by the industrial sector and service sector respectively (see Table 2.2)
Table 2.1: Country Specific Data Total area ..................................... 238,540 km2
Population …………………23.351million (2008)
Rural population………………..50%
Urban population .......................... 50%
Life expectancy ............................. 56 years
GNI per capita (PPP) ..................... US$1,500
GNI per capita (Atlas) .................... US$670
GNI per capita growth rate ............ 1.88%
Human Dev. Index ........................ 0.567 129th
Population growth rate .................. 2.75%
Rural growth rate ......................... 2%
Urban growth rate ........................ 3%
Infant Mortality rate (per 1000 births)…75
2
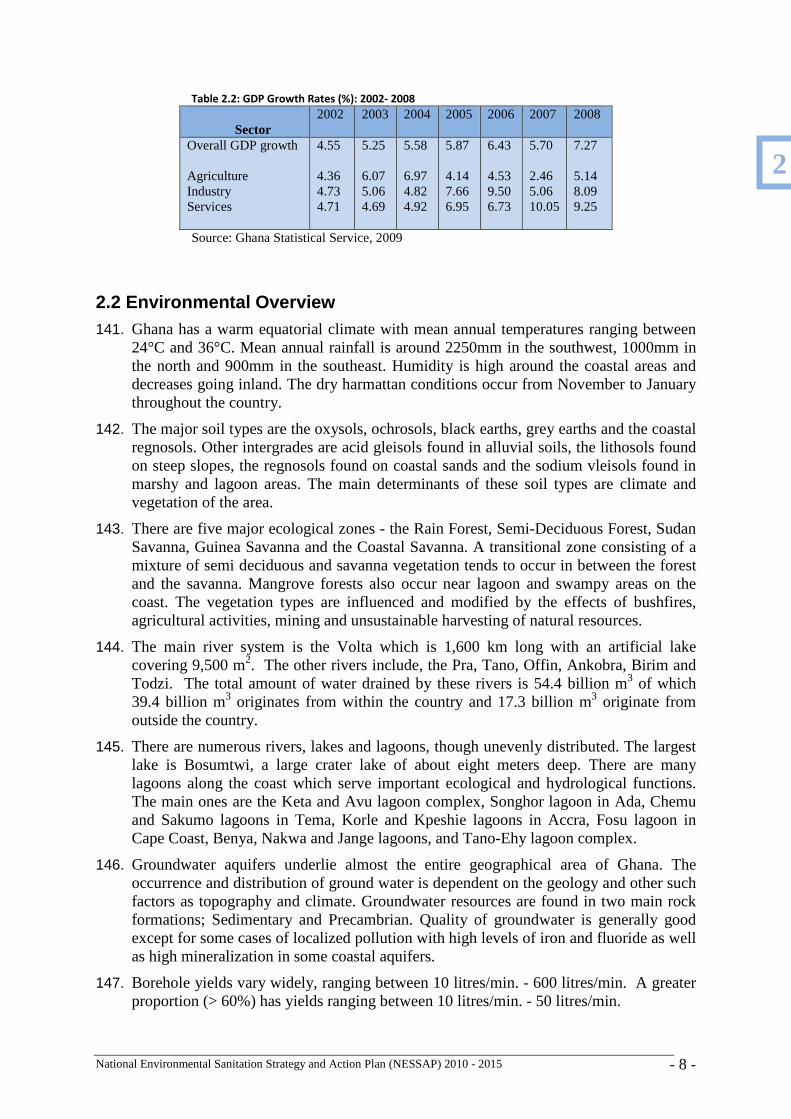
National Environmental Sanitation Strategy and Action Plan (NESSAP) 2010 - 2015 - 8 -
Table 2.2: GDP Growth Rates (%): 2002- 2008
Sector
2002 2003 2004 2005 2006 2007 2008
Overall GDP growth Agriculture Industry Services
4.55 4.36 4.73 4.71
5.25 6.07 5.06 4.69
5.58 6.97 4.82 4.92
5.87 4.14 7.66 6.95
6.43 4.53 9.50 6.73
5.70 2.46 5.06 10.05
7.27 5.14 8.09 9.25
Source: Ghana Statistical Service, 2009
2.2 Environmental Overview 141. Ghana has a warm equatorial climate with mean annual temperatures ranging between
24°C and 36°C. Mean annual rainfall is around 2250mm in the southwest, 1000mm in the north and 900mm in the southeast. Humidity is high around the coastal areas and decreases going inland. The dry harmattan conditions occur from November to January throughout the country.
142. The major soil types are the oxysols, ochrosols, black earths, grey earths and the coastal regnosols. Other intergrades are acid gleisols found in alluvial soils, the lithosols found on steep slopes, the regnosols found on coastal sands and the sodium vleisols found in marshy and lagoon areas. The main determinants of these soil types are climate and vegetation of the area.
143. There are five major ecological zones - the Rain Forest, Semi-Deciduous Forest, Sudan Savanna, Guinea Savanna and the Coastal Savanna. A transitional zone consisting of a mixture of semi deciduous and savanna vegetation tends to occur in between the forest and the savanna. Mangrove forests also occur near lagoon and swampy areas on the coast. The vegetation types are influenced and modified by the effects of bushfires, agricultural activities, mining and unsustainable harvesting of natural resources.
144. The main river system is the Volta which is 1,600 km long with an artificial lake covering 9,500 m2. The other rivers include, the Pra, Tano, Offin, Ankobra, Birim and Todzi. The total amount of water drained by these rivers is 54.4 billion m3 of which 39.4 billion m3 originates from within the country and 17.3 billion m3 originate from outside the country.
145. There are numerous rivers, lakes and lagoons, though unevenly distributed. The largest lake is Bosumtwi, a large crater lake of about eight meters deep. There are many lagoons along the coast which serve important ecological and hydrological functions. The main ones are the Keta and Avu lagoon complex, Songhor lagoon in Ada, Chemu and Sakumo lagoons in Tema, Korle and Kpeshie lagoons in Accra, Fosu lagoon in Cape Coast, Benya, Nakwa and Jange lagoons, and Tano-Ehy lagoon complex.
146. Groundwater aquifers underlie almost the entire geographical area of Ghana. The occurrence and distribution of ground water is dependent on the geology and other such factors as topography and climate. Groundwater resources are found in two main rock formations; Sedimentary and Precambrian. Quality of groundwater is generally good except for some cases of localized pollution with high levels of iron and fluoride as well as high mineralization in some coastal aquifers.
147. Borehole yields vary widely, ranging between 10 litres/min. - 600 litres/min. A greater proportion (> 60%) has yields ranging between 10 litres/min. - 50 litres/min.
2
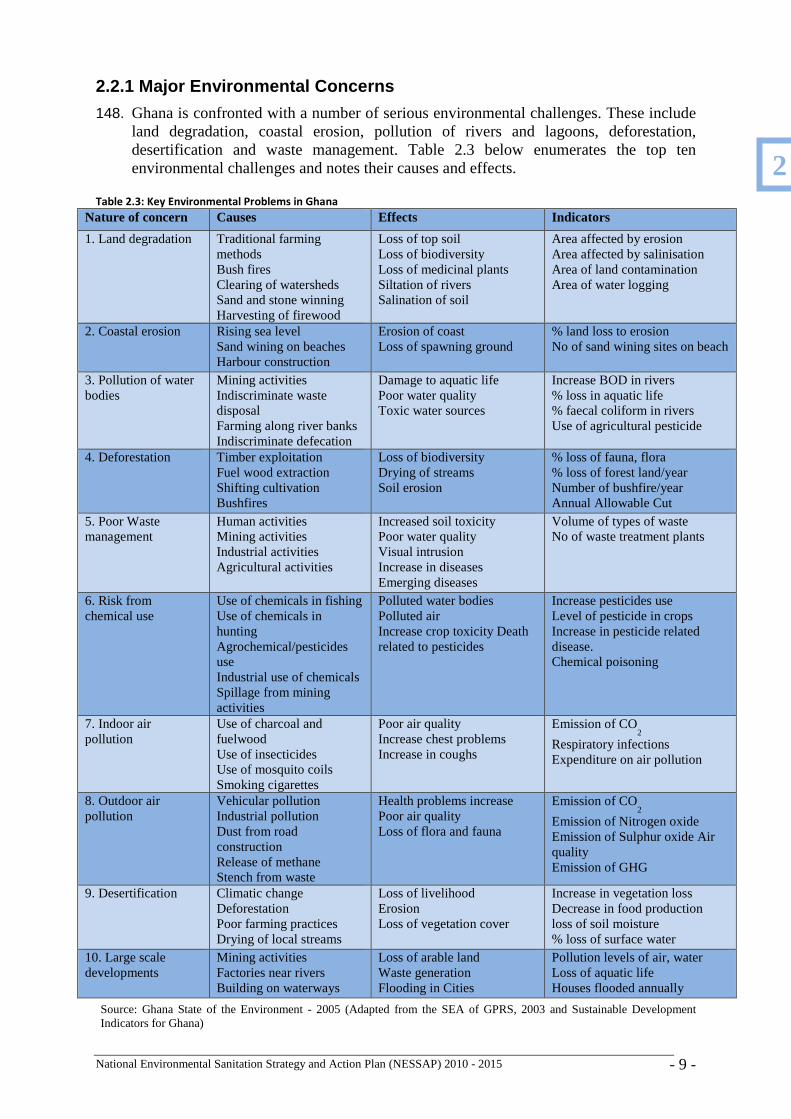
National Environmental Sanitation Strategy and Action Plan (NESSAP) 2010 - 2015 - 9 -
2.2.1 Major Environmental Concerns
148. Ghana is confronted with a number of serious environmental challenges. These include land degradation, coastal erosion, pollution of rivers and lagoons, deforestation, desertification and waste management. Table 2.3 below enumerates the top ten environmental challenges and notes their causes and effects.
Table 2.3: Key Environmental Problems in Ghana
Nature of concern Causes Effects Indicators
1. Land degradation Traditional farming methods Bush fires Clearing of watersheds Sand and stone winning Harvesting of firewood
Loss of top soil Loss of biodiversity Loss of medicinal plants Siltation of rivers Salination of soil
Area affected by erosion Area affected by salinisation Area of land contamination Area of water logging
2. Coastal erosion Rising sea level Sand wining on beaches Harbour construction
Erosion of coast Loss of spawning ground
% land loss to erosion No of sand wining sites on beach
3. Pollution of water bodies
Mining activities Indiscriminate waste disposal Farming along river banks Indiscriminate defecation
Damage to aquatic life Poor water quality Toxic water sources
Increase BOD in rivers % loss in aquatic life % faecal coliform in rivers Use of agricultural pesticide
4. Deforestation Timber exploitation Fuel wood extraction Shifting cultivation Bushfires
Loss of biodiversity Drying of streams Soil erosion
% loss of fauna, flora % loss of forest land/year Number of bushfire/year Annual Allowable Cut
5. Poor Waste management
Human activities Mining activities Industrial activities Agricultural activities
Increased soil toxicity Poor water quality Visual intrusion Increase in diseases Emerging diseases
Volume of types of waste No of waste treatment plants
6. Risk from chemical use
Use of chemicals in fishing Use of chemicals in hunting Agrochemical/pesticides use Industrial use of chemicals Spillage from mining activities
Polluted water bodies Polluted air Increase crop toxicity Death related to pesticides
Increase pesticides use Level of pesticide in crops Increase in pesticide related disease. Chemical poisoning
7. Indoor air pollution
Use of charcoal and fuelwood Use of insecticides Use of mosquito coils Smoking cigarettes
Poor air quality Increase chest problems Increase in coughs
Emission of CO2
Respiratory infections Expenditure on air pollution
8. Outdoor air pollution
Vehicular pollution Industrial pollution Dust from road construction Release of methane Stench from waste
Health problems increase Poor air quality Loss of flora and fauna
Emission of CO2
Emission of Nitrogen oxide Emission of Sulphur oxide Air quality Emission of GHG
9. Desertification Climatic change Deforestation Poor farming practices Drying of local streams
Loss of livelihood Erosion Loss of vegetation cover
Increase in vegetation loss Decrease in food production loss of soil moisture % loss of surface water
10. Large scale developments
Mining activities Factories near rivers Building on waterways
Loss of arable land Waste generation Flooding in Cities
Pollution levels of air, water Loss of aquatic life Houses flooded annually
Source: Ghana State of the Environment - 2005 (Adapted from the SEA of GPRS, 2003 and Sustainable Development Indicators for Ghana)
2
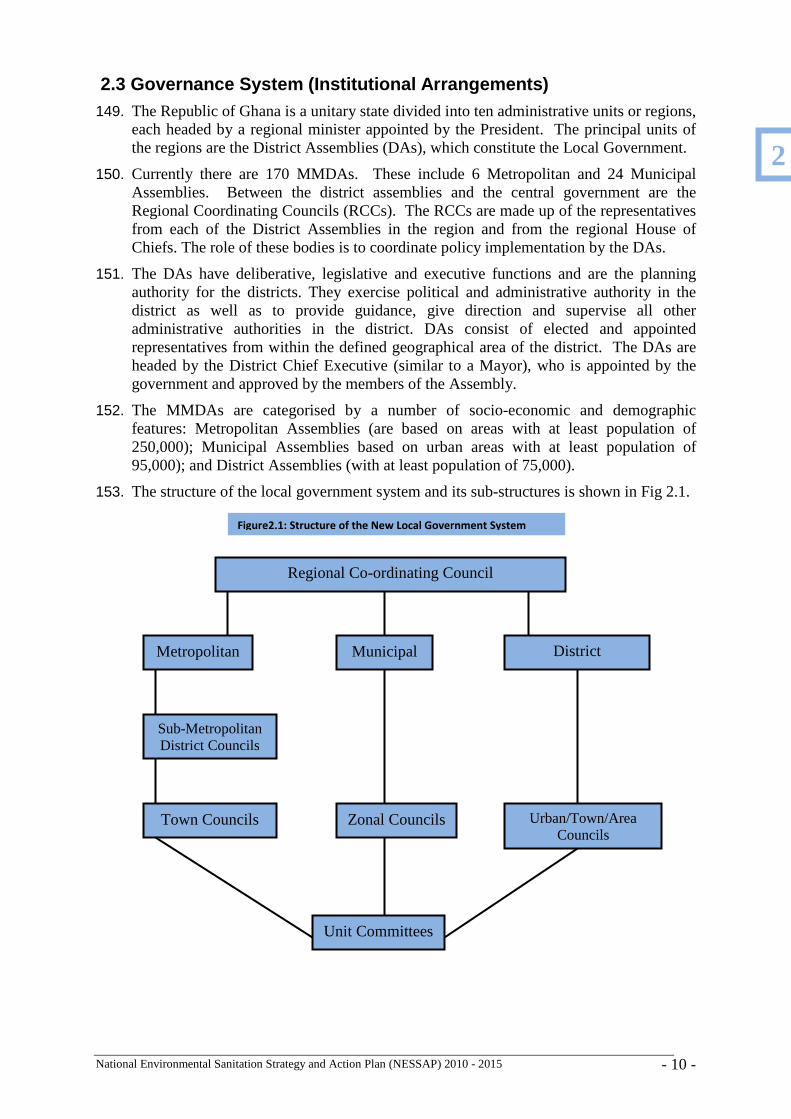
National Environmental Sanitation Strategy and Action Plan (NESSAP) 2010 - 2015 - 10 -
2.3 Governance System (Institutional Arrangements) 149. The Republic of Ghana is a unitary state divided into ten administrative units or regions,
each headed by a regional minister appointed by the President. The principal units of the regions are the District Assemblies (DAs), which constitute the Local Government.
150. Currently there are 170 MMDAs. These include 6 Metropolitan and 24 Municipal Assemblies. Between the district assemblies and the central government are the Regional Coordinating Councils (RCCs). The RCCs are made up of the representatives from each of the District Assemblies in the region and from the regional House of Chiefs. The role of these bodies is to coordinate policy implementation by the DAs.
151. The DAs have deliberative, legislative and executive functions and are the planning authority for the districts. They exercise political and administrative authority in the district as well as to provide guidance, give direction and supervise all other administrative authorities in the district. DAs consist of elected and appointed representatives from within the defined geographical area of the district. The DAs are headed by the District Chief Executive (similar to a Mayor), who is appointed by the government and approved by the members of the Assembly.
152. The MMDAs are categorised by a number of socio-economic and demographic features: Metropolitan Assemblies (are based on areas with at least population of 250,000); Municipal Assemblies based on urban areas with at least population of 95,000); and District Assemblies (with at least population of 75,000).
153. The structure of the local government system and its sub-structures is shown in Fig 2.1.
Regional Co-ordinating Council
Municipal Metropolitan District Assemblies
Sub-Metropolitan District Councils
Town Councils Zonal Councils Urban/Town/Area Councils
Unit Committees
Figure2.1: Structure of the New Local Government System
2
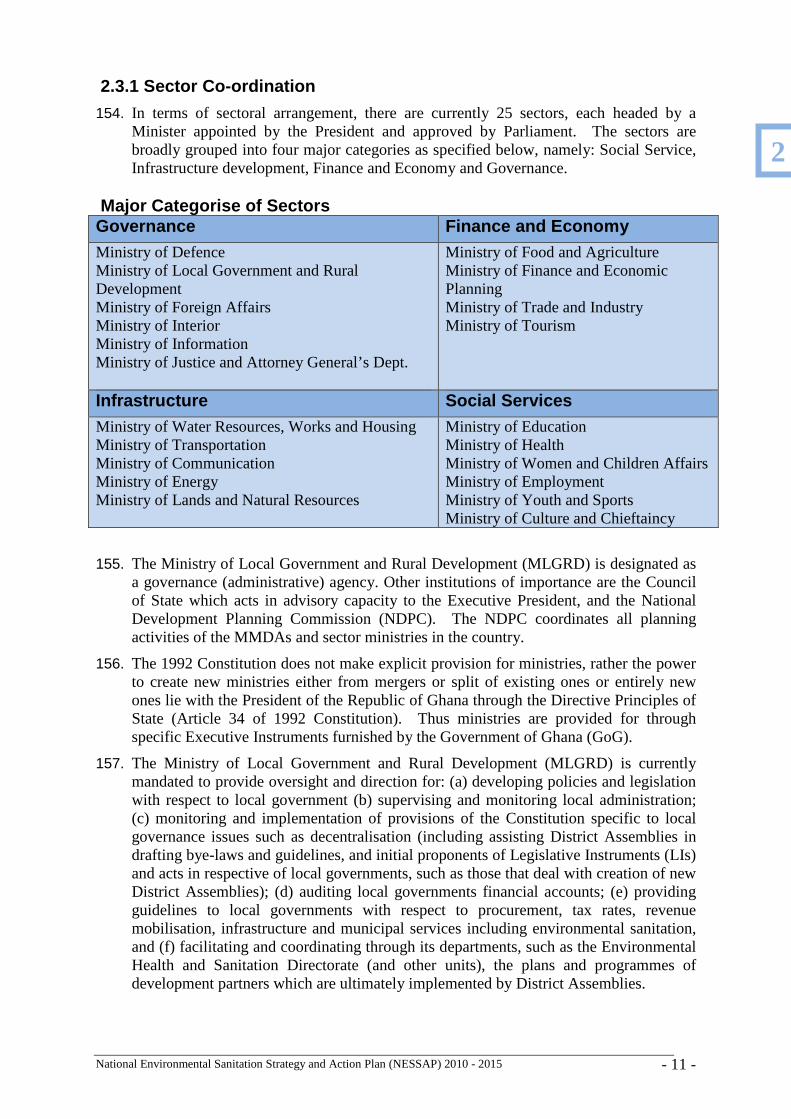
National Environmental Sanitation Strategy and Action Plan (NESSAP) 2010 - 2015 - 11 -
2.3.1 Sector Co-ordination
154. In terms of sectoral arrangement, there are currently 25 sectors, each headed by a Minister appointed by the President and approved by Parliament. The sectors are broadly grouped into four major categories as specified below, namely: Social Service, Infrastructure development, Finance and Economy and Governance.
Major Categorise of Sectors
Governance Finance and Economy Ministry of Defence Ministry of Local Government and Rural Development Ministry of Foreign Affairs Ministry of Interior Ministry of Information Ministry of Justice and Attorney General’s Dept.
Ministry of Food and Agriculture Ministry of Finance and Economic Planning Ministry of Trade and Industry Ministry of Tourism
Infrastructure Social Services Ministry of Water Resources, Works and Housing Ministry of Transportation Ministry of Communication Ministry of Energy Ministry of Lands and Natural Resources
Ministry of Education Ministry of Health Ministry of Women and Children Affairs Ministry of Employment Ministry of Youth and Sports Ministry of Culture and Chieftaincy
155. The Ministry of Local Government and Rural Development (MLGRD) is designated as a governance (administrative) agency. Other institutions of importance are the Council of State which acts in advisory capacity to the Executive President, and the National Development Planning Commission (NDPC). The NDPC coordinates all planning activities of the MMDAs and sector ministries in the country.
156. The 1992 Constitution does not make explicit provision for ministries, rather the power to create new ministries either from mergers or split of existing ones or entirely new ones lie with the President of the Republic of Ghana through the Directive Principles of State (Article 34 of 1992 Constitution). Thus ministries are provided for through specific Executive Instruments furnished by the Government of Ghana (GoG).
157. The Ministry of Local Government and Rural Development (MLGRD) is currently mandated to provide oversight and direction for: (a) developing policies and legislation with respect to local government (b) supervising and monitoring local administration; (c) monitoring and implementation of provisions of the Constitution specific to local governance issues such as decentralisation (including assisting District Assemblies in drafting bye-laws and guidelines, and initial proponents of Legislative Instruments (LIs) and acts in respective of local governments, such as those that deal with creation of new District Assemblies); (d) auditing local governments financial accounts; (e) providing guidelines to local governments with respect to procurement, tax rates, revenue mobilisation, infrastructure and municipal services including environmental sanitation, and (f) facilitating and coordinating through its departments, such as the Environmental Health and Sanitation Directorate (and other units), the plans and programmes of development partners which are ultimately implemented by District Assemblies.
2
National Environmental Sanitation Strategy and Action Plan (NESSAP) 2010 - 2015 - 12 -
2.3.2 Key Sector Institutions and Agencies
158. The Environmental Health and Sanitation Directorate (EHSD), under the Ministry of Local Government and Rural Development (MLGRD) was elevated from the position of a unit to a directorate in 2006 to provide a “more visible home for environmental sanitation” and also give the directorate “space” at high-level management meetings of the ministry.
159. The EHSD provides sector coordination and facilitation of MMDAs in implementing national-level and other ministries’ programmes on environmental sanitation such as the Waste Management and Sanitation Module of the National Youth Employment Programme (NYEP) managed by the Ministry of Employment and Social Welfare.
160. At the Regional level, 10 REHSDs provide facilitation support to Environmental Health and Management Departments (EHMDs, provided for by policy) at district level.
161. The Environmental Protection Agency (EPA) Act, 1994 (Act 490) established the EPA which is mandated to provide environmental standards and compliance management. EPA as a regulating agency has 10 Regional Offices. Two District offices have been established to respond to the specific needs for regulating the potential impacts of intense mining around Tarkwa area and industrial activities in the Port-City of Tema.
162. The Ministry of Health (MoH) and the Ghana Health Service are responsible for the management of health services in the country and providing health data, supporting health education activities, and contributing to regulation and standard-setting for health services. The health sector relies on environmental sanitation data and information to contribute to disease prevention and control.
163. The Ministry of Education and tertiary education institutions are responsible for hygiene education. The School Health Education Programme (SHEP) supports nation-wide education and provides Training and Learning Materials.
164. The Ministry of Water Resources, Works and Housing (MWRWH) is the principal water sector ministry responsible for overall water policy formulation, planning, coordination, collaboration, monitoring and evaluation of programmes for water supply.
165. The Water Directorate is the focal point for coordination of the water sector, while a newly created Housing Directorate is the focal point for housing.
166. The Ministry of Women and Children (MOWAC) is the lead agency responsible for implementing the National Gender and Children’s policy. Policy issues on environmental sanitation that affect the wellbeing of women and children is within the mandate of MOWAC.
167. The Town and Country Planning Department (TCPD) is responsible for all land-use planning in the country. It supports MMDAs in physical planning of towns and provides layouts of towns for the development of services like roads, drainage and sewerage networks, disposal sites and water supply distribution lines.
168. The Ghana Statistical Services (GSS) is the statutory institution responsible for demographic data and official government statistics. GSS provides coverage data on environmental sanitation services.
169. The Hydrological Services Department (HSD) is responsible for managing information on hydrology as well as planning and design of primary drains throughout the country.
170. The Community Water and Sanitation Agency (CWSA) of the MWRWH is the lead facilitator of the water supply in rural communities and small towns, and plays important roles in sanitation and hygiene promotion in rural areas. The key functions of
2
National Environmental Sanitation Strategy and Action Plan (NESSAP) 2010 - 2015 - 13 -
CWSA are set out in the Community Water and Sanitation Agency (CWSA) Act, 1998 (Act 564).
171. The Ghana Water Company Limited (GWCL) is the assets owner and responsible for the provision of water services in 82 urban water systems across the country.
172. The Department of Urban Roads (DUR) is responsible for the construction and maintenance of roads and related infrastructure. The maintenance management of road-side drains is an important aspect of environmental sanitation that is facilitated by the unit.
173. The Department of Feeder Roads (DFR) of the Ministry of Transport is responsible for feeder roads in rural areas and the related infrastructure such as road-side earth and stone-pitch drains for protecting road embankments.
2.3.2 Legal and Regulatory Framework for Local Gove rnance 174. The country is governed by a constitution approved by a referendum in 1992, the fourth
in the attempt at constitutional rule in the country. It provides for a three tier system of governance: The Executive, the Legislature and the Judiciary acting independently and inter-dependently of each other.
175. The Constitution provides for an Executive President who has a maximum of two four-year terms, an elected Legislature (Parliament) representing the total number of constituencies in Ghana.
176. Chapter Six of the Constitution “The Directive Principles of State Policy” provides the broad framework and guidance for all decisions regarding application of the constitution itself and actions of all citizens, Parliament, the President, the Judiciary, the Council of State, the Cabinet, political parties and other bodies.
177. The provision of environmental sanitation infrastructure and services affect a number of line ministries, departments and agencies. While the Local Government Act, 1993 (Act 462) and Local Government Service Act, 2003 (Act 656) seek to effectively transfer the functions and offices of central ministries, departments and agencies to the Assemblies, this has not happened and many still exist and function as central government dependencies.
178. The important issues of career development and progression not very clearly defined for technical staff in local government make many of such staff still identify themselves with central agencies. Furthermore, many agencies continue to provide facilitation and implementation support to MMDAs. The position and functions of the 10 Regional Coordinating Councils (RCCs) compound issues the more.
179. MMDAs still depend on national- and regional-level departments and agencies for facilitation and implementation support. However, the working boundaries and zones of these institutions are in many cases not aligned to those of MMDAs. This adds to the challenges of effective coordination at the district level. Figure 2.2 gives a picture of how multi-agency facilitation is required and carried out for the delivery of certain aspects of environmental sanitation services.
180. For purposes of planning, the decentralized planning system as outlined in the National Development Planning Systems Act 1994 (Act 480), comprises the District Planning Authority at the district-level, Regional Coordinating Council at the regional level, sector Ministries, Departments and Agencies (MDAs) and the National Development Planning Commission (NDPC) at the national level.
181. The NDPC regulates the preparation of Medium-Term Development Plans (MTDPs) by issuing out guidelines to planning authorities (MDAs, RCCs and MMDAs). These
2
National Environmental Sanitation Strategy and Action Plan (NESSAP) 2010 - 2015 - 14 -
guidelines typically, define areas of national policy, priorities and strategies for the medium term (mainly derived from the current national development agenda); provides the framework for deriving sector, regional and district goals, objectives, priorities and strategies; defines the scope and format of the district plans to enhance regional harmonization.
182. As prescribed the District Planning process provides a “bottom-up” complement to broad national-level policy objectives and strategies that reflect aspirations of communities, towns and districts. This process is being followed for the preparation of DESSAPs by MMDAs at district level and the NESSAP at the national-level.
2.3.3 The Local Government Service
183. The Local Government Service was formally inaugurated in November 2007. It is expected that with the operationalisation of the Local Government Service Act, 2003 (Act 656) key issues and challenges that have stalled decentralisation will be overcome.
184. Act 656 separates the Local Government Service (LGS) representing decentralised institutions and/or agencies (responsible for policy/plans/programmes development and implementation) from the Civil Service (representing central policy/planning agencies).
185. While Act 656 presents an opportunity for making progress towards decentralisation, it does not fully resolve issues of fiscal decentralisation. Indeed all key expenditure items of the LGS (e.g. salaries) shall be a charge on the Consolidated Fund9. This has implications for previous efforts at fixing establishment ceilings for MMDAs with the intent that these entities will eventually be able to employ their own key staff and provide MMDCEs with the right incentives to “hire and fire” staff.
9 Part II, Section 28, Local Government Service Act, 2003 (Act 656)
2
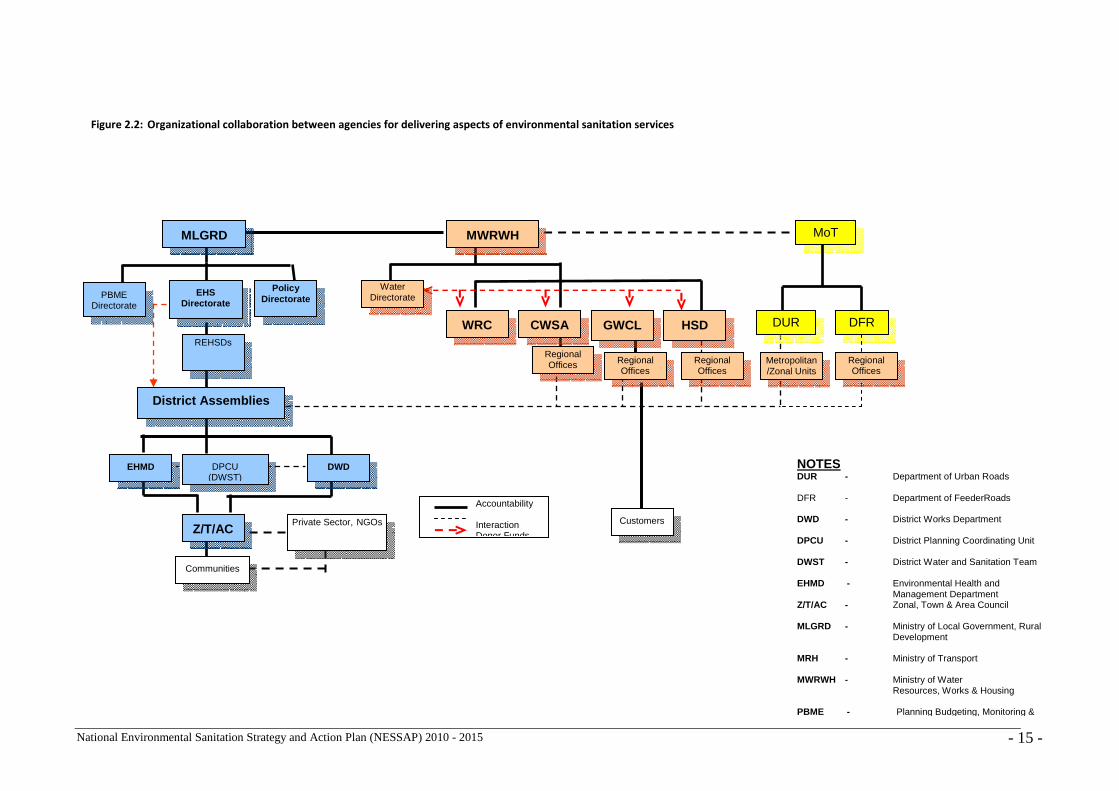
National Environmental Sanitation Strategy and Action Plan (NESSAP) 2010 - 2015 - 15 -
NOTES DUR - Department of Urban Roads DFR - Department of FeederRoads DWD - District Works Department DPCU - District Planning Coordinating Unit DWST - District Water and Sanitation Team EHMD - Environmental Health and
Management Department Z/T/AC - Zonal, Town & Area Council MLGRD - Ministry of Local Government, Rural Development MRH - Ministry of Transport MWRWH - Ministry of Water Resources, Works & Housing PBME - Planning Budgeting, Monitoring &
Figure 2.2: Organizational collaboration between agencies for delivering aspects of environmental sanitation services
Regional Offices Regional
Offices
MLGRD MWRWH
Water Directorate
WRC GWCL CWSA
PBME Directorate
Policy Directorate
EHS Directorate
Customers
District Assemblies
EHMD DWD
Private Sector, NGOs
Communities
Accountability Interaction Donor Funds
MoT
DPCU (DWST)
Z/T/AC
HSD DUR
REHSDs
DFR
Regional Offices Metropolitan
/Zonal Units Regional Offices
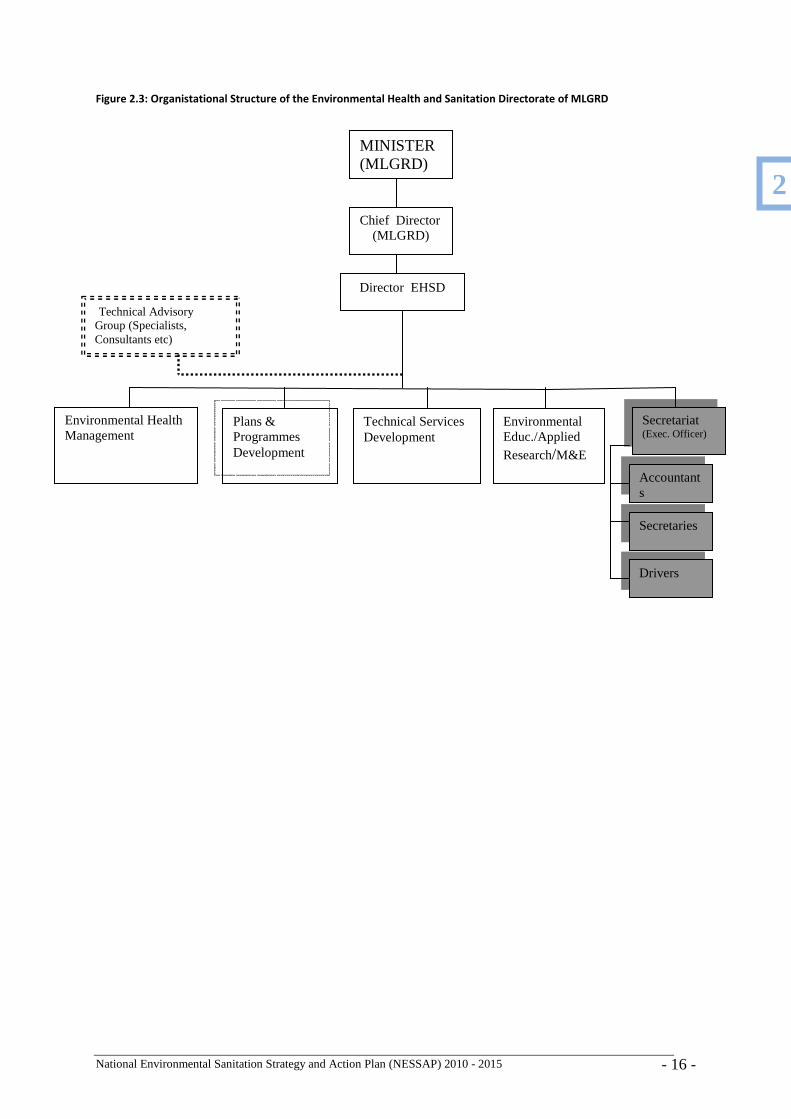
National Environmental Sanitation Strategy and Action Plan (NESSAP) 2010 - 2015 - 16 -
Figure 2.3: Organistational Structure of the Environmental Health and Sanitation Directorate of MLGRD
MINISTER (MLGRD)
Chief Director (MLGRD)
Director EHSD
Environmental Health Management
Plans & Programmes Development
Technical Services Development
Secretariat (Exec. Officer)
Secretaries
Drivers
Technical Advisory Group (Specialists, Consultants etc)
Environmental Educ./Applied Research/M&E
Accountants
2
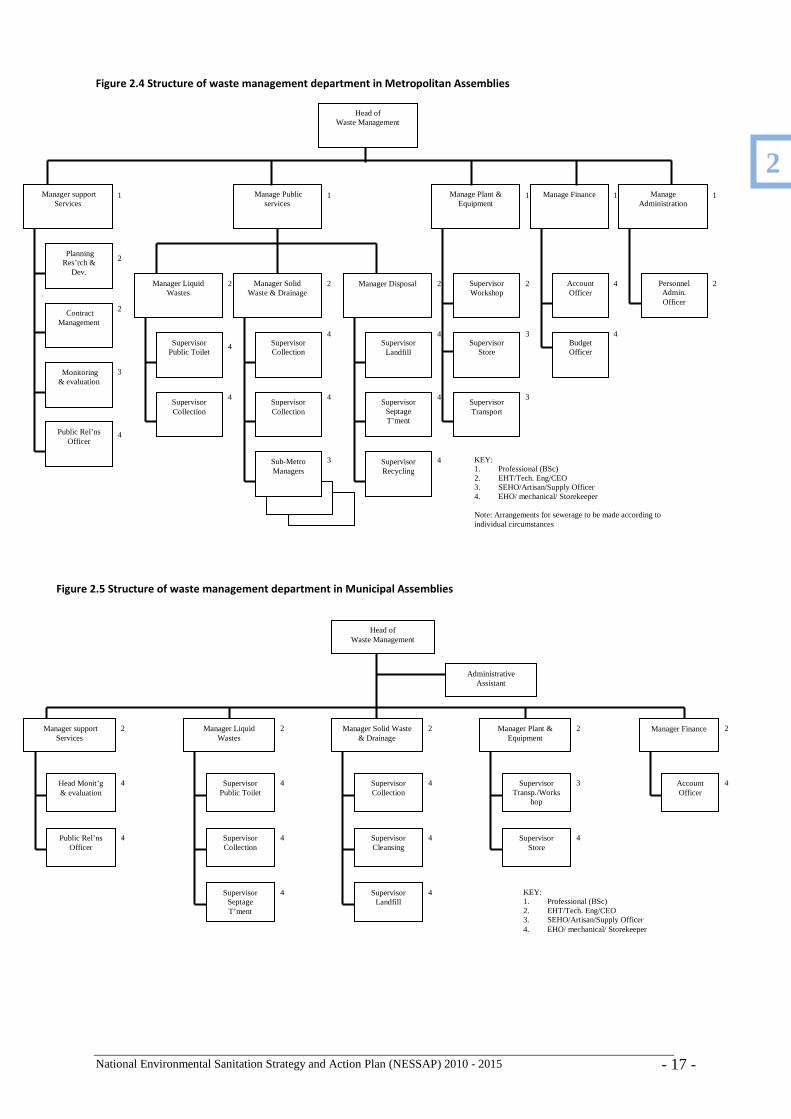
National Environmental Sanitation Strategy and Action Plan (NESSAP) 2010 - 2015 - 17 -
Figure 2.4 Structure of waste management department in Metropolitan Assemblies
Figure 2.5 Structure of waste management department in Municipal Assemblies
Head of Waste Management
Manager support Services
Head Monit’g & evaluation
Public Rel’ns Officer
Manager Liquid Wastes
Supervisor Transp./Works
hop
Supervisor Collection
Supervisor Septage T’ment
Manager Solid Waste & Drainage
Supervisor Landfill
Manager Plant & Equipment
Supervisor Store
Manager Finance
Account Officer
Administrative Assistant
Supervisor Public Toilet
Supervisor Cleansing
Supervisor Collection
KEY: 1. Professional (BSc) 2. EHT/Tech. Eng/CEO 3. SEHO/Artisan/Supply Officer 4. EHO/ mechanical/ Storekeeper
4
2 2 2 2 2
4
4
4
4
4
4
4
3
4
4
Head of Waste Management
Manage Plant & Equipment
Manage Public services
Manager support Services
Manage Finance Manage Administration
Planning Res’rch &
Dev.
Contract Management
Monitoring & evaluation
Public Rel’ns Officer
Manager Liquid Wastes
Supervisor Public Toilet
Supervisor Collection
Manager Solid Waste & Drainage
Supervisor Collection
Supervisor Collection
Sub-Metro Managers
Manager Disposal
Supervisor Landfill
Supervisor Septage T’ment
Supervisor Recycling
Supervisor Workshop
Supervisor Store
Supervisor Transport
Account Officer
Budget Officer
Personnel Admin. Officer
KEY: 1. Professional (BSc) 2. EHT/Tech. Eng/CEO 3. SEHO/Artisan/Supply Officer 4. EHO/ mechanical/ Storekeeper Note: Arrangements for sewerage to be made according to individual circumstances
1 1 1 1 1
2
2
2 2 2 2 4 2
3
4
4
4
4
4
3
4
4
4
3
3
4
2
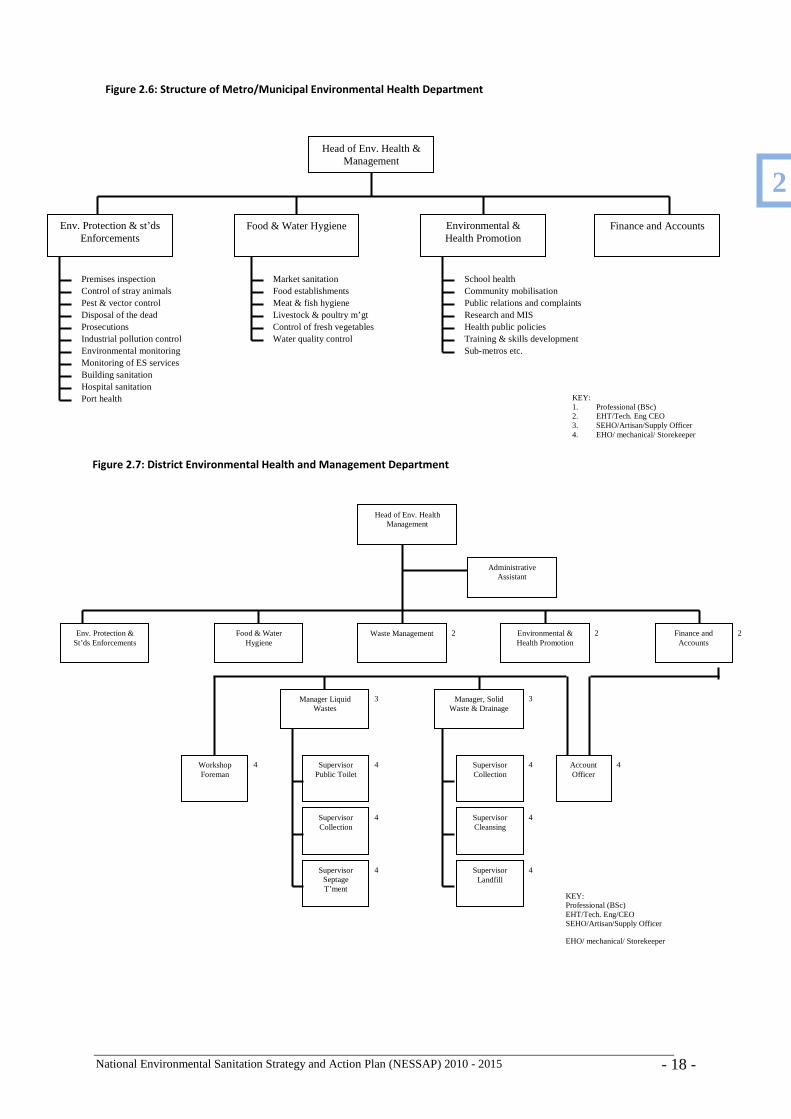
National Environmental Sanitation Strategy and Action Plan (NESSAP) 2010 - 2015 - 18 -
Figure 2.7: District Environmental Health and Management Department
Head of Env. Health Management
Env. Protection & St’ds Enforcements
Manager Liquid Wastes
Workshop Foreman
Food & Water Hygiene
Supervisor Collection
Supervisor Septage T’ment
Waste Management
Supervisor Landfill
Environmental & Health Promotion
Manager, Solid Waste & Drainage
Finance and Accounts
Account Officer
Administrative Assistant
Supervisor Public Toilet
Supervisor Cleansing
Supervisor Collection
KEY: Professional (BSc) EHT/Tech. Eng/CEO SEHO/Artisan/Supply Officer EHO/ mechanical/ Storekeeper
4
3 3
2 2 2
4
4
4 4 4 4
4
Market sanitation School health
Research and MIS
Monitoring of ES services
Control of stray animals
Building sanitation
Port health
Premises inspection
Pest & vector control Disposal of the dead Prosecutions Industrial pollution control Environmental monitoring
Hospital sanitation
Food establishments Meat & fish hygiene Livestock & poultry m’gt Control of fresh vegetables Water quality control
Community mobilisation Public relations and complaints
Health public policies Training & skills development Sub-metros etc.
Head of Env. Health & Management
Env. Protection & st’ds Enforcements
Food & Water Hygiene Environmental & Health Promotion
Finance and Accounts
Figure 2.6: Structure of Metro/Municipal Environmental Health Department
KEY: 1. Professional (BSc) 2. EHT/Tech. Eng CEO 3. SEHO/Artisan/Supply Officer 4. EHO/ mechanical/ Storekeeper
2
National Environmental Sanitation Strategy and Action Plan (NESSAP) 2010 - 2015 - 19 -
3 Current State of Environmental Sanitation
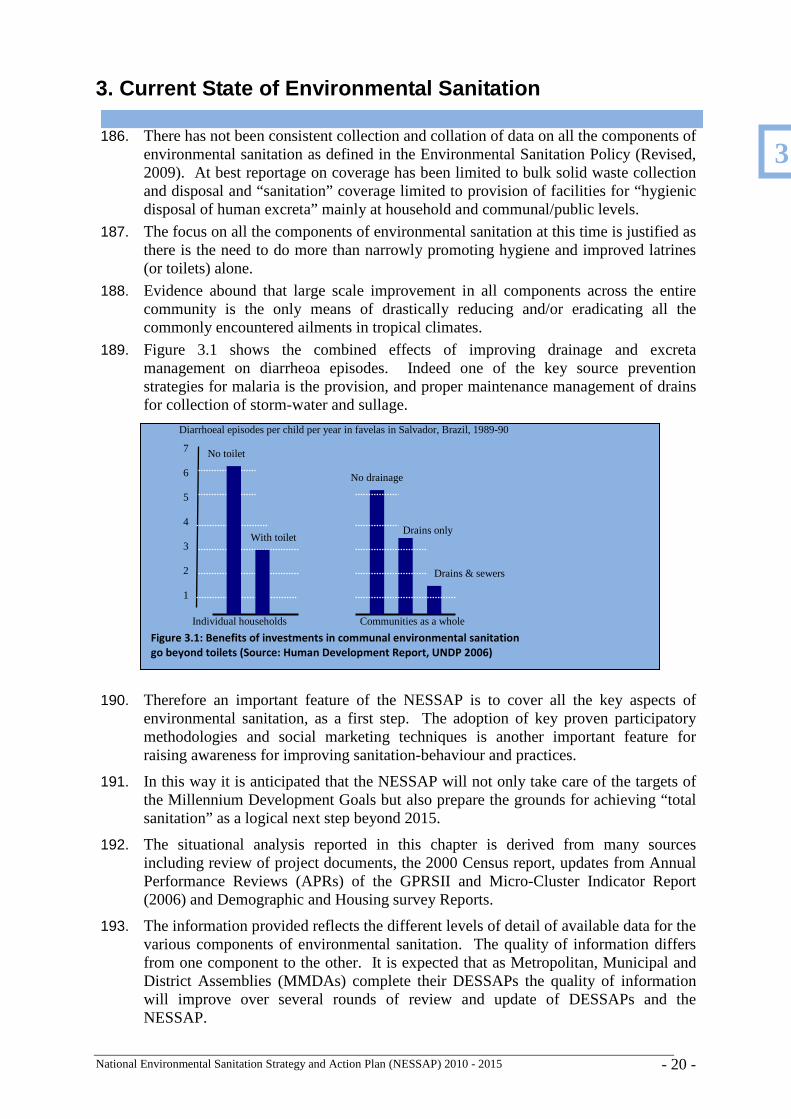
National Environmental Sanitation Strategy and Action Plan (NESSAP) 2010 - 2015 - 20 -
Figure 3.1: Benefits of investments in communal environmental sanitation
go beyond toilets (Source: Human Development Report, UNDP 2006)
3. Current State of Environmental Sanitation
186. There has not been consistent collection and collation of data on all the components of environmental sanitation as defined in the Environmental Sanitation Policy (Revised, 2009). At best reportage on coverage has been limited to bulk solid waste collection and disposal and “sanitation” coverage limited to provision of facilities for “hygienic disposal of human excreta” mainly at household and communal/public levels.
187. The focus on all the components of environmental sanitation at this time is justified as there is the need to do more than narrowly promoting hygiene and improved latrines (or toilets) alone.
188. Evidence abound that large scale improvement in all components across the entire community is the only means of drastically reducing and/or eradicating all the commonly encountered ailments in tropical climates.
189. Figure 3.1 shows the combined effects of improving drainage and excreta management on diarrheoa episodes. Indeed one of the key source prevention strategies for malaria is the provision, and proper maintenance management of drains for collection of storm-water and sullage.
190. Therefore an important feature of the NESSAP is to cover all the key aspects of environmental sanitation, as a first step. The adoption of key proven participatory methodologies and social marketing techniques is another important feature for raising awareness for improving sanitation-behaviour and practices.
191. In this way it is anticipated that the NESSAP will not only take care of the targets of the Millennium Development Goals but also prepare the grounds for achieving “total sanitation” as a logical next step beyond 2015.
192. The situational analysis reported in this chapter is derived from many sources including review of project documents, the 2000 Census report, updates from Annual Performance Reviews (APRs) of the GPRSII and Micro-Cluster Indicator Report (2006) and Demographic and Housing survey Reports.
193. The information provided reflects the different levels of detail of available data for the various components of environmental sanitation. The quality of information differs from one component to the other. It is expected that as Metropolitan, Municipal and District Assemblies (MMDAs) complete their DESSAPs the quality of information will improve over several rounds of review and update of DESSAPs and the NESSAP.
Diarrhoeal episodes per child per year in favelas in Salvador, Brazil, 1989-90
7
6
5
4
3
2
1
No toilet
With toilet
No drainage
Drains only
Drains & sewers
Individual households Communities as a whole
3
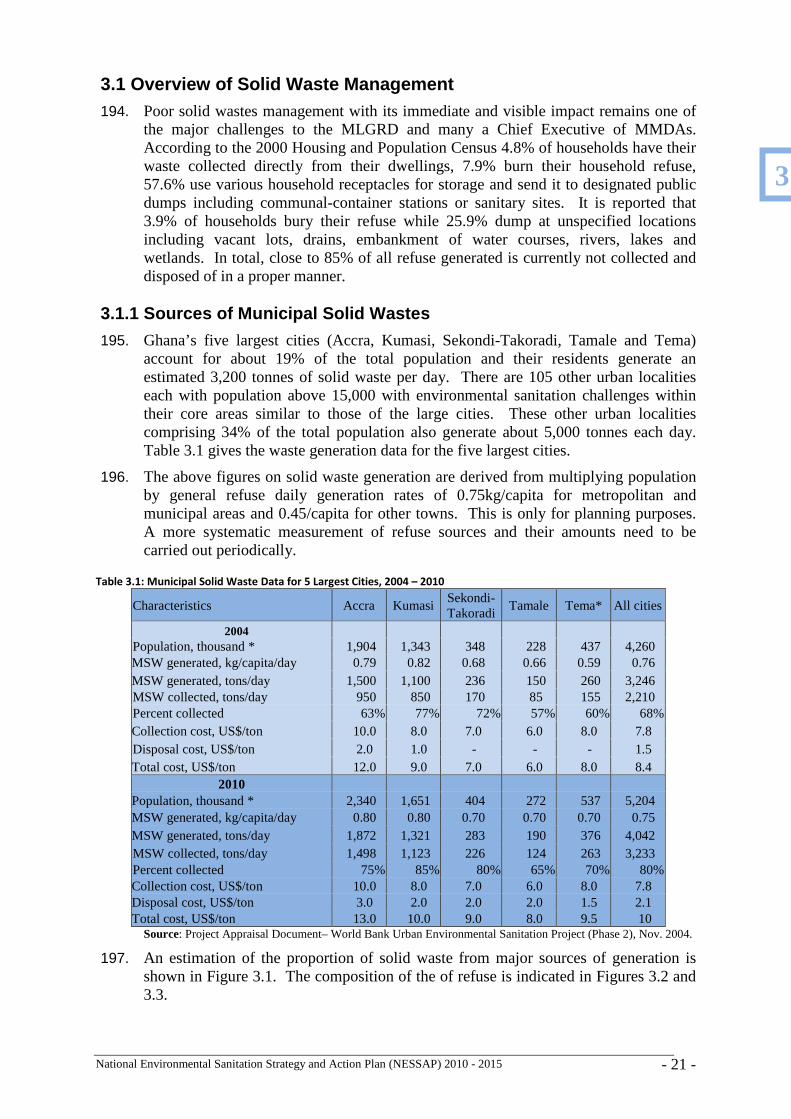
National Environmental Sanitation Strategy and Action Plan (NESSAP) 2010 - 2015 - 21 -
3.1 Overview of Solid Waste Management 194. Poor solid wastes management with its immediate and visible impact remains one of
the major challenges to the MLGRD and many a Chief Executive of MMDAs. According to the 2000 Housing and Population Census 4.8% of households have their waste collected directly from their dwellings, 7.9% burn their household refuse, 57.6% use various household receptacles for storage and send it to designated public dumps including communal-container stations or sanitary sites. It is reported that 3.9% of households bury their refuse while 25.9% dump at unspecified locations including vacant lots, drains, embankment of water courses, rivers, lakes and wetlands. In total, close to 85% of all refuse generated is currently not collected and disposed of in a proper manner.
3.1.1 Sources of Municipal Solid Wastes
195. Ghana’s five largest cities (Accra, Kumasi, Sekondi-Takoradi, Tamale and Tema) account for about 19% of the total population and their residents generate an estimated 3,200 tonnes of solid waste per day. There are 105 other urban localities each with population above 15,000 with environmental sanitation challenges within their core areas similar to those of the large cities. These other urban localities comprising 34% of the total population also generate about 5,000 tonnes each day. Table 3.1 gives the waste generation data for the five largest cities.
196. The above figures on solid waste generation are derived from multiplying population by general refuse daily generation rates of 0.75kg/capita for metropolitan and municipal areas and 0.45/capita for other towns. This is only for planning purposes. A more systematic measurement of refuse sources and their amounts need to be carried out periodically.
Table 3.1: Municipal Solid Waste Data for 5 Largest Cities, 2004 – 2010
Characteristics Accra Kumasi Sekondi- Takoradi
Tamale Tema* All cities
2004 Population, thousand * 1,904 1,343 348 228 437 4,260 MSW generated, kg/capita/day 0.79 0.82 0.68 0.66 0.59 0.76 MSW generated, tons/day 1,500 1,100 236 150 260 3,246 MSW collected, tons/day 950 850 170 85 155 2,210 Percent collected 63% 77% 72% 57% 60% 68% Collection cost, US$/ton 10.0 8.0 7.0 6.0 8.0 7.8 Disposal cost, US$/ton 2.0 1.0 - - - 1.5 Total cost, US$/ton 12.0 9.0 7.0 6.0 8.0 8.4
2010 Population, thousand * 2,340 1,651 404 272 537 5,204 MSW generated, kg/capita/day 0.80 0.80 0.70 0.70 0.70 0.75 MSW generated, tons/day 1,872 1,321 283 190 376 4,042 MSW collected, tons/day 1,498 1,123 226 124 263 3,233 Percent collected 75% 85% 80% 65% 70% 80% Collection cost, US$/ton 10.0 8.0 7.0 6.0 8.0 7.8 Disposal cost, US$/ton 3.0 2.0 2.0 2.0 1.5 2.1 Total cost, US$/ton 13.0 10.0 9.0 8.0 9.5 10
Source: Project Appraisal Document– World Bank Urban Environmental Sanitation Project (Phase 2), Nov. 2004.
197. An estimation of the proportion of solid waste from major sources of generation is shown in Figure 3.1. The composition of the of refuse is indicated in Figures 3.2 and 3.3.
3
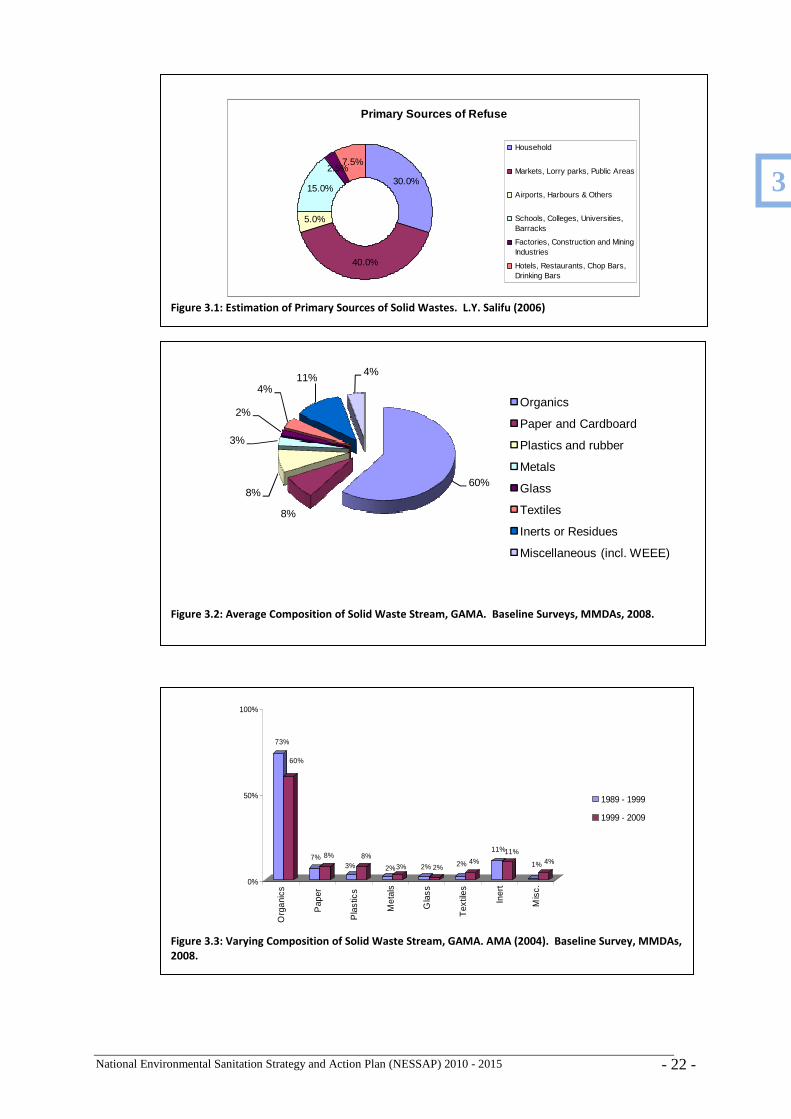
National Environmental Sanitation Strategy and Action Plan (NESSAP) 2010 - 2015 - 22 -
Primary Sources of Refuse
30.0%
40.0%
5.0%
15.0%
2.5%7.5%
Household
Markets, Lorry parks, Public Areas
Airports, Harbours & Others
Schools, Colleges, Universities,Barracks
Factories, Construction and MiningIndustries
Hotels, Restaurants, Chop Bars,Drinking Bars
Figure 3.1: Estimation of Primary Sources of Solid Wastes. L.Y. Salifu (2006)
60%
8%
8%
3%
2%
4%11% 4%
Organics
Paper and Cardboard
Plastics and rubber
Metals
Glass
Textiles
Inerts or Residues
Miscellaneous (incl. WEEE)
Figure 3.2: Average Composition of Solid Waste Stream, GAMA. Baseline Surveys, MMDAs, 2008.
73%
60%
7% 8%3%
8%
2%3% 2% 2% 2% 4%
11%11%
1% 4%
0%
50%
100%
Org
anic
s
Pap
er
Pla
stic
s
Met
als
Gla
ss
Tex
tiles
Iner
t
Mis
c.
1989 - 1999
1999 - 2009
Figure 3.3: Varying Composition of Solid Waste Stream, GAMA. AMA (2004). Baseline Survey, MMDAs,
2008.
3
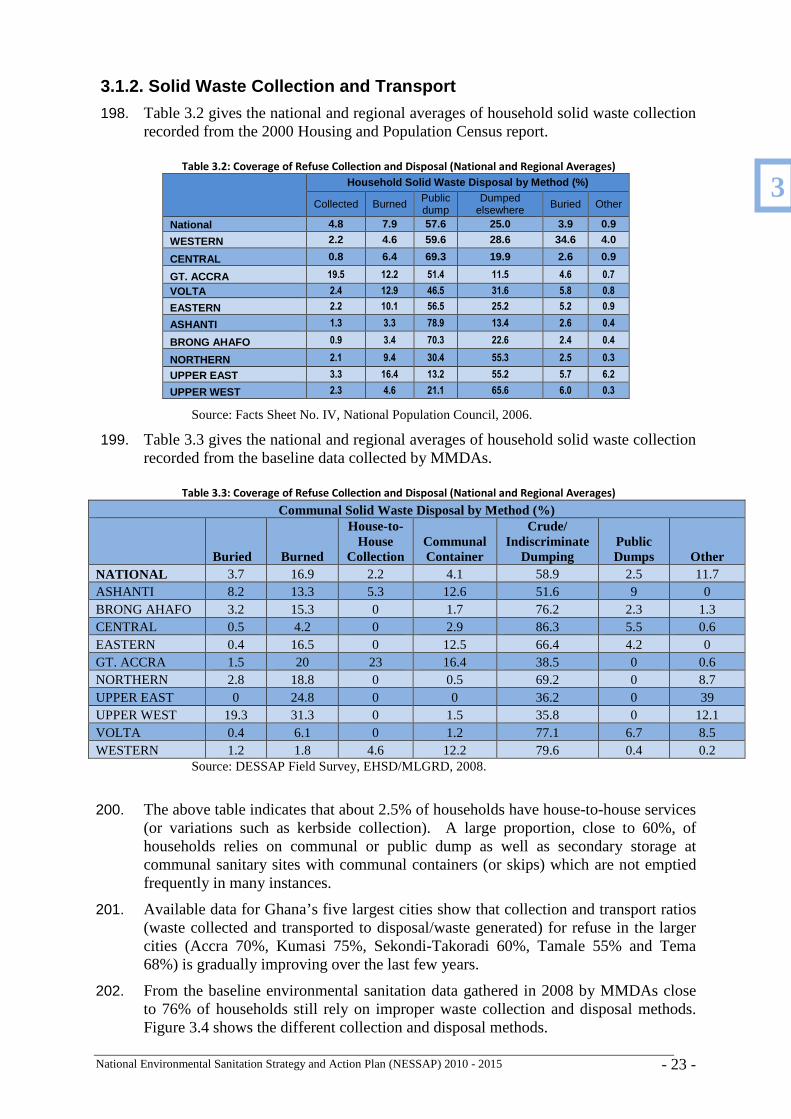
National Environmental Sanitation Strategy and Action Plan (NESSAP) 2010 - 2015 - 23 -
3.1.2. Solid Waste Collection and Transport
198. Table 3.2 gives the national and regional averages of household solid waste collection recorded from the 2000 Housing and Population Census report.
Table 3.2: Coverage of Refuse Collection and Disposal (National and Regional Averages)
Household Solid Waste Disposal by Method (%)
Collected Burned Public dump
Dumped elsewhere Buried Other
National 4.8 7.9 57.6 25.0 3.9 0.9
WESTERN 2.2 4.6 59.6 28.6 34.6 4.0
CENTRAL 0.8 6.4 69.3 19.9 2.6 0.9
GT. ACCRA 19.5 12.2 51.4 11.5 4.6 0.7
VOLTA 2.4 12.9 46.5 31.6 5.8 0.8
EASTERN 2.2 10.1 56.5 25.2 5.2 0.9
ASHANTI 1.3 3.3 78.9 13.4 2.6 0.4
BRONG AHAFO 0.9 3.4 70.3 22.6 2.4 0.4
NORTHERN 2.1 9.4 30.4 55.3 2.5 0.3
UPPER EAST 3.3 16.4 13.2 55.2 5.7 6.2
UPPER WEST 2.3 4.6 21.1 65.6 6.0 0.3
Source: Facts Sheet No. IV, National Population Council, 2006.
199. Table 3.3 gives the national and regional averages of household solid waste collection recorded from the baseline data collected by MMDAs.
Table 3.3: Coverage of Refuse Collection and Disposal (National and Regional Averages)
Communal Solid Waste Disposal by Method (%)
Buried Burned
House-to-House
Collection Communal Container
Crude/ Indiscriminate
Dumping Public Dumps Other
NATIONAL 3.7 16.9 2.2 4.1 58.9 2.5 11.7 ASHANTI 8.2 13.3 5.3 12.6 51.6 9 0 BRONG AHAFO 3.2 15.3 0 1.7 76.2 2.3 1.3 CENTRAL 0.5 4.2 0 2.9 86.3 5.5 0.6 EASTERN 0.4 16.5 0 12.5 66.4 4.2 0 GT. ACCRA 1.5 20 23 16.4 38.5 0 0.6 NORTHERN 2.8 18.8 0 0.5 69.2 0 8.7 UPPER EAST 0 24.8 0 0 36.2 0 39 UPPER WEST 19.3 31.3 0 1.5 35.8 0 12.1 VOLTA 0.4 6.1 0 1.2 77.1 6.7 8.5 WESTERN 1.2 1.8 4.6 12.2 79.6 0.4 0.2 Source: DESSAP Field Survey, EHSD/MLGRD, 2008.
200. The above table indicates that about 2.5% of households have house-to-house services (or variations such as kerbside collection). A large proportion, close to 60%, of households relies on communal or public dump as well as secondary storage at communal sanitary sites with communal containers (or skips) which are not emptied frequently in many instances.
201. Available data for Ghana’s five largest cities show that collection and transport ratios (waste collected and transported to disposal/waste generated) for refuse in the larger cities (Accra 70%, Kumasi 75%, Sekondi-Takoradi 60%, Tamale 55% and Tema 68%) is gradually improving over the last few years.
202. From the baseline environmental sanitation data gathered in 2008 by MMDAs close to 76% of households still rely on improper waste collection and disposal methods. Figure 3.4 shows the different collection and disposal methods.
3
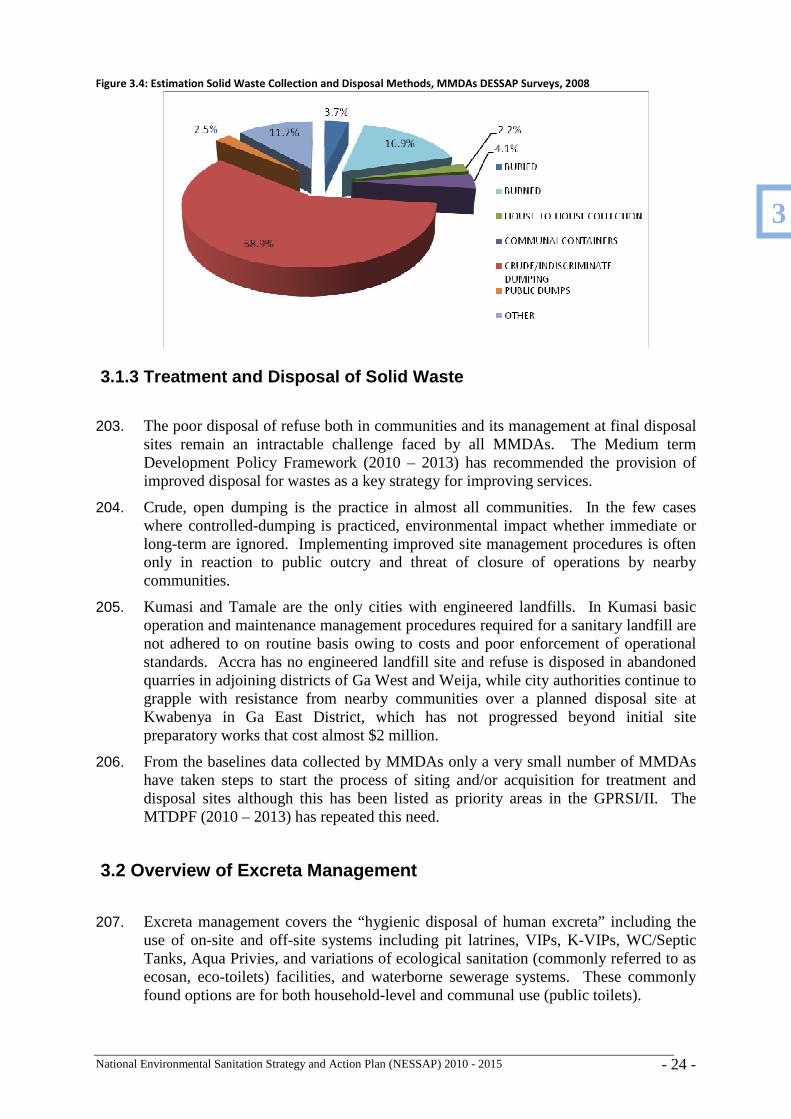
National Environmental Sanitation Strategy and Action Plan (NESSAP) 2010 - 2015 - 24 -
Figure 3.4: Estimation Solid Waste Collection and Disposal Methods, MMDAs DESSAP Surveys, 2008
3.1.3 Treatment and Disposal of Solid Waste
203. The poor disposal of refuse both in communities and its management at final disposal sites remain an intractable challenge faced by all MMDAs. The Medium term Development Policy Framework (2010 – 2013) has recommended the provision of improved disposal for wastes as a key strategy for improving services.
204. Crude, open dumping is the practice in almost all communities. In the few cases where controlled-dumping is practiced, environmental impact whether immediate or long-term are ignored. Implementing improved site management procedures is often only in reaction to public outcry and threat of closure of operations by nearby communities.
205. Kumasi and Tamale are the only cities with engineered landfills. In Kumasi basic operation and maintenance management procedures required for a sanitary landfill are not adhered to on routine basis owing to costs and poor enforcement of operational standards. Accra has no engineered landfill site and refuse is disposed in abandoned quarries in adjoining districts of Ga West and Weija, while city authorities continue to grapple with resistance from nearby communities over a planned disposal site at Kwabenya in Ga East District, which has not progressed beyond initial site preparatory works that cost almost $2 million.
206. From the baselines data collected by MMDAs only a very small number of MMDAs have taken steps to start the process of siting and/or acquisition for treatment and disposal sites although this has been listed as priority areas in the GPRSI/II. The MTDPF (2010 – 2013) has repeated this need.
3.2 Overview of Excreta Management
207. Excreta management covers the “hygienic disposal of human excreta” including the use of on-site and off-site systems including pit latrines, VIPs, K-VIPs, WC/Septic Tanks, Aqua Privies, and variations of ecological sanitation (commonly referred to as ecosan, eco-toilets) facilities, and waterborne sewerage systems. These commonly found options are for both household-level and communal use (public toilets).
3
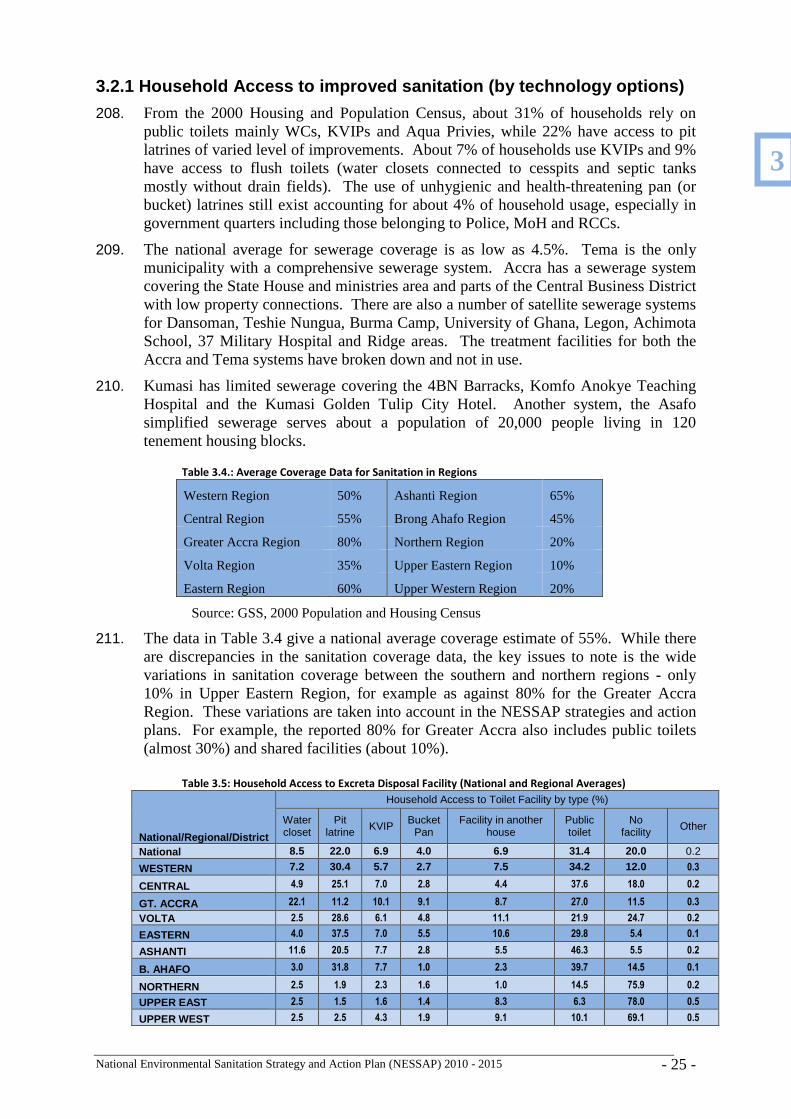
National Environmental Sanitation Strategy and Action Plan (NESSAP) 2010 - 2015 - 25 -
3.2.1 Household Access to improved sanitation (by t echnology options)
208. From the 2000 Housing and Population Census, about 31% of households rely on public toilets mainly WCs, KVIPs and Aqua Privies, while 22% have access to pit latrines of varied level of improvements. About 7% of households use KVIPs and 9% have access to flush toilets (water closets connected to cesspits and septic tanks mostly without drain fields). The use of unhygienic and health-threatening pan (or bucket) latrines still exist accounting for about 4% of household usage, especially in government quarters including those belonging to Police, MoH and RCCs.
209. The national average for sewerage coverage is as low as 4.5%. Tema is the only municipality with a comprehensive sewerage system. Accra has a sewerage system covering the State House and ministries area and parts of the Central Business District with low property connections. There are also a number of satellite sewerage systems for Dansoman, Teshie Nungua, Burma Camp, University of Ghana, Legon, Achimota School, 37 Military Hospital and Ridge areas. The treatment facilities for both the Accra and Tema systems have broken down and not in use.
210. Kumasi has limited sewerage covering the 4BN Barracks, Komfo Anokye Teaching Hospital and the Kumasi Golden Tulip City Hotel. Another system, the Asafo simplified sewerage serves about a population of 20,000 people living in 120 tenement housing blocks.
Table 3.4.: Average Coverage Data for Sanitation in Regions
Western Region 50% Ashanti Region 65%
Central Region 55% Brong Ahafo Region 45%
Greater Accra Region 80% Northern Region 20%
Volta Region 35% Upper Eastern Region 10%
Eastern Region 60% Upper Western Region 20%
Source: GSS, 2000 Population and Housing Census
211. The data in Table 3.4 give a national average coverage estimate of 55%. While there are discrepancies in the sanitation coverage data, the key issues to note is the wide variations in sanitation coverage between the southern and northern regions - only 10% in Upper Eastern Region, for example as against 80% for the Greater Accra Region. These variations are taken into account in the NESSAP strategies and action plans. For example, the reported 80% for Greater Accra also includes public toilets (almost 30%) and shared facilities (about 10%).
Table 3.5: Household Access to Excreta Disposal Facility (National and Regional Averages)
National/Regional/District
Household Access to Toilet Facility by type (%)
Water closet
Pit latrine KVIP
Bucket Pan
Facility in another house
Public toilet
No facility Other
National 8.5 22.0 6.9 4.0 6.9 31.4 20.0 0.2
WESTERN 7.2 30.4 5.7 2.7 7.5 34.2 12.0 0.3
CENTRAL 4.9 25.1 7.0 2.8 4.4 37.6 18.0 0.2
GT. ACCRA 22.1 11.2 10.1 9.1 8.7 27.0 11.5 0.3
VOLTA 2.5 28.6 6.1 4.8 11.1 21.9 24.7 0.2
EASTERN 4.0 37.5 7.0 5.5 10.6 29.8 5.4 0.1
ASHANTI 11.6 20.5 7.7 2.8 5.5 46.3 5.5 0.2
B. AHAFO 3.0 31.8 7.7 1.0 2.3 39.7 14.5 0.1
NORTHERN 2.5 1.9 2.3 1.6 1.0 14.5 75.9 0.2
UPPER EAST 2.5 1.5 1.6 1.4 8.3 6.3 78.0 0.5
UPPER WEST 2.5 2.5 4.3 1.9 9.1 10.1 69.1 0.5
3
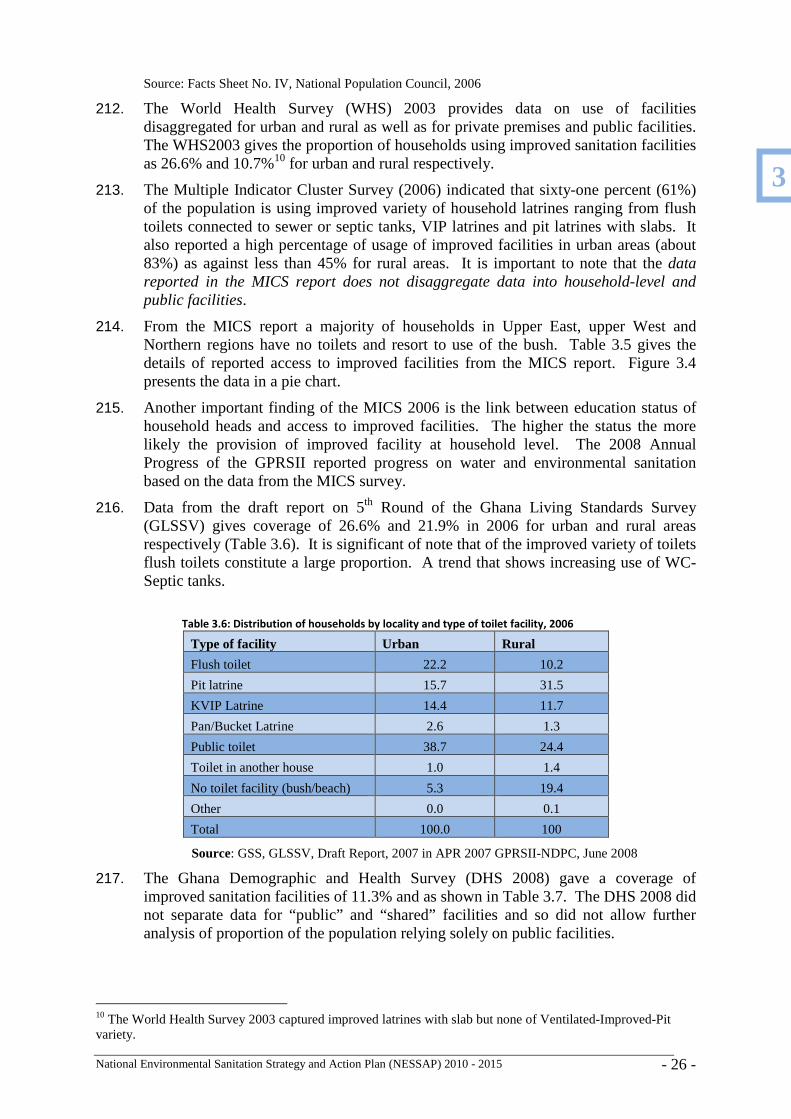
National Environmental Sanitation Strategy and Action Plan (NESSAP) 2010 - 2015 - 26 -
Source: Facts Sheet No. IV, National Population Council, 2006
212. The World Health Survey (WHS) 2003 provides data on use of facilities disaggregated for urban and rural as well as for private premises and public facilities. The WHS2003 gives the proportion of households using improved sanitation facilities as 26.6% and 10.7%10 for urban and rural respectively.
213. The Multiple Indicator Cluster Survey (2006) indicated that sixty-one percent (61%) of the population is using improved variety of household latrines ranging from flush toilets connected to sewer or septic tanks, VIP latrines and pit latrines with slabs. It also reported a high percentage of usage of improved facilities in urban areas (about 83%) as against less than 45% for rural areas. It is important to note that the data reported in the MICS report does not disaggregate data into household-level and public facilities.
214. From the MICS report a majority of households in Upper East, upper West and Northern regions have no toilets and resort to use of the bush. Table 3.5 gives the details of reported access to improved facilities from the MICS report. Figure 3.4 presents the data in a pie chart.
215. Another important finding of the MICS 2006 is the link between education status of household heads and access to improved facilities. The higher the status the more likely the provision of improved facility at household level. The 2008 Annual Progress of the GPRSII reported progress on water and environmental sanitation based on the data from the MICS survey.
216. Data from the draft report on 5th Round of the Ghana Living Standards Survey (GLSSV) gives coverage of 26.6% and 21.9% in 2006 for urban and rural areas respectively (Table 3.6). It is significant of note that of the improved variety of toilets flush toilets constitute a large proportion. A trend that shows increasing use of WC-Septic tanks.
Table 3.6: Distribution of households by locality and type of toilet facility, 2006
Type of facility Urban Rural
Flush toilet 22.2 10.2
Pit latrine 15.7 31.5
KVIP Latrine 14.4 11.7
Pan/Bucket Latrine 2.6 1.3
Public toilet 38.7 24.4
Toilet in another house 1.0 1.4
No toilet facility (bush/beach) 5.3 19.4
Other 0.0 0.1
Total 100.0 100
Source: GSS, GLSSV, Draft Report, 2007 in APR 2007 GPRSII-NDPC, June 2008
217. The Ghana Demographic and Health Survey (DHS 2008) gave a coverage of improved sanitation facilities of 11.3% and as shown in Table 3.7. The DHS 2008 did not separate data for “public” and “shared” facilities and so did not allow further analysis of proportion of the population relying solely on public facilities.
10 The World Health Survey 2003 captured improved latrines with slab but none of Ventilated-Improved-Pit variety.
3
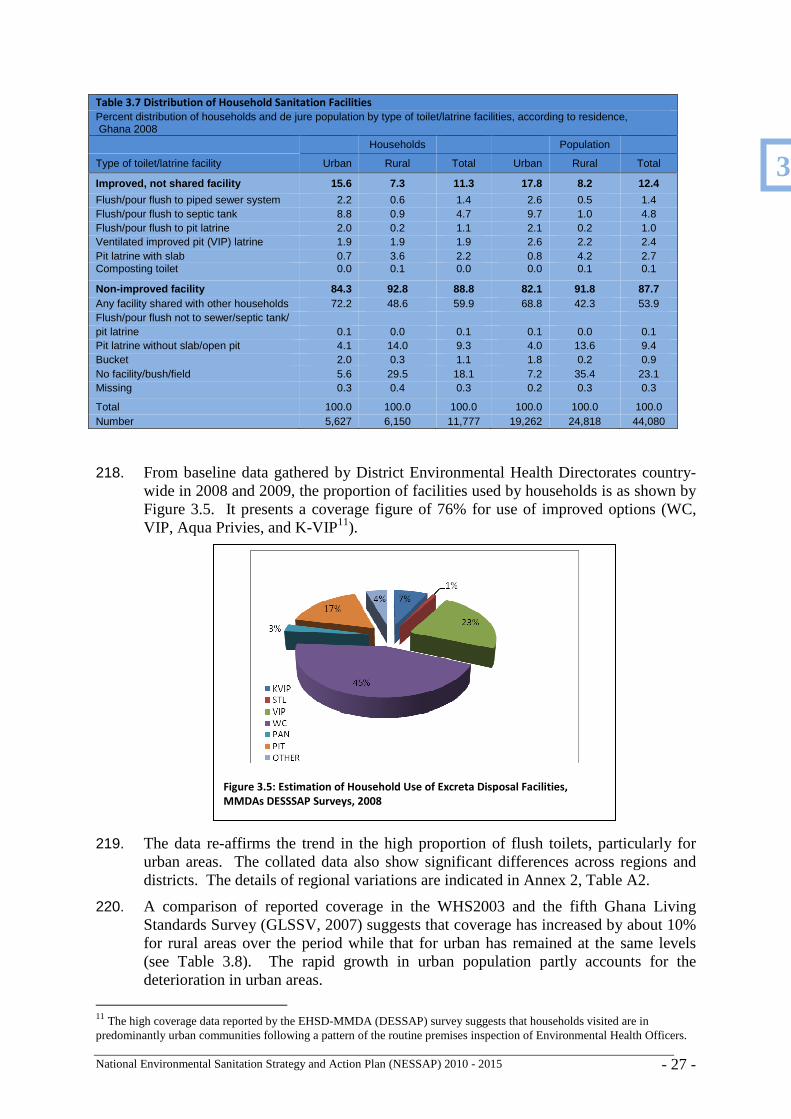
National Environmental Sanitation Strategy and Action Plan (NESSAP) 2010 - 2015 - 27 -
Figure 3.5: Estimation of Household Use of Excreta Disposal Facilities,
MMDAs DESSSAP Surveys, 2008
Table 3.7 Distribution of Household Sanitation Facilities
Percent distribution of households and de jure population by type of toilet/latrine facilities, according to residence, Ghana 2008 Households Population
Type of toilet/latrine facility Urban Rural Total Urban Rural Total
Improved, not shared facility 15.6 7.3 11.3 17.8 8.2 12.4
Flush/pour flush to piped sewer system 2.2 0.6 1.4 2.6 0.5 1.4 Flush/pour flush to septic tank 8.8 0.9 4.7 9.7 1.0 4.8 Flush/pour flush to pit latrine 2.0 0.2 1.1 2.1 0.2 1.0 Ventilated improved pit (VIP) latrine 1.9 1.9 1.9 2.6 2.2 2.4 Pit latrine with slab 0.7 3.6 2.2 0.8 4.2 2.7 Composting toilet 0.0 0.1 0.0 0.0 0.1 0.1
Non-improved facility 84.3 92.8 88.8 82.1 91.8 87.7 Any facility shared with other households 72.2 48.6 59.9 68.8 42.3 53.9 Flush/pour flush not to sewer/septic tank/ pit latrine 0.1 0.0 0.1 0.1 0.0 0.1 Pit latrine without slab/open pit 4.1 14.0 9.3 4.0 13.6 9.4 Bucket 2.0 0.3 1.1 1.8 0.2 0.9 No facility/bush/field 5.6 29.5 18.1 7.2 35.4 23.1 Missing 0.3 0.4 0.3 0.2 0.3 0.3
Total 100.0 100.0 100.0 100.0 100.0 100.0 Number 5,627 6,150 11,777 19,262 24,818 44,080
218. From baseline data gathered by District Environmental Health Directorates country-wide in 2008 and 2009, the proportion of facilities used by households is as shown by Figure 3.5. It presents a coverage figure of 76% for use of improved options (WC, VIP, Aqua Privies, and K-VIP11).
219. The data re-affirms the trend in the high proportion of flush toilets, particularly for urban areas. The collated data also show significant differences across regions and districts. The details of regional variations are indicated in Annex 2, Table A2.
220. A comparison of reported coverage in the WHS2003 and the fifth Ghana Living Standards Survey (GLSSV, 2007) suggests that coverage has increased by about 10% for rural areas over the period while that for urban has remained at the same levels (see Table 3.8). The rapid growth in urban population partly accounts for the deterioration in urban areas.
11 The high coverage data reported by the EHSD-MMDA (DESSAP) survey suggests that households visited are in predominantly urban communities following a pattern of the routine premises inspection of Environmental Health Officers.
3
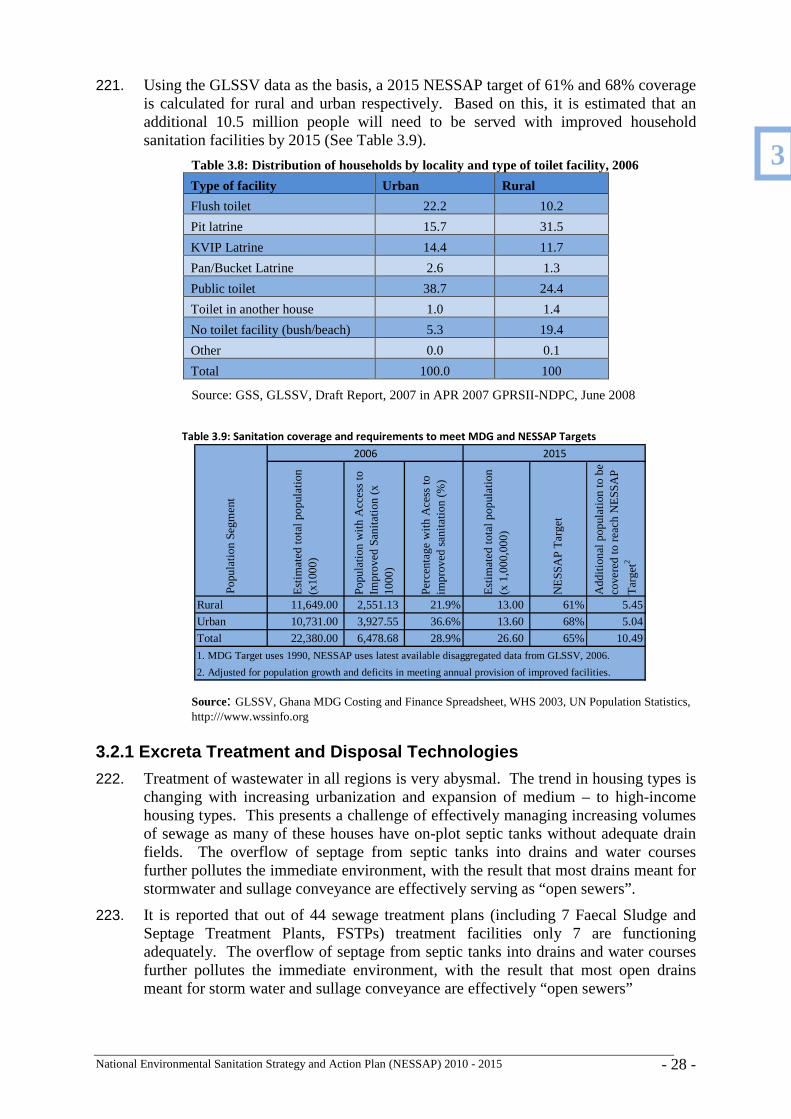
National Environmental Sanitation Strategy and Action Plan (NESSAP) 2010 - 2015 - 28 -
Est
ima
ted
to
tal p
op
ula
tion
(x
100
0)
Po
pula
tion
with
Acc
ess
to
Imp
rove
d S
an
itatio
n (x
10
00
)
Pe
rce
nta
ge
with
Ace
ss t
o im
pro
ved
sa
nita
tion
(%
)
Est
ima
ted
to
tal p
op
ula
tion
(x
1,0
00,
000
)
NE
SS
AP
Ta
rge
t
Ad
diti
ona
l po
pul
atio
n t
o b
e
cove
red
to
re
ach
NE
SS
AP
Ta
rge
t2
Rural 11,649.00 2,551.13 21.9% 13.00 61% 5.45
Urban 10,731.00 3,927.55 36.6% 13.60 68% 5.04
Total 22,380.00 6,478.68 28.9% 26.60 65% 10.49
2006 2015
Po
pula
tion
Se
gm
en
t
1. MDG Target uses 1990, NESSAP uses latest available disaggregated data from GLSSV, 2006.
2. Adjusted for population growth and deficits in meeting annual provision of improved facilities.
221. Using the GLSSV data as the basis, a 2015 NESSAP target of 61% and 68% coverage is calculated for rural and urban respectively. Based on this, it is estimated that an additional 10.5 million people will need to be served with improved household sanitation facilities by 2015 (See Table 3.9).
Table 3.8: Distribution of households by locality and type of toilet facility, 2006
Type of facility Urban Rural
Flush toilet 22.2 10.2
Pit latrine 15.7 31.5
KVIP Latrine 14.4 11.7
Pan/Bucket Latrine 2.6 1.3
Public toilet 38.7 24.4
Toilet in another house 1.0 1.4
No toilet facility (bush/beach) 5.3 19.4
Other 0.0 0.1
Total 100.0 100
Source: GSS, GLSSV, Draft Report, 2007 in APR 2007 GPRSII-NDPC, June 2008
Table 3.9: Sanitation coverage and requirements to meet MDG and NESSAP Targets
Source: GLSSV, Ghana MDG Costing and Finance Spreadsheet, WHS 2003, UN Population Statistics, http:///www.wssinfo.org
3.2.1 Excreta Treatment and Disposal Technologies
222. Treatment of wastewater in all regions is very abysmal. The trend in housing types is changing with increasing urbanization and expansion of medium – to high-income housing types. This presents a challenge of effectively managing increasing volumes of sewage as many of these houses have on-plot septic tanks without adequate drain fields. The overflow of septage from septic tanks into drains and water courses further pollutes the immediate environment, with the result that most drains meant for stormwater and sullage conveyance are effectively serving as “open sewers”.
223. It is reported that out of 44 sewage treatment plans (including 7 Faecal Sludge and Septage Treatment Plants, FSTPs) treatment facilities only 7 are functioning adequately. The overflow of septage from septic tanks into drains and water courses further pollutes the immediate environment, with the result that most open drains meant for storm water and sullage conveyance are effectively “open sewers”
3
National Environmental Sanitation Strategy and Action Plan (NESSAP) 2010 - 2015 - 29 -
224. The Aerated Lagoons constructed for treating sewage for Tema is in disrepair and sewage is discharged directly through a sea outfall. The Upflow Anaerobic-Sludge Blanket (UASB) plant constructed and commissioned recently (2000) to treat sewage from the Accra Central Sewerage system, septage from septic tanks and faecal sludge from public toilets is also not functioning12 with sewage by-passed into the Korle-Lagoon close to the sea shore.
225. In Kumasi the sewerage system serving the 4BN, Komfo Anokye Teaching Hospital (KATH) relies on the Waste Stabilization Pond system constructed in 1994 for the treatment of sewage from the Asafo simplified-sewerage system.
226. Satellite estate sewer systems are also located in Chirapatre, Ahinsan and Kwadaso estates. These systems which previously depended mainly on septic tanks and drain fields were rehabilitated in 2001 after more than a decade of neglect and poor maintenance. The Ahinsan and Chirapatre systems have been upgraded to small community waste stabilization ponds.
227. Treatment of liquid waste of pathogenic nature from HCFs is virtually non-existent. In a few hospitals such as those belonging to missionaries, sullage is recycled and used for flushing toilets and then conveyed to anaerobic bio-digesters and co-treated with hospital liquid and pathological waste. St. Dominic’s Hospital in Akwatia is a notable example.
228. Generally, those sewerage facilities that are functional are those constructed as satellite systems belonging to corporations such as Volta River Authority (VRA), for example in Akuse, estate developments belonging to the erstwhile State Housing Corporation (now State Housing Company Limited) serving areas such as Dansoman, Ridge, Teshie-Nungua (which’s trickling filter is totally in disrepair with sewage flowing through rivulets and drains to the sea).
229. In many instances facilities installed by the erstwhile Public Works Department (PWD) in barracks, schools and hospitals in areas such as Burma Camp, University of Ghana and 37 Military Hospital all in Accra, do not function owing to unclear maintenance responsibilities now that PWD is not directly in charge and sewerage has been transferred to MMDAs. Table 3.6 gives a snap shot of the state of main sewerage systems and septage/faecal sludge treatment plants in Accra, Kumasi and Tema.
230. The difficulty of the Accra Metropolitan Assembly’s Waste Management Department (AMA-WMD) to operate and maintain13 the UASB plant inherited from the Ghana Water Company Limited (GWCL), is a common challenge faced by MMDAs including those of Kumasi, Koforidua and Tamale in effectively managing septage/faecal sludge treatment plants (FSTPs). In Kumasi, FSTP co-sited on the engineered disposal site at Dompoase and commissioned in 2003 is not functioning properly with the initial anaerobic/sedimentation ponds choked due to poor operation and maintenance.
12 Based on visits to the UASB Plant in March 2008. 13 The UASB plant commissioned in 2002 has been dormant since 2004 reportedly due to loss of pressure in pumps that lift to the top of UASB chamber and subsequent detioration of metal parts of key units.
3
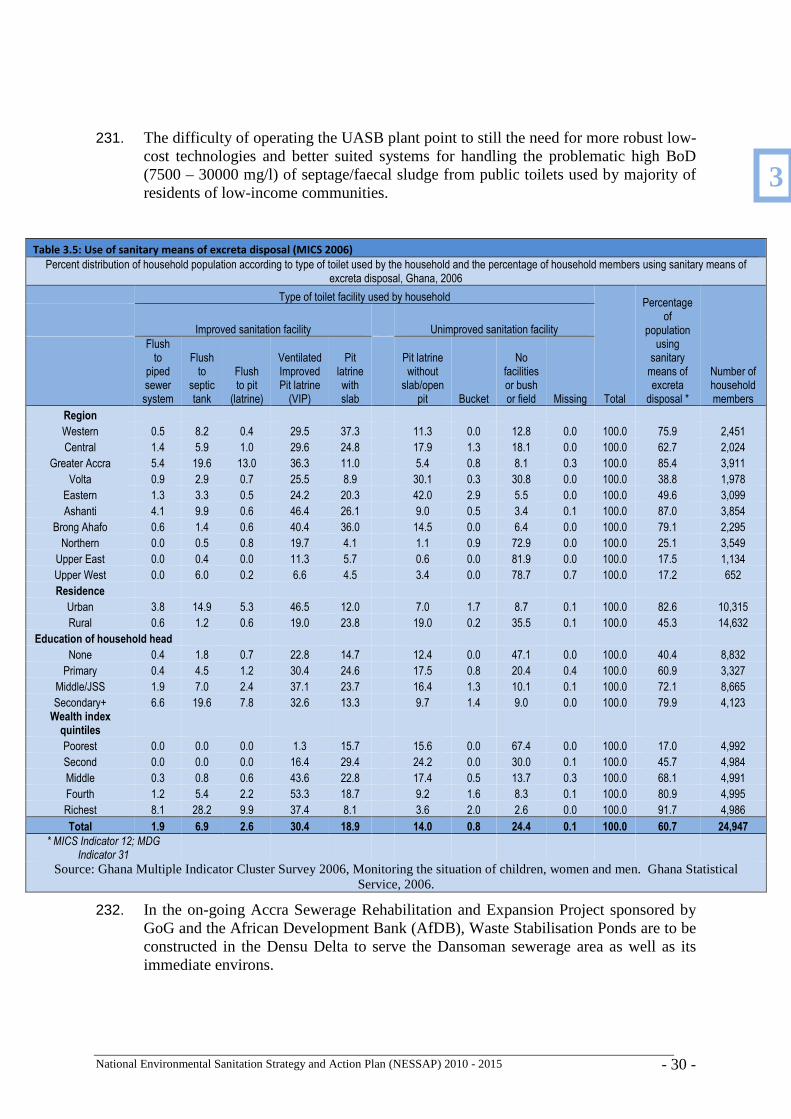
National Environmental Sanitation Strategy and Action Plan (NESSAP) 2010 - 2015 - 30 -
231. The difficulty of operating the UASB plant point to still the need for more robust low-cost technologies and better suited systems for handling the problematic high BoD (7500 – 30000 mg/l) of septage/faecal sludge from public toilets used by majority of residents of low-income communities.
232. In the on-going Accra Sewerage Rehabilitation and Expansion Project sponsored by GoG and the African Development Bank (AfDB), Waste Stabilisation Ponds are to be constructed in the Densu Delta to serve the Dansoman sewerage area as well as its immediate environs.
Table 3.5: Use of sanitary means of excreta disposal (MICS 2006)
Percent distribution of household population according to type of toilet used by the household and the percentage of household members using sanitary means of excreta disposal, Ghana, 2006
Type of toilet facility used by household
Total
Percentage of
population using
sanitary means of excreta
disposal *
Number of household members
Improved sanitation facility Unimproved sanitation facility
Flush to
piped sewer system
Flush to
septic tank
Flush to pit
(latrine)
Ventilated Improved Pit latrine (VIP)
Pit latrine with slab
Pit latrine without
slab/open pit Bucket
No facilities or bush or field Missing
Region
Western 0.5 8.2 0.4 29.5 37.3 11.3 0.0 12.8 0.0 100.0 75.9 2,451
Central 1.4 5.9 1.0 29.6 24.8 17.9 1.3 18.1 0.0 100.0 62.7 2,024
Greater Accra 5.4 19.6 13.0 36.3 11.0 5.4 0.8 8.1 0.3 100.0 85.4 3,911
Volta 0.9 2.9 0.7 25.5 8.9 30.1 0.3 30.8 0.0 100.0 38.8 1,978
Eastern 1.3 3.3 0.5 24.2 20.3 42.0 2.9 5.5 0.0 100.0 49.6 3,099
Ashanti 4.1 9.9 0.6 46.4 26.1 9.0 0.5 3.4 0.1 100.0 87.0 3,854
Brong Ahafo 0.6 1.4 0.6 40.4 36.0 14.5 0.0 6.4 0.0 100.0 79.1 2,295
Northern 0.0 0.5 0.8 19.7 4.1 1.1 0.9 72.9 0.0 100.0 25.1 3,549
Upper East 0.0 0.4 0.0 11.3 5.7 0.6 0.0 81.9 0.0 100.0 17.5 1,134
Upper West 0.0 6.0 0.2 6.6 4.5 3.4 0.0 78.7 0.7 100.0 17.2 652
Residence
Urban 3.8 14.9 5.3 46.5 12.0 7.0 1.7 8.7 0.1 100.0 82.6 10,315
Rural 0.6 1.2 0.6 19.0 23.8 19.0 0.2 35.5 0.1 100.0 45.3 14,632
Education of household head
None 0.4 1.8 0.7 22.8 14.7 12.4 0.0 47.1 0.0 100.0 40.4 8,832
Primary 0.4 4.5 1.2 30.4 24.6 17.5 0.8 20.4 0.4 100.0 60.9 3,327
Middle/JSS 1.9 7.0 2.4 37.1 23.7 16.4 1.3 10.1 0.1 100.0 72.1 8,665
Secondary+ 6.6 19.6 7.8 32.6 13.3 9.7 1.4 9.0 0.0 100.0 79.9 4,123 Wealth index quintiles
Poorest 0.0 0.0 0.0 1.3 15.7 15.6 0.0 67.4 0.0 100.0 17.0 4,992
Second 0.0 0.0 0.0 16.4 29.4 24.2 0.0 30.0 0.1 100.0 45.7 4,984
Middle 0.3 0.8 0.6 43.6 22.8 17.4 0.5 13.7 0.3 100.0 68.1 4,991
Fourth 1.2 5.4 2.2 53.3 18.7 9.2 1.6 8.3 0.1 100.0 80.9 4,995
Richest 8.1 28.2 9.9 37.4 8.1 3.6 2.0 2.6 0.0 100.0 91.7 4,986
Total 1.9 6.9 2.6 30.4 18.9 14.0 0.8 24.4 0.1 100.0 60.7 24,947
* MICS Indicator 12; MDG
Indicator 31
Source: Ghana Multiple Indicator Cluster Survey 2006, Monitoring the situation of children, women and men. Ghana Statistical Service, 2006.
3
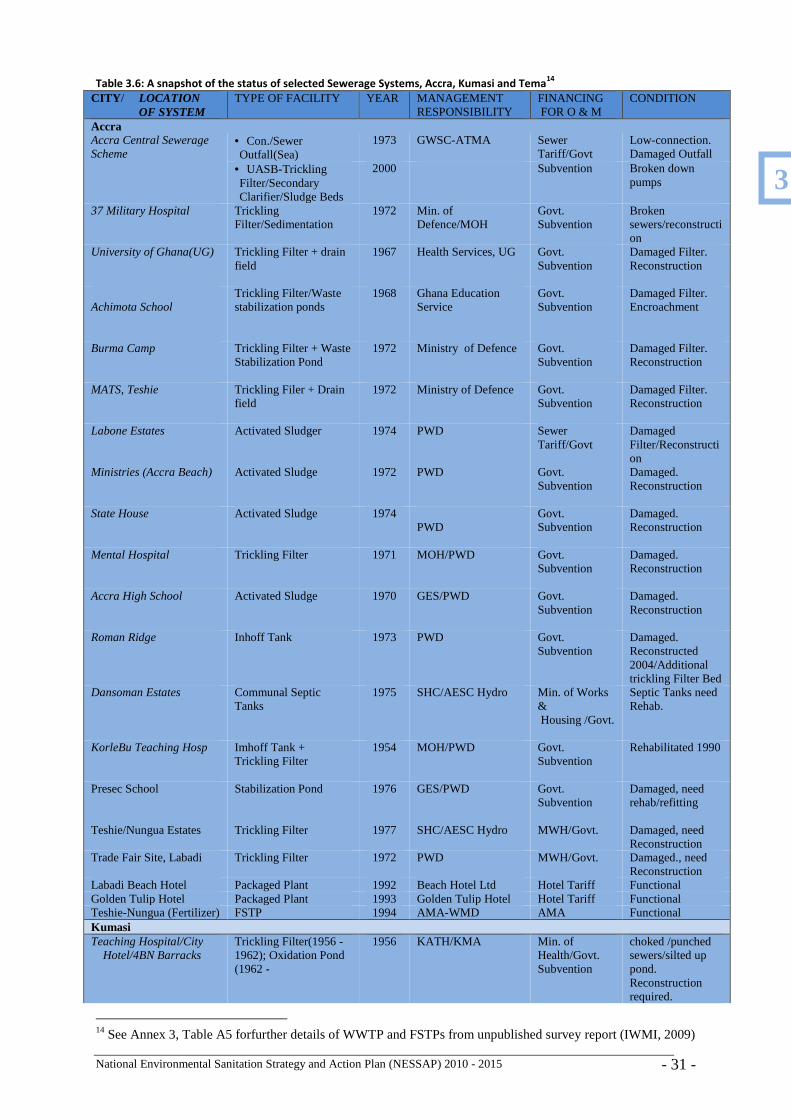
National Environmental Sanitation Strategy and Action Plan (NESSAP) 2010 - 2015 - 31 -
Table 3.6: A snapshot of the status of selected Sewerage Systems, Accra, Kumasi and Tema14
CITY / LOCATION OF SYSTEM
TYPE OF FACILITY YEAR MANAGEMENT RESPONSIBILITY
FINANCING FOR O & M
CONDITION
Accra Accra Central Sewerage Scheme
• Con./Sewer Outfall(Sea)
1973
GWSC-ATMA
Sewer Tariff/Govt
Low-connection. Damaged Outfall
• UASB-Trickling Filter/Secondary Clarifier/Sludge Beds
2000
Subvention
Broken down pumps
37 Military Hospital Trickling Filter/Sedimentation
1972
Min. of Defence/MOH
Govt. Subvention
Broken sewers/reconstruction
University of Ghana(UG) Trickling Filter + drain field
1967
Health Services, UG Govt. Subvention
Damaged Filter. Reconstruction
Achimota School
Trickling Filter/Waste stabilization ponds
1968 Ghana Education Service
Govt. Subvention
Damaged Filter. Encroachment
Burma Camp Trickling Filter + Waste Stabilization Pond
1972
Ministry of Defence
Govt. Subvention
Damaged Filter. Reconstruction
MATS, Teshie Trickling Filer + Drain field
1972
Ministry of Defence
Govt. Subvention
Damaged Filter. Reconstruction
Labone Estates Activated Sludger 1974
PWD
Sewer Tariff/Govt
Damaged Filter/Reconstruction
Ministries (Accra Beach) Activated Sludge
1972
PWD
Govt. Subvention
Damaged. Reconstruction
State House Activated Sludge 1974
PWD
Govt. Subvention
Damaged. Reconstruction
Mental Hospital Trickling Filter 1971
MOH/PWD
Govt. Subvention
Damaged. Reconstruction
Accra High School Activated Sludge 1970
GES/PWD
Govt. Subvention
Damaged. Reconstruction
Roman Ridge Inhoff Tank
1973
PWD
Govt. Subvention
Damaged. Reconstructed 2004/Additional trickling Filter Bed
Dansoman Estates Communal Septic Tanks
1975
SHC/AESC Hydro
Min. of Works & Housing /Govt.
Septic Tanks need Rehab.
KorleBu Teaching Hosp Imhoff Tank + Trickling Filter
1954
MOH/PWD
Govt. Subvention
Rehabilitated 1990
Presec School
Stabilization Pond
1976 GES/PWD
Govt. Subvention
Damaged, need rehab/refitting
Teshie/Nungua Estates Trickling Filter 1977 SHC/AESC Hydro MWH/Govt.
Damaged, need Reconstruction
Trade Fair Site, Labadi
Trickling Filter 1972
PWD
MWH/Govt.
Damaged., need Reconstruction
Labadi Beach Hotel Packaged Plant 1992 Beach Hotel Ltd Hotel Tariff Functional Golden Tulip Hotel Packaged Plant 1993 Golden Tulip Hotel Hotel Tariff Functional Teshie-Nungua (Fertilizer) FSTP 1994 AMA-WMD AMA Functional Kumasi Teaching Hospital/City Hotel/4BN Barracks
Trickling Filter(1956 - 1962); Oxidation Pond (1962 -
1956
KATH/KMA
Min. of Health/Govt. Subvention
choked /punched sewers/silted up pond. Reconstruction required.
14 See Annex 3, Table A5 forfurther details of WWTP and FSTPs from unpublished survey report (IWMI, 2009)
3
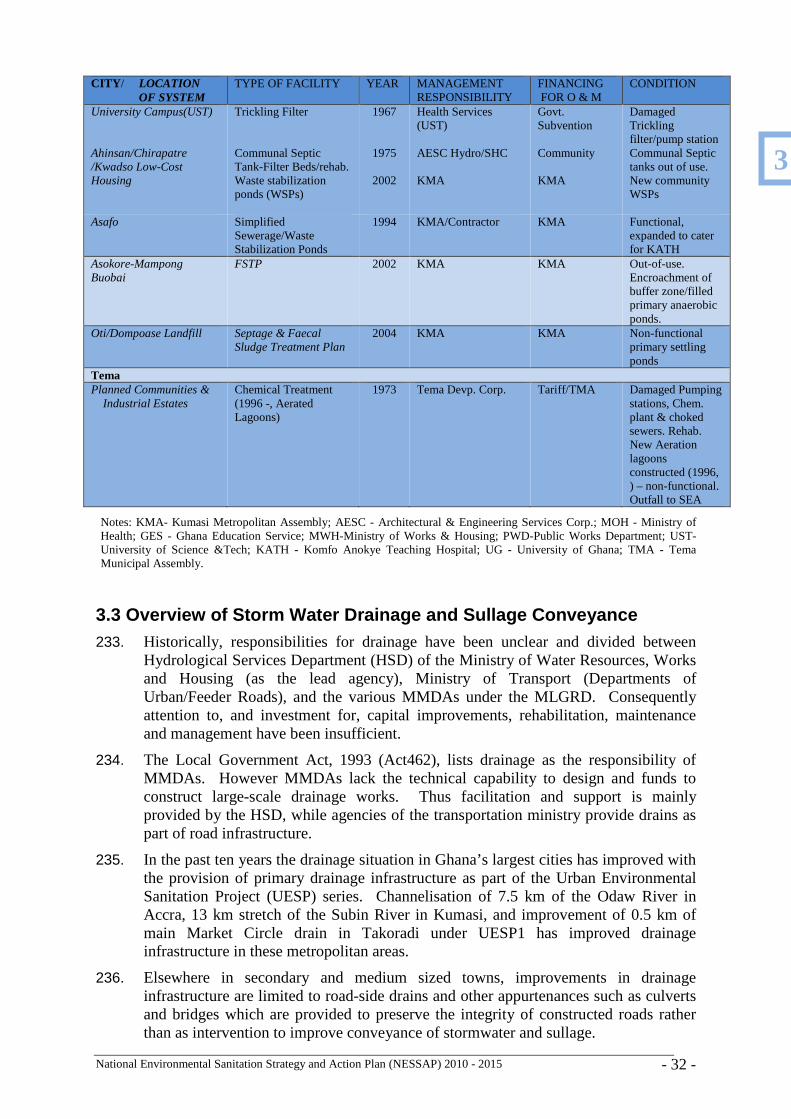
National Environmental Sanitation Strategy and Action Plan (NESSAP) 2010 - 2015 - 32 -
CITY / LOCATION OF SYSTEM
TYPE OF FACILITY YEAR MANAGEMENT RESPONSIBILITY
FINANCING FOR O & M
CONDITION
University Campus(UST) Trickling Filter 1967
Health Services (UST)
Govt. Subvention
Damaged Trickling filter/pump station
Ahinsan/Chirapatre /Kwadso Low-Cost Housing
Communal Septic Tank-Filter Beds/rehab. Waste stabilization ponds (WSPs)
1975
2002
AESC Hydro/SHC KMA
Community KMA
Communal Septic tanks out of use. New community WSPs
Asafo Simplified Sewerage/Waste Stabilization Ponds
1994 KMA/Contractor KMA Functional, expanded to cater for KATH
Asokore-Mampong Buobai
FSTP 2002 KMA KMA Out-of-use. Encroachment of buffer zone/filled primary anaerobic ponds.
Oti/Dompoase Landfill Septage & Faecal Sludge Treatment Plan
2004 KMA KMA Non-functional primary settling ponds
Tema Planned Communities & Industrial Estates
Chemical Treatment (1996 -, Aerated Lagoons)
1973 Tema Devp. Corp. Tariff/TMA Damaged Pumping stations, Chem. plant & choked sewers. Rehab. New Aeration lagoons constructed (1996, ) – non-functional. Outfall to SEA
Notes: KMA- Kumasi Metropolitan Assembly; AESC - Architectural & Engineering Services Corp.; MOH - Ministry of Health; GES - Ghana Education Service; MWH-Ministry of Works & Housing; PWD-Public Works Department; UST-University of Science &Tech; KATH - Komfo Anokye Teaching Hospital; UG - University of Ghana; TMA - Tema Municipal Assembly.
3.3 Overview of Storm Water Drainage and Sullage Conveyanc e 233. Historically, responsibilities for drainage have been unclear and divided between
Hydrological Services Department (HSD) of the Ministry of Water Resources, Works and Housing (as the lead agency), Ministry of Transport (Departments of Urban/Feeder Roads), and the various MMDAs under the MLGRD. Consequently attention to, and investment for, capital improvements, rehabilitation, maintenance and management have been insufficient.
234. The Local Government Act, 1993 (Act462), lists drainage as the responsibility of MMDAs. However MMDAs lack the technical capability to design and funds to construct large-scale drainage works. Thus facilitation and support is mainly provided by the HSD, while agencies of the transportation ministry provide drains as part of road infrastructure.
235. In the past ten years the drainage situation in Ghana’s largest cities has improved with the provision of primary drainage infrastructure as part of the Urban Environmental Sanitation Project (UESP) series. Channelisation of 7.5 km of the Odaw River in Accra, 13 km stretch of the Subin River in Kumasi, and improvement of 0.5 km of main Market Circle drain in Takoradi under UESP1 has improved drainage infrastructure in these metropolitan areas.
236. Elsewhere in secondary and medium sized towns, improvements in drainage infrastructure are limited to road-side drains and other appurtenances such as culverts and bridges which are provided to preserve the integrity of constructed roads rather than as intervention to improve conveyance of stormwater and sullage.
3
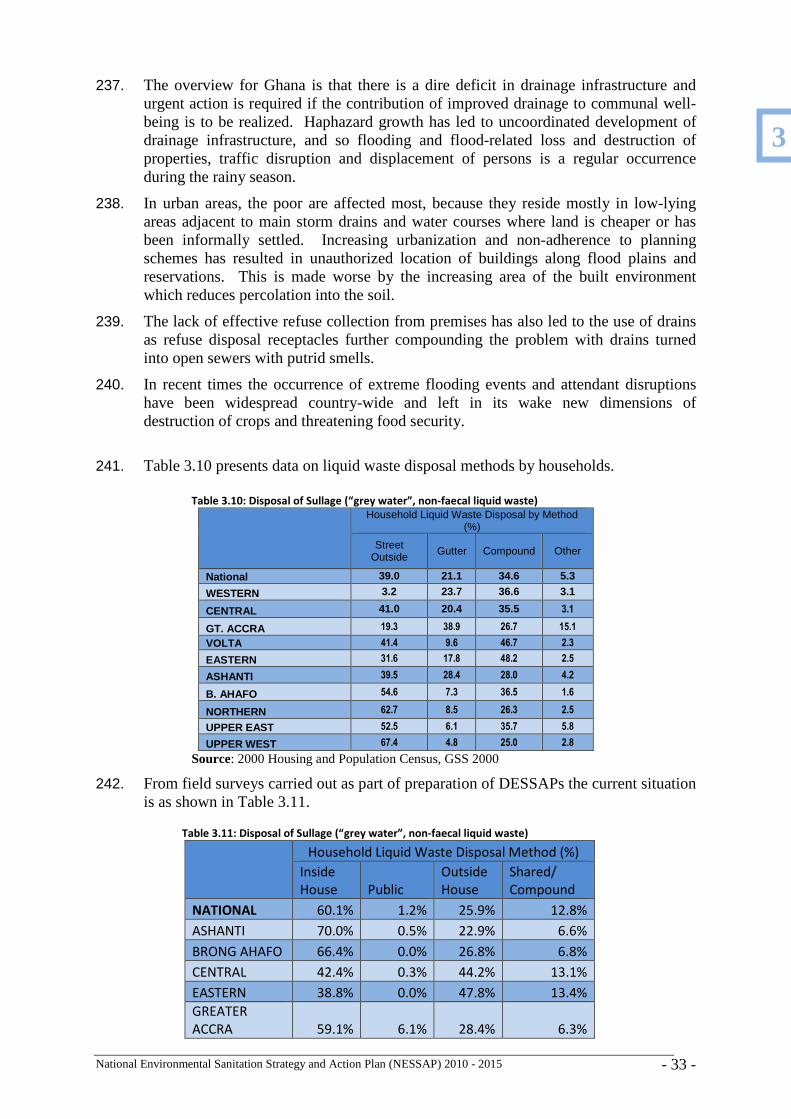
National Environmental Sanitation Strategy and Action Plan (NESSAP) 2010 - 2015 - 33 -
237. The overview for Ghana is that there is a dire deficit in drainage infrastructure and urgent action is required if the contribution of improved drainage to communal well-being is to be realized. Haphazard growth has led to uncoordinated development of drainage infrastructure, and so flooding and flood-related loss and destruction of properties, traffic disruption and displacement of persons is a regular occurrence during the rainy season.
238. In urban areas, the poor are affected most, because they reside mostly in low-lying areas adjacent to main storm drains and water courses where land is cheaper or has been informally settled. Increasing urbanization and non-adherence to planning schemes has resulted in unauthorized location of buildings along flood plains and reservations. This is made worse by the increasing area of the built environment which reduces percolation into the soil.
239. The lack of effective refuse collection from premises has also led to the use of drains as refuse disposal receptacles further compounding the problem with drains turned into open sewers with putrid smells.
240. In recent times the occurrence of extreme flooding events and attendant disruptions have been widespread country-wide and left in its wake new dimensions of destruction of crops and threatening food security.
241. Table 3.10 presents data on liquid waste disposal methods by households.
Table 3.10: Disposal of Sullage (“grey water”, non-faecal liquid waste)
Household Liquid Waste Disposal by Method (%)
Street Outside Gutter Compound Other
National 39.0 21.1 34.6 5.3
WESTERN 3.2 23.7 36.6 3.1
CENTRAL 41.0 20.4 35.5 3.1
GT. ACCRA 19.3 38.9 26.7 15.1
VOLTA 41.4 9.6 46.7 2.3
EASTERN 31.6 17.8 48.2 2.5
ASHANTI 39.5 28.4 28.0 4.2
B. AHAFO 54.6 7.3 36.5 1.6
NORTHERN 62.7 8.5 26.3 2.5
UPPER EAST 52.5 6.1 35.7 5.8
UPPER WEST 67.4 4.8 25.0 2.8
Source: 2000 Housing and Population Census, GSS 2000
242. From field surveys carried out as part of preparation of DESSAPs the current situation is as shown in Table 3.11.
Table 3.11: Disposal of Sullage (“grey water”, non-faecal liquid waste)
Household Liquid Waste Disposal Method (%)
Inside
House Public
Outside
House
Shared/
Compound
NATIONAL 60.1% 1.2% 25.9% 12.8%
ASHANTI 70.0% 0.5% 22.9% 6.6%
BRONG AHAFO 66.4% 0.0% 26.8% 6.8%
CENTRAL 42.4% 0.3% 44.2% 13.1%
EASTERN 38.8% 0.0% 47.8% 13.4%
GREATER
ACCRA 59.1% 6.1% 28.4% 6.3%
3
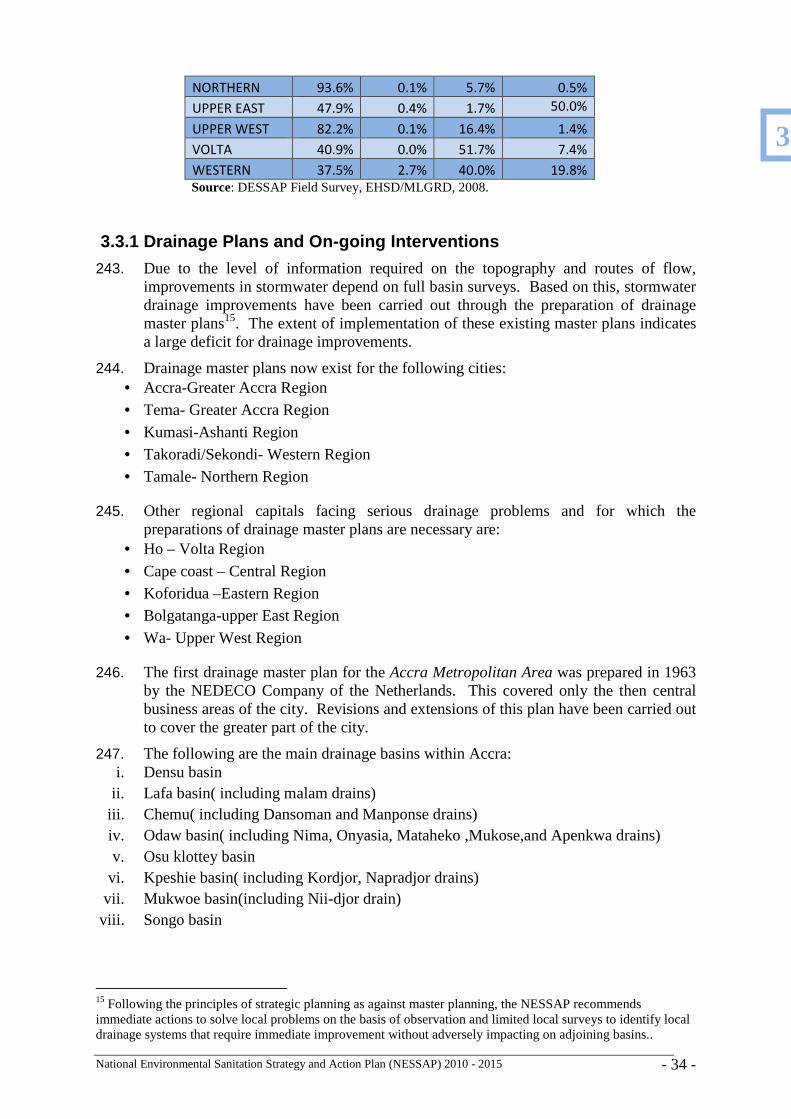
National Environmental Sanitation Strategy and Action Plan (NESSAP) 2010 - 2015 - 34 -
NORTHERN 93.6% 0.1% 5.7% 0.5%
UPPER EAST 47.9% 0.4% 1.7% 50.0%
UPPER WEST 82.2% 0.1% 16.4% 1.4%
VOLTA 40.9% 0.0% 51.7% 7.4%
WESTERN 37.5% 2.7% 40.0% 19.8% Source: DESSAP Field Survey, EHSD/MLGRD, 2008.
3.3.1 Drainage Plans and On-going Interventions
243. Due to the level of information required on the topography and routes of flow, improvements in stormwater depend on full basin surveys. Based on this, stormwater drainage improvements have been carried out through the preparation of drainage master plans15. The extent of implementation of these existing master plans indicates a large deficit for drainage improvements.
244. Drainage master plans now exist for the following cities: • Accra-Greater Accra Region • Tema- Greater Accra Region
• Kumasi-Ashanti Region • Takoradi/Sekondi- Western Region • Tamale- Northern Region
245. Other regional capitals facing serious drainage problems and for which the preparations of drainage master plans are necessary are:
• Ho – Volta Region
• Cape coast – Central Region • Koforidua –Eastern Region • Bolgatanga-upper East Region • Wa- Upper West Region
246. The first drainage master plan for the Accra Metropolitan Area was prepared in 1963 by the NEDECO Company of the Netherlands. This covered only the then central business areas of the city. Revisions and extensions of this plan have been carried out to cover the greater part of the city.
247. The following are the main drainage basins within Accra: i. Densu basin
ii. Lafa basin( including malam drains) iii. Chemu( including Dansoman and Manponse drains) iv. Odaw basin( including Nima, Onyasia, Mataheko ,Mukose,and Apenkwa drains) v. Osu klottey basin
vi. Kpeshie basin( including Kordjor, Napradjor drains) vii. Mukwoe basin(including Nii-djor drain) viii. Songo basin
15 Following the principles of strategic planning as against master planning, the NESSAP recommends immediate actions to solve local problems on the basis of observation and limited local surveys to identify local drainage systems that require immediate improvement without adversely impacting on adjoining basins..
3
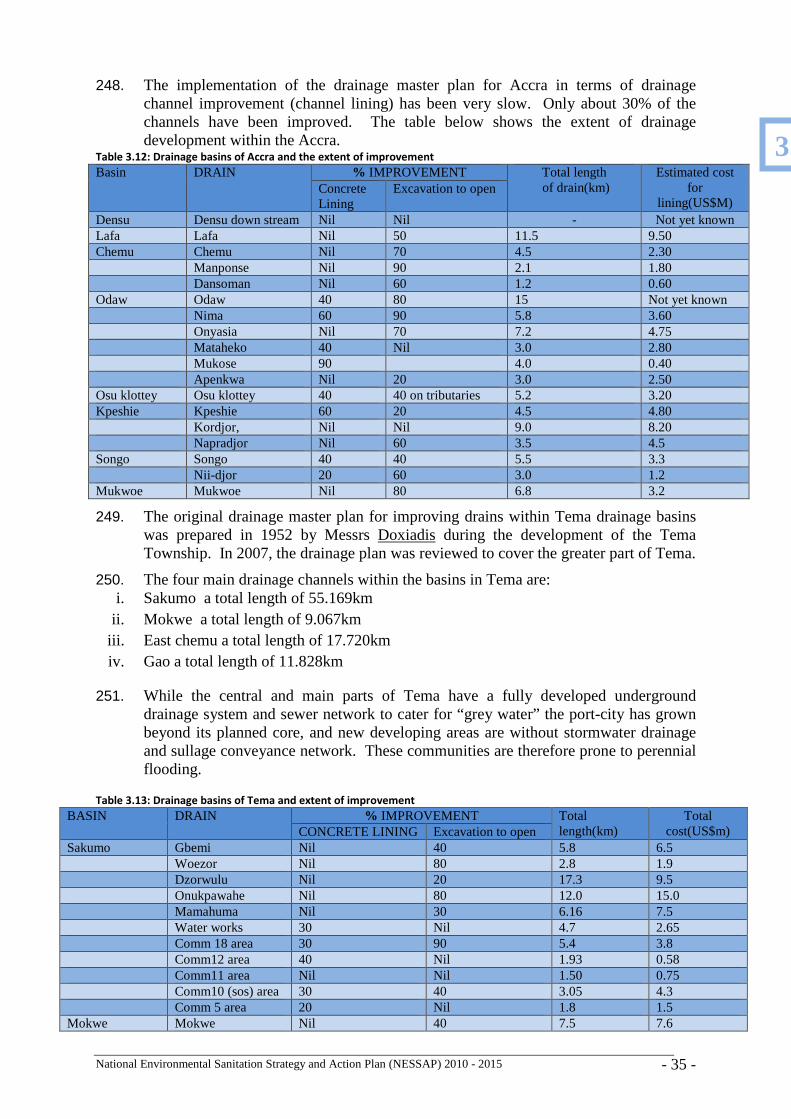
National Environmental Sanitation Strategy and Action Plan (NESSAP) 2010 - 2015 - 35 -
248. The implementation of the drainage master plan for Accra in terms of drainage channel improvement (channel lining) has been very slow. Only about 30% of the channels have been improved. The table below shows the extent of drainage development within the Accra.
Table 3.12: Drainage basins of Accra and the extent of improvement
Basin DRAIN % IMPROVEMENT Total length of drain(km)
Estimated cost for
lining(US$M) Concrete Lining
Excavation to open
Densu Densu down stream Nil Nil - Not yet known Lafa Lafa Nil 50 11.5 9.50 Chemu Chemu Nil 70 4.5 2.30 Manponse Nil 90 2.1 1.80 Dansoman Nil 60 1.2 0.60 Odaw Odaw 40 80 15 Not yet known Nima 60 90 5.8 3.60 Onyasia Nil 70 7.2 4.75 Mataheko 40 Nil 3.0 2.80 Mukose 90 4.0 0.40 Apenkwa Nil 20 3.0 2.50 Osu klottey Osu klottey 40 40 on tributaries 5.2 3.20 Kpeshie Kpeshie 60 20 4.5 4.80 Kordjor, Nil Nil 9.0 8.20 Napradjor Nil 60 3.5 4.5 Songo Songo 40 40 5.5 3.3 Nii-djor 20 60 3.0 1.2 Mukwoe Mukwoe Nil 80 6.8 3.2
249. The original drainage master plan for improving drains within Tema drainage basins was prepared in 1952 by Messrs Doxiadis during the development of the Tema Township. In 2007, the drainage plan was reviewed to cover the greater part of Tema.
250. The four main drainage channels within the basins in Tema are: i. Sakumo a total length of 55.169km
ii. Mokwe a total length of 9.067km iii. East chemu a total length of 17.720km iv. Gao a total length of 11.828km
251. While the central and main parts of Tema have a fully developed underground drainage system and sewer network to cater for “grey water” the port-city has grown beyond its planned core, and new developing areas are without stormwater drainage and sullage conveyance network. These communities are therefore prone to perennial flooding.
Table 3.13: Drainage basins of Tema and extent of improvement
BASIN DRAIN % IMPROVEMENT Total length(km)
Total cost(US$m) CONCRETE LINING Excavation to open
Sakumo Gbemi Nil 40 5.8 6.5 Woezor Nil 80 2.8 1.9 Dzorwulu Nil 20 17.3 9.5 Onukpawahe Nil 80 12.0 15.0 Mamahuma Nil 30 6.16 7.5 Water works 30 Nil 4.7 2.65 Comm 18 area 30 90 5.4 3.8 Comm12 area 40 Nil 1.93 0.58 Comm11 area Nil Nil 1.50 0.75 Comm10 (sos) area 30 40 3.05 4.3 Comm 5 area 20 Nil 1.8 1.5 Mokwe Mokwe Nil 40 7.5 7.6
3
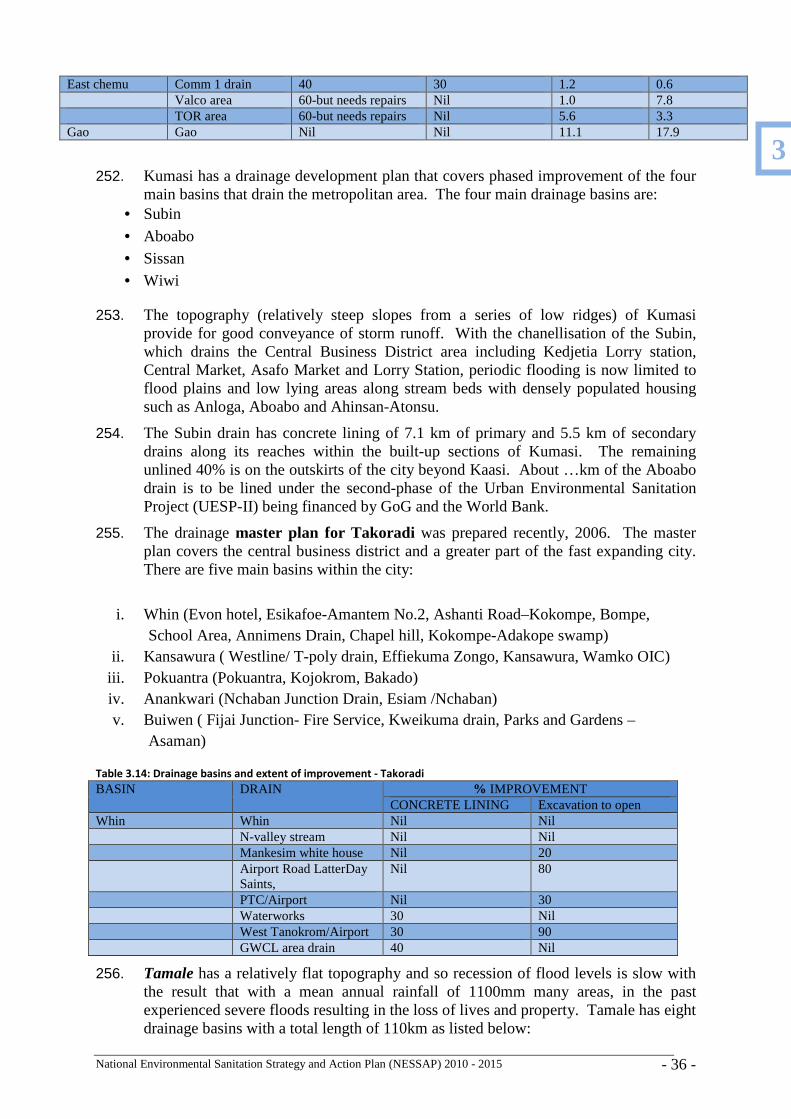
National Environmental Sanitation Strategy and Action Plan (NESSAP) 2010 - 2015 - 36 -
East chemu Comm 1 drain 40 30 1.2 0.6 Valco area 60-but needs repairs Nil 1.0 7.8 TOR area 60-but needs repairs Nil 5.6 3.3 Gao Gao Nil Nil 11.1 17.9
252. Kumasi has a drainage development plan that covers phased improvement of the four main basins that drain the metropolitan area. The four main drainage basins are:
• Subin
• Aboabo • Sissan • Wiwi
253. The topography (relatively steep slopes from a series of low ridges) of Kumasi provide for good conveyance of storm runoff. With the chanellisation of the Subin, which drains the Central Business District area including Kedjetia Lorry station, Central Market, Asafo Market and Lorry Station, periodic flooding is now limited to flood plains and low lying areas along stream beds with densely populated housing such as Anloga, Aboabo and Ahinsan-Atonsu.
254. The Subin drain has concrete lining of 7.1 km of primary and 5.5 km of secondary drains along its reaches within the built-up sections of Kumasi. The remaining unlined 40% is on the outskirts of the city beyond Kaasi. About …km of the Aboabo drain is to be lined under the second-phase of the Urban Environmental Sanitation Project (UESP-II) being financed by GoG and the World Bank.
255. The drainage master plan for Takoradi was prepared recently, 2006. The master plan covers the central business district and a greater part of the fast expanding city. There are five main basins within the city:
i. Whin (Evon hotel, Esikafoe-Amantem No.2, Ashanti Road–Kokompe, Bompe,
School Area, Annimens Drain, Chapel hill, Kokompe-Adakope swamp) ii. Kansawura ( Westline/ T-poly drain, Effiekuma Zongo, Kansawura, Wamko OIC) iii. Pokuantra (Pokuantra, Kojokrom, Bakado) iv. Anankwari (Nchaban Junction Drain, Esiam /Nchaban) v. Buiwen ( Fijai Junction- Fire Service, Kweikuma drain, Parks and Gardens –
Asaman)
Table 3.14: Drainage basins and extent of improvement - Takoradi
BASIN DRAIN % IMPROVEMENT CONCRETE LINING Excavation to open
Whin Whin Nil Nil N-valley stream Nil Nil Mankesim white house Nil 20 Airport Road LatterDay
Saints, Nil 80
PTC/Airport Nil 30 Waterworks 30 Nil West Tanokrom/Airport 30 90 GWCL area drain 40 Nil
256. Tamale has a relatively flat topography and so recession of flood levels is slow with the result that with a mean annual rainfall of 1100mm many areas, in the past experienced severe floods resulting in the loss of lives and property. Tamale has eight drainage basins with a total length of 110km as listed below:
3
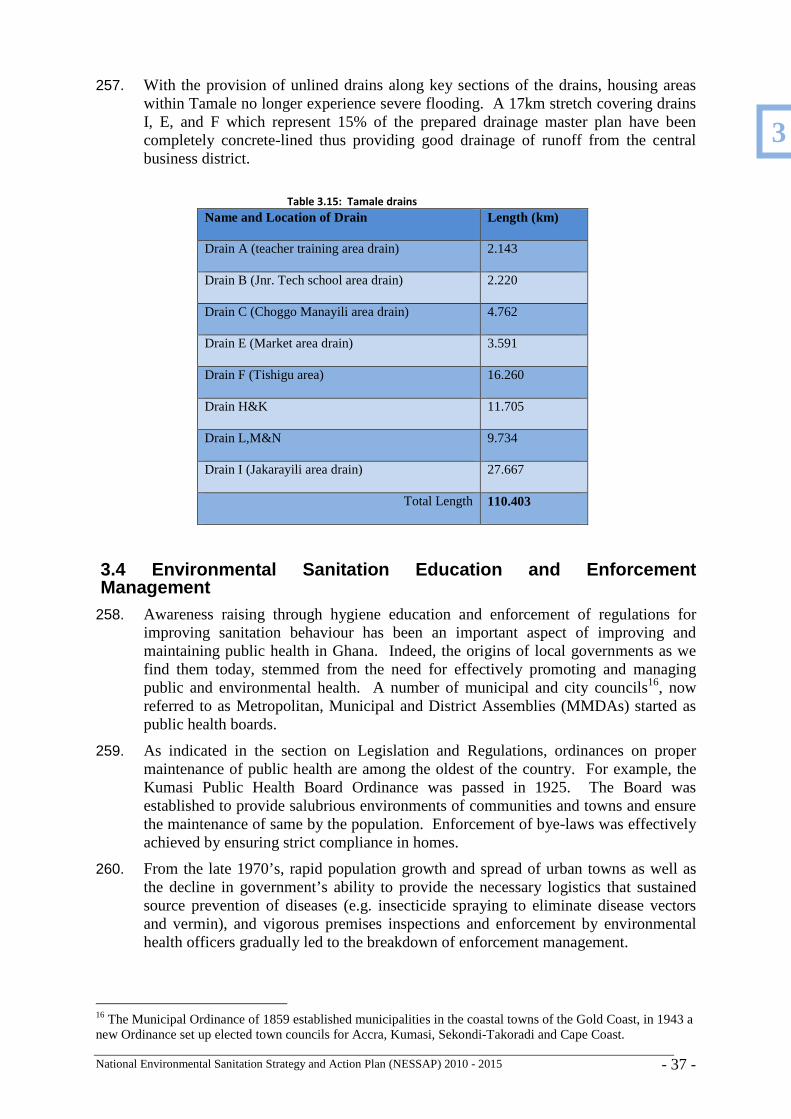
National Environmental Sanitation Strategy and Action Plan (NESSAP) 2010 - 2015 - 37 -
257. With the provision of unlined drains along key sections of the drains, housing areas within Tamale no longer experience severe flooding. A 17km stretch covering drains I, E, and F which represent 15% of the prepared drainage master plan have been completely concrete-lined thus providing good drainage of runoff from the central business district.
Table 3.15: Tamale drains
Name and Location of Drain Length (km)
Drain A (teacher training area drain) 2.143
Drain B (Jnr. Tech school area drain) 2.220
Drain C (Choggo Manayili area drain) 4.762
Drain E (Market area drain) 3.591
Drain F (Tishigu area) 16.260
Drain H&K 11.705
Drain L,M&N 9.734
Drain I (Jakarayili area drain) 27.667
Total Length 110.403
3.4 Environmental Sanitation Education and Enforcement Management
258. Awareness raising through hygiene education and enforcement of regulations for improving sanitation behaviour has been an important aspect of improving and maintaining public health in Ghana. Indeed, the origins of local governments as we find them today, stemmed from the need for effectively promoting and managing public and environmental health. A number of municipal and city councils16, now referred to as Metropolitan, Municipal and District Assemblies (MMDAs) started as public health boards.
259. As indicated in the section on Legislation and Regulations, ordinances on proper maintenance of public health are among the oldest of the country. For example, the Kumasi Public Health Board Ordinance was passed in 1925. The Board was established to provide salubrious environments of communities and towns and ensure the maintenance of same by the population. Enforcement of bye-laws was effectively achieved by ensuring strict compliance in homes.
260. From the late 1970’s, rapid population growth and spread of urban towns as well as the decline in government’s ability to provide the necessary logistics that sustained source prevention of diseases (e.g. insecticide spraying to eliminate disease vectors and vermin), and vigorous premises inspections and enforcement by environmental health officers gradually led to the breakdown of enforcement management.
16 The Municipal Ordinance of 1859 established municipalities in the coastal towns of the Gold Coast, in 1943 a new Ordinance set up elected town councils for Accra, Kumasi, Sekondi-Takoradi and Cape Coast.
3
National Environmental Sanitation Strategy and Action Plan (NESSAP) 2010 - 2015 - 38 -
261. The above situation explains, to a great extent, why only 40% (See Table 3.2) of the population have access to improved sanitation facilities at household level. The problem will remain as the lack of household-level facilities affects mainly low-income communities where majority of people, especially in urban and small towns live, and the population growth is also high.
262. The continued presence of pan-latrines in houses (4% nationally), which was banned in 1999, especially in government premises such as those belonging to the Police and MoH, further illustrates the inability of the enforcement and sanctioning system to be applied effectively.
3.4.1 Environmental Sanitation and Hygiene Promotio n
263. From late 1980’s and early 1990’s, lessons of the International Water Supply and Sanitation Decade (IWSSD, 1981 – 1990) showed the importance of households in making decisions not only on choice of technology options and how facilities are installed but also how they are used and maintained correctly. Access to improved water and sanitation implied more than simple coverage numbers but also frequency of un-impeded and sustained usage. The software aspects of environmental sanitation services have therefore received greater attention.
264. The key players in environmental health and hygiene education in Ghana are the MoH, the School Health Educatio Programme (SHEP) under Ghana Education Service (GES) of the Ministry of Education, Science and Sports (MoESS), and the MLGRD.
265. The MoH through the Health Education Unit of the Ghana Health Service (GHS) has traditionally been at the forefront of health education. The unit designs and produces various visual and audio-visual support materials to compliment health education activities of the GHS. The unit has a national office and regional offices across the country. The unit over the years has however provided support mainly to campaigns with national character.
266. Community Health Nurses on the other hand deliver a more proactive form of health education as part of their everyday work carrying regular health education activities be it at the health facilities or during outreach activities.
267. The Environmental Health and Sanitation Department of the Ministry of Local Government and Rural Development, provides oversight of all environmental health workers in the country, with 10 Regional Health and Sanitation Units providing direct facilitation and supervision of staff within the MMDAs. At the MMDA level, the Environmental Sanitation Policy (Revised 2009) has defined the Environmental Health and Management Department (EHMD) as responsible for environmental health education and related enforcement functions.
268. The bulk of the EHMD staff are field workers who are expected to ensure the management and protection of the environment so as to prevent hazards to human health, conserve natural resources and maintain pleasant surroundings. This function has traditionally been executed through the conduct of premises inspections and prosecution of offenders. However, in recent years due to reforming of environmental health education, the health promotion aspects of the department’s work have become highlighted to the detriment of the necessary incentives for enforcement.
269. The Ghana Education Service (GES) of the MoE plays a vital role in health and hygiene education. School Sanitation and Hygiene Education (SSHE) promotion is implemented under the national School Health Education Programme (SHEP).
3
National Environmental Sanitation Strategy and Action Plan (NESSAP) 2010 - 2015 - 39 -
270. The School Health Education Programme (SHEP) was instituted in 1992 after the GOG had become a signatory to the Convention on the Rights of the Child in 1992. The programme’s focus is to introduce an integrated health education on healthy school environment to complement academic components of formal education. Ensuring the availability of improved water and sanitation facilities and their proper use is also an important aspect of SHEP’s mission.
271. The Ministry of Education (MoE) plays the lead role, with technical support from Ministry of Health (MoH) and other relevant ministries, departments and agencies.
272. The key programme areas of SHEP include Sexually Transmitted Infections (STIs), HIV and AIDS prevention education, general safety, water, sanitation and hygiene, foods & nutrition, drug use and provision of school health services.
273. The basic structure for implementing the SHEP programme consists of National Office, 10 Regional Offices, at all districts and School-Based Health Coordinators and community-level School Health Committees which bring together stakeholders at the school/community level to give direction to the programme’s implementation in each school. In order to sustain capacity building of School Health Committees, District Training Teams are established and trained based on a Trainer’s Guide for School Health Committees developed by the national SHEP office17.
274. The promotion of safe storage of water through the introduction of “veronica buckets” and hand-washing with soap in schools, have been vigorously pursued with successful results.
275. Hygiene issues with clear targets, aimed at behaviour change in children, have been integrated into the syllabus of basic schools. To deepen the capacity of trainee teachers, workshops are organised for Integrated Science and Social/Environmental Studies tutors to promote the integration of hygiene and sanitation in the curriculum of Teacher Training Colleges (TTCs).
276. An assessment and review of existing IEC materials have been carried out and appropriate ones selected for reproduction, while a School Sanitation and Hygiene Education Manual has been developed based on materials employed by CWSA in carrying out hygiene education in schools.
277. SHEP is integrating the results of the 2007 Global School-based Student Health Survey (GSHS) sponsored by WHO to inform future programming to mitigate the main risk factors that teenagers in school are pre-disposed to. The GSHS measures alcohol and other drug use, sexual behaviours that contribute to HIV infection, other Sexually Transmitted Infections (STIs), and unintended pregnancy, hygiene and protective factors among others.
278. The emphasis on IEC as a focus area in the ESP (Revised, 2009) and likewise on Environmental Sanitation Education and Enforcement Management as a key component of environmental sanitation is to provide an integrated means of promoting hygiene and sanitation behavior change across all segments of society. Ensuring effective implementation of SSHE and enhancing community participation in programmes as well as the role of the SHEP constitute important strategies of the NESSAP.
279. In the rural water sector, the National Community Water and Sanitation Programme (NCWSP), launched in 1994, emphasises promotion of hygiene behaviour as a basic
17 Since 2005 the SHEP National office have facilitated the training of 600 School Health Committees in selected schools in four regions namely Eastern, Volta, Central and Greater Accra regions, and 33 District Training Teams were established and trained (2007) under the SSHE Component of WSSPSII.
3
3
National Environmental Sanitation Strategy and Action Plan (NESSAP) 2010 - 2015 - 40 -
requirement for all projects. Typically, hygiene promotion is carried out by Environmental Health Assistants (EHAs) with facilitation support offered by Extension Support Staff of the Community Water and Sanitation Agency (CWSA). The aim of hygiene promotion is to ensure safe water collection, storage and use as well as promoting improved household latrines.
280. In implementing health/hygiene education, the various players in the area have employed a variety of methods, approaches and learning materials. The most common method which has been used to disseminate health/hygiene education information by all actors has been the health/hygiene talk. The health/hygiene talk is an interactive lecture approach that allows the speaker to pass on valuable health/hygiene information or messages to a target audience.
281. This method has been the most frequently used mainly because of the ease of its use and secondly because health/hygiene has always been perceived as a specialised area and information on such issues must come from technical people. The health/hygiene talk is also frequently used in the school setting.
282. The use of visual, audio and audio-visual aids is also popular in health/hygiene education to meet the target audience mostly of children and the population living in rural and peri-urban who are unable to read. Posters, billboards, car bumper stickers, comic books, pamphlets, have been the most popular visual support materials.
283. The early days of health education were characterised by film shows at the community level, however, the cost of producing these films and the specialist equipment needed to show them affected health educator’s ability to use them over the years. It is only recently that the government has began re-equipping the Information Services Department (ISD) that it seems likely that, the use of films in health/hygiene education on a large scale might re-emerge.
284. Participatory Approaches and Social-Marketing Strategies: participatory methods like Participatory Learning and Action (PLA), SARAR and Participatory Hygiene And Sanitation Transformation (PHAST) and others are applied extensively to facilitate hygiene education especially within the water and sanitation sector. These methods emphasise the use of dialogues with the target group in facilitating the behaviour change process and the adoption of health/hygiene messages.
285. The use of these participatory methods is more popular with extension workers working with NGOs, CBOs and FBOs than with their counterparts working with mainstream government institutions like the Ghana Health Service.
286. Lately social marketing approaches have also been adopted for promoting sanitation so that sanitation options are targeted to effectively trigger demand and ignite uptake by those who need improvements by segmenting target audiences, as is often applied in marketing of popular brands of consumer items.
287. Community-Led Total Sanitation (CLTS) is emerging as one of the effective demand-responsive strategies that have the potential of igniting the involvement of all individuals and households to collectively identify the main routes of transmission of common diseases and impacts of environmental health problems. The identification of the extent of the problems and the challenges that need to be overcome in order to address the issues of poor sanitation, by community members themselves, usually serve as the initial trigger for community mobilization and action.
288. Unlike previous supply-driven approaches which have proven ineffective, CLTS is not prescriptive but embraces all the tools and approaches that enable empowerment of communities to be motivated and so take collective action, with the support of local
3
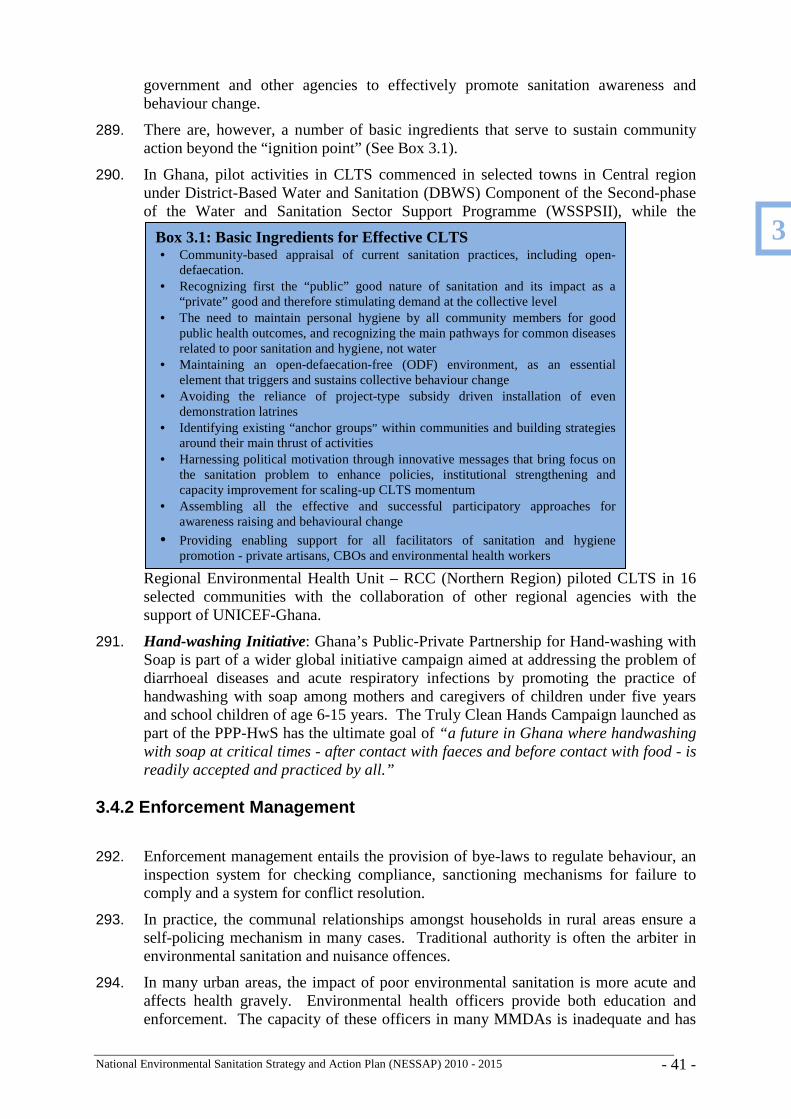
National Environmental Sanitation Strategy and Action Plan (NESSAP) 2010 - 2015 - 41 -
Box 3.1: Basic Ingredients for Effective CLTS • Community-based appraisal of current sanitation practices, including open-
defaecation. • Recognizing first the “public” good nature of sanitation and its impact as a
“private” good and therefore stimulating demand at the collective level • The need to maintain personal hygiene by all community members for good
public health outcomes, and recognizing the main pathways for common diseases related to poor sanitation and hygiene, not water
• Maintaining an open-defaecation-free (ODF) environment, as an essential element that triggers and sustains collective behaviour change
• Avoiding the reliance of project-type subsidy driven installation of even demonstration latrines
• Identifying existing “anchor groups” within communities and building strategies around their main thrust of activities
• Harnessing political motivation through innovative messages that bring focus on the sanitation problem to enhance policies, institutional strengthening and capacity improvement for scaling-up CLTS momentum
• Assembling all the effective and successful participatory approaches for awareness raising and behavioural change
• Providing enabling support for all facilitators of sanitation and hygiene promotion - private artisans, CBOs and environmental health workers
government and other agencies to effectively promote sanitation awareness and behaviour change.
289. There are, however, a number of basic ingredients that serve to sustain community action beyond the “ignition point” (See Box 3.1).
290. In Ghana, pilot activities in CLTS commenced in selected towns in Central region under District-Based Water and Sanitation (DBWS) Component of the Second-phase of the Water and Sanitation Sector Support Programme (WSSPSII), while the
Regional Environmental Health Unit – RCC (Northern Region) piloted CLTS in 16 selected communities with the collaboration of other regional agencies with the support of UNICEF-Ghana.
291. Hand-washing Initiative: Ghana’s Public-Private Partnership for Hand-washing with Soap is part of a wider global initiative campaign aimed at addressing the problem of diarrhoeal diseases and acute respiratory infections by promoting the practice of handwashing with soap among mothers and caregivers of children under five years and school children of age 6-15 years. The Truly Clean Hands Campaign launched as part of the PPP-HwS has the ultimate goal of “a future in Ghana where handwashing with soap at critical times - after contact with faeces and before contact with food - is readily accepted and practiced by all.”
3.4.2 Enforcement Management
292. Enforcement management entails the provision of bye-laws to regulate behaviour, an inspection system for checking compliance, sanctioning mechanisms for failure to comply and a system for conflict resolution.
293. In practice, the communal relationships amongst households in rural areas ensure a self-policing mechanism in many cases. Traditional authority is often the arbiter in environmental sanitation and nuisance offences.
294. In many urban areas, the impact of poor environmental sanitation is more acute and affects health gravely. Environmental health officers provide both education and enforcement. The capacity of these officers in many MMDAs is inadequate and has
3
National Environmental Sanitation Strategy and Action Plan (NESSAP) 2010 - 2015 - 42 -
resulted in nostalgic recall of the old “tankass” or “saman saman” era. The MLGRD has responded by recently deploying “sanitation guards” as part of the Sanitation Module under the National Youth Employment Programme (NYEP) and lately the implementation of the ZOIL brigade by MEST.
295. The Expanded Sanitary Inspections, Compliance Management and Enforcement (ESICOME) programme was initiated in 1999 to revisit the previously effective colonial and post-independence sanitary inspection and enforcement of bye-laws. The new scope seeks to reinforce public health education methods that were adopted from the late 1970’s which was failing to improve environmental sanitation behaviour with the necessary sanctions for non-compliance of bye-laws.
296. The ESICOME programme therefore covers premises inspection; environmental hygiene education, dissemination of sanitary information; and enforcement of sanitary regulations. The programme is designed for district-based implementation with facilitation by Regional Environmental Health and Sanitation Directorates (REHSDs).
3.5 Management of Health-Care and Special Industrial Waste s 297. Health-Care Waste refers to all the wastes, solid and liquid, generated from Health-
Care Facilities (HCFs) for the delivery of health and related services including medical, veterinary and health-research services.
298. The bulk of wastes (about 75% to 90%) generated from HCFs are generally not hazardous and are normally managed as part of municipal solid waste stream, but need to be handled carefully because of the risk of contamination. The remaining 10% to 25% is rather hazardous and requires special handling and management; pathological waste such as tissues and body fluids, pharmaceuticals, sharps (syringes, disposable scalpels, blades, etc.), non sharps (swabs, bandages, disposable medical devices, etc), chemicals (solvents, disinfectants, etc.) and radioactive materials, pose risks to handlers and personnel and those who come into contact with them if not stored, collected, transported and disposed of safely.
299. Special hazardous wastes refer to waste of hazardous nature generated from industry and some specialised commercial operations. In this NESSAP new sources of waste of indeterminate long-term effect is classified as hazardous until declassified by the relevant authority such as the EPA; included in this category are various waste-electrical and electronic equipment (WEEE), electromagnetic cards used for telephony and other identification-transactions such as Automatic-Teller-Machines (ATMs).
3
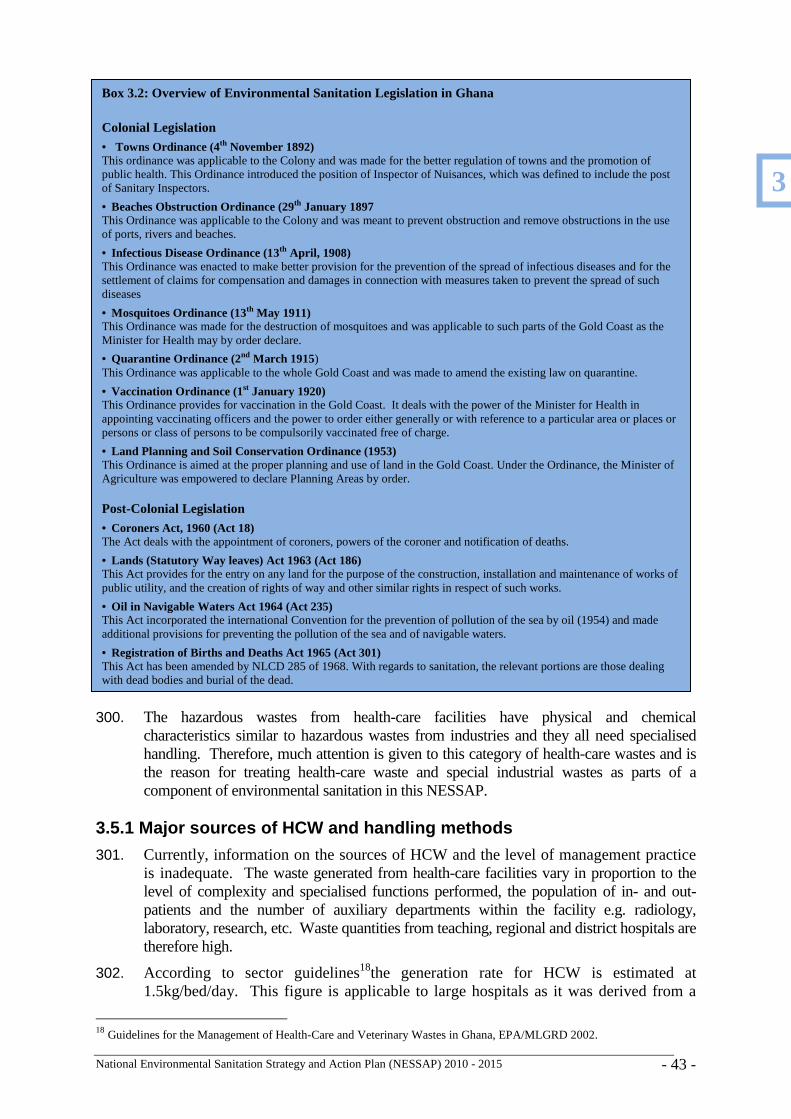
National Environmental Sanitation Strategy and Action Plan (NESSAP) 2010 - 2015 - 43 -
Box 3.2: Overview of Environmental Sanitation Legislation in Ghana
Colonial Legislation • Towns Ordinance (4th November 1892) This ordinance was applicable to the Colony and was made for the better regulation of towns and the promotion of public health. This Ordinance introduced the position of Inspector of Nuisances, which was defined to include the post of Sanitary Inspectors.
• Beaches Obstruction Ordinance (29th January 1897 This Ordinance was applicable to the Colony and was meant to prevent obstruction and remove obstructions in the use of ports, rivers and beaches.
• Infectious Disease Ordinance (13th April, 1908) This Ordinance was enacted to make better provision for the prevention of the spread of infectious diseases and for the settlement of claims for compensation and damages in connection with measures taken to prevent the spread of such diseases
• Mosquitoes Ordinance (13th May 1911) This Ordinance was made for the destruction of mosquitoes and was applicable to such parts of the Gold Coast as the Minister for Health may by order declare.
• Quarantine Ordinance (2nd March 1915) This Ordinance was applicable to the whole Gold Coast and was made to amend the existing law on quarantine.
• Vaccination Ordinance (1st January 1920) This Ordinance provides for vaccination in the Gold Coast. It deals with the power of the Minister for Health in appointing vaccinating officers and the power to order either generally or with reference to a particular area or places or persons or class of persons to be compulsorily vaccinated free of charge.
• Land Planning and Soil Conservation Ordinance (1953) This Ordinance is aimed at the proper planning and use of land in the Gold Coast. Under the Ordinance, the Minister of Agriculture was empowered to declare Planning Areas by order. Post-Colonial Legislation • Coroners Act, 1960 (Act 18) The Act deals with the appointment of coroners, powers of the coroner and notification of deaths.
• Lands (Statutory Way leaves) Act 1963 (Act 186) This Act provides for the entry on any land for the purpose of the construction, installation and maintenance of works of public utility, and the creation of rights of way and other similar rights in respect of such works.
• Oil in Navigable Waters Act 1964 (Act 235) This Act incorporated the international Convention for the prevention of pollution of the sea by oil (1954) and made additional provisions for preventing the pollution of the sea and of navigable waters.
• Registration of Births and Deaths Act 1965 (Act 301) This Act has been amended by NLCD 285 of 1968. With regards to sanitation, the relevant portions are those dealing with dead bodies and burial of the dead.
300. The hazardous wastes from health-care facilities have physical and chemical characteristics similar to hazardous wastes from industries and they all need specialised handling. Therefore, much attention is given to this category of health-care wastes and is the reason for treating health-care waste and special industrial wastes as parts of a component of environmental sanitation in this NESSAP.
3.5.1 Major sources of HCW and handling methods
301. Currently, information on the sources of HCW and the level of management practice is inadequate. The waste generated from health-care facilities vary in proportion to the level of complexity and specialised functions performed, the population of in- and out- patients and the number of auxiliary departments within the facility e.g. radiology, laboratory, research, etc. Waste quantities from teaching, regional and district hospitals are therefore high.
302. According to sector guidelines18the generation rate for HCW is estimated at 1.5kg/bed/day. This figure is applicable to large hospitals as it was derived from a
18 Guidelines for the Management of Health-Care and Veterinary Wastes in Ghana, EPA/MLGRD 2002.
3
National Environmental Sanitation Strategy and Action Plan (NESSAP) 2010 - 2015 - 44 -
survey of major hospitals in Accra19. As part of data collection towards preparation of DESSAPs information on waste generation is being collated on health-care waste from health-care facilities.
303. Health-Care Waste Management (HCWM) in HCFs is generally poor as acceptable standards for storage, collection, transport, treatment and final disposal is not adhered to. Currently, the hazardous portion of solid wastes generated is often mixed with municipal waste and collected by MMDAs or by private companies. The waste is disposed of without segregation or placement in special cells. In many HCFs pathological wastes is disposed of in underground hold tanks and pits. It is only in isolated cases that special treatment such as autoclaving and disinfection occurs prior to disposal.
304. The Ministry of Health (MoH) since 2002 has embarked on a programme of improving handling and final disposal of health-care wastes in the large teaching and regional hospitals. Table 5.20 provides a list of Regional/Specialist HCFs and the planned programmes for improving the management of health-care waste (mainly wastewater and organic fraction of refuse).
305. The main category of HCW that poses most danger is pathological waste. MoH is currently installing small-scale incinerators in district-level hospitals where the volume of pathological wastes is small and can be effectively handled in that manner.
306. In Regional and Teaching/Specialist hospitals the volumes of pathological waste is high and treatment via incineration is not adequate as pollution of the immediate environs occurs.
3.5.2 Special Industrial Wastes
307. Industrial waste refers to all categories of wastes produced as a result of industrial activity including factories, mines and mills. A large proportion of it is neither hazardous nor toxic such as wood-waste and shavings from saw-mills.
308. Special Industrial Wastes refer to the proportion of wastes from industrial (and sometimes commercial) activities that require special and expert handling and/or special disposal methods because of its quantity, concentration, physical, chemical, and/or biological characteristics. These wastes are often hazardous because they pose substantial or potential threats to public health and/or the environment due to being flammable, oxidising, corrosive, toxic, alkaline, radioactive and/or explosive.
309. They include pesticides, laboratory chemicals, industrial chemicals, spillage and waste-oils, and all related contaminated materials as well as all wastes that require special handling such as out-of-date food waste, empty aerosol cans, electrical and electronic equipment including old refrigerators, spent energy-saving CFC bulbs (contains mercury), CPUs etc.
310. Information on the major sources and categories of special industrial wastes and commonly used management methods are scantily reported by MMDAs and the regulatory agency EPA.
3.6 Effects on environment and health 311. Environmental sanitation is a major determinant for achieving improved quality of
life as it affects quality of the environmental resources on which life depends. All the
19 Report on Hospital Waste Analysis of 6 major hospitals in Accra. Waste Management Department-AMA, 1992.
3
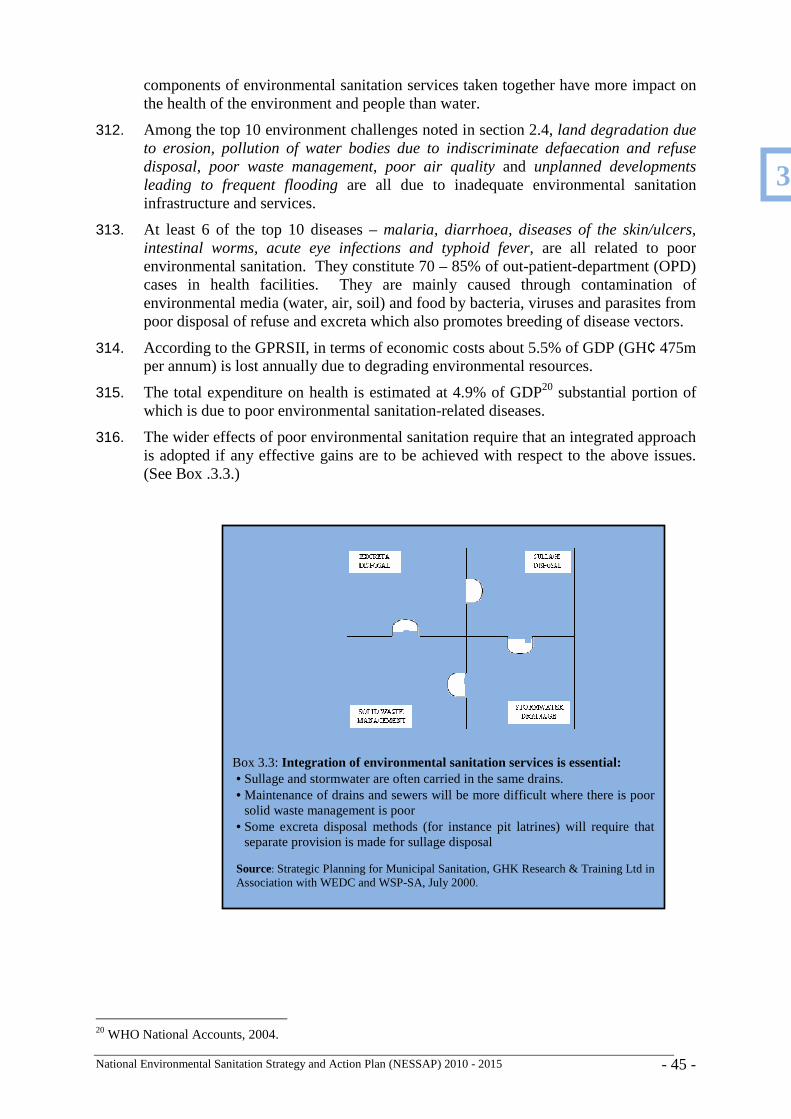
National Environmental Sanitation Strategy and Action Plan (NESSAP) 2010 - 2015 - 45 -
Box 3.3: Integration of environmental sanitation services is essential: • Sullage and stormwater are often carried in the same drains. • Maintenance of drains and sewers will be more difficult where there is poor
solid waste management is poor • Some excreta disposal methods (for instance pit latrines) will require that
separate provision is made for sullage disposal Source: Strategic Planning for Municipal Sanitation, GHK Research & Training Ltd in Association with WEDC and WSP-SA, July 2000.
components of environmental sanitation services taken together have more impact on the health of the environment and people than water.
312. Among the top 10 environment challenges noted in section 2.4, land degradation due to erosion, pollution of water bodies due to indiscriminate defaecation and refuse disposal, poor waste management, poor air quality and unplanned developments leading to frequent flooding are all due to inadequate environmental sanitation infrastructure and services.
313. At least 6 of the top 10 diseases – malaria, diarrhoea, diseases of the skin/ulcers, intestinal worms, acute eye infections and typhoid fever, are all related to poor environmental sanitation. They constitute 70 – 85% of out-patient-department (OPD) cases in health facilities. They are mainly caused through contamination of environmental media (water, air, soil) and food by bacteria, viruses and parasites from poor disposal of refuse and excreta which also promotes breeding of disease vectors.
314. According to the GPRSII, in terms of economic costs about 5.5% of GDP (GH¢ 475m per annum) is lost annually due to degrading environmental resources.
315. The total expenditure on health is estimated at 4.9% of GDP20 substantial portion of which is due to poor environmental sanitation-related diseases.
316. The wider effects of poor environmental sanitation require that an integrated approach is adopted if any effective gains are to be achieved with respect to the above issues. (See Box .3.3.)
20 WHO National Accounts, 2004.
3
National Environmental Sanitation Strategy and Action Plan (NESSAP) 2010 - 2015 - 46 -
3.6.1 Malaria
317. Malaria remains the leading killer of pregnant women and children under five. There are many methods currently applied in Ghana for malaria control including mosquito nets and insecticide treated mosquito nets; House protection with screening of windows, eaves and doors; Use of repellents, indoor residual spraying; Fumigant insecticide dispensers (such as coils) and Space spraying of insecticides.
318. The cost effective and sustainable method directly related to environmental sanitation are those that effectively lead to reduction of vector density and thus impact on vector control on the transmission potential (i.e. reproduction rate, vectorial capacity).
319. Most practical methods aiming at the reduction of vector densities require the treatment of vector breeding places, leading to their elimination or to a considerable reduction of breeding in the treated sites - these methods include all forms of larval control.
320. Source reduction by environmental management methods (or malaria sanitation) includes drainage, flushing, filling, and rendering river and lake margins unsuitable for anopheline breeding. These methods have been the classical means of malaria prevention during colonial and the period immediately after independence. In recent times, this method is being revisited, particularly, in Accra metropolis with trials in La, Taifa and other areas (the so called targeted specific breeding places of local importance). Environmental management methods are the most sustainable means of source prevention of malaria and require a sustainable source of financing for improving and securing maintenance management of facilities for stormwater and sullage conveyance.
321. Larviciding including the use of both chemical insecticides such as the toxin of Bacilus thuringiensis israelensis and those of biological origin, and insect growth regulators is also applied selectively. It requires the treatment of all breeding places and because of poor residual effect require regular and frequent applications.
322. Biological control for anophelines, is limited to the use of predators (mainly larvivorous fish), which are most effective in man-made breeding sites (e.g. ponds, or irrigation ditches).
323. The broadening of the scope of hygienic disposal of excreta to include improved wastewater and sullage management as well as all other aspects of environmental sanitation services as proposed by the Environmental Sanitation Policy (Revised, 2009) is essential for effective malaria control. Table A6 of Annex 2 indicates the distribution of reported cases of malaria by region across the country.
3.6.2 HIV/AIDS
324. HIV/AIDS continues to be a menace though there are encouraging reports of its decline in recent times. It is reported that in 2004, approximately 400,000 Ghanaians were estimated to be HIV-positive and this number is expected to reach 500,000 by 2015. The prevalence rates have increased from 2.6 percent in 2000, to 3.6 percent in 2003, and 3.1 percent in 2004.21 The prevalent rate is reported to be 2.2% by the end of 2007.
325. The National Strategic Framework 2006–2010 (NSF II) prepared by the National Aids Commission recognises the HIV/AIDS epidemic as a socio developmental
21 National AIDS/STI Control Programme, GHS, 2005
3
National Environmental Sanitation Strategy and Action Plan (NESSAP) 2010 - 2015 - 47 -
challenge and, therefore, incorporates issues dealing with recent evolutions in the epidemic, the social forces driving the epidemic, the socio-cultural environment, and the experiences from the first strategic framework 2001–2005 (NSF I). The framework provides an overall planning guide for dealing with improvements in programme supporting structures, preventing infections, targeted behaviour change programmes to the general population as well as specific vulnerable groups, treatment, care and support, and combating stigma and discrimination.
326. MMDAs and their collaborators have been working within the above general framework to achieve a number of objectives including:- to scale up targeted Behavioural Change Communication (BCC) and Information, Communication and Education (IEC) programmes; to increase knowledge levels and also raise awareness about the pandemic; to scale up social mobilization for HIV/AIDS prevention especially at the community levels; to enact and enforce policies and laws that protect the rights of People Living With HIV/AIDS (PLWHA), Orphans and Vulnerable Children (OVC) within the workplace and vulnerable groups; to engage civil society in community preparedness through relevant IE&C and BCC activities for the rollout of Anti-retroviral Testing (ART) and Voluntary Counseling and Testing (VCT).
327. For environmental sanitation services the important considerations include how the policy (and therefore the NESSAP) takes on board the key elements of the strategies being implemented by MMDAs and, in particular, ensure that service levels and standards are responsive to the needs of PLWHA. It has been established that the needs of PLWHA for sanitation and hygiene are more acute – for example, there is need for more water for drinking and for frequent bathing to reduce heat-flushes, and for medication.
328. The stigmatization that goes with HIV/AIDS is also very critical. It has been reported that in the traditional compound-house setting of low-income areas (where the bulk of people live) where shared and communal facilities are the available options, PLWHA are often either banned from use of household toilets or other householders avoid using such facilities immediately after use by PLWHA or where they have access to such facilities other householders go to great lengths to clean toilets or bathrooms with disinfectants before use.
329. Incorporating relevant strategies and activities, by MMDAs to meet the objectives of the NSFII is an important consideration of the NESSAP.
3.6.3 Climate Change and Global Warming
330. That the earth’s climate is changing with serious effects is without doubt. The uncontrollable variability of this change and its impact requires that Ghana puts in place adaptation mechanisms. While Global Warming is now receiving high-level political attention globally due to its impact there remains more to be done at the country level.
331. Proposals for limiting global warming include reducing primarily Carbon dioxide (CO2) and non-CO2 emissions of methane and black-carbon aerosols, which make up the bulk of greenhouse gases (GHGs).
332. Municipal Solid Waste Management (MSWM) has a direct impact on emission of GHGs, although proportionately it is low (in the range of 2 – 3% of GHGs globally22. Landfill gas (LFG) consists mainly of methane (CH4), carbon monoxide (CO) and
22 Sardinia 2007, Executive Summaries, R. Cossu et al. Environmental Sanitary Engineering Centre (CISA), 2007.
3
National Environmental Sanitation Strategy and Action Plan (NESSAP) 2010 - 2015 - 48 -
hydrogen sulphide (H2S). Furthermore, there are more than 2000 trace elements in this kind of biogas.
333. Through the efficient collection of landfill gas it is possible to reduce the emission of methane and carbon dioxide to the atmosphere and to avoid pollution and unpleasant odours as well as dangerous gas explosions. For example, improving landfill cover by exploiting natural processes of microbial methane oxidation is an inexpensive way of reducing methane emissions from landfills. This process can be enhanced by using compost as landfill cover which further improves the conditions for methanotrophic bacteria to thrive.
334. The Clean Development Mechanism (CDM) was developed to commit developed economies in achieving targets set under the Kyoto Protocol23 more effectively. The CDM, defined in Article 12 of the Protocol, allows a country with an emission-reduction or emission-limitation commitment under the Kyoto Protocol to implement an emission-reduction project in developing countries. Such projects can earn saleable certified emission reduction (CER) credits, each equivalent to one tonne of CO2, which can be counted towards meeting Kyoto targets.
335. Simply, a CDM24 project involves an industrialised country paying for projects that reduce or avoid emissions in poorer nations and therefore earn (or buy back) credits that can be applied to meeting their own (industrialised country) emission targets.
336. A typical CDM project potentially reduces net GHG emissions into the atmosphere through collection and combustion of LFG (methane) by financing an engineered landfill and upgrading current waste management practices. A variation for reducing greenhouse gases is to use the collected methane gas for a waste-to-energy (WtE) plant which substitutes combustion of fossil fuel for energy production. The net emission reduction achieved by energy utilization is however limited compared to flaring of methane only.
337. Information about past waste management practices is necessary for the estimation of methane emissions from refuse dumps because the emissions of today are the result of waste disposal years or decades ago. So without proper historical records on volumes and composition of waste streams it is difficult to estimate the environmental effects from management of municipal waste. Currently, there are only two-engineered landfills in Ghana and over 15,000 uncontrolled open dump sites with accompanied open burning.
338. The MTDPF (2010-2013) and the Environmental Sanitation Policy (Revised, 2009) emphasise improvements in disposal sites and R&D that will lead to more information on all waste streams.
339. Climate change has the effect of making weather patterns unpredictable. In extreme cases the impacts are either severe flooding which causes all types of wastes handling and treatment systems ineffective or drought affecting sources of water for basic drinking and for maintaining basic sanitation.
23 The Kyoto Protocol is an international agreement linked to the United Nations Framework Convention on Climate Change. The protocol was adopted in Kyoto, Japan, on 11 December 1997 and entered into force on 16 February 2005. 24 The EPA as the the Designated National Authority (DNA) on CDM has prepared a working document “The Clean Development Mechanism in Ghana” to guide implementation of potential projects.
3
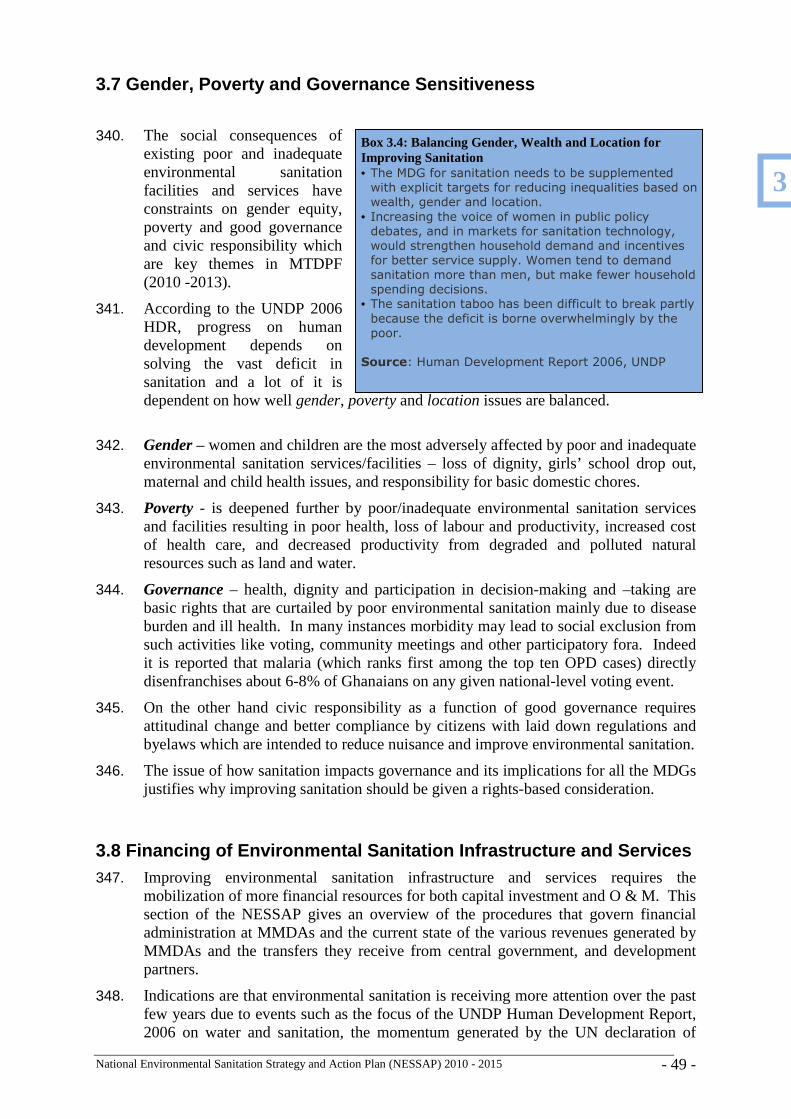
National Environmental Sanitation Strategy and Action Plan (NESSAP) 2010 - 2015 - 49 -
Box 3.4: Balancing Gender, Wealth and Location for Improving Sanitation • The MDG for sanitation needs to be supplemented
with explicit targets for reducing inequalities based on
wealth, gender and location.
• Increasing the voice of women in public policy
debates, and in markets for sanitation technology,
would strengthen household demand and incentives
for better service supply. Women tend to demand
sanitation more than men, but make fewer household
spending decisions.
• The sanitation taboo has been difficult to break partly because the deficit is borne overwhelmingly by the
poor.
Source: Human Development Report 2006, UNDP
3.7 Gender, Poverty and Governance Sensitiveness
340. The social consequences of existing poor and inadequate environmental sanitation facilities and services have constraints on gender equity, poverty and good governance and civic responsibility which are key themes in MTDPF (2010 -2013).
341. According to the UNDP 2006 HDR, progress on human development depends on solving the vast deficit in sanitation and a lot of it is dependent on how well gender, poverty and location issues are balanced.
342. Gender – women and children are the most adversely affected by poor and inadequate environmental sanitation services/facilities – loss of dignity, girls’ school drop out, maternal and child health issues, and responsibility for basic domestic chores.
343. Poverty - is deepened further by poor/inadequate environmental sanitation services and facilities resulting in poor health, loss of labour and productivity, increased cost of health care, and decreased productivity from degraded and polluted natural resources such as land and water.
344. Governance – health, dignity and participation in decision-making and –taking are basic rights that are curtailed by poor environmental sanitation mainly due to disease burden and ill health. In many instances morbidity may lead to social exclusion from such activities like voting, community meetings and other participatory fora. Indeed it is reported that malaria (which ranks first among the top ten OPD cases) directly disenfranchises about 6-8% of Ghanaians on any given national-level voting event.
345. On the other hand civic responsibility as a function of good governance requires attitudinal change and better compliance by citizens with laid down regulations and byelaws which are intended to reduce nuisance and improve environmental sanitation.
346. The issue of how sanitation impacts governance and its implications for all the MDGs justifies why improving sanitation should be given a rights-based consideration.
3.8 Financing of Environmental Sanitation Infrastructure and Servi ces 347. Improving environmental sanitation infrastructure and services requires the
mobilization of more financial resources for both capital investment and O & M. This section of the NESSAP gives an overview of the procedures that govern financial administration at MMDAs and the current state of the various revenues generated by MMDAs and the transfers they receive from central government, and development partners.
348. Indications are that environmental sanitation is receiving more attention over the past few years due to events such as the focus of the UNDP Human Development Report, 2006 on water and sanitation, the momentum generated by the UN declaration of
3
National Environmental Sanitation Strategy and Action Plan (NESSAP) 2010 - 2015 - 50 -
2008 as the International Year of Sanitation (IYS), and the advocacy gains of strategies such as CLTS.
349. The recently developed Sanitation and Water for ALL: a Global Framework of Action (SWA) is a source of further support to those countries, including Ghana, that are currently “off-track” in terms of meeting the MDG Target 7c.
350. The increased attention makes it important that fiscal management at MMDAs is examined critically in order to identify and recommend potential sources of financing for achieving the incremental improvements in environmental sanitation infrastructure and related operation and maintenance management of services.
3.8.1 Legal framework on Local Government Finance
351. The legal framework that guides MMDAs in their financial management of resources includes the following.
• The District Assemblies Common Fund Act, 1993(Act 455) with updated guidelines • Ghana Audit Act, 2000(Act 584) • Local Government Service Act,2003 (Act 656) • Public Procurement Act, 2003 (Act 663) • Internal Audit Agency Act, 2003 (Act 658) • Financial Administration Act, 2003 (Act 654) • Financial Administration Regulation, 2004 (LI 1802) • Financial Memoranda for Metropolitan, Municipal and District Assembly of 1961,
revised in June 2004, • Internal Revenue Act, 2005(Regulation of Business, Act 684) • Composite Budget Guidelines (under review by MLGRD) • Guideline for preparation of budgets • Guidelines for preparation of District Medium Term Development Plan, January 2006
(by NDPC)
352. The above legislations give further direction to MMDAs in exercising their mandates as provided in the Local Government Act, 1993 (Act 462) and the National Development Planning System Act, 1994 (Act 480).
353. The Financial Administration Act, 2003(Act 654) and Financial Administration Regulation, 2004 (LI 1802) provide the framework for the Financial Accountability System for Ministries, Departments and Agencies as well as MMDAs. Act 654 mandates the Ministry of Finance and Economic Planning (MoFEP) in the preparation of the fiscal policy of government for presentation to parliament for ratification.
354. The Controller and Accountant General’s Department (CAGD) by law is the primary disbursement agency of the government.
355. The Financial Memoranda (2004) for MMDAs defines and complements both the Financial Administration Regulation LI 1802 and the Local Government Act 642 and defines control systems with respect to revenue and expenditure.
3
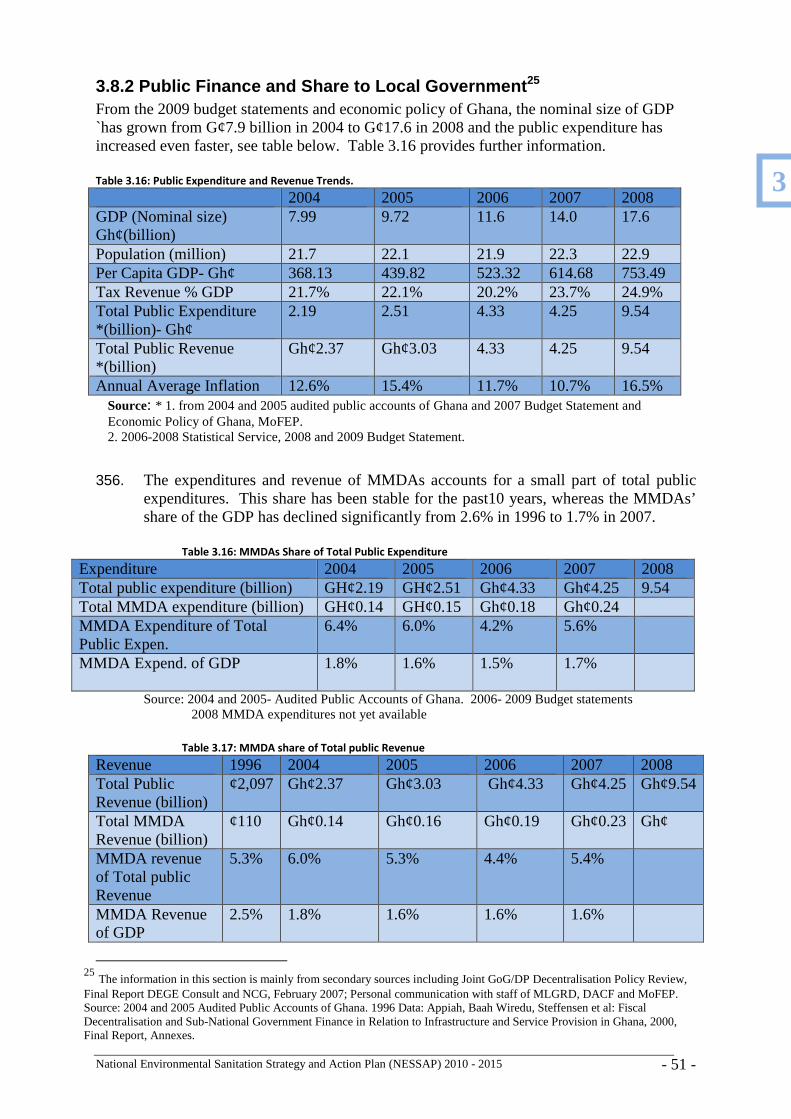
National Environmental Sanitation Strategy and Action Plan (NESSAP) 2010 - 2015 - 51 -
3.8.2 Public Finance and Share to Local Government 25 From the 2009 budget statements and economic policy of Ghana, the nominal size of GDP `has grown from G¢7.9 billion in 2004 to G¢17.6 in 2008 and the public expenditure has increased even faster, see table below. Table 3.16 provides further information. Table 3.16: Public Expenditure and Revenue Trends.
2004 2005 2006 2007 2008 GDP (Nominal size) Gh¢(billion)
7.99 9.72 11.6 14.0 17.6
Population (million) 21.7 22.1 21.9 22.3 22.9 Per Capita GDP- Gh¢ 368.13 439.82 523.32 614.68 753.49 Tax Revenue % GDP 21.7% 22.1% 20.2% 23.7% 24.9% Total Public Expenditure *(billion)- Gh¢
2.19 2.51 4.33 4.25 9.54
Total Public Revenue *(billion)
Gh¢2.37 Gh¢3.03 4.33 4.25 9.54
Annual Average Inflation 12.6% 15.4% 11.7% 10.7% 16.5% Source: * 1. from 2004 and 2005 audited public accounts of Ghana and 2007 Budget Statement and Economic Policy of Ghana, MoFEP. 2. 2006-2008 Statistical Service, 2008 and 2009 Budget Statement.
356. The expenditures and revenue of MMDAs accounts for a small part of total public expenditures. This share has been stable for the past10 years, whereas the MMDAs’ share of the GDP has declined significantly from 2.6% in 1996 to 1.7% in 2007.
Table 3.16: MMDAs Share of Total Public Expenditure
Expenditure 2004 2005 2006 2007 2008 Total public expenditure (billion) GH¢2.19 GH¢2.51 Gh¢4.33 Gh¢4.25 9.54 Total MMDA expenditure (billion) GH¢0.14 GH¢0.15 Gh¢0.18 Gh¢0.24 MMDA Expenditure of Total Public Expen.
6.4% 6.0% 4.2% 5.6%
MMDA Expend. of GDP 1.8% 1.6% 1.5% 1.7%
Source: 2004 and 2005- Audited Public Accounts of Ghana. 2006- 2009 Budget statements 2008 MMDA expenditures not yet available
Table 3.17: MMDA share of Total public Revenue
Revenue 1996 2004 2005 2006 2007 2008 Total Public Revenue (billion)
¢2,097 Gh¢2.37 Gh¢3.03 Gh¢4.33 Gh¢4.25 Gh¢9.54
Total MMDA Revenue (billion)
¢110 Gh¢0.14 Gh¢0.16 Gh¢0.19 Gh¢0.23 Gh¢
MMDA revenue of Total public Revenue
5.3% 6.0% 5.3% 4.4% 5.4%
MMDA Revenue of GDP
2.5% 1.8% 1.6% 1.6% 1.6%
25 The information in this section is mainly from secondary sources including Joint GoG/DP Decentralisation Policy Review, Final Report DEGE Consult and NCG, February 2007; Personal communication with staff of MLGRD, DACF and MoFEP. Source: 2004 and 2005 Audited Public Accounts of Ghana. 1996 Data: Appiah, Baah Wiredu, Steffensen et al: Fiscal Decentralisation and Sub-National Government Finance in Relation to Infrastructure and Service Provision in Ghana, 2000, Final Report, Annexes.
3
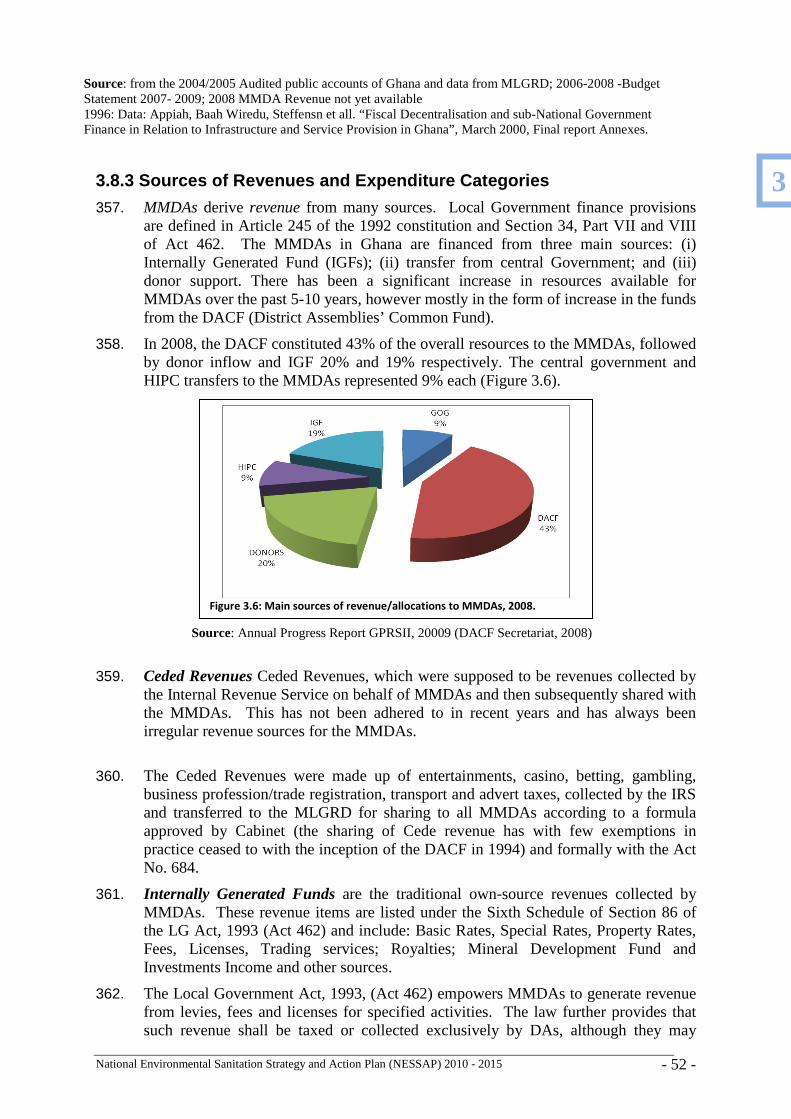
National Environmental Sanitation Strategy and Action Plan (NESSAP) 2010 - 2015 - 52 -
Source: from the 2004/2005 Audited public accounts of Ghana and data from MLGRD; 2006-2008 -Budget Statement 2007- 2009; 2008 MMDA Revenue not yet available 1996: Data: Appiah, Baah Wiredu, Steffensn et all. “Fiscal Decentralisation and sub-National Government Finance in Relation to Infrastructure and Service Provision in Ghana”, March 2000, Final report Annexes.
3.8.3 Sources of Revenues and Expenditure Categorie s
357. MMDAs derive revenue from many sources. Local Government finance provisions are defined in Article 245 of the 1992 constitution and Section 34, Part VII and VIII of Act 462. The MMDAs in Ghana are financed from three main sources: (i) Internally Generated Fund (IGFs); (ii) transfer from central Government; and (iii) donor support. There has been a significant increase in resources available for MMDAs over the past 5-10 years, however mostly in the form of increase in the funds from the DACF (District Assemblies’ Common Fund).
358. In 2008, the DACF constituted 43% of the overall resources to the MMDAs, followed by donor inflow and IGF 20% and 19% respectively. The central government and HIPC transfers to the MMDAs represented 9% each (Figure 3.6).
Source: Annual Progress Report GPRSII, 20009 (DACF Secretariat, 2008)
359. Ceded Revenues Ceded Revenues, which were supposed to be revenues collected by the Internal Revenue Service on behalf of MMDAs and then subsequently shared with the MMDAs. This has not been adhered to in recent years and has always been irregular revenue sources for the MMDAs.
360. The Ceded Revenues were made up of entertainments, casino, betting, gambling, business profession/trade registration, transport and advert taxes, collected by the IRS and transferred to the MLGRD for sharing to all MMDAs according to a formula approved by Cabinet (the sharing of Cede revenue has with few exemptions in practice ceased to with the inception of the DACF in 1994) and formally with the Act No. 684.
361. Internally Generated Funds are the traditional own-source revenues collected by MMDAs. These revenue items are listed under the Sixth Schedule of Section 86 of the LG Act, 1993 (Act 462) and include: Basic Rates, Special Rates, Property Rates, Fees, Licenses, Trading services; Royalties; Mineral Development Fund and Investments Income and other sources.
362. The Local Government Act, 1993, (Act 462) empowers MMDAs to generate revenue from levies, fees and licenses for specified activities. The law further provides that such revenue shall be taxed or collected exclusively by DAs, although they may
Figure 3.6: Main sources of revenue/allocations to MMDAs, 2008.
3
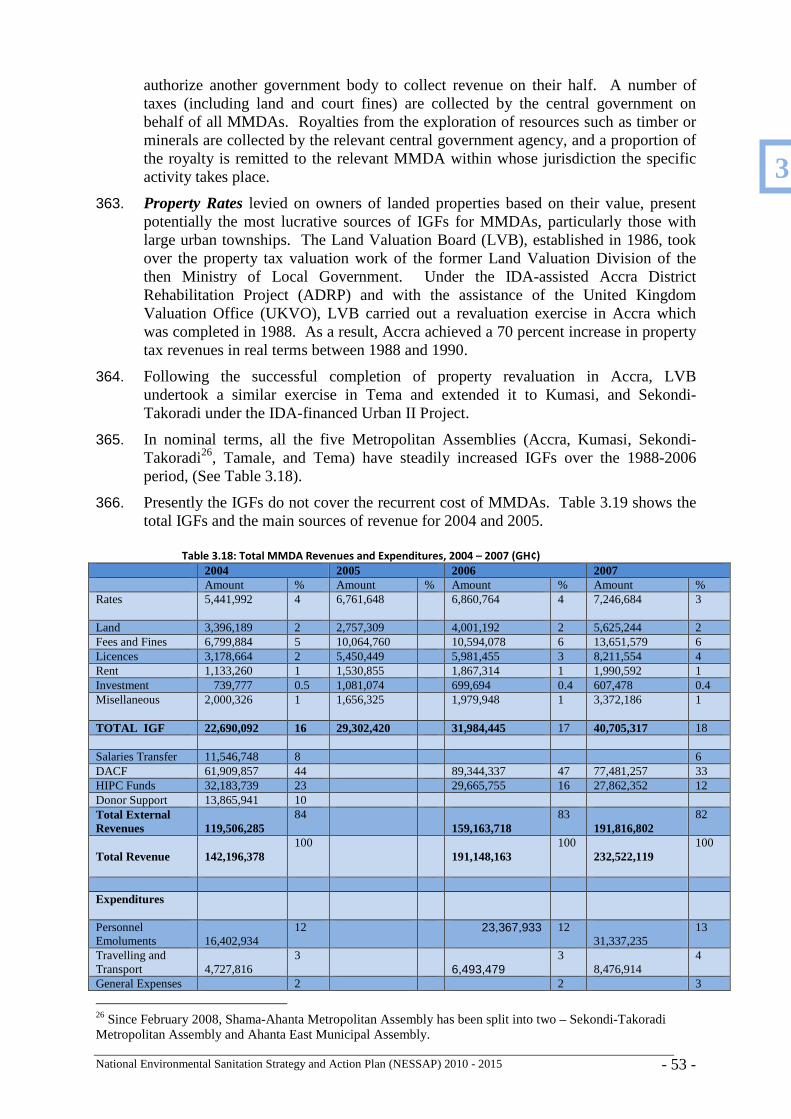
National Environmental Sanitation Strategy and Action Plan (NESSAP) 2010 - 2015 - 53 -
authorize another government body to collect revenue on their half. A number of taxes (including land and court fines) are collected by the central government on behalf of all MMDAs. Royalties from the exploration of resources such as timber or minerals are collected by the relevant central government agency, and a proportion of the royalty is remitted to the relevant MMDA within whose jurisdiction the specific activity takes place.
363. Property Rates levied on owners of landed properties based on their value, present potentially the most lucrative sources of IGFs for MMDAs, particularly those with large urban townships. The Land Valuation Board (LVB), established in 1986, took over the property tax valuation work of the former Land Valuation Division of the then Ministry of Local Government. Under the IDA-assisted Accra District Rehabilitation Project (ADRP) and with the assistance of the United Kingdom Valuation Office (UKVO), LVB carried out a revaluation exercise in Accra which was completed in 1988. As a result, Accra achieved a 70 percent increase in property tax revenues in real terms between 1988 and 1990.
364. Following the successful completion of property revaluation in Accra, LVB undertook a similar exercise in Tema and extended it to Kumasi, and Sekondi-Takoradi under the IDA-financed Urban II Project.
365. In nominal terms, all the five Metropolitan Assemblies (Accra, Kumasi, Sekondi-Takoradi26, Tamale, and Tema) have steadily increased IGFs over the 1988-2006 period, (See Table 3.18).
366. Presently the IGFs do not cover the recurrent cost of MMDAs. Table 3.19 shows the total IGFs and the main sources of revenue for 2004 and 2005.
Table 3.18: Total MMDA Revenues and Expenditures, 2004 – 2007 (GH¢)
2004 2005 2006 2007 Amount % Amount % Amount % Amount % Rates 5,441,992 4
6,761,648 6,860,764 4 7,246,684 3
Land 3,396,189 2 2,757,309 4,001,192 2 5,625,244 2 Fees and Fines 6,799,884 5 10,064,760 10,594,078 6 13,651,579 6 Licences 3,178,664 2 5,450,449 5,981,455 3 8,211,554 4 Rent 1,133,260 1 1,530,855 1,867,314 1 1,990,592 1 Investment 739,777 0.5 1,081,074 699,694 0.4 607,478 0.4 Misellaneous 2,000,326 1 1,656,325 1,979,948 1 3,372,186
1
TOTAL IGF 22,690,092 16 29,302,420 31,984,445 17 40,705,317 18 Salaries Transfer 11,546,748 8 6 DACF 61,909,857 44 89,344,337 47 77,481,257 33 HIPC Funds 32,183,739 23 29,665,755 16 27,862,352 12 Donor Support 13,865,941 10 Total External Revenues
119,506,285
84 159,163,718
83 191,816,802
82
Total Revenue
142,196,378
100 191,148,163
100 232,522,119
100
Expenditures
Personnel Emoluments
16,402,934
12 23,367,933 12 31,337,235
13
Travelling and Transport
4,727,816
3 6,493,479
3 8,476,914
4
General Expenses 2 2 3
26 Since February 2008, Shama-Ahanta Metropolitan Assembly has been split into two – Sekondi-Takoradi Metropolitan Assembly and Ahanta East Municipal Assembly.
3
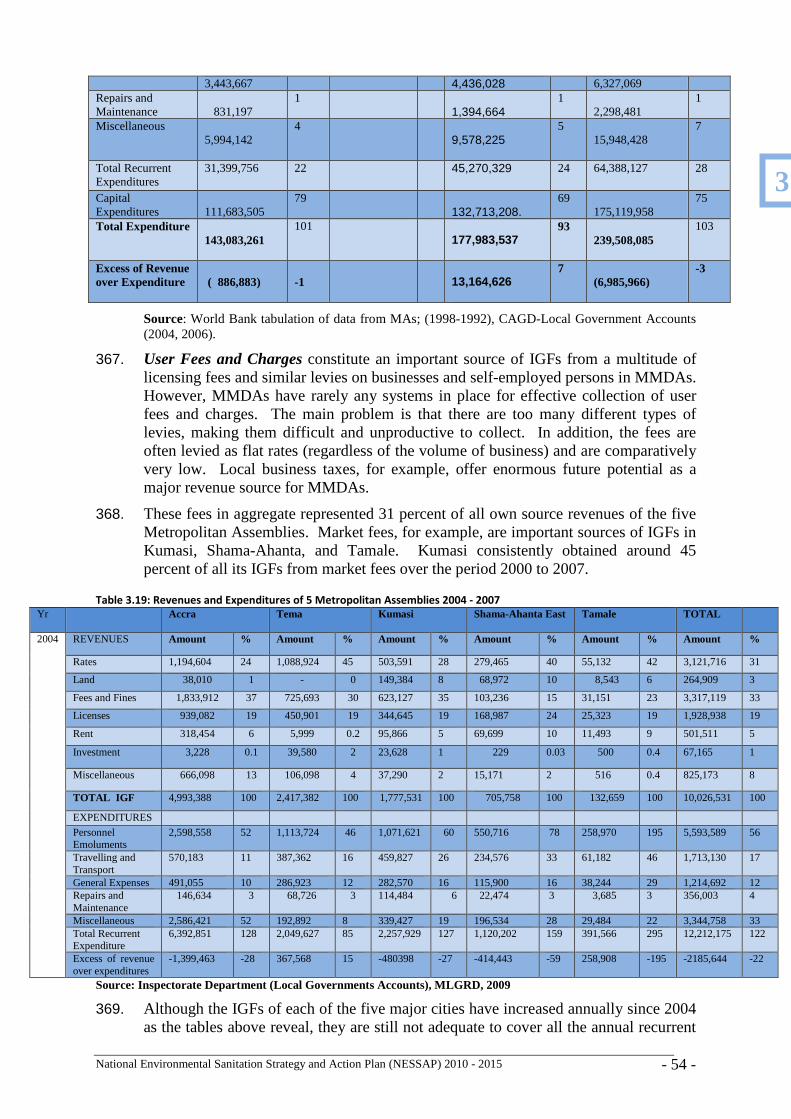
National Environmental Sanitation Strategy and Action Plan (NESSAP) 2010 - 2015 - 54 -
3,443,667 4,436,028 6,327,069 Repairs and Maintenance
831,197
1 1,394,664
1 2,298,481
1
Miscellaneous 5,994,142
4 9,578,225
5 15,948,428
7
Total Recurrent Expenditures
31,399,756 22 45,270,329
24 64,388,127 28
Capital Expenditures
111,683,505
79 132,713,208.
69 175,119,958
75
Total Expenditure 143,083,261
101 177,983,537
93 239,508,085
103
Excess of Revenue over Expenditure
( 886,883)
-1
13,164,626
7 (6,985,966)
-3
Source: World Bank tabulation of data from MAs; (1998-1992), CAGD-Local Government Accounts (2004, 2006).
367. User Fees and Charges constitute an important source of IGFs from a multitude of licensing fees and similar levies on businesses and self-employed persons in MMDAs. However, MMDAs have rarely any systems in place for effective collection of user fees and charges. The main problem is that there are too many different types of levies, making them difficult and unproductive to collect. In addition, the fees are often levied as flat rates (regardless of the volume of business) and are comparatively very low. Local business taxes, for example, offer enormous future potential as a major revenue source for MMDAs.
368. These fees in aggregate represented 31 percent of all own source revenues of the five Metropolitan Assemblies. Market fees, for example, are important sources of IGFs in Kumasi, Shama-Ahanta, and Tamale. Kumasi consistently obtained around 45 percent of all its IGFs from market fees over the period 2000 to 2007.
Table 3.19: Revenues and Expenditures of 5 Metropolitan Assemblies 2004 - 2007
Yr
Accra Tema Kumasi Shama-Ahanta East Tamale TOTAL
2004 REVENUES Amount % Amount % Amount % Amount % Amount % Amount %
Rates 1,194,604 24 1,088,924 45 503,591 28 279,465 40 55,132 42 3,121,716 31
Land 38,010 1 - 0 149,384 8 68,972 10 8,543 6 264,909 3
Fees and Fines 1,833,912 37 725,693 30 623,127 35 103,236 15 31,151 23 3,317,119 33
Licenses 939,082 19 450,901 19 344,645 19 168,987 24 25,323 19 1,928,938 19
Rent 318,454 6 5,999 0.2 95,866 5 69,699 10 11,493 9 501,511 5
Investment 3,228 0.1 39,580 2 23,628 1 229 0.03 500 0.4 67,165 1
Miscellaneous 666,098 13 106,098 4 37,290 2 15,171 2 516 0.4 825,173 8
TOTAL IGF 4,993,388 100 2,417,382 100 1,777,531 100 705,758 100 132,659 100 10,026,531 100
EXPENDITURES
Personnel Emoluments
2,598,558 52 1,113,724 46 1,071,621 60 550,716 78 258,970 195 5,593,589 56
Travelling and Transport
570,183 11 387,362 16 459,827 26 234,576 33 61,182 46 1,713,130 17
General Expenses 491,055 10 286,923 12 282,570 16 115,900 16 38,244 29 1,214,692 12 Repairs and Maintenance
146,634 3 68,726 3 114,484 6 22,474 3 3,685 3 356,003 4
Miscellaneous 2,586,421 52 192,892 8 339,427 19 196,534 28 29,484 22 3,344,758 33 Total Recurrent Expenditure
6,392,851 128 2,049,627 85 2,257,929 127 1,120,202 159 391,566 295 12,212,175 122
Excess of revenue over expenditures
-1,399,463 -28 367,568 15 -480398 -27 -414,443 -59 258,908 -195 -2185,644 -22
Source: Inspectorate Department (Local Governments Accounts), MLGRD, 2009
369. Although the IGFs of each of the five major cities have increased annually since 2004 as the tables above reveal, they are still not adequate to cover all the annual recurrent
3
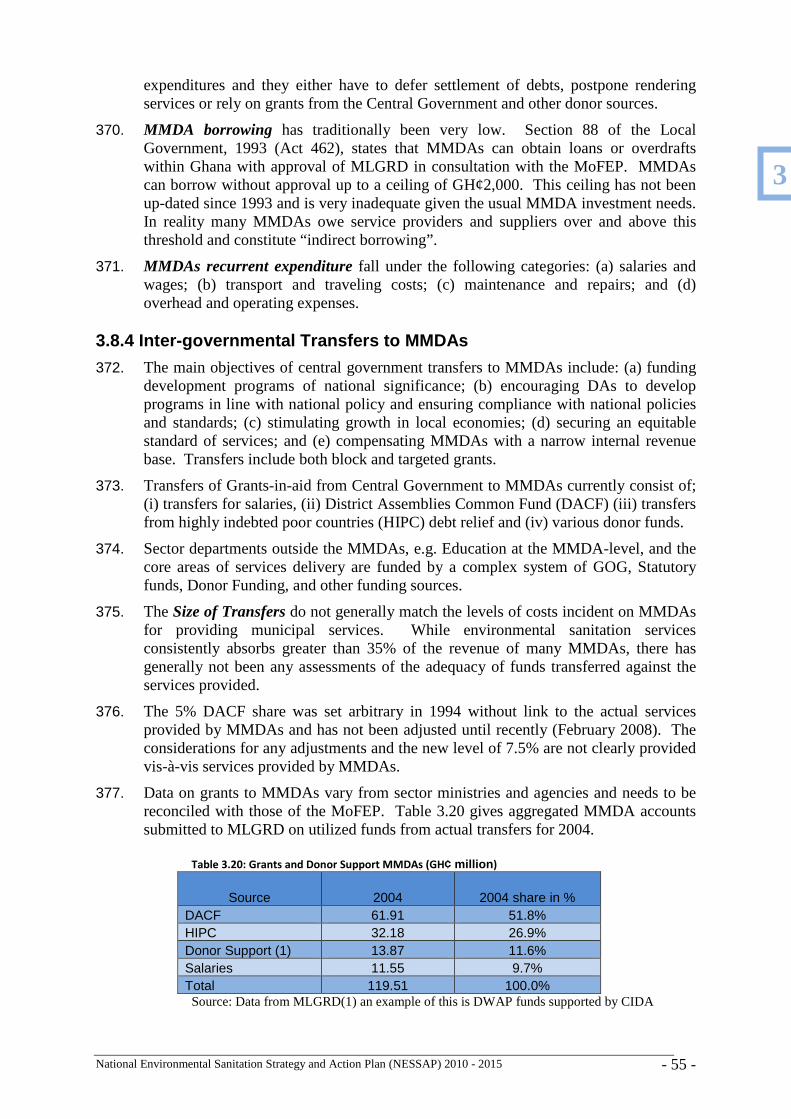
National Environmental Sanitation Strategy and Action Plan (NESSAP) 2010 - 2015 - 55 -
expenditures and they either have to defer settlement of debts, postpone rendering services or rely on grants from the Central Government and other donor sources.
370. MMDA borrowing has traditionally been very low. Section 88 of the Local Government, 1993 (Act 462), states that MMDAs can obtain loans or overdrafts within Ghana with approval of MLGRD in consultation with the MoFEP. MMDAs can borrow without approval up to a ceiling of GH¢2,000. This ceiling has not been up-dated since 1993 and is very inadequate given the usual MMDA investment needs. In reality many MMDAs owe service providers and suppliers over and above this threshold and constitute “indirect borrowing”.
371. MMDAs recurrent expenditure fall under the following categories: (a) salaries and wages; (b) transport and traveling costs; (c) maintenance and repairs; and (d) overhead and operating expenses.
3.8.4 Inter-governmental Transfers to MMDAs
372. The main objectives of central government transfers to MMDAs include: (a) funding development programs of national significance; (b) encouraging DAs to develop programs in line with national policy and ensuring compliance with national policies and standards; (c) stimulating growth in local economies; (d) securing an equitable standard of services; and (e) compensating MMDAs with a narrow internal revenue base. Transfers include both block and targeted grants.
373. Transfers of Grants-in-aid from Central Government to MMDAs currently consist of; (i) transfers for salaries, (ii) District Assemblies Common Fund (DACF) (iii) transfers from highly indebted poor countries (HIPC) debt relief and (iv) various donor funds.
374. Sector departments outside the MMDAs, e.g. Education at the MMDA-level, and the core areas of services delivery are funded by a complex system of GOG, Statutory funds, Donor Funding, and other funding sources.
375. The Size of Transfers do not generally match the levels of costs incident on MMDAs for providing municipal services. While environmental sanitation services consistently absorbs greater than 35% of the revenue of many MMDAs, there has generally not been any assessments of the adequacy of funds transferred against the services provided.
376. The 5% DACF share was set arbitrary in 1994 without link to the actual services provided by MMDAs and has not been adjusted until recently (February 2008). The considerations for any adjustments and the new level of 7.5% are not clearly provided vis-à-vis services provided by MMDAs.
377. Data on grants to MMDAs vary from sector ministries and agencies and needs to be reconciled with those of the MoFEP. Table 3.20 gives aggregated MMDA accounts submitted to MLGRD on utilized funds from actual transfers for 2004.
Table 3.20: Grants and Donor Support MMDAs (GH¢ million )
Source 2004 2004 share in % DACF 61.91 51.8% HIPC 32.18 26.9% Donor Support (1) 13.87 11.6% Salaries 11.55 9.7% Total 119.51 100.0%
Source: Data from MLGRD(1) an example of this is DWAP funds supported by CIDA
3
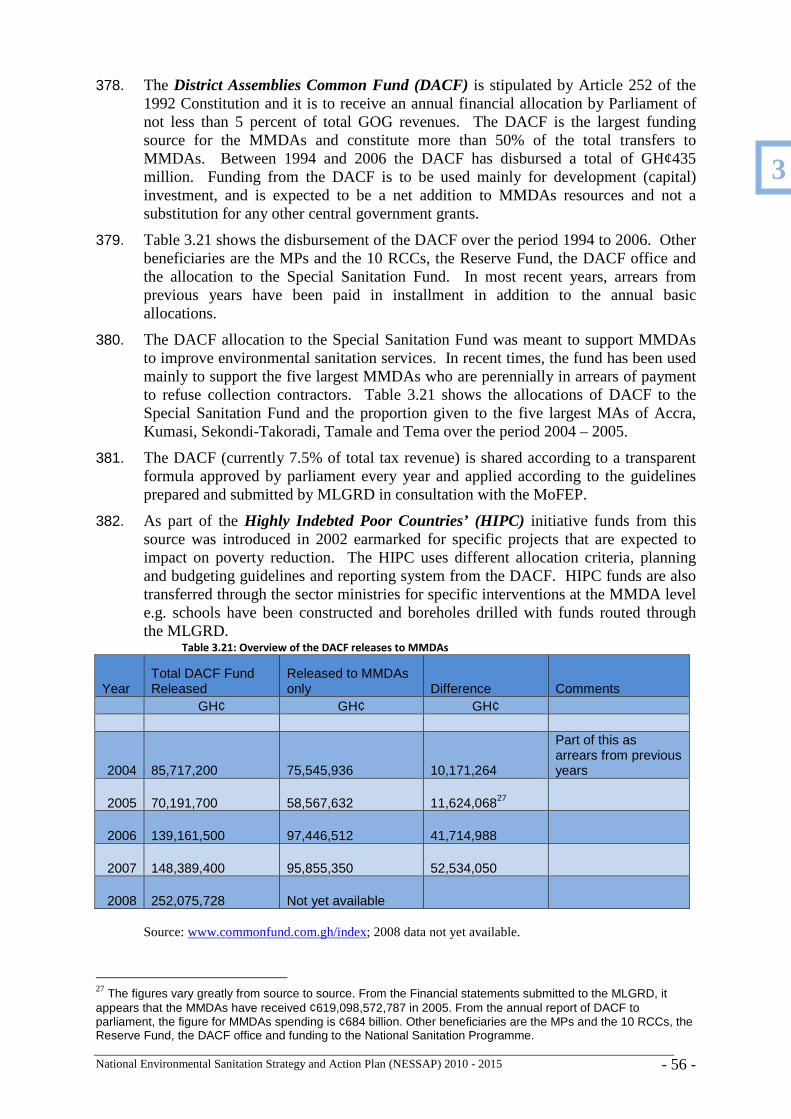
National Environmental Sanitation Strategy and Action Plan (NESSAP) 2010 - 2015 - 56 -
378. The District Assemblies Common Fund (DACF) is stipulated by Article 252 of the 1992 Constitution and it is to receive an annual financial allocation by Parliament of not less than 5 percent of total GOG revenues. The DACF is the largest funding source for the MMDAs and constitute more than 50% of the total transfers to MMDAs. Between 1994 and 2006 the DACF has disbursed a total of GH¢435 million. Funding from the DACF is to be used mainly for development (capital) investment, and is expected to be a net addition to MMDAs resources and not a substitution for any other central government grants.
379. Table 3.21 shows the disbursement of the DACF over the period 1994 to 2006. Other beneficiaries are the MPs and the 10 RCCs, the Reserve Fund, the DACF office and the allocation to the Special Sanitation Fund. In most recent years, arrears from previous years have been paid in installment in addition to the annual basic allocations.
380. The DACF allocation to the Special Sanitation Fund was meant to support MMDAs to improve environmental sanitation services. In recent times, the fund has been used mainly to support the five largest MMDAs who are perennially in arrears of payment to refuse collection contractors. Table 3.21 shows the allocations of DACF to the Special Sanitation Fund and the proportion given to the five largest MAs of Accra, Kumasi, Sekondi-Takoradi, Tamale and Tema over the period 2004 – 2005.
381. The DACF (currently 7.5% of total tax revenue) is shared according to a transparent formula approved by parliament every year and applied according to the guidelines prepared and submitted by MLGRD in consultation with the MoFEP.
382. As part of the Highly Indebted Poor Countries’ (HIPC) initiative funds from this source was introduced in 2002 earmarked for specific projects that are expected to impact on poverty reduction. The HIPC uses different allocation criteria, planning and budgeting guidelines and reporting system from the DACF. HIPC funds are also transferred through the sector ministries for specific interventions at the MMDA level e.g. schools have been constructed and boreholes drilled with funds routed through the MLGRD.
Table 3.21: Overview of the DACF releases to MMDAs
Year Total DACF Fund Released
Released to MMDAs only Difference Comments
GH¢ GH¢ GH¢
2004 85,717,200 75,545,936 10,171,264
Part of this as arrears from previous years
2005 70,191,700 58,567,632 11,624,06827
2006 139,161,500 97,446,512 41,714,988
2007 148,389,400 95,855,350 52,534,050
2008 252,075,728 Not yet available Source: www.commonfund.com.gh/index; 2008 data not yet available.
27 The figures vary greatly from source to source. From the Financial statements submitted to the MLGRD, it appears that the MMDAs have received ¢619,098,572,787 in 2005. From the annual report of DACF to parliament, the figure for MMDAs spending is ¢684 billion. Other beneficiaries are the MPs and the 10 RCCs, the Reserve Fund, the DACF office and funding to the National Sanitation Programme.
3
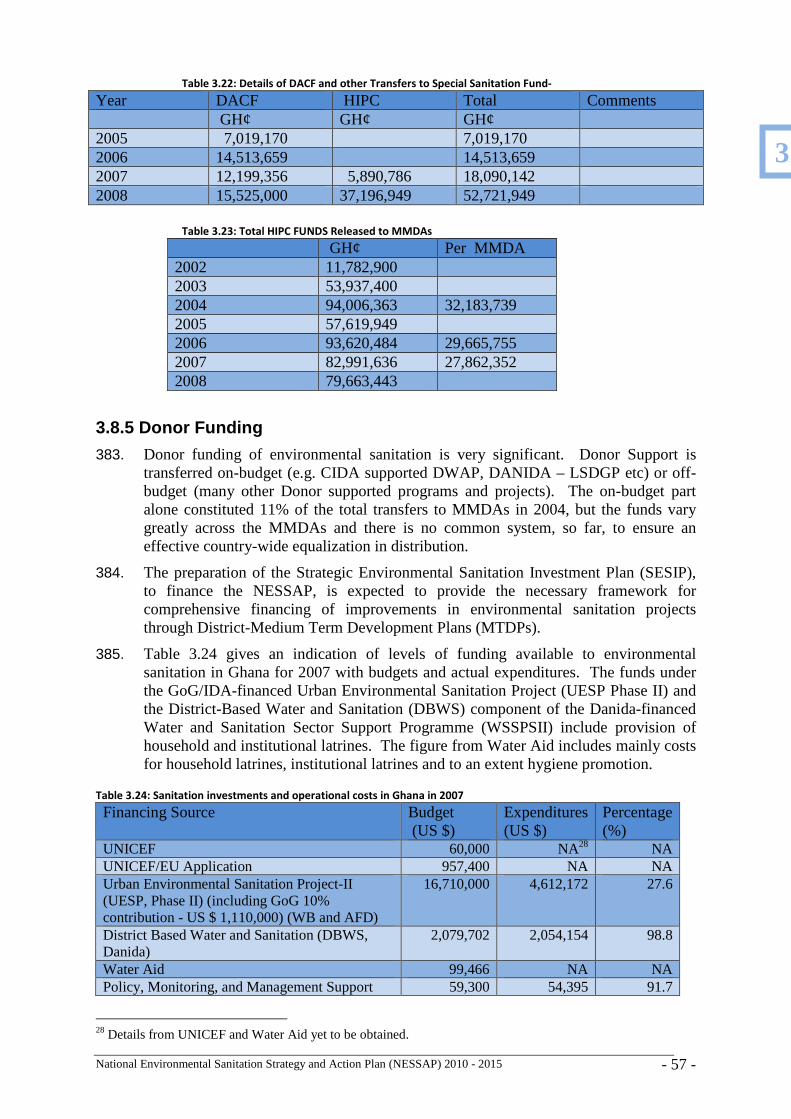
National Environmental Sanitation Strategy and Action Plan (NESSAP) 2010 - 2015 - 57 -
Table 3.22: Details of DACF and other Transfers to Special Sanitation Fund-
Year DACF HIPC Total Comments GH¢ GH¢ GH¢ 2005 7,019,170 7,019,170 2006 14,513,659 14,513,659 2007 12,199,356 5,890,786 18,090,142 2008 15,525,000 37,196,949 52,721,949 Table 3.23: Total HIPC FUNDS Released to MMDAs
GH¢ Per MMDA 2002 11,782,900 2003 53,937,400 2004 94,006,363 32,183,739 2005 57,619,949 2006 93,620,484 29,665,755 2007 82,991,636 27,862,352 2008 79,663,443
3.8.5 Donor Funding
383. Donor funding of environmental sanitation is very significant. Donor Support is transferred on-budget (e.g. CIDA supported DWAP, DANIDA – LSDGP etc) or off-budget (many other Donor supported programs and projects). The on-budget part alone constituted 11% of the total transfers to MMDAs in 2004, but the funds vary greatly across the MMDAs and there is no common system, so far, to ensure an effective country-wide equalization in distribution.
384. The preparation of the Strategic Environmental Sanitation Investment Plan (SESIP), to finance the NESSAP, is expected to provide the necessary framework for comprehensive financing of improvements in environmental sanitation projects through District-Medium Term Development Plans (MTDPs).
385. Table 3.24 gives an indication of levels of funding available to environmental sanitation in Ghana for 2007 with budgets and actual expenditures. The funds under the GoG/IDA-financed Urban Environmental Sanitation Project (UESP Phase II) and the District-Based Water and Sanitation (DBWS) component of the Danida-financed Water and Sanitation Sector Support Programme (WSSPSII) include provision of household and institutional latrines. The figure from Water Aid includes mainly costs for household latrines, institutional latrines and to an extent hygiene promotion.
Table 3.24: Sanitation investments and operational costs in Ghana in 2007
Financing Source Budget (US $)
Expenditures (US $)
Percentage (%)
UNICEF 60,000 NA28 NA UNICEF/EU Application 957,400 NA NA Urban Environmental Sanitation Project-II (UESP, Phase II) (including GoG 10% contribution - US $ 1,110,000) (WB and AFD)
16,710,000 4,612,172 27.6
District Based Water and Sanitation (DBWS, Danida)
2,079,702 2,054,154 98.8
Water Aid 99,466 NA NA Policy, Monitoring, and Management Support 59,300 54,395 91.7
28 Details from UNICEF and Water Aid yet to be obtained.
3
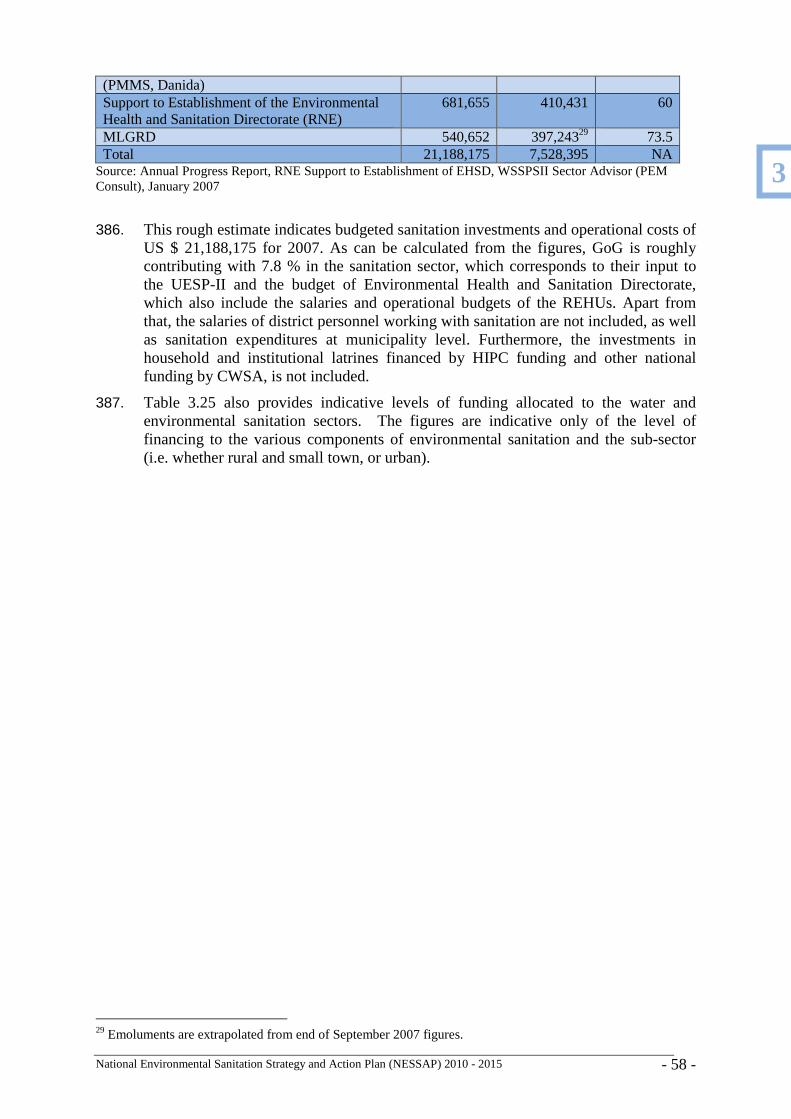
National Environmental Sanitation Strategy and Action Plan (NESSAP) 2010 - 2015 - 58 -
(PMMS, Danida) Support to Establishment of the Environmental Health and Sanitation Directorate (RNE)
681,655 410,431 60
MLGRD 540,652 397,24329 73.5 Total 21,188,175 7,528,395 NA
Source: Annual Progress Report, RNE Support to Establishment of EHSD, WSSPSII Sector Advisor (PEM Consult), January 2007
386. This rough estimate indicates budgeted sanitation investments and operational costs of US $ 21,188,175 for 2007. As can be calculated from the figures, GoG is roughly contributing with 7.8 % in the sanitation sector, which corresponds to their input to the UESP-II and the budget of Environmental Health and Sanitation Directorate, which also include the salaries and operational budgets of the REHUs. Apart from that, the salaries of district personnel working with sanitation are not included, as well as sanitation expenditures at municipality level. Furthermore, the investments in household and institutional latrines financed by HIPC funding and other national funding by CWSA, is not included.
387. Table 3.25 also provides indicative levels of funding allocated to the water and environmental sanitation sectors. The figures are indicative only of the level of financing to the various components of environmental sanitation and the sub-sector (i.e. whether rural and small town, or urban).
29 Emoluments are extrapolated from end of September 2007 figures.
3
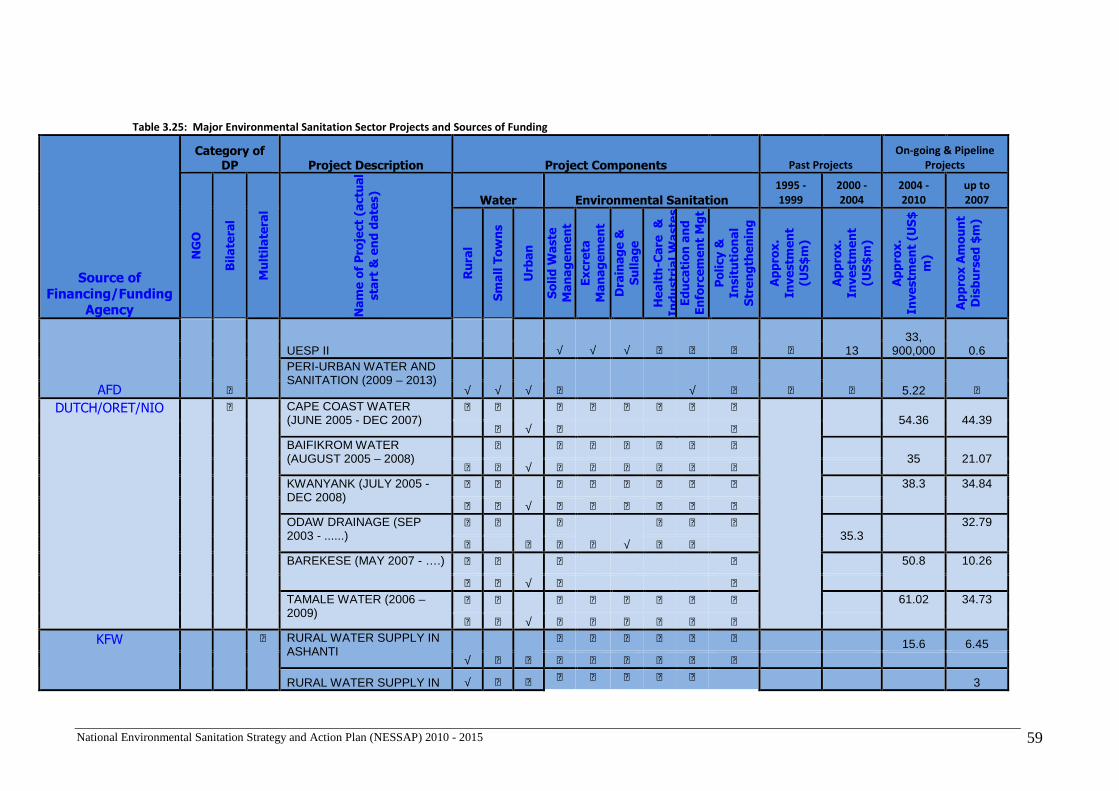
National Environmental Sanitation Strategy and Action Plan (NESSAP) 2010 - 2015 59
Table 3.25: Major Environmental Sanitation Sector Projects and Sources of Funding
Source of Financing/Funding
Agency
Category of DP Project Description Project Components Past Projects
On-going & Pipeline
Projects
NGO
Bilate
ral
Multilate
ral
Nam
e of Pro
ject (a
ctu
al
sta
rt &
end d
ate
s)
Water Environmental Sanitation
1995 -
1999
2000 -
2004
2004 -
2010
up to
2007
Rura
l
Sm
all Towns
Urb
an
Solid W
aste
Managem
ent
Excre
ta
Managem
ent
Dra
inage &
Sullage
Health-C
are
&
Industrial W
aste
s
Education and
Enfo
rcem
ent Mgt
Policy &
Insitutional
Strength
enin
g
Appro
x.
Investm
ent
(US$m
)
Appro
x.
Investm
ent
(US$m
)
Appro
x.
Investm
ent (U
S$
m)
Appro
x A
mount
Disburs
ed $
m)
AFD ?
UESP II √ √ √ ? ? ? ? 13 33,
900,000 0.6 PERI-URBAN WATER AND SANITATION (2009 – 2013)
√ √ √ ? √ ? ? ? 5.22 ? DUTCH/ORET/NIO ? CAPE COAST WATER
(JUNE 2005 - DEC 2007) ? ?
√
? ? ? ? ? ? 54.36
44.39
? ? ? BAIFIKROM WATER (AUGUST 2005 – 2008)
?
√
? ? ? ? ? ? 35
21.07
? ? ? ? ? ? ? ?
KWANYANK (JULY 2005 - DEC 2008)
? ?
√
? ? ? ? ? ? 38.3 34.84
? ? ? ? ? ? ? ?
ODAW DRAINAGE (SEP 2003 - ......)
? ?
?
?
? √
? ? ? 35.3
32.79
? ? ? ?
BAREKESE (MAY 2007 - ….) ? ?
√
? ? 50.8 10.26
? ? ? ?
TAMALE WATER (2006 – 2009)
? ?
√
? ? ? ? ? ? 61.02 34.73
? ? ? ? ? ? ? ?
KFW ? RURAL WATER SUPPLY IN ASHANTI
√ ? ?
? ? ? ? ? ? 15.6 6.45 ? ? ? ? ? ?
RURAL WATER SUPPLY IN √ ? ? ? ? ? ? ? 3
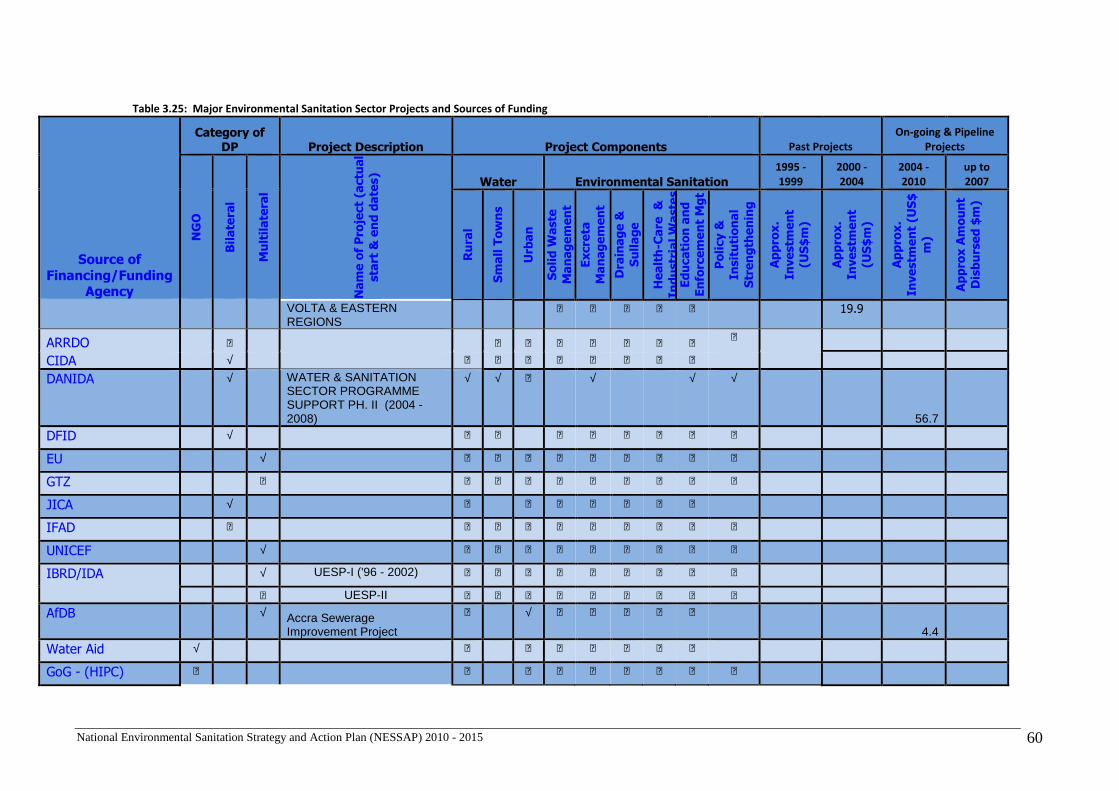
National Environmental Sanitation Strategy and Action Plan (NESSAP) 2010 - 2015 60
Table 3.25: Major Environmental Sanitation Sector Projects and Sources of Funding
Source of Financing/Funding
Agency
Category of DP Project Description Project Components Past Projects
On-going & Pipeline
Projects
NGO
Bilate
ral
Multilate
ral
Nam
e of Pro
ject (a
ctu
al
sta
rt &
end d
ate
s)
Water Environmental Sanitation
1995 -
1999
2000 -
2004
2004 -
2010
up to
2007
Rura
l
Sm
all Towns
Urb
an
Solid W
aste
Managem
ent
Excre
ta
Managem
ent
Dra
inage &
Sullage
Health-C
are
&
Industrial W
aste
s
Education and
Enfo
rcem
ent Mgt
Policy &
Insitutional
Strength
enin
g
Appro
x.
Investm
ent
(US$m
)
Appro
x.
Investm
ent
(US$m
)
Appro
x.
Investm
ent (U
S$
m)
Appro
x A
mount
Disburs
ed $
m)
VOLTA & EASTERN REGIONS
? ? ? ? ? 19.9
ARRDO ? ? ? ? ? ? ? ? ?
CIDA √ ? ? ? ? ? ? ? ?
DANIDA √ WATER & SANITATION SECTOR PROGRAMME SUPPORT PH. II (2004 - 2008)
√ √ ? √ √ √
56.7
DFID √ ? ? ? ? ? ? ? ?
EU √ ? ? ? ? ? ? ? ? ?
GTZ ? ? ? ? ? ? ? ? ? ?
JICA √ ? ? ? ? ? ? ?
IFAD ? ? ? ? ? ? ? ? ? ?
UNICEF √ ? ? ? ? ? ? ? ? ?
IBRD/IDA √ UESP-I ('96 - 2002) ? ? ? ? ? ? ? ? ? ? UESP-II ? ? ? ? ? ? ? ? ?
AfDB √ Accra Sewerage Improvement Project
? √ ? ? ? ? ?
4.4
Water Aid √ ? ? ? ? ? ? ?
GoG - (HIPC) ? ? ? ? ? ? ? ? ?
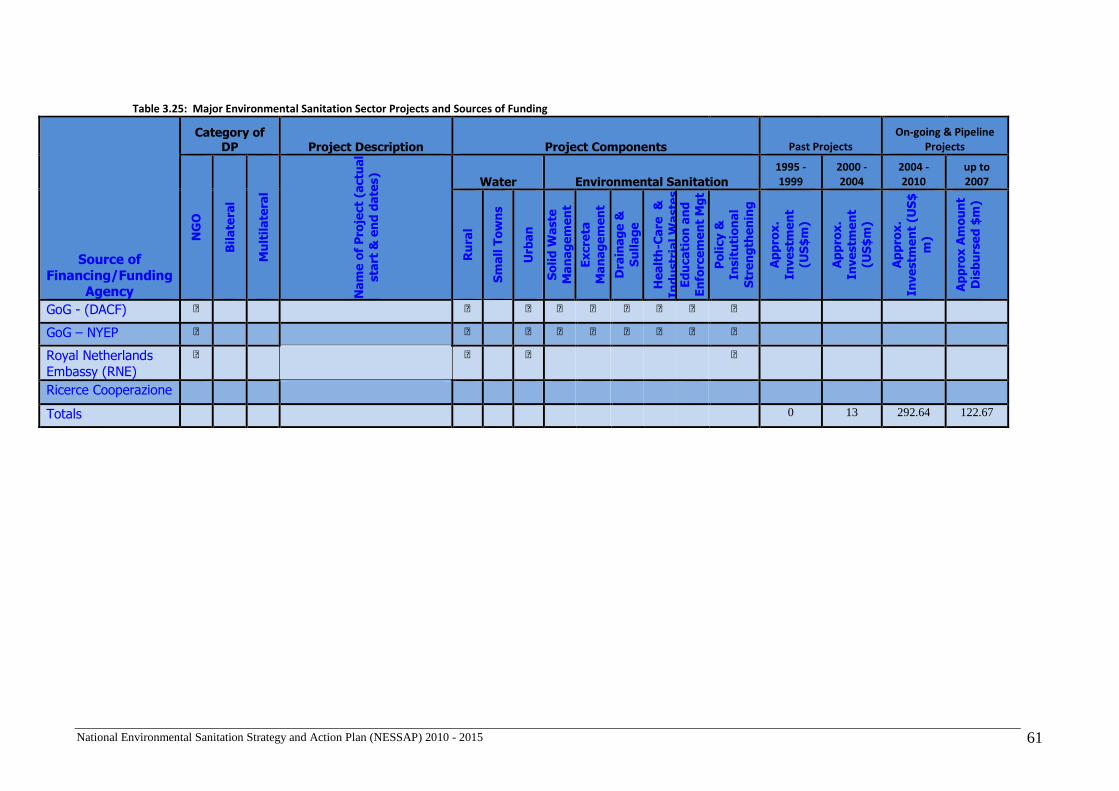
National Environmental Sanitation Strategy and Action Plan (NESSAP) 2010 - 2015 61
Table 3.25: Major Environmental Sanitation Sector Projects and Sources of Funding
Source of Financing/Funding
Agency
Category of DP Project Description Project Components Past Projects
On-going & Pipeline
Projects
NGO
Bilate
ral
Multilate
ral
Nam
e of Pro
ject (a
ctu
al
sta
rt &
end d
ate
s)
Water Environmental Sanitation
1995 -
1999
2000 -
2004
2004 -
2010
up to
2007
Rura
l
Sm
all Towns
Urb
an
Solid W
aste
Managem
ent
Excre
ta
Managem
ent
Dra
inage &
Sullage
Health-C
are
&
Industrial W
aste
s
Education and
Enfo
rcem
ent Mgt
Policy &
Insitutional
Strength
enin
g
Appro
x.
Investm
ent
(US$m
)
Appro
x.
Investm
ent
(US$m
)
Appro
x.
Investm
ent (U
S$
m)
Appro
x A
mount
Disburs
ed $
m)
GoG - (DACF) ? ? ? ? ? ? ? ? ?
GoG – NYEP ? ? ? ? ? ? ? ? ?
Royal Netherlands Embassy (RNE)
? ? ? ?
Ricerce Cooperazione
Totals 0 13 292.64 122.67
National Environmental Sanitation Strategy and Action Plan (NESSAP) 2010 - 2015 62
4 National Objectives and Strategies
National Environmental Sanitation Strategy and Action Plan (NESSAP) 2010 - 2015 63
4. National Objectives and Strategies
388. This section of the NESSAP proposes the planned broad strategies to meet the objectives and measures defined to overcome the challenges of the environmental sanitation sector. The key policies and actions are derived from, among others, the MTDPF (2010 – 2013) and the GPRSII, decentralisation framework and the Environmental Sanitation Policy (Revised, 2009). These are discussed briefly in the following sections.
4.1 The Medium Term Development Policy Framework (MTDPF, 2010 – 2013) and Growth and Poverty Reduction Strategy (GPRS-II)
389. Environmental sanitation is considered as a major component within the national development framework. While GPRSII strategized to ensure the right to basic services such as health-care, safe drinking water, sanitation and decent housing that improve the well-being of all Ghanaians the current MTDPF has prioritised the accelerated development of basic infrastructure to facilitate the production of goods and services.30.
390. The MTDPF under the Expanded Development of Production Infrastructure pillar proposes a number of strategic approaches, including (i) the acceleration of the provision of excreta management facilities, especially at the household level (ii) improving physical and land-use planning with emphasis on the acquisition of land for the treatment and disposal of wastes in major towns and cities, (iii) promotion of recycling and cost recovery principles in waste management and (iv) establishing a Fund for Environmental Sanitation.
4.2 Decentralisation 391. The Constitution of the Republic of Ghana under Section 240 (1) states that “Ghana
shall have a system of local government and administration which, shall as far as practicable, be decentralized”. Section 241 (3) reiterates that “Subject to this Constitution, a District Assembly shall be the highest political authority in the district, and shall have deliberative, legislative and executive powers”. Decentralized administration also places the oversight of implementation of all policies, plans, programmes and projects for all services under the jurisdiction of MMDAs.
392. The Local Government Act, 1993 (Act 462) provides the core regulation for the administration of local governments in Ghana while the National Development Planning (System) Act, 1994 (Act 480) lays out the development planning functions of MMDAs.
393. The above provide the basic tenets for the development of this NESSAP – policy objectives and actions will only provide an initial national framework subject to further refinements by actual and realistic strategies and targets for implementation by each MMDA. Therefore District Environmental Sanitation Strategies and Action Plans (DESSAPs) will provide the local level strategies, plans, programmes and sub-projects that will be considered as part of District’s Medium-Term Development Plans.
394. In terms of presence within the lower-tier levels of MMDAs, the Environmental Health and Sanitation Directorate is the most decentralized of all departments in Ghana with offices and/or operational staff at all levels including Sub-Metropolitan Districts, Zonal, Town and Area Councils.
30MTDPF(2010 – 2013), NDPC, 2009.
4
National Environmental Sanitation Strategy and Action Plan (NESSAP) 2010 - 2015 64
4.4 Underlying operational principles of the NESSAP 395. The NESSAP as stated above is a reflection of the objectives of the Environmental
Sanitation Policy (Revised, 2009). Hence all the principles underlying the policy also apply to the NESSAP. In addition and in line with the considerations of sections, 4.1, 4.2 and 4.3 above, the NESSAP will be based on the following;
• Decentralised planning and implementation of interventions based on DESSAPs and MMDA’s MTDPs;
• Pursuing institutional strengthening and capacity enhancement of the sector in line with programmes of the Local Government Service;
• Strategic Sanitation Approach – matching facilities with housing segments and affordability of residents;
• Targeting to reach total access for environmental sanitation through incremental achievements;
• Transparent means of sector performance assessment involving all stakeholders including civil society, NGOs, traditional authority, religious bodies and other professional associations;
• Enabling public-private-partnerships to flourish amid public regulation and fair refereeing by all stakeholders;
• Recognising the Public-and-Private “Good” nature of environmental sanitation services;
• Enhancing collaboration among key sector actors, especially harnessing the comparative strengths of regional-level entities31 for effective facilitation of MMDAs within the coordinating mandates of RCCs.
396. The provision of improved environmental sanitation services is influenced largely by housing segments of an area. The type of housing segment and the growth in each type of predominant housing will largely affect required facilities. For example, in many newly developing areas, high cost areas and estates, improved excreta disposal facilities are provided – and this is the trend in the housing market. Thus the challenge of improving services is skewed mainly, for urban areas, towards overcoming deficits in core low-income areas of large towns and for small towns.
4.5 Objectives of the Environmental Sanitation Policy (Revis ed, 2009) 397. The various strategies and action plans of the NESSAP are derived from the objectives
and measures under the following policy focal areas32 of the Revised ESP (2009). The detail actions are presented in the various component action plans under section 4.6.
A. Capacity Development 398. In order to reflect the importance of environmental sanitation in our national
development, there is the need for placing the sector among top priority areas of national agenda. This will require developing and strengthening capacity and raising the profile of agencies within the sector.
399. Proposed objectives for capacity development in environmental sanitation are:
3131 The organization and management of the development of DESSAPs by MMDAs was effectively coordinated by RCC-level agencies. See Handbook on the Preparation of DESSAPs, EHSD/MLGRD, 2007. 32 The detail list of objectives and actions under the key focus areas are provided in the Revised Environmental Sanitation Policy (2009). These are also repeated under section 4.
4
National Environmental Sanitation Strategy and Action Plan (NESSAP) 2010 - 2015 65
(A1) To formally establish environmental sanitation as a sub-sector in the development planning system with clearly defined institutional mandates;
(A2) To strengthen coordination and collaboration among sector institutions; (A3) To develop capacity of the sector for effective facilitation of MMDAs and private sector
for the provision of environmental sanitation services; (A4) To ensure transfer of adequate resources to MMDAs for environmental sanitation
functions; (A5.) To mainstream the management of the mitigation of marine pollution in environmental
sanitation strategies
B. Information Education and Communication 400. Attitudinal and behavioural change is central to achieving sustainable progress in
environmental sanitation. Therefore, environmental sanitation education, effective communication and dissemination of information are considered as integral elements of all environmental sanitation activities. Whilst environmental education is not in itself sufficient to ensure improvements in environmental sanitation, neither is the provision of sanitary infrastructure and services unless they are properly used.
401. Awareness raising and participatory engagement of all stakeholders to ensure informed-decision making on policies, plans and programmes is also critical. The philosophy of materials in transition (MINT) is also informed by these considerations, among others.
402. Objectives proposed to achieve the above include: (B1) To raise awareness on the Environmental Sanitation Policy (Revised, 2009). (B2.)To raise the awareness of the benefits of improved environmental sanitation especially
as related to health, food hygiene and general environment
(B3) To provide sector-wide standards for service provision, taking into consideration local conditions and needs
(B4.) To raise awareness on the increasing waste levels associated with growing economy and related lifestyle changes
(B5) To raise awareness of the importance (functions and benefits) of wet lands and water
courses (B6.) To enable effective community participation in the sitting of environmental sanitation
facilities C. Legislation and Regulation 403. Environmental sanitation reflects the way of life of a society. Given the prevailing high
levels of non-compliance with laid down environmental sanitation rules and regulations, there is the need to reinforce the legal regime and its enforcement. The roles of the judiciary and law enforcement agencies are of critical importance in this regard.
404. Law enforcement shall play complementary role to objectives and actions proposed for IEC and for service provision. The proposed objectives are:
(C1) To develop legislation in support of institutional structures required for managing
environmental sanitation
4
National Environmental Sanitation Strategy and Action Plan (NESSAP) 2010 - 2015 66
(C2.) To make available to all sector actors updated sector-wide standards, laws and
regulations on environmental sanitation (C3.) To mainstream alternative uses of wastes (liquid and solid) through appropriate
technologies and incentives (C4.) To institute regulatory mechanisms that safeguard wetlands and water courses; (C5.) To safeguard groundwater from contamination from poor environmental sanitation practices (C6.) To institute a means of incorporating, and adhering to, international conventions into domestic law (C7.) To ensure effective regulation for prevention of transboundary dumping in a free-trade regime D. Sustainable financing and cost recovery 405. In order to achieve the above, forward looking objectives are proposed, including;
(D1.) To ensure sustainable financing of environmental sanitation services (D2.) To develop a strategy and financing plan with clear allocation of resources (and costs) for households, communities, MMDAs and central government; (D3.) To improve public sector financing of environmental sanitation services
E. Levels of Service 406. The environmental sanitation needs of various target groups vary and so are the
corresponding facilities and services that are provided. The underlying principle of Revised ESP (2009) is to ensure that choices by all segments of the population for any level of service reflect effective demand, while the choice of technologies for all levels of service adhere to regulations in order to safeguard public interest and the rights of all.
407. In order to achieve the above, the following objectives have been proposed: (E1.) To effectively contain and decrease the negative impact from poor environmental
sanitation (E2.) To support adequate treatment and final disposal of all wastes; (E3.) To respond effectively to increasing waste volumes and changing waste streams due to
growing economy and varying life-styles (E4.) To support remedial strategies for all wetlands and water courses under threat from
indiscriminate disposal of waste (E5.) To meet the needs of vulnerable and physically challenged individuals in provision of
services F. Research and Development
4
National Environmental Sanitation Strategy and Action Plan (NESSAP) 2010 - 2015 67
(F1.) To develop an effective framework for capturing, reporting of sector statistics and performance to users at all levels
(F2) To support research in appropriate technologies to meet the needs of all segments of
society, especially vulnerable and poor people (F3.) To respond effectively to increasing waste volumes and changing waste streams due to
growing economy and varying life-styles G. Monitoring and Evaluation 408. To track policy implementation effectively and provide continuous improvement in
responding to emerging challenges in the sector, the objectives and measures to be pursued include:
(G1.) To develop framework for monitoring and evaluation at all levels within the sector;
(G2.) To strengthen capacity to implement M&E;
(G3.) To develop a responsive reporting and feedback mechanism for M&E
4.6 Measures, action plans and strategies 409. As discussed in previous chapters, the measures and action plans of the NESSAP are
derived from the objectives under the various focus areas of the Environmental Sanitation Policy (Revised, 2009). Each measure has been classified as either general, and therefore cuts across all the components of environmental sanitation, or is relevant to a specific component of environmental sanitation.
410. In the following sections, the generic strategies and action plans are discussed first, followed by those specific to the defined components of environmental sanitation. Where the same general measures are applicable for specific components, these are not repeated.
4.6.1 Capacity Development
411. The Revised Environmental Sanitation Policy (2009) identifies capacity development as a critical element for improving environmental sanitation services ( a key component of the “green economy”). The decline in coverage of services from the late 1970’s has continued and worsened. To overcome the deficit and make rapid progress require that there is urgent and scaled-up capacity enhancement within the sector.
412. The measures and actions as well as the corresponding time-frames proposed for achieving the policy objectives of the Capacity Development focus area are presented in Table 4.1. The key strategies related to the proposed measures and actions are in the following sections.
413. In the short-term institutional strengthening focuses on the establishment of the Environmental Health and Sanitation Department (EHSD) in the Ministry of Local Government and Rural Development (MLGRD). During the latter part of 2007, a review of institutional development was carried out and a training plan developed. Formal approval of the proposed scheme of service for staff of the EHSD will be pursued.
4
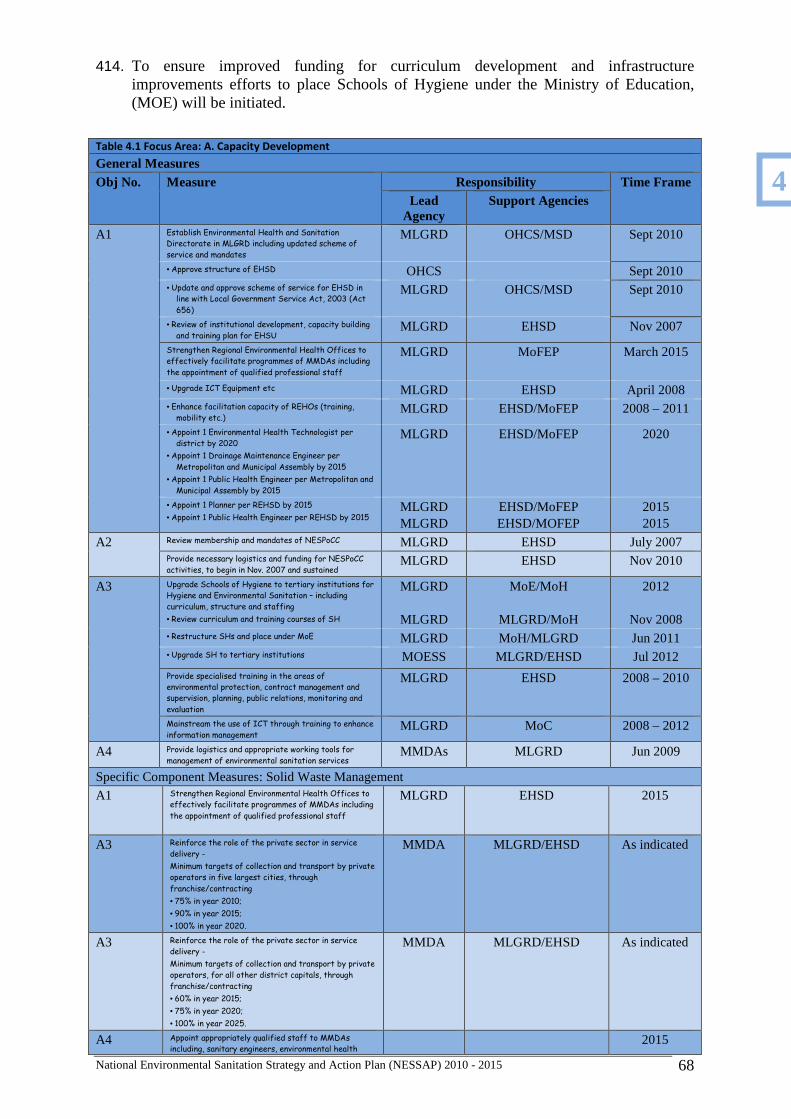
National Environmental Sanitation Strategy and Action Plan (NESSAP) 2010 - 2015 68
414. To ensure improved funding for curriculum development and infrastructure improvements efforts to place Schools of Hygiene under the Ministry of Education, (MOE) will be initiated.
Table 4.1 Focus Area: A. Capacity Development
General Measures Obj No. Measure Responsibility Time Frame
Lead Agency
Support Agencies
A1 Establish Environmental Health and Sanitation
Directorate in MLGRD including updated scheme of
service and mandates
MLGRD OHCS/MSD Sept 2010
• Approve structure of EHSD OHCS Sept 2010 • Update and approve scheme of service for EHSD in
line with Local Government Service Act, 2003 (Act
656)
MLGRD OHCS/MSD Sept 2010
• Review of institutional development, capacity building
and training plan for EHSU MLGRD EHSD Nov 2007
Strengthen Regional Environmental Health Offices to
effectively facilitate programmes of MMDAs including
the appointment of qualified professional staff
MLGRD MoFEP March 2015
• Upgrade ICT Equipment etc MLGRD EHSD April 2008 • Enhance facilitation capacity of REHOs (training,
mobility etc.) MLGRD EHSD/MoFEP 2008 – 2011
• Appoint 1 Environmental Health Technologist per
district by 2020
• Appoint 1 Drainage Maintenance Engineer per
Metropolitan and Municipal Assembly by 2015
• Appoint 1 Public Health Engineer per Metropolitan and
Municipal Assembly by 2015
MLGRD EHSD/MoFEP 2020
• Appoint 1 Planner per REHSD by 2015
• Appoint 1 Public Health Engineer per REHSD by 2015 MLGRD MLGRD
EHSD/MoFEP EHSD/MOFEP
2015 2015
A2 Review membership and mandates of NESPoCC MLGRD EHSD July 2007 Provide necessary logistics and funding for NESPoCC
activities, to begin in Nov. 2007 and sustained MLGRD EHSD Nov 2010
A3 Upgrade Schools of Hygiene to tertiary institutions for
Hygiene and Environmental Sanitation – including
curriculum, structure and staffing
• Review curriculum and training courses of SH
MLGRD
MLGRD
MoE/MoH
MLGRD/MoH
2012
Nov 2008 • Restructure SHs and place under MoE MLGRD MoH/MLGRD Jun 2011 • Upgrade SH to tertiary institutions MOESS MLGRD/EHSD Jul 2012 Provide specialised training in the areas of
environmental protection, contract management and
supervision, planning, public relations, monitoring and
evaluation
MLGRD EHSD 2008 – 2010
Mainstream the use of ICT through training to enhance
information management MLGRD MoC 2008 – 2012
A4 Provide logistics and appropriate working tools for
management of environmental sanitation services MMDAs MLGRD Jun 2009
Specific Component Measures: Solid Waste Management
A1 Strengthen Regional Environmental Health Offices to
effectively facilitate programmes of MMDAs including
the appointment of qualified professional staff
MLGRD EHSD 2015
A3 Reinforce the role of the private sector in service
delivery -
Minimum targets of collection and transport by private
operators in five largest cities, through
franchise/contracting
• 75% in year 2010;
• 90% in year 2015;
• 100% in year 2020.
MMDA MLGRD/EHSD As indicated
A3 Reinforce the role of the private sector in service
delivery -
Minimum targets of collection and transport by private
operators, for all other district capitals, through
franchise/contracting
• 60% in year 2015;
• 75% in year 2020;
• 100% in year 2025.
MMDA MLGRD/EHSD As indicated
A4 Appoint appropriately qualified staff to MMDAs
including, sanitary engineers, environmental health 2015
4
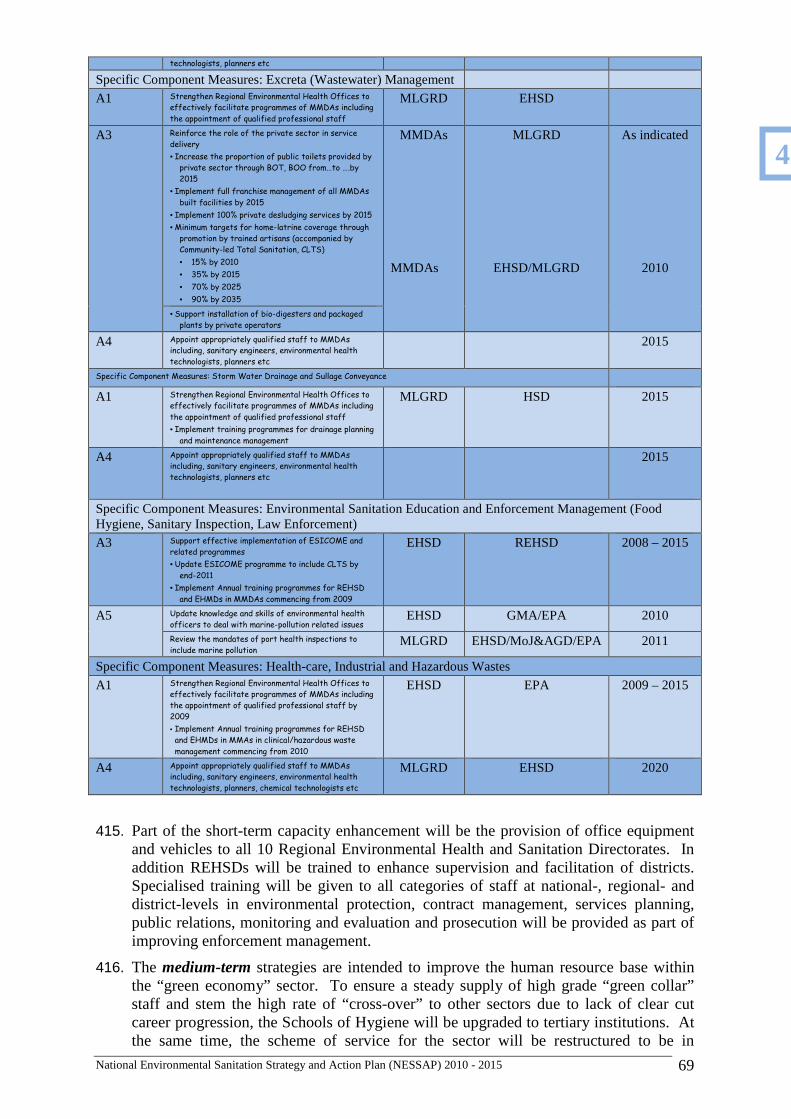
National Environmental Sanitation Strategy and Action Plan (NESSAP) 2010 - 2015 69
technologists, planners etc
Specific Component Measures: Excreta (Wastewater) Management
A1 Strengthen Regional Environmental Health Offices to
effectively facilitate programmes of MMDAs including
the appointment of qualified professional staff
MLGRD EHSD
A3 Reinforce the role of the private sector in service
delivery
• Increase the proportion of public toilets provided by
private sector through BOT, BOO from…to ….by
2015
• Implement full franchise management of all MMDAs
built facilities by 2015
• Implement 100% private desludging services by 2015
• Minimum targets for home-latrine coverage through
promotion by trained artisans (accompanied by
Community-led Total Sanitation, CLTS)
• 15% by 2010
• 35% by 2015
• 70% by 2025
• 90% by 2035
MMDAs
MMDAs
MLGRD
EHSD/MLGRD
As indicated
2010
• Support installation of bio-digesters and packaged
plants by private operators
A4 Appoint appropriately qualified staff to MMDAs
including, sanitary engineers, environmental health
technologists, planners etc
2015
Specific Component Measures: Storm Water Drainage and Sullage Conveyance
A1 Strengthen Regional Environmental Health Offices to
effectively facilitate programmes of MMDAs including
the appointment of qualified professional staff
• Implement training programmes for drainage planning
and maintenance management
MLGRD HSD 2015
A4 Appoint appropriately qualified staff to MMDAs
including, sanitary engineers, environmental health
technologists, planners etc
2015
Specific Component Measures: Environmental Sanitation Education and Enforcement Management (Food Hygiene, Sanitary Inspection, Law Enforcement)
A3 Support effective implementation of ESICOME and
related programmes
• Update ESICOME programme to include CLTS by
end-2011
• Implement Annual training programmes for REHSD
and EHMDs in MMDAs commencing from 2009
EHSD REHSD 2008 – 2015
A5 Update knowledge and skills of environmental health
officers to deal with marine-pollution related issues EHSD GMA/EPA 2010
Review the mandates of port health inspections to
include marine pollution MLGRD EHSD/MoJ&AGD/EPA 2011
Specific Component Measures: Health-care, Industrial and Hazardous Wastes
A1 Strengthen Regional Environmental Health Offices to
effectively facilitate programmes of MMDAs including
the appointment of qualified professional staff by
2009
• Implement Annual training programmes for REHSD
and EHMDs in MMAs in clinical/hazardous waste
management commencing from 2010
EHSD EPA 2009 – 2015
A4 Appoint appropriately qualified staff to MMDAs
including, sanitary engineers, environmental health
technologists, planners, chemical technologists etc
MLGRD EHSD 2020
415. Part of the short-term capacity enhancement will be the provision of office equipment and vehicles to all 10 Regional Environmental Health and Sanitation Directorates. In addition REHSDs will be trained to enhance supervision and facilitation of districts. Specialised training will be given to all categories of staff at national-, regional- and district-levels in environmental protection, contract management, services planning, public relations, monitoring and evaluation and prosecution will be provided as part of improving enforcement management.
416. The medium-term strategies are intended to improve the human resource base within the “green economy” sector. To ensure a steady supply of high grade “green collar” staff and stem the high rate of “cross-over” to other sectors due to lack of clear cut career progression, the Schools of Hygiene will be upgraded to tertiary institutions. At the same time, the scheme of service for the sector will be restructured to be in
4
National Environmental Sanitation Strategy and Action Plan (NESSAP) 2010 - 2015 70
harmony with the Local Government Service and provide “space” for professionals from other disciplines such as planning, finance, sociology and communications that are essential for modernizing the management of the sector.
417. Attracting higher calibre staff into the environmental health and sanitation sector through improved conditions of service including well-defined career development path will be pursued.
418. In the long-term, it is envisaged that building on the above strategies will enable the appointment of key staff including public health engineers and planners at REHSDs, public health and drain maintenance engineers at metropolitan and municipal assemblies, and at least one (1) environmental health technologist per district by 2020.
419. For solid waste management, ensuring improved productivity in collection and transport, and adoption of new and emerging technologies for final disposal, for example Reactor Landfilling (referred to as High-Density-Aerobic Landfills in the Ghana Landfill Guidelines) all have implications for service costs as well as effective management of landfill-gas (LFG) with or without energy recovery (i.e. waste-to-energy options).
420. The issues of climate change and the application of carbon-trading and -crediting as tools for gradually developing improved final disposal facilities have not received the required attention and opportunities available under the Kyoto Protocol, for example, have been missed. There is urgent need for a different mix of professionals with the requisite background experience and qualifications to enable the sector respond to these challenges and emerging trends. This will be achieved through capacity building and tailor-made on-the-job training for selected staff with the right aptitude.
421. From the early 1990’s a lot of effort has been made to encourage private sector participation in environmental sanitation services. The AMA-GTZ project increased substantially the coverage of house-to-house services by introducing standardised wheeled-bins for refuse storage and commenced direct collection services through the use of compaction trucks. Around the same time pilot schemes were also implemented by private operators using non-motorised collection systems including donkey-carts and push-trucks to augment the proportion of fee-charging primary collection services through franchise.
422. From the late 1990’s deliberate efforts were made to encourage the private sector to deliver substantial portion of collection and transport services following the successful application of the contracting method by Tema Municipal Assembly. The Urban Environmental Sanitation Project (UESP) series is supporting private sector delivery of not only collection/transport but also management of engineered landfills in the project cities.
423. To systematically pursue the agenda for privatising operations, it is expected that 75% or more of all solid waste collection and transport in the five largest cities will be through private operators, 90% by the close of 2015 and 100 by 2020. It is expected that all district capitals country-wide will follow suit and incrementally increase the proportion of services provided by the private sector.
424. To provide a benchmark for appraising the performance of all MMDAs in privatising refuse collection, transport and disposal requires that a baseline of existing services and their mode of delivery be determined. This exercise was launched as part of preparing the NESSAP.
425. Development of appropriate tools for monitoring and evaluation of privatised operations to ensure quality of service to households and the training of staff in contract/franchise management arrangements and procurement are all important facets of enhancing capacity of sector staff.
4
National Environmental Sanitation Strategy and Action Plan (NESSAP) 2010 - 2015 71
426. The basic capacity challenges of the sector regarding excreta management include training staff to manage a vigorous nation-wide scaling-up of home toilets promotion through emerging techniques such as Community-Led Total Sanitation (CLTS) to achieve modest country-wide target of 75% coverage by 2015. The skills of sector practitioners in designing and managing treatment facilities for faecal sludge and septage need to be improved. The latter is particularly important as many of the low-cost treatment facilities (faecal sludge and stabilization ponds, trickling filters, etc) installed are not functioning as desired.
427. The main strategies for the management of public and communal toilets are the full franchise management of all MMDA facilities and encouraging the private sector to build-operate and transfer or own public toilets by 2015.
428. An important aspect of managing public toilets is the handling and treatment of faecal sludges from such un-sewered facilities. The private sector will be supported to install bio-digesters and other packaged plants whose requirement for land is considerably less than ponds. Currently, the haulage and conveyance of faecal sludge and septage is largely provided by private cesspit emptier trucks in the largest cities, and it is proposed that full private sector delivery of desludging services be extended to all MMDAs by 2015. Guidelines for installation of treatment facilities and cesspit-emptier services will be developed in the short-term.
429. Street and road-side drain cleansing has been routinely provided by Waste Management or Environmental Health departments, as the case may be, in all MMDAs. However, the labour-intensive nature of the service has limited the provision of the service to only main thoroughfares around government offices and central-business-districts with the neglect, in particular, of community drains. The Department of Urban Roads (DUR) contracts out road-side drain cleansing as part of routine maintenance for road infrastructure but this is not regular as the pressure for new road projects often supersede maintaining drains seen as MMDA activity.
430. The inter-play between Stormwater drainage and sullage conveyance, solid waste and wastewater and implications for common ailments such as malaria and typhoid (see section 3.6) require that these services and related infrastructure be systematically improved as part of efforts at source prevention of such common disease vectors.
431. Restructuring of WMDs and EHMDs at MMDA levels to cater for staff with the right appreciation of planning for drains and drainage maintenance-management will be pursued. AMA has established a Drainage Maintenance Unit as part of recommendations of UESP and it is expected that the remaining four largest cities will follow suit. It is expected that as DAs establish their Environmental Health and Management Directorates and District Works Departments, units for drainage management will be included and staff provided training in drainage planning and maintenance management.
432. Development of drainage plans and implementation of the priority interventions will be pursued through effective collaboration between Planning Departments responsible for physical and land-use planning, and WMDs/EHMDs/DWD of MMDAs. To enable integrated drainage basin planning and management, effective facilitation of such planning will be provided by Regional Hydrological Services Department and Regional Environmental Health and Sanitation Directorates with active support of Regional Planning Coordinating Units.
433. In order to lay the basis for effective and systematic environmental sanitation education and enforcement management, ESICOME will be maintained as a core programme for sanitary inspections and enforcement. An important aspect of this will be the incorporation of locally-adapted CLTS methods in ESICOME by the end of 2011.
4
National Environmental Sanitation Strategy and Action Plan (NESSAP) 2010 - 2015 72
434. During this period, the Capacity Enhancement and Training Plan prepared in 2007 together with training modules prepared and implemented as part of UESPII and RNE’s support to “the Establishment of the Environmental Health and Sanitation Directorate” will be revisited to enhance staff capacity in prosecution, environmental assessment, services and financial planning. The effectiveness and scope of port-health inspections and the inclusion of issues on marine pollution will be assessed with the collaboration of appropriate agencies such as the National Maritime Authority.
435. At this stage sector capacity building on management of health-care, industrial and hazardous wastes will focus mainly on characterization of these waste categories and safe handling and treatment methods.
436. The MLGRD and EPA published guidelines on Management of Health-Care and Veterinary Wastes in 2002 to provide the basis for the safe segregation, packing, handling, storage, treatment, transportation, disposal and monitoring of health care waste whilst the MoH has recently published MoH’s policy and guidelines on health-care waste. As part of short-term measures training of staff on the major components of clinical wastes and their handling will be carried out.
437. A programme for systematic gathering of information on industrial waste sources, composition and recycling potential will be carried out. For general industrial waste, the main strategy will be on recycling up to 25% of waste and gradually reducing the amounts transported to final disposal in line with MINT.
438. A special waste stream analysis for waste-electrical and electronic equipment (WEEE) will be instituted in 2011 to assess the feasibility of establishing WEEE centres in Ghana.
439. During the industrial waste characterization exercise, criteria and specific treatment methods will be assembled as part of guidelines to be developed and specialised advisory services instituted to support industrial and commercial sources of hazardous wastes.
4.6.2 Information, Education and Communication
440. Awareness raising for change of environmental sanitation behaviour is recognised as a cornerstone for achieving the objectives of the Environmental Sanitation Policy (Revised, 2009) and this NESSAP. The measures under the IEC focus area of the policy clearly supports this position and generally proposes a two-pronged approach. The first involves vigorous environmental sanitation education with public participation and building of partnerships among key stakeholders to change behavior of the population as well as towards all types of waste. The second involves enforcement and sanctioning procedures that effectively deter miscreants.
441. In the following sections the measures and action plans related to the Information, Education and Communication focus area are presented in Table 4.2. Details of proposed strategies and explanations to the planned actions for general and specific-component measures follow.
442. In the short-term implementation of the Communication Plan for the Environmental Sanitation Policy (Revised, 2009) will be pursued to ensure widespread dissemination. The national launch of the revised policy and the NESSAP is supposed to attract high-level political and sector leaders. Over the years the Environmental Sanitation Week has been celebrated and has led to some periodic cleanup campaigns. It is proposed that the day of the week designated as ENSADA should be statutorily declared a clean-up day to provide it a legal basis and improve participation by citizens.
4
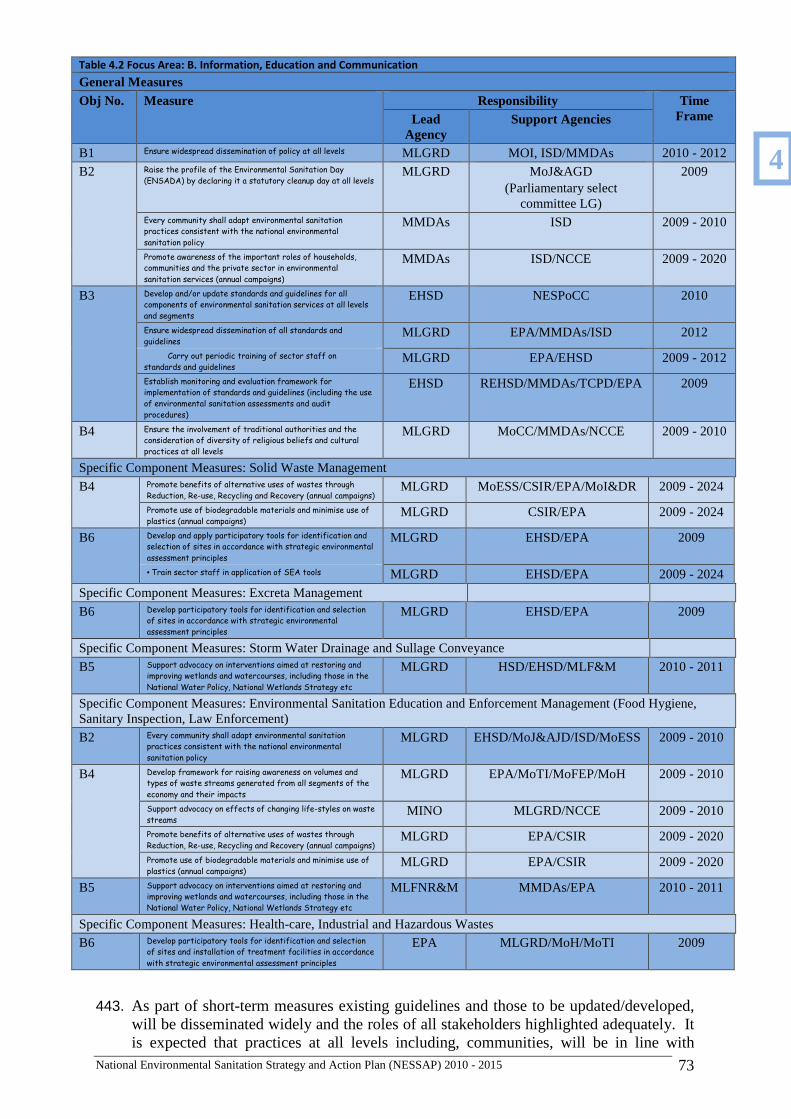
National Environmental Sanitation Strategy and Action Plan (NESSAP) 2010 - 2015 73
Table 4.2 Focus Area: B. Information, Education and Communication
General Measures Obj No. Measure Responsibility Time
Frame Lead Agency
Support Agencies
B1 Ensure widespread dissemination of policy at all levels MLGRD MOI, ISD/MMDAs 2010 - 2012
B2 Raise the profile of the Environmental Sanitation Day
(ENSADA) by declaring it a statutory cleanup day at all levels MLGRD MoJ&AGD
(Parliamentary select committee LG)
2009
Every community shall adapt environmental sanitation
practices consistent with the national environmental
sanitation policy
MMDAs ISD 2009 - 2010
Promote awareness of the important roles of households,
communities and the private sector in environmental
sanitation services (annual campaigns)
MMDAs ISD/NCCE 2009 - 2020
B3 Develop and/or update standards and guidelines for all
components of environmental sanitation services at all levels
and segments
EHSD NESPoCC 2010
Ensure widespread dissemination of all standards and
guidelines MLGRD EPA/MMDAs/ISD 2012
Carry out periodic training of sector staff on
standards and guidelines MLGRD EPA/EHSD 2009 - 2012
Establish monitoring and evaluation framework for
implementation of standards and guidelines (including the use
of environmental sanitation assessments and audit
procedures)
EHSD REHSD/MMDAs/TCPD/EPA 2009
B4 Ensure the involvement of traditional authorities and the
consideration of diversity of religious beliefs and cultural
practices at all levels
MLGRD MoCC/MMDAs/NCCE 2009 - 2010
Specific Component Measures: Solid Waste Management
B4 Promote benefits of alternative uses of wastes through
Reduction, Re-use, Recycling and Recovery (annual campaigns) MLGRD MoESS/CSIR/EPA/MoI&DR 2009 - 2024
Promote use of biodegradable materials and minimise use of
plastics (annual campaigns) MLGRD CSIR/EPA 2009 - 2024
B6 Develop and apply participatory tools for identification and
selection of sites in accordance with strategic environmental
assessment principles
MLGRD EHSD/EPA 2009
• Train sector staff in application of SEA tools MLGRD EHSD/EPA 2009 - 2024
Specific Component Measures: Excreta Management
B6 Develop participatory tools for identification and selection
of sites in accordance with strategic environmental
assessment principles
MLGRD EHSD/EPA 2009
Specific Component Measures: Storm Water Drainage and Sullage Conveyance
B5 Support advocacy on interventions aimed at restoring and
improving wetlands and watercourses, including those in the
National Water Policy, National Wetlands Strategy etc
MLGRD HSD/EHSD/MLF&M 2010 - 2011
Specific Component Measures: Environmental Sanitation Education and Enforcement Management (Food Hygiene, Sanitary Inspection, Law Enforcement)
B2 Every community shall adapt environmental sanitation
practices consistent with the national environmental
sanitation policy
MLGRD EHSD/MoJ&AJD/ISD/MoESS 2009 - 2010
B4 Develop framework for raising awareness on volumes and
types of waste streams generated from all segments of the
economy and their impacts
MLGRD EPA/MoTI/MoFEP/MoH 2009 - 2010
Support advocacy on effects of changing life-styles on waste
streams MINO MLGRD/NCCE 2009 - 2010
Promote benefits of alternative uses of wastes through
Reduction, Re-use, Recycling and Recovery (annual campaigns) MLGRD EPA/CSIR 2009 - 2020
Promote use of biodegradable materials and minimise use of
plastics (annual campaigns) MLGRD EPA/CSIR 2009 - 2020
B5 Support advocacy on interventions aimed at restoring and
improving wetlands and watercourses, including those in the
National Water Policy, National Wetlands Strategy etc
MLFNR&M MMDAs/EPA 2010 - 2011
Specific Component Measures: Health-care, Industrial and Hazardous Wastes
B6 Develop participatory tools for identification and selection
of sites and installation of treatment facilities in accordance
with strategic environmental assessment principles
EPA MLGRD/MoH/MoTI 2009
443. As part of short-term measures existing guidelines and those to be updated/developed, will be disseminated widely and the roles of all stakeholders highlighted adequately. It is expected that practices at all levels including, communities, will be in line with
4
National Environmental Sanitation Strategy and Action Plan (NESSAP) 2010 - 2015 74
national standards. Capacity building and training of sector staff on standards and guidelines as well as on Result-Based Monitoring and Evaluation (R-BM&E), environmental assessments and auditing will be provided.
444. A core strategy in disseminating the revised policy and measures will be the involvement of traditional authority and religious bodies in advocacy on civic rights and responsibilities regarding environmental sanitation services.
445. The different means of achieving the policy objective of Reduction, Re-use, Recycling and Recovery (4Rs) is now gaining attention. An essential element for institutionalising these pathways is to promote the results of value-chain analysis of the various components of wastes streams and the concept of “MINT”, hence the title of this document. The promotion of alternative biodegradable packaging materials instead of plastics will also be pursued as part of medium- to long-term measures.
446. Active engagement of stakeholders and their participation in decision-making-and-taking have proven to be effective tools in disseminating intended plans. In the area of solid waste and excreta management, selection of sites for final disposal and installation of low-cost treatment facilities has remained very challenging. Routine application of tools, such as SEA, that enable engagement of non-experts in decision-taking will be pursued.
447. The pollution of watercourses, wetlands, lagoons and rivers from point and non-point sources is threatening the quality of water available for abstraction for potable and other direct productive uses. A proposed core strategy is to support advocacy aimed at reclaiming and restoring wetlands and water bodies.
448. In the short- to medium-term, the core strategies for IEC have to deal with how Environmental Sanitation Education and Enforcement Management (ESEEM) is effectively achieved through the engagement and participation of individuals, households and communities.
449. The active participation of traditional authorities and religious bodies in support of advocacy on the effects of changing life-styles on waste streams generated from various sectors of the economy will be vigorously pursued.
450. Part of the ESEEM strategy will be to gather information of sources of waste and their tonnages or volumes based on community, area/zonal/sub-metropolitan areas and districts as well as on electoral and constituency basis. It is expected that the baseline information gathered as part of preparation of DESSAPs will contribute to the required information and hence a means for setting periodic (also annual) benchmarks and targets for meeting the aims of the MINT targets and the use of biodegradable alternatives.
4.6.3 Legislation and Regulation
451. The legislation and regulation focus is to provide a conducive environment that enables all stakeholders (service providers, households, institutions, industrial and commercial entities etc) to exercise their rights and responsibilities, within a responsive refereeing regimen.
452. The measures and actions as well as the corresponding time-frame proposed for achieving the policy objectives of the Legislation and Regulation focus area are presented in Table 4.3. The key strategies related to the proposed measures and actions follow.
4
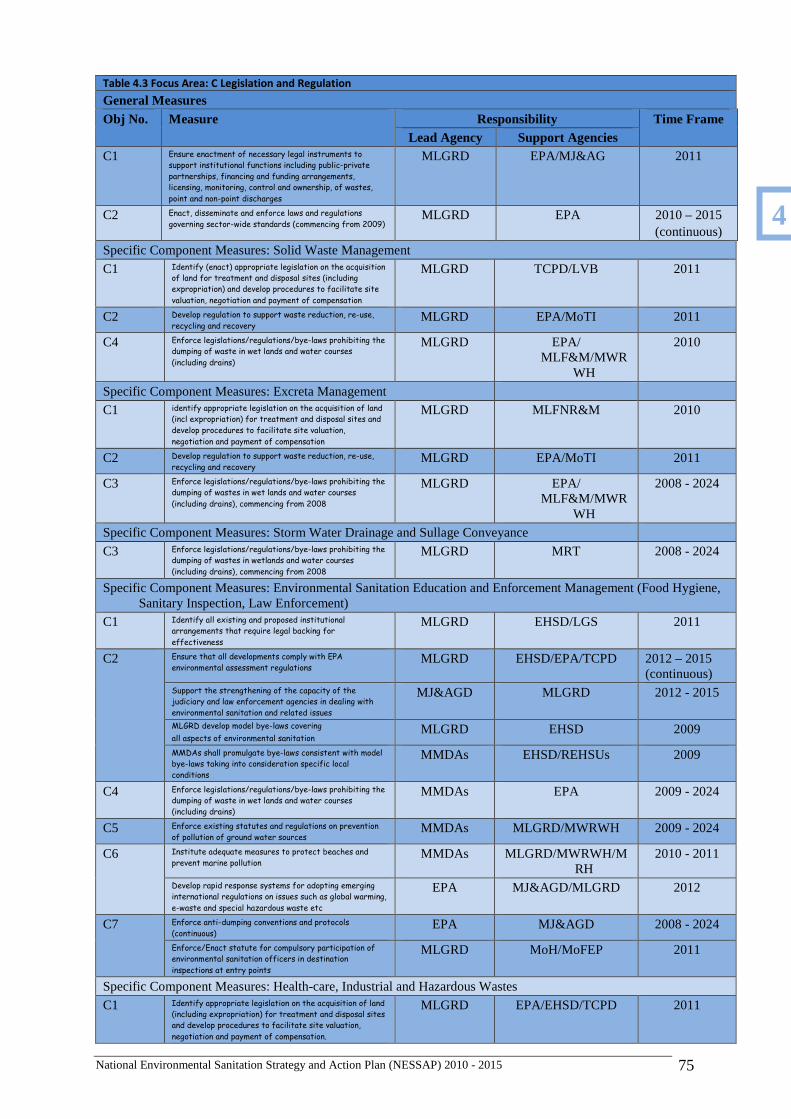
National Environmental Sanitation Strategy and Action Plan (NESSAP) 2010 - 2015 75
Table 4.3 Focus Area: C Legislation and Regulation
General Measures Obj No. Measure Responsibility Time Frame
Lead Agency Support Agencies C1 Ensure enactment of necessary legal instruments to
support institutional functions including public-private
partnerships, financing and funding arrangements,
licensing, monitoring, control and ownership, of wastes,
point and non-point discharges
MLGRD EPA/MJ&AG 2011
C2 Enact, disseminate and enforce laws and regulations
governing sector-wide standards (commencing from 2009) MLGRD EPA 2010 – 2015
(continuous)
Specific Component Measures: Solid Waste Management
C1 Identify (enact) appropriate legislation on the acquisition
of land for treatment and disposal sites (including
expropriation) and develop procedures to facilitate site
valuation, negotiation and payment of compensation
MLGRD TCPD/LVB 2011
C2 Develop regulation to support waste reduction, re-use,
recycling and recovery MLGRD EPA/MoTI 2011
C4 Enforce legislations/regulations/bye-laws prohibiting the
dumping of waste in wet lands and water courses
(including drains)
MLGRD EPA/ MLF&M/MWR
WH
2010
Specific Component Measures: Excreta Management
C1 identify appropriate legislation on the acquisition of land
(incl expropriation) for treatment and disposal sites and
develop procedures to facilitate site valuation,
negotiation and payment of compensation
MLGRD MLFNR&M 2010
C2 Develop regulation to support waste reduction, re-use,
recycling and recovery MLGRD EPA/MoTI 2011
C3 Enforce legislations/regulations/bye-laws prohibiting the
dumping of wastes in wet lands and water courses
(including drains), commencing from 2008
MLGRD EPA/ MLF&M/MWR
WH
2008 - 2024
Specific Component Measures: Storm Water Drainage and Sullage Conveyance
C3 Enforce legislations/regulations/bye-laws prohibiting the
dumping of wastes in wetlands and water courses
(including drains), commencing from 2008
MLGRD MRT 2008 - 2024
Specific Component Measures: Environmental Sanitation Education and Enforcement Management (Food Hygiene, Sanitary Inspection, Law Enforcement)
C1 Identify all existing and proposed institutional
arrangements that require legal backing for
effectiveness
MLGRD EHSD/LGS 2011
C2 Ensure that all developments comply with EPA
environmental assessment regulations MLGRD EHSD/EPA/TCPD 2012 – 2015
(continuous) Support the strengthening of the capacity of the
judiciary and law enforcement agencies in dealing with
environmental sanitation and related issues
MJ&AGD MLGRD 2012 - 2015
MLGRD develop model bye-laws covering
all aspects of environmental sanitation MLGRD EHSD 2009
MMDAs shall promulgate bye-laws consistent with model
bye-laws taking into consideration specific local
conditions
MMDAs EHSD/REHSUs 2009
C4 Enforce legislations/regulations/bye-laws prohibiting the
dumping of waste in wet lands and water courses
(including drains)
MMDAs EPA 2009 - 2024
C5 Enforce existing statutes and regulations on prevention
of pollution of ground water sources MMDAs MLGRD/MWRWH 2009 - 2024
C6 Institute adequate measures to protect beaches and
prevent marine pollution MMDAs MLGRD/MWRWH/M
RH 2010 - 2011
Develop rapid response systems for adopting emerging
international regulations on issues such as global warming,
e-waste and special hazardous waste etc
EPA MJ&AGD/MLGRD 2012
C7 Enforce anti-dumping conventions and protocols
(continuous) EPA MJ&AGD 2008 - 2024
Enforce/Enact statute for compulsory participation of
environmental sanitation officers in destination
inspections at entry points
MLGRD MoH/MoFEP 2011
Specific Component Measures: Health-care, Industrial and Hazardous Wastes
C1 Identify appropriate legislation on the acquisition of land
(including expropriation) for treatment and disposal sites
and develop procedures to facilitate site valuation,
negotiation and payment of compensation.
MLGRD EPA/EHSD/TCPD 2011
4
National Environmental Sanitation Strategy and Action Plan (NESSAP) 2010 - 2015 76
453. In the short-term the strategy will focus on assessing existing relevant laws to identify gaps and enact appropriate instruments where necessary. Typical areas that need to be catered for include giving legal backing to Environmental Health and Management Departments as provided for in the Revised ESP (2009); providing model bye-laws to support service delivery by private operators e.g. declaration of franchise areas; providing legal instruments for enforcing “polluter-pays-principle” at all levels; giving legal backing to operational principles regarding control and ownership of wastes.
454. In order to apply and adhere to the various levels of service, sector-wide standards will be developed and given appropriate legal backing.
455. The Revised ESP (2009) has taken on board MTDPF strategies for environmental sanitation especially the acquisition of sites for final disposal. To support this, a comprehensive framework will be developed to facilitate the acquisition of land for final disposal covering site assessment, valuation, negotiation and payment of compensation.
456. Laws will be enacted to operationalise the benchmarks and targets related to the 4Rs waste hierarchy, especially for industrial and commercial generators.
457. Enforcement of regulations and bye-laws are currently not effective due to inadequate capacity of sector staff and also lack of mechanisms that effectively aid “self- policing” by households and communities. To contribute to the abatement of pollution of wetlands and watercourses from point and non-point sources, a collation of all related regulations and means of enforcement in addition to the traditional “saman saman” shall be carried out. The enforcement mechanisms assessed to be potentially effective shall be implemented in the short, medium and long-term and updated regularly.
458. In the medium term, in support of enforcement of environmental regulations the existing process of building and development permitting by MMDAs will be updated to include the relevant sections of Environmental Assessment Regulations, 1999 (LI1652). Dissemination of these updated processes will be carried out as part of environmental sanitation education.
459. To improve the administration and prosecution of environmental sanitation offences, the Judicial Service will be supported to train members of the bench on relevant legislation. In the long-term it is expected that Environmental Courts will be established as part of MMDA courts to deal with environmental sanitation cases.
460. To ensure consistency in the application of environmental sanitation bye-laws country-wide, model bye-laws shall be disseminated to all MMDAs.
461. To safeguard groundwater sources, existing bye-laws on siting of household, communal and public treatment and disposal facilities will be widely disseminated and enforced.
462. Enhancing the quality of our beaches as part of promoting tourism will be pursued through dissemination and enforcement of relevant laws for the protection of beaches and prevention of marine pollution. Involving local communities living along beaches will be an essential element of this strategy.
463. Many of the consequences of poor environmental sanitation are not confined to national boundaries, and therefore there is the need to enhance the implementation of international accented measures and practices such as dealing with global warming, the growing menace of e-waste and management of mercury from energy-saving bulbs. Also implicated is the need to ensure that toxic and hazardous wastes are not “exported” or “imported” into Ghana through dissemination of relevant provisions.
4
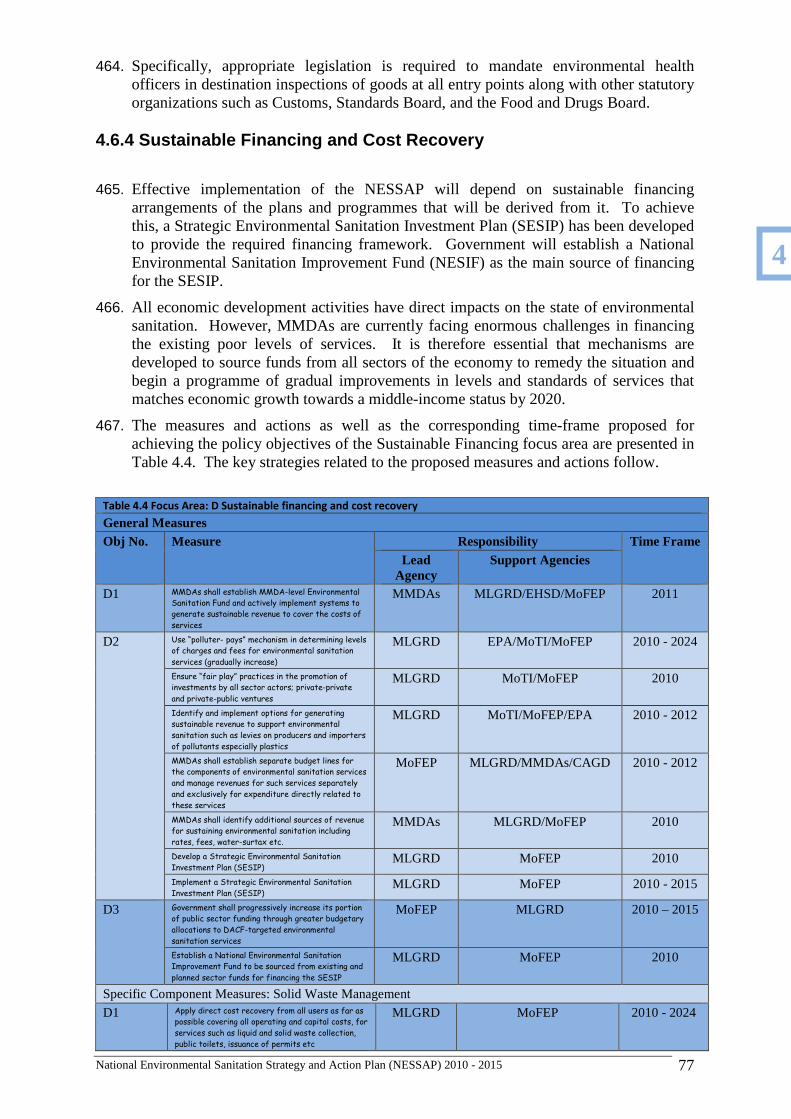
National Environmental Sanitation Strategy and Action Plan (NESSAP) 2010 - 2015 77
464. Specifically, appropriate legislation is required to mandate environmental health officers in destination inspections of goods at all entry points along with other statutory organizations such as Customs, Standards Board, and the Food and Drugs Board.
4.6.4 Sustainable Financing and Cost Recovery
465. Effective implementation of the NESSAP will depend on sustainable financing arrangements of the plans and programmes that will be derived from it. To achieve this, a Strategic Environmental Sanitation Investment Plan (SESIP) has been developed to provide the required financing framework. Government will establish a National Environmental Sanitation Improvement Fund (NESIF) as the main source of financing for the SESIP.
466. All economic development activities have direct impacts on the state of environmental sanitation. However, MMDAs are currently facing enormous challenges in financing the existing poor levels of services. It is therefore essential that mechanisms are developed to source funds from all sectors of the economy to remedy the situation and begin a programme of gradual improvements in levels and standards of services that matches economic growth towards a middle-income status by 2020.
467. The measures and actions as well as the corresponding time-frame proposed for achieving the policy objectives of the Sustainable Financing focus area are presented in Table 4.4. The key strategies related to the proposed measures and actions follow.
Table 4.4 Focus Area: D Sustainable financing and cost recovery
General Measures Obj No. Measure Responsibility Time Frame
Lead Agency
Support Agencies
D1 MMDAs shall establish MMDA-level Environmental
Sanitation Fund and actively implement systems to
generate sustainable revenue to cover the costs of
services
MMDAs MLGRD/EHSD/MoFEP 2011
D2 Use “polluter- pays” mechanism in determining levels
of charges and fees for environmental sanitation
services (gradually increase)
MLGRD EPA/MoTI/MoFEP 2010 - 2024
Ensure “fair play” practices in the promotion of
investments by all sector actors; private-private
and private-public ventures
MLGRD MoTI/MoFEP 2010
Identify and implement options for generating
sustainable revenue to support environmental
sanitation such as levies on producers and importers
of pollutants especially plastics
MLGRD MoTI/MoFEP/EPA 2010 - 2012
MMDAs shall establish separate budget lines for
the components of environmental sanitation services
and manage revenues for such services separately
and exclusively for expenditure directly related to
these services
MoFEP MLGRD/MMDAs/CAGD 2010 - 2012
MMDAs shall identify additional sources of revenue
for sustaining environmental sanitation including
rates, fees, water-surtax etc.
MMDAs MLGRD/MoFEP 2010
Develop a Strategic Environmental Sanitation
Investment Plan (SESIP) MLGRD MoFEP 2010
Implement a Strategic Environmental Sanitation
Investment Plan (SESIP) MLGRD MoFEP 2010 - 2015
D3 Government shall progressively increase its portion
of public sector funding through greater budgetary
allocations to DACF-targeted environmental
sanitation services
MoFEP MLGRD 2010 – 2015
Establish a National Environmental Sanitation
Improvement Fund to be sourced from existing and
planned sector funds for financing the SESIP
MLGRD MoFEP 2010
Specific Component Measures: Solid Waste Management
D1 Apply direct cost recovery from all users as far as
possible covering all operating and capital costs, for
services such as liquid and solid waste collection,
public toilets, issuance of permits etc
MLGRD MoFEP 2010 - 2024
4
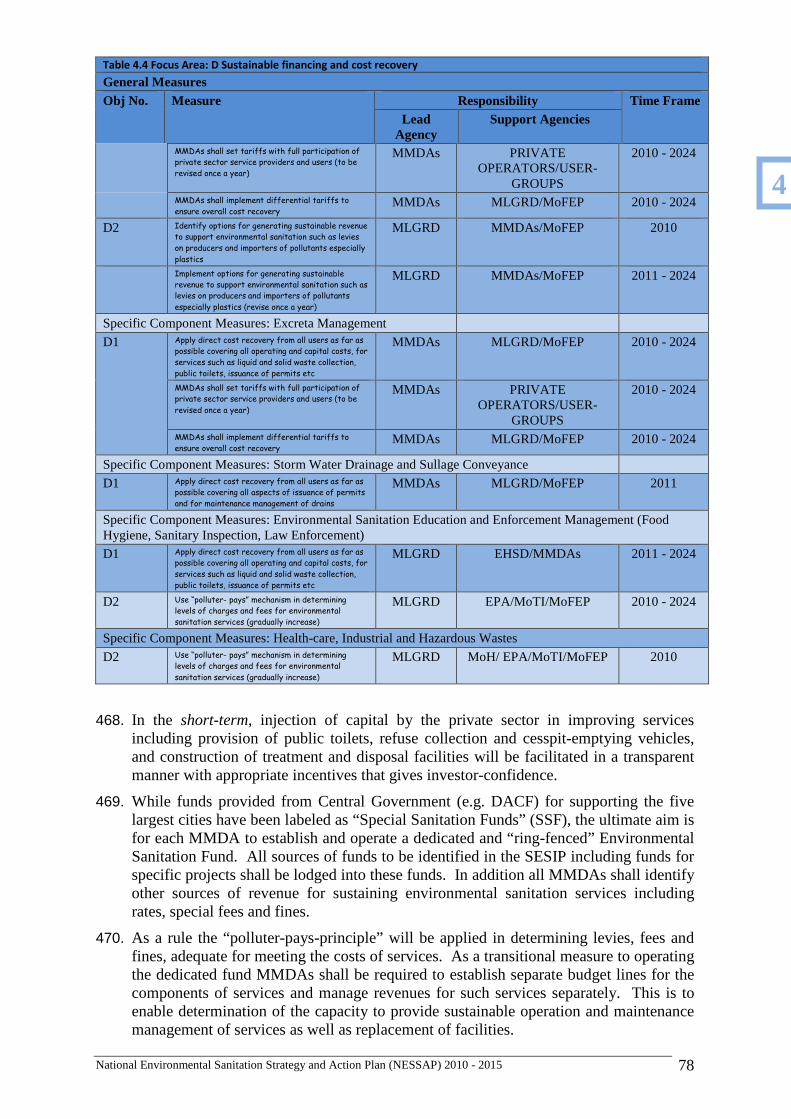
National Environmental Sanitation Strategy and Action Plan (NESSAP) 2010 - 2015 78
Table 4.4 Focus Area: D Sustainable financing and cost recovery
General Measures Obj No. Measure Responsibility Time Frame
Lead Agency
Support Agencies
MMDAs shall set tariffs with full participation of
private sector service providers and users (to be
revised once a year)
MMDAs PRIVATE OPERATORS/USER-
GROUPS
2010 - 2024
MMDAs shall implement differential tariffs to
ensure overall cost recovery MMDAs MLGRD/MoFEP 2010 - 2024
D2 Identify options for generating sustainable revenue
to support environmental sanitation such as levies
on producers and importers of pollutants especially
plastics
MLGRD MMDAs/MoFEP 2010
Implement options for generating sustainable
revenue to support environmental sanitation such as
levies on producers and importers of pollutants
especially plastics (revise once a year)
MLGRD MMDAs/MoFEP 2011 - 2024
Specific Component Measures: Excreta Management
D1 Apply direct cost recovery from all users as far as
possible covering all operating and capital costs, for
services such as liquid and solid waste collection,
public toilets, issuance of permits etc
MMDAs MLGRD/MoFEP 2010 - 2024
MMDAs shall set tariffs with full participation of
private sector service providers and users (to be
revised once a year)
MMDAs PRIVATE OPERATORS/USER-
GROUPS
2010 - 2024
MMDAs shall implement differential tariffs to
ensure overall cost recovery MMDAs MLGRD/MoFEP 2010 - 2024
Specific Component Measures: Storm Water Drainage and Sullage Conveyance
D1 Apply direct cost recovery from all users as far as
possible covering all aspects of issuance of permits
and for maintenance management of drains
MMDAs MLGRD/MoFEP 2011
Specific Component Measures: Environmental Sanitation Education and Enforcement Management (Food Hygiene, Sanitary Inspection, Law Enforcement)
D1 Apply direct cost recovery from all users as far as
possible covering all operating and capital costs, for
services such as liquid and solid waste collection,
public toilets, issuance of permits etc
MLGRD EHSD/MMDAs 2011 - 2024
D2 Use “polluter- pays” mechanism in determining
levels of charges and fees for environmental
sanitation services (gradually increase)
MLGRD EPA/MoTI/MoFEP 2010 - 2024
Specific Component Measures: Health-care, Industrial and Hazardous Wastes
D2 Use “polluter- pays” mechanism in determining
levels of charges and fees for environmental
sanitation services (gradually increase)
MLGRD MoH/ EPA/MoTI/MoFEP 2010
468. In the short-term, injection of capital by the private sector in improving services including provision of public toilets, refuse collection and cesspit-emptying vehicles, and construction of treatment and disposal facilities will be facilitated in a transparent manner with appropriate incentives that gives investor-confidence.
469. While funds provided from Central Government (e.g. DACF) for supporting the five largest cities have been labeled as “Special Sanitation Funds” (SSF), the ultimate aim is for each MMDA to establish and operate a dedicated and “ring-fenced” Environmental Sanitation Fund. All sources of funds to be identified in the SESIP including funds for specific projects shall be lodged into these funds. In addition all MMDAs shall identify other sources of revenue for sustaining environmental sanitation services including rates, special fees and fines.
470. As a rule the “polluter-pays-principle” will be applied in determining levies, fees and fines, adequate for meeting the costs of services. As a transitional measure to operating the dedicated fund MMDAs shall be required to establish separate budget lines for the components of services and manage revenues for such services separately. This is to enable determination of the capacity to provide sustainable operation and maintenance management of services as well as replacement of facilities.
4
National Environmental Sanitation Strategy and Action Plan (NESSAP) 2010 - 2015 79
471. Once the SESIP becomes operational and, the national and MMDA funds are in place these will provide the needed financing over the medium- to long-term period for the NESSAP. Government will progressively increase its share of allocations of the DACF targeted to environmental sanitation. As part of medium-term strategic planning, government will establish a dedicated National Environmental Sanitation Investment Fund (NESIF) to fund MTDP components of DESSAPs from 2010.
472. In order to ensure sustainable financing of services and gradually improve levels of services, direct cost-recovery shall be applied. In applying this principle consideration will be given to affordability, differential tariffs and cross-subsidisation where appropriate. As part of this arrangement MMDAs shall establish participatory procedures for setting tariffs involving private sector operators and user-groups.
473. To provide a sustainable means of managing the increase in plastic content of the waste stream and littering including recycling, specific levies shall be applied on importers and producers of plastic products. MMDAs shall also apply levies on distributors and users of plastic products.
474. Best practices from the novel MOTI/AMA programme of managing littering by sachet-water producers, vendors and users will be replicated in Central-Business-Districts (CBD) of district-capitals country-wide.
475. The responsibility for provision of cleansing and maintenance of primary, secondary (including road-side) drains has traditionally been divided among a number of institutions. Although MMDAs are legally responsible for this service the MWRWH (through the Hydrological Services Division) has been responsible for awarding contracts for desilting of drains while the DUR has been providing same for road-side drains. The high labour- intensive and costs associated with drain cleansing and maintenance has often led to inadequate budget allocation by MMDAs. Furthermore without expertise and dedicated technical units for the service it is often neglected. As part of efforts to remedy this, the five largest cities are creating Drainage Maintenance Units and preparing drain maintenance plans. The preparation of plans will go a long way to ensure targeting of scarce funds at priority drainage maintenance activities while additional funds will be mobilised for the involvement of communities through CBOs. This will be replicated for all MMDAs. In smaller DAs the Environmental Health and Management Departments will continue to be responsible for drain cleansing.
476. A sustainable means of preventing the common ailments such as cholera, typhoid, dysentery and malaria is to focus more on prevention than hitherto. The application of direct costs of services to be borne by users requires that adequate information on the costs incident on each of the services is made available. Educating the public on food-safety and hygiene and the implications of poor drain maintenance and refuse collection on malaria, and the costs to the economy will, as an example, justify applying funds from non-traditional sources such as Talk-tax.
477. A basic aim of applying the “polluter-pays-principle” is to identify the costs due to various components and sources of the waste stream. While recycling is voluntarily being practiced, the level and extent is currently low. The detail characterisation of waste will improve information on sources of waste sector-by-sector and thus influence, for example, targets to be set for recycling of more waste from industry and service sectors.
478. All taken together the ultimate aim is to decouple the growth in wastes and therefore improve the “green-economy” component due to expected total economic growth of Ghana. Figures 3.7 to 3.10 show the value-chain maps for the four (4) main
4
National Environmental Sanitation Strategy and Action Plan (NESSAP) 2010 - 2015 80
components of the solid waste stream analysed as part of a study on the potential for job creation targeting the youth33.
4.6.5 Levels of Service
479. The main objective of the NESSAP is to provide a basis for gradual and incremental improvement in the levels of service for different target groups. The choice of any level of service by any segment of the population should be based on informed demand. For the first time in Ghana, a comprehensive baseline survey has being carried out as part of the preparation of District-level Environmental Sanitation Strategies and Action Plans (DESSAPs). The data gathered informs this final version of the NESSAP.
480. The measures and actions as well as the corresponding time-frame proposed for achieving the policy objectives of the Levels of Service focus area are presented in Table 4.5. The key strategies related to the proposed measures and actions follow.
481. An important cornerstone of refining the NESSAP is the completion of DESSAPs by MMDAs. From the third quarter of 2007, MMDAs were engaged in the collection of data on existing levels of environmental sanitation infrastructure and services towards the preparation of DESSAPs. The collated baseline information on environmental sanitation show the existing levels of service in various categories of urban and rural towns and districts, and the access to these services by households in the different housing segments.
482. The defined levels of service ranging from existing “unacceptable” to “minimum” to “comfortable” and to the ultimate “amenity” will be used as a basis for establishing the existing, the projected gaps and thus the incremental improvements required in infrastructure and services.
483. It is expected that, in the medium- to long-term and in line with guidelines from the National Development Planning Commission (NDPC), MMDAs shall update their DESSAPs to meet the District Medium-Term Development Planning cycle.
484. In the short-term, Districts will incorporate their DESSAPs in the next MTDPs to come into force in 2010. The first round of DESSAPs will target achieving “minimum” levels of service by the end of 2015.
485. In order to meet the demands of all segments of society, the levels of service to be adopted will make provision for the needs of the vulnerable groups: women, children and the poor, especially people with disability. In locating treatment and disposal facilities, strict adherence to planning guidelines, EPA standards and other relevant regulations will be maintained.
33 Value-Chain Analysis of SWM in Accra for CHF-Ghana YES Programme. WasteCare Associates, March 2010.
4
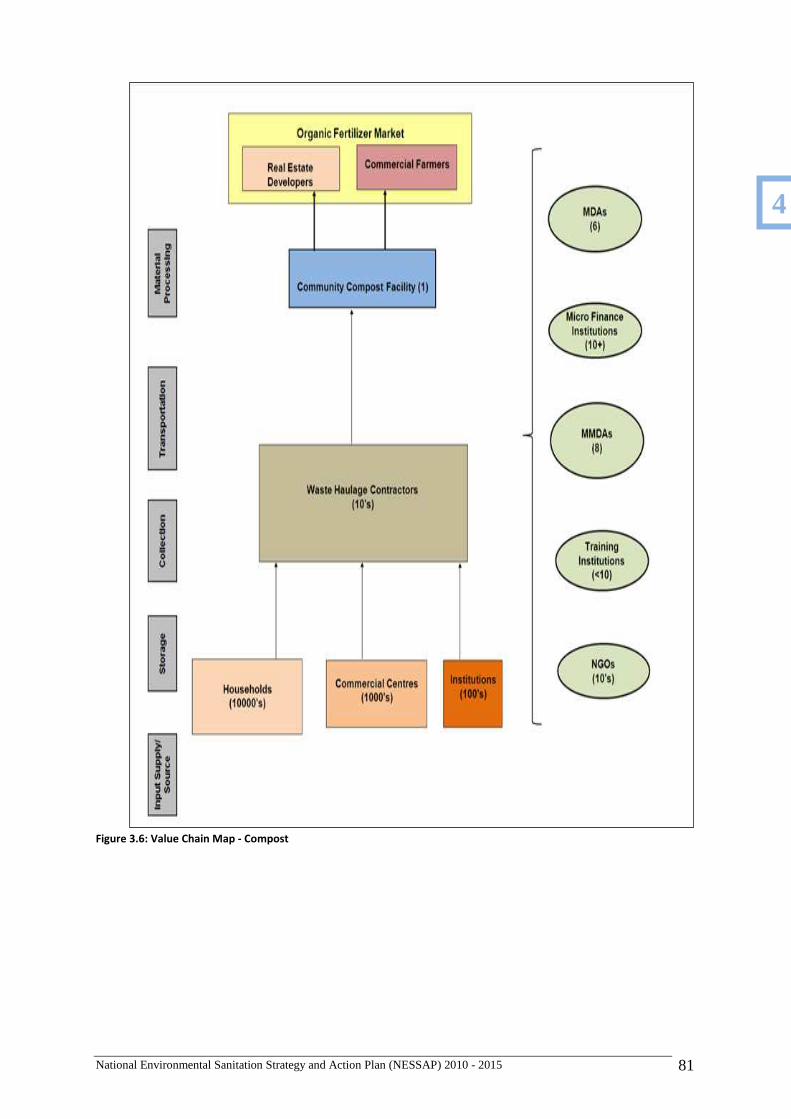
National Environmental Sanitation Strategy and Action Plan (NESSAP) 2010 - 2015 81
Figure 3.6: Value Chain Map - Compost
4
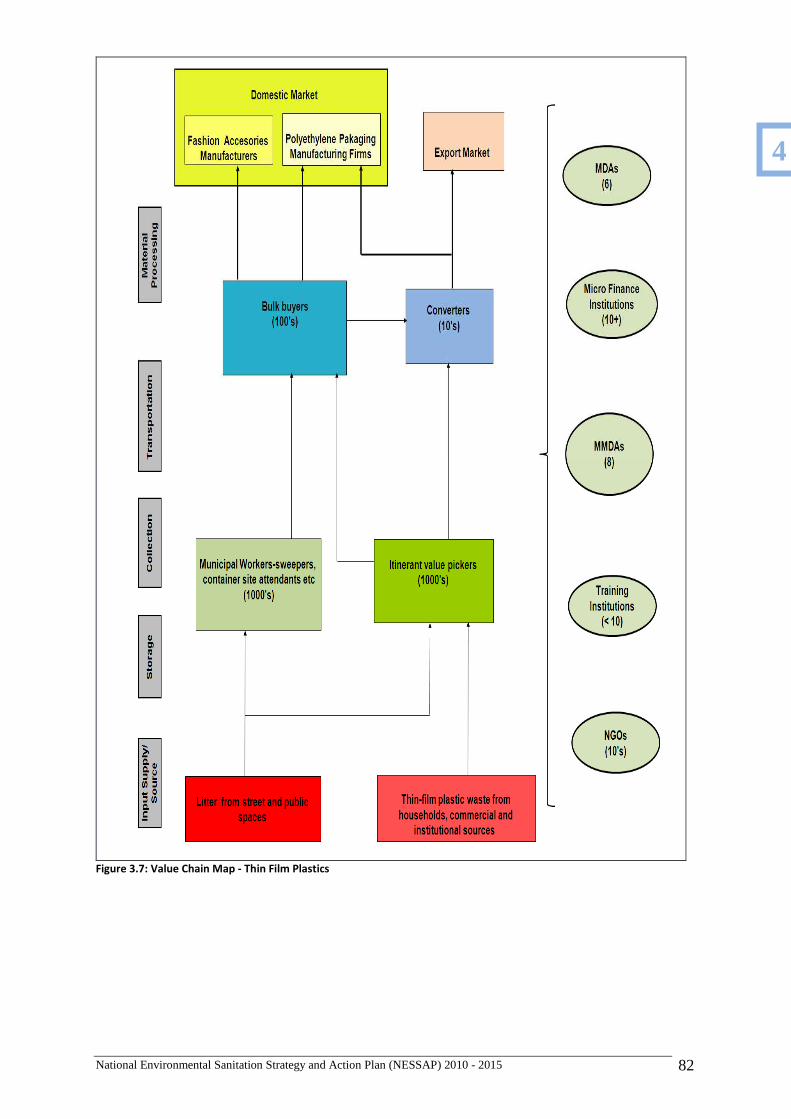
National Environmental Sanitation Strategy and Action Plan (NESSAP) 2010 - 2015 82
Figure 3.7: Value Chain Map - Thin Film Plastics
4
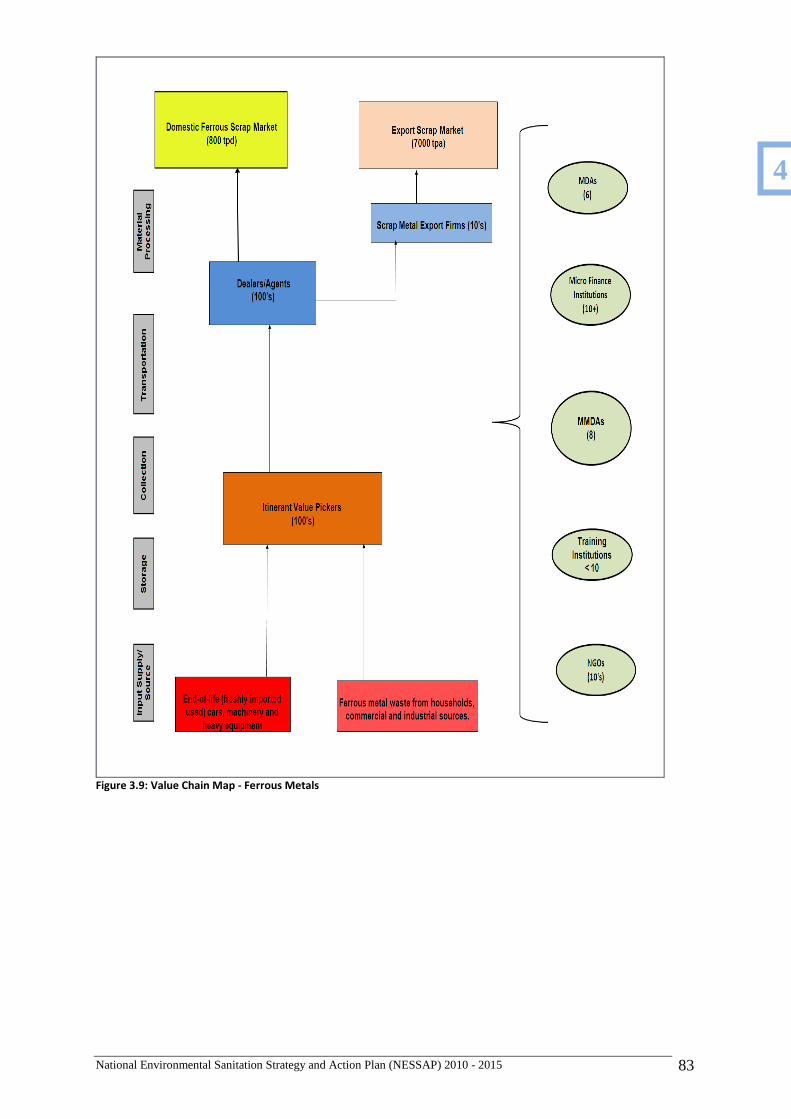
National Environmental Sanitation Strategy and Action Plan (NESSAP) 2010 - 2015 83
Figure 3.9: Value Chain Map - Ferrous Metals
4
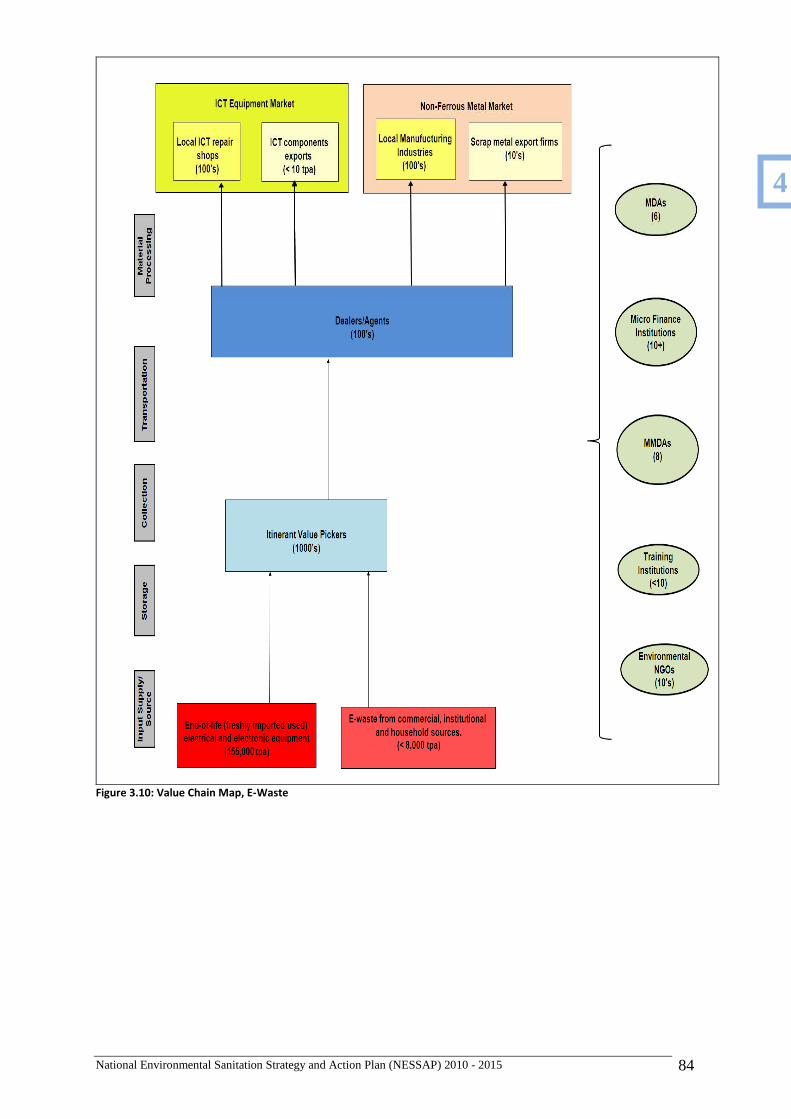
National Environmental Sanitation Strategy and Action Plan (NESSAP) 2010 - 2015 84
Figure 3.10: Value Chain Map, E-Waste
4
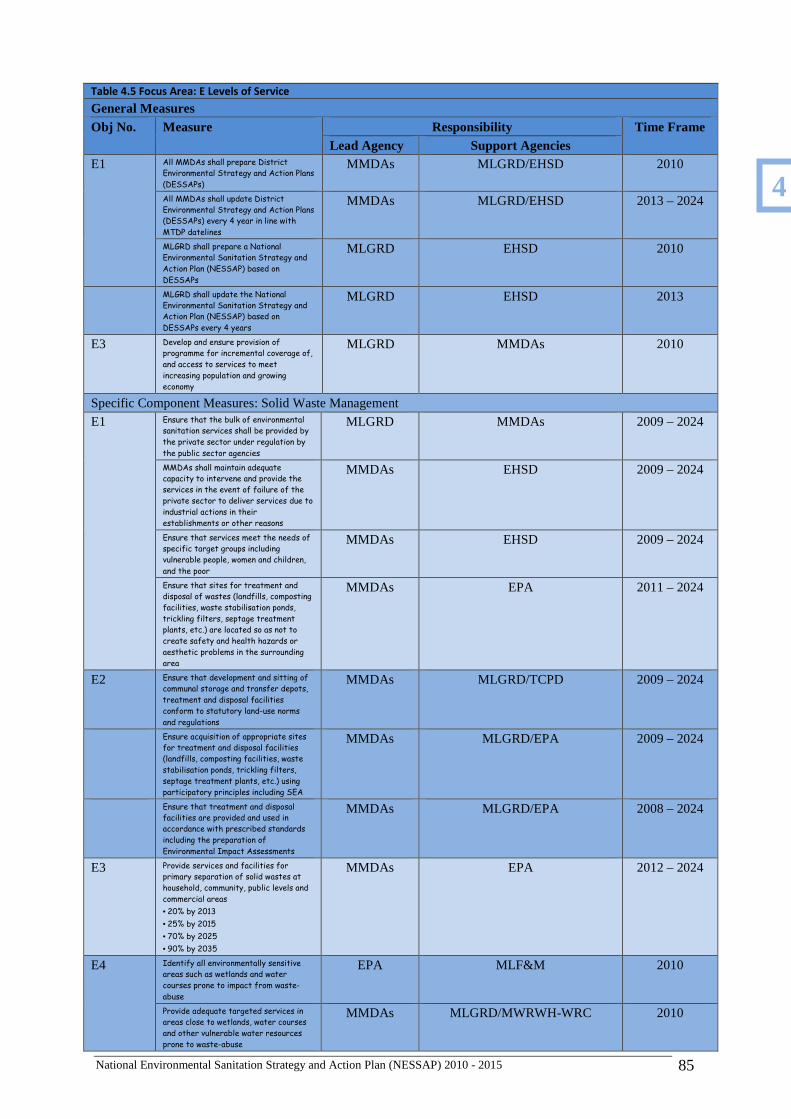
National Environmental Sanitation Strategy and Action Plan (NESSAP) 2010 - 2015 85
Table 4.5 Focus Area: E Levels of Service
General Measures Obj No. Measure Responsibility Time Frame
Lead Agency Support Agencies E1 All MMDAs shall prepare District
Environmental Strategy and Action Plans
(DESSAPs)
MMDAs MLGRD/EHSD 2010
All MMDAs shall update District
Environmental Strategy and Action Plans
(DESSAPs) every 4 year in line with
MTDP datelines
MMDAs MLGRD/EHSD 2013 – 2024
MLGRD shall prepare a National
Environmental Sanitation Strategy and
Action Plan (NESSAP) based on
DESSAPs
MLGRD EHSD 2010
MLGRD shall update the National
Environmental Sanitation Strategy and
Action Plan (NESSAP) based on
DESSAPs every 4 years
MLGRD EHSD 2013
E3 Develop and ensure provision of
programme for incremental coverage of,
and access to services to meet
increasing population and growing
economy
MLGRD MMDAs 2010
Specific Component Measures: Solid Waste Management
E1 Ensure that the bulk of environmental
sanitation services shall be provided by
the private sector under regulation by
the public sector agencies
MLGRD MMDAs 2009 – 2024
MMDAs shall maintain adequate
capacity to intervene and provide the
services in the event of failure of the
private sector to deliver services due to
industrial actions in their
establishments or other reasons
MMDAs EHSD 2009 – 2024
Ensure that services meet the needs of
specific target groups including
vulnerable people, women and children,
and the poor
MMDAs EHSD 2009 – 2024
Ensure that sites for treatment and
disposal of wastes (landfills, composting
facilities, waste stabilisation ponds,
trickling filters, septage treatment
plants, etc.) are located so as not to
create safety and health hazards or
aesthetic problems in the surrounding
area
MMDAs EPA 2011 – 2024
E2 Ensure that development and sitting of
communal storage and transfer depots,
treatment and disposal facilities
conform to statutory land-use norms
and regulations
MMDAs MLGRD/TCPD 2009 – 2024
Ensure acquisition of appropriate sites
for treatment and disposal facilities
(landfills, composting facilities, waste
stabilisation ponds, trickling filters,
septage treatment plants, etc.) using
participatory principles including SEA
MMDAs MLGRD/EPA 2009 – 2024
Ensure that treatment and disposal
facilities are provided and used in
accordance with prescribed standards
including the preparation of
Environmental Impact Assessments
MMDAs MLGRD/EPA 2008 – 2024
E3 Provide services and facilities for
primary separation of solid wastes at
household, community, public levels and
commercial areas
• 20% by 2013
• 25% by 2015
• 70% by 2025
• 90% by 2035
MMDAs EPA 2012 – 2024
E4 Identify all environmentally sensitive
areas such as wetlands and water
courses prone to impact from waste-
abuse
EPA MLF&M 2010
Provide adequate targeted services in
areas close to wetlands, water courses
and other vulnerable water resources
prone to waste-abuse
MMDAs MLGRD/MWRWH-WRC 2010
4
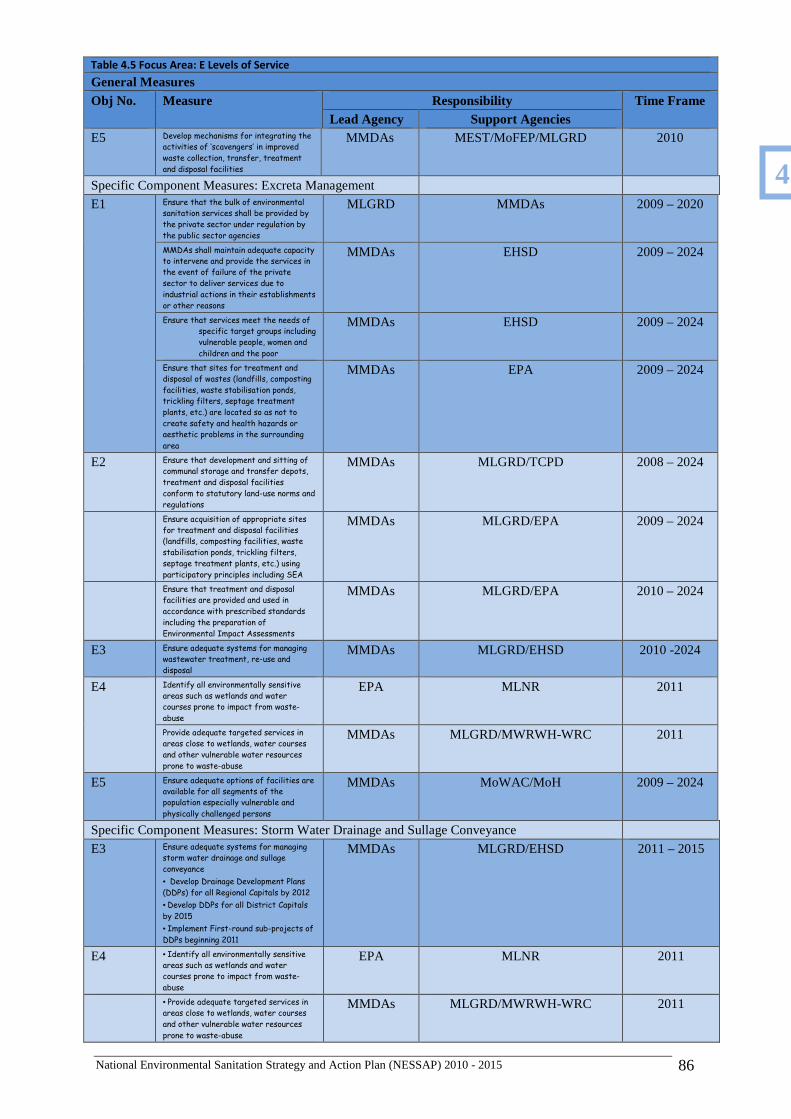
National Environmental Sanitation Strategy and Action Plan (NESSAP) 2010 - 2015 86
Table 4.5 Focus Area: E Levels of Service
General Measures Obj No. Measure Responsibility Time Frame
Lead Agency Support Agencies E5 Develop mechanisms for integrating the
activities of ‘scavengers’ in improved
waste collection, transfer, treatment
and disposal facilities
MMDAs MEST/MoFEP/MLGRD 2010
Specific Component Measures: Excreta Management
E1 Ensure that the bulk of environmental
sanitation services shall be provided by
the private sector under regulation by
the public sector agencies
MLGRD MMDAs 2009 – 2020
MMDAs shall maintain adequate capacity
to intervene and provide the services in
the event of failure of the private
sector to deliver services due to
industrial actions in their establishments
or other reasons
MMDAs EHSD 2009 – 2024
Ensure that services meet the needs of
specific target groups including
vulnerable people, women and
children and the poor
MMDAs EHSD 2009 – 2024
Ensure that sites for treatment and
disposal of wastes (landfills, composting
facilities, waste stabilisation ponds,
trickling filters, septage treatment
plants, etc.) are located so as not to
create safety and health hazards or
aesthetic problems in the surrounding
area
MMDAs EPA 2009 – 2024
E2 Ensure that development and sitting of
communal storage and transfer depots,
treatment and disposal facilities
conform to statutory land-use norms and
regulations
MMDAs MLGRD/TCPD 2008 – 2024
Ensure acquisition of appropriate sites
for treatment and disposal facilities
(landfills, composting facilities, waste
stabilisation ponds, trickling filters,
septage treatment plants, etc.) using
participatory principles including SEA
MMDAs MLGRD/EPA 2009 – 2024
Ensure that treatment and disposal
facilities are provided and used in
accordance with prescribed standards
including the preparation of
Environmental Impact Assessments
MMDAs MLGRD/EPA 2010 – 2024
E3 Ensure adequate systems for managing
wastewater treatment, re-use and
disposal
MMDAs MLGRD/EHSD 2010 -2024
E4 Identify all environmentally sensitive
areas such as wetlands and water
courses prone to impact from waste-
abuse
EPA MLNR 2011
Provide adequate targeted services in
areas close to wetlands, water courses
and other vulnerable water resources
prone to waste-abuse
MMDAs MLGRD/MWRWH-WRC 2011
E5 Ensure adequate options of facilities are
available for all segments of the
population especially vulnerable and
physically challenged persons
MMDAs MoWAC/MoH 2009 – 2024
Specific Component Measures: Storm Water Drainage and Sullage Conveyance
E3 Ensure adequate systems for managing
storm water drainage and sullage
conveyance
• Develop Drainage Development Plans
(DDPs) for all Regional Capitals by 2012
• Develop DDPs for all District Capitals
by 2015
• Implement First-round sub-projects of
DDPs beginning 2011
MMDAs MLGRD/EHSD 2011 – 2015
E4 • Identify all environmentally sensitive
areas such as wetlands and water
courses prone to impact from waste-
abuse
EPA MLNR 2011
• Provide adequate targeted services in
areas close to wetlands, water courses
and other vulnerable water resources
prone to waste-abuse
MMDAs MLGRD/MWRWH-WRC 2011
4
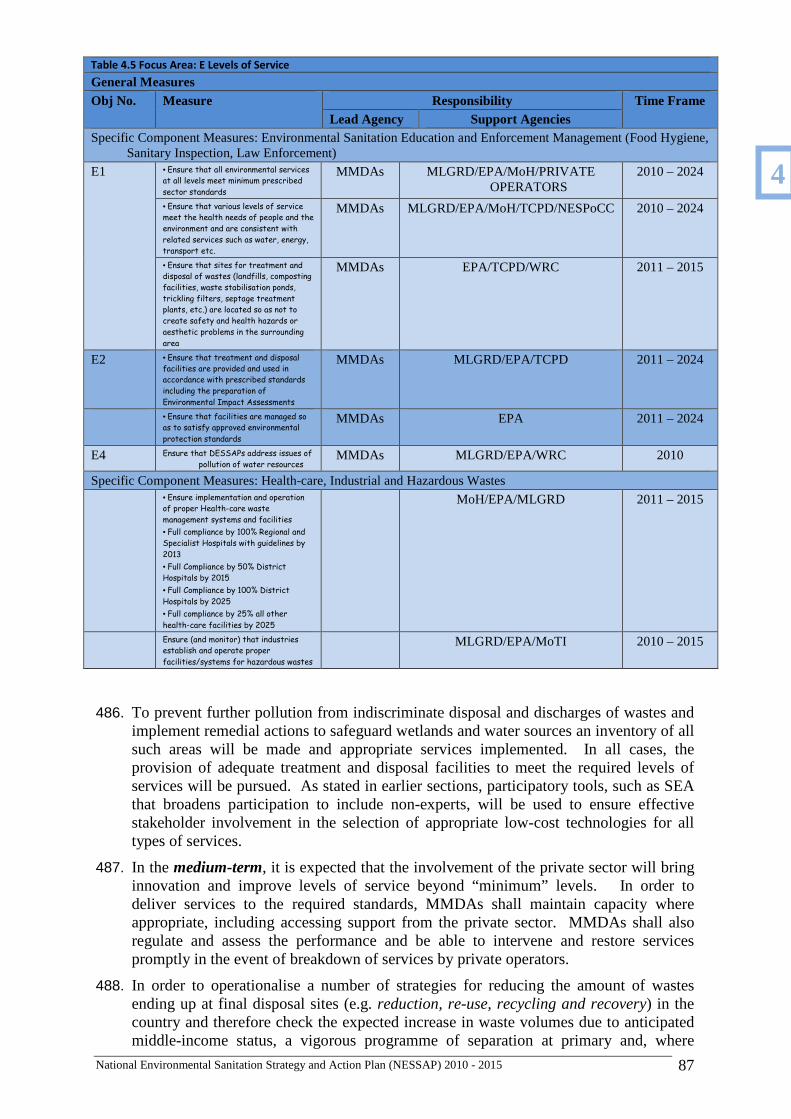
National Environmental Sanitation Strategy and Action Plan (NESSAP) 2010 - 2015 87
Table 4.5 Focus Area: E Levels of Service
General Measures Obj No. Measure Responsibility Time Frame
Lead Agency Support Agencies Specific Component Measures: Environmental Sanitation Education and Enforcement Management (Food Hygiene,
Sanitary Inspection, Law Enforcement)
E1 • Ensure that all environmental services
at all levels meet minimum prescribed
sector standards
MMDAs MLGRD/EPA/MoH/PRIVATE OPERATORS
2010 – 2024
• Ensure that various levels of service
meet the health needs of people and the
environment and are consistent with
related services such as water, energy,
transport etc.
MMDAs MLGRD/EPA/MoH/TCPD/NESPoCC 2010 – 2024
• Ensure that sites for treatment and
disposal of wastes (landfills, composting
facilities, waste stabilisation ponds,
trickling filters, septage treatment
plants, etc.) are located so as not to
create safety and health hazards or
aesthetic problems in the surrounding
area
MMDAs EPA/TCPD/WRC 2011 – 2015
E2 • Ensure that treatment and disposal
facilities are provided and used in
accordance with prescribed standards
including the preparation of
Environmental Impact Assessments
MMDAs MLGRD/EPA/TCPD 2011 – 2024
• Ensure that facilities are managed so
as to satisfy approved environmental
protection standards
MMDAs EPA 2011 – 2024
E4 Ensure that DESSAPs address issues of
pollution of water resources MMDAs MLGRD/EPA/WRC 2010
Specific Component Measures: Health-care, Industrial and Hazardous Wastes
• Ensure implementation and operation
of proper Health-care waste
management systems and facilities
• Full compliance by 100% Regional and
Specialist Hospitals with guidelines by
2013
• Full Compliance by 50% District
Hospitals by 2015
• Full Compliance by 100% District
Hospitals by 2025
• Full compliance by 25% all other
health-care facilities by 2025
MoH/EPA/MLGRD 2011 – 2015
Ensure (and monitor) that industries
establish and operate proper
facilities/systems for hazardous wastes
MLGRD/EPA/MoTI 2010 – 2015
486. To prevent further pollution from indiscriminate disposal and discharges of wastes and implement remedial actions to safeguard wetlands and water sources an inventory of all such areas will be made and appropriate services implemented. In all cases, the provision of adequate treatment and disposal facilities to meet the required levels of services will be pursued. As stated in earlier sections, participatory tools, such as SEA that broadens participation to include non-experts, will be used to ensure effective stakeholder involvement in the selection of appropriate low-cost technologies for all types of services.
487. In the medium-term, it is expected that the involvement of the private sector will bring innovation and improve levels of service beyond “minimum” levels. In order to deliver services to the required standards, MMDAs shall maintain capacity where appropriate, including accessing support from the private sector. MMDAs shall also regulate and assess the performance and be able to intervene and restore services promptly in the event of breakdown of services by private operators.
488. In order to operationalise a number of strategies for reducing the amount of wastes ending up at final disposal sites (e.g. reduction, re-use, recycling and recovery) in the country and therefore check the expected increase in waste volumes due to anticipated middle-income status, a vigorous programme of separation at primary and, where
4
National Environmental Sanitation Strategy and Action Plan (NESSAP) 2010 - 2015 88
appropriate, secondary levels of collection shall be pursued. By the end of the first round of implementation of DESSAPs, it is projected that 15% of solid waste from household, communal, public, commercial and industrial sources shall be separated at source.
489. Specific to the collection, transport and disposal of solid waste it is important that the role and special needs of waste-value pickers (referred to wrongly as “scavengers” and “bola boys”) in the chain, especially at final disposal sites, are recognised and addressed. In the short- to medium-term, the potential for integrating recycling stations at disposal and communal storage (skip depots) operated by waste-value pickers will be examined. The extension of the Waste Management module under the National Youth Employment Programme (NYEP) to cover management of communal transfer stations will also be explored.
490. Concerning excreta management, the haulage and transport of septage and faecal sludge, and provision of public facilities in Ghana’s five largest cities are mainly by the private sector. The franchise management of public toilets and the provision of cesspit emptier services by private operators will be extended to all Districts within the medium-term. The private sector is expected to innovate in meeting the needs of the vulnerable especially the use of public facilities by physically challenged persons.
491. Providing appropriate low-cost treatment and disposal facilities for septage and faecal sludge impacts greatly on the levels of service for excreta management, particularly the efficient management of communal and public facilities. It also impacts on pollution due to “cow-boy” discharging of emptier trucks into streams and watercourses. To ensure safe handling of septage and faecal sludge MMDAs will install Faecal Sludge Treatment Plants (FSTPs), waste stabilisation ponds and bio-digesters.
492. Guidelines on all aspects of the services and facilities for excreta management shall be updated where they exist, and new ones prepared where they are not available, and disseminated to all levels, especially sub-metropolitan districts, zonal, town and area councils.
493. In the short- to medium-terms drainage development plans shall be prepared for all regional and district capitals for effective management of storm drainage and sullage conveyance. It is expected that within the medium term drainage interventions as is been carried out in the five largest cities will be extended to cover priority works in other regional and district capitals. It is also expected that the preparation of DESSAPs will provide the priority elements of Drainage Development Plans and the required maintenance management arrangements.
494. To enable households and users of services make informed choices and decisions on levels of service and related technologies, affordability and willingness to pay for and maintain the services, environmental sanitation education and enforcement will entail the provision of adequate information on costs and benefits on all services. In addition information on the legal and sanction regimes to support the effective implementation of the desired levels of service will be provided.
495. All MMDAs shall integrate into their DESSAPs, existing management plans being implemented by the MoH regarding healthcare waste. The guidelines on Health-Care Waste prepared by the MoH will be used to assess the levels of service provided for handling (including storage, collection, transport, treatment and disposal) of clinical wastes and the required improvements to be made and programmes to be implemented by the specific health-care institutions.
496. The characterisation of wastes by industries and the implementation of the hierarchy of waste management options will be closely monitored and a system of reporting on performance implemented within the medium term.
4
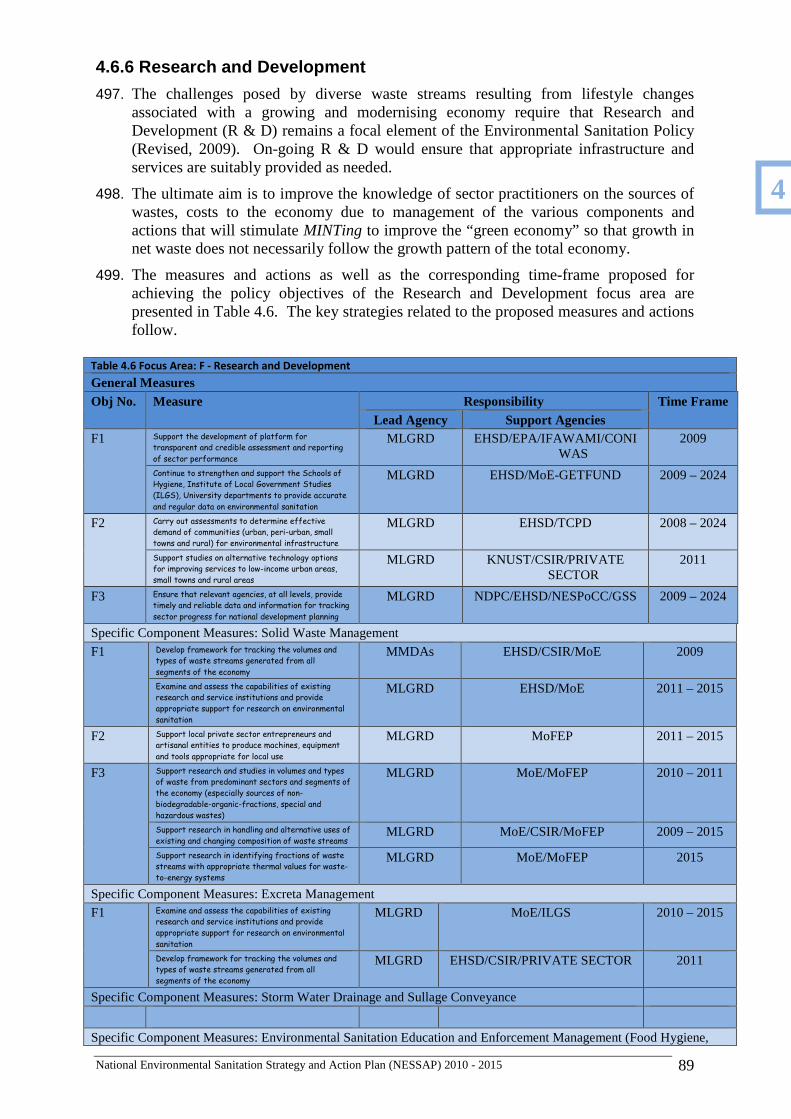
National Environmental Sanitation Strategy and Action Plan (NESSAP) 2010 - 2015 89
4.6.6 Research and Development
497. The challenges posed by diverse waste streams resulting from lifestyle changes associated with a growing and modernising economy require that Research and Development (R & D) remains a focal element of the Environmental Sanitation Policy (Revised, 2009). On-going R & D would ensure that appropriate infrastructure and services are suitably provided as needed.
498. The ultimate aim is to improve the knowledge of sector practitioners on the sources of wastes, costs to the economy due to management of the various components and actions that will stimulate MINTing to improve the “green economy” so that growth in net waste does not necessarily follow the growth pattern of the total economy.
499. The measures and actions as well as the corresponding time-frame proposed for achieving the policy objectives of the Research and Development focus area are presented in Table 4.6. The key strategies related to the proposed measures and actions follow.
Table 4.6 Focus Area: F - Research and Development
General Measures Obj No. Measure Responsibility Time Frame
Lead Agency Support Agencies F1 Support the development of platform for
transparent and credible assessment and reporting
of sector performance
MLGRD EHSD/EPA/IFAWAMI/CONIWAS
2009
Continue to strengthen and support the Schools of
Hygiene, Institute of Local Government Studies
(ILGS), University departments to provide accurate
and regular data on environmental sanitation
MLGRD EHSD/MoE-GETFUND 2009 – 2024
F2 Carry out assessments to determine effective
demand of communities (urban, peri-urban, small
towns and rural) for environmental infrastructure
MLGRD EHSD/TCPD 2008 – 2024
Support studies on alternative technology options
for improving services to low-income urban areas,
small towns and rural areas
MLGRD KNUST/CSIR/PRIVATE SECTOR
2011
F3 Ensure that relevant agencies, at all levels, provide
timely and reliable data and information for tracking
sector progress for national development planning
MLGRD NDPC/EHSD/NESPoCC/GSS 2009 – 2024
Specific Component Measures: Solid Waste Management
F1 Develop framework for tracking the volumes and
types of waste streams generated from all
segments of the economy
MMDAs EHSD/CSIR/MoE 2009
Examine and assess the capabilities of existing
research and service institutions and provide
appropriate support for research on environmental
sanitation
MLGRD EHSD/MoE 2011 – 2015
F2 Support local private sector entrepreneurs and
artisanal entities to produce machines, equipment
and tools appropriate for local use
MLGRD MoFEP 2011 – 2015
F3 Support research and studies in volumes and types
of waste from predominant sectors and segments of
the economy (especially sources of non-
biodegradable-organic-fractions, special and
hazardous wastes)
MLGRD MoE/MoFEP 2010 – 2011
Support research in handling and alternative uses of
existing and changing composition of waste streams MLGRD MoE/CSIR/MoFEP 2009 – 2015
Support research in identifying fractions of waste
streams with appropriate thermal values for waste-
to-energy systems
MLGRD MoE/MoFEP 2015
Specific Component Measures: Excreta Management
F1 Examine and assess the capabilities of existing
research and service institutions and provide
appropriate support for research on environmental
sanitation
MLGRD MoE/ILGS 2010 – 2015
Develop framework for tracking the volumes and
types of waste streams generated from all
segments of the economy
MLGRD EHSD/CSIR/PRIVATE SECTOR 2011
Specific Component Measures: Storm Water Drainage and Sullage Conveyance
Specific Component Measures: Environmental Sanitation Education and Enforcement Management (Food Hygiene,
4
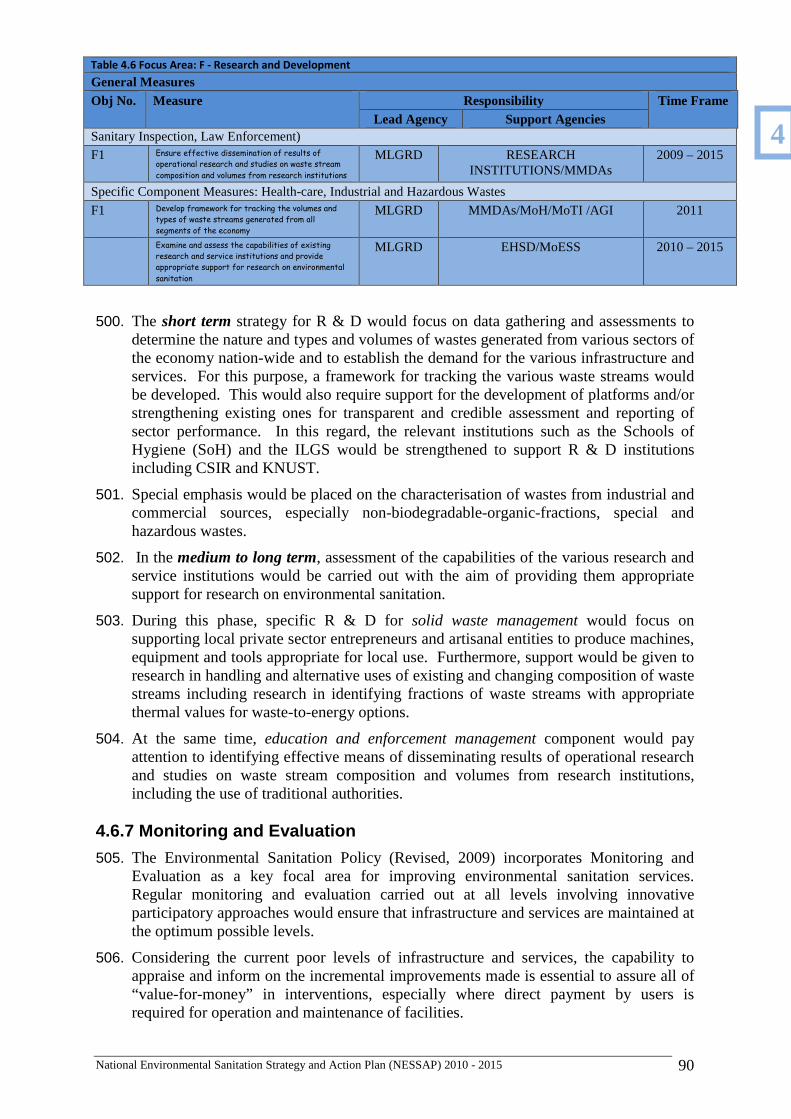
National Environmental Sanitation Strategy and Action Plan (NESSAP) 2010 - 2015 90
Table 4.6 Focus Area: F - Research and Development
General Measures Obj No. Measure Responsibility Time Frame
Lead Agency Support Agencies Sanitary Inspection, Law Enforcement)
F1 Ensure effective dissemination of results of
operational research and studies on waste stream
composition and volumes from research institutions
MLGRD RESEARCH INSTITUTIONS/MMDAs
2009 – 2015
Specific Component Measures: Health-care, Industrial and Hazardous Wastes
F1 Develop framework for tracking the volumes and
types of waste streams generated from all
segments of the economy
MLGRD MMDAs/MoH/MoTI /AGI 2011
Examine and assess the capabilities of existing
research and service institutions and provide
appropriate support for research on environmental
sanitation
MLGRD EHSD/MoESS 2010 – 2015
500. The short term strategy for R & D would focus on data gathering and assessments to determine the nature and types and volumes of wastes generated from various sectors of the economy nation-wide and to establish the demand for the various infrastructure and services. For this purpose, a framework for tracking the various waste streams would be developed. This would also require support for the development of platforms and/or strengthening existing ones for transparent and credible assessment and reporting of sector performance. In this regard, the relevant institutions such as the Schools of Hygiene (SoH) and the ILGS would be strengthened to support R & D institutions including CSIR and KNUST.
501. Special emphasis would be placed on the characterisation of wastes from industrial and commercial sources, especially non-biodegradable-organic-fractions, special and hazardous wastes.
502. In the medium to long term, assessment of the capabilities of the various research and service institutions would be carried out with the aim of providing them appropriate support for research on environmental sanitation.
503. During this phase, specific R & D for solid waste management would focus on supporting local private sector entrepreneurs and artisanal entities to produce machines, equipment and tools appropriate for local use. Furthermore, support would be given to research in handling and alternative uses of existing and changing composition of waste streams including research in identifying fractions of waste streams with appropriate thermal values for waste-to-energy options.
504. At the same time, education and enforcement management component would pay attention to identifying effective means of disseminating results of operational research and studies on waste stream composition and volumes from research institutions, including the use of traditional authorities.
4.6.7 Monitoring and Evaluation
505. The Environmental Sanitation Policy (Revised, 2009) incorporates Monitoring and Evaluation as a key focal area for improving environmental sanitation services. Regular monitoring and evaluation carried out at all levels involving innovative participatory approaches would ensure that infrastructure and services are maintained at the optimum possible levels.
506. Considering the current poor levels of infrastructure and services, the capability to appraise and inform on the incremental improvements made is essential to assure all of “value-for-money” in interventions, especially where direct payment by users is required for operation and maintenance of facilities.
4
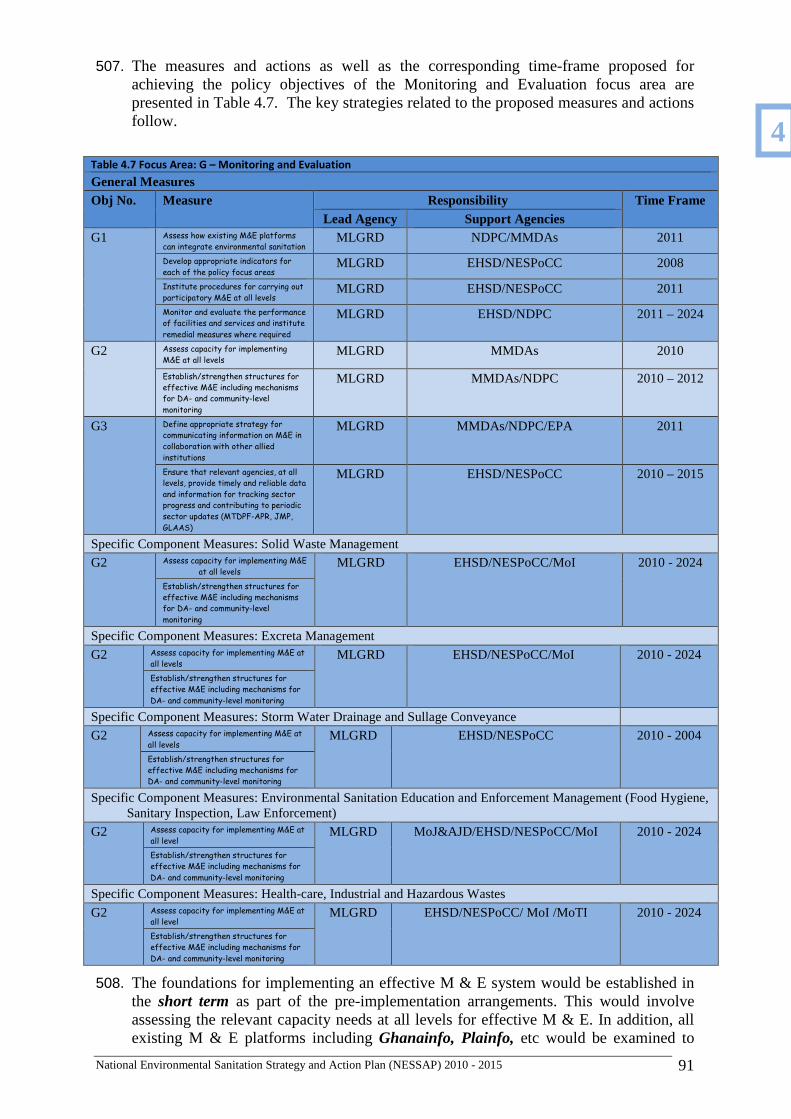
National Environmental Sanitation Strategy and Action Plan (NESSAP) 2010 - 2015 91
507. The measures and actions as well as the corresponding time-frame proposed for achieving the policy objectives of the Monitoring and Evaluation focus area are presented in Table 4.7. The key strategies related to the proposed measures and actions follow.
Table 4.7 Focus Area: G – Monitoring and Evaluation
General Measures Obj No. Measure Responsibility Time Frame
Lead Agency Support Agencies G1 Assess how existing M&E platforms
can integrate environmental sanitation MLGRD NDPC/MMDAs 2011
Develop appropriate indicators for
each of the policy focus areas MLGRD EHSD/NESPoCC 2008
Institute procedures for carrying out
participatory M&E at all levels MLGRD EHSD/NESPoCC 2011
Monitor and evaluate the performance
of facilities and services and institute
remedial measures where required
MLGRD EHSD/NDPC 2011 – 2024
G2 Assess capacity for implementing
M&E at all levels MLGRD MMDAs 2010
Establish/strengthen structures for
effective M&E including mechanisms
for DA- and community-level
monitoring
MLGRD MMDAs/NDPC 2010 – 2012
G3 Define appropriate strategy for
communicating information on M&E in
collaboration with other allied
institutions
MLGRD MMDAs/NDPC/EPA 2011
Ensure that relevant agencies, at all
levels, provide timely and reliable data
and information for tracking sector
progress and contributing to periodic
sector updates (MTDPF-APR, JMP,
GLAAS)
MLGRD EHSD/NESPoCC 2010 – 2015
Specific Component Measures: Solid Waste Management
G2 Assess capacity for implementing M&E
at all levels MLGRD EHSD/NESPoCC/MoI 2010 - 2024
Establish/strengthen structures for
effective M&E including mechanisms
for DA- and community-level
monitoring
Specific Component Measures: Excreta Management
G2 Assess capacity for implementing M&E at
all levels MLGRD EHSD/NESPoCC/MoI 2010 - 2024
Establish/strengthen structures for
effective M&E including mechanisms for
DA- and community-level monitoring Specific Component Measures: Storm Water Drainage and Sullage Conveyance
G2 Assess capacity for implementing M&E at
all levels MLGRD EHSD/NESPoCC 2010 - 2004
Establish/strengthen structures for
effective M&E including mechanisms for
DA- and community-level monitoring Specific Component Measures: Environmental Sanitation Education and Enforcement Management (Food Hygiene,
Sanitary Inspection, Law Enforcement)
G2 Assess capacity for implementing M&E at
all level MLGRD MoJ&AJD/EHSD/NESPoCC/MoI 2010 - 2024
Establish/strengthen structures for
effective M&E including mechanisms for
DA- and community-level monitoring
Specific Component Measures: Health-care, Industrial and Hazardous Wastes
G2 Assess capacity for implementing M&E at
all level MLGRD EHSD/NESPoCC/ MoI /MoTI 2010 - 2024
Establish/strengthen structures for
effective M&E including mechanisms for
DA- and community-level monitoring
508. The foundations for implementing an effective M & E system would be established in the short term as part of the pre-implementation arrangements. This would involve assessing the relevant capacity needs at all levels for effective M & E. In addition, all existing M & E platforms including Ghanainfo, Plainfo, etc would be examined to
4
National Environmental Sanitation Strategy and Action Plan (NESSAP) 2010 - 2015 92
identify the access points for integrating environmental sanitation components. This would be done concurrently with the development of appropriate indicators for monitoring the various aspects of the policy implementation as well as the specific components of environmental sanitation.
509. Once the foundation has been laid, appropriate procedures would be instituted for carrying out participatory M&E at all levels including defining appropriate strategy for communicating information on M&E in collaboration with other allied institutions.
510. Up to the medium term, emphasis would be placed on strengthening structures for effective M&E including mechanisms for DA- and community-level monitoring; where necessary new structures would also be established.
511. Throughout the implementation phase, it is expected that monitoring and evaluation of the performance of facilities and services and instituting remedial measures where required, would be a permanent feature into the long term. To this end, efforts would be made to ensure that relevant agencies, at all levels, provide timely and reliable data and information for tracking sector progress and contributing to periodic sector updates.
512. A core strategic focus of M&E will be on how the various segments of the “green economy” are responding to policy actions and affecting the total economy. For example, the growth in “green-collar” jobs as a proportion of the total employment levels in the country will be assessed against any perceived improvements in the key sectors of the economy.
513. Civil society, NGOs and other advocacy groupings (including those involved in religious, human-rights and legal activities) will be involved in sector performance appraisals and reporting to ensure transparency and pursuit of required reforms and/or improvements. For example, the roles of the Inter-Faith Waste Management Initiative (IFAWAMI), CONIWAS and CONINWAM in sector performance appraisal and reporting at national, regional, district and community levels will be examined and appropriately supported.
514. The involvement of sub-metropolitan districts, zonal, town and area councils in M&E of all components of environmental sanitation infrastructure and services will be implemented to ensure that sub-projects and interventions emanating from DESSAPs are adequately informed by users of the services themselves.
515. At the national level the dissemination of sector performance involving traditional authorities, NGOs, religious bodies, ministries, departments and agencies under the auspices of the Ministry of Information and National Orientation (MoINO) will be implemented to provide the necessary high-level platform for M&E reportage.
4.7 Linking National Strategies to DESSAPs
516. The above strategies and action plans for each of the focus areas and components of the Environmental Sanitation Policy (Revised, 2009), provides the initial policy-level strategies and plan targets. These will guide the preparation of DESSAPs based on the comprehensive country-wide baseline information on environmental sanitation.
517. DESSAPs provide the critical “bottom-up” feedback needed for updating the NESSAP. The NESSAP and DESSAPs provides the necessary standards and data for preparing the SESIP and hence the framework for financing environmental sanitation.
4
National Environmental Sanitation Strategy and Action Plan (NESSAP) 2010 - 2015 93
4.8 Environmental Implications of Proposed Strategies 518. The NESSAP proposes a wide range of strategies and actions under the different focus
areas, aimed at addressing the many challenges facing the environmental sanitation sector. Implementing the strategies of the NESSAP has the potential of benefits as well as adverse effects on the environment that have to be accounted for.
519. The potential adverse effects are expected to arise more from the impacts of construction and operation of various facilities such as drains, Material recovery Facilities (MRFs), treatment sites etc. However, the application of SEA in the overall ESP/NESSAP development process has ensured that obvious environmental effects are considered in the strategy formulation. It is therefore expected that the overall benefits to the environment will exceed the adverse effects.
520. As required adherence to EA Regulations of 1999 (LI 1652) will ensure that EIAs for relevant interventions are carried out to ensure that appropriate mitigation is carried out. Implementation of the strategies of NESSAP is expected to improve the key environmental concerns listed under Section 2.2., and lead to improvements in the physical environment and general health of the population, particularly residents of low-income areas.
521. It is important to emphasise that improvements in environmental sanitation will go a long way to propel Ghana towards the achievement of MDG on environmental sustainability. Reducing and ultimately eliminating the widespread pollution of water bodies and wetlands caused by improper waste disposal and inadequate waste water management practices will lead to improved water quantity and quality and thereby ensure sustainable provision of water for consumption and production.
522. Improving the treatment and management of wastes on the whole will reduce carbon emissions arising from widespread indiscriminate dumping and burning of refuse which contributes to the phenomenon of climate change (global warming) with the attendant negative effects on health and livelihoods.
4.9 Implications of NESSAP Targets and MDGs 523. The strategies and targets indicated under Section 4.6, apart from the promotion of
improved household sanitation facilities, are not related directly to any specific MDG target but rather considered as severally contributing to achieving aspects of the targets of all the MDGs, in particular Goal 7 (Environmental Sustainability).
524. This is demonstrated in Figure 4.1. As the various programmes of the NESSAP are tackled to cover all the components of environmental sanitation it is expected to contribute, in the process, towards achieving all the MDGs.
525. Owing to the lack of clearly stated targets for most of the components of environmental sanitation apart from excreta disposal (Goal 7, Target 7c), the relationship between NESSAP targets and other MDGs can only be partially described qualitatively and by means of proxy indicators.
526. For example, the proposed adoption of the term material-in-transition (“MINT”) for all discards (instead of “waste”) and the process of “minting” to derive maximum benefits along the value-chain of each component of environmental sanitation is aimed at identifying all the potential sector “value-chain” enterprises to provide more “green collar” jobs. This is directly related to MDG Goal 1 “Eradicate Extreme Poverty”
Figure 4.1: The link between Environmental Sanitation and MDGs
4
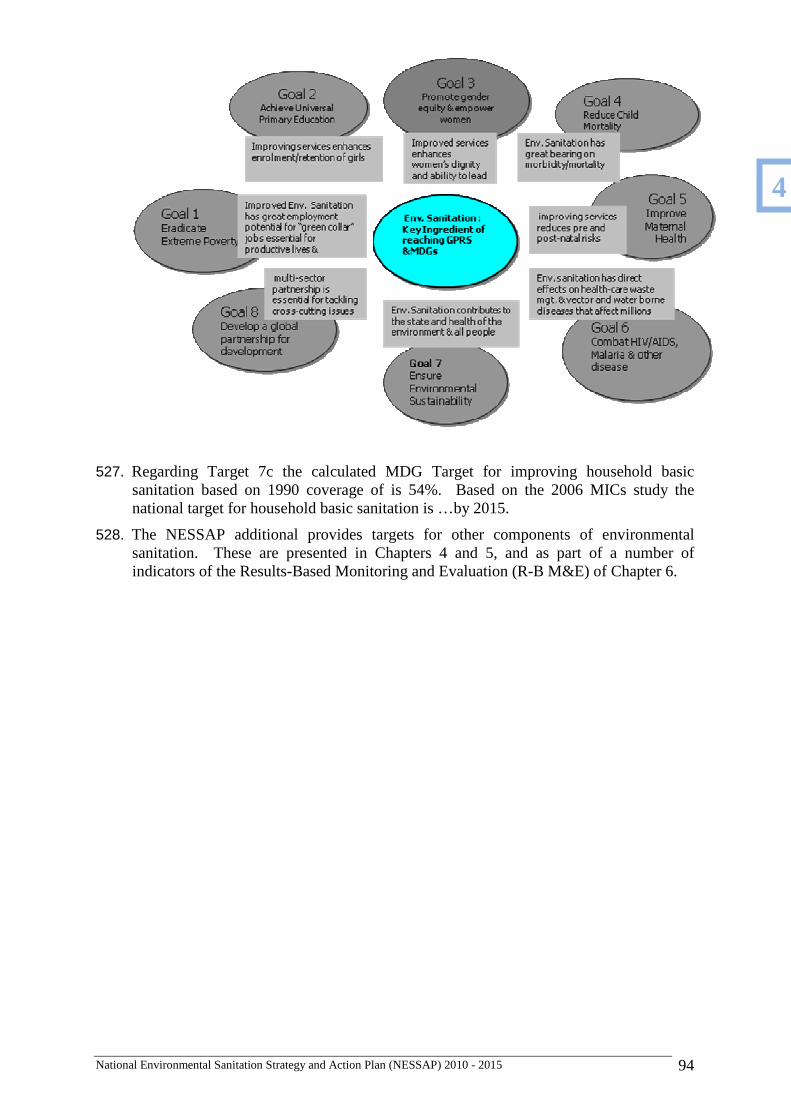
National Environmental Sanitation Strategy and Action Plan (NESSAP) 2010 - 2015 94
527. Regarding Target 7c the calculated MDG Target for improving household basic sanitation based on 1990 coverage of is 54%. Based on the 2006 MICs study the national target for household basic sanitation is …by 2015.
528. The NESSAP additional provides targets for other components of environmental sanitation. These are presented in Chapters 4 and 5, and as part of a number of indicators of the Results-Based Monitoring and Evaluation (R-B M&E) of Chapter 6.
4
National Environmental Sanitation Strategy and Action Plan (NESSAP) 2010 - 2015 95
5 Requirements for Improving Services and Infrastructures
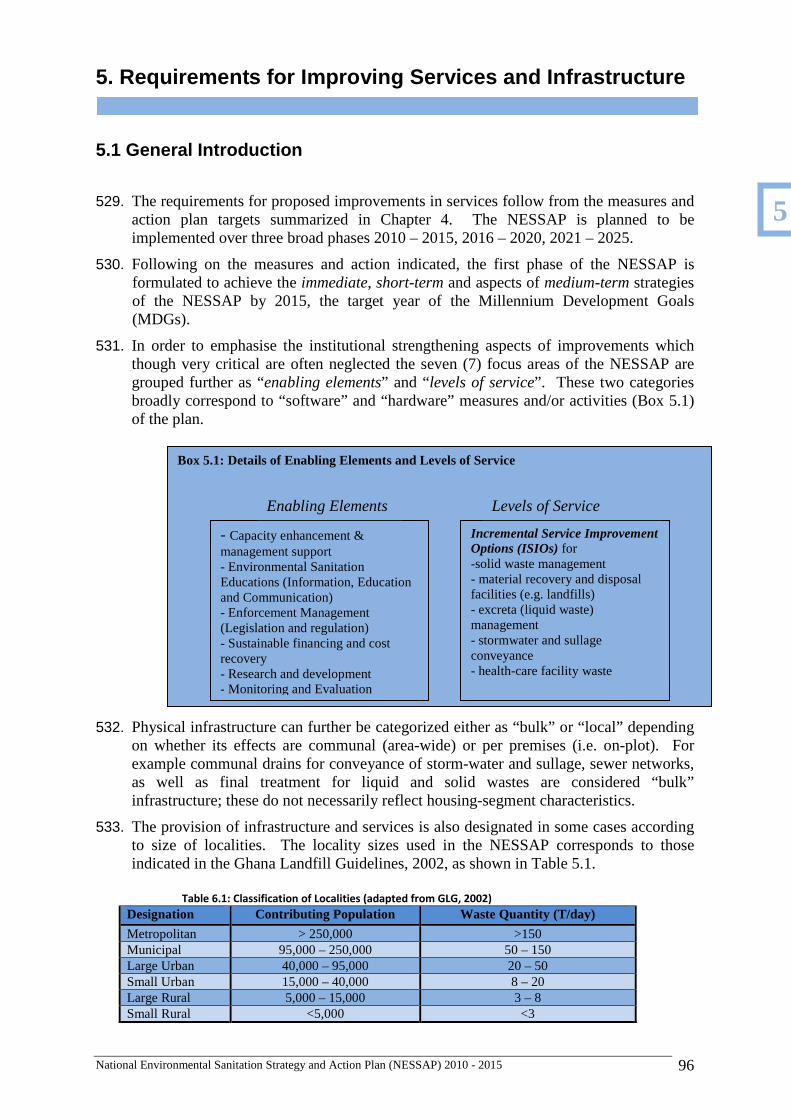
National Environmental Sanitation Strategy and Action Plan (NESSAP) 2010 - 2015 96
5. Requirements for Improving Services and Infrastr ucture
5.1 General Introduction
529. The requirements for proposed improvements in services follow from the measures and action plan targets summarized in Chapter 4. The NESSAP is planned to be implemented over three broad phases 2010 – 2015, 2016 – 2020, 2021 – 2025.
530. Following on the measures and action indicated, the first phase of the NESSAP is formulated to achieve the immediate, short-term and aspects of medium-term strategies of the NESSAP by 2015, the target year of the Millennium Development Goals (MDGs).
531. In order to emphasise the institutional strengthening aspects of improvements which though very critical are often neglected the seven (7) focus areas of the NESSAP are grouped further as “enabling elements” and “levels of service”. These two categories broadly correspond to “software” and “hardware” measures and/or activities (Box 5.1) of the plan.
532. Physical infrastructure can further be categorized either as “bulk” or “local” depending on whether its effects are communal (area-wide) or per premises (i.e. on-plot). For example communal drains for conveyance of storm-water and sullage, sewer networks, as well as final treatment for liquid and solid wastes are considered “bulk” infrastructure; these do not necessarily reflect housing-segment characteristics.
533. The provision of infrastructure and services is also designated in some cases according to size of localities. The locality sizes used in the NESSAP corresponds to those indicated in the Ghana Landfill Guidelines, 2002, as shown in Table 5.1.
Table 6.1: Classification of Localities (adapted from GLG, 2002)
Designation Contributing Population Waste Quantity (T/day)
Metropolitan > 250,000 >150 Municipal 95,000 – 250,000 50 – 150 Large Urban 40,000 – 95,000 20 – 50 Small Urban 15,000 – 40,000 8 – 20 Large Rural 5,000 – 15,000 3 – 8 Small Rural <5,000 <3
Box 5.1: Details of Enabling Elements and Levels of Service
- Capacity enhancement & management support - Environmental Sanitation Educations (Information, Education and Communication) - Enforcement Management (Legislation and regulation) - Sustainable financing and cost recovery - Research and development - Monitoring and Evaluation
Enabling Elements
Incremental Service Improvement Options (ISIOs) for -solid waste management - material recovery and disposal facilities (e.g. landfills) - excreta (liquid waste) management - stormwater and sullage conveyance - health-care facility waste
Levels of Service
5
National Environmental Sanitation Strategy and Action Plan (NESSAP) 2010 - 2015 97
534. The process followed in determining the improvements required for implementing the enabling elements and achieving the service targets and the corresponding additional resources i.e. “financing gap”, is presented in Figure 5.1. The process is the basis for the model adopted for the accompanying Strategic Environmental Sanitation Investment Plan (SESIP).
5.2 Options for Enabling Elements 535. Analyses of how to effectively implement the activity (ies) and operationalise the
measures for each of the enabling elements of the NESSAP gives an indication of the additional resources needed.
536. The resources for Enabling elements covering Capacity Enhancement and Management Support, Environmental Sanitation Education (covering all aspects of Information, Education and Communication, IEC), Enforcement Management (Legislation and Regulation), Financing and Cost Recovery, Research and Development, Monitoring and Evaluation are derived by estimating what is required for implementing the activities of the measures indicated in Tables 4.1 – 4.7 of Chapter 4.
537. The activities are derived from the measures related to objectives A1 – A5, B1 – B6, C1 – C7, D1 – D3, F1 – F3, G1 – G3, and aspects of E1 and E2 (under Levels of Service).
538. For a number of measures it is practical to indicate the costs of enabling elements as proportion of that of ‘management support’ due to incremental operational activities. Where this is applied the specific category of enabling element should be clearly indicated.
539. A special case is made for CLTS as a tool for scaling-up improved environmental sanitation services with community participation as central. Among the lessons learned from implementing CLTS34 including (i) that Open-Defaecation-Free (ODF) status of communities are a necessary but insufficient condition to good environmental sanitation and hygiene, and (ii) that other infrastructure have an influencing factor for changing sanitation practices support the need to tackle environmental sanitation holistically as is the case for the NESSAP.
5.3. Options for Levels of Services 540. The determination of what is required for improving Levels of Service is carried out
through a detailed analysis of proposed measures against specific service targets.
541. The activities (interventions) are those related to objectives E2 – E5 and the proposed measures.
542. The proposed requirements for improvements are also based on the three qualitative service-levels defined by the MLGRD/MEST. These qualitative levels of service are “minimum, comfortable, and amenity”35.
543. The above levels of service are detailed further to correspond to specific modes referred to as Incremental Service Improvement Options (ISIOs). The ISIOs present a basis for gradual improvements for selected components of environmental sanitation.
544. The existing situation is analysed for each of the service areas (or types of services) for the key components of environmental sanitation services. Comparing the current (existing) situation of any locality (community) with the target Incremental Service Improvement Options (ISIOs) provides a basis for estimating the gap(s) required for
34 See pp. 266,292,388 and entire sections in Beyond Construction, Use by All. WaterAid, IRC, WSSCC. 2008. 35 Qualitative description of “unacceptable, minimum, comfortable and amenity” levels of service Preparation of District Waste Management Plans in Ghana. Best Practice Environmental Guidelines Series No.3. EPA/MES/MLGRD, July 2002.
5
National Environmental Sanitation Strategy and Action Plan (NESSAP) 2010 - 2015 98
improvement (see Figure 5.1). Resources to meet the gap are then derived using unit costs and/or expenditure functions.
545. As there can be several modes of providing services to meet the qualitative description of levels of service (“minimum”, “comfortable” and “amenity”) the ISIOs in the NESSAP and the modes of services and facilities described are based on expert judgement.
546. The ability to adapt these modes to suit individual conditions in each locality presents the challenge of designing a flexible programme that can be used by MMDAs (and their sub-divisions)36 to update their baseline data and hence DESSAPs.
547. In the following sections the ISIOs for the key components of environmental sanitation are described.
5.3.1 Incremental Service Improvement Options (ISIO s)
548. The service levels for each component of environmental sanitation are indicated as Incremental Service Improvement Options (ISIOs) to be achieved over the three planning periods, 2010-2015, 2016-2020, and 2021-2025. Thus, for each component of environmental sanitation the existing level of service is determined (based on information on DESSAPs and other sources such as Population and Housing Census), and the expected incremental improvements to any of the minimum, comfortable, and amenity levels proposed respectively.
549. In the initial situation service levels may differ among communities and types of services, thus MMDAs and their subdivisions will necessarily focus on those services lagging behind to improve to the “minimum” level.
550. For example, if it is assumed that at present, in a certain community, the service level for a certain component of environmental sanitation is unacceptable. The required improvement will be to attain the “minimum” level by 2015 or earlier.
551. In another instance, the community may operate its services at the “minimum” level with respect to some components, such as collection of solid waste, while its service level on other components, for example excreta management, may be “unsatisfactory”. In this case, the community may want to increase the service level on excreta management to the “minimum” level by 2015, while keeping the collection of solid waste at its present level or improve it further.
552. The community would aspire to moving forward with both components, so that solid waste management is improved to the comfortable level, at the same time as the excreta management is improved initially to the minimum level. This will ensure integrated environmental sanitation improvement and management.
.
36 A computer programme MINT*ESAA based on the concepts of Material in Transition (MINT) and Environmental Sanitation Assessment and Audits (ESAA) when fully developed will allow users to make alternate choices regarding enabling elements and ISIOs.
5
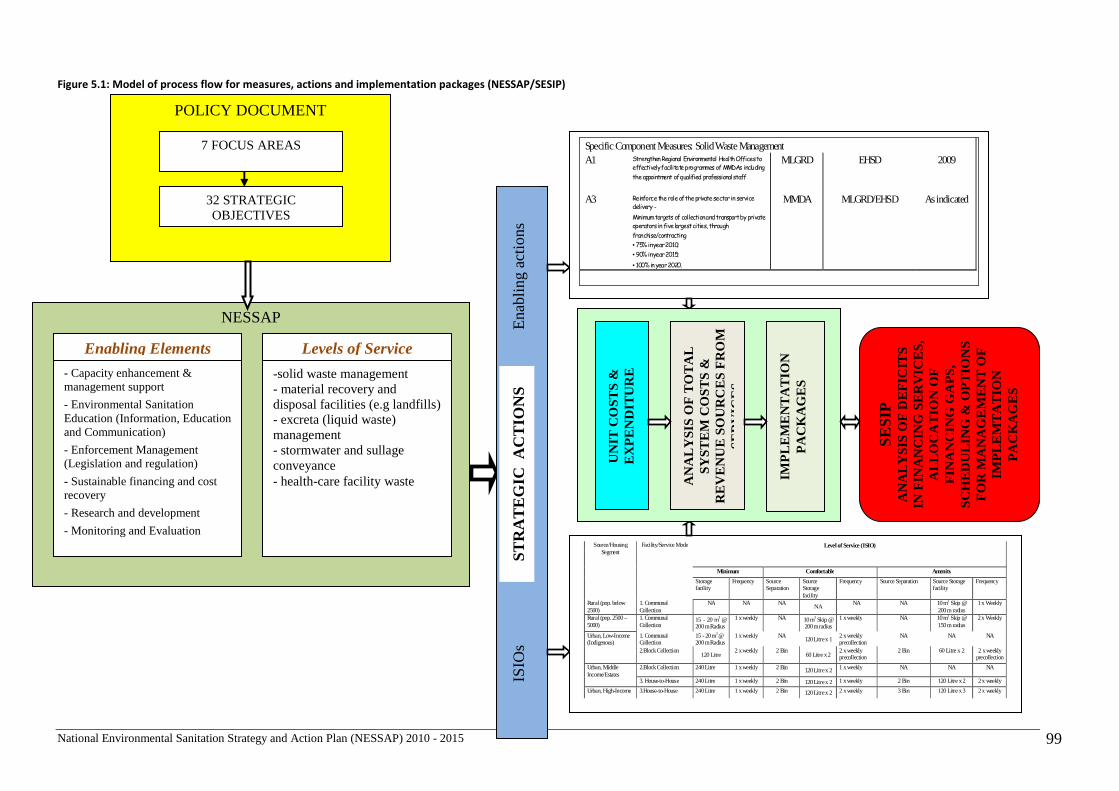
National Environmental Sanitation Strategy and Action Plan (NESSAP) 2010 - 2015 99
Figure 5.1: Model of process flow for measures, actions and implementation packages (NESSAP/SESIP)
NESSAP
- Capacity enhancement & management support
- Environmental Sanitation Education (Information, Education and Communication)
- Enforcement Management (Legislation and regulation)
- Sustainable financing and cost recovery
- Research and development
- Monitoring and Evaluation
Enabling Elements
-solid waste management - material recovery and disposal facilities (e.g landfills) - excreta (liquid waste) management - stormwater and sullage conveyance - health-care facility waste
Levels of Service
POLICY DOCUMENT
7 FOCUS AREAS
32 STRATEGIC OBJECTIVES
ST
RA
TE
GIC
AC
TIO
NS
E
nabl
ing
actio
ns
ISIO
s
Specific Component Measures: Solid Waste Management A1 Strengthen Regional Environmental Health Offices to
effectively facilitate programmes of MMDAs including
the appointment of qualified professional staff
MLGRD EHSD 2009
A3 Reinforce the role of the private sector in service delivery -
Minimum targets of collection and transport by private operators in five largest cities, through
franchise/contracting
• 75% in year 2010;
• 90% in year 2015;
• 100% in year 2020.
MMDA MLGRD/EHSD As indicated
Source/Housing Segment
Facility/Service Mode Level of Service (ISIO)
Minimum Comfortable Amenity
Storage facility
Frequency Source Separation
Source Storage facility
Frequency Source Separation Source Storage facility
Frequency
Rural (pop. below 2500)
1. Communal Collection
NA NA NA NA
NA NA 10 m3 Skip @ 200 m radius
1 x Weekly
Rural (pop. 2500 – 5000)
1. Communal Collection
15 - 20 m3 @ 200 m Radius
1 x weekly NA 10 m3 Skip @ 200 m radius
1 x weekly NA 10 m3 Skip @ 150 m radius
2 x Weekly
Urban, Low-Income (Indigenous)
1. Communal Collection
15 - 20 m3 @ 200 m Radius
1 x weekly NA 120 Litre x 1
2 x weekly precollection
NA NA NA
2.Block Collection 120 Litre
2 x weekly 2 Bin 60 Litre x 2
2 x weekly precollection
2 Bin 60 Litre x 2 2 x weekly precollection
Urban, Middle Income/Estates
2.Block Collection 240 Litre 1 x weekly 2 Bin 120 Litre x 2 1 x weekly NA NA NA
3. House-to-House 240 Litre 1 x weekly 2 Bin 120 Litre x 2 1 x weekly 2 Bin 120 Litre x 2 2 x weekly
Urban, High-Income 3.House-to-House 240 Litre 1 x weekly 2 Bin 120 Litre x 2 2 x weekly 3 Bin 120 Litre x 3 2 x weekly
UN
IT C
OS
TS
&
EX
PE
ND
ITU
RE
F
UN
CT
ION
S
AN
ALY
SIS
OF
TO
TA
L S
YS
TE
M C
OS
TS
&
RE
VE
NU
E S
OU
RC
ES
FR
OM
S
ER
VIC
ES
SE
SIP
A
NA
LYS
IS O
F D
EF
ICIT
S
IN F
INA
NC
ING
SE
RV
ICE
S,
ALL
OC
AT
ION
OF
F
INA
NC
ING
GA
PS
, S
CH
ED
ULI
NG
& O
PT
ION
S
FO
R M
AN
AG
EM
EN
T O
F
IMP
LEM
TA
TIO
N
PA
CK
AG
ES
IMP
LEM
EN
TA
TIO
N
PA
CK
AG
ES
National Environmental Sanitation Strategy and Action Plan (NESSAP) 2010 - 2015 100
5.3.1.1 ISIOs for Solid Waste Management
553. Municipal Solid Waste Collection and Transport: based on the predominant mode of housing and common collection services currently employed. Tables 2.1 and 2.2 indicate the service options adopted for refuse collection and the typical transport modes defined in the NESSAP.
554. In line with planned improvements in service levels, the ISIOs indicate a gradual introduction of source-separation of refuse. This is a reflection of the strategies that shall be implemented to achieve the policy objectives of reduction, reuse, recycling and recovery (4Rs) and the related “MINT” strategies.
555. Sweeping of Streets and Public Places (Central Business Districts, Taxi/Bus/Lorry Terminals, Markets, etc.): indiscriminate littering contributes to the many unsightly conditions prevailing in almost all public places especially markets and bus terminals. There are no specific ISIOs for sweeping of streets and public places, but a minimum desirable level of ensuring absence of accumulated refuse within the vicinity of public activity, particularly, during peak hours.
556. The applicable service standard is to adopt the practice of engaging waste-pickers to frequently rid such places of refuse and provision of strategically located refuse storage bins together with consistent education and enforcement of nuisance bye-laws.
557. Cleaning of Beaches and Shores: Ghana’s beaches have not been attractive as result of the deposit of solid waste material into drains and water courses carried by rivers into the sea, particularly during rains, and their subsequent wash back unto the beaches. Also almost all the communities living on beaches traditionally use the beaches as their place of convenience and defecate indiscriminately at the beaches and thus devaluing any touristic use.
558. Annex 3, Table A7 shows all the twenty one (21) MMDAs that have coast lines and beach communities. Three of these are metropolitan assemblies with large populations that impact greatly on the sanitary conditions of the beaches. There are no readily available cost-functions for this activity.
559. Mining (evacuation) of Large Refuse Dumps in Small, Medium and Large Towns: the baseline data compiled on refuse dumps indicates a large number of unauthorized refuse dumps scattered nationwide. In many cases they are located either on vacant private lots of land or on community lands earmarked for recreational activities. There are no available unit cost functions for this activity.
560. Material Recovery (and Treatment) Facilities: Tables 5.5 and 5.6 indicate examples of facilities for typical MSW recovery, treatment and disposal operations. In keeping with the underlying NESSAP principle of investing more in “4Rs” all final disposal sites (including landfills) are designated as Material Recovery Facilities (MRFs).
561. The sitting of faecal sludge treatment facilities together with solid waste treatment where feasible, in order to optimize the gains from additional mechanical, biological treatment (MBT) is recommended as good practice.
562. In accordance with the GLG, 2002, five types of landfilling are considered in the NESSAP. The “minimum” operation to be achieved is one of controlled (improved) manual-dumping operations while emphasising composting of the bio-degradable organic fraction (BoF) of the waste stream (see Table 5.5). Where inert material is land-filled it is regarded only as stored temporarily until it is mined.
563. A special category of Material Recovery Facility (MRF) is Waste Electrical and Electronic Equipment (WEEE, e-waste belongs to this category) collection and handling centres to cater for the growing quantities of imported used equipment whose end-of-life occurs in our cities, towns and villages.
5
National Environmental Sanitation Strategy and Action Plan (NESSAP) 2010 - 2015 101
564. The Environmental Protection Agency (EPA) has developed guidelines for the establishment of such facilities and it is expected that the private sector will benefit from investments as a result of the EU Directive for handling end-of-life of electrical and electronic equipment originating from the EU.
565. Recycling plants (stations) are increasingly being installed by the private sector and this will be supported as a means of reaching the “4Rs” objective. This far the preference of the private sector has been in metal and plastic recycling. A number of “bring” stations will be established to cater for household-level recyclable material, other difficult-to-handle bulky and hazardous waste.
566. Composting plants will be developed and managed as part of all categories of final disposal sites as a minimum ISIO for MRFs.
5.3.1.2 ISIOs for Excreta (Liquid Waste) Management
567. The facilities for ‘hygienic disposal of human excreta’ shown for the various levels of service are indicative only and based on commonly encountered technologies used in Ghana. For consistency the housing segments applied for SWM are also applied in this case, with more details. The distribution also follows the predominant sanitation planning areas that have been used for a number of Strategic Sanitation Plans (SSPs) for Ghana’s five largest cities.
568. The technologies shown are not prescriptive as the Revised Environmental Sanitation Policy (2009) emphasizes the concept of “sanitation ladder” and thus endorses all categories of improved technologies.
569. For wastewater collection systems, the levels of service are those applicable to the main housing segments. For public toilets serving urban communities it is assumed that upgrading from on-plot systems to interceptor tanks for small-bore sewerage systems and then to shallow (simplified) sewers is the appropriate and logical improvement in levels of service.
570. Due to the predominance of on-plot systems that require off-site treatment of a mixture of septage (contents from unsettled septic tank) and faecal sludge (night-soil) of high-Bio-chemical Oxygen Demand (BOD) from public toilets, the treatment systems covered are the common robust examples that have been applied locally in Ghana.
571. Adoption of decentralised-excreta-treatment-resource-recovery and re-use (DETERRR) systems is also recommended. Bio-digester is one of the favourable options for decentralized-excreta-treatment-resource-recovery and reuse systems which can lead to cost-reduction in developing central treatment facilities, especially for handling faecal sludge from public toilets and domestic on-plot systems.
572. Another dimension for improving environmental sanitation, as proven elsewhere is the adoption of Community-Led Total Sanitation (CLTS) as a nation-wide strategy for sanitation promotion in rural areas and small towns of population less than 7,500.
573. Therefore, in considering the indicated technologies for excreta management and the required improvements, account has to be taken of current trends of focusing more on awareness-raising for change in sanitation-behaviour and promotion of improved public health and sanitation systems. These issues are handled more effectively under enabling elements so as to ignite and sustain uptake by households and communities.
5
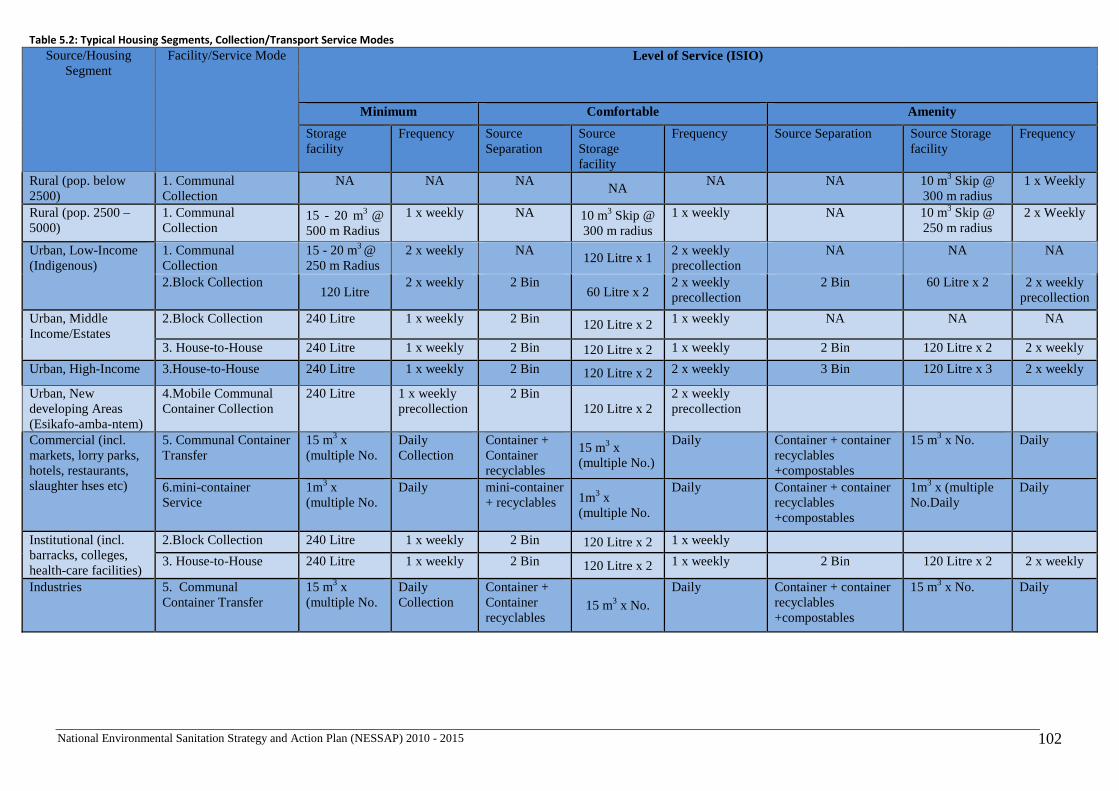
National Environmental Sanitation Strategy and Action Plan (NESSAP) 2010 - 2015 102
Table 5.2: Typical Housing Segments, Collection/Transport Service Modes
Source/Housing Segment
Facility/Service Mode Level of Service (ISIO)
Minimum Comfortable Amenity
Storage facility
Frequency Source Separation
Source Storage facility
Frequency Source Separation Source Storage facility
Frequency
Rural (pop. below 2500)
1. Communal Collection
NA NA NA NA
NA NA 10 m3 Skip @ 300 m radius
1 x Weekly
Rural (pop. 2500 – 5000)
1. Communal Collection
15 - 20 m3 @ 500 m Radius
1 x weekly NA 10 m3 Skip @ 300 m radius
1 x weekly NA 10 m3 Skip @ 250 m radius
2 x Weekly
Urban, Low-Income (Indigenous)
1. Communal Collection
15 - 20 m3 @ 250 m Radius
2 x weekly NA 120 Litre x 1
2 x weekly precollection
NA NA NA
2.Block Collection 120 Litre
2 x weekly 2 Bin 60 Litre x 2
2 x weekly precollection
2 Bin 60 Litre x 2 2 x weekly precollection
Urban, Middle Income/Estates
2.Block Collection 240 Litre 1 x weekly 2 Bin 120 Litre x 2 1 x weekly NA NA NA
3. House-to-House 240 Litre 1 x weekly 2 Bin 120 Litre x 2 1 x weekly 2 Bin 120 Litre x 2 2 x weekly
Urban, High-Income 3.House-to-House 240 Litre 1 x weekly 2 Bin 120 Litre x 2 2 x weekly 3 Bin 120 Litre x 3 2 x weekly
Urban, New developing Areas (Esikafo-amba-ntem)
4.Mobile Communal Container Collection
240 Litre 1 x weekly precollection
2 Bin 120 Litre x 2
2 x weekly precollection
Commercial (incl. markets, lorry parks, hotels, restaurants, slaughter hses etc)
5. Communal Container Transfer
15 m3 x (multiple No.
Daily Collection
Container + Container recyclables
15 m3 x (multiple No.)
Daily Container + container recyclables +compostables
15 m3 x No. Daily
6.mini-container Service
1m3 x (multiple No.
Daily mini-container + recyclables 1m3 x
(multiple No.
Daily Container + container recyclables +compostables
1m3 x (multiple No.Daily
Daily
Institutional (incl. barracks, colleges, health-care facilities)
2.Block Collection 240 Litre 1 x weekly 2 Bin 120 Litre x 2 1 x weekly
3. House-to-House 240 Litre 1 x weekly 2 Bin 120 Litre x 2 1 x weekly 2 Bin 120 Litre x 2 2 x weekly
Industries 5. Communal Container Transfer
15 m3 x (multiple No.
Daily Collection
Container + Container recyclables
15 m3 x No. Daily Container + container
recyclables +compostables
15 m3 x No. Daily
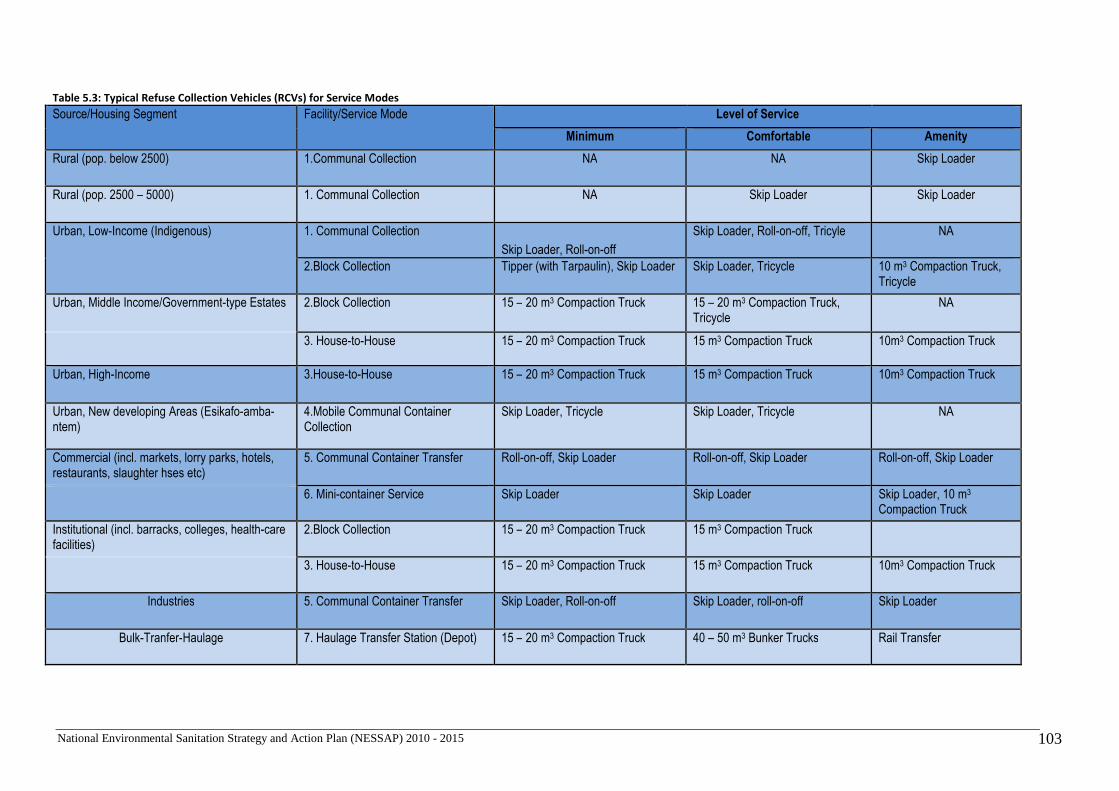
National Environmental Sanitation Strategy and Action Plan (NESSAP) 2010 - 2015 103
Table 5.3: Typical Refuse Collection Vehicles (RCVs) for Service Modes
Source/Housing Segment Facility/Service Mode Level of Service
Minimum Comfortable Amenity
Rural (pop. below 2500) 1.Communal Collection NA NA Skip Loader
Rural (pop. 2500 – 5000) 1. Communal Collection NA Skip Loader Skip Loader
Urban, Low-Income (Indigenous) 1. Communal Collection
Skip Loader, Roll-on-off
Skip Loader, Roll-on-off, Tricyle NA
2.Block Collection Tipper (with Tarpaulin), Skip Loader Skip Loader, Tricycle 10 m3 Compaction Truck, Tricycle
Urban, Middle Income/Government-type Estates 2.Block Collection 15 – 20 m3 Compaction Truck 15 – 20 m3 Compaction Truck, Tricycle
NA
3. House-to-House 15 – 20 m3 Compaction Truck 15 m3 Compaction Truck 10m3 Compaction Truck
Urban, High-Income 3.House-to-House 15 – 20 m3 Compaction Truck 15 m3 Compaction Truck 10m3 Compaction Truck
Urban, New developing Areas (Esikafo-amba-ntem)
4.Mobile Communal Container Collection
Skip Loader, Tricycle Skip Loader, Tricycle NA
Commercial (incl. markets, lorry parks, hotels, restaurants, slaughter hses etc)
5. Communal Container Transfer Roll-on-off, Skip Loader Roll-on-off, Skip Loader Roll-on-off, Skip Loader
6. Mini-container Service Skip Loader Skip Loader Skip Loader, 10 m3 Compaction Truck
Institutional (incl. barracks, colleges, health-care facilities)
2.Block Collection 15 – 20 m3 Compaction Truck 15 m3 Compaction Truck
3. House-to-House 15 – 20 m3 Compaction Truck 15 m3 Compaction Truck 10m3 Compaction Truck
Industries 5. Communal Container Transfer Skip Loader, Roll-on-off Skip Loader, roll-on-off Skip Loader
Bulk-Tranfer-Haulage 7. Haulage Transfer Station (Depot) 15 – 20 m3 Compaction Truck 40 – 50 m3 Bunker Trucks Rail Transfer
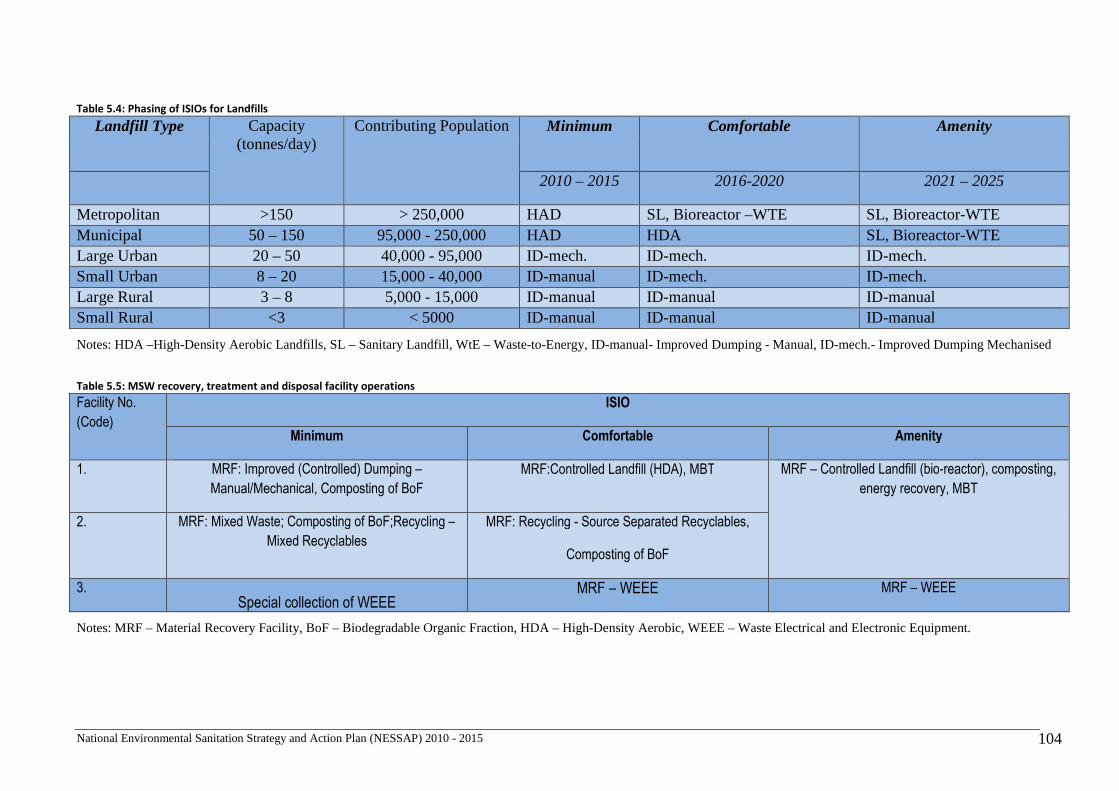
National Environmental Sanitation Strategy and Action Plan (NESSAP) 2010 - 2015 104
Table 5.4: Phasing of ISIOs for Landfills
Landfill Type Capacity (tonnes/day)
Contributing Population Minimum Comfortable Amenity
2010 – 2015 2016-2020 2021 – 2025
Metropolitan >150 > 250,000 HAD SL, Bioreactor –WTE SL, Bioreactor-WTE Municipal 50 – 150 95,000 - 250,000 HAD HDA SL, Bioreactor-WTE Large Urban 20 – 50 40,000 - 95,000 ID-mech. ID-mech. ID-mech. Small Urban 8 – 20 15,000 - 40,000 ID-manual ID-mech. ID-mech. Large Rural 3 – 8 5,000 - 15,000 ID-manual ID-manual ID-manual Small Rural <3 < 5000 ID-manual ID-manual ID-manual
Notes: HDA –High-Density Aerobic Landfills, SL – Sanitary Landfill, WtE – Waste-to-Energy, ID-manual- Improved Dumping - Manual, ID-mech.- Improved Dumping Mechanised
Table 5.5: MSW recovery, treatment and disposal facility operations
Facility No.
(Code)
ISIO
Minimum Comfortable Amenity
1. MRF: Improved (Controlled) Dumping –
Manual/Mechanical, Composting of BoF
MRF:Controlled Landfill (HDA), MBT MRF – Controlled Landfill (bio-reactor), composting,
energy recovery, MBT
2. MRF: Mixed Waste; Composting of BoF;Recycling –
Mixed Recyclables
MRF: Recycling - Source Separated Recyclables,
Composting of BoF
3. Special collection of WEEE
MRF – WEEE MRF – WEEE
Notes: MRF – Material Recovery Facility, BoF – Biodegradable Organic Fraction, HDA – High-Density Aerobic, WEEE – Waste Electrical and Electronic Equipment.
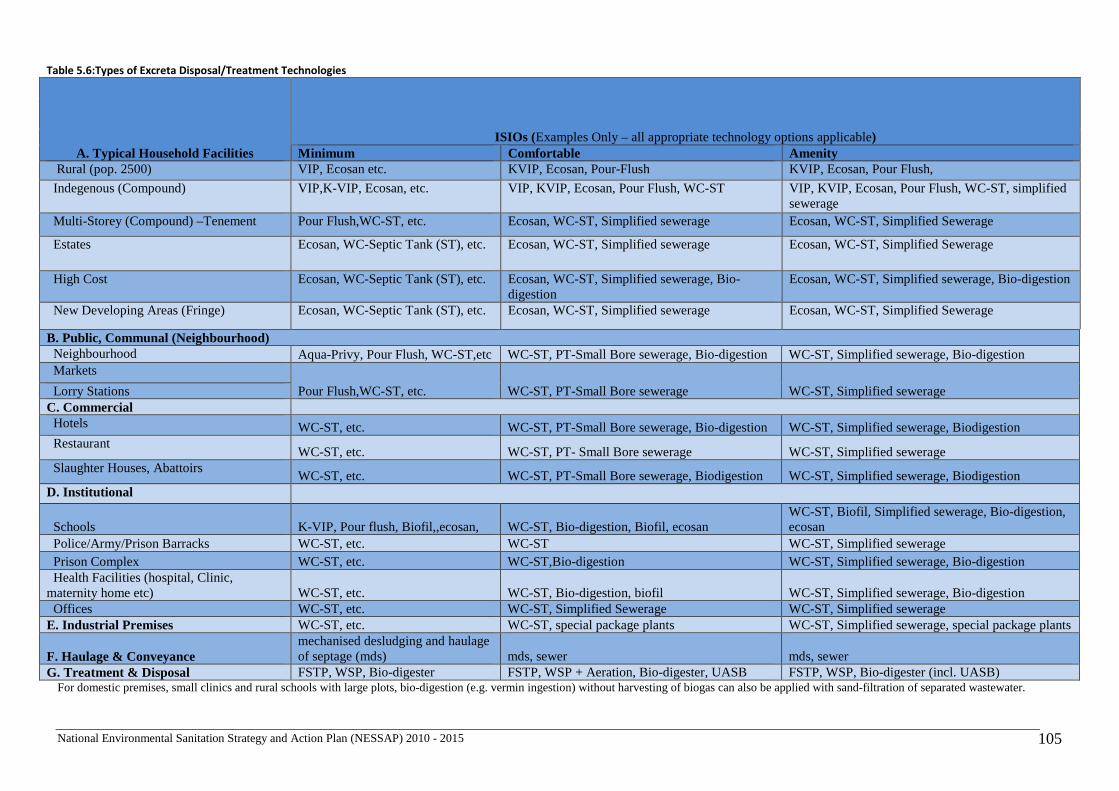
National Environmental Sanitation Strategy and Action Plan (NESSAP) 2010 - 2015 105
Table 5.6:Types of Excreta Disposal/Treatment Technologies
A. Typical Household Facilities ISIOs (Examples Only – all appropriate technology options applicable)
Minimum Comfortable Amenity Rural (pop. 2500) VIP, Ecosan etc. KVIP, Ecosan, Pour-Flush KVIP, Ecosan, Pour Flush,
Indegenous (Compound) VIP,K-VIP, Ecosan, etc. VIP, KVIP, Ecosan, Pour Flush, WC-ST VIP, KVIP, Ecosan, Pour Flush, WC-ST, simplified sewerage
Multi-Storey (Compound) –Tenement Pour Flush,WC-ST, etc. Ecosan, WC-ST, Simplified sewerage Ecosan, WC-ST, Simplified Sewerage
Estates Ecosan, WC-Septic Tank (ST), etc. Ecosan, WC-ST, Simplified sewerage Ecosan, WC-ST, Simplified Sewerage
High Cost Ecosan, WC-Septic Tank (ST), etc. Ecosan, WC-ST, Simplified sewerage, Bio-digestion
Ecosan, WC-ST, Simplified sewerage, Bio-digestion
New Developing Areas (Fringe) Ecosan, WC-Septic Tank (ST), etc. Ecosan, WC-ST, Simplified sewerage Ecosan, WC-ST, Simplified Sewerage
B. Public, Communal (Neighbourhood) Neighbourhood Aqua-Privy, Pour Flush, WC-ST,etc WC-ST, PT-Small Bore sewerage, Bio-digestion WC-ST, Simplified sewerage, Bio-digestion Markets
Pour Flush,WC-ST, etc. WC-ST, PT-Small Bore sewerage WC-ST, Simplified sewerage Lorry Stations C. Commercial Hotels WC-ST, etc. WC-ST, PT-Small Bore sewerage, Bio-digestion WC-ST, Simplified sewerage, Biodigestion Restaurant
WC-ST, etc. WC-ST, PT- Small Bore sewerage WC-ST, Simplified sewerage Slaughter Houses, Abattoirs
WC-ST, etc. WC-ST, PT-Small Bore sewerage, Biodigestion WC-ST, Simplified sewerage, Biodigestion D. Institutional
Schools K-VIP, Pour flush, Biofil,,ecosan, WC-ST, Bio-digestion, Biofil, ecosan WC-ST, Biofil, Simplified sewerage, Bio-digestion, ecosan
Police/Army/Prison Barracks WC-ST, etc. WC-ST WC-ST, Simplified sewerage Prison Complex WC-ST, etc. WC-ST,Bio-digestion WC-ST, Simplified sewerage, Bio-digestion Health Facilities (hospital, Clinic, maternity home etc) WC-ST, etc. WC-ST, Bio-digestion, biofil WC-ST, Simplified sewerage, Bio-digestion Offices WC-ST, etc. WC-ST, Simplified Sewerage WC-ST, Simplified sewerage E. Industrial Premises WC-ST, etc. WC-ST, special package plants WC-ST, Simplified sewerage, special package plants
F. Haulage & Conveyance mechanised desludging and haulage of septage (mds) mds, sewer mds, sewer
G. Treatment & Disposal FSTP, WSP, Bio-digester FSTP, WSP + Aeration, Bio-digester, UASB FSTP, WSP, Bio-digester (incl. UASB) For domestic premises, small clinics and rural schools with large plots, bio-digestion (e.g. vermin ingestion) without harvesting of biogas can also be applied with sand-filtration of separated wastewater.
National Environmental Sanitation Strategy and Action Plan (NESSAP) 2010 - 2015 106
5.3.1.3 ISIOs for Stormwater Drainage and Sullage Conveyance
574. Storm-water drainage is categorized as bulk infrastructure as it is typically not related to population nor housing segments but more to rainfall intensity and ground conditions. Generally, the more paved an area is the more run-off results due to reduced infiltration. However, in newly developing areas and low-income indigenous areas, the lack of covered vegetation (e.g. grassed plots) lead to erosion and creation of gullies.
575. The quantity of sullage (“grey water” from bathhouses and kitchens) is linked to population (or some water-based activity) and the type of “grey water” facilities available in a premises. The provision of small drains along the sides of buildings and/or soakage-pits to carry grey-water constitutes important improvement elements at the household level.
576. The NESSAP limits the improvement for drainage and sullage conveyance to secondary and tertiary drains within the built environment starting with unlined ditches as a minimum level, stone-pitched and/or concrete lined drains as comfortable level, and covered stone-pitched and/or concrete lined drains as amenity level. The improvements for major primary drainage infrastructure are covered under special projects handled by the Hydrological Services Department (HSD) of the Ministry of Water Resources, Works and Housing (MWRWH) or specific project-management-units37.
577. Drain cleansing (in CBDs and flood-prone areas) is captured under this section although it is typically provided together with street sweeping under municipal waste management services. Drain cleansing is also and often denoted as “de-silting” for either maintenance of road-side drains or as a flood control measure and covered as in the budget of Department of Urban Roads (DUR) or HSD of MWRWH.
578. The minimum service level assumed entails the cleansing of community drains (450/600 diameter) once a week during dry seasons and three-times weekly during rainy seasons.
5.3.1.4 ISIOs for Health-Care Facility and Special Industrial Wastes
579. Special Industrial Wastes: cost of services for special industrial waste are not covered in the SESIP as industries are required to cater for this category of wastes.
580. Health-Care Facility Wastes: services for special Health-Care Facility (HCF) wastes are not covered since HCFs are expected to handle this category of wastes themselves following prescriptions for disinfection, sterilization and/or incineration as applicable and provided for in policies and guidelines38. The provision of municipal-type waste and enforcement management is considered as part of solid waste services.
581. The opportunity for effective co-treatment of bio-medical (pathological) waste, the Bio-degradable Organic Fraction (BoF) of MSW and wastewater while harvesting biogas through bio-digestion is given consideration.
582. HCFs (as well as Prison complexes) present classical examples of how to apply bio-digestion with opportunities for earning carbon-credits39. It is assumed that at the amenity level the recovered biogas is used for heating and cooking, while the treated effluent is recycled for cistern flushing as a potential strategy for saving potable water.
37 The Projects Coordinating Unit (PCU) of the MLGRD managing the Urban Environmental Sanitation Project series with loan-financing from the IDA-World Bank. 38 Guidelines for the Management of Health-Care and Veterinary Waste in Ghana, EPA/MLGRD, 2002. Policy and Guidelines for Health-Care Facility Waste, MoH, 2008.
5
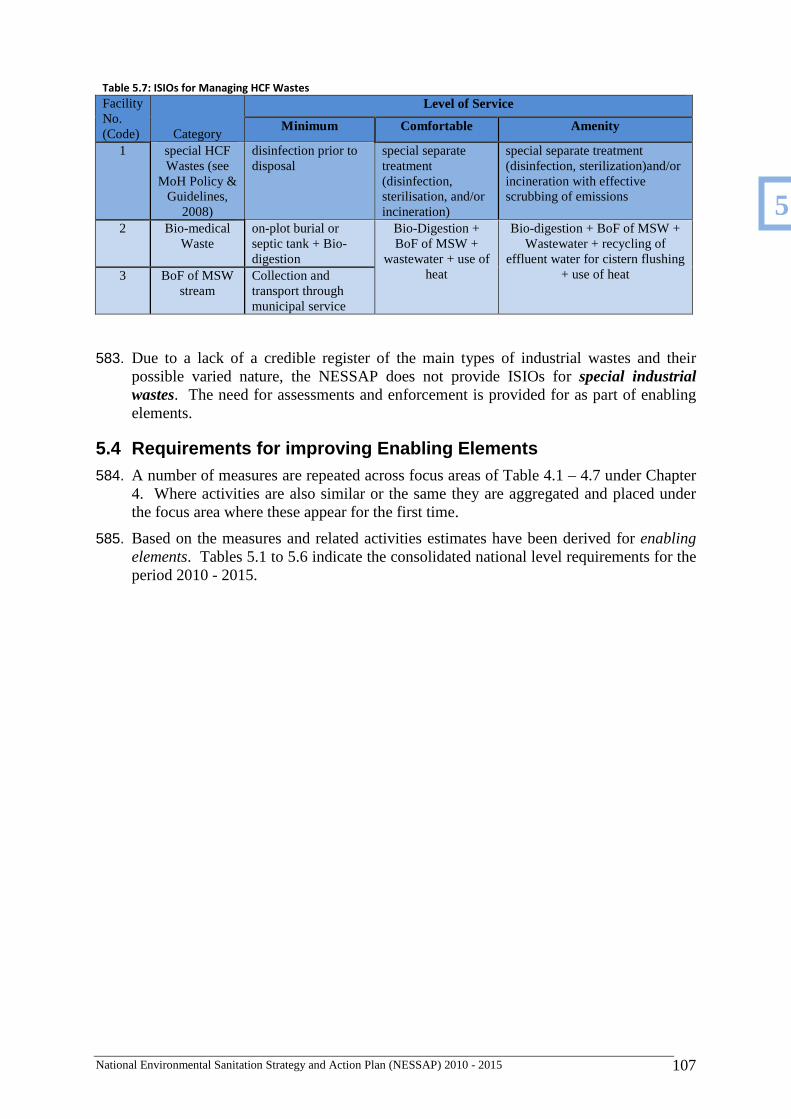
National Environmental Sanitation Strategy and Action Plan (NESSAP) 2010 - 2015 107
Table 5.7: ISIOs for Managing HCF Wastes
Facility No. (Code) Category
Level of Service
Minimum Comfortable Amenity
1 special HCF Wastes (see
MoH Policy & Guidelines,
2008)
disinfection prior to disposal
special separate treatment (disinfection, sterilisation, and/or incineration)
special separate treatment (disinfection, sterilization)and/or incineration with effective scrubbing of emissions
2 Bio-medical Waste
on-plot burial or septic tank + Bio-digestion
Bio-Digestion + BoF of MSW +
wastewater + use of heat
Bio-digestion + BoF of MSW + Wastewater + recycling of
effluent water for cistern flushing + use of heat 3 BoF of MSW
stream Collection and transport through municipal service
583. Due to a lack of a credible register of the main types of industrial wastes and their possible varied nature, the NESSAP does not provide ISIOs for special industrial wastes. The need for assessments and enforcement is provided for as part of enabling elements.
5.4 Requirements for improving Enabling Elements 584. A number of measures are repeated across focus areas of Table 4.1 – 4.7 under Chapter
4. Where activities are also similar or the same they are aggregated and placed under the focus area where these appear for the first time.
585. Based on the measures and related activities estimates have been derived for enabling elements. Tables 5.1 to 5.6 indicate the consolidated national level requirements for the period 2010 - 2015.
5
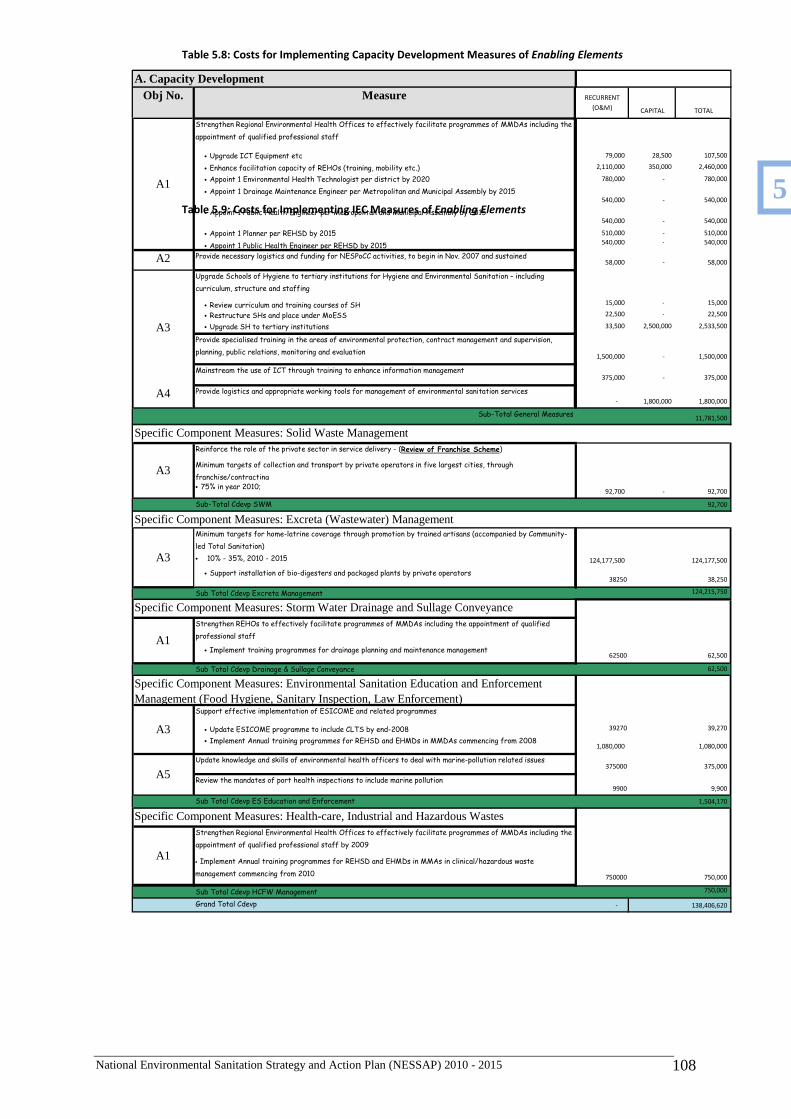
National Environmental Sanitation Strategy and Action Plan (NESSAP) 2010 - 2015 108
RECURRENT
(O&M) CAPITAL TOTAL
79,000 28,500 107,500
2,110,000 350,000 2,460,000
780,000 - 780,000
540,000 - 540,000
540,000 - 540,000
510,000 - 510,000
540,000 - 540,000
A2 58,000 - 58,000
15,000 - 15,000
22,500 - 22,500
33,500 2,500,000 2,533,500
1,500,000 - 1,500,000
375,000 - 375,000
A4- 1,800,000 1,800,000
Sub-Total General Measures11,781,500
Reinforce the role of the private sector in service delivery - (Review of Franchise Scheme)
Minimum targets of collection and transport by private operators in five largest cities, through
franchise/contracting
• 75% in year 2010;92,700 - 92,700
Sub-Total Cdevp SWM 92,700
Minimum targets for home-latrine coverage through promotion by trained artisans (accompanied by Community-
led Total Sanitation)
• 10% - 35%, 2010 - 2015 124,177,500 124,177,500
• Support installation of bio-digesters and packaged plants by private operators38250 38,250
Sub Total Cdevp Excreta Management 124,215,750
Strengthen REHOs to effectively facilitate programmes of MMDAs including the appointment of qualified
professional staff
• Implement training programmes for drainage planning and maintenance management62500 62,500
Sub Total Cdevp Drainage & Sullage Conveyance 62,500
Support effective implementation of ESICOME and related programmes
• Update ESICOME programme to include CLTS by end-2008 39270 39,270
• Implement Annual training programmes for REHSD and EHMDs in MMDAs commencing from 20081,080,000 1,080,000
Update knowledge and skills of environmental health officers to deal with marine-pollution related issues375000 375,000
Review the mandates of port health inspections to include marine pollution9900 9,900
Sub Total Cdevp ES Education and Enforcement 1,504,170
Strengthen Regional Environmental Health Offices to effectively facilitate programmes of MMDAs including the
appointment of qualified professional staff by 2009
• Implement Annual training programmes for REHSD and EHMDs in MMAs in clinical/hazardous waste
management commencing from 2010750000 750,000
Sub Total Cdevp HCFW Management 750,000
Grand Total Cdevp - 138,406,620
A1
• Upgrade ICT Equipment etc
• Enhance facilitation capacity of REHOs (training, mobility etc.)
• Appoint 1 Public Health Engineer per Metropolitan and Municipal Assembly by 2015
A. Capacity DevelopmentObj No. Measure
• Appoint 1 Environmental Health Technologist per district by 2020
• Appoint 1 Drainage Maintenance Engineer per Metropolitan and Municipal Assembly by 2015
• Appoint 1 Planner per REHSD by 2015
• Appoint 1 Public Health Engineer per REHSD by 2015
Provide necessary logistics and funding for NESPoCC activities, to begin in Nov. 2007 and sustained
Strengthen Regional Environmental Health Offices to effectively facilitate programmes of MMDAs including the
appointment of qualified professional staff
A3
Upgrade Schools of Hygiene to tertiary institutions for Hygiene and Environmental Sanitation – including
curriculum, structure and staffing
• Review curriculum and training courses of SH
• Upgrade SH to tertiary institutions
• Restructure SHs and place under MoESS
Provide specialised training in the areas of environmental protection, contract management and supervision,
planning, public relations, monitoring and evaluation
Mainstream the use of ICT through training to enhance information management
Provide logistics and appropriate working tools for management of environmental sanitation services
Specific Component Measures: Solid Waste Management
Specific Component Measures: Excreta (Wastewater) Management
A3
A3
Specific Component Measures: Environmental Sanitation Education and Enforcement Management (Food Hygiene, Sanitary Inspection, Law Enforcement)
Specific Component Measures: Storm Water Drainage and Sullage Conveyance
A1
A5
A3
Specific Component Measures: Health-care, Industrial and Hazardous Wastes
A1
Table 5.8: Costs for Implementing Capacity Development Measures of Enabling Elements
Table 5.9: Costs for Implementing IEC Measures of Enabling Elements
5
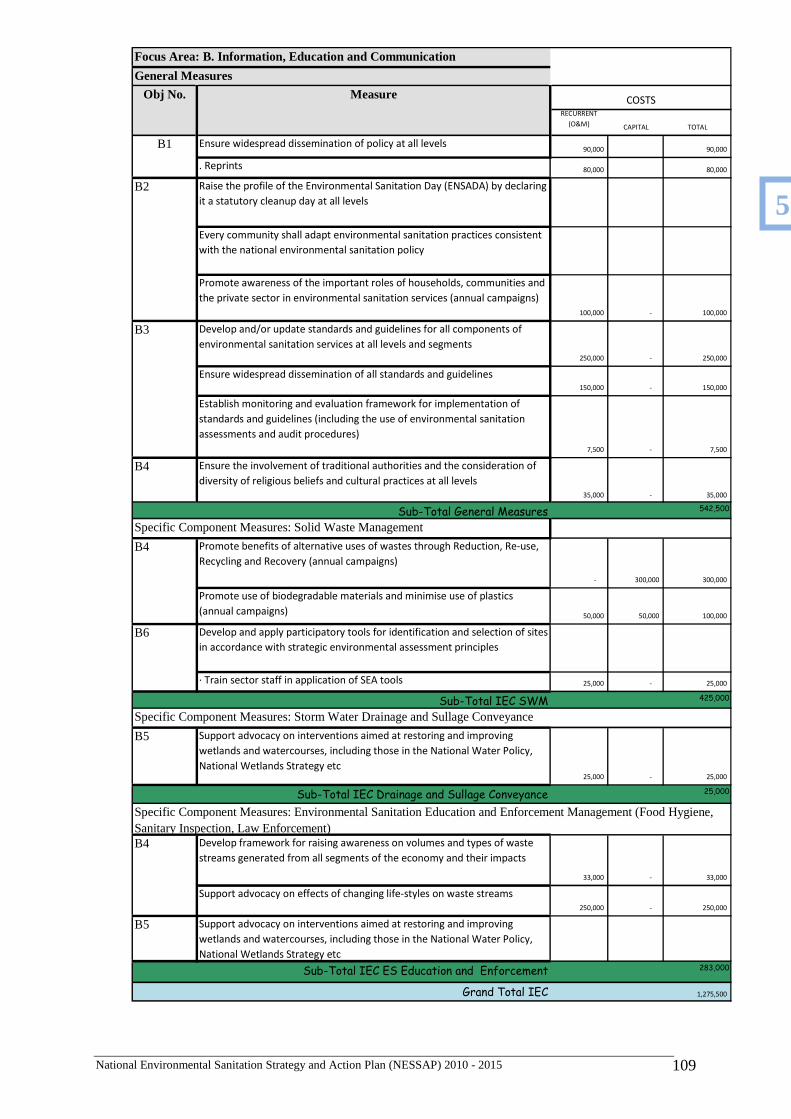
National Environmental Sanitation Strategy and Action Plan (NESSAP) 2010 - 2015 109
RECURRENT
(O&M) CAPITAL TOTAL
90,000 90,000
. Reprints 80,000 80,000
100,000 - 100,000
250,000 - 250,000
150,000 - 150,000
7,500 - 7,500
B4
35,000 - 35,000
Sub-Total General Measures 542,500
Promote benefits of alternative uses of wastes through Reduction, Re-use,
Recycling and Recovery (annual campaigns)
- 300,000 300,000
Promote use of biodegradable materials and minimise use of plastics
(annual campaigns)50,000 50,000 100,000
Develop and apply participatory tools for identification and selection of sites
in accordance with strategic environmental assessment principles
· Train sector staff in application of SEA tools 25,000 - 25,000
Sub-Total IEC SWM 425,000
Support advocacy on interventions aimed at restoring and improving
wetlands and watercourses, including those in the National Water Policy,
National Wetlands Strategy etc25,000 - 25,000
Sub-Total IEC Drainage and Sullage Conveyance 25,000
Develop framework for raising awareness on volumes and types of waste
streams generated from all segments of the economy and their impacts
33,000 - 33,000
Support advocacy on effects of changing life-styles on waste streams250,000 - 250,000
Support advocacy on interventions aimed at restoring and improving
wetlands and watercourses, including those in the National Water Policy,
National Wetlands Strategy etc
Sub-Total IEC ES Education and Enforcement 283,000
Grand Total IEC 1,275,500
Every community shall adapt environmental sanitation practices consistent
with the national environmental sanitation policy
Promote awareness of the important roles of households, communities and
the private sector in environmental sanitation services (annual campaigns)
Ensure widespread dissemination of policy at all levels
Focus Area: B. Information, Education and Communication
General Measures
Obj No. Measure COSTS
Raise the profile of the Environmental Sanitation Day (ENSADA) by declaring
it a statutory cleanup day at all levels
Specific Component Measures: Solid Waste Management
B2
B1
B4
Establish monitoring and evaluation framework for implementation of
standards and guidelines (including the use of environmental sanitation
assessments and audit procedures)
Ensure the involvement of traditional authorities and the consideration of
diversity of religious beliefs and cultural practices at all levels
B3 Develop and/or update standards and guidelines for all components of
environmental sanitation services at all levels and segments
Ensure widespread dissemination of all standards and guidelines
B6
B4
Specific Component Measures: Storm Water Drainage and Sullage Conveyance
Specific Component Measures: Environmental Sanitation Education and Enforcement Management (Food Hygiene, Sanitary Inspection, Law Enforcement)
B5
B5
5
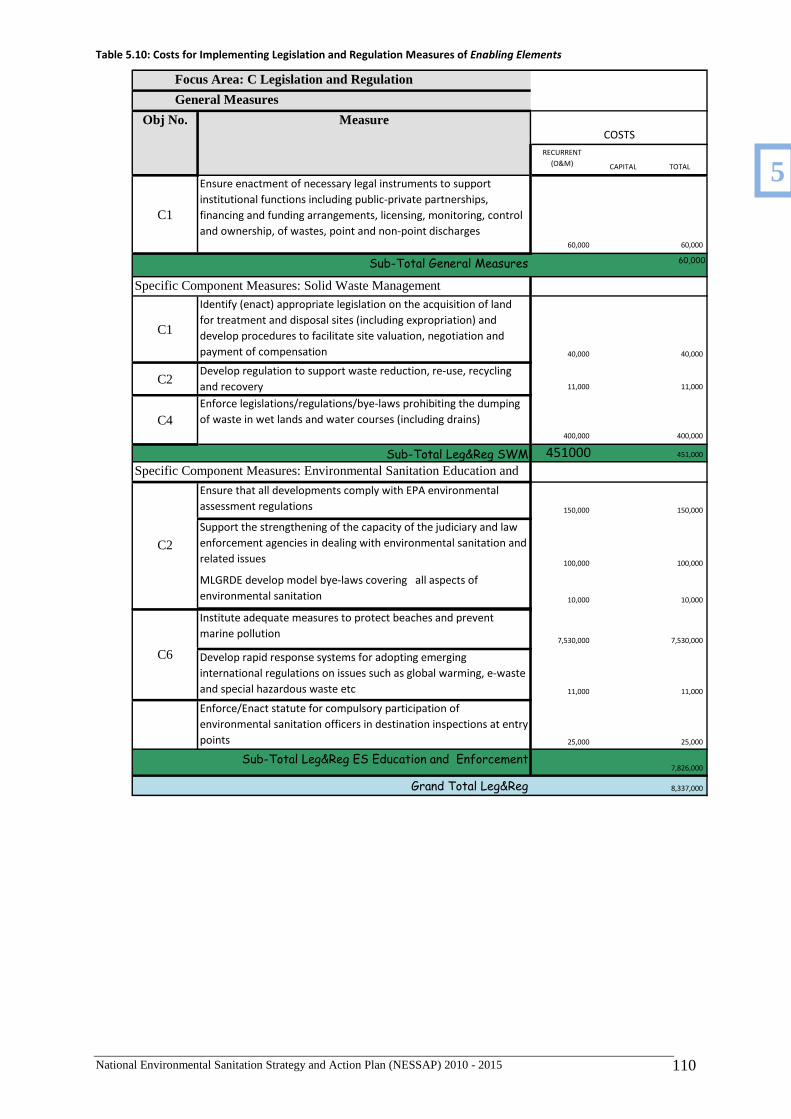
National Environmental Sanitation Strategy and Action Plan (NESSAP) 2010 - 2015 110
Table 5.10: Costs for Implementing Legislation and Regulation Measures of Enabling Elements
Measure
RECURRENT
(O&M) CAPITAL TOTAL
C1
Ensure enactment of necessary legal instruments to support
institutional functions including public-private partnerships,
financing and funding arrangements, licensing, monitoring, control
and ownership, of wastes, point and non-point discharges60,000 60,000
Sub-Total General Measures 60,000
C1
Identify (enact) appropriate legislation on the acquisition of land
for treatment and disposal sites (including expropriation) and
develop procedures to facilitate site valuation, negotiation and
payment of compensation 40,000 40,000
C2Develop regulation to support waste reduction, re-use, recycling
and recovery 11,000 11,000
C4Enforce legislations/regulations/bye-laws prohibiting the dumping
of waste in wet lands and water courses (including drains)
400,000 400,000
Sub-Total Leg&Reg SWM 451000 451,000
Ensure that all developments comply with EPA environmental
assessment regulations 150,000 150,000
Support the strengthening of the capacity of the judiciary and law
enforcement agencies in dealing with environmental sanitation and
related issues 100,000 100,000
MLGRDE develop model bye-laws covering all aspects of
environmental sanitation 10,000 10,000
Institute adequate measures to protect beaches and prevent
marine pollution7,530,000 7,530,000
Develop rapid response systems for adopting emerging
international regulations on issues such as global warming, e-waste
and special hazardous waste etc 11,000 11,000
Enforce/Enact statute for compulsory participation of
environmental sanitation officers in destination inspections at entry
points 25,000 25,000
Sub-Total Leg&Reg ES Education and Enforcement7,826,000
Grand Total Leg&Reg 8,337,000
COSTS
C2
Focus Area: C Legislation and Regulation
General Measures
Obj No.
C6
Specific Component Measures: Solid Waste Management
Specific Component Measures: Environmental Sanitation Education and Enforcement Management (Food Hygiene, Sanitary Inspection, Law
5
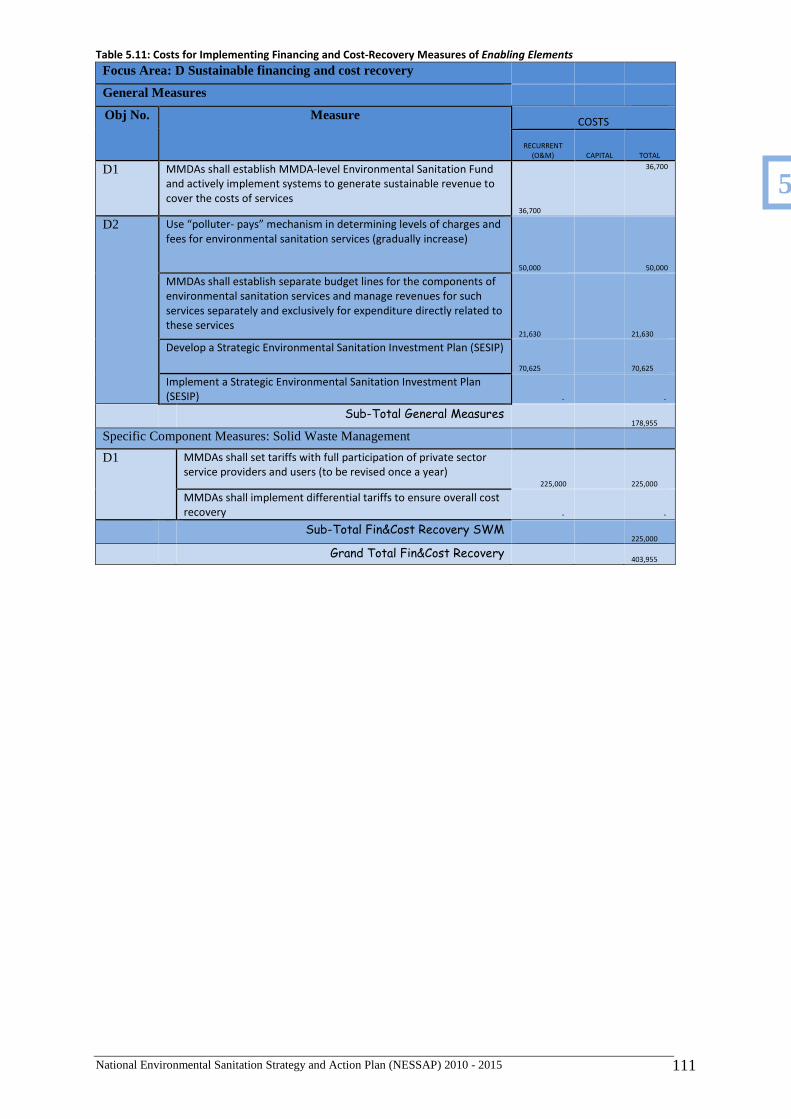
National Environmental Sanitation Strategy and Action Plan (NESSAP) 2010 - 2015 111
Table 5.11: Costs for Implementing Financing and Cost-Recovery Measures of Enabling Elements
Focus Area: D Sustainable financing and cost recovery
General Measures
Obj No. Measure COSTS
RECURRENT
(O&M) CAPITAL TOTAL
D1 MMDAs shall establish MMDA-level Environmental Sanitation Fund
and actively implement systems to generate sustainable revenue to
cover the costs of services
36,700
36,700
D2 Use “polluter- pays” mechanism in determining levels of charges and
fees for environmental sanitation services (gradually increase)
50,000
50,000
MMDAs shall establish separate budget lines for the components of
environmental sanitation services and manage revenues for such
services separately and exclusively for expenditure directly related to
these services
21,630
21,630
Develop a Strategic Environmental Sanitation Investment Plan (SESIP)
70,625
70,625
Implement a Strategic Environmental Sanitation Investment Plan
(SESIP) -
-
Sub-Total General Measures
178,955
Specific Component Measures: Solid Waste Management
D1 MMDAs shall set tariffs with full participation of private sector
service providers and users (to be revised once a year) 225,000
225,000
MMDAs shall implement differential tariffs to ensure overall cost
recovery -
-
Sub-Total Fin&Cost Recovery SWM
225,000
Grand Total Fin&Cost Recovery
403,955
5
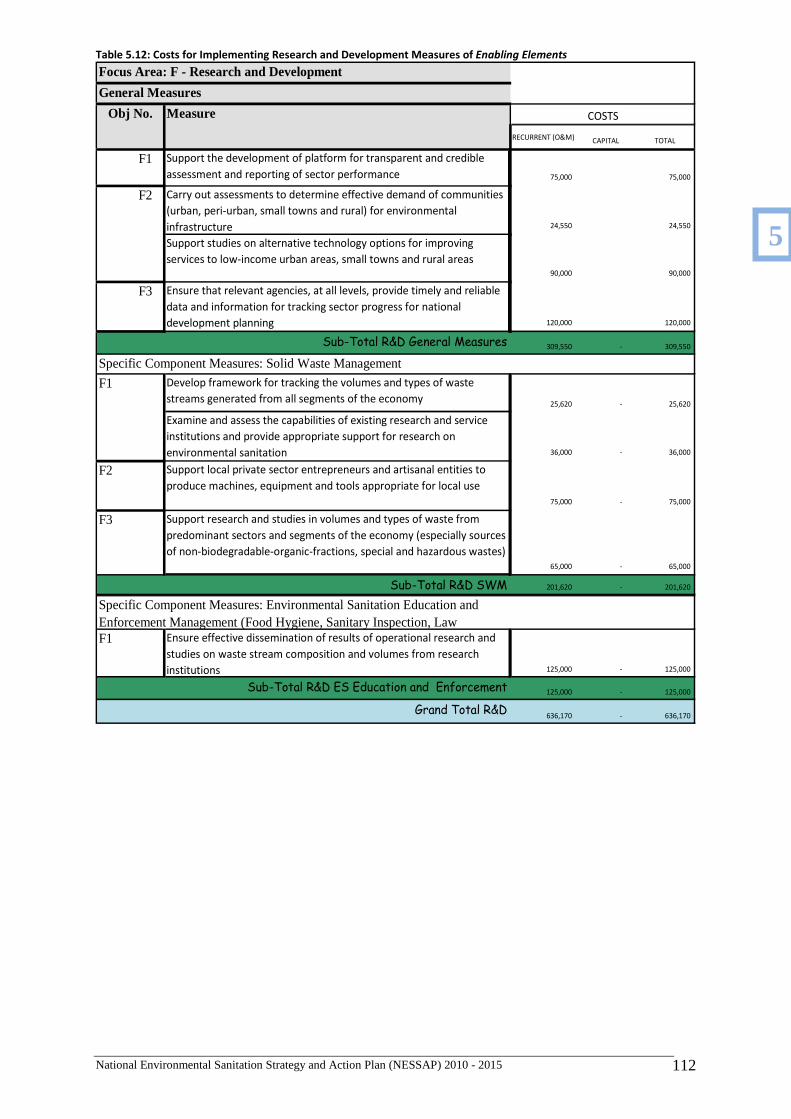
National Environmental Sanitation Strategy and Action Plan (NESSAP) 2010 - 2015 112
Table 5.12: Costs for Implementing Research and Development Measures of Enabling Elements
Measure
RECURRENT (O&M) CAPITAL TOTAL
Support the development of platform for transparent and credible
assessment and reporting of sector performance 75,000 75,000
Carry out assessments to determine effective demand of communities
(urban, peri-urban, small towns and rural) for environmental
infrastructure 24,550 24,550
Support studies on alternative technology options for improving
services to low-income urban areas, small towns and rural areas90,000 90,000
F3 Ensure that relevant agencies, at all levels, provide timely and reliable
data and information for tracking sector progress for national
development planning 120,000 120,000
Sub-Total R&D General Measures 309,550 - 309,550
F1 Develop framework for tracking the volumes and types of waste
streams generated from all segments of the economy25,620 - 25,620
Examine and assess the capabilities of existing research and service
institutions and provide appropriate support for research on
environmental sanitation 36,000 - 36,000
F2 Support local private sector entrepreneurs and artisanal entities to
produce machines, equipment and tools appropriate for local use
75,000 - 75,000
F3 Support research and studies in volumes and types of waste from
predominant sectors and segments of the economy (especially sources
of non-biodegradable-organic-fractions, special and hazardous wastes)65,000 - 65,000
Sub-Total R&D SWM 201,620 - 201,620
F1 Ensure effective dissemination of results of operational research and
studies on waste stream composition and volumes from research
institutions 125,000 - 125,000
Sub-Total R&D ES Education and Enforcement 125,000 - 125,000
Grand Total R&D636,170 - 636,170
F1
Focus Area: F - Research and Development
General Measures
Obj No.
Specific Component Measures: Environmental Sanitation Education and Enforcement Management (Food Hygiene, Sanitary Inspection, Law
Specific Component Measures: Solid Waste Management
F2
COSTS
5
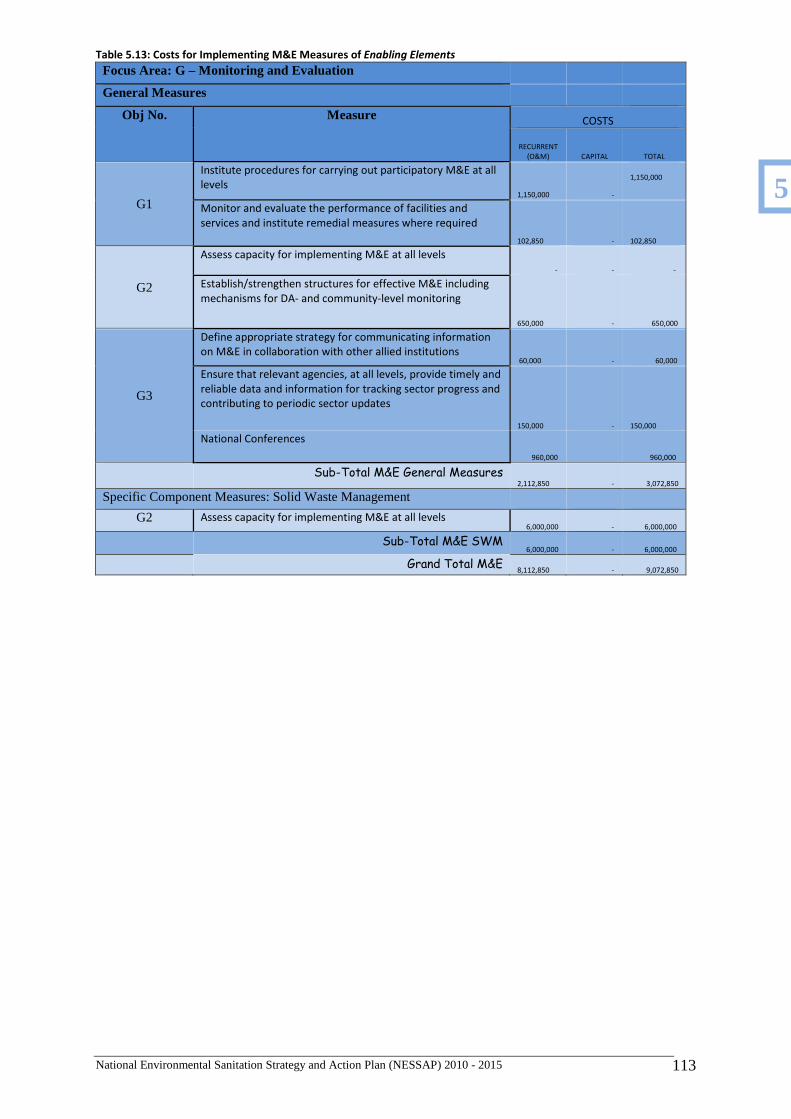
National Environmental Sanitation Strategy and Action Plan (NESSAP) 2010 - 2015 113
Table 5.13: Costs for Implementing M&E Measures of Enabling Elements
Focus Area: G – Monitoring and Evaluation
General Measures
Obj No. Measure COSTS
RECURRENT
(O&M) CAPITAL TOTAL
G1
Institute procedures for carrying out participatory M&E at all
levels
1,150,000 -
1,150,000
Monitor and evaluate the performance of facilities and
services and institute remedial measures where required
102,850 -
102,850
G2
Assess capacity for implementing M&E at all levels
- - -
Establish/strengthen structures for effective M&E including
mechanisms for DA- and community-level monitoring
650,000 - 650,000
G3
Define appropriate strategy for communicating information
on M&E in collaboration with other allied institutions 60,000 - 60,000
Ensure that relevant agencies, at all levels, provide timely and
reliable data and information for tracking sector progress and
contributing to periodic sector updates
150,000 - 150,000
National Conferences
960,000 960,000
Sub-Total M&E General Measures
2,112,850 - 3,072,850
Specific Component Measures: Solid Waste Management G2 Assess capacity for implementing M&E at all levels
6,000,000 - 6,000,000
Sub-Total M&E SWM 6,000,000 - 6,000,000
Grand Total M&E
8,112,850 - 9,072,850
5
National Environmental Sanitation Strategy and Action Plan (NESSAP) 2010 - 2015 114
5.5 Requirements for improving Levels of Service 586. The requirements for Levels of Service over the first phase of the NESSAP are for
carrying out proposed activities (services and interventions) to meet set indicators under each service component measure (E1 to E5), to achieve the minimum ISIOs by 2015.
587. There are a number of “software” activities under Levels of Service that can be considered as part of capacity enhancement. Examples include, updating of DESSAPs (under E1) and enhancing private sector roles (under E2).
588. The measures-activities planning framework applied for projecting requirements for specific ISIOs are shown in Table 6.7.
5.5.1 Solid Waste Management
589. Based on information provided in baseline information gathered and draft DESSAPs prepared by MMDAs a number of basic parameters have been employed to generate district by district requirements for various services.
590. Municipal Solid Waste Collection and Transport: for all MMDAs to meet the targets of minimum ISIOs, the estimated additional resources for increasing collection and transport is indicated in Table 5.8 below. This is based on 2008 average collection and transport coverage of 50% for Metropolitan Assemblies cities and 35% for the remaining Municipal and District Assemblies.
591. It is estimated that to meet the minimum targets for improving collection and transport services in the five largest cities (Accra, Kumasi, Takoradi, Tema and Tamale) i.e. 75% in 2010 and 85% by 2015 the following requirements are indicated:
• Provision of communal storage containers to cater for 70% -80% of the additional
municipal solid waste to be generated; • Improvements of selected container transfer stations to enhance container handling;
these facilities are proposed to be provided as part of community infrastructure upgrading schemes for low-income areas;
• to meet the minimum ISIO for collection and transport, of 75% based on the existing predominant mode of collection and transportation systems it is estimated an amount of GH¢93,433,615 is required for the five largest cities over the six-year period 2010-2015.
• Municipal and District Assemblies will require estimated amounts of GH¢143,480,570 and GH¢283,768,607 respectively to reach 60% collection and transport by 2015.
• Provision of MRFs to reduce significantly the requirement of void-space annually for placement of waste assuming an average depth of 15 metres; and
• Provision of primary storage containers to gradually improve house-to-house service coverage and thus increase the number of direct-paying customers.
592. Specific to the five largest cities (Accra, Kumasi, Sekondi-Takoradi, Tamale and Tema) a vigorous programme of provision of refuse storage containers (120/240 litres) to increase house-to-house services, and to commence source-separation of biodegradable-organic-fractions (BoFs) will ease some-what the pressure on the city authorities’ purses. The strategic location and construction of a number of MRFs (which will also serve as Refuse Transfer Depots) will also add to improving the productivity of Refuse Collection Vehicles (RCVs) through the reduction of round-trip travel times.
5
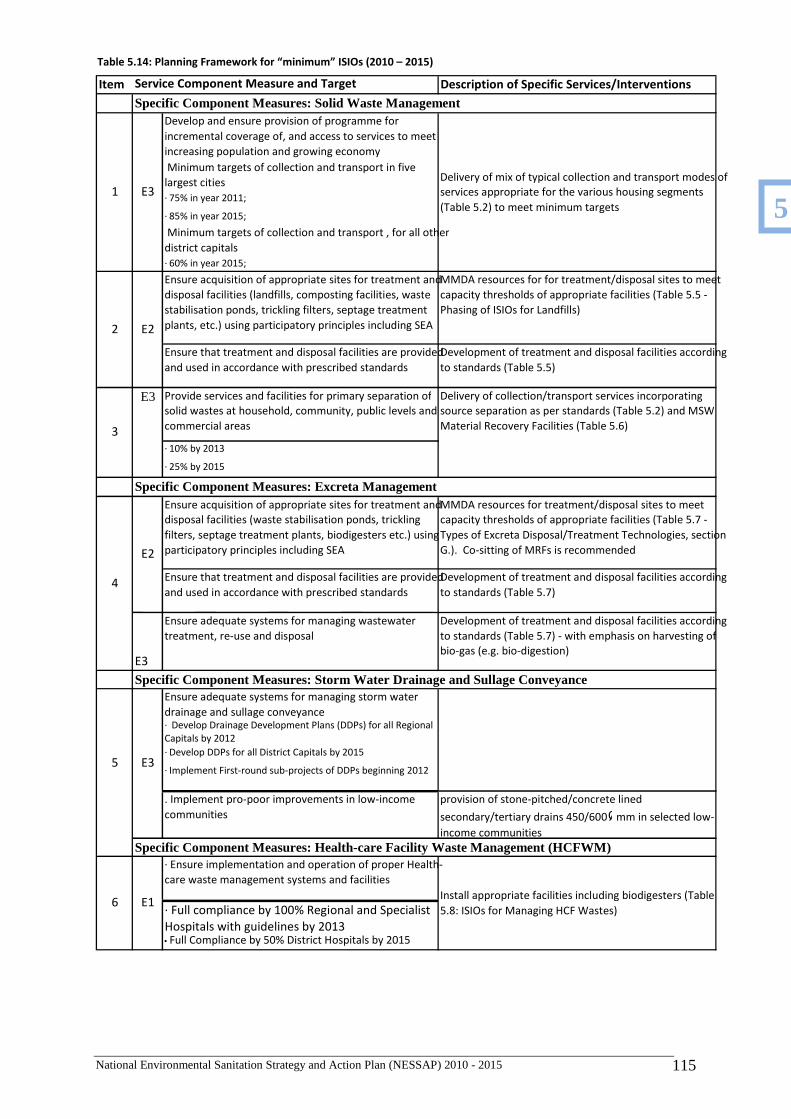
National Environmental Sanitation Strategy and Action Plan (NESSAP) 2010 - 2015 115
Item Description of Specific Services/Interventions
Develop and ensure provision of programme for
incremental coverage of, and access to services to meet
increasing population and growing economy
Minimum targets of collection and transport in five
largest cities
· 75% in year 2011; · 85% in year 2015; Minimum targets of collection and transport , for all other
district capitals
· 60% in year 2015; Ensure acquisition of appropriate sites for treatment and
disposal facilities (landfills, composting facilities, waste
stabilisation ponds, trickling filters, septage treatment
plants, etc.) using participatory principles including SEA
MMDA resources for for treatment/disposal sites to meet
capacity thresholds of appropriate facilities (Table 5.5 -
Phasing of ISIOs for Landfills)
Ensure that treatment and disposal facilities are provided
and used in accordance with prescribed standards
Development of treatment and disposal facilities according
to standards (Table 5.5)
Provide services and facilities for primary separation of
solid wastes at household, community, public levels and
commercial areas
· 10% by 2013
· 25% by 2015
Ensure acquisition of appropriate sites for treatment and
disposal facilities (waste stabilisation ponds, trickling
filters, septage treatment plants, biodigesters etc.) using
participatory principles including SEA
MMDA resources for treatment/disposal sites to meet
capacity thresholds of appropriate facilities (Table 5.7 -
Types of Excreta Disposal/Treatment Technologies, section
G.). Co-sitting of MRFs is recommended
Ensure that treatment and disposal facilities are provided
and used in accordance with prescribed standards
Development of treatment and disposal facilities according
to standards (Table 5.7)
E3
Ensure adequate systems for managing wastewater
treatment, re-use and disposal
Development of treatment and disposal facilities according
to standards (Table 5.7) - with emphasis on harvesting of
bio-gas (e.g. bio-digestion)
Ensure adequate systems for managing storm water
drainage and sullage conveyance· Develop Drainage Development Plans (DDPs) for all Regional
Capitals by 2012
· Develop DDPs for all District Capitals by 2015
· Implement First-round sub-projects of DDPs beginning 2012
. Implement pro-poor improvements in low-income
communities
provision of stone-pitched/concrete lined
secondary/tertiary drains 450/600 Ø mm in selected low-
income communities
· Ensure implementation and operation of proper Health- care waste management systems and facilities
· Full compliance by 100% Regional and Specialist
Hospitals with guidelines by 2013• Full Compliance by 50% District Hospitals by 2015
Install appropriate facilities including biodigesters (Table
5.8: ISIOs for Managing HCF Wastes)
Delivery of mix of typical collection and transport modes of
services appropriate for the various housing segments
(Table 5.2) to meet minimum targets
Specific Component Measures: Solid Waste Management
Delivery of collection/transport services incorporating
source separation as per standards (Table 5.2) and MSW
Material Recovery Facilities (Table 5.6)
1 E3
E3
3
2 E2
6 E1
Service Component Measure and Target
E2
4
E3
Specific Component Measures: Storm Water Drainage and Sullage Conveyance
Specific Component Measures: Health-care Facility Waste Management (HCFWM)
5
Specific Component Measures: Excreta Management
Table 5.14: Planning Framework for “minimum” ISIOs (2010 – 2015)
5
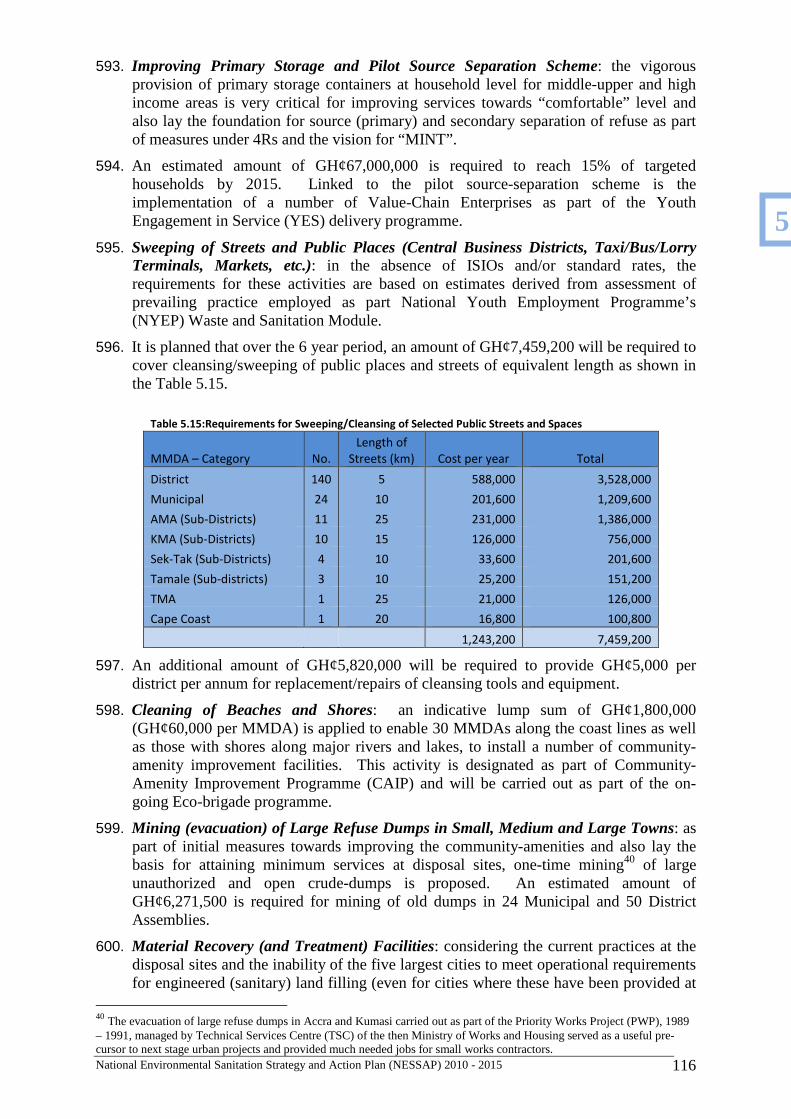
National Environmental Sanitation Strategy and Action Plan (NESSAP) 2010 - 2015 116
593. Improving Primary Storage and Pilot Source Separation Scheme: the vigorous provision of primary storage containers at household level for middle-upper and high income areas is very critical for improving services towards “comfortable” level and also lay the foundation for source (primary) and secondary separation of refuse as part of measures under 4Rs and the vision for “MINT”.
594. An estimated amount of GH¢67,000,000 is required to reach 15% of targeted households by 2015. Linked to the pilot source-separation scheme is the implementation of a number of Value-Chain Enterprises as part of the Youth Engagement in Service (YES) delivery programme.
595. Sweeping of Streets and Public Places (Central Business Districts, Taxi/Bus/Lorry Terminals, Markets, etc.): in the absence of ISIOs and/or standard rates, the requirements for these activities are based on estimates derived from assessment of prevailing practice employed as part National Youth Employment Programme’s (NYEP) Waste and Sanitation Module.
596. It is planned that over the 6 year period, an amount of GH¢7,459,200 will be required to cover cleansing/sweeping of public places and streets of equivalent length as shown in the Table 5.15.
Table 5.15:Requirements for Sweeping/Cleansing of Selected Public Streets and Spaces
MMDA – Category No.
Length of
Streets (km) Cost per year Total
District 140 5 588,000 3,528,000
Municipal 24 10 201,600 1,209,600
AMA (Sub-Districts) 11 25 231,000 1,386,000
KMA (Sub-Districts) 10 15 126,000 756,000
Sek-Tak (Sub-Districts) 4 10 33,600 201,600
Tamale (Sub-districts) 3 10 25,200 151,200
TMA 1 25 21,000 126,000
Cape Coast 1 20 16,800 100,800
1,243,200 7,459,200
597. An additional amount of GH¢5,820,000 will be required to provide GH¢5,000 per district per annum for replacement/repairs of cleansing tools and equipment.
598. Cleaning of Beaches and Shores: an indicative lump sum of GH¢1,800,000 (GH¢60,000 per MMDA) is applied to enable 30 MMDAs along the coast lines as well as those with shores along major rivers and lakes, to install a number of community-amenity improvement facilities. This activity is designated as part of Community-Amenity Improvement Programme (CAIP) and will be carried out as part of the on-going Eco-brigade programme.
599. Mining (evacuation) of Large Refuse Dumps in Small, Medium and Large Towns: as part of initial measures towards improving the community-amenities and also lay the basis for attaining minimum services at disposal sites, one-time mining40 of large unauthorized and open crude-dumps is proposed. An estimated amount of GH¢6,271,500 is required for mining of old dumps in 24 Municipal and 50 District Assemblies.
600. Material Recovery (and Treatment) Facilities: considering the current practices at the disposal sites and the inability of the five largest cities to meet operational requirements for engineered (sanitary) land filling (even for cities where these have been provided at
40 The evacuation of large refuse dumps in Accra and Kumasi carried out as part of the Priority Works Project (PWP), 1989 – 1991, managed by Technical Services Centre (TSC) of the then Ministry of Works and Housing served as a useful pre-cursor to next stage urban projects and provided much needed jobs for small works contractors.
5
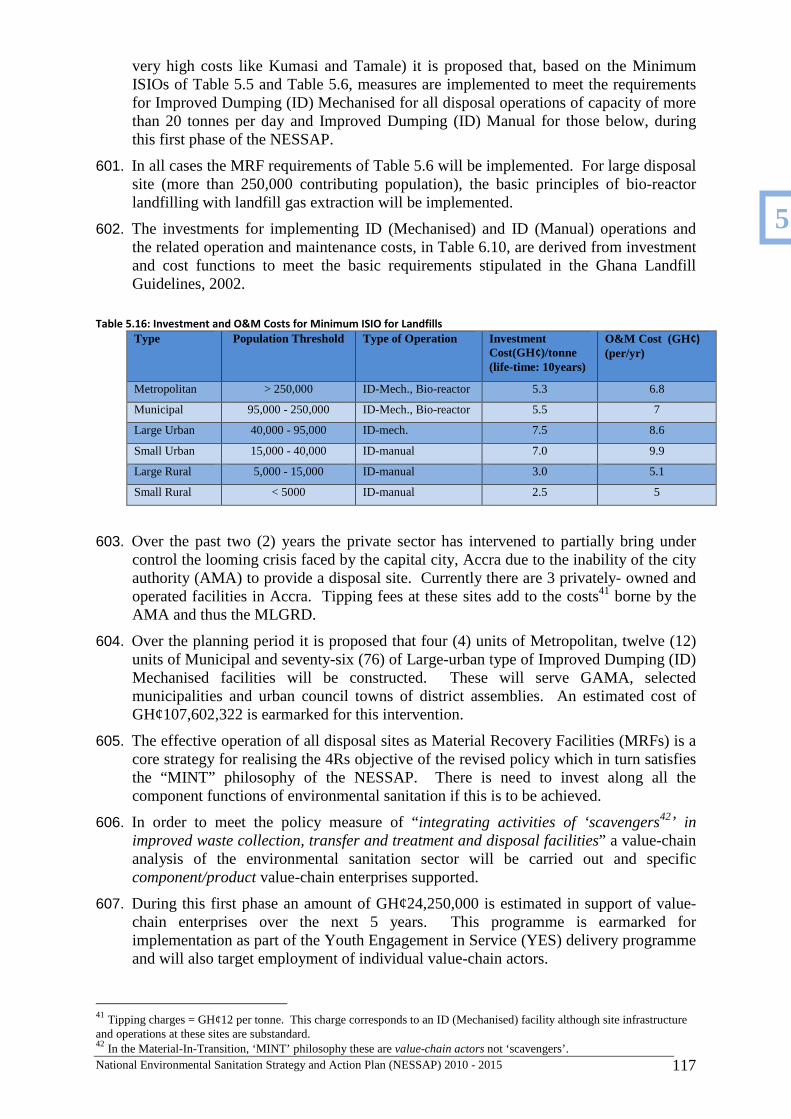
National Environmental Sanitation Strategy and Action Plan (NESSAP) 2010 - 2015 117
very high costs like Kumasi and Tamale) it is proposed that, based on the Minimum ISIOs of Table 5.5 and Table 5.6, measures are implemented to meet the requirements for Improved Dumping (ID) Mechanised for all disposal operations of capacity of more than 20 tonnes per day and Improved Dumping (ID) Manual for those below, during this first phase of the NESSAP.
601. In all cases the MRF requirements of Table 5.6 will be implemented. For large disposal site (more than 250,000 contributing population), the basic principles of bio-reactor landfilling with landfill gas extraction will be implemented.
602. The investments for implementing ID (Mechanised) and ID (Manual) operations and the related operation and maintenance costs, in Table 6.10, are derived from investment and cost functions to meet the basic requirements stipulated in the Ghana Landfill Guidelines, 2002.
Table 5.16: Investment and O&M Costs for Minimum ISIO for Landfills
Type Population Threshold Type of Operation Investment Cost(GH¢)/tonne (life-time: 10years)
O&M Cost (GH ¢)
(per/yr)
Metropolitan > 250,000 ID-Mech., Bio-reactor 5.3 6.8
Municipal 95,000 - 250,000 ID-Mech., Bio-reactor 5.5 7
Large Urban 40,000 - 95,000 ID-mech. 7.5 8.6
Small Urban 15,000 - 40,000 ID-manual 7.0 9.9
Large Rural 5,000 - 15,000 ID-manual 3.0 5.1
Small Rural < 5000 ID-manual 2.5 5
603. Over the past two (2) years the private sector has intervened to partially bring under control the looming crisis faced by the capital city, Accra due to the inability of the city authority (AMA) to provide a disposal site. Currently there are 3 privately- owned and operated facilities in Accra. Tipping fees at these sites add to the costs41 borne by the AMA and thus the MLGRD.
604. Over the planning period it is proposed that four (4) units of Metropolitan, twelve (12) units of Municipal and seventy-six (76) of Large-urban type of Improved Dumping (ID) Mechanised facilities will be constructed. These will serve GAMA, selected municipalities and urban council towns of district assemblies. An estimated cost of GH¢107,602,322 is earmarked for this intervention.
605. The effective operation of all disposal sites as Material Recovery Facilities (MRFs) is a core strategy for realising the 4Rs objective of the revised policy which in turn satisfies the “MINT” philosophy of the NESSAP. There is need to invest along all the component functions of environmental sanitation if this is to be achieved.
606. In order to meet the policy measure of “integrating activities of ‘scavengers42’ in improved waste collection, transfer and treatment and disposal facilities” a value-chain analysis of the environmental sanitation sector will be carried out and specific component/product value-chain enterprises supported.
607. During this first phase an amount of GH¢24,250,000 is estimated in support of value-chain enterprises over the next 5 years. This programme is earmarked for implementation as part of the Youth Engagement in Service (YES) delivery programme and will also target employment of individual value-chain actors.
41 Tipping charges = GH¢12 per tonne. This charge corresponds to an ID (Mechanised) facility although site infrastructure and operations at these sites are substandard. 42 In the Material-In-Transition, ‘MINT’ philosophy these are value-chain actors not ‘scavengers’.
5
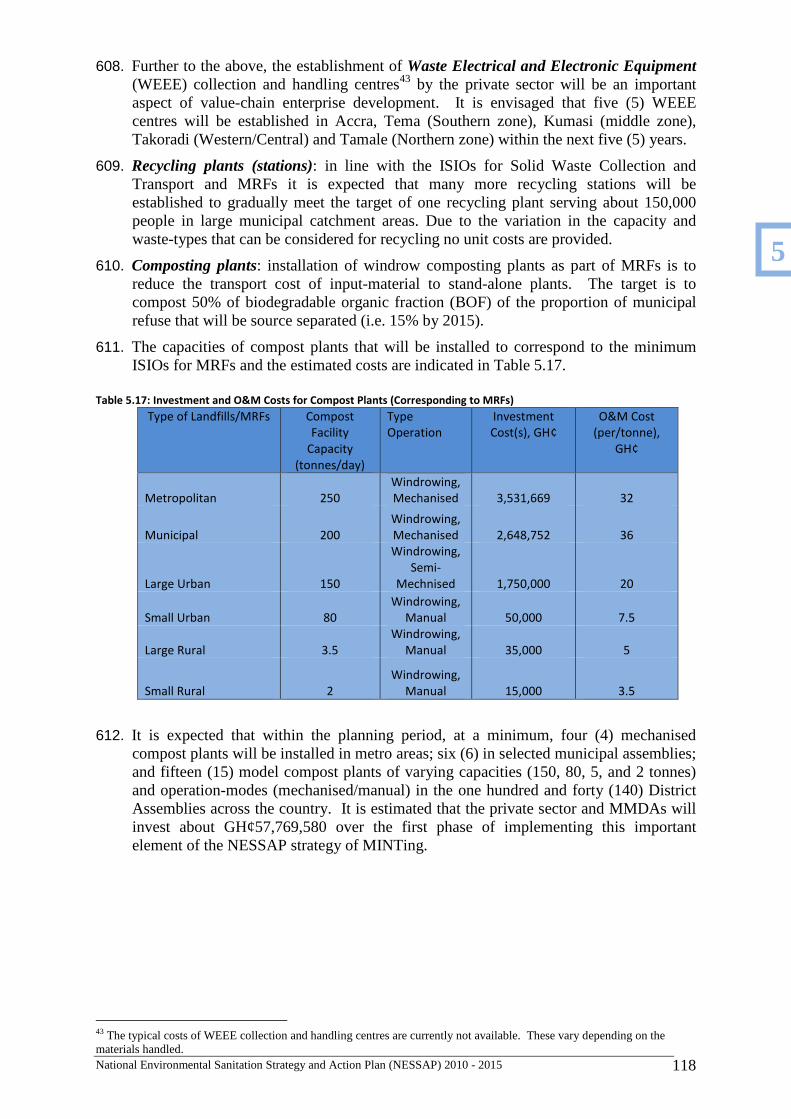
National Environmental Sanitation Strategy and Action Plan (NESSAP) 2010 - 2015 118
608. Further to the above, the establishment of Waste Electrical and Electronic Equipment (WEEE) collection and handling centres43 by the private sector will be an important aspect of value-chain enterprise development. It is envisaged that five (5) WEEE centres will be established in Accra, Tema (Southern zone), Kumasi (middle zone), Takoradi (Western/Central) and Tamale (Northern zone) within the next five (5) years.
609. Recycling plants (stations): in line with the ISIOs for Solid Waste Collection and Transport and MRFs it is expected that many more recycling stations will be established to gradually meet the target of one recycling plant serving about 150,000 people in large municipal catchment areas. Due to the variation in the capacity and waste-types that can be considered for recycling no unit costs are provided.
610. Composting plants: installation of windrow composting plants as part of MRFs is to reduce the transport cost of input-material to stand-alone plants. The target is to compost 50% of biodegradable organic fraction (BOF) of the proportion of municipal refuse that will be source separated (i.e. 15% by 2015).
611. The capacities of compost plants that will be installed to correspond to the minimum ISIOs for MRFs and the estimated costs are indicated in Table 5.17.
Table 5.17: Investment and O&M Costs for Compost Plants (Corresponding to MRFs)
Type of Landfills/MRFs Compost
Facility
Capacity
(tonnes/day)
Type
Operation
Investment
Cost(s), GH¢
O&M Cost
(per/tonne),
GH¢
Metropolitan 250
Windrowing,
Mechanised 3,531,669 32
Municipal 200
Windrowing,
Mechanised 2,648,752 36
Large Urban 150
Windrowing,
Semi-
Mechnised 1,750,000 20
Small Urban 80
Windrowing,
Manual 50,000 7.5
Large Rural 3.5
Windrowing,
Manual 35,000 5
Small Rural 2
Windrowing,
Manual 15,000 3.5
612. It is expected that within the planning period, at a minimum, four (4) mechanised compost plants will be installed in metro areas; six (6) in selected municipal assemblies; and fifteen (15) model compost plants of varying capacities (150, 80, 5, and 2 tonnes) and operation-modes (mechanised/manual) in the one hundred and forty (140) District Assemblies across the country. It is estimated that the private sector and MMDAs will invest about GH¢57,769,580 over the first phase of implementing this important element of the NESSAP strategy of MINTing.
43 The typical costs of WEEE collection and handling centres are currently not available. These vary depending on the materials handled.
5
National Environmental Sanitation Strategy and Action Plan (NESSAP) 2010 - 2015 119
5.5.2 Excreta (Liquid Waste) Management
613. During this phase, remedial actions will focus on two areas; (i) improving access to improved household-level and (ii) installation of final treatment and disposal, facilities. In both cases focus will to effectively derive value through re-use and recovery materials in fulfilment of “MINT” philosophy.
614. Firstly, implementing an effective country-wide programme to overcome the over reliance on public toilets in low-income urban communities and the resort to open-defaecation in many rural, small/large towns and peri-urban settlements due to lack of improved facilities.
615. Where shared facilities are provided in compound houses (the main housing segment in low-income areas and indigenous settlements of rural, small and large towns) their adequacy is in question44 and indicates the need for further efforts for upgrading existing facilities and expanding options.
616. Secondly, is to significantly reduce the un-controlled discharge of untreated faecal sludges and septage into rivers, the sea as well as on and close to refuse dumps. The burden of diseases such as cholera, dysentery and typhoid due to these poor practices warrants urgent attention and the MTDPF recommended the installation of final treatment facilities.
617. The reliance of on-plot WC/septic tanks in newly built estates and developing areas (which are growing rapidly) also places a burden for effective treatment of septage.
618. Related to the above is to institute improved operation and maintenance management arrangements to overcome the common practice of running down newly-installed facilities such that within the first and second years after commissioning they deteriorate and fall into disrepair sometimes beyond rehabilitation.
619. Increasing Access to Improved Household Sanitation Facilities: following on from section 5.3.1.2, the implementation of CLTS as part of enabling element is expected to enhance accelerated coverage for home latrines to meet the needs of different housing segments at different rungs of the sanitation ladder.
620. While the initial focus of CLTS initiatives will be on rural areas, related strategies that will trigger large scale and sustainable behavioural change and increased household ownership of sanitation facilities in small, large towns will be implemented. The intractable challenge of provision of household latrines, particularly in low-income houses will be addressed through previously tested revolving fund (loan) schemes.
621. The enhanced presence and operations of Micro-Finance-Institutions (MFIs) and Rural Community Banks (RCBs) over the past few years will be relied upon to implement micro-credit schemes targeting, initially, households with women as heads of families and community-based women associations.
622. The micro-finance institutions will serve as finance management-intermediaries to manage the credit schemes to households. Small works contractors and artisans will receive training for promotion and marketing all the available improved technology options.
623. Existing organizations including Water and Sanitation Development Boards (WSDBs), Water and Sanitation Committees (WATSANs), Community-based Organisations (CBOs), landlord associations, market-women associations etc), will serve as platforms for promoting the scheme.
44 WHO/UNICEF JMP for WSS. Progress on Drinking Water and Sanitation: Special Focus on Sanitation, 2008 indicates 51% of coverage of Shared as against 10% of “improved” facilities.
5
National Environmental Sanitation Strategy and Action Plan (NESSAP) 2010 - 2015 120
624. An estimated amount of GH¢125,000,000 is earmarked for supporting the provision of 25,000 facilities per year over the initial phase, including appraisal/assessment of activities/capability and roles of MFIs/Rural Banks act as MIs for rolling out country-wide home-toilet improvement programme employing concessionary revolving-loan scheme.
625. Provision of Treatment, Re-Use, Recovery and Disposal Facilities: to meet these requirements while adhering to prescribed standards including the preparation of Environmental Impact Assessments, the co-siting of new facilities as part of MRFs will be pursued, as far as practicable; the land required for these are estimated as part of requirements for MRFs (Table 6.9).
626. The provision of improved treatment and re-use facilities will target selected district capitals, growth and market centres across the 76 urban councils in the country. An estimated amount of GH¢13,000,000 is earmarked for the provision 15 systems comprising FSTP/Bio-digesters, simplified sewerage networks cum waste stabilisation ponds over 6 years.
627. An important aspect of these activities will be the installation of decentralised-excreta-treatment-resource-recovery and re-use (DETERRR) systems in strategic locations. Over the initial period the installation of 50 of such decentralised communal facilities at an estimated cost of GH¢7,525,000 is proposed; this is expected to reduce the burden of faecal sludge and septage flows to treatment facilities.
628. The above intervention implemented together with those under SWM is intended address the need “to provide adequate targeted services in areas close to wetlands, water courses and other vulnerable water resources prone to waste-abuse”.
629. An important aspect of this strategy will be the involvement of the private sector in the provision and management of the DETERR facilities similar to existing franchise management arrangements.
630. Rehabilitation, Upgrading, Installation and Improved Operation-and-Maintenance Management of Existing Treatment Facilities: the NESSAP proposes the implementation of a number of Technical Assistance and Technology Transfer (TATT) projects to overcome the rampant “operational-value” stripping of treatment facilities.
631. The rehabilitation of the main treatment plant serving the capital, Accra, and its environs (GAMA, Greater Accra Metropolitan Area45) has engaged city authorities and ministries in recent times. The closure of the Teshie and Achimota septage treatment facilities has increased the volume of discharges at the Korle-Gonno tipping station and requires urgent repair and upgrading of the Accra Central Sewerage Treatment Plant (Upflow-Anaerobic Sludge Blanket, UASB, system) as well as a number of plants within GAMA to remedy the situation. The rehabilitation of a number of disused plants in other MMDAs will also be initiated.
632. An estimated amount of GH¢13,400,000 is earmarked for rehabilitation, upgrade and installation of treatment facilities in GAMA, TMA, AMA, STMA, TAMA areas. An additional estimated amount of GH¢3,850,000 will be required to implement effective operation and maintenance management of facilities through municipality-cum-private-sector led TATT initiatives.
633. Implementation of Pro-Poor Initiatives in Low-in Income communities: installation of improved sanitation facilities in schools and their sustainable management will be carried out as part of pro-poor upgrading schemes. Over the period an estimated amount of GH¢73,200,000 is earmarked for provision of 2,910 facilities for existing
45 GAMA covers AMA, TMA, Ledzorkuku-Krowor, Adentan and Ashaiman municipalities, Ga-West, Ga-East, and Ga-South districts.
5
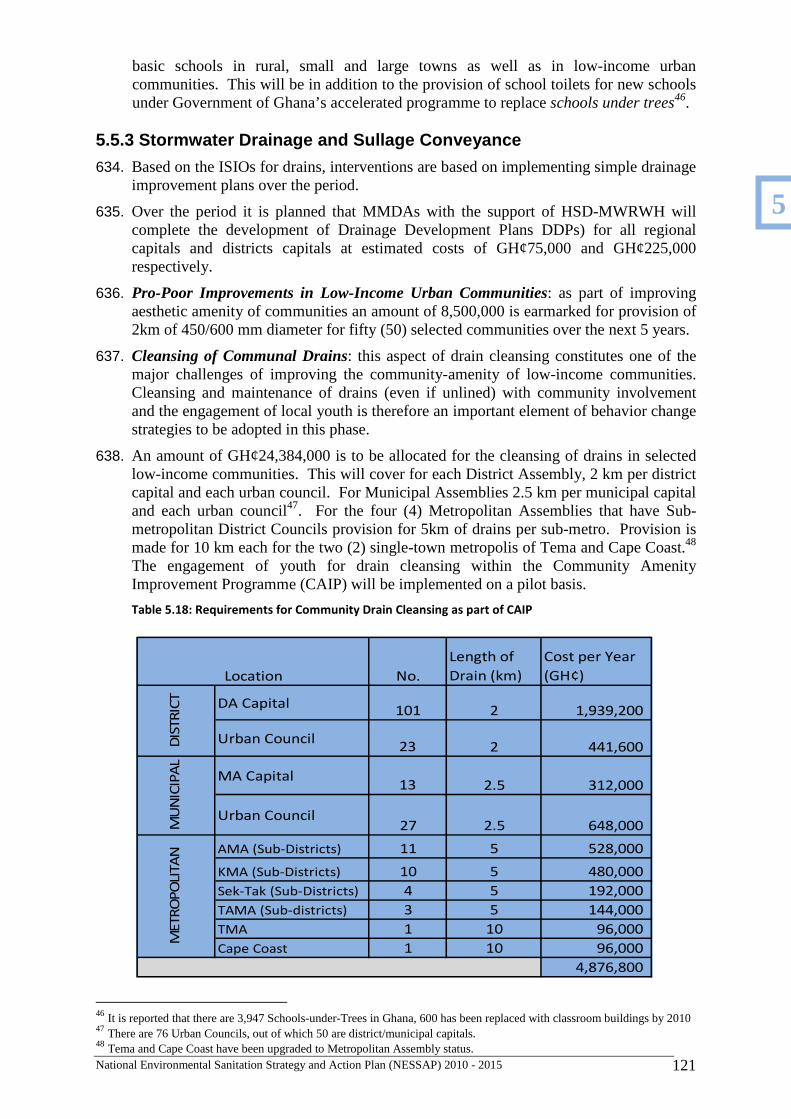
National Environmental Sanitation Strategy and Action Plan (NESSAP) 2010 - 2015 121
No.
Length of
Drain (km)
Cost per Year
(GH¢)
DA Capital101 2 1,939,200
Urban Council23 2 441,600
MA Capital13 2.5 312,000
Urban Council27 2.5 648,000
AMA (Sub-Districts) 11 5 528,000
KMA (Sub-Districts) 10 5 480,000
Sek-Tak (Sub-Districts) 4 5 192,000
TAMA (Sub-districts) 3 5 144,000
TMA 1 10 96,000
Cape Coast 1 10 96,000
4,876,800
DIS
TR
ICT
Location
MU
NIC
IPA
LM
ETR
OPO
LITA
N
basic schools in rural, small and large towns as well as in low-income urban communities. This will be in addition to the provision of school toilets for new schools under Government of Ghana’s accelerated programme to replace schools under trees46.
5.5.3 Stormwater Drainage and Sullage Conveyance
634. Based on the ISIOs for drains, interventions are based on implementing simple drainage improvement plans over the period.
635. Over the period it is planned that MMDAs with the support of HSD-MWRWH will complete the development of Drainage Development Plans DDPs) for all regional capitals and districts capitals at estimated costs of GH¢75,000 and GH¢225,000 respectively.
636. Pro-Poor Improvements in Low-Income Urban Communities: as part of improving aesthetic amenity of communities an amount of 8,500,000 is earmarked for provision of 2km of 450/600 mm diameter for fifty (50) selected communities over the next 5 years.
637. Cleansing of Communal Drains: this aspect of drain cleansing constitutes one of the major challenges of improving the community-amenity of low-income communities. Cleansing and maintenance of drains (even if unlined) with community involvement and the engagement of local youth is therefore an important element of behavior change strategies to be adopted in this phase.
638. An amount of GH¢24,384,000 is to be allocated for the cleansing of drains in selected low-income communities. This will cover for each District Assembly, 2 km per district capital and each urban council. For Municipal Assemblies 2.5 km per municipal capital and each urban council47. For the four (4) Metropolitan Assemblies that have Sub-metropolitan District Councils provision for 5km of drains per sub-metro. Provision is made for 10 km each for the two (2) single-town metropolis of Tema and Cape Coast.48 The engagement of youth for drain cleansing within the Community Amenity Improvement Programme (CAIP) will be implemented on a pilot basis.
Table 5.18: Requirements for Community Drain Cleansing as part of CAIP
46 It is reported that there are 3,947 Schools-under-Trees in Ghana, 600 has been replaced with classroom buildings by 2010 47 There are 76 Urban Councils, out of which 50 are district/municipal capitals. 48 Tema and Cape Coast have been upgraded to Metropolitan Assembly status.
5
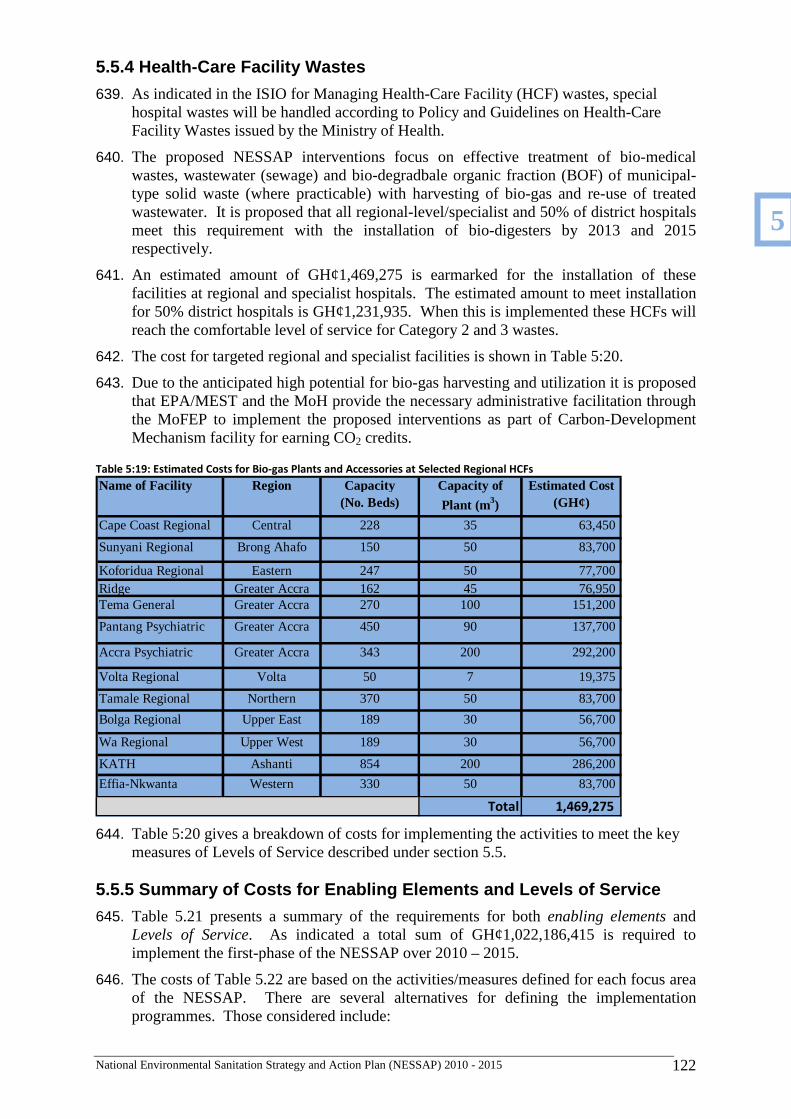
National Environmental Sanitation Strategy and Action Plan (NESSAP) 2010 - 2015 122
5.5.4 Health-Care Facility Wastes
639. As indicated in the ISIO for Managing Health-Care Facility (HCF) wastes, special hospital wastes will be handled according to Policy and Guidelines on Health-Care Facility Wastes issued by the Ministry of Health.
640. The proposed NESSAP interventions focus on effective treatment of bio-medical wastes, wastewater (sewage) and bio-degradbale organic fraction (BOF) of municipal-type solid waste (where practicable) with harvesting of bio-gas and re-use of treated wastewater. It is proposed that all regional-level/specialist and 50% of district hospitals meet this requirement with the installation of bio-digesters by 2013 and 2015 respectively.
641. An estimated amount of GH¢1,469,275 is earmarked for the installation of these facilities at regional and specialist hospitals. The estimated amount to meet installation for 50% district hospitals is GH¢1,231,935. When this is implemented these HCFs will reach the comfortable level of service for Category 2 and 3 wastes.
642. The cost for targeted regional and specialist facilities is shown in Table 5:20.
643. Due to the anticipated high potential for bio-gas harvesting and utilization it is proposed that EPA/MEST and the MoH provide the necessary administrative facilitation through the MoFEP to implement the proposed interventions as part of Carbon-Development Mechanism facility for earning CO2 credits.
Table 5:19: Estimated Costs for Bio-gas Plants and Accessories at Selected Regional HCFs
Name of Facility Region Capacity (No. Beds)
Capacity of
Plant (m3)
Estimated Cost (GH¢)
Cape Coast Regional Central 228 35 63,450
Sunyani Regional Brong Ahafo 150 50 83,700
Koforidua Regional Eastern 247 50 77,700 Ridge Greater Accra 162 45 76,950 Tema General Greater Accra 270 100 151,200
Pantang Psychiatric Greater Accra 450 90 137,700
Accra Psychiatric Greater Accra 343 200 292,200
Volta Regional Volta 50 7 19,375
Tamale Regional Northern 370 50 83,700
Bolga Regional Upper East 189 30 56,700
Wa Regional Upper West 189 30 56,700
KATH Ashanti 854 200 286,200
Effia-Nkwanta Western 330 50 83,700
Total 1,469,275
644. Table 5:20 gives a breakdown of costs for implementing the activities to meet the key measures of Levels of Service described under section 5.5.
5.5.5 Summary of Costs for Enabling Elements and Le vels of Service
645. Table 5.21 presents a summary of the requirements for both enabling elements and Levels of Service. As indicated a total sum of GH¢1,022,186,415 is required to implement the first-phase of the NESSAP over 2010 – 2015.
646. The costs of Table 5.22 are based on the activities/measures defined for each focus area of the NESSAP. There are several alternatives for defining the implementation programmes. Those considered include:
5
National Environmental Sanitation Strategy and Action Plan (NESSAP) 2010 - 2015 123
• Defining programmes according to the main NESSAP component-measures:- general (or cross-cutting issues), solid waste management, excreta management, storm-water drainage and sullage conveyance, environmental sanitation education and enforcement management, and health-care, industrial and hazardous wastes management;
• Identifying implementation programmes to reflect various national-plan targets including MDGs; and/or
• Defining implementation plans according to the NESSAP framework for improving environmental sanitation in combination with the above.
647. The last alternative was adopted and implementation programmes defined to address sector requirements. The programmes will be implemented through MMDA/MLGRD interventions as well as those of related sectors such MWRWH, MoE, MEST, MoH and MoFA. These are elaborated in Chapter 6.
5
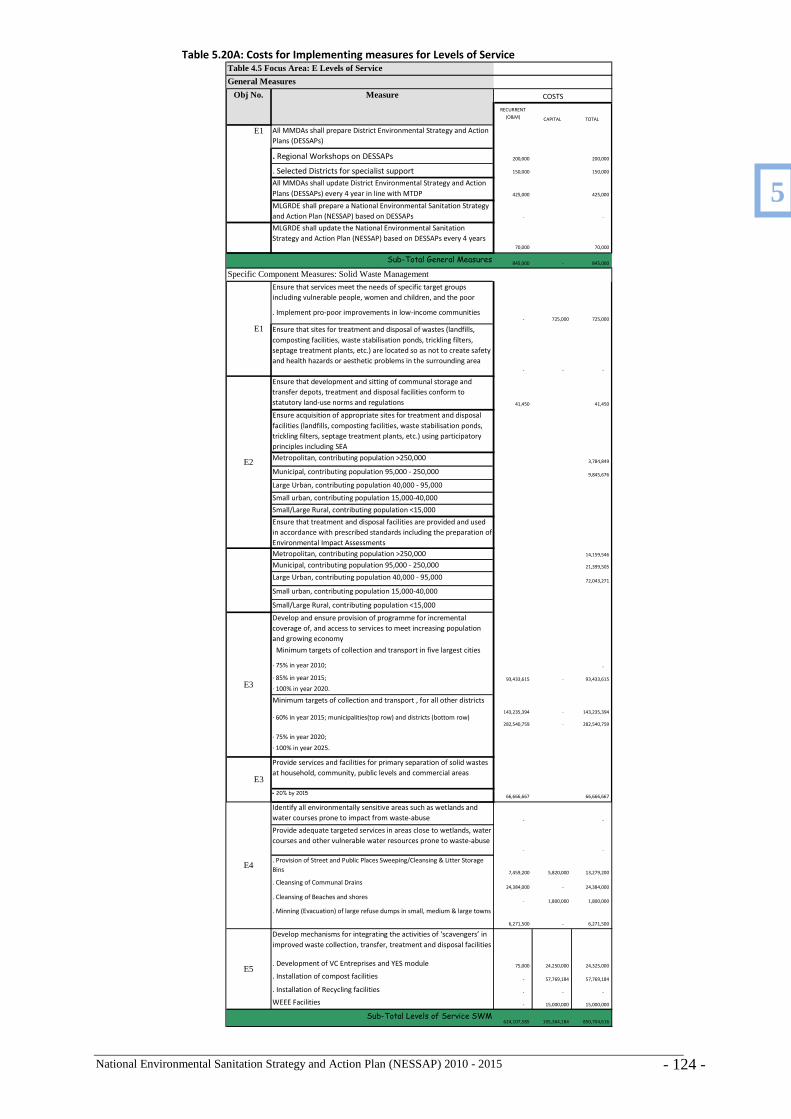
National Environmental Sanitation Strategy and Action Plan (NESSAP) 2010 - 2015 - 124 -
Table 5.20A: Costs for Implementing measures for Levels of Service
RECURRENT
(O&M) CAPITAL TOTAL
All MMDAs shall prepare District Environmental Strategy and Action
Plans (DESSAPs)
. Regional Workshops on DESSAPs 200,000 200,000
. Selected Districts for specialist support 150,000 150,000
All MMDAs shall update District Environmental Strategy and Action
Plans (DESSAPs) every 4 year in line with MTDP 425,000 425,000
MLGRDE shall prepare a National Environmental Sanitation Strategy
and Action Plan (NESSAP) based on DESSAPs - -
MLGRDE shall update the National Environmental Sanitation
Strategy and Action Plan (NESSAP) based on DESSAPs every 4 years70,000 70,000
Sub-Total General Measures845,000 - 845,000
Ensure that services meet the needs of specific target groups
including vulnerable people, women and children, and the poor
. Implement pro-poor improvements in low-income communities- 725,000 725,000
Ensure that sites for treatment and disposal of wastes (landfills,
composting facilities, waste stabilisation ponds, trickling filters,
septage treatment plants, etc.) are located so as not to create safety
and health hazards or aesthetic problems in the surrounding area- - -
Ensure that development and sitting of communal storage and
transfer depots, treatment and disposal facilities conform to
statutory land-use norms and regulations 41,450 41,450
Ensure acquisition of appropriate sites for treatment and disposal
facilities (landfills, composting facilities, waste stabilisation ponds,
trickling filters, septage treatment plants, etc.) using participatory
principles including SEA
Metropolitan, contributing population >250,0003,784,849
Municipal, contributing population 95,000 - 250,000 9,845,676
Large Urban, contributing population 40,000 - 95,000
Small urban, contributing population 15,000-40,000
Small/Large Rural, contributing population <15,000
Ensure that treatment and disposal facilities are provided and used
in accordance with prescribed standards including the preparation of
Environmental Impact Assessments
Metropolitan, contributing population >250,000 14,159,546
Municipal, contributing population 95,000 - 250,000 21,399,505
Large Urban, contributing population 40,000 - 95,00072,043,271
Small urban, contributing population 15,000-40,000
Small/Large Rural, contributing population <15,000
Develop and ensure provision of programme for incremental
coverage of, and access to services to meet increasing population
and growing economy
Minimum targets of collection and transport in five largest cities
· 75% in year 2010; -
· 85% in year 2015; 93,433,615 - 93,433,615
· 100% in year 2020.
Minimum targets of collection and transport , for all other districts
143,235,394 - 143,235,394
282,540,759 - 282,540,759
· 75% in year 2020;
· 100% in year 2025.
Provide services and facilities for primary separation of solid wastes
at household, community, public levels and commercial areas
• 20% by 201566,666,667 66,666,667
Identify all environmentally sensitive areas such as wetlands and
water courses prone to impact from waste-abuse - -
Provide adequate targeted services in areas close to wetlands, water
courses and other vulnerable water resources prone to waste-abuse- -
. Provision of Street and Public Places Sweeping/Cleansing & Litter Storage
Bins 7,459,200 5,820,000 13,279,200
. Cleansing of Communal Drains24,384,000 - 24,384,000
. Cleansing of Beaches and shores- 1,800,000 1,800,000
. Minning (Evacuation) of large refuse dumps in small, medium & large towns
6,271,500 - 6,271,500
Develop mechanisms for integrating the activities of ‘scavengers’ in
improved waste collection, transfer, treatment and disposal facilities
. Development of VC Entreprises and YES module 75,000 24,250,000 24,325,000
. Installation of compost facilities - 57,769,184 57,769,184
. Installation of Recycling facilities - - -
WEEE Facilities - 15,000,000 15,000,000
Sub-Total Levels of Service SWM624,107,585 105,364,184 850,704,616
Table 4.5 Focus Area: E Levels of Service
General Measures
Obj No. Measure
· 60% in year 2015; municipalities(top row) and districts (bottom row)
E3
E4
E5
Specific Component Measures: Solid Waste Management
E1
E1
COSTS
E3
E2
5
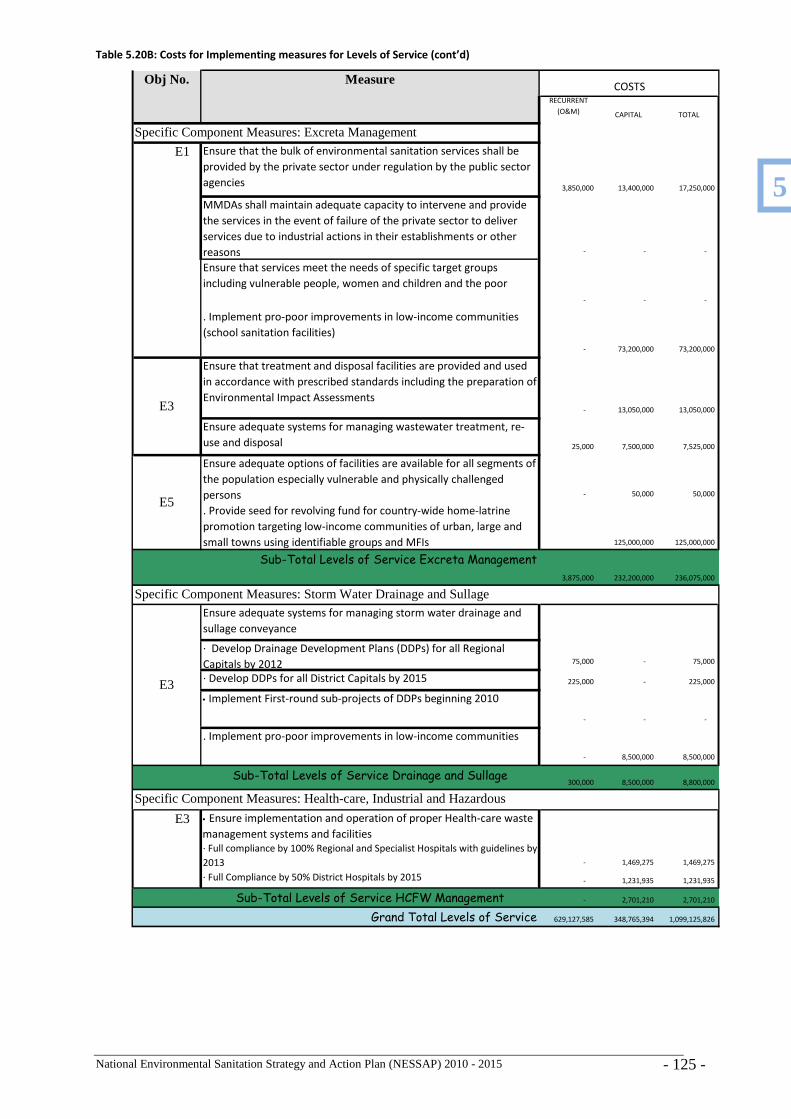
National Environmental Sanitation Strategy and Action Plan (NESSAP) 2010 - 2015 - 125 -
Table 5.20B: Costs for Implementing measures for Levels of Service (cont’d)
RECURRENT
(O&M) CAPITAL TOTAL
Ensure that the bulk of environmental sanitation services shall be
provided by the private sector under regulation by the public sector
agencies3,850,000 13,400,000 17,250,000
MMDAs shall maintain adequate capacity to intervene and provide
the services in the event of failure of the private sector to deliver
services due to industrial actions in their establishments or other
reasons - - -
Ensure that services meet the needs of specific target groups
including vulnerable people, women and children and the poor
- - -
. Implement pro-poor improvements in low-income communities
(school sanitation facilities)
- 73,200,000 73,200,000
Ensure that treatment and disposal facilities are provided and used
in accordance with prescribed standards including the preparation of
Environmental Impact Assessments- 13,050,000 13,050,000
Ensure adequate systems for managing wastewater treatment, re-
use and disposal 25,000 7,500,000 7,525,000
Ensure adequate options of facilities are available for all segments of
the population especially vulnerable and physically challenged
persons - 50,000 50,000
. Provide seed for revolving fund for country-wide home-latrine
promotion targeting low-income communities of urban, large and
small towns using identifiable groups and MFIs 125,000,000 125,000,000
Sub-Total Levels of Service Excreta Management
3,875,000 232,200,000 236,075,000
Ensure adequate systems for managing storm water drainage and
sullage conveyance
· Develop Drainage Development Plans (DDPs) for all Regional
Capitals by 2012 75,000 - 75,000
· Develop DDPs for all District Capitals by 2015 225,000 - 225,000
• Implement First-round sub-projects of DDPs beginning 2010
- - -
. Implement pro-poor improvements in low-income communities
- 8,500,000 8,500,000
300,000 8,500,000 8,800,000
• Ensure implementation and operation of proper Health-care waste
management systems and facilities
· Full compliance by 100% Regional and Specialist Hospitals with guidelines by
2013 - 1,469,275 1,469,275
· Full Compliance by 50% District Hospitals by 2015 - 1,231,935 1,231,935
- 2,701,210 2,701,210
Grand Total Levels of Service 629,127,585 348,765,394 1,099,125,826
MeasureCOSTS
E1
E5
E3
Specific Component Measures: Excreta Management
Obj No.
Sub-Total Levels of Service HCFW Management
E3
Specific Component Measures: Storm Water Drainage and Sullage Conveyance
Sub-Total Levels of Service Drainage and Sullage
ConveyanceSpecific Component Measures: Health-care, Industrial and Hazardous Wastes
E3
5
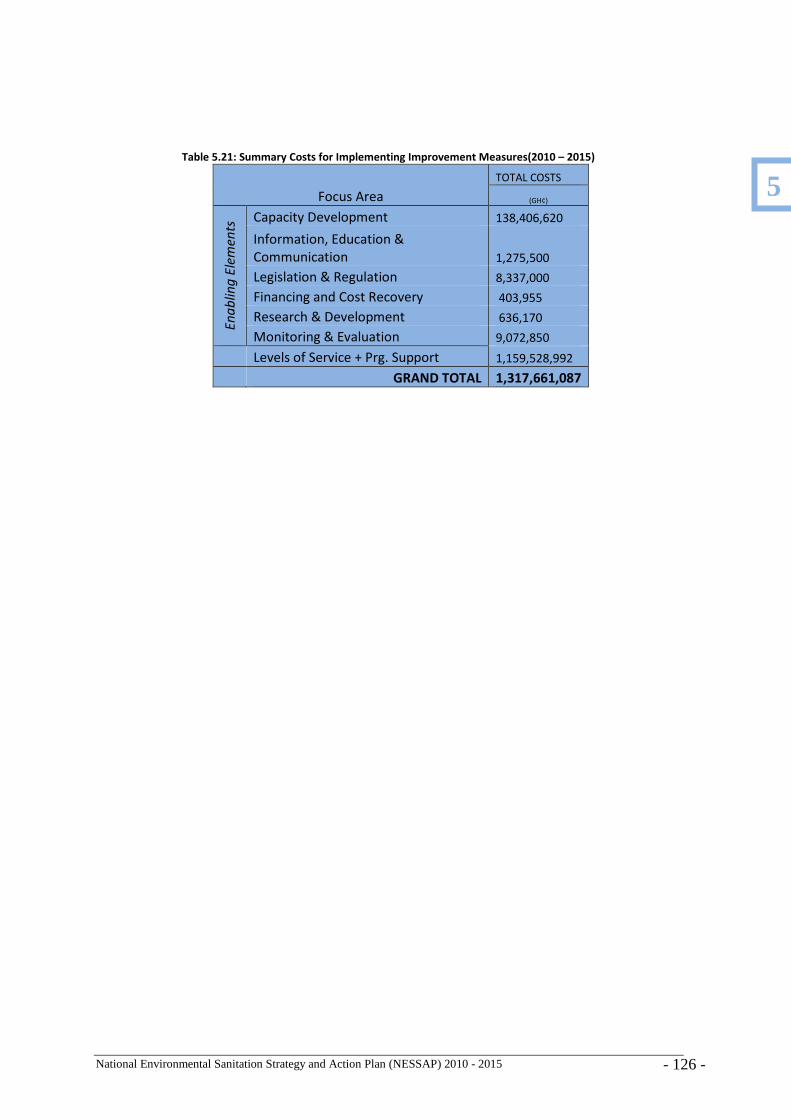
National Environmental Sanitation Strategy and Action Plan (NESSAP) 2010 - 2015 - 126 -
Table 5.21: Summary Costs for Implementing Improvement Measures(2010 – 2015)
Focus Area
TOTAL COSTS
(GH¢)
En
ab
lin
g E
lem
en
ts Capacity Development 138,406,620
Information, Education &
Communication 1,275,500
Legislation & Regulation 8,337,000
Financing and Cost Recovery 403,955
Research & Development 636,170
Monitoring & Evaluation 9,072,850
Levels of Service + Prg. Support 1,159,528,992
GRAND TOTAL 1,317,661,087
5
National Environmental Sanitation Strategy and Action Plan (NESSAP) 2010 - 2015 - 127 -
6 Implementation Plan
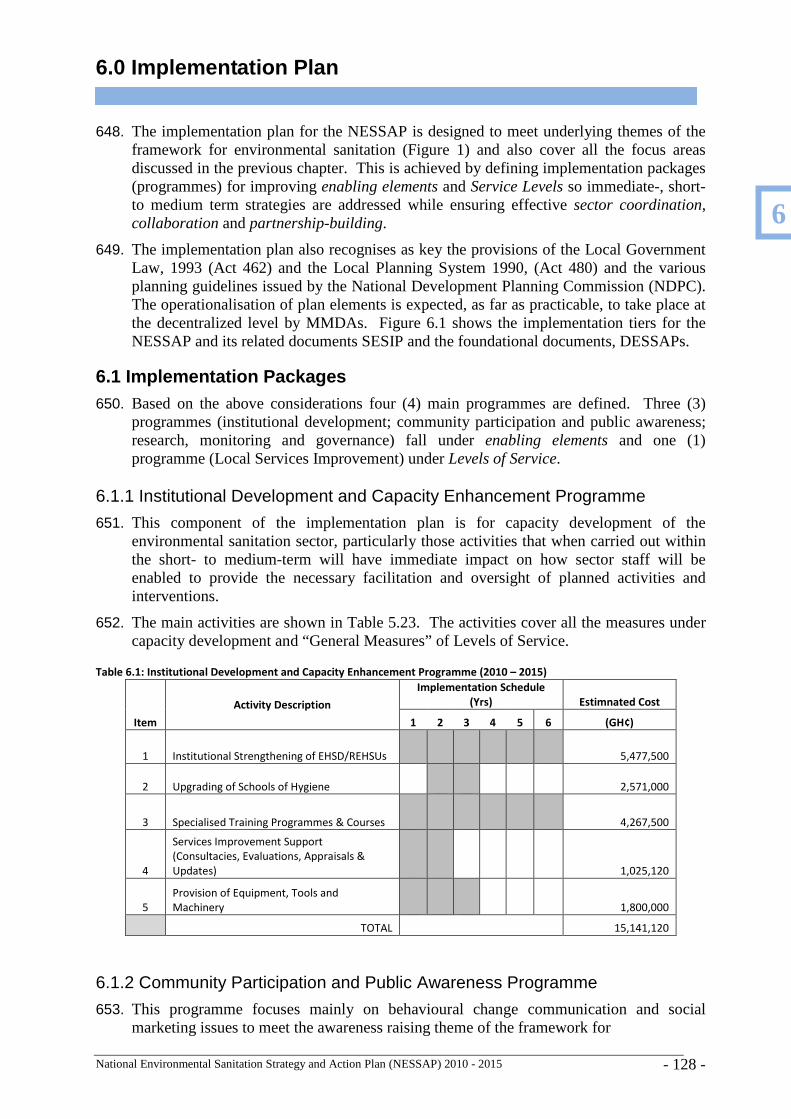
National Environmental Sanitation Strategy and Action Plan (NESSAP) 2010 - 2015 - 128 -
6.0 Implementation Plan
648. The implementation plan for the NESSAP is designed to meet underlying themes of the framework for environmental sanitation (Figure 1) and also cover all the focus areas discussed in the previous chapter. This is achieved by defining implementation packages (programmes) for improving enabling elements and Service Levels so immediate-, short- to medium term strategies are addressed while ensuring effective sector coordination, collaboration and partnership-building.
649. The implementation plan also recognises as key the provisions of the Local Government Law, 1993 (Act 462) and the Local Planning System 1990, (Act 480) and the various planning guidelines issued by the National Development Planning Commission (NDPC). The operationalisation of plan elements is expected, as far as practicable, to take place at the decentralized level by MMDAs. Figure 6.1 shows the implementation tiers for the NESSAP and its related documents SESIP and the foundational documents, DESSAPs.
6.1 Implementation Packages 650. Based on the above considerations four (4) main programmes are defined. Three (3)
programmes (institutional development; community participation and public awareness; research, monitoring and governance) fall under enabling elements and one (1) programme (Local Services Improvement) under Levels of Service.
6.1.1 Institutional Development and Capacity Enhancement Programme
651. This component of the implementation plan is for capacity development of the environmental sanitation sector, particularly those activities that when carried out within the short- to medium-term will have immediate impact on how sector staff will be enabled to provide the necessary facilitation and oversight of planned activities and interventions.
652. The main activities are shown in Table 5.23. The activities cover all the measures under capacity development and “General Measures” of Levels of Service.
Table 6.1: Institutional Development and Capacity Enhancement Programme (2010 – 2015)
Item
Activity Description
Implementation Schedule
(Yrs) Estimnated Cost
1 2 3 4 5 6 (GH¢)
1 Institutional Strengthening of EHSD/REHSUs 5,477,500
2 Upgrading of Schools of Hygiene 2,571,000
3 Specialised Training Programmes & Courses 4,267,500
4
Services Improvement Support
(Consultacies, Evaluations, Appraisals &
Updates) 1,025,120
5
Provision of Equipment, Tools and
Machinery 1,800,000
TOTAL 15,141,120
6.1.2 Community Participation and Public Awareness Programme
653. This programme focuses mainly on behavioural change communication and social marketing issues to meet the awareness raising theme of the framework for
6
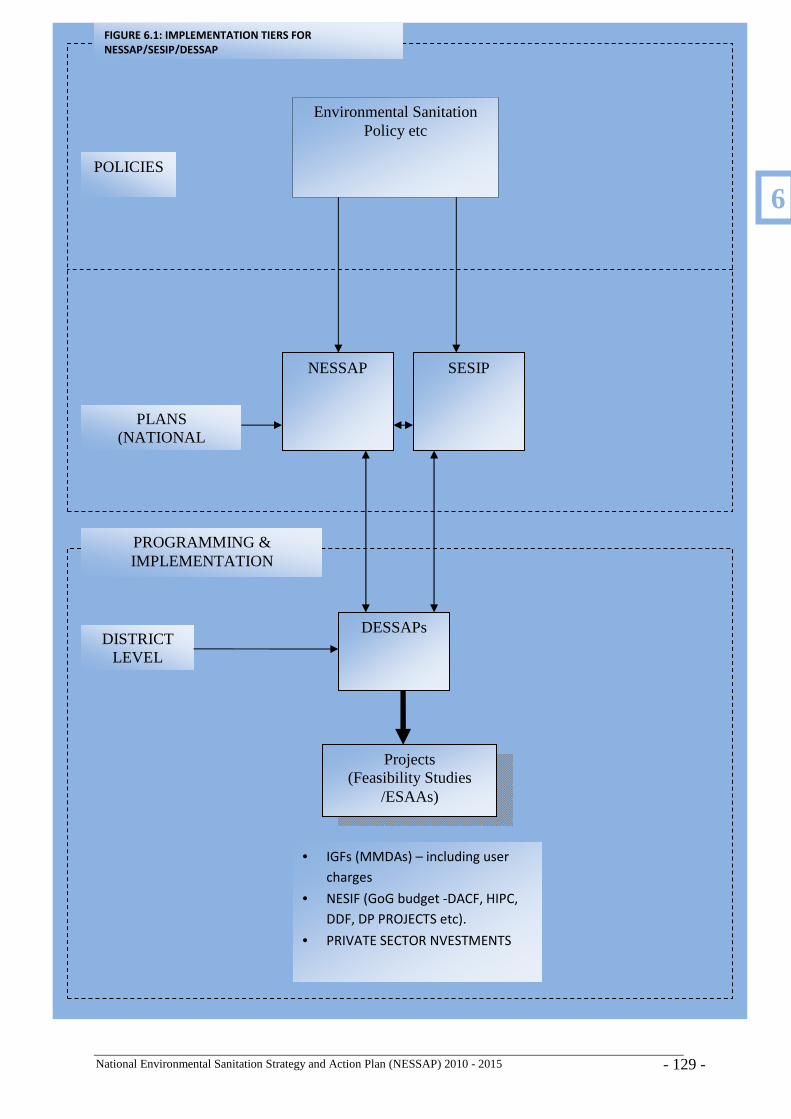
National Environmental Sanitation Strategy and Action Plan (NESSAP) 2010 - 2015 - 129 -
6
PROGRAMMING & IMPLEMENTATION
DISTRICT LEVEL
Projects (Feasibility Studies
/ESAAs)
• IGFs (MMDAs) – including user
charges
• NESIF (GoG budget -DACF, HIPC,
DDF, DP PROJECTS etc).
• PRIVATE SECTOR NVESTMENTS
DESSAPs
FIGURE 6.1: IMPLEMENTATION TIERS FOR
NESSAP/SESIP/DESSAP
Environmental Sanitation Policy etc
POLICIES
NESSAP SESIP
PLANS (NATIONAL
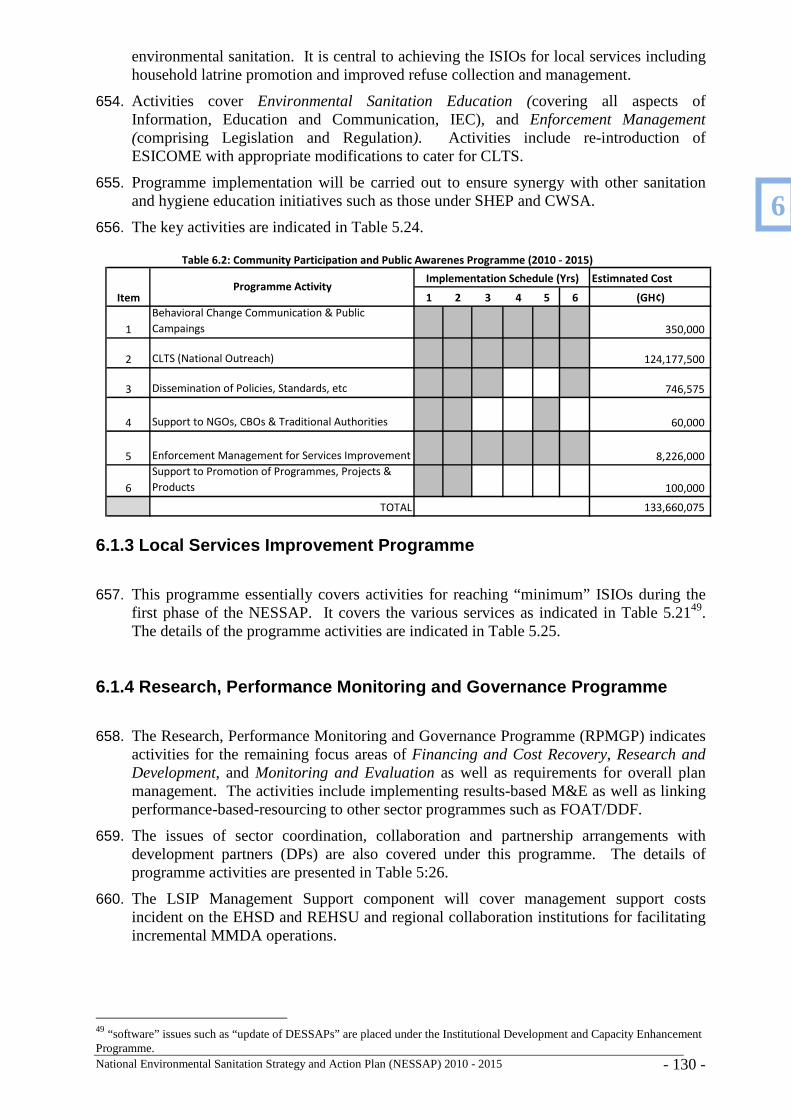
National Environmental Sanitation Strategy and Action Plan (NESSAP) 2010 - 2015 - 130 -
environmental sanitation. It is central to achieving the ISIOs for local services including household latrine promotion and improved refuse collection and management.
654. Activities cover Environmental Sanitation Education (covering all aspects of Information, Education and Communication, IEC), and Enforcement Management (comprising Legislation and Regulation). Activities include re-introduction of ESICOME with appropriate modifications to cater for CLTS.
655. Programme implementation will be carried out to ensure synergy with other sanitation and hygiene education initiatives such as those under SHEP and CWSA.
656. The key activities are indicated in Table 5.24. Table 6.2: Community Participation and Public Awarenes Programme (2010 - 2015)
Estimnated Cost
1 2 3 4 5 6 (GH¢)
1
Behavioral Change Communication & Public
Campaings 350,000
2 CLTS (National Outreach) 124,177,500
3 Dissemination of Policies, Standards, etc 746,575
4 Support to NGOs, CBOs & Traditional Authorities 60,000
5 Enforcement Management for Services Improvement 8,226,000
6
Support to Promotion of Programmes, Projects &
Products 100,000
TOTAL 133,660,075
Programme ActivityImplementation Schedule (Yrs)
Item
6.1.3 Local Services Improvement Programme
657. This programme essentially covers activities for reaching “minimum” ISIOs during the first phase of the NESSAP. It covers the various services as indicated in Table 5.2149. The details of the programme activities are indicated in Table 5.25.
6.1.4 Research, Performance Monitoring and Governan ce Programme
658. The Research, Performance Monitoring and Governance Programme (RPMGP) indicates activities for the remaining focus areas of Financing and Cost Recovery, Research and Development, and Monitoring and Evaluation as well as requirements for overall plan management. The activities include implementing results-based M&E as well as linking performance-based-resourcing to other sector programmes such as FOAT/DDF.
659. The issues of sector coordination, collaboration and partnership arrangements with development partners (DPs) are also covered under this programme. The details of programme activities are presented in Table 5:26.
660. The LSIP Management Support component will cover management support costs incident on the EHSD and REHSU and regional collaboration institutions for facilitating incremental MMDA operations.
49 “software” issues such as “update of DESSAPs” are placed under the Institutional Development and Capacity Enhancement Programme.
6
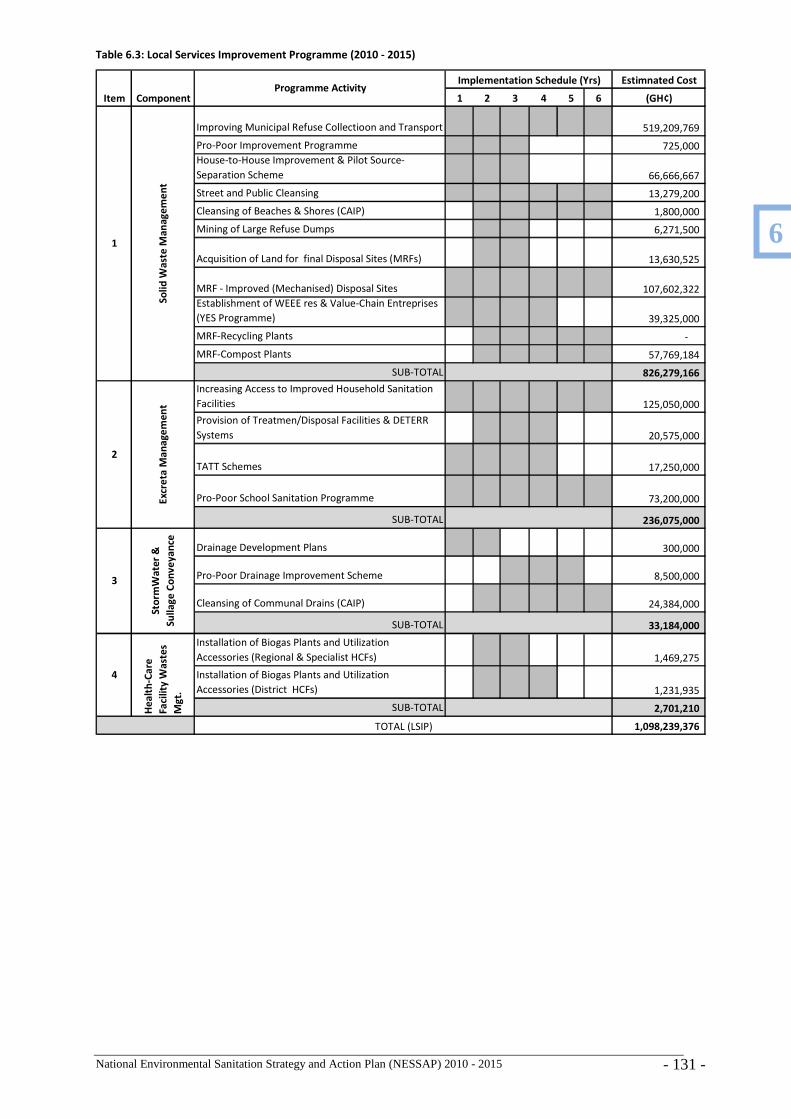
National Environmental Sanitation Strategy and Action Plan (NESSAP) 2010 - 2015 - 131 -
Table 6.3: Local Services Improvement Programme (2010 - 2015)
Estimnated Cost
1 2 3 4 5 6 (GH¢)
Improving Municipal Refuse Collectioon and Transport 519,209,769
Pro-Poor Improvement Programme 725,000
House-to-House Improvement & Pilot Source-
Separation Scheme 66,666,667
Street and Public Cleansing 13,279,200
Cleansing of Beaches & Shores (CAIP) 1,800,000
Mining of Large Refuse Dumps 6,271,500
Acquisition of Land for final Disposal Sites (MRFs) 13,630,525
MRF - Improved (Mechanised) Disposal Sites 107,602,322
Establishment of WEEE res & Value-Chain Entreprises
(YES Programme) 39,325,000
MRF-Recycling Plants -
MRF-Compost Plants 57,769,184
SUB-TOTAL 826,279,166
Increasing Access to Improved Household Sanitation
Facilities 125,050,000
Provision of Treatmen/Disposal Facilities & DETERR
Systems 20,575,000
TATT Schemes 17,250,000
Pro-Poor School Sanitation Programme 73,200,000
SUB-TOTAL 236,075,000
Drainage Development Plans 300,000
Pro-Poor Drainage Improvement Scheme 8,500,000
Cleansing of Communal Drains (CAIP) 24,384,000
SUB-TOTAL 33,184,000
Installation of Biogas Plants and Utilization
Accessories (Regional & Specialist HCFs) 1,469,275
Installation of Biogas Plants and Utilization
Accessories (District HCFs) 1,231,935
SUB-TOTAL 2,701,210
1,098,239,376
Programme ActivityImplementation Schedule (Yrs)
Item Component
Sto
rmW
ate
r &
Su
lla
ge
Co
nv
ey
an
ce
4
He
alt
h-C
are
Faci
lity
Wa
ste
s
Mg
t.
TOTAL (LSIP)
1
So
lid
Wa
ste
Ma
na
ge
me
nt
Exc
reta
Ma
na
ge
me
nt
3
2
6
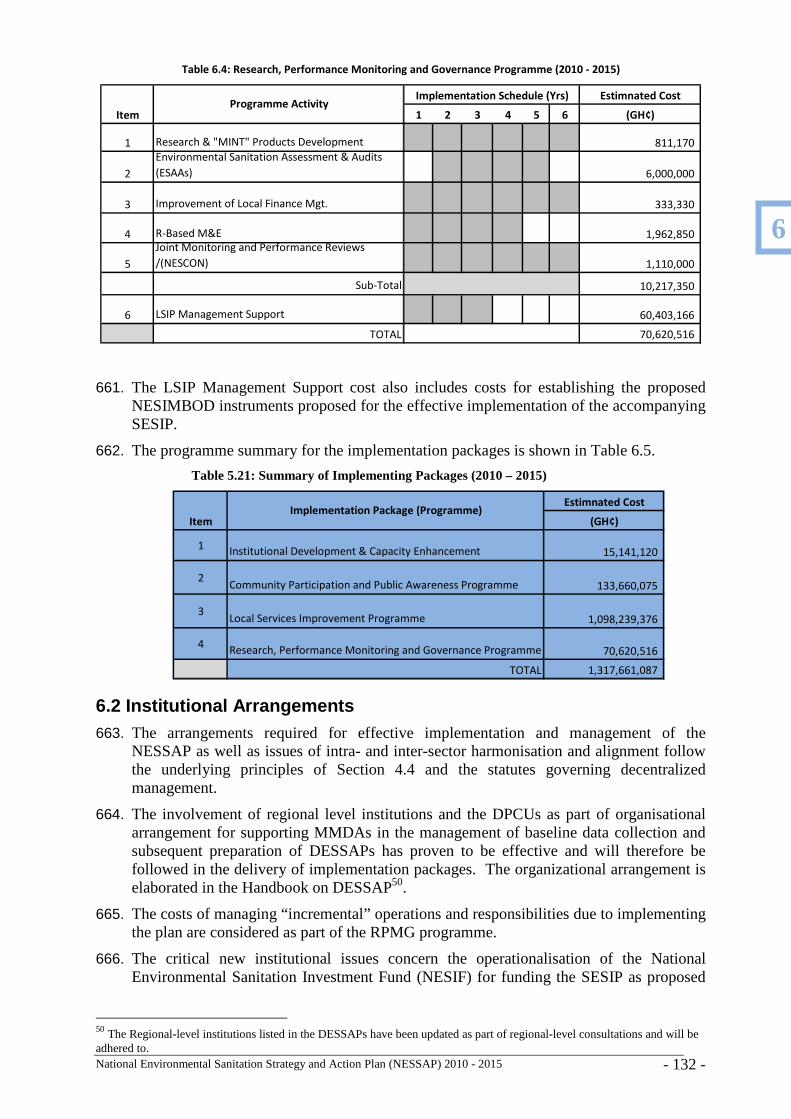
National Environmental Sanitation Strategy and Action Plan (NESSAP) 2010 - 2015 - 132 -
Table 6.4: Research, Performance Monitoring and Governance Programme (2010 - 2015)
Estimnated Cost
1 2 3 4 5 6 (GH¢)
1 Research & "MINT" Products Development 811,170
2
Environmental Sanitation Assessment & Audits
(ESAAs) 6,000,000
3 Improvement of Local Finance Mgt. 333,330
4 R-Based M&E 1,962,850
5
Joint Monitoring and Performance Reviews
/(NESCON) 1,110,000
Sub-Total 10,217,350
6 LSIP Management Support 60,403,166
TOTAL 70,620,516
Programme ActivityImplementation Schedule (Yrs)
Item
661. The LSIP Management Support cost also includes costs for establishing the proposed NESIMBOD instruments proposed for the effective implementation of the accompanying SESIP.
662. The programme summary for the implementation packages is shown in Table 6.5.
Table 5.21: Summary of Implementing Packages (2010 – 2015)
Estimnated Cost
(GH¢)
1Institutional Development & Capacity Enhancement 15,141,120
2Community Participation and Public Awareness Programme 133,660,075
3Local Services Improvement Programme 1,098,239,376
4Research, Performance Monitoring and Governance Programme 70,620,516
TOTAL 1,317,661,087
ItemImplementation Package (Programme)
6.2 Institutional Arrangements 663. The arrangements required for effective implementation and management of the
NESSAP as well as issues of intra- and inter-sector harmonisation and alignment follow the underlying principles of Section 4.4 and the statutes governing decentralized management.
664. The involvement of regional level institutions and the DPCUs as part of organisational arrangement for supporting MMDAs in the management of baseline data collection and subsequent preparation of DESSAPs has proven to be effective and will therefore be followed in the delivery of implementation packages. The organizational arrangement is elaborated in the Handbook on DESSAP50.
665. The costs of managing “incremental” operations and responsibilities due to implementing the plan are considered as part of the RPMG programme.
666. The critical new institutional issues concern the operationalisation of the National Environmental Sanitation Investment Fund (NESIF) for funding the SESIP as proposed
50 The Regional-level institutions listed in the DESSAPs have been updated as part of regional-level consultations and will be adhered to.
6
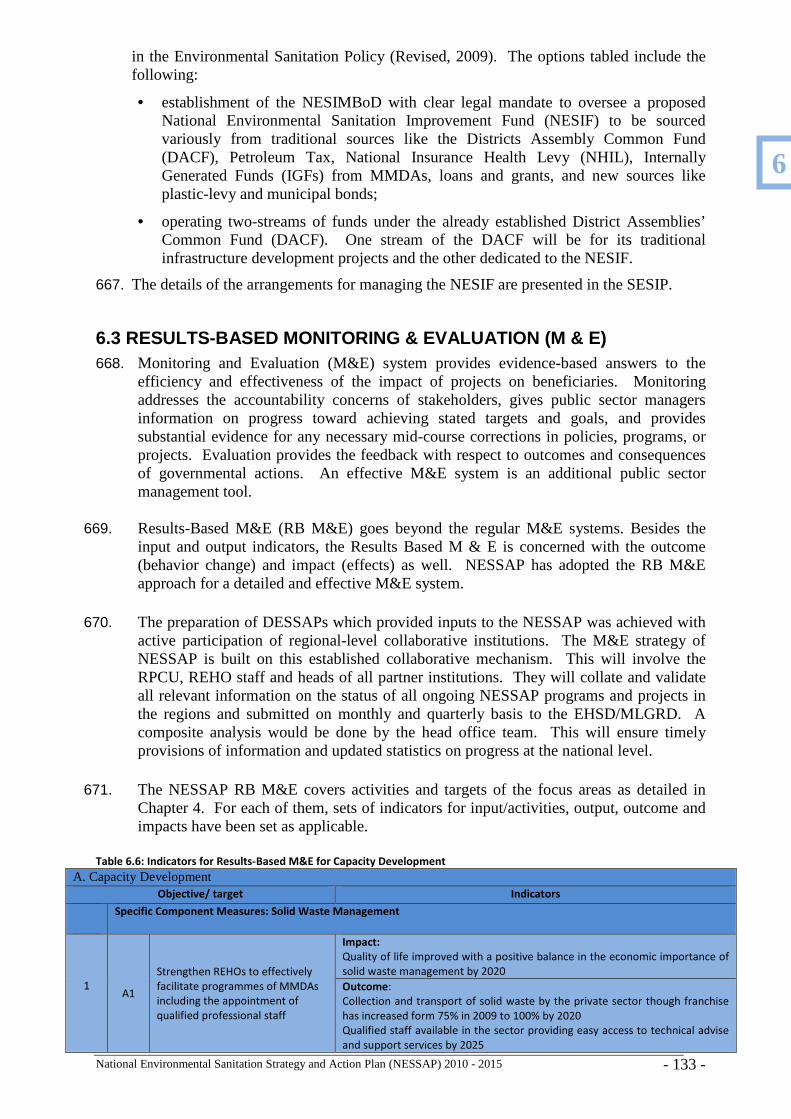
National Environmental Sanitation Strategy and Action Plan (NESSAP) 2010 - 2015 - 133 -
in the Environmental Sanitation Policy (Revised, 2009). The options tabled include the following:
• establishment of the NESIMBoD with clear legal mandate to oversee a proposed National Environmental Sanitation Improvement Fund (NESIF) to be sourced variously from traditional sources like the Districts Assembly Common Fund (DACF), Petroleum Tax, National Insurance Health Levy (NHIL), Internally Generated Funds (IGFs) from MMDAs, loans and grants, and new sources like plastic-levy and municipal bonds;
• operating two-streams of funds under the already established District Assemblies’ Common Fund (DACF). One stream of the DACF will be for its traditional infrastructure development projects and the other dedicated to the NESIF.
667. The details of the arrangements for managing the NESIF are presented in the SESIP.
6.3 RESULTS-BASED MONITORING & EVALUATION (M & E) 668. Monitoring and Evaluation (M&E) system provides evidence-based answers to the
efficiency and effectiveness of the impact of projects on beneficiaries. Monitoring addresses the accountability concerns of stakeholders, gives public sector managers information on progress toward achieving stated targets and goals, and provides substantial evidence for any necessary mid-course corrections in policies, programs, or projects. Evaluation provides the feedback with respect to outcomes and consequences of governmental actions. An effective M&E system is an additional public sector management tool.
669. Results-Based M&E (RB M&E) goes beyond the regular M&E systems. Besides the input and output indicators, the Results Based M & E is concerned with the outcome (behavior change) and impact (effects) as well. NESSAP has adopted the RB M&E approach for a detailed and effective M&E system.
670. The preparation of DESSAPs which provided inputs to the NESSAP was achieved with active participation of regional-level collaborative institutions. The M&E strategy of NESSAP is built on this established collaborative mechanism. This will involve the RPCU, REHO staff and heads of all partner institutions. They will collate and validate all relevant information on the status of all ongoing NESSAP programs and projects in the regions and submitted on monthly and quarterly basis to the EHSD/MLGRD. A composite analysis would be done by the head office team. This will ensure timely provisions of information and updated statistics on progress at the national level.
671. The NESSAP RB M&E covers activities and targets of the focus areas as detailed in Chapter 4. For each of them, sets of indicators for input/activities, output, outcome and impacts have been set as applicable.
Table 6.6: Indicators for Results-Based M&E for Capacity Development
A. Capacity Development Objective/ target Indicators
Specific Component Measures: Solid Waste Management
1 A1
Strengthen REHOs to effectively
facilitate programmes of MMDAs
including the appointment of
qualified professional staff
Impact:
Quality of life improved with a positive balance in the economic importance of
solid waste management by 2020
Outcome:
Collection and transport of solid waste by the private sector though franchise
has increased form 75% in 2009 to 100% by 2020
Qualified staff available in the sector providing easy access to technical advise
and support services by 2025
6
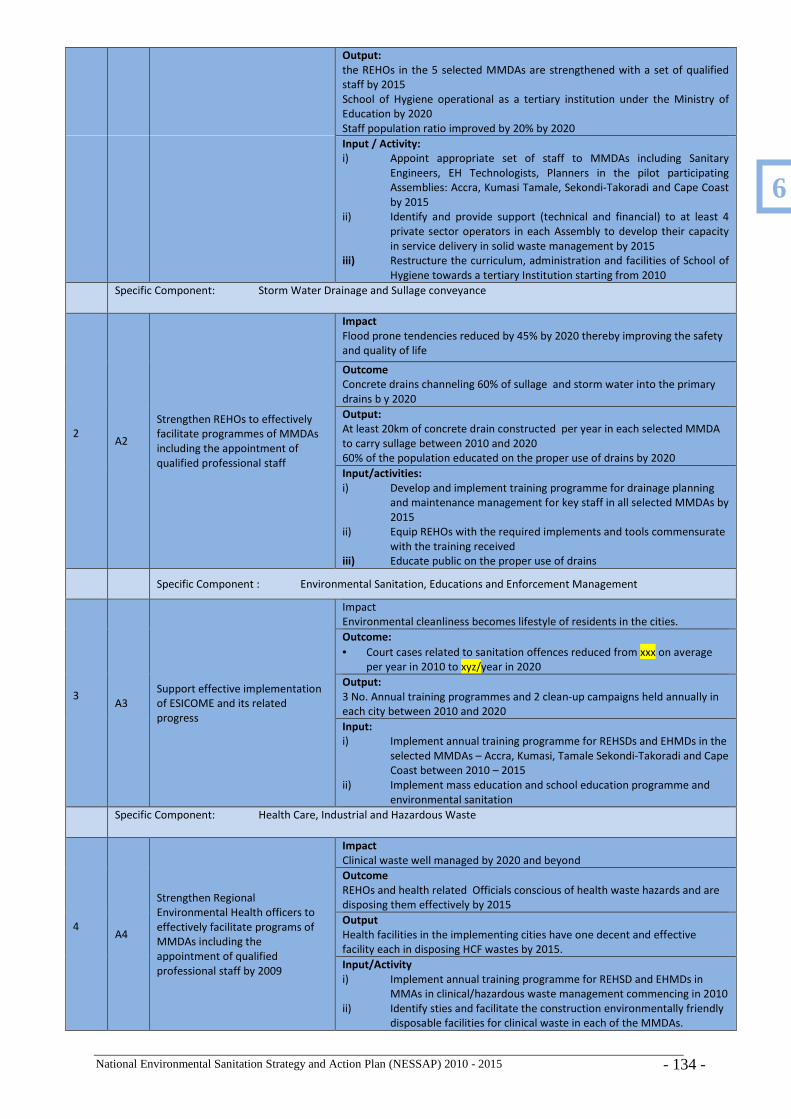
National Environmental Sanitation Strategy and Action Plan (NESSAP) 2010 - 2015 - 134 -
Output:
the REHOs in the 5 selected MMDAs are strengthened with a set of qualified
staff by 2015
School of Hygiene operational as a tertiary institution under the Ministry of
Education by 2020
Staff population ratio improved by 20% by 2020
Input / Activity:
i) Appoint appropriate set of staff to MMDAs including Sanitary
Engineers, EH Technologists, Planners in the pilot participating
Assemblies: Accra, Kumasi Tamale, Sekondi-Takoradi and Cape Coast
by 2015
ii) Identify and provide support (technical and financial) to at least 4
private sector operators in each Assembly to develop their capacity
in service delivery in solid waste management by 2015
iii) Restructure the curriculum, administration and facilities of School of
Hygiene towards a tertiary Institution starting from 2010
Specific Component: Storm Water Drainage and Sullage conveyance
2 A2
Strengthen REHOs to effectively
facilitate programmes of MMDAs
including the appointment of
qualified professional staff
Impact
Flood prone tendencies reduced by 45% by 2020 thereby improving the safety
and quality of life
Outcome
Concrete drains channeling 60% of sullage and storm water into the primary
drains b y 2020
Output:
At least 20km of concrete drain constructed per year in each selected MMDA
to carry sullage between 2010 and 2020
60% of the population educated on the proper use of drains by 2020
Input/activities:
i) Develop and implement training programme for drainage planning
and maintenance management for key staff in all selected MMDAs by
2015
ii) Equip REHOs with the required implements and tools commensurate
with the training received
iii) Educate public on the proper use of drains
Specific Component : Environmental Sanitation, Educations and Enforcement Management
3 A3
Support effective implementation
of ESICOME and its related
progress
Impact
Environmental cleanliness becomes lifestyle of residents in the cities.
Outcome:
• Court cases related to sanitation offences reduced from xxx on average
per year in 2010 to xyz/year in 2020
Output:
3 No. Annual training programmes and 2 clean-up campaigns held annually in
each city between 2010 and 2020
Input:
i) Implement annual training programme for REHSDs and EHMDs in the
selected MMDAs – Accra, Kumasi, Tamale Sekondi-Takoradi and Cape
Coast between 2010 – 2015
ii) Implement mass education and school education programme and
environmental sanitation
Specific Component: Health Care, Industrial and Hazardous Waste
4 A4
Strengthen Regional
Environmental Health officers to
effectively facilitate programs of
MMDAs including the
appointment of qualified
professional staff by 2009
Impact
Clinical waste well managed by 2020 and beyond
Outcome
REHOs and health related Officials conscious of health waste hazards and are
disposing them effectively by 2015
Output
Health facilities in the implementing cities have one decent and effective
facility each in disposing HCF wastes by 2015.
Input/Activity
i) Implement annual training programme for REHSD and EHMDs in
MMAs in clinical/hazardous waste management commencing in 2010
ii) Identify sties and facilitate the construction environmentally friendly
disposable facilities for clinical waste in each of the MMDAs.
6
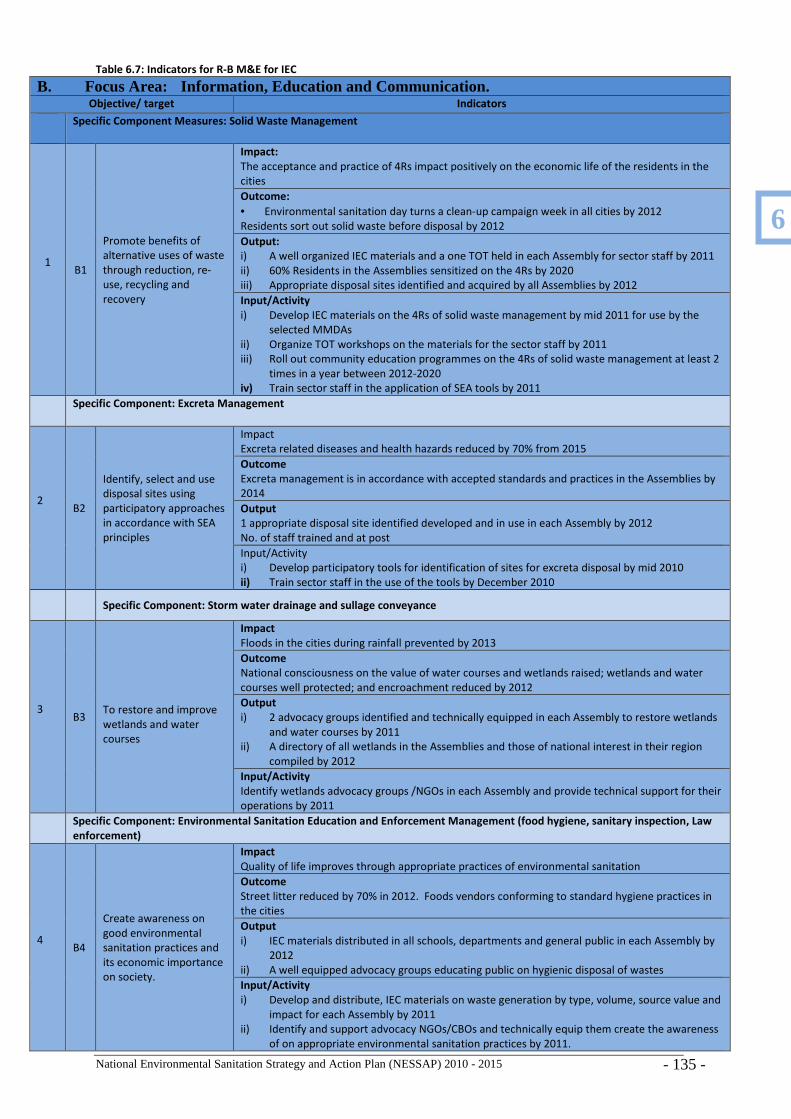
National Environmental Sanitation Strategy and Action Plan (NESSAP) 2010 - 2015 - 135 -
Table 6.7: Indicators for R-B M&E for IEC
B. Focus Area: Information, Education and Communication. Objective/ target Indicators
Specific Component Measures: Solid Waste Management
1 B1
Promote benefits of
alternative uses of waste
through reduction, re-
use, recycling and
recovery
Impact:
The acceptance and practice of 4Rs impact positively on the economic life of the residents in the
cities
Outcome:
• Environmental sanitation day turns a clean-up campaign week in all cities by 2012
Residents sort out solid waste before disposal by 2012
Output:
i) A well organized IEC materials and a one TOT held in each Assembly for sector staff by 2011
ii) 60% Residents in the Assemblies sensitized on the 4Rs by 2020
iii) Appropriate disposal sites identified and acquired by all Assemblies by 2012
Input/Activity
i) Develop IEC materials on the 4Rs of solid waste management by mid 2011 for use by the
selected MMDAs
ii) Organize TOT workshops on the materials for the sector staff by 2011
iii) Roll out community education programmes on the 4Rs of solid waste management at least 2
times in a year between 2012-2020
iv) Train sector staff in the application of SEA tools by 2011
Specific Component: Excreta Management
2 B2
Identify, select and use
disposal sites using
participatory approaches
in accordance with SEA
principles
Impact
Excreta related diseases and health hazards reduced by 70% from 2015
Outcome
Excreta management is in accordance with accepted standards and practices in the Assemblies by
2014
Output
1 appropriate disposal site identified developed and in use in each Assembly by 2012
No. of staff trained and at post
Input/Activity
i) Develop participatory tools for identification of sites for excreta disposal by mid 2010
ii) Train sector staff in the use of the tools by December 2010
Specific Component: Storm water drainage and sullage conveyance
3 B3
To restore and improve
wetlands and water
courses
Impact
Floods in the cities during rainfall prevented by 2013
Outcome
National consciousness on the value of water courses and wetlands raised; wetlands and water
courses well protected; and encroachment reduced by 2012
Output
i) 2 advocacy groups identified and technically equipped in each Assembly to restore wetlands
and water courses by 2011
ii) A directory of all wetlands in the Assemblies and those of national interest in their region
compiled by 2012
Input/Activity
Identify wetlands advocacy groups /NGOs in each Assembly and provide technical support for their
operations by 2011
Specific Component: Environmental Sanitation Education and Enforcement Management (food hygiene, sanitary inspection, Law
enforcement)
4 B4
Create awareness on
good environmental
sanitation practices and
its economic importance
on society.
Impact
Quality of life improves through appropriate practices of environmental sanitation
Outcome
Street litter reduced by 70% in 2012. Foods vendors conforming to standard hygiene practices in
the cities
Output
i) IEC materials distributed in all schools, departments and general public in each Assembly by
2012
ii) A well equipped advocacy groups educating public on hygienic disposal of wastes
Input/Activity
i) Develop and distribute, IEC materials on waste generation by type, volume, source value and
impact for each Assembly by 2011
ii) Identify and support advocacy NGOs/CBOs and technically equip them create the awareness
of on appropriate environmental sanitation practices by 2011.
6
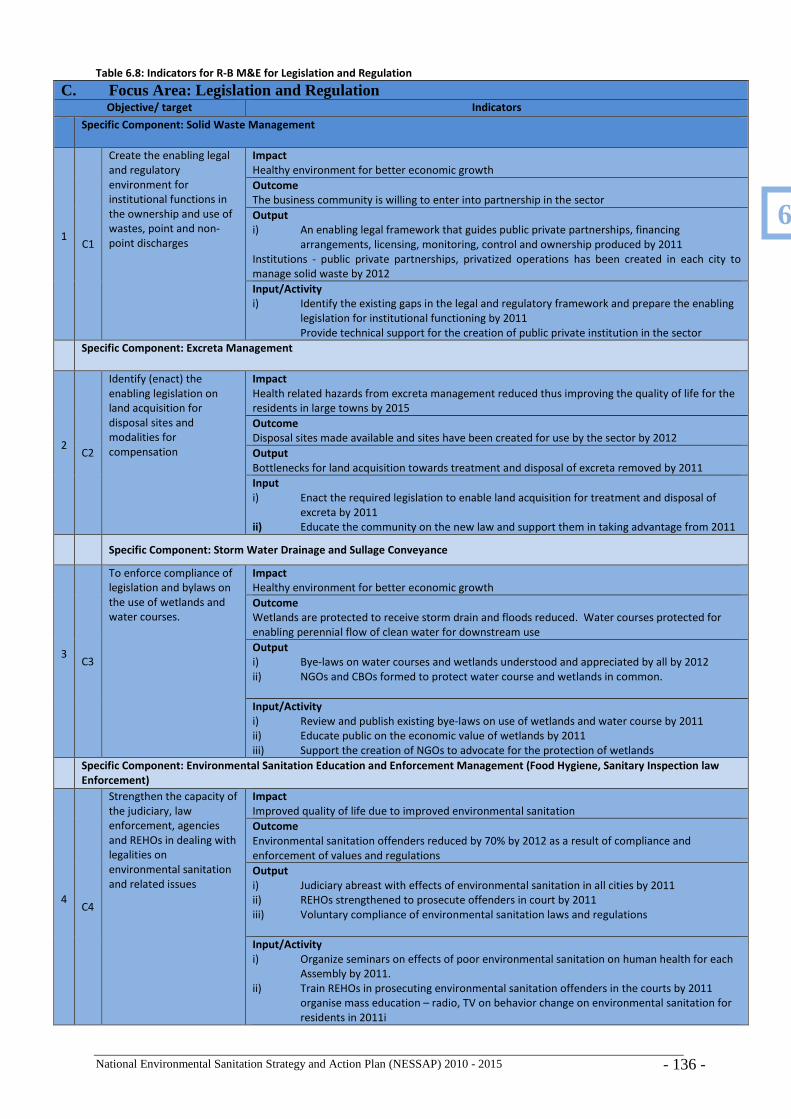
National Environmental Sanitation Strategy and Action Plan (NESSAP) 2010 - 2015 - 136 -
Table 6.8: Indicators for R-B M&E for Legislation and Regulation
C. Focus Area: Legislation and Regulation Objective/ target Indicators
Specific Component: Solid Waste Management
1 C1
Create the enabling legal
and regulatory
environment for
institutional functions in
the ownership and use of
wastes, point and non-
point discharges
Impact
Healthy environment for better economic growth
Outcome
The business community is willing to enter into partnership in the sector
Output
i) An enabling legal framework that guides public private partnerships, financing
arrangements, licensing, monitoring, control and ownership produced by 2011
Institutions - public private partnerships, privatized operations has been created in each city to
manage solid waste by 2012
Input/Activity
i) Identify the existing gaps in the legal and regulatory framework and prepare the enabling
legislation for institutional functioning by 2011
Provide technical support for the creation of public private institution in the sector
Specific Component: Excreta Management
2 C2
Identify (enact) the
enabling legislation on
land acquisition for
disposal sites and
modalities for
compensation
Impact
Health related hazards from excreta management reduced thus improving the quality of life for the
residents in large towns by 2015
Outcome
Disposal sites made available and sites have been created for use by the sector by 2012
Output
Bottlenecks for land acquisition towards treatment and disposal of excreta removed by 2011
Input
i) Enact the required legislation to enable land acquisition for treatment and disposal of
excreta by 2011
ii) Educate the community on the new law and support them in taking advantage from 2011
Specific Component: Storm Water Drainage and Sullage Conveyance
3 C3
To enforce compliance of
legislation and bylaws on
the use of wetlands and
water courses.
Impact
Healthy environment for better economic growth
Outcome
Wetlands are protected to receive storm drain and floods reduced. Water courses protected for
enabling perennial flow of clean water for downstream use
Output
i) Bye-laws on water courses and wetlands understood and appreciated by all by 2012
ii) NGOs and CBOs formed to protect water course and wetlands in common.
Input/Activity
i) Review and publish existing bye-laws on use of wetlands and water course by 2011
ii) Educate public on the economic value of wetlands by 2011
iii) Support the creation of NGOs to advocate for the protection of wetlands
Specific Component: Environmental Sanitation Education and Enforcement Management (Food Hygiene, Sanitary Inspection law
Enforcement)
4 C4
Strengthen the capacity of
the judiciary, law
enforcement, agencies
and REHOs in dealing with
legalities on
environmental sanitation
and related issues
Impact
Improved quality of life due to improved environmental sanitation
Outcome
Environmental sanitation offenders reduced by 70% by 2012 as a result of compliance and
enforcement of values and regulations
Output
i) Judiciary abreast with effects of environmental sanitation in all cities by 2011
ii) REHOs strengthened to prosecute offenders in court by 2011
iii) Voluntary compliance of environmental sanitation laws and regulations
Input/Activity
i) Organize seminars on effects of poor environmental sanitation on human health for each
Assembly by 2011.
ii) Train REHOs in prosecuting environmental sanitation offenders in the courts by 2011
organise mass education – radio, TV on behavior change on environmental sanitation for
residents in 2011i
6
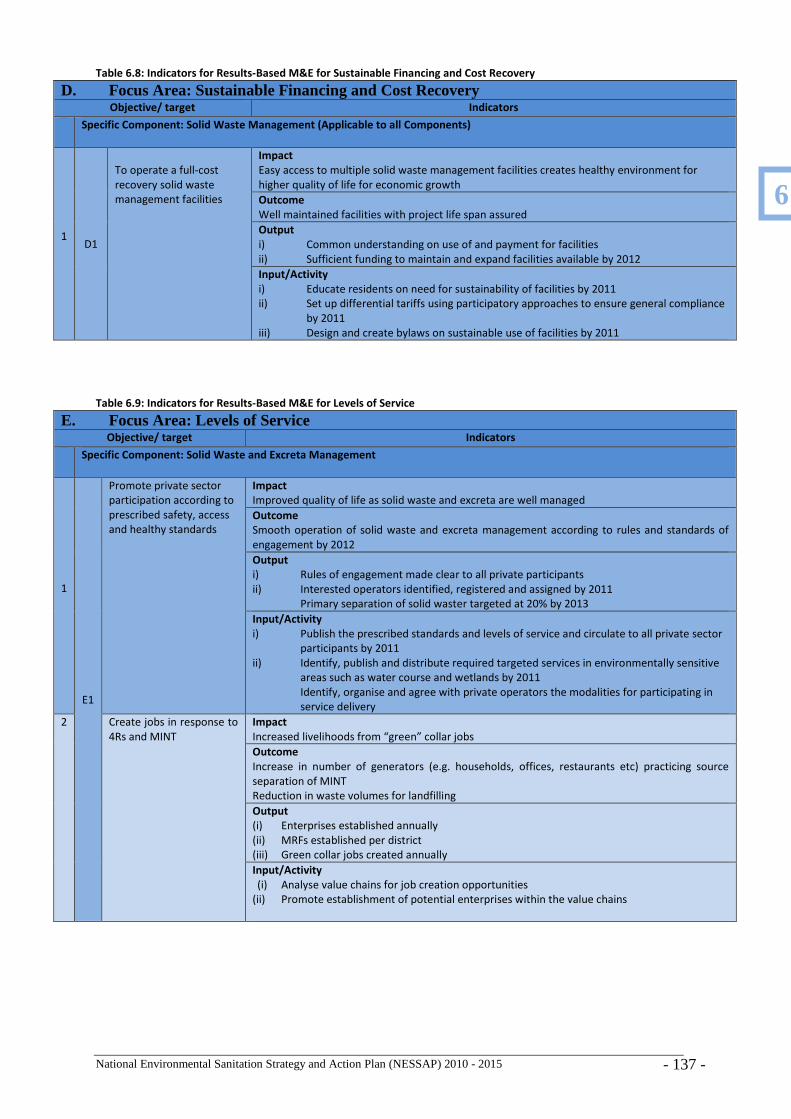
National Environmental Sanitation Strategy and Action Plan (NESSAP) 2010 - 2015 - 137 -
Table 6.8: Indicators for Results-Based M&E for Sustainable Financing and Cost Recovery
D. Focus Area: Sustainable Financing and Cost Recovery Objective/ target Indicators
Specific Component: Solid Waste Management (Applicable to all Components)
1 D1
To operate a full-cost
recovery solid waste
management facilities
Impact
Easy access to multiple solid waste management facilities creates healthy environment for
higher quality of life for economic growth
Outcome
Well maintained facilities with project life span assured
Output
i) Common understanding on use of and payment for facilities
ii) Sufficient funding to maintain and expand facilities available by 2012
Input/Activity
i) Educate residents on need for sustainability of facilities by 2011
ii) Set up differential tariffs using participatory approaches to ensure general compliance
by 2011
iii) Design and create bylaws on sustainable use of facilities by 2011
Table 6.9: Indicators for Results-Based M&E for Levels of Service
E. Focus Area: Levels of Service Objective/ target Indicators
Specific Component: Solid Waste and Excreta Management
1
E1
Promote private sector
participation according to
prescribed safety, access
and healthy standards
Impact
Improved quality of life as solid waste and excreta are well managed
Outcome
Smooth operation of solid waste and excreta management according to rules and standards of
engagement by 2012
Output
i) Rules of engagement made clear to all private participants
ii) Interested operators identified, registered and assigned by 2011
Primary separation of solid waster targeted at 20% by 2013
Input/Activity
i) Publish the prescribed standards and levels of service and circulate to all private sector
participants by 2011
ii) Identify, publish and distribute required targeted services in environmentally sensitive
areas such as water course and wetlands by 2011
Identify, organise and agree with private operators the modalities for participating in
service delivery
2 Create jobs in response to
4Rs and MINT
Impact
Increased livelihoods from “green” collar jobs
Outcome
Increase in number of generators (e.g. households, offices, restaurants etc) practicing source
separation of MINT
Reduction in waste volumes for landfilling
Output
(i) Enterprises established annually
(ii) MRFs established per district
(iii) Green collar jobs created annually
Input/Activity
(i) Analyse value chains for job creation opportunities
(ii) Promote establishment of potential enterprises within the value chains
6
National Environmental Sanitation Strategy and Action Plan (NESSAP) 2010 - 2015 - 138 -
Annexes
Annex 1: Data Tables Table A1: Locality Characteristics – Environmental Sanitation Services (TBD – separate document containing community-by-community, area council and district profiles) Table A2: Population of Districts (submitted by RPCUs and Regional Statisticians) Annex 2 Analysis of NESSAP Targets and Minimum ISIOs for Services (to be issued as separate document)
6
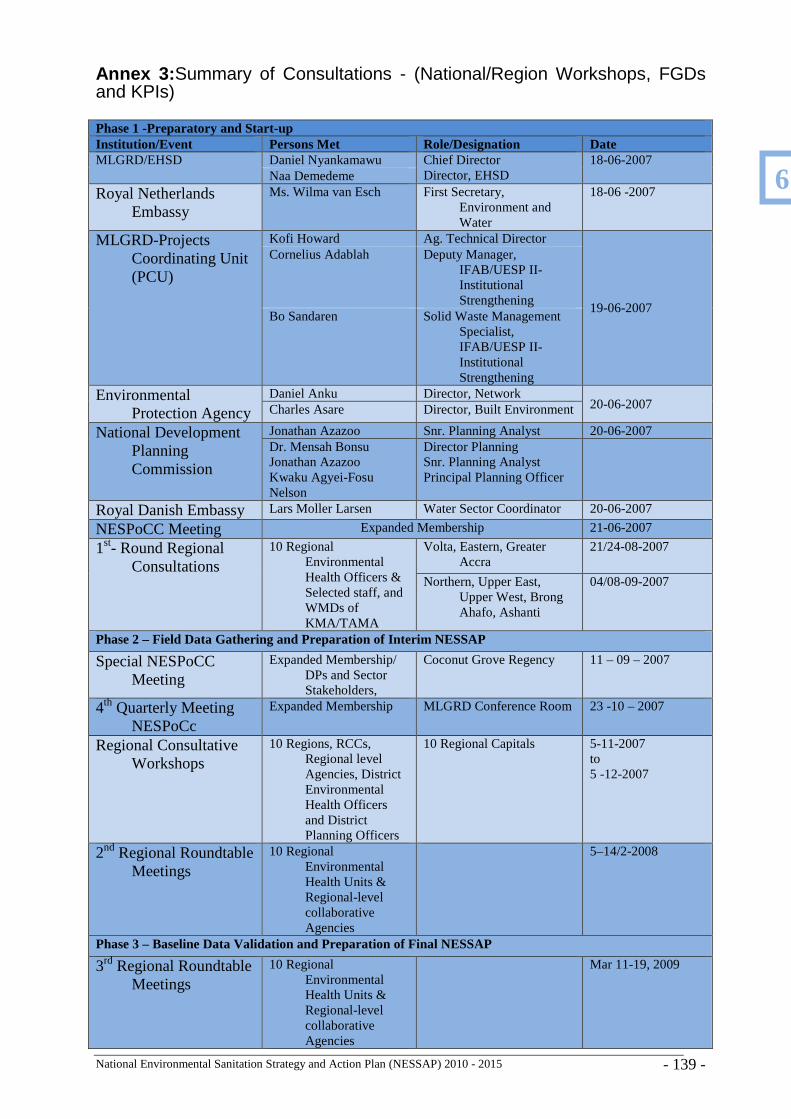
National Environmental Sanitation Strategy and Action Plan (NESSAP) 2010 - 2015 - 139 -
Annex 3: Summary of Consultations - (National/Region Workshops, FGDs and KPIs) Phase 1 -Preparatory and Start-up Institution/Event Persons Met Role/Designation Date MLGRD/EHSD Daniel Nyankamawu Chief Director
Director, EHSD 18-06-2007
Naa Demedeme Royal Netherlands
Embassy Ms. Wilma van Esch First Secretary,
Environment and Water
18-06 -2007
MLGRD-Projects Coordinating Unit (PCU)
Kofi Howard Ag. Technical Director
19-06-2007
Cornelius Adablah Deputy Manager, IFAB/UESP II-Institutional Strengthening
Bo Sandaren Solid Waste Management Specialist, IFAB/UESP II-Institutional Strengthening
Environmental Protection Agency
Daniel Anku Director, Network 20-06-2007 Charles Asare Director, Built Environment
National Development Planning Commission
Jonathan Azazoo Snr. Planning Analyst 20-06-2007 Dr. Mensah Bonsu Jonathan Azazoo Kwaku Agyei-Fosu Nelson
Director Planning Snr. Planning Analyst Principal Planning Officer
Royal Danish Embassy Lars Moller Larsen Water Sector Coordinator 20-06-2007
NESPoCC Meeting Expanded Membership 21-06-2007
1st- Round Regional Consultations
10 Regional Environmental Health Officers & Selected staff, and WMDs of KMA/TAMA
Volta, Eastern, Greater Accra
21/24-08-2007
Northern, Upper East, Upper West, Brong Ahafo, Ashanti
04/08-09-2007
Phase 2 – Field Data Gathering and Preparation of Interim NESSAP
Special NESPoCC Meeting
Expanded Membership/ DPs and Sector Stakeholders,
Coconut Grove Regency 11 – 09 – 2007
4th Quarterly Meeting NESPoCc
Expanded Membership MLGRD Conference Room 23 -10 – 2007
Regional Consultative Workshops
10 Regions, RCCs, Regional level Agencies, District Environmental Health Officers and District Planning Officers
10 Regional Capitals 5-11-2007 to 5 -12-2007
2nd Regional Roundtable Meetings
10 Regional Environmental Health Units & Regional-level collaborative Agencies
5–14/2-2008
Phase 3 – Baseline Data Validation and Preparation of Final NESSAP
3rd Regional Roundtable Meetings
10 Regional Environmental Health Units & Regional-level collaborative Agencies
Mar 11-19, 2009
6

National Environmental Sanitation Strategy and Action Plan (NESSAP) 2010 - 2015 - 140 -
Regional Validation Workshops
10 Regions, RCCs, Regional level Agencies, District Environmental Health Officers and District Planning Officers
10 Regional Capitals 25-03-2009 to 24 -04-2009
Internal Progress Review Meetings
EHSD & WasteCare Staff, Sector Advisor & External Consultants
Afia Hotel/WasteCare Trade Fair
12-15 Aug. 2009; 28 Sept -7th Oct.
2009;
Quarterly Meeting NESPoCc
Expanded Membership MLGRD Conference Room Nov. 10, 2009
Quarterly Meeting NESPoCc
Expanded Membership Coconut Grove regency Apr 8, 2010
6
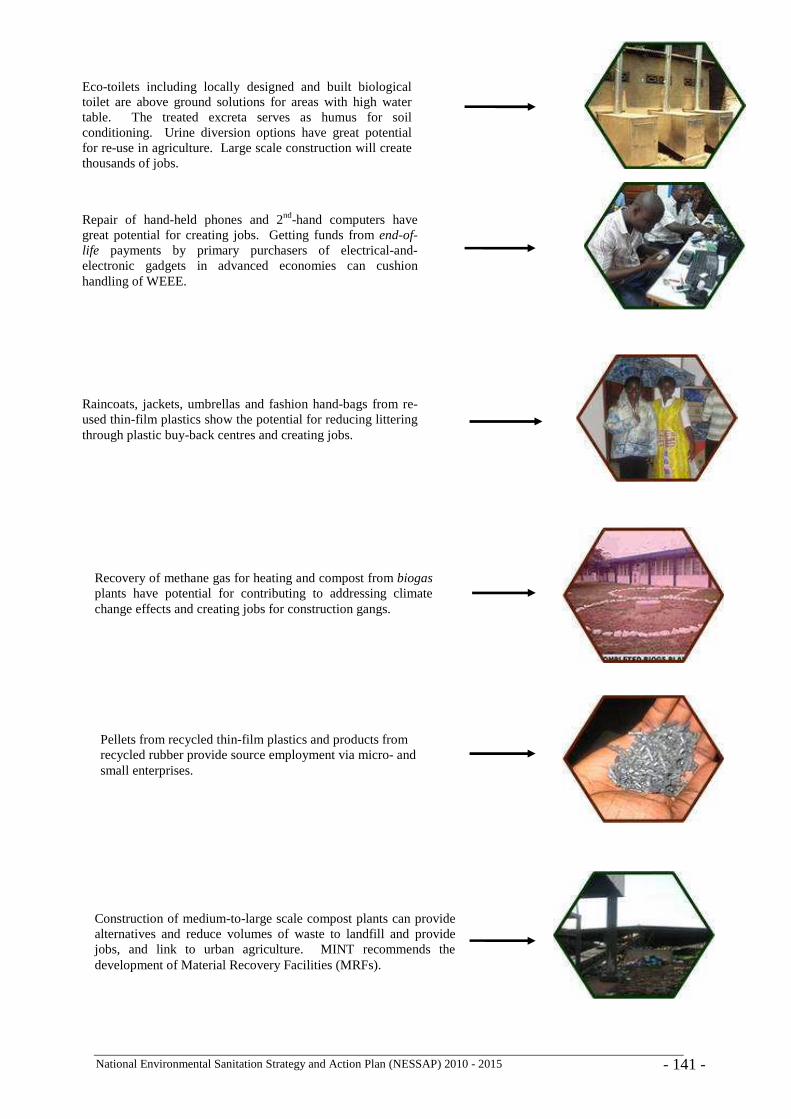
National Environmental Sanitation Strategy and Action Plan (NESSAP) 2010 - 2015 - 141 -
Eco-toilets including locally designed and built biological toilet are above ground solutions for areas with high water table. The treated excreta serves as humus for soil conditioning. Urine diversion options have great potential for re-use in agriculture. Large scale construction will create thousands of jobs.
Repair of hand-held phones and 2nd-hand computers have great potential for creating jobs. Getting funds from end-of-life payments by primary purchasers of electrical-and-electronic gadgets in advanced economies can cushion handling of WEEE.
Raincoats, jackets, umbrellas and fashion hand-bags from re-used thin-film plastics show the potential for reducing littering through plastic buy-back centres and creating jobs.
Recovery of methane gas for heating and compost from biogas plants have potential for contributing to addressing climate change effects and creating jobs for construction gangs.
Pellets from recycled thin-film plastics and products from recycled rubber provide source employment via micro- and small enterprises.
Construction of medium-to-large scale compost plants can provide alternatives and reduce volumes of waste to landfill and provide jobs, and link to urban agriculture. MINT recommends the development of Material Recovery Facilities (MRFs).
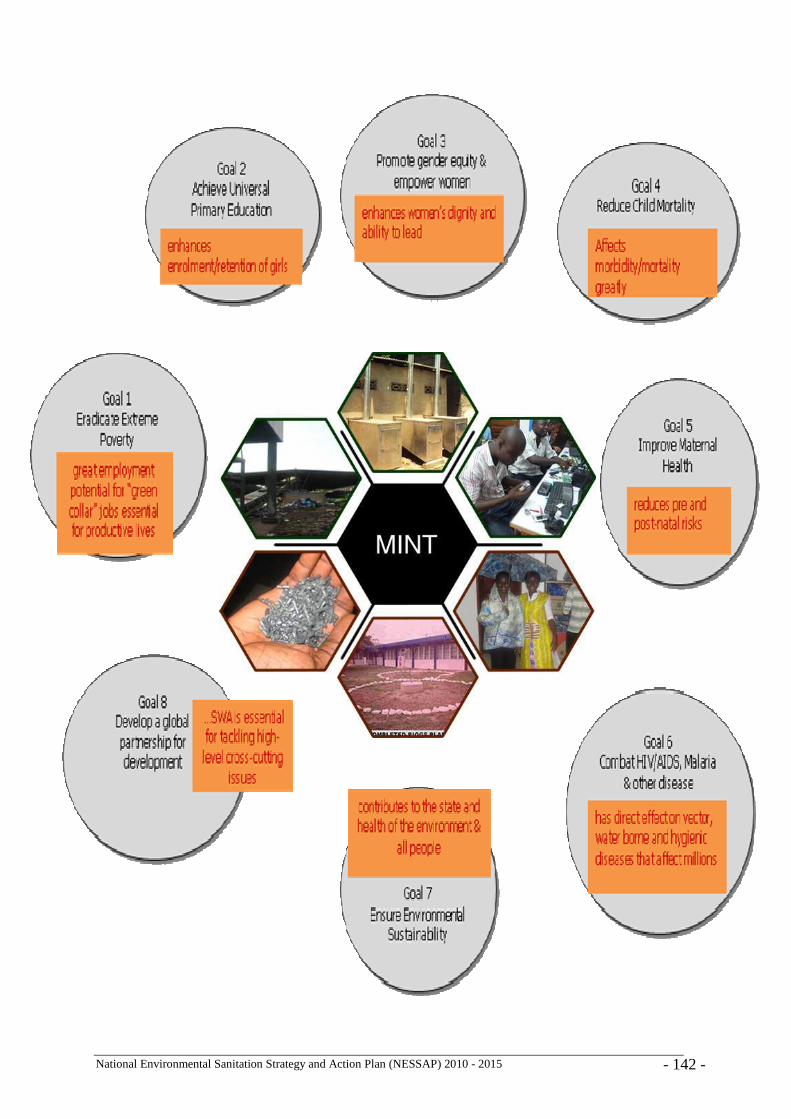
National Environmental Sanitation Strategy and Action Plan (NESSAP) 2010 - 2015 - 142 -