Embed Size (px)
Citation preview
Department of Civil Engineering Sydney NSW 2006 AUSTRALIA http://www.civil.usyd.edu.au/ Environmental Fluids/Wind Group
A New Design Method for Wave-Induced Pipeline Stability on a Sandy Seabed Research Report No R860 Fuping Gao, BE ME PhD Dong-Sheng Jeng, BE ME PhD December 2005 ISSN 1833-2781
Department of Civil Engineering Environmental Fluids/Wind Group
http://www.civil.usyd.edu.au/
A New Design Method for Wave-Induced Pipeline Stability on a Sandy Seabed
Research Report No R860
Fuping Gao, BE ME PhD
Dong-Sheng Jeng, BE ME PhD
December 2005 Abstract: The existing DnV Recommended Practice (RP E305) for pipeline on-bottom stability is mainly based on the Pipe-Soil Interaction Model proposed by Wagner et al. (1987) and the Wake Model by Lambrakos et al. (1987) to calculate the soil resistance and the hydrodynamic forces upon pipeline, respectively. Unlike the methods in the DnV Practice, in this paper, an improved analysis method is proposed for the on-bottom stability of a submarine pipeline, which is based on the relationships between and for various restraint conditions obtained by the hydrodynamic loading experiments, taking into account the coupling effects between wave, pipeline and sandy seabed. The analysis procedure is illustrated with a detailed flow chart. A comparison is made between the submerged weights of pipeline predicted with the DnV Practice and those with the new method. The proposed analysis method may provide a helpful tool for the engineering practice of pipeline on-bottom stability design. Keywords: Submarine pipeline; Analysis method; On-bottom stability; Sandy seabed; Wave-pipe-soil coupling effect.
A New Design Method for Wave-Induced Pipeline Stability on a Sandy Seabed December 2005
Department of Civil Engineering Research Report No R860
2
Copyright Notice Department of Civil Engineering, Research Report R859 A New Design Method for Wave-Induced Pipeline Stability on a Sandy Seabed © 2005 Fuping Gao and Dong-Sheng Jeng [email protected] ISSN 1833-2781 This publication may be redistributed freely in its entirety and in its original form without the consent of the copyright owner. Use of material contained in this publication in any other published works must be appropriately referenced, and, if necessary, permission sought from the author. Published by: Department of Civil Engineering The University of Sydney Sydney NSW 2006 AUSTRALIA December 2005 This report and other Research Reports published by The Department of Civil Engineering are available on the Internet: http://www.civil.usyd.edu.au
A New Design Method for Wave-Induced Pipeline Stability on a Sandy Seabed December 2005
Department of Civil Engineering Research Report No R860
3
Contents
1. Introduction.......................................................................................................4
2. Physical Modeling for Wave-Induced Pipeline Instability...............................6
2.1 Experimental facilities and instruments......................................................8
2.2. Froude Modelling.....................................................................................10
2.3. Testing materials ......................................................................................12
2.3.1 Soils....................................................................................................12
2.3.2 Pipelines .............................................................................................12
2.4 Testing procedures ....................................................................................14
2.5 Experiment results ....................................................................................14
2.5.1 Pipeline Instability process ................................................................14
2.5.2. Criterion for pipeline on-bottom instability......................................17
2.5.3. Effects of loading history..................................................................20
2.6 Comparison with previous experiments ...................................................23
2.6.1 Calculation of the wave-induced forces upon pipeline with Wake II
model ................................................................................................24
2.6.2. Comparison with ‘pipe-soil’ interaction experiments ......................27
3. New Design Method .......................................................................................29
3.1 Existing design models .............................................................................29
3.2 Physical Phenomena of Pipeline Losing On-Bottom Instability ..............32
3.3 New Criteria for Pipeline On-Bottom Instability .....................................33
3.4 Procedure for Analysis of Wave-Induced Pipeline On-Bottom Stability 37
3.5 Comparison with DnV Recommended Practice .......................................40
4. Concluding Remarks.......................................................................................44
References ...........................................................................................................46
Appendix: Wake II Model ..................................................................................49
A New Design Method for Wave-Induced Pipeline Stability on a Sandy Seabed December 2005
Department of Civil Engineering Research Report No R860
4
1. Introduction
Submarine pipelines are a convenient means to transport natural oil or gas from offshore oil
wells to an onshore location. One of the main problems encountered with the use of the
pipeline is the wave-induced instability (Herbich, 1985). Under the wave loading, there
exists a balance between wave forces, submerged weight of pipelines and soil resistance. To
avoid swept sideways, the pipeline ought to be given a heavy enough concrete coating, or it
has to be anchored or trenched. However, both designs are expensive and complicated.
Thus, a better understanding of the wave-induced pipeline stability is important for pipeline
design.
In the past decades, with the increasing demand for submarine pipelines to transport
natural oil and gas, many researchers had focused particularly on solving wave-induced
pipeline instability problems (Wagner et al., 1987; Brennodden et al., 1989; Allen et al.,
1989; Foda et al., 1990). However, this problem has not been fully understood because of the
complicated soil behavior and geometry of pipelines (Lawlor and Flynn, 1991). Numerous
experimental studies on the lateral stability of un-trenched pipelines have been carried out
with cyclic actuator loading methods since the 1980’s (Wagner et al., 1987; Brennodden et
al., 1989; Allen et al., 1989). Among these, Wagner et al. (1987) improved the Coulomb
friction theory into an empirical pipe-soil interaction model, in which the total lateral
resistance was assumed to be the sum of the Coulomb friction component and the soil passive
resistance component. Brennoden et al. (1989) further proposed an energy-based pipe-soil
interaction model, in which the soil passive resistance component is related to the work done
by pipe during its movement. It has been reported that remarkable cost benefits can be
achieved by reduction of designed weight of pipe, when considering the soil passive
resistance (Allen et al., 1989). The aforementioned studies indicated that the traditional
design method based on the Coulomb friction theory was too conservative. However, in the
above experimental investigations, the wave loads were not modeled with hydrodynamic
methods but exerted with mechanical actuators, and no water was filled in the tank.
Therefore, the wave-induced sand scour around the pipeline could not be modeled properly.
The wave-induced oscillatory flow around the pipeline does not only affect the pipeline but
also the seabed. In general, the on-bottom stability of the submarine pipeline is the problem
of interaction between wave, soil and pipe, rather than only the pipe-soil interaction under
cyclic loading as considered in the previous works.
A New Design Method for Wave-Induced Pipeline Stability on a Sandy Seabed December 2005
Department of Civil Engineering Research Report No R860
5
Numerous hydrodynamic experiments have been conducted to investigate scour under
fixed pipelines in the past (Foda et al., 1990; Stansby and Starr, 1992). For example, Stansby
and Starr (1992) studied the wave-induced settlement of pipeline. Nevertheless, the
horizontal movements were not allowed in their experiments. Thus, the phenomena of on-
bottom stability could not be really reflected. On the other hand, Foda et al. (1990) examined
the vertical stability of half-buried pipe with wave flume, which no scour was observed in
their experiments. Since the flow characteristics around half-buried pipeline is different from
that around un-trenched pipeline. In fact, from the aspect of wave-pipe-soil interaction, the
breakout of un-trenched pipeline is more complicated than that of half-buried one. To date,
no experimental data regarding the lateral stability of un-trenched pipeline is yet available.
This study consists of two components. First, a series of physical modeling for the
wave-induced pipeline instability is conducted. The onset of pipe breakout is examined. A
simple numerical model is employed to provide parametric study. Second, a new design
method for wave-induced pipeline stability is proposed, which will provide costal engineers a
guideline.
A New Design Method for Wave-Induced Pipeline Stability on a Sandy Seabed December 2005
Department of Civil Engineering Research Report No R860
6
2. Physical Modeling for Wave-Induced Pipeline
Instability
The interaction between ocean waves, submarine pipeline and seabed has attracted more and
more attention over the past few decades. Coulomb friction theory was employed to estimate
the friction force between pipeline and soil, under the action of ocean waves before the
1970’s. Actually, Coulomb friction theory is far from the realistic wave-induced pipe-soil
interaction. Lyons (1973) experimentally explored the wave-induced stability of untrenched
pipeline, and concluded that the Coulomb friction theory was not suitable to describe the
wave-induced interaction between pipeline and soil, especially when adhesive clay is
involved. This is because that the lateral friction between pipeline and soil should be the
function of properties of soil, pipe and wave.
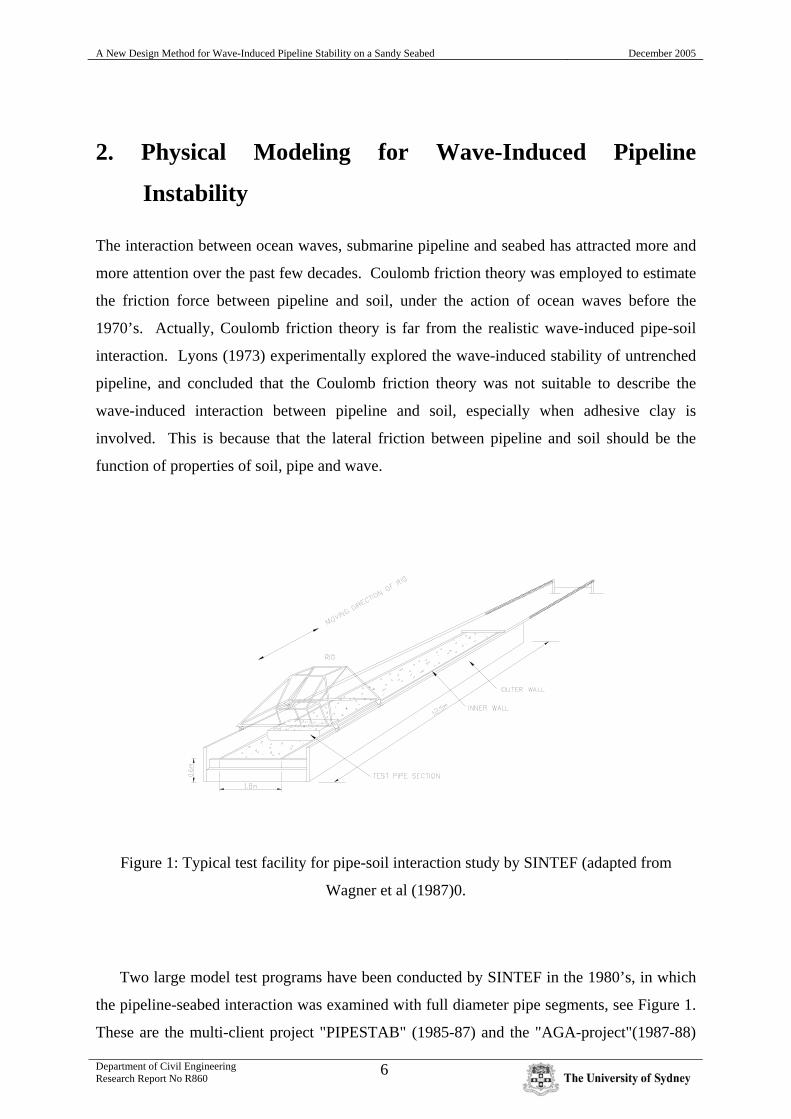
Figure 1: Typical test facility for pipe-soil interaction study by SINTEF (adapted from
Wagner et al (1987)0.
Two large model test programs have been conducted by SINTEF in the 1980’s, in which
the pipeline-seabed interaction was examined with full diameter pipe segments, see Figure 1.
These are the multi-client project "PIPESTAB" (1985-87) and the "AGA-project"(1987-88)
A New Design Method for Wave-Induced Pipeline Stability on a Sandy Seabed December 2005
Department of Civil Engineering Research Report No R860
7
(Allen, 1989; Brennodden et al., 1986; Wagner et al., 1987; Brennodden et al., 1989). A
considerable experience was gained, including an empirical Pipe-Soil Interaction Model and
an Energy Based Pipe-Soil Interaction Model proposed respectively by Wagner et al (1989)
and Brennoden et al. (1989), respectively. In both models, the total lateral resistance HF , was
assumed as the sum of sliding resistance component FF and soil passive resistance
component RF , i.e.
RFH FFF += (1)
where
( )LsF FWF −= μ (2)
in which, μ is the sliding resistance coefficient, sW is the pipeline submerged weight per
meter, LF is the wave-induced lift force upon pipeline. The difference between two models
is the methods for calculating the soil resistance component. In the former model (the
Empirical Pipe-Soil Interaction Model, Wagner et al., 1989),
TR AF 'βγ= , (3)
in which β is an empirical coefficient, 'γ is the soil buoyant weight, TA is half of the contact
area between pipeline and soil. However, in the latter model (Energy Based Pipe-Soil
Interaction, Brennoden et al., 1989), RF is relative to the work done by pipe during its
movement. These experimental results and the models deduced from the results form an
important basis for today’s regulations regarding pipeline stability design (Det norsk Veritas,
1988).
In the above experiments, the cyclic loadings are exerted with mechanical actuators to
simulate the real wave-induced forces upon pipeline, see Figure 1. Moreover, the pressure
upon seabed could not be simulated in their experiments. These pressure fluctuations further
induce the variations in effective stresses and pore water pressure within non-cohesive marine
sediments. They are different from the actual hydrodynamic wave situations. In reality, the
hydrodynamic forces act on not only pipeline but also seabed, and the response of seabed to
the hydrodynamic forces can directly affect the pipeline stability. Therefore, precisely
speaking, the wave induced on-bottom stability of the submarine pipeline involves the
interaction of wave, soil and pipe, not only pipe/soil interaction. Additionally, in the above
A New Design Method for Wave-Induced Pipeline Stability on a Sandy Seabed December 2005
Department of Civil Engineering Research Report No R860
8
Pipe-Soil Interaction Models (Wagner et al., 1989; Brennoden et al., 1989), numerous
empirical coefficients have no implicit physical meanings and are difficult to be determined
in design procedure. To date, it seems that the underlying physical mechanism is not yet well
understood, as stated by Hale et al. (1991).
Regarding the interaction between waves, pipes and sandy seabeds, many investigations
have been conducted in the study on sand scouring near pipelines (Sumer et al., 1991; Chiew,
1990; Mao, 1988). In the aforementioned experimental approaches, the pipeline were
installed at the fixed condition, thus, the pipeline instability were not involved.
2.1 Experimental facilities and instruments
Under the wave action, the water particles oscillate elliptically at upper water level with
certain frequency. But due to the boundary effect, the particles near the sea bottom mainly
oscillate horizontally, which directly affect the pipeline stability. To simulate the oscillating
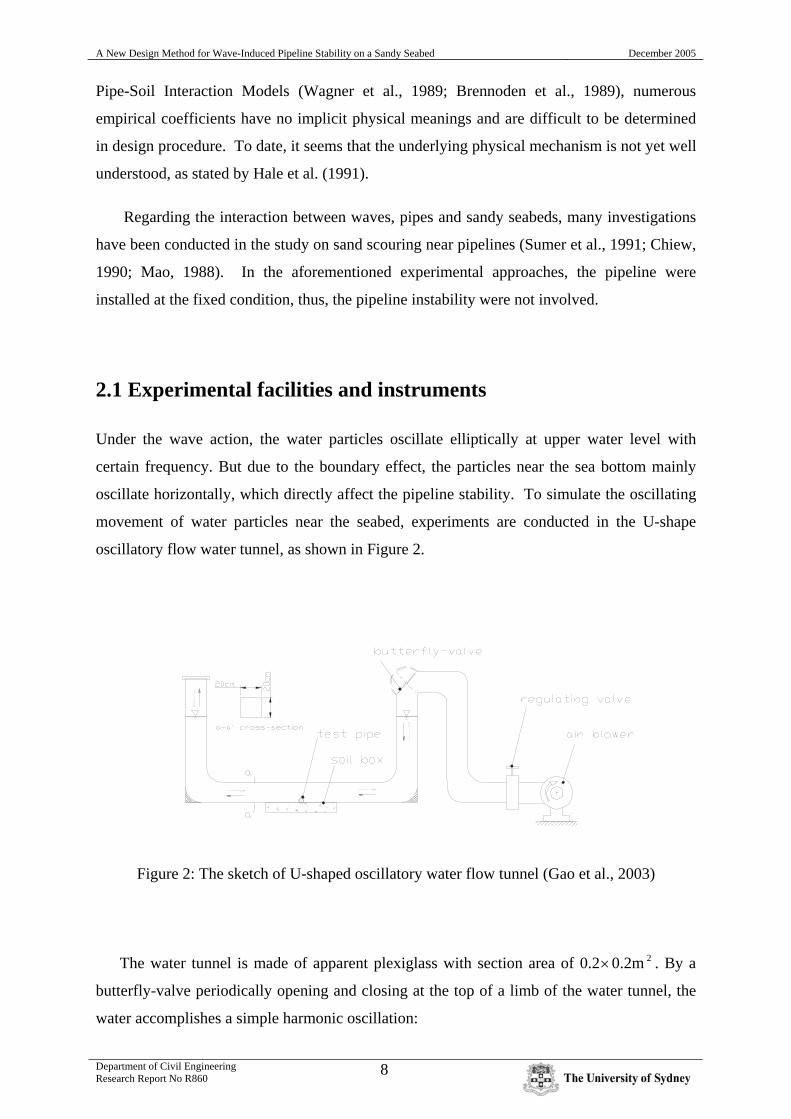
movement of water particles near the seabed, experiments are conducted in the U-shape
oscillatory flow water tunnel, as shown in Figure 2.
Figure 2: The sketch of U-shaped oscillatory water flow tunnel (Gao et al., 2003)
The water tunnel is made of apparent plexiglass with section area of 0.2×0.2m 2 . By a
butterfly-valve periodically opening and closing at the top of a limb of the water tunnel, the
water accomplishes a simple harmonic oscillation:
A New Design Method for Wave-Induced Pipeline Stability on a Sandy Seabed December 2005
Department of Civil Engineering Research Report No R860
9
ttAA ωsin)(0= , (4)
in which )(0 tA is the amplitude of oscillatory flow ;ω is the angle velocity of oscillatory
flow, i.e. Tπω 2
= , T is the period of oscillatory flow, T=2.60(s); t is loading time. By
regulating valve, the effective air flux from air blower can be changed. Thus, the amplitude
can be varied continuously within 5-200mm.
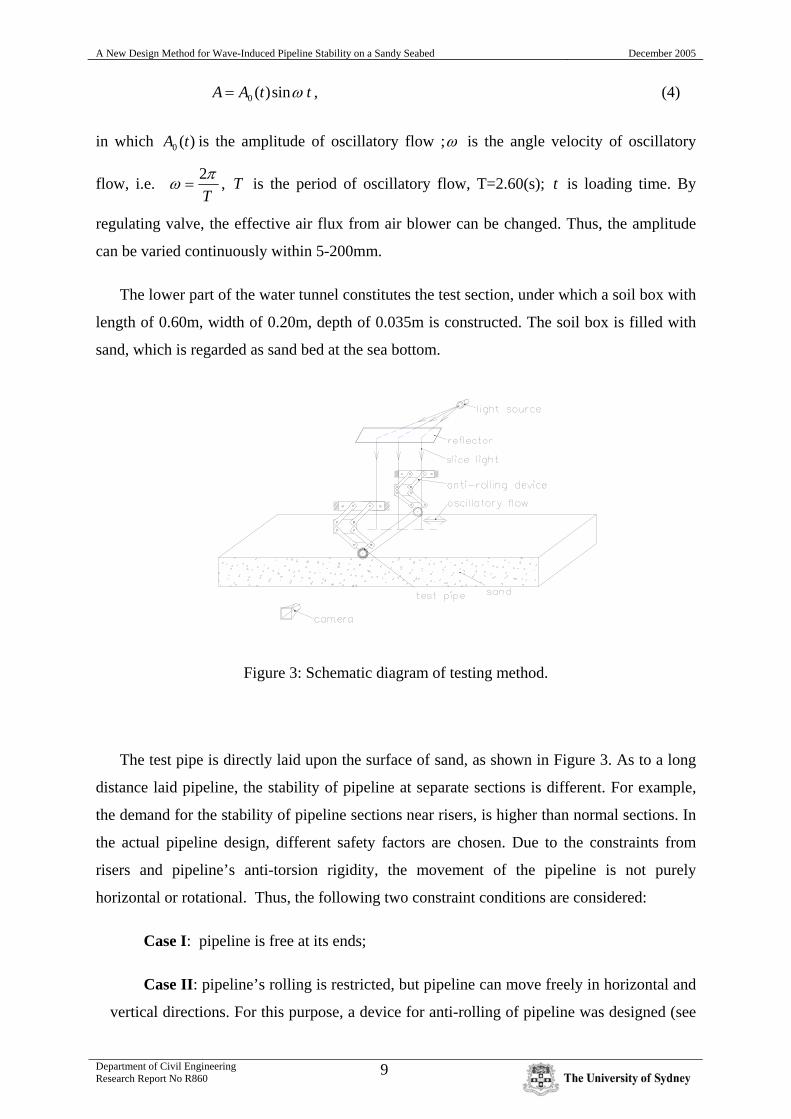
The lower part of the water tunnel constitutes the test section, under which a soil box with
length of 0.60m, width of 0.20m, depth of 0.035m is constructed. The soil box is filled with
sand, which is regarded as sand bed at the sea bottom.
Figure 3: Schematic diagram of testing method.
The test pipe is directly laid upon the surface of sand, as shown in Figure 3. As to a long
distance laid pipeline, the stability of pipeline at separate sections is different. For example,
the demand for the stability of pipeline sections near risers, is higher than normal sections. In
the actual pipeline design, different safety factors are chosen. Due to the constraints from
risers and pipeline’s anti-torsion rigidity, the movement of the pipeline is not purely
horizontal or rotational. Thus, the following two constraint conditions are considered:
Case I: pipeline is free at its ends;
Case II: pipeline’s rolling is restricted, but pipeline can move freely in horizontal and
vertical directions. For this purpose, a device for anti-rolling of pipeline was designed (see
A New Design Method for Wave-Induced Pipeline Stability on a Sandy Seabed December 2005
Department of Civil Engineering Research Report No R860
10
Figure3). The anti-rolling device is made of thin plexiglass plate and mini bearings. It
includes two parts, which are installed at the two ends of pipeline separately.
To detect the onset of sand scouring, sand scour visualization was carried out under the
sliced light by a video camera. Meanwhile, the instability process of the pipe was also
observed and recorded by the video camera, as shown in Figure 3.
2.2. Froude Modelling
Development and testing of offshore pipeline model is of great importance because of the
difficulty of obtaining data from prototypes. However, care must be taken to make sure that
the model simulates the behavior of the prototype as accurately as possible.
In the study of wave-pipeline interaction problem, three non-dimensional numbers
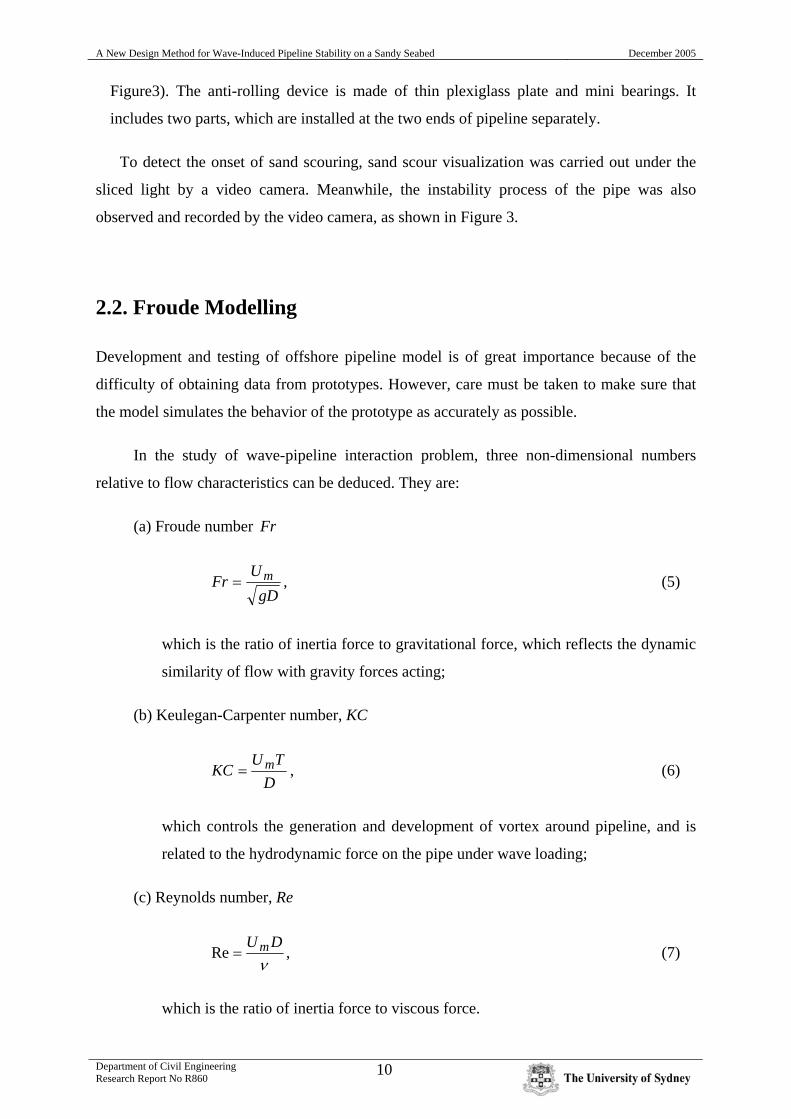
relative to flow characteristics can be deduced. They are:
(a) Froude number Fr
gD
UFr m= , (5)
which is the ratio of inertia force to gravitational force, which reflects the dynamic
similarity of flow with gravity forces acting;
(b) Keulegan-Carpenter number, KC
D
TUKC m= , (6)
which controls the generation and development of vortex around pipeline, and is
related to the hydrodynamic force on the pipe under wave loading;
(c) Reynolds number, Re
ν
DU m=Re , (7)
which is the ratio of inertia force to viscous force.
A New Design Method for Wave-Induced Pipeline Stability on a Sandy Seabed December 2005
Department of Civil Engineering Research Report No R860
11
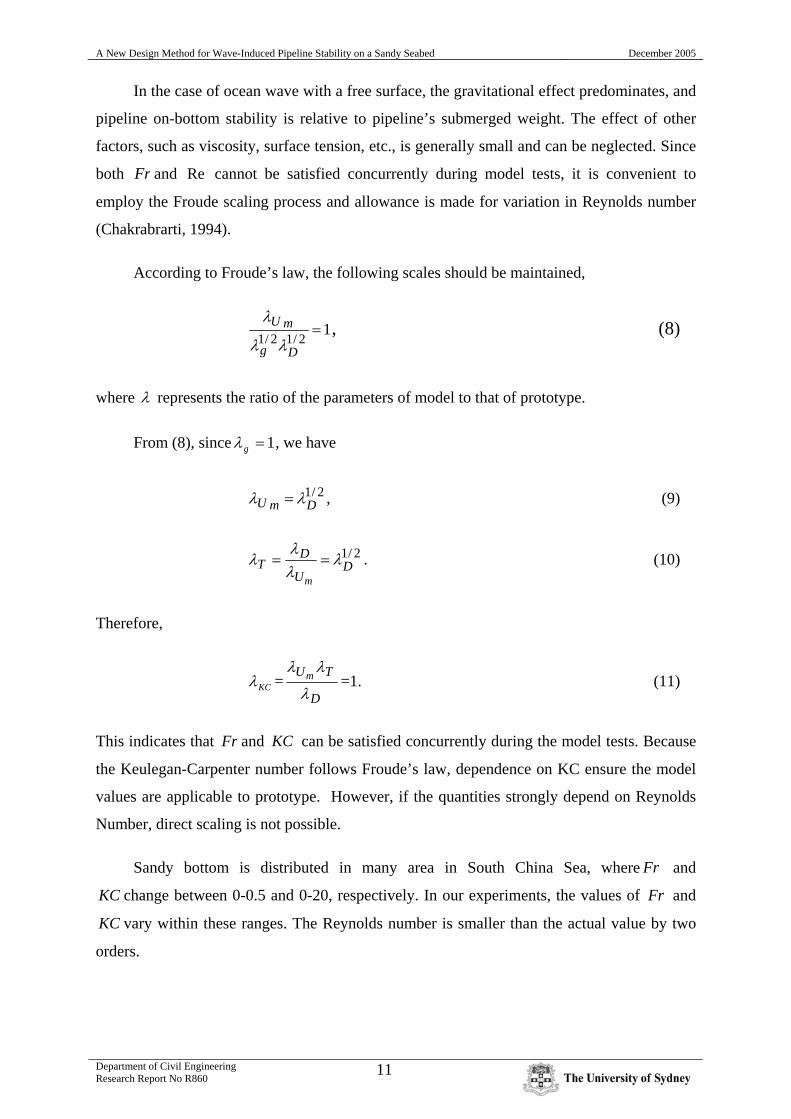
In the case of ocean wave with a free surface, the gravitational effect predominates, and
pipeline on-bottom stability is relative to pipeline’s submerged weight. The effect of other
factors, such as viscosity, surface tension, etc., is generally small and can be neglected. Since
both Fr and Re cannot be satisfied concurrently during model tests, it is convenient to
employ the Froude scaling process and allowance is made for variation in Reynolds number
(Chakrabrarti, 1994).
According to Froude’s law, the following scales should be maintained,
12/12/1
=Dg
mU
λλ
λ, (8)
where λ represents the ratio of the parameters of model to that of prototype.
From (8), since 1=gλ , we have
2/1DmU λλ = , (9)
2/1D
U
DT
m
λλλ
λ == . (10)
Therefore,
KCλ =D
TUm
λ
λλ=1. (11)
This indicates that Fr and KC can be satisfied concurrently during the model tests. Because
the Keulegan-Carpenter number follows Froude’s law, dependence on KC ensure the model
values are applicable to prototype. However, if the quantities strongly depend on Reynolds
Number, direct scaling is not possible.
Sandy bottom is distributed in many area in South China Sea, where Fr and
KC change between 0-0.5 and 0-20, respectively. In our experiments, the values of Fr and
KC vary within these ranges. The Reynolds number is smaller than the actual value by two
orders.
A New Design Method for Wave-Induced Pipeline Stability on a Sandy Seabed December 2005
Department of Civil Engineering Research Report No R860
12
2.3. Testing materials
2.3.1 Soils
Because of the proximity of the pipeline to the seafloor, the modeling of soil
characteristic of the foundation may be important. The sand beds consist of medium sand
and fine sand. The index properties of the sands are shown in Table 1. The moist sand is first
saturated, then packed in the soil box under water, and finally trimmed with a scraper. The
difference of the unit weights for different tests is controlled within the error of 5‰.
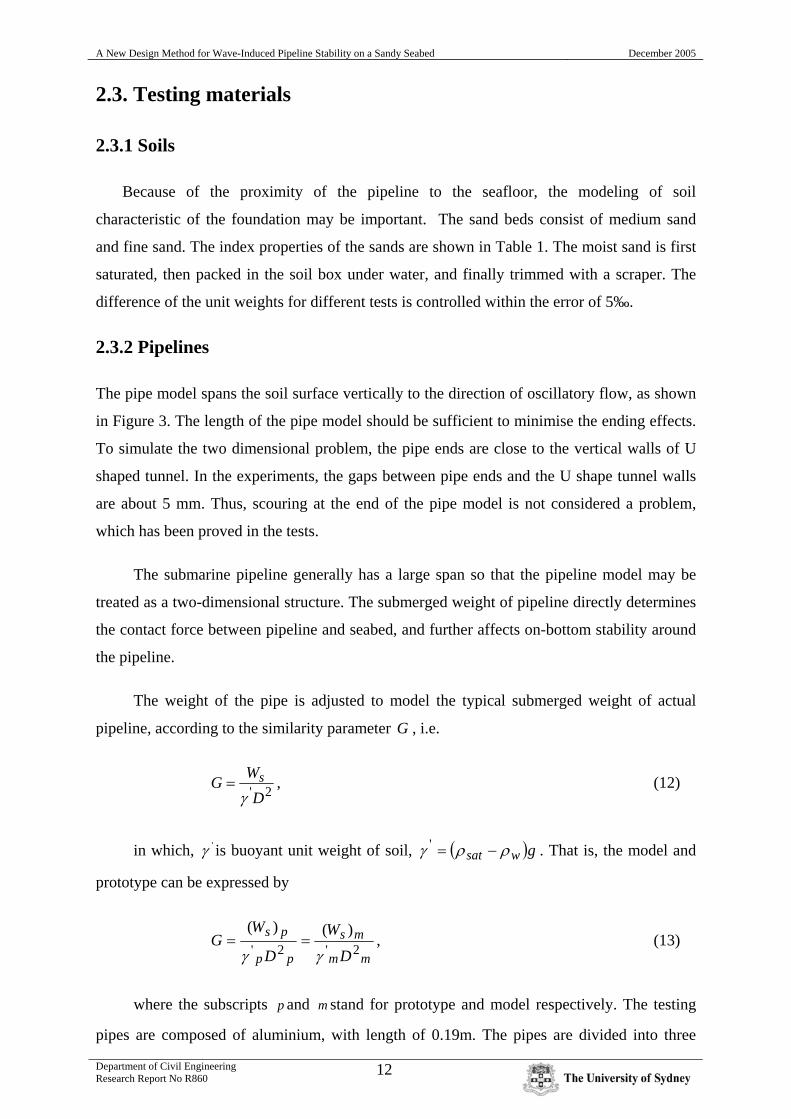
2.3.2 Pipelines
The pipe model spans the soil surface vertically to the direction of oscillatory flow, as shown
in Figure 3. The length of the pipe model should be sufficient to minimise the ending effects.
To simulate the two dimensional problem, the pipe ends are close to the vertical walls of U
shaped tunnel. In the experiments, the gaps between pipe ends and the U shape tunnel walls
are about 5 mm. Thus, scouring at the end of the pipe model is not considered a problem,
which has been proved in the tests.
The submarine pipeline generally has a large span so that the pipeline model may be
treated as a two-dimensional structure. The submerged weight of pipeline directly determines
the contact force between pipeline and seabed, and further affects on-bottom stability around
the pipeline.
The weight of the pipe is adjusted to model the typical submerged weight of actual
pipeline, according to the similarity parameter G , i.e.
2'DWG s
γ= , (12)
in which, 'γ is buoyant unit weight of soil, ( )gwsat ρργ −=' . That is, the model and
prototype can be expressed by
mm
ms
pp
ps
D
W
D
WG 2'2'
)()(
γγ== , (13)
where the subscripts p and m stand for prototype and model respectively. The testing
pipes are composed of aluminium, with length of 0.19m. The pipes are divided into three
A New Design Method for Wave-Induced Pipeline Stability on a Sandy Seabed December 2005
Department of Civil Engineering Research Report No R860
13
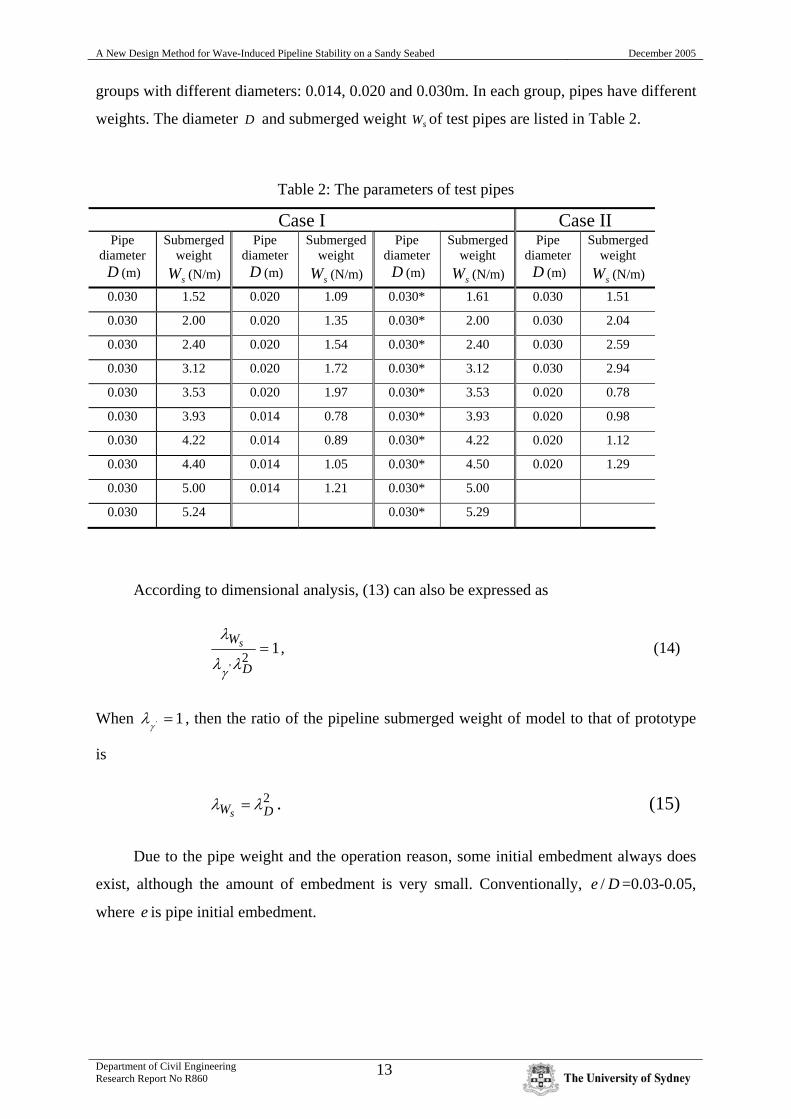
groups with different diameters: 0.014, 0.020 and 0.030m. In each group, pipes have different
weights. The diameter D and submerged weight sW of test pipes are listed in Table 2.
Table 2: The parameters of test pipes
Case I Case II Pipe
diameter D (m)
Submerged weight
sW (N/m)
Pipe diameter D (m)
Submerged weight
sW (N/m)
Pipe diameter D (m)
Submerged weight
sW (N/m)
Pipe diameter D (m)
Submerged weight
sW (N/m)
0.030 1.52 0.020 1.09 0.030* 1.61 0.030 1.51
0.030 2.00 0.020 1.35 0.030* 2.00 0.030 2.04
0.030 2.40 0.020 1.54 0.030* 2.40 0.030 2.59
0.030 3.12 0.020 1.72 0.030* 3.12 0.030 2.94
0.030 3.53 0.020 1.97 0.030* 3.53 0.020 0.78
0.030 3.93 0.014 0.78 0.030* 3.93 0.020 0.98
0.030 4.22 0.014 0.89 0.030* 4.22 0.020 1.12
0.030 4.40 0.014 1.05 0.030* 4.50 0.020 1.29
0.030 5.00 0.014 1.21 0.030* 5.00 0.030 5.24 0.030* 5.29
According to dimensional analysis, (13) can also be expressed as
12
'
=D
Ws
λλ
λ
γ
, (14)
When 1' =γ
λ , then the ratio of the pipeline submerged weight of model to that of prototype
is
2DWs
λλ = . (15)
Due to the pipe weight and the operation reason, some initial embedment always does
exist, although the amount of embedment is very small. Conventionally, De / =0.03-0.05,
where e is pipe initial embedment.
A New Design Method for Wave-Induced Pipeline Stability on a Sandy Seabed December 2005
Department of Civil Engineering Research Report No R860
14
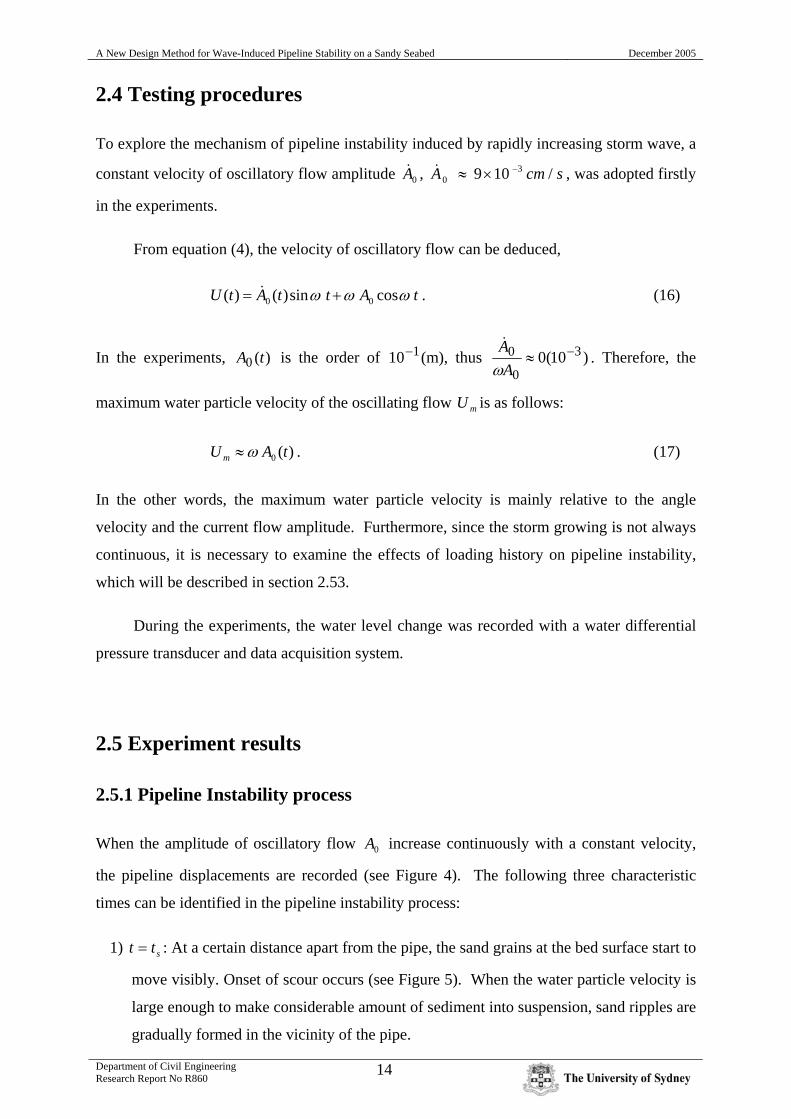
2.4 Testing procedures
To explore the mechanism of pipeline instability induced by rapidly increasing storm wave, a
constant velocity of oscillatory flow amplitude 0A& , scmA /109 30
−×≈& , was adopted firstly
in the experiments.
From equation (4), the velocity of oscillatory flow can be deduced,
tAttAtU ωωω cossin)()( 00 += & . (16)
In the experiments, )(0 tA is the order of 110− (m), thus )10(0 3
0
0 −≈A
Aω
&. Therefore, the
maximum water particle velocity of the oscillating flow mU is as follows:
)(0 tAU m ω≈ . (17)
In the other words, the maximum water particle velocity is mainly relative to the angle
velocity and the current flow amplitude. Furthermore, since the storm growing is not always
continuous, it is necessary to examine the effects of loading history on pipeline instability,
which will be described in section 2.53.
During the experiments, the water level change was recorded with a water differential
pressure transducer and data acquisition system.
2.5 Experiment results
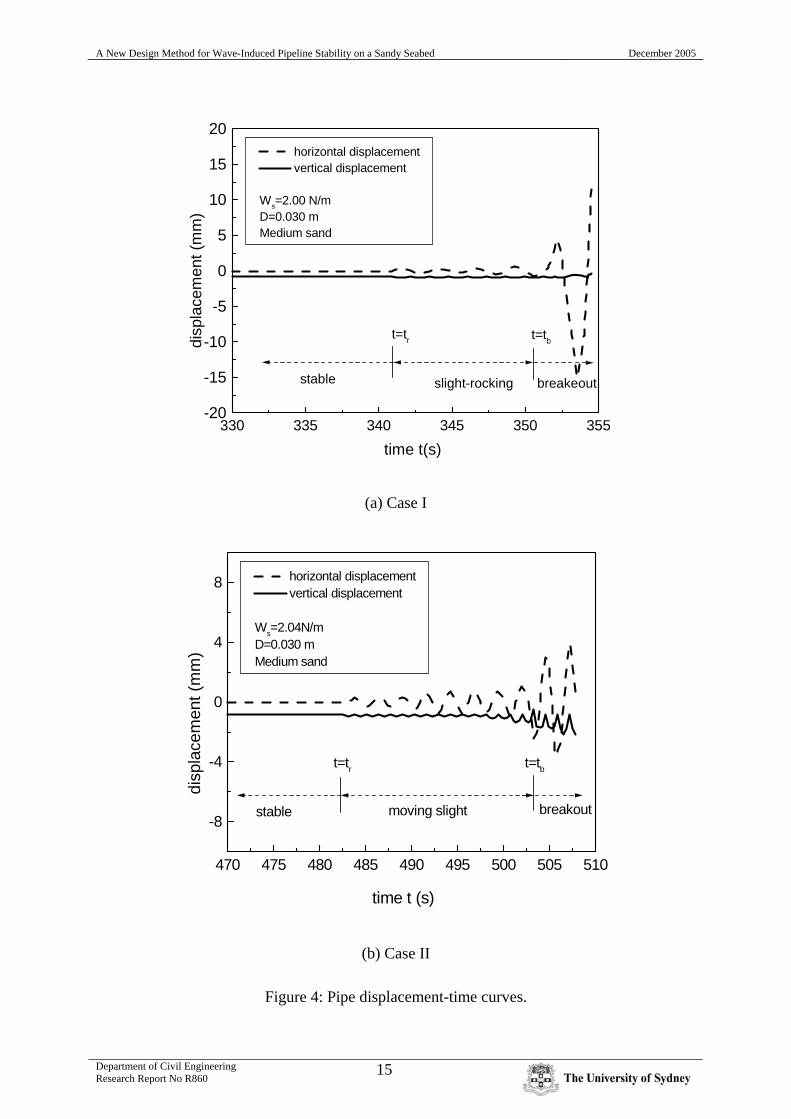
2.5.1 Pipeline Instability process
When the amplitude of oscillatory flow 0A increase continuously with a constant velocity,
the pipeline displacements are recorded (see Figure 4). The following three characteristic
times can be identified in the pipeline instability process:
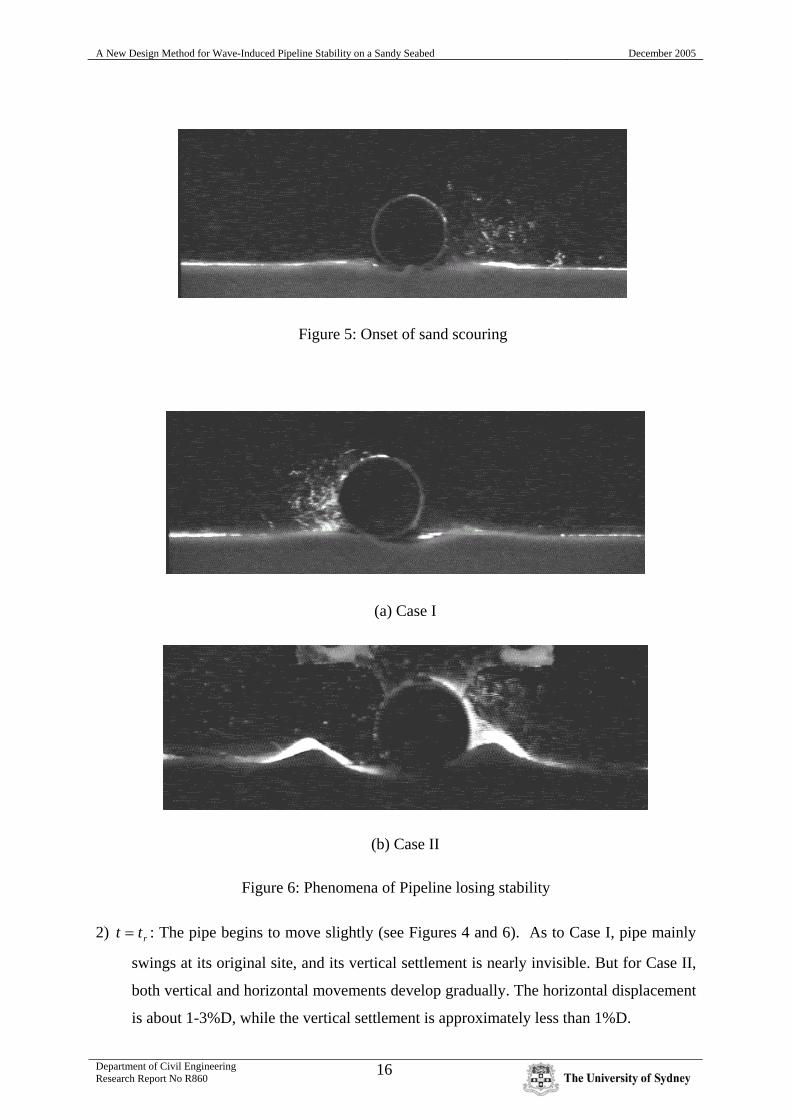
1) stt = : At a certain distance apart from the pipe, the sand grains at the bed surface start to
move visibly. Onset of scour occurs (see Figure 5). When the water particle velocity is
large enough to make considerable amount of sediment into suspension, sand ripples are
gradually formed in the vicinity of the pipe.
A New Design Method for Wave-Induced Pipeline Stability on a Sandy Seabed December 2005
Department of Civil Engineering Research Report No R860
15
330 335 340 345 350 355-20
-15
-10
-5
0
5
10
15
20
t=tbt=tr
breakeoutslight-rockingstable
horizontal displacement vertical displacement
Ws=2.00 N/mD=0.030 mMedium sand
disp
lace
men
t (m
m)
time t(s)
(a) Case I
470 475 480 485 490 495 500 505 510
-8
-4
0
4
8
t=tbt=tr
breakoutmoving slightstable
time t (s)
disp
lace
men
t (m
m)
horizontal displacement vertical displacement
Ws=2.04N/mD=0.030 mMedium sand
(b) Case II
Figure 4: Pipe displacement-time curves.
A New Design Method for Wave-Induced Pipeline Stability on a Sandy Seabed December 2005
Department of Civil Engineering Research Report No R860
16
Figure 5: Onset of sand scouring
(a) Case I
(b) Case II
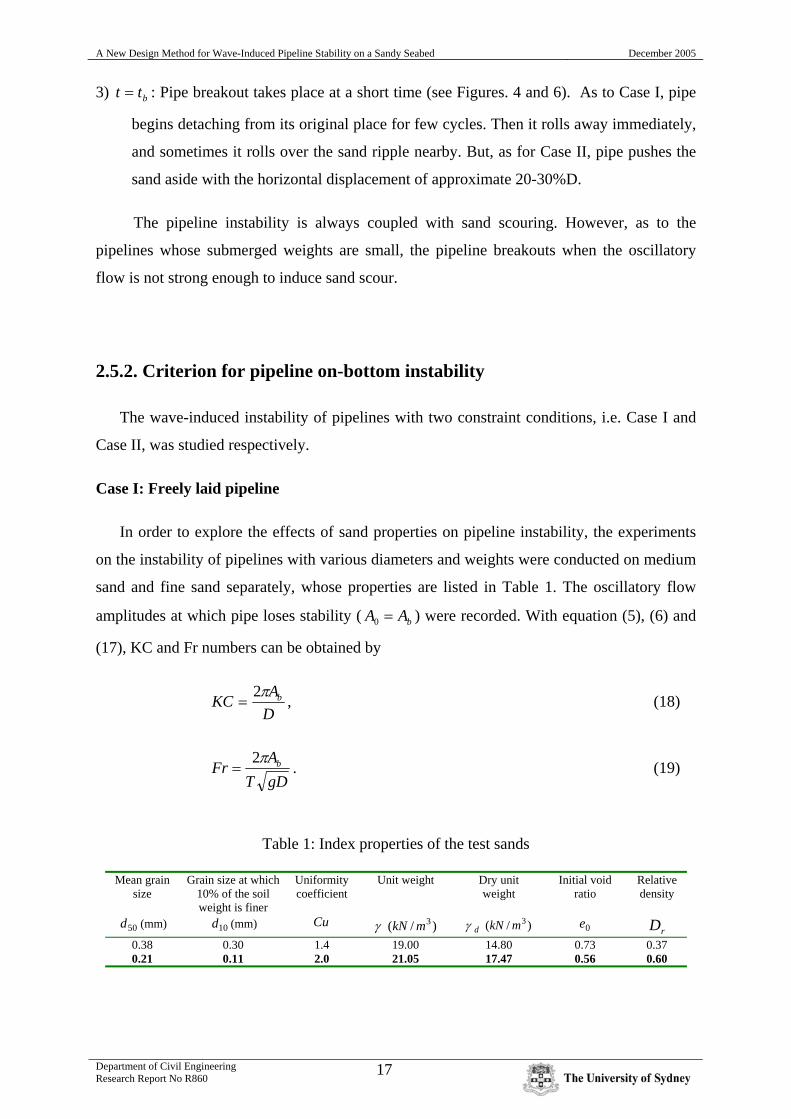
Figure 6: Phenomena of Pipeline losing stability
2) rtt = : The pipe begins to move slightly (see Figures 4 and 6). As to Case I, pipe mainly
swings at its original site, and its vertical settlement is nearly invisible. But for Case II,
both vertical and horizontal movements develop gradually. The horizontal displacement
is about 1-3%D, while the vertical settlement is approximately less than 1%D.
A New Design Method for Wave-Induced Pipeline Stability on a Sandy Seabed December 2005
Department of Civil Engineering Research Report No R860
17
3) btt = : Pipe breakout takes place at a short time (see Figures. 4 and 6). As to Case I, pipe
begins detaching from its original place for few cycles. Then it rolls away immediately,
and sometimes it rolls over the sand ripple nearby. But, as for Case II, pipe pushes the
sand aside with the horizontal displacement of approximate 20-30%D.
The pipeline instability is always coupled with sand scouring. However, as to the
pipelines whose submerged weights are small, the pipeline breakouts when the oscillatory
flow is not strong enough to induce sand scour.
2.5.2. Criterion for pipeline on-bottom instability
The wave-induced instability of pipelines with two constraint conditions, i.e. Case I and
Case II, was studied respectively.
Case I: Freely laid pipeline
In order to explore the effects of sand properties on pipeline instability, the experiments
on the instability of pipelines with various diameters and weights were conducted on medium
sand and fine sand separately, whose properties are listed in Table 1. The oscillatory flow
amplitudes at which pipe loses stability ( bAA =0 ) were recorded. With equation (5), (6) and
(17), KC and Fr numbers can be obtained by
DAKC bπ2
= , (18)
gDTAFr bπ2
= . (19)
Table 1: Index properties of the test sands
Mean grain
size
50d (mm)
Grain size at which 10% of the soil weight is finer
10d (mm)
Uniformity coefficient
Cu
Unit weight
)/( 3mkNγ
Dry unit weight
)/( 3mkNdγ
Initial void ratio
0e
Relative density
rD 0.38 0.30 1.4 19.00 14.80 0.73 0.37 0.21 0.11 2.0 21.05 17.47 0.56 0.60
A New Design Method for Wave-Induced Pipeline Stability on a Sandy Seabed December 2005
Department of Civil Engineering Research Report No R860
18
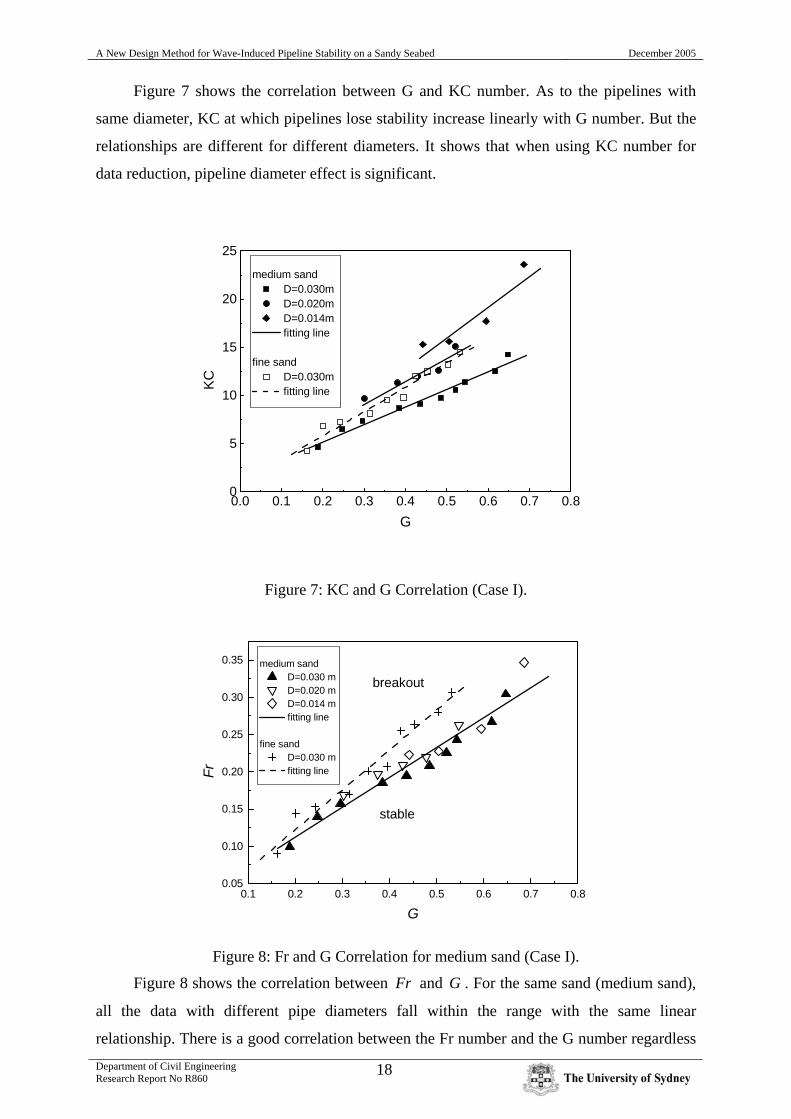
Figure 7 shows the correlation between G and KC number. As to the pipelines with
same diameter, KC at which pipelines lose stability increase linearly with G number. But the
relationships are different for different diameters. It shows that when using KC number for
data reduction, pipeline diameter effect is significant.
0.0 0.1 0.2 0.3 0.4 0.5 0.6 0.7 0.80
5
10
15
20
25
medium sand D=0.030m D=0.020m D=0.014m fitting line
fine sand D=0.030m fitting line
KC
G
Figure 7: KC and G Correlation (Case I).
0.1 0.2 0.3 0.4 0.5 0.6 0.7 0.80.05
0.10
0.15
0.20
0.25
0.30
0.35
breakout
stable
medium sand D=0.030 m D=0.020 m D=0.014 m fitting line
fine sand D=0.030 m fitting line Fr
G
Figure 8: Fr and G Correlation for medium sand (Case I).
Figure 8 shows the correlation between Fr and G . For the same sand (medium sand),
all the data with different pipe diameters fall within the range with the same linear
relationship. There is a good correlation between the Fr number and the G number regardless
A New Design Method for Wave-Induced Pipeline Stability on a Sandy Seabed December 2005
Department of Civil Engineering Research Report No R860
19
of the pipeline diameter. It matches with the point of Chakrabarti (1994) and Poorooshasb
(1990), which indicates the importance of Fr in case of water-structure-soil interaction.
However, there exists some deference between the results for medium sand and fine
sand, as shown in Figures 7 and 8. That is, the sand characteristics influence pipeline
stability.
Case II: Anti-rolling pipeline
With the designed anti-rolling device (Figure 3), experiments were conducted on medium
sand for pipelines with different diameters, i.e. D=0.030m, 0.020m, as well as different
submerged weight. As the experiments on pipelines freely laid, the oscillatory flow amplitude
also rises at the same speed 0A& .
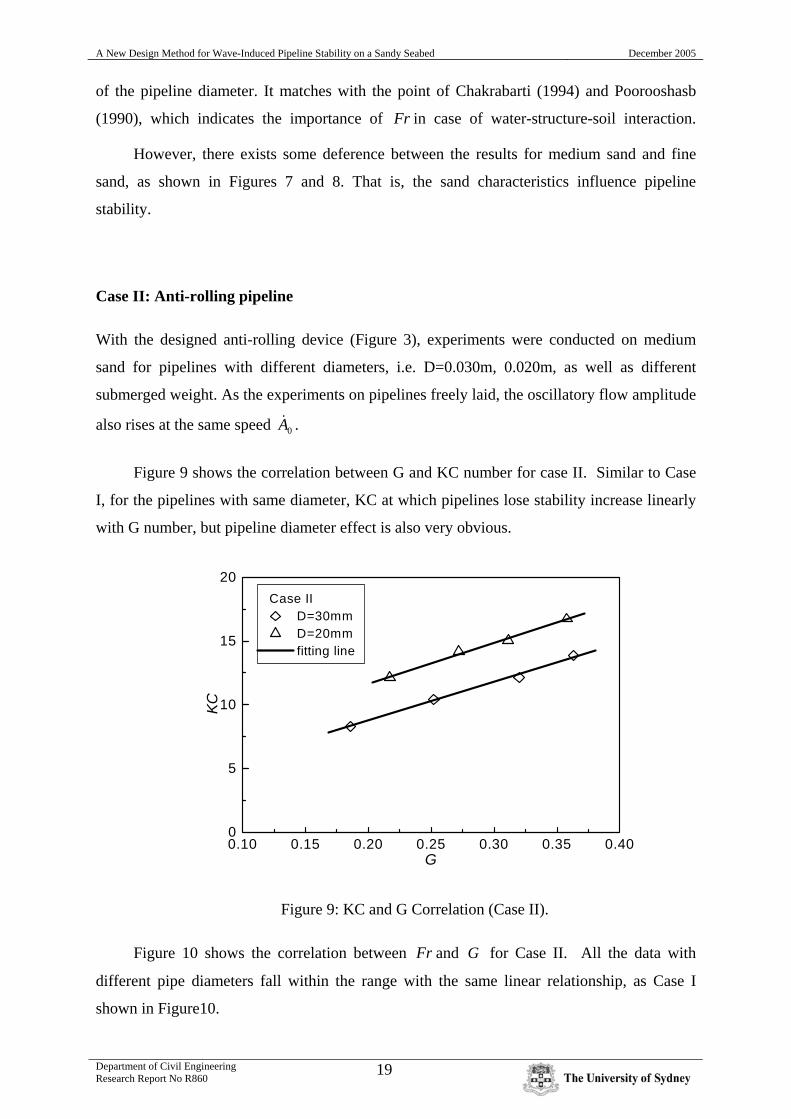
Figure 9 shows the correlation between G and KC number for case II. Similar to Case
I, for the pipelines with same diameter, KC at which pipelines lose stability increase linearly
with G number, but pipeline diameter effect is also very obvious.
0.10 0.15 0.20 0.25 0.30 0.35 0.400
5
10
15
20 Case II
D=30mm D=20mm fitting line
KC
G
Figure 9: KC and G Correlation (Case II).
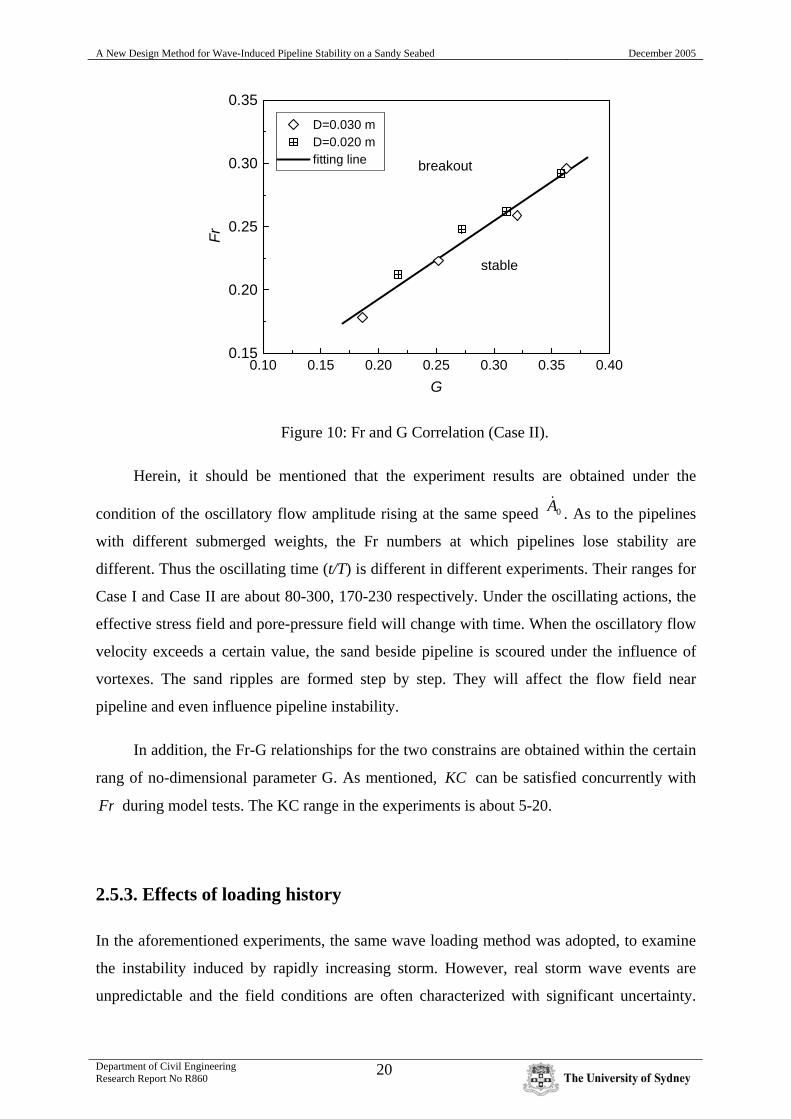
Figure 10 shows the correlation between Fr and G for Case II. All the data with
different pipe diameters fall within the range with the same linear relationship, as Case I
shown in Figure10.
A New Design Method for Wave-Induced Pipeline Stability on a Sandy Seabed December 2005
Department of Civil Engineering Research Report No R860
20
0.10 0.15 0.20 0.25 0.30 0.35 0.400.15
0.20
0.25
0.30
0.35
breakout
stable
D=0.030 m D=0.020 m fitting line
Fr
G
Figure 10: Fr and G Correlation (Case II).
Herein, it should be mentioned that the experiment results are obtained under the
condition of the oscillatory flow amplitude rising at the same speed 0A& . As to the pipelines
with different submerged weights, the Fr numbers at which pipelines lose stability are
different. Thus the oscillating time (t/T) is different in different experiments. Their ranges for
Case I and Case II are about 80-300, 170-230 respectively. Under the oscillating actions, the
effective stress field and pore-pressure field will change with time. When the oscillatory flow
velocity exceeds a certain value, the sand beside pipeline is scoured under the influence of
vortexes. The sand ripples are formed step by step. They will affect the flow field near
pipeline and even influence pipeline instability.
In addition, the Fr-G relationships for the two constrains are obtained within the certain
rang of no-dimensional parameter G. As mentioned, KC can be satisfied concurrently with
Fr during model tests. The KC range in the experiments is about 5-20.
2.5.3. Effects of loading history
In the aforementioned experiments, the same wave loading method was adopted, to examine
the instability induced by rapidly increasing storm. However, real storm wave events are
unpredictable and the field conditions are often characterized with significant uncertainty.
A New Design Method for Wave-Induced Pipeline Stability on a Sandy Seabed December 2005
Department of Civil Engineering Research Report No R860
21
Thus, it is also very necessary to study the effects of loading history upon the pipeline
instability.
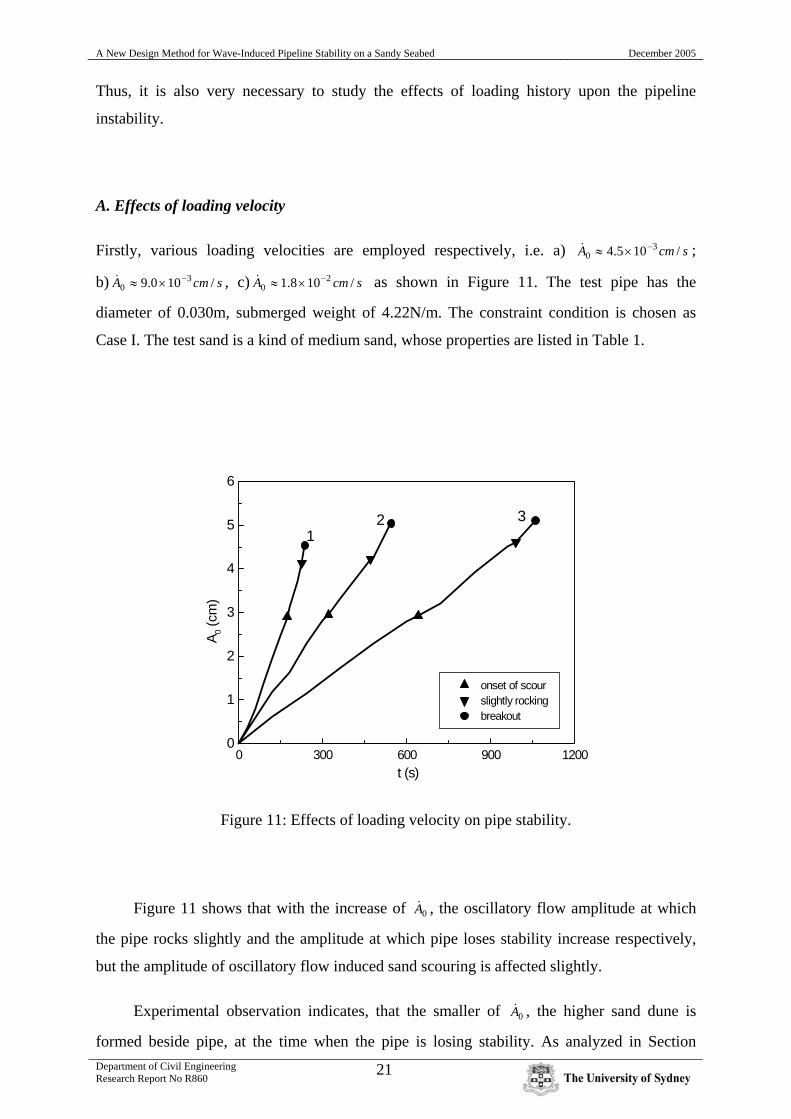
A. Effects of loading velocity
Firstly, various loading velocities are employed respectively, i.e. a) scmA /105.4 30
−×≈& ;
b) scmA /100.9 30
−×≈& , c) scmA /108.1 20
−×≈& as shown in Figure 11. The test pipe has the
diameter of 0.030m, submerged weight of 4.22N/m. The constraint condition is chosen as
Case I. The test sand is a kind of medium sand, whose properties are listed in Table 1.
0 300 600 900 12000
1
2
3
4
5
6
12 3
onset of scour slightly rocking breakout
A 0 (cm
)
t (s)
Figure 11: Effects of loading velocity on pipe stability.
Figure 11 shows that with the increase of 0A& , the oscillatory flow amplitude at which
the pipe rocks slightly and the amplitude at which pipe loses stability increase respectively,
but the amplitude of oscillatory flow induced sand scouring is affected slightly.
Experimental observation indicates, that the smaller of 0A& , the higher sand dune is
formed beside pipe, at the time when the pipe is losing stability. As analyzed in Section
A New Design Method for Wave-Induced Pipeline Stability on a Sandy Seabed December 2005
Department of Civil Engineering Research Report No R860
22
2.3, 0A& << mU , thus the change of 0A is quasi-static at specific value of mU (or 0A ). Various
0A& represents somehow the different oscillating times (t/T) at the vicinity of certain value of
mU . Therefore, the loading velocity (or the oscillating times) affects the sand scouring around
pipe and eventually has influence on the stability of pipe.
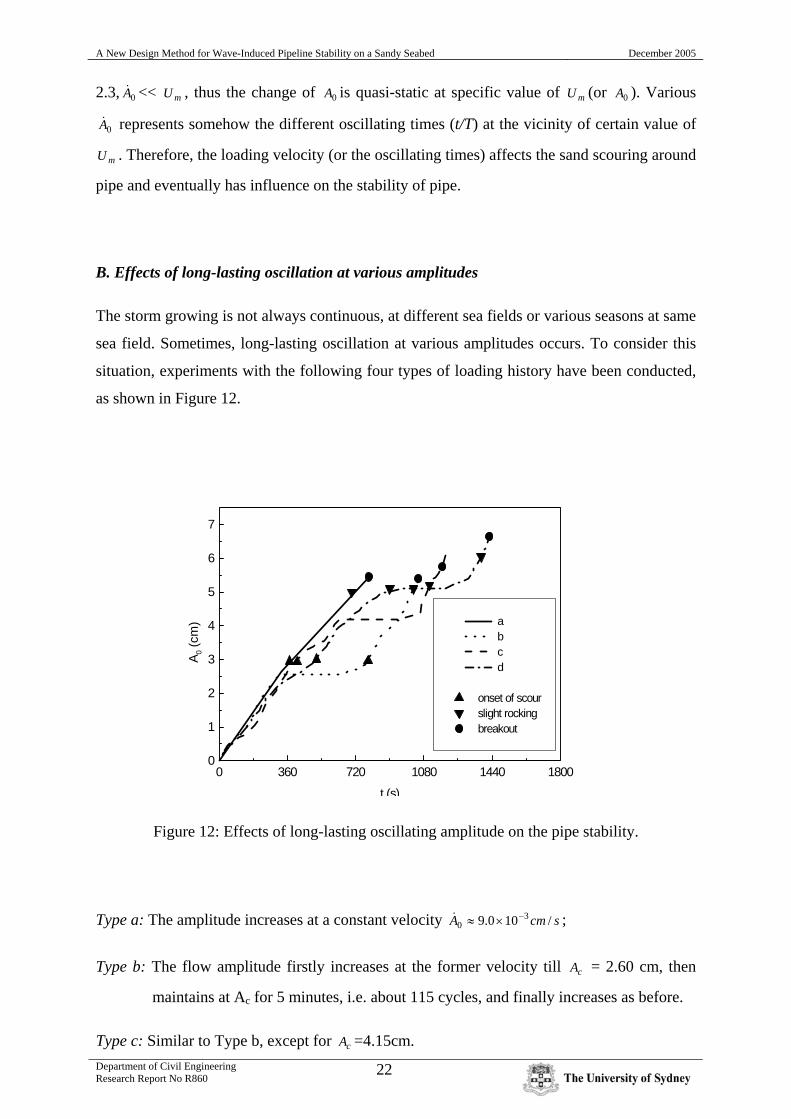
B. Effects of long-lasting oscillation at various amplitudes
The storm growing is not always continuous, at different sea fields or various seasons at same
sea field. Sometimes, long-lasting oscillation at various amplitudes occurs. To consider this
situation, experiments with the following four types of loading history have been conducted,
as shown in Figure 12.
0 360 720 1080 1440 18000
1
2
3
4
5
6
7
a b c d
onset of scour slight rocking breakout
A 0 (cm
)
t (s)
Figure 12: Effects of long-lasting oscillating amplitude on the pipe stability.
Type a: The amplitude increases at a constant velocity scmA /100.9 30
−×≈& ;
Type b: The flow amplitude firstly increases at the former velocity till cA = 2.60 cm, then
maintains at Ac for 5 minutes, i.e. about 115 cycles, and finally increases as before.
Type c: Similar to Type b, except for cA =4.15cm.
A New Design Method for Wave-Induced Pipeline Stability on a Sandy Seabed December 2005
Department of Civil Engineering Research Report No R860
23
Type d: The flow amplitude firstly increases with the former velocity till Ac at which the pipe
rocks slightly, then maintains at Ac 115 cycles, and finally increases as before.
Figure 12 indicates that when long-lasting oscillatory amplitude cA less than that of
onset of scour sA (Type b), it nearly does not have influence on the pipe stability. When
sc AA > (Type c, d), due to the effect of vortex, the sand grains pile up on both sides of the
pipe, thereby the long-lasting oscillation increases the stability of pipeline. Furthermore, the
pipe slight rocking is not always followed by losing stability. If the flow amplitude dose not
rise after pipe begins lightly rocking, the pipe will return to the static condition again and the
more sediment is observed piling beside the pipe (Type d). After the flow amplitude increases
to some higher level, the pipe slightly rocks again, and loses stability at higher flow
amplitude.
All above imply that the wave-induced pipe instability is coupled with the sand
scouring around pipe, and some intermittently growing storm could be beneficial for the pipe
stability.
2.6 Comparison with previous experiments
The above experimental results show that, under the action of rapidly rising wave induced
wave loading, there exist different linear relationships between Fr and G numbers for freely
laid pipelines and anti-rolling pipelines respectively. As to the medium sands, the least square
fitting equations of the data in Figures 8 and 10, can be given as
⎪⎪⎩
⎪⎪⎨
⎧
−<<+
<<+=
pipesrollingantiD
WD
W
pipesdlaifreelyD
WD
W
gDU
ss
ss
m
)36.018.0(62.0069.0
)65.018.0(37.0043.0
2'2'
2'2'
γγ
γγ (20)
The equations give the relationships between water particle velocity, soil properties,
pipe diameter and submerged weight of the pipe. All the parameters involved have obvious
physical meaning. This line can be regarded as the critical line for pipe on-bottom instability.
However, in the previous experiments (Allen, 1989; Brennodden et al., 1986; Wagner et al.,
1987; Brennodden et al., 1989), mechanical actuator was used to simulate the real
hydrodynamic forces upon pipelines. So the pipe-soil interaction models obtained by the
experiments do not include wave parameters (see Eqs. (1), (2) and (3)). In order to compare
A New Design Method for Wave-Induced Pipeline Stability on a Sandy Seabed December 2005
Department of Civil Engineering Research Report No R860
24
with the previous experiment results, the calculation of hydrodynamic forces induced by
waves on pipeline is essential.
2.6.1 Calculation of the wave-induced forces upon pipeline with Wake II
model
Historically, the wave-induced forces upon submarine pipeline used to be calculated with an
adaptation of Morison’s equation for both horizontal and vertical or a lift force taken to be
proportional to the ambient velocity squared. However, it has been recognized that in the
force model, the ambient velocity should be modified under the consideration of wake flow.
Measurements showed that Morison’s equation is lacking in its ability to predict the details in
shape and magnitude of force time history.
Soedigdo et al. (1999) proposed a Wake II model, in which wake velocity correction
was derived based on a closed-form solution to the linearised Navier-Stokes Model for
oscillatory flow and hydrodynamic forces coefficients were determined based on start-up
effects. Wake II model can be used for stability design calculations for pipelines on the
seabed for regular waves without currents for various diameters. Sabag et al. (2000) pointed
out that the Wake II model fitting well with experiment results, and it is a great improvement
on Morison’s equation. The Wake II model is summarised in Appendix.
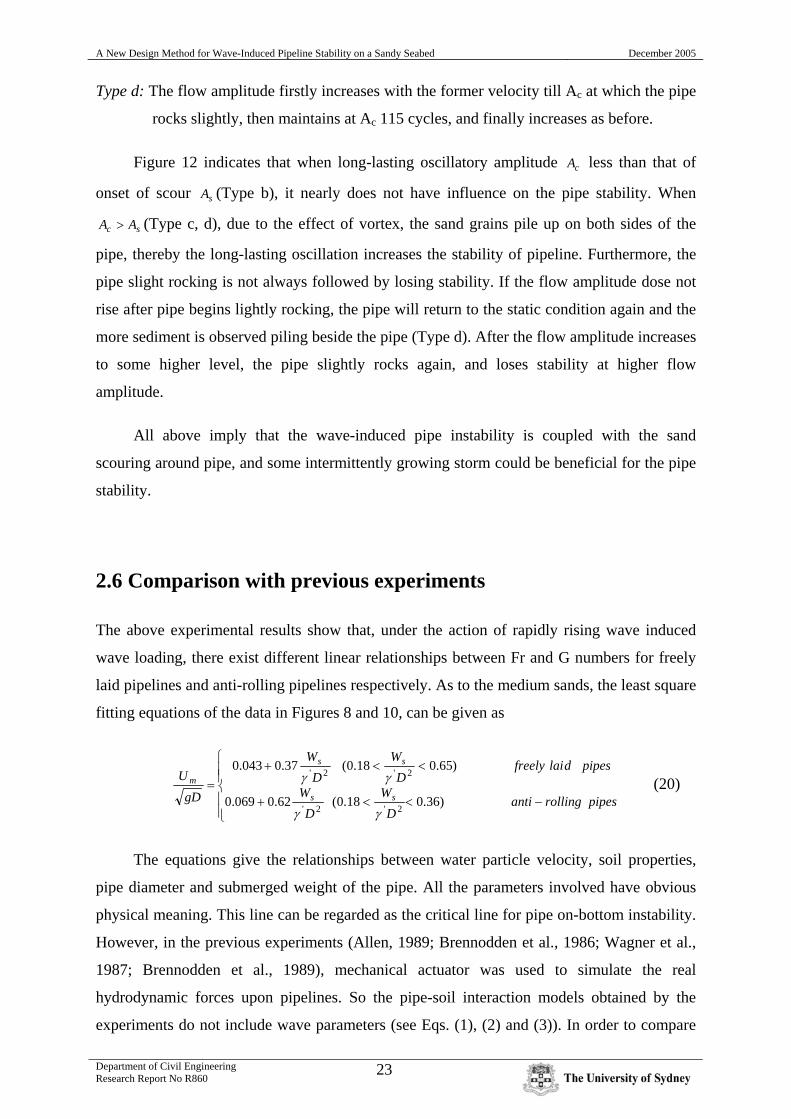
Take the experiment on anti-rolling pipe with sW =2.04 N/m, D=0.030 m as an
example (see Figures 13 and 14). Figure 13 shows the difference between the amplitude of
eU and that of )(tU gets bigger with the increase of free stream velocity. The correction for
wake velocity can significantly increase the effective velocity encountered by pipeline. The
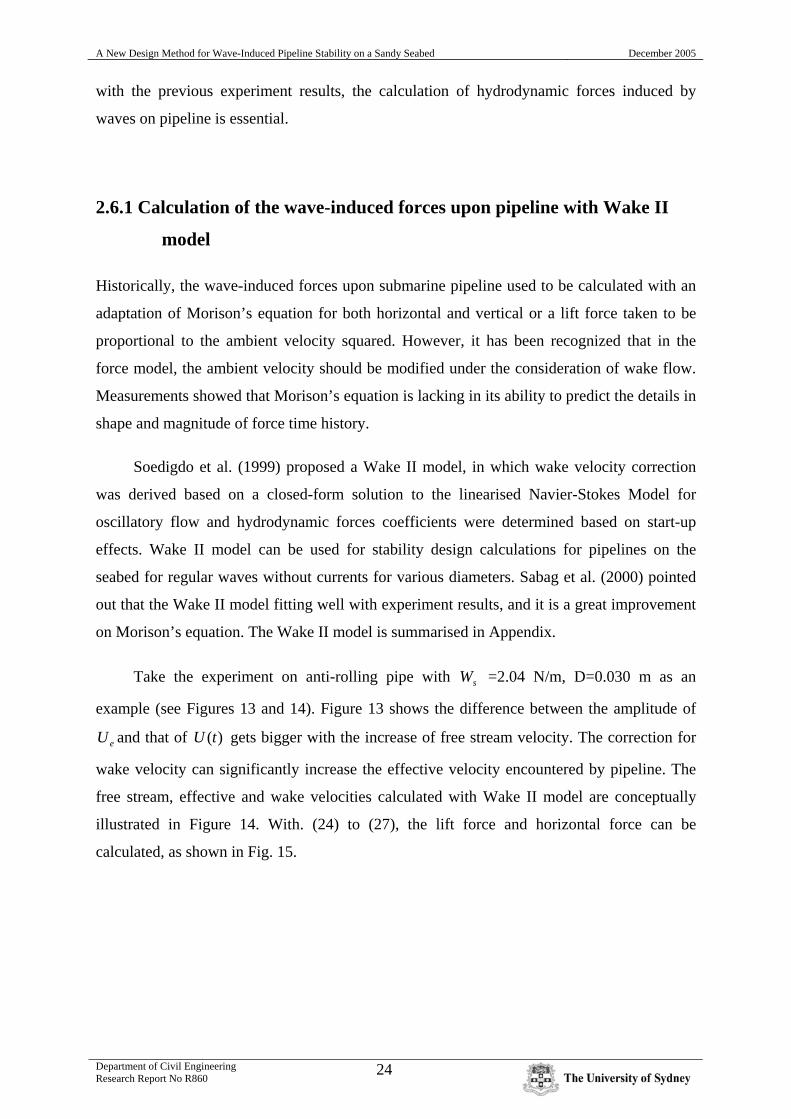
free stream, effective and wake velocities calculated with Wake II model are conceptually
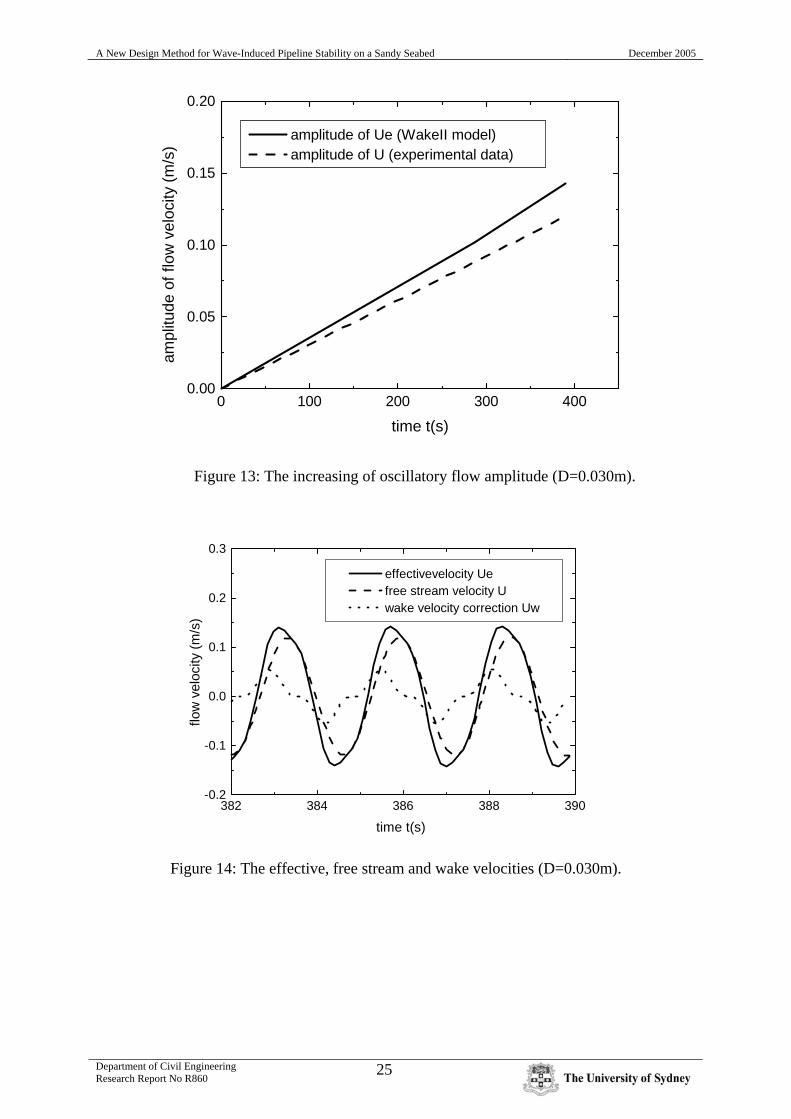
illustrated in Figure 14. With. (24) to (27), the lift force and horizontal force can be
calculated, as shown in Fig. 15.
A New Design Method for Wave-Induced Pipeline Stability on a Sandy Seabed December 2005
Department of Civil Engineering Research Report No R860
25
0 100 200 300 4000.00
0.05
0.10
0.15
0.20
amplitude of Ue (WakeII model) amplitude of U (experimental data)
ampl
itude
of f
low
vel
ocity
(m/s
)
time t(s)
Figure 13: The increasing of oscillatory flow amplitude (D=0.030m).
382 384 386 388 390-0.2
-0.1
0.0
0.1
0.2
0.3
time t(s)
flow
vel
ocity
(m/s
)
effectivevelocity Ue free stream velocity U wake velocity correction Uw
Figure 14: The effective, free stream and wake velocities (D=0.030m).
A New Design Method for Wave-Induced Pipeline Stability on a Sandy Seabed December 2005
Department of Civil Engineering Research Report No R860
26
382 384 386 388 390-1.2
-0.8
-0.4
0.0
0.4
0.8
1.2
1.6
time t(s)
hydr
odyn
amic
forc
es o
n pi
prlin
e (N
/m)
horizontal force FH lift force FL
Figure 15: Lift and horizontal forces on pipeline with Wake II (D=0.030m).
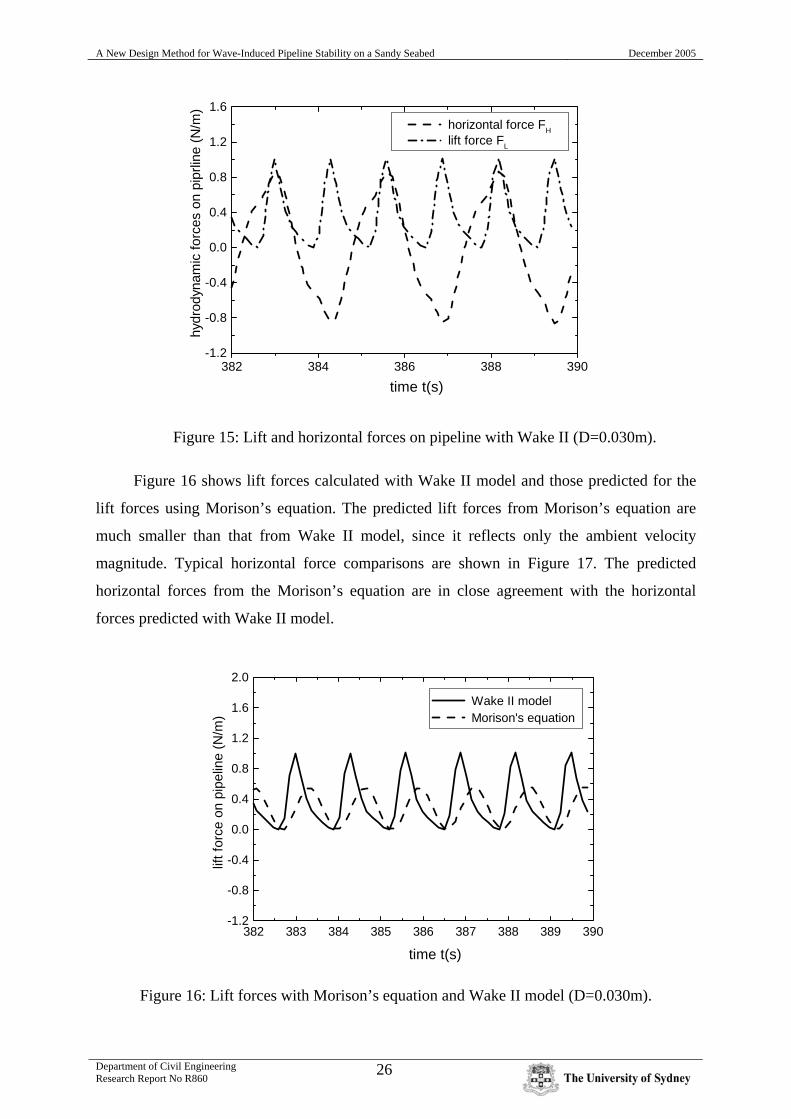
Figure 16 shows lift forces calculated with Wake II model and those predicted for the
lift forces using Morison’s equation. The predicted lift forces from Morison’s equation are
much smaller than that from Wake II model, since it reflects only the ambient velocity
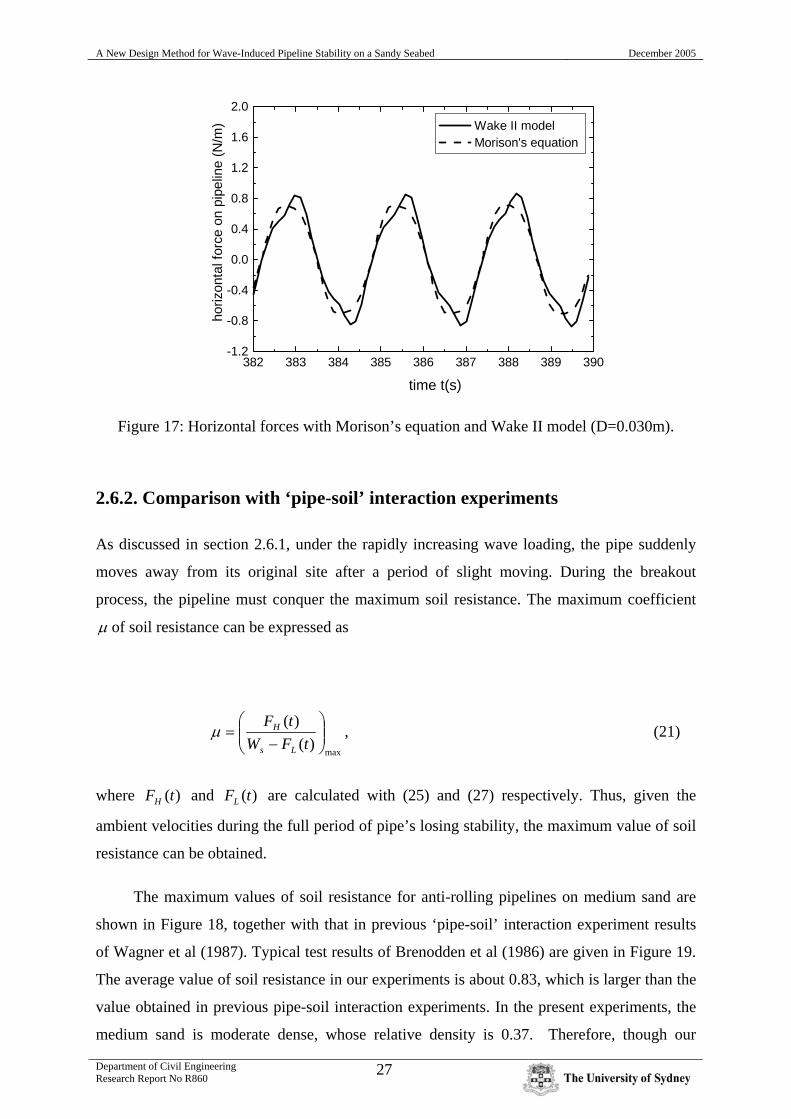
magnitude. Typical horizontal force comparisons are shown in Figure 17. The predicted
horizontal forces from the Morison’s equation are in close agreement with the horizontal
forces predicted with Wake II model.
382 383 384 385 386 387 388 389 390-1.2
-0.8
-0.4
0.0
0.4
0.8
1.2
1.6
2.0
time t(s)
lift f
orce
on
pipe
line
(N/m
)
Wake II model Morison's equation
Figure 16: Lift forces with Morison’s equation and Wake II model (D=0.030m).
A New Design Method for Wave-Induced Pipeline Stability on a Sandy Seabed December 2005
Department of Civil Engineering Research Report No R860
27
382 383 384 385 386 387 388 389 390-1.2
-0.8
-0.4
0.0
0.4
0.8
1.2
1.6
2.0
time t(s)
horiz
onta
l for
ce o
n pi
pelin
e (N
/m) Wake II model
Morison's equation
Figure 17: Horizontal forces with Morison’s equation and Wake II model (D=0.030m).
2.6.2. Comparison with ‘pipe-soil’ interaction experiments
As discussed in section 2.6.1, under the rapidly increasing wave loading, the pipe suddenly
moves away from its original site after a period of slight moving. During the breakout
process, the pipeline must conquer the maximum soil resistance. The maximum coefficient
μ of soil resistance can be expressed as
max
)()(
⎟⎟⎠
⎞⎜⎜⎝
⎛−
=tFW
tF
Ls
Hμ , (21)
where )(tFH and )(tFL are calculated with (25) and (27) respectively. Thus, given the
ambient velocities during the full period of pipe’s losing stability, the maximum value of soil
resistance can be obtained.
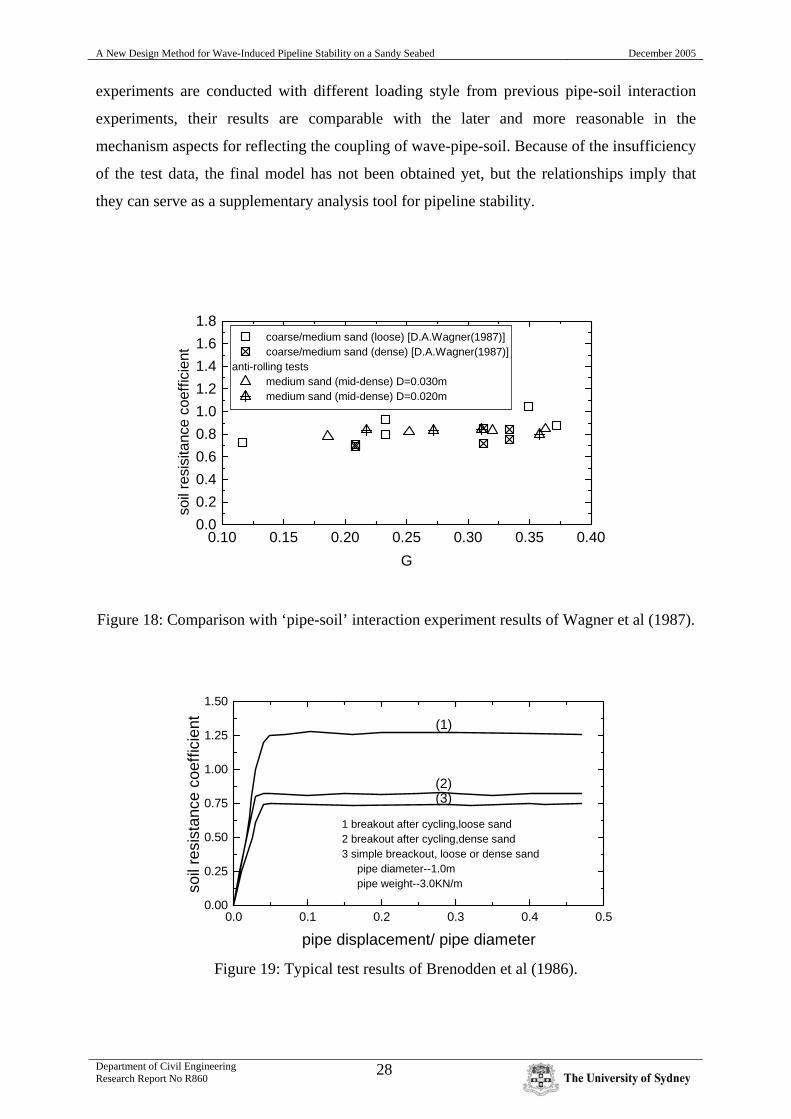
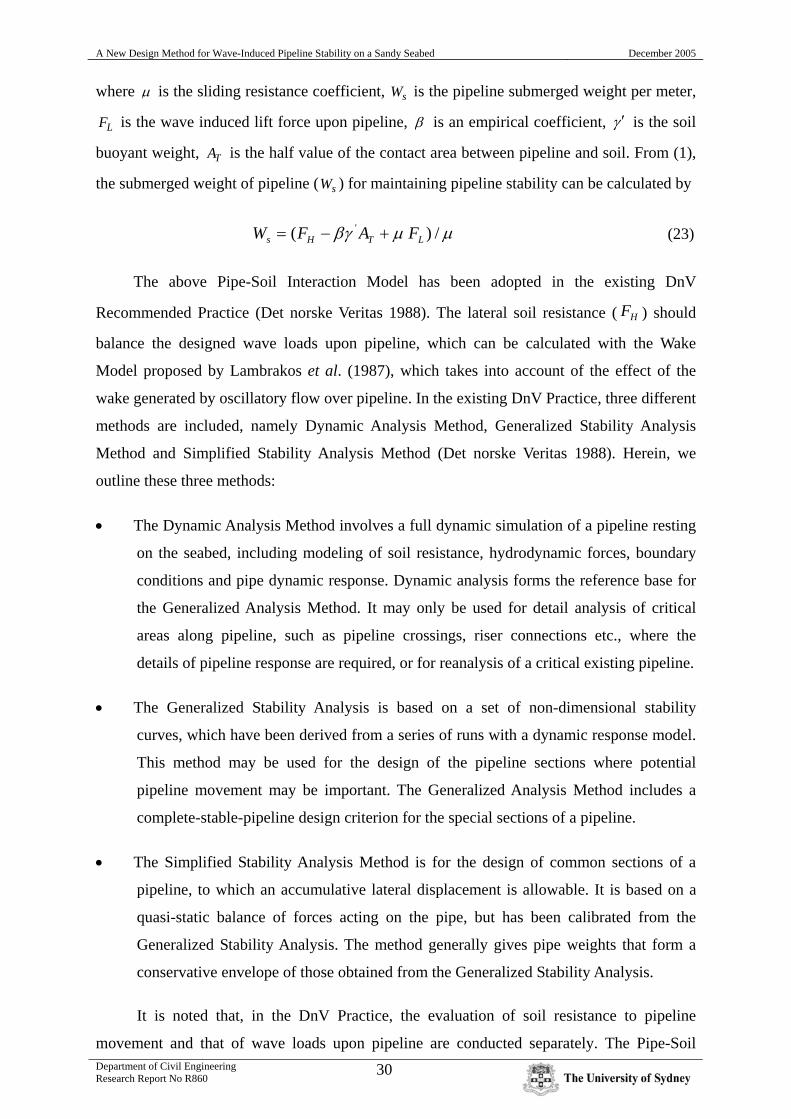
The maximum values of soil resistance for anti-rolling pipelines on medium sand are
shown in Figure 18, together with that in previous ‘pipe-soil’ interaction experiment results
of Wagner et al (1987). Typical test results of Brenodden et al (1986) are given in Figure 19.
The average value of soil resistance in our experiments is about 0.83, which is larger than the
value obtained in previous pipe-soil interaction experiments. In the present experiments, the
medium sand is moderate dense, whose relative density is 0.37. Therefore, though our
A New Design Method for Wave-Induced Pipeline Stability on a Sandy Seabed December 2005
Department of Civil Engineering Research Report No R860
28
experiments are conducted with different loading style from previous pipe-soil interaction
experiments, their results are comparable with the later and more reasonable in the
mechanism aspects for reflecting the coupling of wave-pipe-soil. Because of the insufficiency
of the test data, the final model has not been obtained yet, but the relationships imply that
they can serve as a supplementary analysis tool for pipeline stability.
0.10 0.15 0.20 0.25 0.30 0.35 0.400.00.20.40.60.81.01.21.41.61.8
coarse/medium sand (loose) [D.A.Wagner(1987)] coarse/medium sand (dense) [D.A.Wagner(1987)]
anti-rolling tests medium sand (mid-dense) D=0.030m medium sand (mid-dense) D=0.020m
soil
resi
sita
nce
coef
ficie
nt
G
Figure 18: Comparison with ‘pipe-soil’ interaction experiment results of Wagner et al (1987).
0.0 0.1 0.2 0.3 0.4 0.50.00
0.25
0.50
0.75
1.00
1.25
1.50
(3)(2)
(1)
1 breakout after cycling,loose sand2 breakout after cycling,dense sand3 simple breackout, loose or dense sand pipe diameter--1.0m pipe weight--3.0KN/mso
il re
sist
ance
coe
ffici
ent
pipe displacement/ pipe diameter
Figure 19: Typical test results of Brenodden et al (1986).

A New Design Method for Wave-Induced Pipeline Stability on a Sandy Seabed December 2005
Department of Civil Engineering Research Report No R860
29
3. New Design Method1
3.1 Existing design models
During recent decades, offshore pipelines have become one of efficient practices of transport
for oil and gas. When pipelines are installed upon seabed and subjected to wave loading,
there exits a complex interaction between waves, pipelines and seabed. To avoid the
occurrence of lateral instability of a pipeline, the pipeline has to be given a heavy weight of
concrete coating or alternatively be anchored/trenched. Both methodologies are expensive
and complicated from the aspects of design and construction. The weight of concrete coating
is a decisive factor for the accomplishment of satisfactory pipeline stability and it may prove
to be the decisive factor for carrying out the installation. In the current pipeline engineering
practice, however, mistakes or inconsistence often occurs in the design of pipeline (Lawlor
and Flynn 1991). The importance of a safe and economic design of submarine pipeline with
respect to its on-bottom stability has been widely recognized, which urges the need for a
more reliable design method.
The state-of-the-art in pipeline stability design has been changing very rapidly recently.
A few investigations have addressed the problem of pipeline-seabed interaction, such as
PIPESTAB project (Brennodden et al. 1986; Wagner et al. 1987), the AGA project
(Brennodden et al. 1989) and a project at Danish Hydraulic Institute (DHI) (Palmer et al.
1988). The PIPESTAB and AGA projects have produced soil resistance models, e.g. the
Pipe-Soil Interaction Model (Wagner et al. 1987) and the Energy-Based Pipe-Soil Interaction
Model (Brennodden et al. 1989). In the previous models, which were drawn from
mechanical actuator loading experiments, the complicated behavior of submarine pipelines
subjected to ocean environmental loads was reflected to a certain extent. These include the
pipeline embedment, which occurs as a pipeline is laid upon the seabed, and the additional
settlement during oscillatory loading history. In the Pipe-Soil Interaction Model, the total soil
lateral resistance to pipeline movement, HF , was assumed as the sum of sliding resistance
component and soil passive resistance component, i.e.
( ) TLsH AFWF 'βγμ +−= (22)
1 Part of this section forms the manuscript: Gao, F. P., Jeng, D-S; and Wu, Y.: An improved analysis method for wave-induced pipeline stability on a sandy seabed. Journal of Transportation Engineering, ASCE (submitted)
A New Design Method for Wave-Induced Pipeline Stability on a Sandy Seabed December 2005
Department of Civil Engineering Research Report No R860
30
where μ is the sliding resistance coefficient, sW is the pipeline submerged weight per meter,
LF is the wave induced lift force upon pipeline, β is an empirical coefficient, γ ′ is the soil
buoyant weight, TA is the half value of the contact area between pipeline and soil. From (1),
the submerged weight of pipeline ( sW ) for maintaining pipeline stability can be calculated by
μμβγ /)( 'LTHs FAFW +−= (23)
The above Pipe-Soil Interaction Model has been adopted in the existing DnV
Recommended Practice (Det norske Veritas 1988). The lateral soil resistance ( HF ) should
balance the designed wave loads upon pipeline, which can be calculated with the Wake
Model proposed by Lambrakos et al. (1987), which takes into account of the effect of the
wake generated by oscillatory flow over pipeline. In the existing DnV Practice, three different
methods are included, namely Dynamic Analysis Method, Generalized Stability Analysis
Method and Simplified Stability Analysis Method (Det norske Veritas 1988). Herein, we
outline these three methods:
• The Dynamic Analysis Method involves a full dynamic simulation of a pipeline resting
on the seabed, including modeling of soil resistance, hydrodynamic forces, boundary
conditions and pipe dynamic response. Dynamic analysis forms the reference base for
the Generalized Analysis Method. It may only be used for detail analysis of critical
areas along pipeline, such as pipeline crossings, riser connections etc., where the
details of pipeline response are required, or for reanalysis of a critical existing pipeline.
• The Generalized Stability Analysis is based on a set of non-dimensional stability
curves, which have been derived from a series of runs with a dynamic response model.
This method may be used for the design of the pipeline sections where potential
pipeline movement may be important. The Generalized Analysis Method includes a
complete-stable-pipeline design criterion for the special sections of a pipeline.
• The Simplified Stability Analysis Method is for the design of common sections of a
pipeline, to which an accumulative lateral displacement is allowable. It is based on a
quasi-static balance of forces acting on the pipe, but has been calibrated from the
Generalized Stability Analysis. The method generally gives pipe weights that form a
conservative envelope of those obtained from the Generalized Stability Analysis.
It is noted that, in the DnV Practice, the evaluation of soil resistance to pipeline
movement and that of wave loads upon pipeline are conducted separately. The Pipe-Soil
A New Design Method for Wave-Induced Pipeline Stability on a Sandy Seabed December 2005
Department of Civil Engineering Research Report No R860
31
Interaction Model was found to be conservative for determining the weight coating of
pipeline (Verley and Reeds 1989). As stated by Lawlor and Flynn (1991) and Hale et al.
(1991), the underlying physical mechanism of pipeline on-bottom stability has not yet been
well understood.
In the previous experiments (Brennodden et al. 1986, Wagner et al. 1987, Brennodden
et al. 1989 and Palmer et al. 1988), the wave-induced hydrodynamic forces upon pipeline
were simulated with a mechanical actuator. In their experiments, the test pipeline was
attached to the mechanical rig by a suspension system, which provided the transfer of the
horizontal and vertical forces simulating the wave loads on pipeline. In the models proposed
by Wagner et al. (1987) and Brennodden et al. (1989) etc., numerous empirical coefficients
have no implicit physical meanings and are difficult to determine in design procedure. In
reality, the wave forces act on not only pipeline but also seabed, and the seabed response to
the hydrodynamic forces can affect the pipeline stability too. Therefore, precisely speaking,
the wave induced on-bottom stability of the submarine pipeline involves the interaction of
wave, soil and pipe, but not pipe/soil interaction.
Unlike the aforementioned experimental methods, Gao et al. (2002; 2003) have studied
intensively the pipeline on-bottom stability with a U-shaped oscillatory flow tunnel, as shown
in Figures 1 and 2. The U-shaped oscillatory flow tunnel is made of transparent plexiglass
with section area of 0.2× 0.2 m2. By a butterfly-valve periodically opening and closing at the
top of a limb of the water tunnel, the water was capable of accomplishing a simple harmonic
oscillation for simulating the wave induced oscillating movement of water particles near the
seabed. By regulating valve, the effective air flux from air blower can be changed. Thus, the
amplitude can be varied continuously from 5 to 200 mm. The lower part of the water tunnel
constitutes the test section with a soil box filled with sand regarded as sandy seabed. The test
pipe was directly laid upon the surface of sand, as shown in Figures 1 and 2.
It has been well known that even small change in the thickness of concrete coating may
pose significant impact on the entire pipeline project (Allen et al. 1989). As such, a more
reasonable analysis method for pipeline on-bottom stability is highly desired.
The objective of the paper is to propose an improved analysis method for pipeline on-
bottom stability from the aspect of wave-pipe-soil interaction. A comparison will be made
between the physical phenomena of pipe losing stability in the pipe-soil interaction tests and
those in the wave-pipe-soil interaction tests. Based on the relationships for describing
pipeline on-bottom stability induced by waves, the analysis procedure will also be presented.
A New Design Method for Wave-Induced Pipeline Stability on a Sandy Seabed December 2005
Department of Civil Engineering Research Report No R860
32
Furthermore, the submerged weights of pipeline predicted by the improved analysis method
will be compared with those by DnV Practice (Det norske Veritas 1988).
3.2 Physical Phenomena of Pipeline Losing On-Bottom Instability
In the PIPESTAB, AGA and DHI pipe-soil interaction tests, the instability process of
pipeline was either displacement controlled or force controlled. In their experiments, when
losing lateral stability, pipe was pushing the soils nearby back and forth and sand scouring
was not involved (Allen et al. 1989). Both the PIPESTAB and AGA pipe-soil interaction
tests have generally showed that any loading history causing additional pipeline penetration
would result in an increase of lateral resistance. These results can be explained by the
importance of pipe penetration into the soil, mounding in front of the pipe and the associated
lateral earth passive pressure. With the increase of the sand density, the effect of cyclic
preloading on the ultimate soil resistance became less, due to the reduced initial penetration
in the dense sand and reduced penetration increase with cyclic loading on the dense sand
compared with those for loose sand (Wagner et al. 1989). However, in oscillatory flow
conditions, the traditional static stability of pipe-soil interaction is not necessarily valid. This
is particularly true in the weak bottom soils typical of the upper layer of some marine
sediments (Lammert and Hale 1989).
In the wave-pipe-soil interaction experiments with U-shaped oscillatory tunnel (see
Figure 1), a constant value of the increase of oscillatory flow amplitude per second, i.e.
0A& =0.09× 10⁻³ m/s, was adopted for exploration of the mechanism of pipeline instability
induced by rapidly increasing storm waves. With the increase of oscillatory flow amplitude,
three characteristic times are experienced during pipe losing on-bottom stability (see Figure
5): (a) Onset of scour: local scour is triggered when water particle velocity around pipe is
large enough, thereafter sand ripples will be gradually formed in the vicinity of the pipe; (b)
Pipe rocking: the pipe rocks slightly periodically at its original location with approximately
same frequency of oscillatory flow; (c) Pipe breakout: the pipe suddenly moves away from its
original location, or breakout takes place, after a period of slight rocking. The above process
of pipeline’s losing on-bottom stability has been further verified in the wave flume tests by
Teh et al. (2003).
A comparison between the physical phenomena of pipe losing stability in the pipe-soil
interaction tests and those in the wave-pipe-soil interaction tests shows that, an additional
A New Design Method for Wave-Induced Pipeline Stability on a Sandy Seabed December 2005
Department of Civil Engineering Research Report No R860
33
penetration of pipe into soil bed under cyclical pre-loadings has been found in both
experiments, which increases the ultimate lateral resistance. In the wave-pipe-soil interaction
tests, sand scour around test pipe was detected and the sediment transportation was found to
have influence on pipe on-bottom stability. However, this could not be simulated in the
previous pipe-soil interaction tests. The local sour around marine structures has been recently
summarized by Sumer et al. (2001) and Sumer and Fredsøe (2002).
3.3 New Criteria for Pipeline On-Bottom Instability
Dimensional analysis has indicated that the critical pipeline submerged weight ( 2'/ DWs γ ) to
keep pipeline laterally stable is mainly relative to the following parameters:
,/,)/((/ 5.02' DTUgDUfDW mms =γ
)......,,,/,/,/,/,/ 0 κρρν rswsatmm DdDUATtDU & (24)
where Ws is the pipeline submerged weight per meter, ( )gwsat ρργ −=' is the buoyant unit
weight of soil, D is the outer diameter of pipeline; 5.0)/(gDUm is the Froude number (Fr),
whose physical meaning is the ratio of inertia force to gravitational force; mU is the maximum
value of the velocity of water particles at seabed, g is the gravitational acceleration; DTU m /
is the Keulegan-Carpenter number ( KC ), which controls the generation and development of
vortex around pipeline; T is the wave period; ν/DU m is the Reynolds number (Re), whose
physical meaning is the ratio of inertia force to viscous force; ν is the kinematic viscosity of
fluid ; Tt / is the time of oscillatory flow acting on pipeline, t is the loading time; mUA /0& is
the ratio of the increase of oscillatory flow amplitude per second ( 0A& ) to the maximum of
water particle velocity; wsat ρρ / is specific gravity of saturated sand, i.e. the ratio of the
density of saturated sand ( satρ ) to that of pore water ( wρ ); sdD / is the ratio of pipe diameter
(D) to particle diameter of sand ( sd ); rD is the relative density of sand; κ is the relative
roughness of pipeline (Gao et al. 2003).
Since both Fr and Re could not be satisfied concurrently in the wave experiments, it is
reasonable to employ the Froude scaling process and allowance were made for variation in
Reynolds number (Chakrabarti 1994). In the experiments, Re range is at the order of 310 – 410 ,
which is approximately one order less than that in the field. Based on the experimental
A New Design Method for Wave-Induced Pipeline Stability on a Sandy Seabed December 2005
Department of Civil Engineering Research Report No R860
34
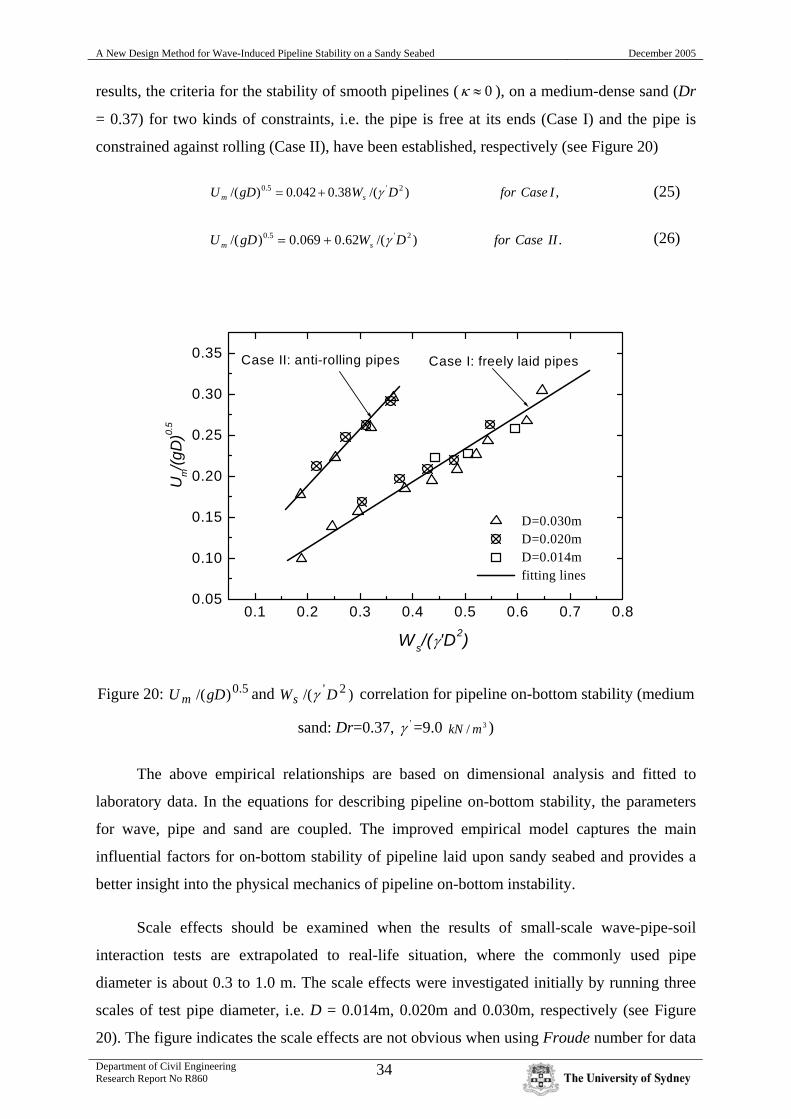
results, the criteria for the stability of smooth pipelines ( 0≈κ ), on a medium-dense sand (Dr
= 0.37) for two kinds of constraints, i.e. the pipe is free at its ends (Case I) and the pipe is
constrained against rolling (Case II), have been established, respectively (see Figure 20)
,)/(38.0042.0)/( 2'5.0 ICaseforDWgDU sm γ+= (25)
.)/(62.0069.0)/( 2'5.0 IICaseforDWgDU sm γ+= (26)
0.1 0.2 0.3 0.4 0.5 0.6 0.7 0.80.05
0.10
0.15
0.20
0.25
0.30
0.35
Ws/(γ'D2)
Um/(g
D)0.
5
Case I: freely laid pipesCase II: anti-rolling pipes
D=0.030m D=0.020m D=0.014m fitting lines
Figure 20: 5.0)/(gDU m and )/( 2'DWs γ correlation for pipeline on-bottom stability (medium
sand: Dr=0.37, 'γ =9.0 3/ mkN )
The above empirical relationships are based on dimensional analysis and fitted to
laboratory data. In the equations for describing pipeline on-bottom stability, the parameters
for wave, pipe and sand are coupled. The improved empirical model captures the main
influential factors for on-bottom stability of pipeline laid upon sandy seabed and provides a
better insight into the physical mechanics of pipeline on-bottom instability.
Scale effects should be examined when the results of small-scale wave-pipe-soil
interaction tests are extrapolated to real-life situation, where the commonly used pipe
diameter is about 0.3 to 1.0 m. The scale effects were investigated initially by running three
scales of test pipe diameter, i.e. D = 0.014m, 0.020m and 0.030m, respectively (see Figure
20). The figure indicates the scale effects are not obvious when using Froude number for data
A New Design Method for Wave-Induced Pipeline Stability on a Sandy Seabed December 2005
Department of Civil Engineering Research Report No R860
35
reduction. However, more large-scale experiments and field observations are desired to
further verify the above empirical relationships. It is noted that in the experiments, KC range
is about 5 to 20, and Fr range about 0.1 to 0.3. The seabed properties and loading history
would also have influence on the pipeline stability. Thus for various conditions of waves and
seabed, some modification should be given to the above wave-pipe-soil interaction
relationships for pipeline on-bottom stability.
According the DnV Practice (Det norske Veritas 1988), for a long-distance laid pipeline,
the demands for on-bottom stability are different for various sections of the pipeline.
Generally speaking, no lateral displacement during extreme environmental conditions is
allowed at the special locations, including the section close to a platform, normally taken as
500 m, and some points on pipeline such as valve connections, pipeline crossing, Y- or T-
connections expansion loops etc. Certain lateral displacement is acceptable at the common
locations, i.e. the section located more than a certain distance away from the platform,
normally taken as 500 m. As for the special sections of pipeline, it should keep stable even
without the constraint effect from the ends. However, as for the common sections of pipeline,
the demands for their stability are less rigorous, i.e. the constraint effect from the ends can be
taken into account for their lateral stability. Thus, the obtained relationships in Figure 3 may
serve as the criteria for on-bottom stability of pipeline on sandy seabed. The critical line for
Case I can be used for evaluating the on-bottom stability of pipeline at special locations, and
the one for Case II can be used for evaluating the on-bottom stability of pipeline at common
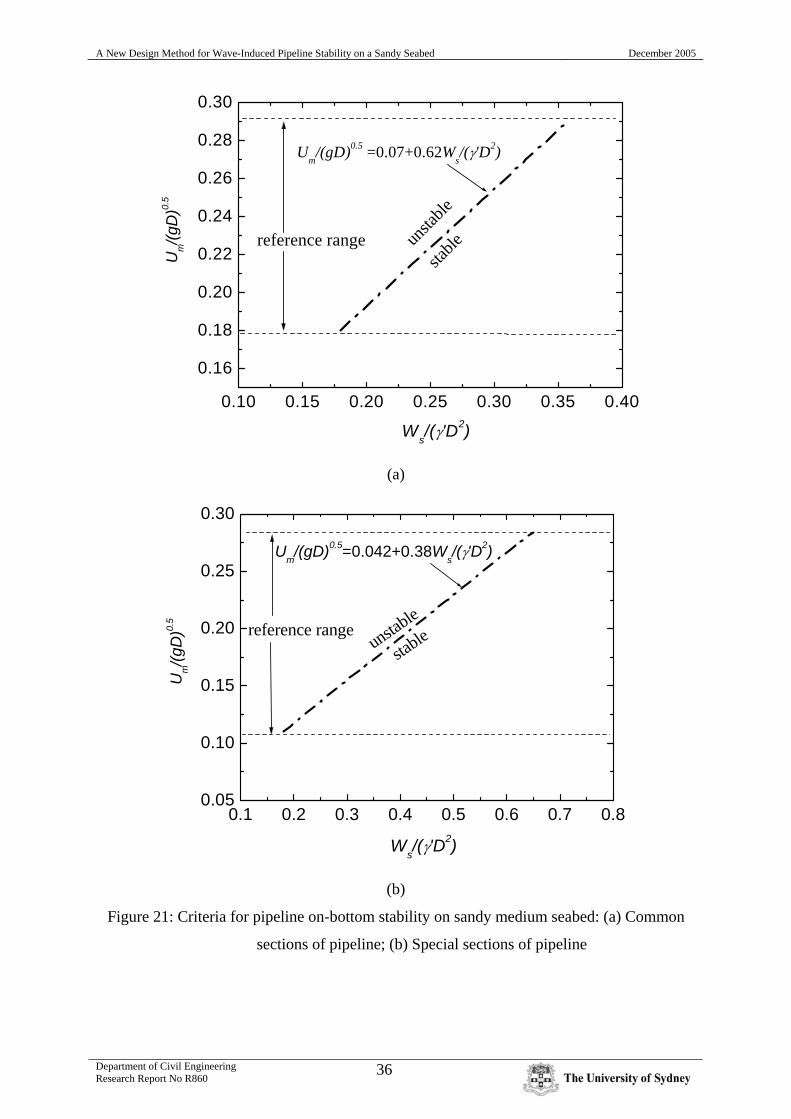
locations, as shown in Figure 21. The critical lines in the figure are based on the medium
sand test results, thus they should be modified when the physical parameters of seabed are
changed. The new criteria for pipeline on-bottom stability is characterized by
• flat seabed with homogeneous sandy soil conditions along the entire length of the
pipeline;
• waves propagating perpendicularly to the pipeline axis;
• materials of pipeline assumed to be rigid compared with soils.
A New Design Method for Wave-Induced Pipeline Stability on a Sandy Seabed December 2005
Department of Civil Engineering Research Report No R860
36
0.10 0.15 0.20 0.25 0.30 0.35 0.40
0.16
0.18
0.20
0.22
0.24
0.26
0.28
0.30
Ws/(γ'D2)
Um/(g
D)0.
5
stableun
stable
reference range
Um/(gD)0.5 =0.07+0.62Ws/(γ'D2)
(a)
0.1 0.2 0.3 0.4 0.5 0.6 0.7 0.80.05
0.10
0.15
0.20
0.25
0.30
Ws/(γ'D2)
Um/(g
D)0.
5
reference rangestab
leunstable
Um/(gD)0.5=0.042+0.38W
s/(γ'D2)
(b)
Figure 21: Criteria for pipeline on-bottom stability on sandy medium seabed: (a) Common
sections of pipeline; (b) Special sections of pipeline
A New Design Method for Wave-Induced Pipeline Stability on a Sandy Seabed December 2005
Department of Civil Engineering Research Report No R860
37
3.4 Procedure for Analysis of Wave-Induced Pipeline On-Bottom
Stability
The aim of pipeline design with respect to the on-bottom stability is to determine the steel
pipeline thickness and the weight of the concrete coating or the thickness of concrete coating,
so that the submerged weight of the pipeline is sufficient to meet the required stability
criteria.
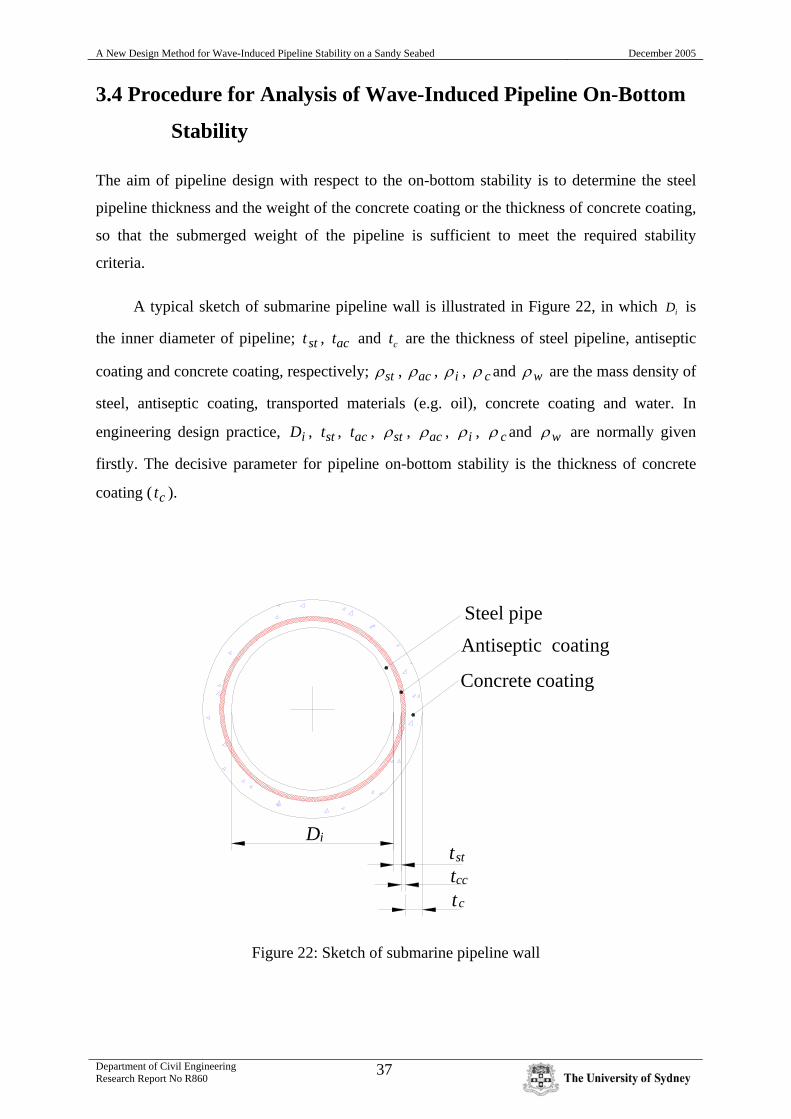
A typical sketch of submarine pipeline wall is illustrated in Figure 22, in which iD is
the inner diameter of pipeline; stt , act and ct are the thickness of steel pipeline, antiseptic
coating and concrete coating, respectively; stρ , acρ , iρ , cρ and wρ are the mass density of
steel, antiseptic coating, transported materials (e.g. oil), concrete coating and water. In
engineering design practice, iD , stt , act , stρ , acρ , iρ , cρ and wρ are normally given
firstly. The decisive parameter for pipeline on-bottom stability is the thickness of concrete
coating ( ct ).
D
Steel pipe
Concrete coating
ist
cc
t
tc
t
Antiseptic coating
Figure 22: Sketch of submarine pipeline wall
A New Design Method for Wave-Induced Pipeline Stability on a Sandy Seabed December 2005
Department of Civil Engineering Research Report No R860
38
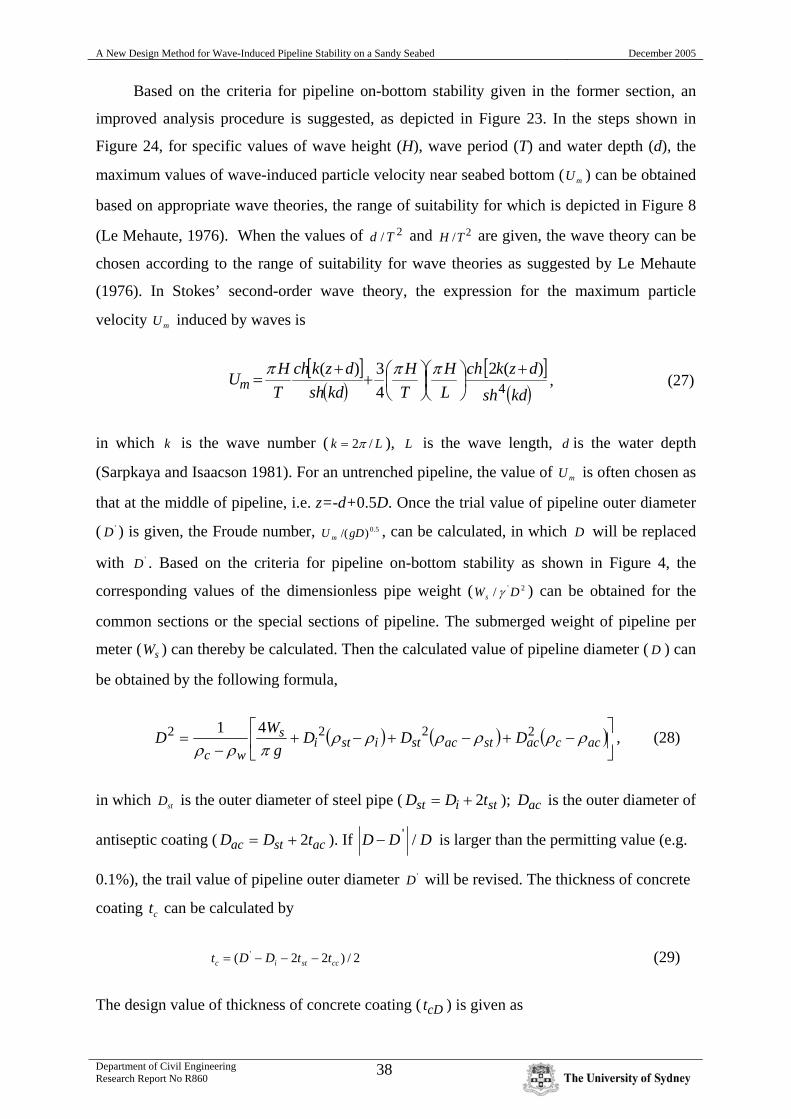
Based on the criteria for pipeline on-bottom stability given in the former section, an
improved analysis procedure is suggested, as depicted in Figure 23. In the steps shown in
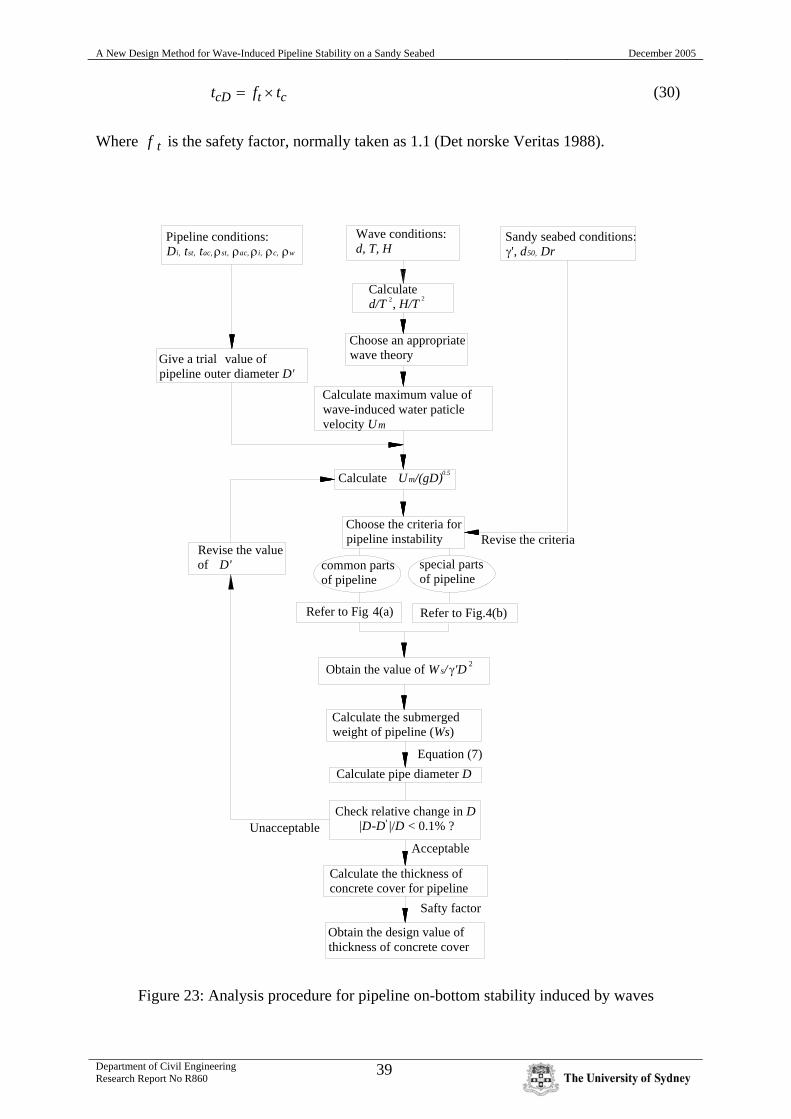
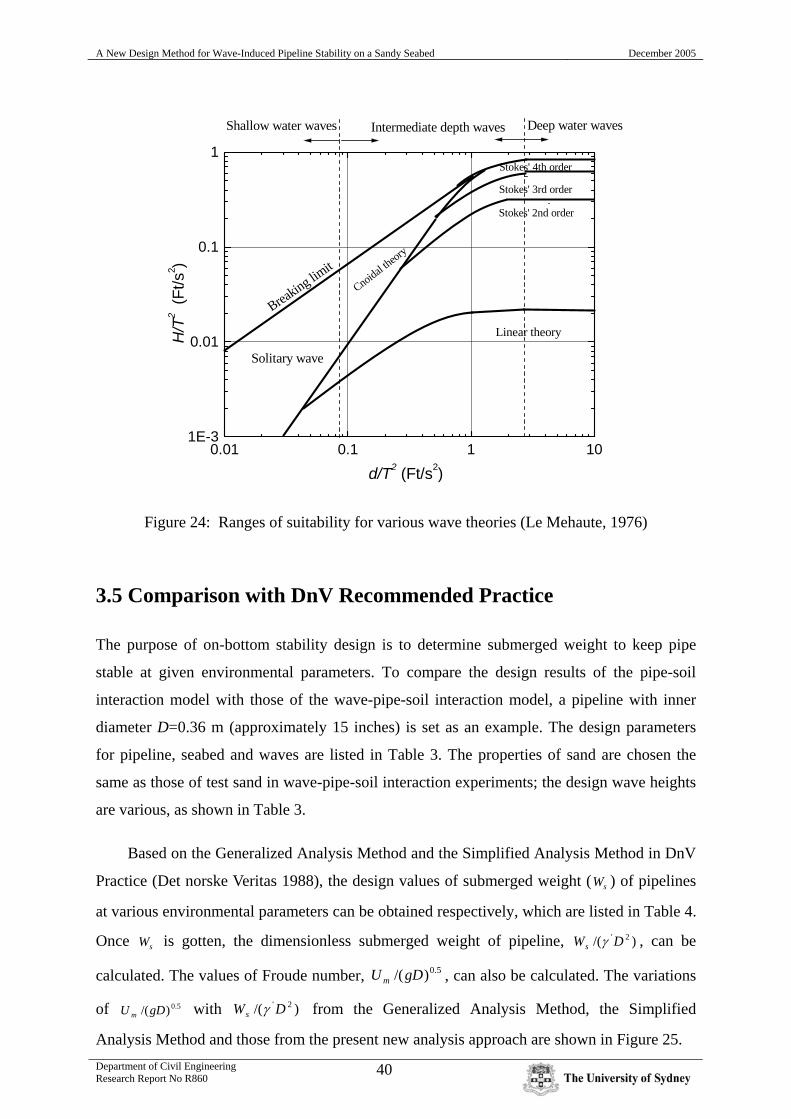
Figure 24, for specific values of wave height (H), wave period (T) and water depth (d), the
maximum values of wave-induced particle velocity near seabed bottom ( mU ) can be obtained
based on appropriate wave theories, the range of suitability for which is depicted in Figure 8
(Le Mehaute, 1976). When the values of 2/ Td and 2/TH are given, the wave theory can be
chosen according to the range of suitability for wave theories as suggested by Le Mehaute
(1976). In Stokes’ second-order wave theory, the expression for the maximum particle
velocity mU induced by waves is
[ ]
( )[ ]
( )kdshdzkch
LH
TH
kdshdzkch
THUm 4
)(243)( +
⎟⎠⎞
⎜⎝⎛
⎟⎠⎞
⎜⎝⎛+
+=
πππ, (27)
in which k is the wave number ( Lk /2π= ), L is the wave length, d is the water depth
(Sarpkaya and Isaacson 1981). For an untrenched pipeline, the value of mU is often chosen as
that at the middle of pipeline, i.e. z=-d+0.5D. Once the trial value of pipeline outer diameter
( 'D ) is given, the Froude number, 5.0)/(gDU m , can be calculated, in which D will be replaced
with 'D . Based on the criteria for pipeline on-bottom stability as shown in Figure 4, the
corresponding values of the dimensionless pipe weight ( 2'/ DWs γ ) can be obtained for the
common sections or the special sections of pipeline. The submerged weight of pipeline per
meter ( sW ) can thereby be calculated. Then the calculated value of pipeline diameter ( D ) can
be obtained by the following formula,
( ) ( ) ( )⎥⎦
⎤⎢⎣
⎡−+−+−+
−= accacstacstisti
s
wcDDD
gWD ρρρρρρ
πρρ2222 41 , (28)
in which stD is the outer diameter of steel pipe ( stist tDD 2+= ); acD is the outer diameter of
antiseptic coating ( acstac tDD 2+= ). If DDD /'− is larger than the permitting value (e.g.
0.1%), the trail value of pipeline outer diameter 'D will be revised. The thickness of concrete
coating ct can be calculated by
2/)22( 'ccstic ttDDt −−−= (29)
The design value of thickness of concrete coating ( cDt ) is given as
A New Design Method for Wave-Induced Pipeline Stability on a Sandy Seabed December 2005
Department of Civil Engineering Research Report No R860
39
ctcD tft ×= (30)
Where tf is the safety factor, normally taken as 1.1 (Det norske Veritas 1988).
Wave conditions: d, T, H
Calculated/T , H/T2
Choose an appropriatewave theory
Calculate maximum value of wave-induced water paticle velocity Um
Give a trial value of pipeline outer diameter D'
Pipeline conditions: Di, tst, tac, ρst, ρac, ρi, ρc, ρw
Calculate Um/(gD)
common parts of pipeline
Sandy seabed conditions: γ', d50, Dr
Choose the criteria for pipeline instability
Obtain the value of W s/ γ'D
Calculate the submerged weight of pipeline (Ws)
Calculate pipe diameter D
Check relative change in D|D-D |/D < 0.1% ?
Calculate the thickness of concrete cover for pipeline
Obtain the design value of thickness of concrete cover
Revise the value of D'
Safty factor
Revise the criteria
0.5
2
special parts of pipeline
2
'
Equation (7)
UnacceptableAcceptable
Refer to Fig 4(a) Refer to Fig.4(b)
Figure 23: Analysis procedure for pipeline on-bottom stability induced by waves
A New Design Method for Wave-Induced Pipeline Stability on a Sandy Seabed December 2005
Department of Civil Engineering Research Report No R860
40
0.01 0.1 1 101E-3
0.01
0.1
1Stokes' 4th order
Stokes' 3rd order
Linear theory
Stokes' 2nd order
Cnoidal t
heory
Solitary wave
Breaking lim
it
Deep water wavesIntermediate depth wavesShallow water waves
H/T
2 (Ft
/s2 )
d/T2 (Ft/s2)
Figure 24: Ranges of suitability for various wave theories (Le Mehaute, 1976)
3.5 Comparison with DnV Recommended Practice
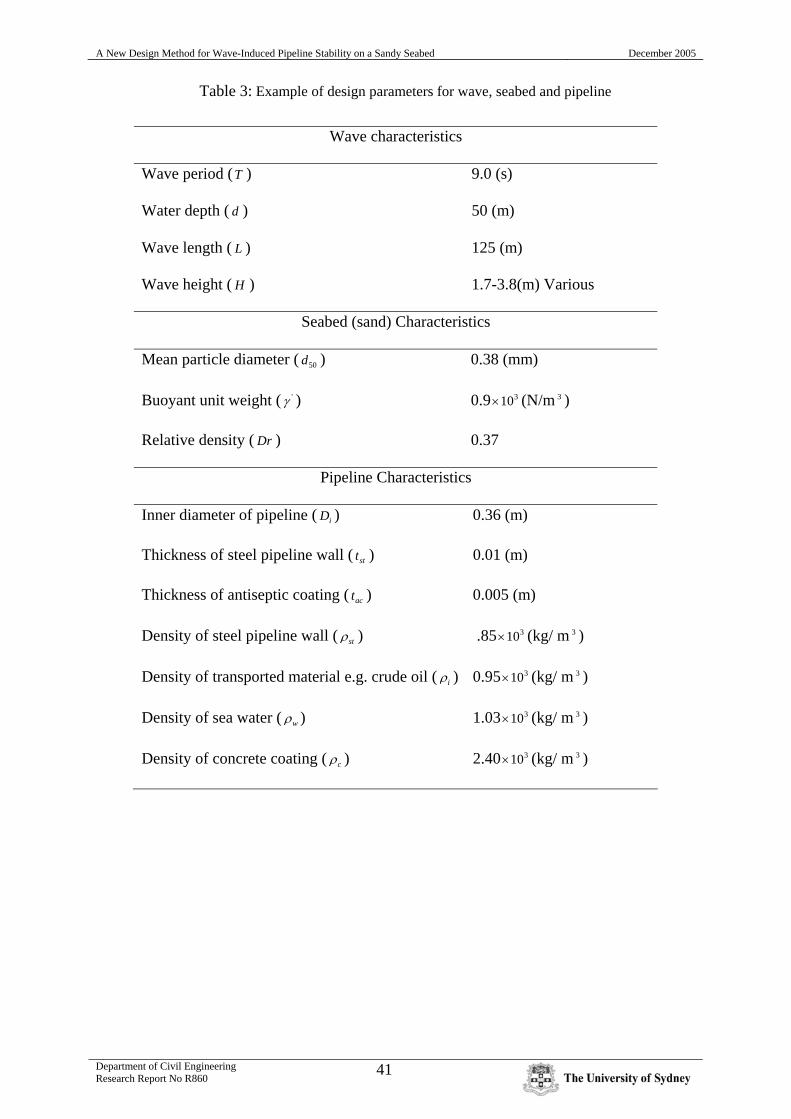
The purpose of on-bottom stability design is to determine submerged weight to keep pipe
stable at given environmental parameters. To compare the design results of the pipe-soil
interaction model with those of the wave-pipe-soil interaction model, a pipeline with inner
diameter D=0.36 m (approximately 15 inches) is set as an example. The design parameters
for pipeline, seabed and waves are listed in Table 3. The properties of sand are chosen the
same as those of test sand in wave-pipe-soil interaction experiments; the design wave heights
are various, as shown in Table 3.
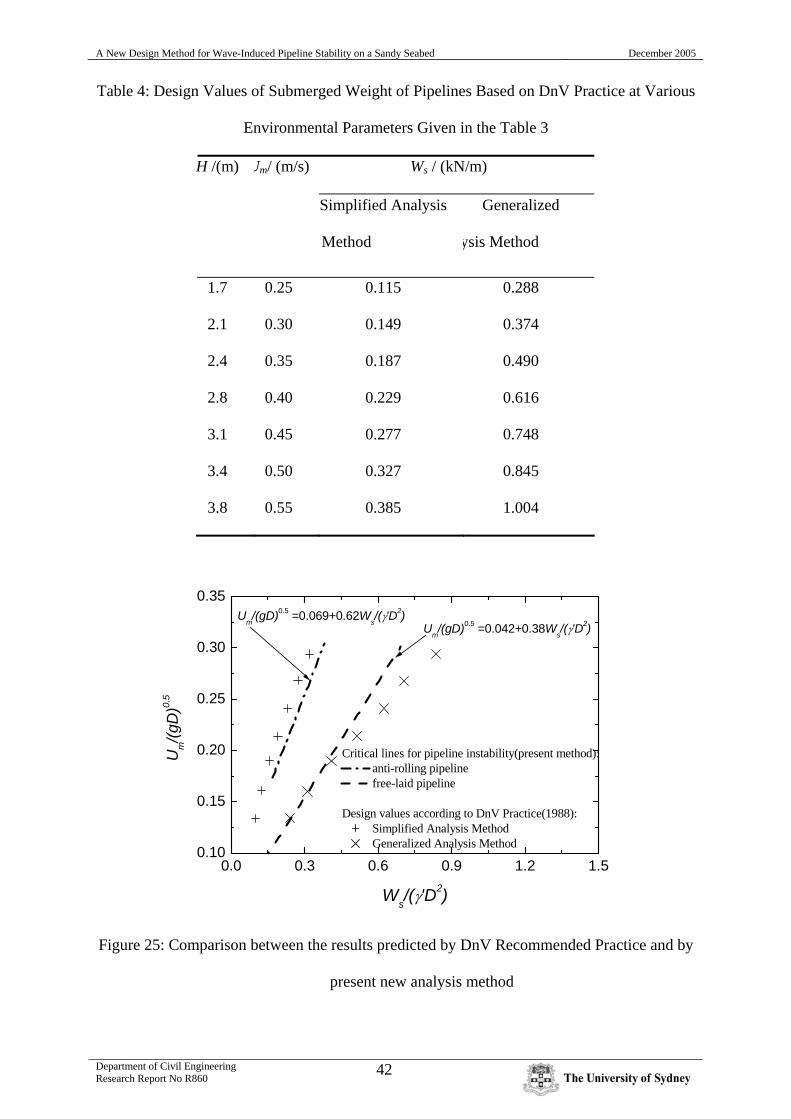
Based on the Generalized Analysis Method and the Simplified Analysis Method in DnV
Practice (Det norske Veritas 1988), the design values of submerged weight ( sW ) of pipelines
at various environmental parameters can be obtained respectively, which are listed in Table 4.
Once sW is gotten, the dimensionless submerged weight of pipeline, )/( 2' DWs γ , can be
calculated. The values of Froude number, 5.0)/(gDU m , can also be calculated. The variations
of 5.0)/(gDU m with )/( 2' DWs γ from the Generalized Analysis Method, the Simplified
Analysis Method and those from the present new analysis approach are shown in Figure 25.
A New Design Method for Wave-Induced Pipeline Stability on a Sandy Seabed December 2005
Department of Civil Engineering Research Report No R860
41
Table 3: Example of design parameters for wave, seabed and pipeline
Wave characteristics
Wave period (T ) 9.0 (s)
Water depth ( d ) 50 (m)
Wave length ( L ) 125 (m)
Wave height ( H ) 1.7-3.8(m) Various
Seabed (sand) Characteristics
Mean particle diameter ( 50d ) 0.38 (mm)
Buoyant unit weight ( 'γ ) 0.9 310× (N/m 3 )
Relative density ( Dr ) 0.37
Pipeline Characteristics
Inner diameter of pipeline ( iD ) 0.36 (m)
Thickness of steel pipeline wall ( stt ) 0.01 (m)
Thickness of antiseptic coating ( act ) 0.005 (m)
Density of steel pipeline wall ( stρ ) .85 310× (kg/ m 3 )
Density of transported material e.g. crude oil ( iρ ) 0.95 310× (kg/ m 3 )
Density of sea water ( wρ ) 1.03 310× (kg/ m 3 )
Density of concrete coating ( cρ ) 2.40 310× (kg/ m 3 )
A New Design Method for Wave-Induced Pipeline Stability on a Sandy Seabed December 2005
Department of Civil Engineering Research Report No R860
42
Table 4: Design Values of Submerged Weight of Pipelines Based on DnV Practice at Various
Environmental Parameters Given in the Table 3
H /(m) Ws / (kN/m) Um/ (m/s)
Simplified Analysis
Method
Generalized
ysis Method
1.7 0.25 0.115 0.288
2.1 0.30 0.149 0.374
2.4 0.35 0.187 0.490
2.8 0.40 0.229 0.616
3.1 0.45 0.277 0.748
3.4 0.50 0.327 0.845
3.8 0.55 0.385 1.004
0.0 0.3 0.6 0.9 1.2 1.50.10
0.15
0.20
0.25
0.30
0.35
Um/(gD)0.5 =0.042+0.38Ws/(γ'D2)
Critical lines for pipeline instability(present method): anti-rolling pipeline free-laid pipeline
Design values according to DnV Practice(1988): Simplified Analysis Method Generalized Analysis Method
Um/(gD)0.5 =0.069+0.62W
s/(γ'D2)
Um/(g
D)0.
5
Ws/(γ'D2)
Figure 25: Comparison between the results predicted by DnV Recommended Practice and by
present new analysis method
A New Design Method for Wave-Induced Pipeline Stability on a Sandy Seabed December 2005
Department of Civil Engineering Research Report No R860
43
As mentioned preiously, the critical line for freely laid pipelines (Case I) can be used for
evaluating the on-bottom stability of pipeline at special sections, and the one for anti-rolling
pipelines (Case II) can be used for evaluating the on-bottom stability of pipeline at common
sections. It is indicated in Figure 25 that, the critical line for the instability of anti-rolling
pipeline and that for free-laid pipeline in the empirical wave-pipe-soil interaction
relationships match approximately the design values based on Simplified Analysis Method
and those based on Generalized Analysis Method in DnV Practice, respectively.
Nevertheless, with the increase of Froude number, the Generalized Analysis Method is
getting more conservative for the on-bottom stability design of the pipeline at special
sections. This may be explained by that the sand dune that forms in the vicinity of pipeline
due to scour, and which benefits pipeline’s on-bottom stability. Sand scour, as an indicator of
wave-pipe-soil interaction, is one of the influential factors for pipeline stability, which
however has not been taken into account in the existing DnV Practice for pipeline stability
design.
A New Design Method for Wave-Induced Pipeline Stability on a Sandy Seabed December 2005
Department of Civil Engineering Research Report No R860
44
4. Concluding Remarks
(1) Froude number (Fr) and the non-dimensional pipe weight (G) are two most important
parameters in modeling wave-induced instability of untrenched pipeline. Based on the
experimental results, different linear relationships between Fr and G have been
obtained for pipes with different restraint conditions, i.e. a) freely laid pipelines and b)
anti-rolling pipelines. Moreover three characteristic times in the process of the pipe’s
losing stability are revealed.
(2) Based on Wake II model, the current wave-soil-pipe interaction test results and the
results of previous pipe-soil interaction tests are compared. It is indicated that the
results of two types of tests are comparable. The obtained Fr-G relationships can be
used for supplementary analysis of criterion for pipeline instability in design procedure.
(3) In consideration of the actual field conditions, different loading histories are used to
explore the effects of them on the pipeline instability. It is found that the scouring of
sand besides the pipeline is the main result of the deferent loading histories, and affects
the pipeline stability eventually.
(4) Sand scour, as an indicator of the “wave-soil-pipe” coupling, is detected in our
experiments. But, in the previous experiments with actuator, it could not be modeled.
Therefore, the current hydrodynamic experiments are more reasonable in the
mechanism aspects, which reflect the ‘wave-soil-pipeline’ coupling effects. The
physical phenomena of pipeline losing on-bottom stability was better simulated in the
wave-pipe-soil interaction experiments, in which local scour around pipeline was
detected, reflecting the intensive interaction between wave, pipe and sand. The
relationships between 5.0)/(gDU m and )/( 2' DWs γ for two kinds of constraint conditions,
i.e. Case I: freely laid pipes, Case II anti-rolling pipes, can serve as the stability criteria
for special sections and common sections of the pipeline, respectively.
(5) Based on the obtained relationships between 5.0)/(gDU m and )/( 2' DWs γ , an improved
analysis method for pipeline on-bottom stability is proposed. The analysis procedure is
given with a detailed illustration.
(6) A comparison of submerged weights of pipeline predicted with existing DnV
A New Design Method for Wave-Induced Pipeline Stability on a Sandy Seabed December 2005
Department of Civil Engineering Research Report No R860
45
Recommended Practice and those with the new method indicates that they are generally
comparable. With the increase of Froude number, the Generalized Method in the DnV
Practice becomes more conservative than the wave-pipe-soil interaction model for the
on-bottom stability design of pipeline at special sections. Sand scour has some
influence on pipeline stability, which however has not been considered in the existing
DnV Practice.
Acknowledgement
Financial supports by National Natural Science Foundation of China (Project No. 50509022)
and ‘Tenth Five-year Plan’ of Chinese Academy of Sciences (Project No. KJCX2-SW-L03)
and Australian Research Council Large Grant Scheme # A00104092 (2001-2003) are greatly
appreciated. The second author is grateful for the support from Institute of Mechanics,
Chinese Academy of Science under Senior Visiting Scholar Scheme to initialise the second
half of this report during December 2004-January 2005. The authors The authors also thank
Professors Yingxiang Wu, Xiaoyun Gu, Qun Pu and Senior Engineer Kun Li at Institute of
Mechanics, Chinese Academy of Sciences, for their guidance and assistance in the
experiments.
A New Design Method for Wave-Induced Pipeline Stability on a Sandy Seabed December 2005
Department of Civil Engineering Research Report No R860
46
References
Allen DW, Lammert WF, Hale JR and Jacobsen V. (1989). Submarine pipeline on-bottom
stability: recent AGA research. The 10th Offshore Technical Conference, paper 6055.
Brennodden, H., Sveggen, O., Wagner, D.A. and Murff, J.D. (1986). Full-scale pipe-soil
interaction tests. Proc. Offshore Technology Conference, OTC 5338, 433-440.
Brennodden H, Lieng JT, Sotberg T and Verley RLP. (1989). An energy-based pipe-soil
interaction model. The 10th Offshore Technical Conference, paper 6057.
Chakrabarti K. (1994). Offshore Structure Modeling. JBW Printers & Binder Pte. Ltd.
Chiew, Y.M., (1990). Mechanics of local scour around submarine pipelines. Journal of
Hydraulic Engineering, ASCE, 116, 515~529.
Det norske Veritas, (1988). On-bottom stability design of submarine pipelines,
Recommended Practice E305
Foda MA, Chang J, Law A. (1990). Wave-induced breakout of half-buried marine pipes.
Journal of Waterways, Port, Coastal and Ocean Engineering, ASCE., 116:267-286.
Gao, F. P., Gu, X. Y., Jeng, D.-S. and Teo, H. T. (2002) An experimental study for wave-
induced instability of pipelines: The breakout of pipelines. Applied Ocean Research,
24(2), 83-90.
Gao, F. P., Gu, X. Y. and Jeng, D. S. (2003). Physical modeling of untrenched submarine
pipeline instability. Ocean Engineering, 30 (10): 1283-1304.
Hale, J.R., Lammert, W.F., Allen, D.W., (1991). Pipeline On-bottom stability calculations:
Comparison of two state-of-the-art methods and pipe-soil model verification. Proc. 12th
Offshore Technology Conference, OTC, paper 6761.
Herbich J.B. (1985). Hydromechanics of submarine pipelines: Design problems. Can.J. Civil
Engng, 12, 863~874
Lammert, W. F. and Hale, J. R. (1989). Dynamic response of submarine pipelines exposed to
combined wave and current action. Proceeding of Annual Offshore Technology
Conference, OTC 6058, 159-170.
Lawlor, CDF, Flynn, SJA. (1991). Subsea pipeline stability analysis: Still a black art?
Transactions of the Institution of Engineers, Australia: Civil Engineering, 33: 1-8.
A New Design Method for Wave-Induced Pipeline Stability on a Sandy Seabed December 2005
Department of Civil Engineering Research Report No R860
47
Le Mehaute, B.(1976). An introduction to hydrodynamics and water waves. Dusseldorf:
Springer-Verlag.
Lyons, C.G., (1973). Soil resistance to lateral sliding of marine pipelines, Proc. Offshore
Technology Conference, OTC, vol. 1876, pp. 479-484.
Mao Y., (1988). Seabed scours under pipelines. Proc 7th Into Symp On Offshore Mechanics
and Arctic Engineering (OMAE), ASME, 33-38
Palmer, A. C., Steenfelt, J. S. and Jacobsen, V. (1988). Lateral resistance of marine pipelines
on sand, Proceedings of 20th Annual Offshore Technology Conference, Paper OTC 5853,
399-408.
Poorooshasb F. (1990). On centrifuge use for ocean research. Marine Geotechnology, 9:141-
158
Sabag, S.R., Edge, B.L., Soedigdo, I.R., (2000). Wake II model for hydrodynamic forces on
marine pipelines including waves and currents. Ocean Engineering, 27, 1295-1319.
Sarpkaya, T., and Isaacson, M. (1981). Mechanics of Wave Forces of Offshore Structures.
London: Van Nostrand Reinhold Company.
Soedigdo, I.R., Lambrakos, K.F., Edge, B.L. (1999). Predicton of hydrodynamic forces on
submarine pipelines using an improved wake II model. Ocean Engineering, 26, 431-462.
Stansby PK, Starr P. (1992). On a horizontal cylinder resting on a sand bed under waves and
currents. International Journal for Offshore and Polar Engineering, 2:262-266
Sumer, B.M., Fredsøe, J., (1991). Onset of scour below a pipeline exposed to waves. Int J
Offshore and Polar Engng, 1, 189-194
Sumer, B. M. and Fredsøe, J. (2002). The mechanics of scour in the marine environment.
New Jersey: World Scientific Publishing Company.
Sumer, B. M., Whitehouse, R. J. S. and Tørum, A. (2001). Scour around coastal structures: a
summary of recent research, Coastal Engineering, 44: 153-190.
Teh, T. C., Palmer, A. C., Damgaard, J. S. (2003). Experimental study of marine pipelines on
unstable and liquefied seabed. Coastal Engineering, 50: 1 –17.
Verley, R. L. P. and Reed, K. (1989). Response of pipeline on various soils for realistic
hydrodynamic loading. Proceedings of 8th Offshore Mechanics and Polar Engineering
Conference, 5: 149-156.
A New Design Method for Wave-Induced Pipeline Stability on a Sandy Seabed December 2005
Department of Civil Engineering Research Report No R860
48
Wagner DA, Murff JD, Brennodden H, Sveggen O. (1987). Pipe-soil interaction model. The
8th Offshore Technical Conference, paper 5504.
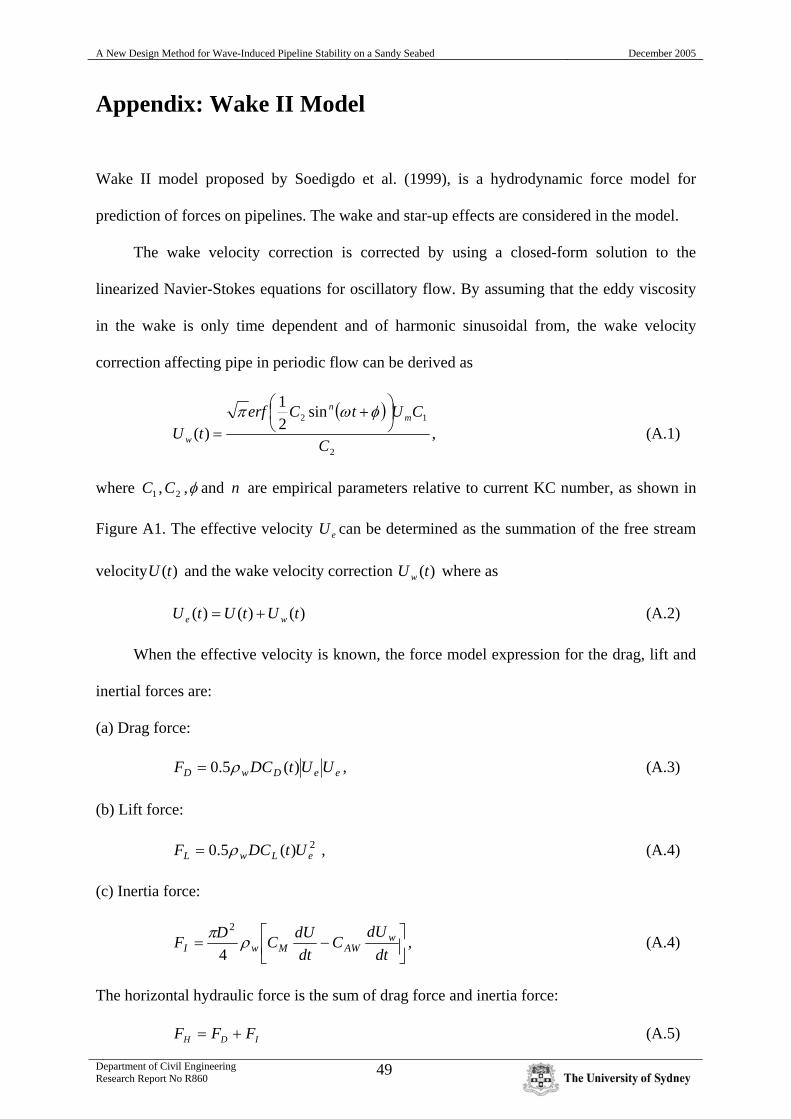
A New Design Method for Wave-Induced Pipeline Stability on a Sandy Seabed December 2005
Department of Civil Engineering Research Report No R860
49
Appendix: Wake II Model
Wake II model proposed by Soedigdo et al. (1999), is a hydrodynamic force model for
prediction of forces on pipelines. The wake and star-up effects are considered in the model.
The wake velocity correction is corrected by using a closed-form solution to the
linearized Navier-Stokes equations for oscillatory flow. By assuming that the eddy viscosity
in the wake is only time dependent and of harmonic sinusoidal from, the wake velocity
correction affecting pipe in periodic flow can be derived as
( )
2
12 sin21
)(C
CUtCerftU
mn
w
⎟⎠⎞
⎜⎝⎛ +
=φωπ
, (A.1)
where 1C , 2C ,φ and n are empirical parameters relative to current KC number, as shown in
Figure A1. The effective velocity eU can be determined as the summation of the free stream
velocity )(tU and the wake velocity correction )(tU w where as
)()()( tUtUtU we += (A.2)
When the effective velocity is known, the force model expression for the drag, lift and
inertial forces are:
(a) Drag force:
eeDwD UUtDCF )(5.0 ρ= , (A.3)
(b) Lift force:
2)(5.0 eLwL UtDCF ρ= , (A.4)
(c) Inertia force:
⎥⎦
⎤⎢⎣
⎡ −=dt
dUC
dtdUCDF w
AWMwI ρπ4
2, (A.4)
The horizontal hydraulic force is the sum of drag force and inertia force:
IDH FFF += (A.5)
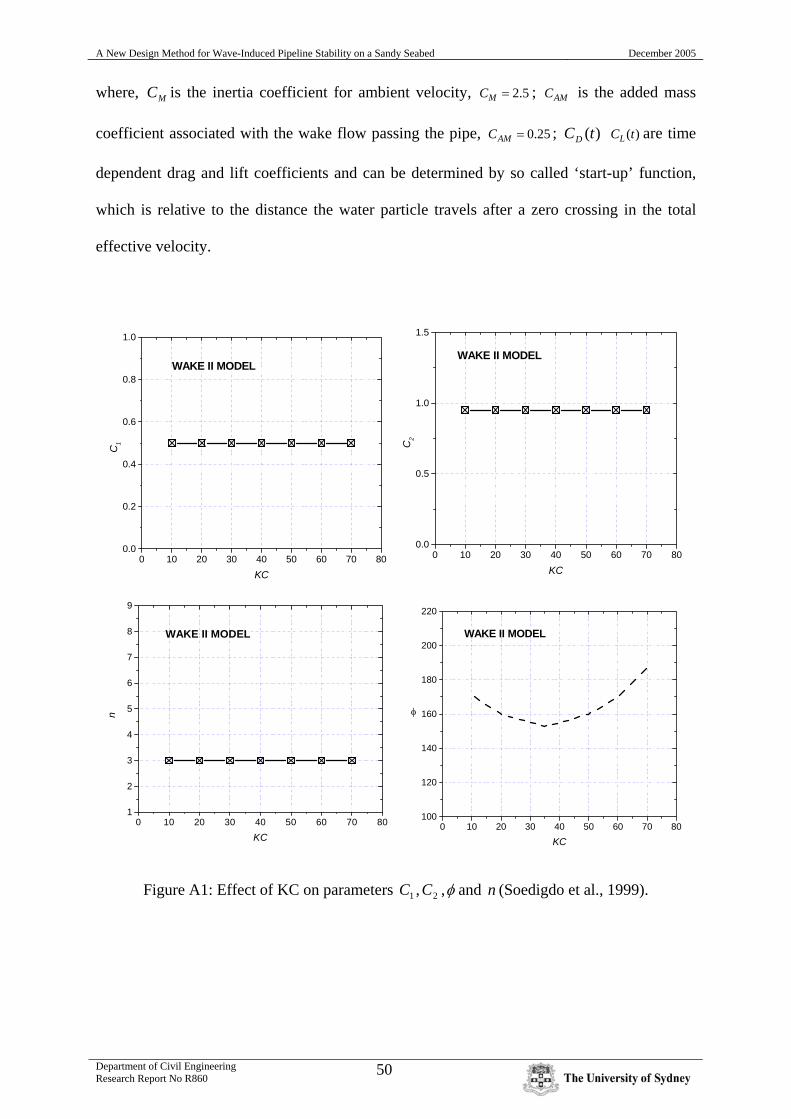
A New Design Method for Wave-Induced Pipeline Stability on a Sandy Seabed December 2005
Department of Civil Engineering Research Report No R860
50
where, MC is the inertia coefficient for ambient velocity, 5.2=MC ; AMC is the added mass
coefficient associated with the wake flow passing the pipe, 25.0=AMC ; )(tCD )(tCL are time
dependent drag and lift coefficients and can be determined by so called ‘start-up’ function,
which is relative to the distance the water particle travels after a zero crossing in the total
effective velocity.
0 10 20 30 40 50 60 70 800.0
0.2
0.4
0.6
0.8
1.0
WAKE II MODEL
C1
KC
0 10 20 30 40 50 60 70 800.0
0.5
1.0
1.5
WAKE II MODEL
C2
KC
0 10 20 30 40 50 60 70 801
2
3
4
5
6
7
8
9
WAKE II MODEL
n
KC0 10 20 30 40 50 60 70 80
100
120
140
160
180
200
220
φ
WAKE II MODEL
KC
Figure A1: Effect of KC on parameters 1C , 2C ,φ and n (Soedigdo et al., 1999).