Embed Size (px)
Citation preview
Environmental Financing inCentral and Eastern Europe
1996-2001

Environmental Financing in Central and Eastern Europe
1996-2001
Written by Joanna Fiedler and Paulina Janiak
SZENTENDRE, HUNGARYMAY 2003
THE REGIONAL ENVIRONMENTAL CENTERfor Central and Eastern Europe
About the REC
The Regional Environmental Center for Central and Eastern Europe (REC) is a non-partisan, non-advocacy, not-for-profit organisation with a mission to assist in solving environmental problems in Central and Eastern Europe (CEE). TheCenter fulfils this mission by encouraging cooperation among non-governmental organisations, governments, businessesand other environmental stakeholders, by supporting the free exchange of information and by promoting publicparticipation in environmental decision-making.
The REC was established in 1990 by the United States, the European Commission and Hungary. Today, the REC is legallybased on a Charter signed by the governments of 27 countries and the European Commission, and on an InternationalAgreement with the Government of Hungary. The REC has its headquarters in Szentendre, Hungary, and local offices in eachof its 15 beneficiary CEE countries which are: Albania, Bosnia and Herzegovina, Bulgaria, Croatia, Czech Republic, Estonia,Hungary, Latvia, Lithuania, FYR Macedonia, Poland, Romania, Serbia and Montenegro, Slovakia and Slovenia.
Recent donors are the European Commission and the governments of Albania, Belgium, Bosnia and Herzegovina,Bulgaria, Canada, the Czech Republic, Denmark, Estonia, Finland, France, Germany, Italy, Japan, Latvia, Lithuania, theNetherlands, Poland, Serbia and Montenegro, Slovenia, Sweden, Switzerland, the United Kingdom and the United States,as well as other inter-governmental and private institutions.
The entire contents of this publication are copyright©2003 The Regional Environmental Center for Central and Eastern Europe
No part of this publication may be sold in any form or reproduced for salewithout prior written permission of the copyright holder
963 9424 33 1
Published by:The Regional Environmental Center for Central and Eastern Europe
Ady Endre ut 9-11, 2000 Szentendre, HungaryTel: (36-26) 504-000, Fax: (36-26) 311-294, E-mail: [email protected], Web site: <www.rec.org>
Printed in Hungary by ProTertia
This and all REC publications are printed on recycled paper or paper produced without the use of chlorine or chlorine-based chemicals
2 E N V I R O N M E N TA L F I N A N C I N G I N C E N T R A L A N D E A S T E R N E U R O P E
Map of Central and Eastern Europe 6
Authors and Acknowledgements 7
List of Abbreviations 8
Executive Summary 9
Chapter 1: Background and Introduction 13
This Report 13
Environment for Europe Process 13
Scope of the Report 14
Approach 14
Report Structure 16
Endnotes 16
Chapter 2: Wider Framework 19
Political and Economic Framework 19
Conclusions 22
Endnotes 24
Chapter 3: Environmental Status and Issues 25
Candidate Countries 25
SEE Countries 28
Conclusions 31
Endnotes 31
Chapter 4: Need for Investment 33
Candidate Countries 33
SEE Countries 33
Role of the Polluter-Pays Principle 34
Conclusions 35
Endnotes 35
T A B L E O F C O N T E N T S
E N V I R O N M E N TA L F I N A N C I N G I N C E N T R A L A N D E A S T E R N E U R O P E 3
Chapter 5: Environmental Expenditure in the Candidate Countries 37
Conclusions 42
Endnotes 42
Chapter 6: Environmental Expenditure in the Countries of South Eastern Europe 43
Albania 43
Bosnia and Herzegovina 43
Croatia 43
FYR Macedonia 44
Serbia and Montenegro 45
Conclusions 47
Endnotes 47
Chapter 7: National Sources of Financing 49
The Public Sector 51
The Private Sector 53
Conclusions 59
Endnotes 59
Chapter 8: International Environmental Assistance 61
Candidate Countries 61
SEE Countries 70
Conclusions 77
Endnotes 78
Chapter 9: Key Conclusions 81
Specific Conclusions — the Candidate Countries 81
Specific Conclusions — the SEE Countries 82
Chapter 10: Options for the Future 83
Revising and Identifying Investment Needs 83
Using Investment More Efficiently 83
Coordinating Sources of Finance 83
Increasing Absorption Capacity 84
Involving the Private Sector 85
C O N T E N T S
4 E N V I R O N M E N TA L F I N A N C I N G I N C E N T R A L A N D E A S T E R N E U R O P E
Improving Risk Management 88
Endnotes 90
Chapter 11: The Way Forward — Recommendations for Actions 91
Recommendations for the Governments of the Candidate Countries 91
Recommendations for the Governments of South Eastern Europe 91
Recommendations for the Private Sector 92
Recommendations for Donors 92
References 93
Annex 1: Data Presented in this Report 95
Annex 2: Methodological Issues 115
Environmental Expenditure in the Candidate Countries 115
Environmental Expenditure in the Countries of South Eastern Europe 117
International Environmental Assistance — Methodology of Data Collection 119
Endnotes 120
Annex 3: Creditor Reporting System Purpose Codes 121
C O N T E N T S
E N V I R O N M E N TA L F I N A N C I N G I N C E N T R A L A N D E A S T E R N E U R O P E 5
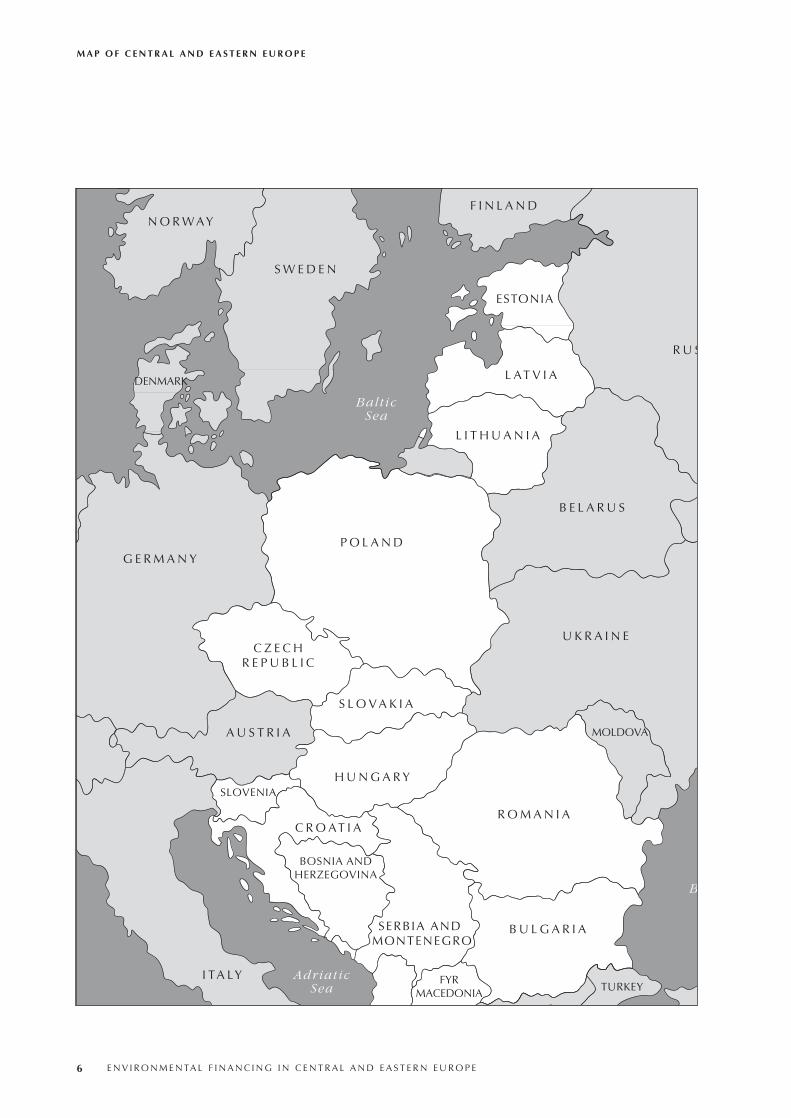
M A P O F C E N T R A L A N D E A S T E R N E U R O P E
6 E N V I R O N M E N TA L F I N A N C I N G I N C E N T R A L A N D E A S T E R N E U R O P E
B
B U L G A R I A
C R O AT I A
BOSNIA ANDHERZEGOVINA
C Z E C HR E P U B L I C
ESTONIA
L AT V I A
L I T H U A N I A
H U N G A R Y
R O M A N I A
FYRMACEDONIA
P O L A N D
S L O V A K I A
SLOVENIA
AdriaticSea
Balt icSea
B E L A R U S
U K R A I N E
MOLDOVA
G E R M A N Y
A U S T R I A
I TA LY
R U S
TURKEY
F I N L A N D
S W E D E N
N O R W AY
DENMARK
SERBIA AND MONTENEGRO
E N V I R O N M E N TA L F I N A N C I N G I N C E N T R A L A N D E A S T E R N E U R O P E 7
Joanna Fiedler (project manager) and Paulina Janiak(project officer) from the Environmental PolicyProgramme at the REC prepared this report.
The report was prepared in close cooperation withCarla Bertuzzi and Ulrik Weuder (both from the Non-Member Countries Division, Environment Directorateat the OECD).
We would like to specially thank Glen Andersonand Zsuzsanna Lehoczki for their peer reviews.
We would also like to thank Anna Bramwell (fromthe European Commission) for helping in collectingand interpreting data from the European Commission;Ulf Johansson (from Eurostat) for valuable commentsand guidance on interpretation of Eurostat data; JohnButson (from EnviroMarkets International) for his valu-able comments on structure and content of the report;Jernej Stritih (from OIKOS) for his valuable comments;and Brendan Gillespie and Grzegorz Peszko (from theNon-Member Countries Division, EnvironmentDirectorate at the OECD) for their comments.
We would like to thank to the following REC staff:
Oreola Ivanova (head of the Environmental PolicyProgramme), and project director, for her guidance andvaluable comments throughout the project; and JenniferMcGuinn (head of the Local Initiatives Programme) forher valuable comments.
We thank REC country office staff from Albania,Bosnia and Herzegovina, Croatia, FYR Macedonia,Serbia and Montenegro, Kosovo (Territory CurrentlyUnder Interim UN Administration) for their involvementin compiling data from the SEE region.
We would like to thank our local consultants forcompiling data from their respective countries: NarinPanariti from Albania, Aziz Sunje from Bosnia andHerzegovina, Jelena Budak from Croatia, ZoranNiegovan from Serbia and Montenegro, Driton Balajfrom Kosovo.
We would like to thank Palle Lindgaard-Jorgensenand Peter Pedersen from the Danish EnvironmentalProtection Agency (DEPA) for supporting this project andfor their continuous support during the implementation.
Authors and Acknowledgements
8
BOT Built, Operate and Transfer
BOOT Build, Own, Operate and Transfer
BOO Build, Own and Operate
CARDS Community Assistance for Reconstruction andStabilisation
CEE Central and Eastern Europe. (This report focus-es on the EU candidate countries of CEE:Bulgaria, the Czech Republic, Estonia,Hungary, Latvia, Lithuania, Poland, Romania,Slovakia, Slovenia.
EBRD European Bank for Reconstruction andDevelopment
EC European Commission
EECCA Eastern Europe, Caucasus and Central Asia
EU European Union
Eurostat Statistical Office of the European Communities
FYR Macedonia Former Yugoslav Republic of Macedonia
GDP Gross Domestic Product
GNI Gross National Income
ISPA Instrument for Structural Policies for Pre-acces-sion
NACE General Industrial Classification of EconomicActivities within the European Communities(Nomenclature des Activités desCommunautés Européennes)
OA Official Assistance (Recipients covered by thisreport are Bulgaria, the Czech Republic,Estonia, Hungary, Latvia, Lithuania, Poland,Romania, Slovakia, Slovenia
ODA Official development assistance (Recipients
covered by this report are Albania, Bosnia and
Herzegovina, Croatia, FYR Macedonia and
Serbia and Montenegro.
OECD Organisation for Economic Co-operation andDevelopment
Phare Poland Hungary Aid for the Reconstruction ofthe Economy
REC Regional Environmental Center
REReP Regional Environmental ReconstructionProgramme for South Eastern Europe
RDA Regional Development Agency
SAPARD Special Accession Programme for Agricultureand Rural Development
SAP Stabilisation and Association Process
SEE South Eastern EuropeSouth Eastern Europe(SEE) countriesAlbania, Bosnia and Herzegovina, Croatia,FYR Macedonia, Serbia and Montenegro(Republic of Serbia, Republic of Montenegroand Kosovo - Territory Currently Under InterimUN Administration).
UNECE United Nations Economic Commission forEurope
UNEP United Nations Environmental Programme
L I S T O F A B B R E V I AT I O N S
E N V I R O N M E N TA L F I N A N C I N G I N C E N T R A L A N D E A S T E R N E U R O P E
This report has been prepared by the RegionalEnvironmental Center (REC) for Central Eastern Europe(CEE), which serves as secretariat of the CEE sub pro-gramme of the Task Force for implementation of theEnvironmental Action Programme (EAP) for Central andEastern Europe. The report is prepared in response tothe official request of the Ministers in Aarhus (see para-graph 53 of the Ministerial Declaration from Aarhus ) Itsmain objective is to present trends and levels of envi-ronmental financing from domestic and internationalsources in the European Union (EU) candidate countriesof CEE and in the countries of South Eastern Europe(SEE) over the period 1996 to 2001. The report also dis-cusses the options for environmental financing in bothregions in the future, and recommends courses of actionthat could be undertaken to improve the level and effec-tiveness of environmental financing. The report is pre-pared for the fifth ministerial conference “Environmentfor Europe” to be held in Kiev, in May 2003.
The analysis of trends in environmental financingpresented in this report is based on data collected frominternational databases, international financial institu-tions, donor countries, and national statistics. Wherepossible the data have been cross referenced and vali-dated against other sources but some limitationsinevitably remain. These particularly concern the lackof data on environmental expenditure and commit-ments in regard to the SEE countries. Although data onexpenditure and commitments for different environ-mental media in the the candidate countries exist, theyare still incomplete.
In the second half of the 1990s, 10 candidate coun-tries made further progress in their transition towardsmarket economies. This process was mainly driven bythe prospect of integration with the European Union(EU). At the same time the countries of the SEE strug-gled with the legacy left by the break-up of the formerYugoslavia and numerous armed conflicts, which
resulted in the fragmentation of the region and acomplex socio-economic situation. In the candidatecountries, political stability and progress in transitionresulted in the implementation of environmental poli-cies designed to reduce environmental pollution, and inthe allocation of resources for investment in cleaner andmore efficient technologies. Meanwhile, in the SEEcountries political insecurity and weak economiescontributed to a gradual deterioration of the environ-mental infrastructure, an accumulation of hazardousindustrial waste and a growing number of environ-mental hot spots.
Despite significant improvements in the state of theenvironment in the candidate countries, the region stillfaces the challenge of mobilising adequate funds inorder to achieve their environmental goals. In thesecountries the need for environmental investment isdriven mainly by the EU accession process, and it hasbeen estimated that compliance with the so-calledinvestment-heavy directives alone will require betweenEUR 80 and 110 billion. In the SEE countries there are asyet no estimates of investment needs.
The polluter pays principle is the underlying prin-ciple for most environmental financing, thus it isanticipated that all the countries of the region will focuson its implementation. The conditions for environmentalfinancing have improved in recent years in many candi-date countries. New policies, macroeconomicstabilisation, the reduction of subsidies on energy, waterand other resources and the implementation ofeconomic instruments have resulted in better integrationof the polluter pays principle in both the private andpublic sectors. In the SEE countries, in contrast, theconditions for environmental financing remain at aninadequate level. This is mainly due to the difficultgeneral economic situation, accompanied by inadequateenforcement of environmental legislation and the lack(or inefficient use) of economic instruments.
Based on data for 2000, there is a marked variance
E N V I R O N M E N TA L F I N A N C I N G I N C E N T R A L A N D E A S T E R N E U R O P E 9
Executive Summary
in the size of the environmental market in the candidatecountries, ranging from over EUR 1 billion in Polandand the Czech Republic to EUR 100 million in Estoniaand Latvia. Trends in total environmental expenditureas a percent of gross domestic product (GDP) showedthat many countries in the region decreased theirannual expenditure over the period from 1996 to 2000.In Estonia, environmental expenditure fell from 2.2percent of GPD to 1.2 percent of GDP over this period,while in the Czech Republic the corresponding figureswere 2.3 percent and 2.0 percent. In contrast to thisthere was an increase in total expenditure on environ-mental protection in Bulgaria and Lithuania. The lowestlevels of expenditure were observed in Latvia andSlovenia (both less than 1 percent of GDP in 2000),although the average for the candidate countries was1.26 percent of GDP.
Total levels of environmental expenditure per capitaalso varied significantly, reaching EUR 106 per capita inthe Czech Republic but only EUR 17 in Latvia, with aCEE average of EUR 51.5 per capita. Trends showedthat expenditure per capita in the Czech Republic andSlovakia decreased over the period, while levels inEstonia and Romania remained constant and in othercandidate countries per capita expenditure increased(particularly in 2000).
Many SEE countries have been primarily dependentupon international assistance in relation to imple-menting investment projects. Expenditure fromdomestic sources was very limited. In certain countriesaction was undertaken to strengthen environmentalfinancing, for example in FYR Macedonia the establish-ment of an environmental fund, and in Croatia thefinancing of environmental infrastructure projects by theCroatian Bank for Reconstruction and Development.
In more mature market economies it is anticipatedthat environmental expenditure will be fundedprimarily from internal sources. In the transitionaleconomies of the candidate countries and SEE it can beexpected that domestic resources will provide the maincontribution to investment, and will meet almost alloperational and maintenance costs. In transitionaleconomies foreign financing sources may provide somefinance, but most of the resources needed will stillcome from domestic (national) sources. Thus, in thesecond half of the 1990s, the successful implementationof environmental projects has become closely linked tothe successful integration and combination of publicand private financial resources.
Public sector expenditure in the whole region reliedon three major sources of finance: local governmentrevenues, transfers from central government budgets,and grants and soft loans from environmental funds. Inthe candidate countries, public sector expenditurereached more than 20 percent of the total in Slovenia,
Estonia and Bulgaria, while in Latvia and Lithuanialevels were below 10 percent. Trends in total per capitaexpenditure by the public sector show that expenditureincreased in Bulgaria and Estonia and decreased in theCzech Republic. The highest levels were reported inPoland and in the Czech Republic.
Inside the public sector, the process of increaseddecentralisation of responsibilities to local municipali-ties has played an important role. Most municipalities inthe region have problems securing financing for envi-ronmental investment. In the second half of the 1990smany municipalities were exploring new options,including those involving the private sector and issuingmunicipal bonds.
Environmental funds have played an important rolein financing environmental investment in many coun-tries of the region. In 2000 in Latvia environmentalfunds contributed 42.9 percent of total expenditure, andin Slovenia the figure was 23.0 percent, while inEstonia, Bulgaria, Hungary, Poland and Slovakia fundsmade up over 10 percent of total expenditure.
In many candidate countries, private sector involve-ment in financing environmental infrastructure wasbecoming increasingly important in the second half of1990s. Industry’s investment in environmental protectiondecreased in Poland, the Czech Republic, and Slovakia,but increased in Bulgaria, Hungary and Slovenia, while itremained constant in other countries. The levels ofindustry investment as a percentage of GDP in 2000 aresimilar in many countries, ranging from 0.5 percent inBulgaria and Estonia to 0.1 in Lithuania and below 0.1 inLatvia. Industry investment as a share of GDP saw adecreasing in the Czech Republic, Slovakia and Polandand an increase in Hungary and Bulgaria.
Involving the private sector requires the establish-ment of mechanisms that will facilitate private sectorcontributions to public sector infrastructure projects. Inthe analysed period many countries of the region startedto consider implementing environmental infrastructureprojects through public private partnerships. The mostcommon ways of involving the private sector variedfrom technical assistance delivered by the private sector,through turnkey contracts and operating contracts suchas the Build, Operate, Transfer as well as the Build,Own, Operate, Transfer schemes to full privatisation.Positive examples of the public private partnerships inenvironmental infrastructure can be seen in the CzechRepublic, where Brnenske Vodarny a Kanalizace leasesand operates the water and sewage system in Brno, andin Bulgaria, where the Sofia water and wastewatersystem is run by Sofijiska Voda AD. The European Bankfor Reconstruction and Development was involved inboth of these public private partnership projects.
Throughout the period 1996-2001 internationalenvironmental assistance to the candidate countries
E X E C U T I V E S U M M A R Y
10 E N V I R O N M E N TA L F I N A N C I N G I N C E N T R A L A N D E A S T E R N E U R O P E
and SEE countries increased. In the SEE the level ofinternational financial commitments fluctuated signifi-cantly, with the low level in 1999 linked to the conflictin Kosovo and a shift in the donors’ assistance to emer-gency aid as well as a sharp decrease in theinternational financial institutions’ activities in theregion. 2000 brought an increase in internationalcontributions as a result of the launching of theRegional Environmental Reconstruction Programme.At the same time in the candidate countries theEuropean Community (EC) introduced the Instrumentfor Structural Policies for Pre-accession programme,which provides significant financing for projectsinvolving environmental (and transport) infrastruc-ture. This contributed to the high level of assistanceobserved that year.
Analysis demonstrates that the international financialinstitutions and the EC played a crucial role in channellingassistance for environmental projects to the candidatecountries , in all providing around 91 percent of the totalexternal contributions to investment in the region. At thesame time, the importance of bilateral donors’ contribu-tions to the so-called first-round accession countriesgradually decreased. However it is too early to confirmwhether or not this is a long-term trend. At the same time,in the SEE region bilateral donors apparently played amore significant role, providing almost 57 percent of thetotal external assistance. Yet, due to the lack of data, itwas not possible to estimate the contributions of the ECover this period, and this could significantly change thebalance between different donors.
External assistance for the environment accountedfor almost 0.9 percent of GDP in Latvia but only 0.1percent in Slovenia. A similar range was observed in theSEE countries, where contributions to Albaniaaccounted for almost 0.9 percent of GDP but only 0.2percent in Serbia and Montenegro. In per capita terms,the analysis demonstrated a major difference betweenthe levels of contributions channelled to the tworegions. In the candidate countries the highest percapita assistance was provided to Estonia and Latvia(EUR 25.5 and 21.5 million, respectively). In the SEEregion per capita assistance was the highest inMacedonia (EUR 11.4 million). At the same time, in thecandidate countries the lowest level of assistance wasEUR 5.3 million in Slovakia, and in the SEE only EUR 1.9million in Serbia and Montenegro.
In order to help improve the level and effective-ness of environmental financing from both domesticand international sources in the future, a number ofoptions have been identified. These options areaddressed to different stakeholders, including govern-ments, local authorities, industry, internationalfinancial institutions and the donor community. Theyfocus on ways of increasing levels of investment, of
utilising investment more efficiently, of co-ordinatingsources of financing, of increasing absorptioncapacity, of involving the private sector and of movingcloser towards full cost recovery and compliance withthe polluter pays principle.
There are several recommendations for courses ofaction to be undertaken by different stakeholders.
Recommendations for the candidate countriesgovernments include:
• Revisions of estimates of investment needs are neededin order to assess the real investment needs within thedirectives’ deadlines in general and granted transition-al periods in particular.
• Clearly defined financial strategies and lists of priorityprojects need to be developed in order both to attractdonors and to use the available funding more efficient-ly. For the first-wave accession countries, financialstrategies will facilitate the absorption of increased lev-els of post-accession assistance of structural and cohe-sion funds. By developing appropriate financing strate-gies, the second-wave accession countries (Bulgariaand Romania) will be better able to justify requests fortransitional periods in the course of their negotiations,and to absorb increased pre-accession funding e.g.through the Instrument for Structural Policies for Pre-accession (ISPA).
• Further harmonisation of statistical systems with theStatistical Office for the European Communities(Eurostat) needs to be achieved in order to trackchanges in levels and trends of environmental expen-diture in all countries.
• Further increase of administrative capacity is needed ata national level in order to effectively manage post-accession assistance and additionally increased levelsof pre-accession assistance in Bulgaria and Romania.
• Administrative capacity at regional and local levelsneeds to be strengthened in order to absorb interna-tional assistance. In the case of the first-wave accessioncountries, this will leverage absorption of the increasedamounts of assistance channelled through cohesionand structural funds. In the case of second round acces-sion countries, it will initially help to absorb pre-acces-sion funds to followed by post-accession assistance.
• Training for all levels of administration needs to be pro-vided by governments in order to create favourableconditions for managing environmental investmentprojects e.g. financial evaluation, tendering, and pro-ject management involving the private sector.
• Minimising the risk of involvement for the private sec-tor needs to be tackled by governments. It can be donefor example through a more clearly defined legal andadministrative framework for public private partner-ship projects, or by training in development, imple-mentation and management of public private partner-ship projects.
E X E C U T I V E S U M M A R Y
E N V I R O N M E N TA L F I N A N C I N G I N C E N T R A L A N D E A S T E R N E U R O P E 11
• Further support is needed for the private sector inorder to create better conditions for the private sectorto be involved in environmental projects. It can bedone for example through providing training inrequirements of post-accession assistance and differenttypes of public private partnerships etc.
Recommendations for the SEE governments include:
• Investment needs have to be estimated by govern-ments in order to design credible financial strategies.
• Domestic financing mechanisms need to be developedby governments in order to support environmentalexpenditure mainly in environmental infrastructuredevelopment. This can be done for example throughthe creation of environmental funds, or by the intro-duction and strengthening, as well as enforcement ofeconomic instruments.
• Clearly defined financing strategies and lists of priorityprojects need to be developed primarily in order touse investment more efficiently, and secondly toattract donors.
• Administrative capacity at the national level and atregional and local levels needs to be improved in orderto absorb the assistance channelled to the countries ofthe region and as a precondition for development ofdomestic financial mechanisms. This can be done forexample through improving training in project prepara-tion, implementation and monitoring as well as by adopt-ing donors’ administrative and reporting requirements.
• There needs to be better co-ordination of activitiesbetween institutions within the countries, especially inthose countries that are divided into entities, andwhere environmental investment is handled by differ-ent ministries.
• Support is needed for the emerging domestic eco-industries market (including; national consulting com-panies providing technical assistance in the projectpreparation phase as well as national companies sup-plying environmental equipment for infrastructure pro-jects) in order to implement infrastructure projects in amore effective and efficient way and to ensure the trans-fer of the best technologies. Additionally, developmentof eco-industries has a positive effect on the reductionof unemployment. It can be done for example throughcreating a favourable taxation for eco-industry compa-nies, establishing national/international exhibitions orby creating favourable conditions for joint ventures.
• Support is needed for the development of collectionsystems of data on environmental expenditure in orderto track the levels and trends of environmental expen-diture in the countries.
• Minimising the risk of involvement of the private sectorneeds to be tackled by governments. This can be donefor example through a more clearly defined legal andadministrative framework for public private partner-ship projects, or by training in the development, imple-mentation and management of such projects.
Recommendations for the private sector include:
• There is a need for increased involvement of commer-cial banks in supporting private companies investing inenvironmental infrastructure projects.
• Training for private sector companies is needed inorder to better assess how to improve risk managementas well as to more effectively identify future opportuni-ties to be involved in public infrastructure projects.
• Further improvement of environmental standards byindustry is needed. It can be done for example throughintroducing the Eco-Management and Audit Scheme orISO 14,000, or supporting industry with the training.
Recommendations for donors and IFIs include:
• International assistance needs to be better co-ordi-nated by donors in order to target countries’ nation-al priorities more effectively. With the increased lev-els of post-accession assistance from the EU donorsneed to re-focus their assistance, for example, on theSEE countries.
• Involvement of international financial institutions intechnical assistance is needed (including funding feasi-bility studies, funding technical assistance or extendinga guarantee on behalf of the recipient country etc) inorder to leverage the effect of the provided assistance.
• Donors need to support the SEE countries in develop-ing their domestic financial mechanisms in order toleverage the effect of provided assistance.
• Further work is needed on clearer definitions of frame-works for funding according to the types of projects,types of proponent, absolute level of funding, specificrequirements of co-funding as well as rules relating toprivate sector involvement etc.
E X E C U T I V E S U M M A R Y
12 E N V I R O N M E N TA L F I N A N C I N G I N C E N T R A L A N D E A S T E R N E U R O P E
This ReportThe Secretariat of the Central and Eastern Europe
(CEE) Sub-programme of the Task Force for implemen-tation of the Environmental Action Programme based inthe Regional Environmental Center (REC) for Centraland Eastern Europe has prepared this report, asrequested by the Aarhus Ministerial Declaration (seeparagraph 53 of the Ministerial Declaration). The reportis to be submitted as a category II document for the fifthministerial conference Environment for Europe whichwill take place in Kiev, in May 2003.
The main objective of the report is to present trendsand levels of environmental financing from 1996-2001;to discuss future options of environmental financing inSouth Eastern Europe (SEE) and in the European Unioncandidate countries of Central and Eastern Europe, aswell as to identify the possible steps to improve thelevels and effectiveness of environmental financing.
Thus this report needs to:
• present the trends in environmental expenditureand financing from domestic sources,
• present the trends in environmental commitmentsfrom international sources,
• identify options of environmental financing in thecandidate countries and SEE.
The report is also regarded as being of generalinterest to institutions and other bodies and individualsinterested in environmental financing.
Environment for Europe ProcessThe first ministerial conference within the
Environment for Europe process was held in 1991 atDobris Castle in the former Czechoslovakia. The confer-ence discussed ways of strengthening cooperation to
protect and improve the environment, as well as long-term strategies toward an environmental actionprogramme for Europe.
Environmental financing has been on the agendaof the Environment for Europe process since thesecond ministerial conference held in Lucerne in1993. The second conference focused on externalsources of environmental financing, although theparticipants acknowledged that the largest proportionof financing for environmental investment in CEE, andin Eastern Europe, the Caucasus and Central Asia(EECCA), would be derived from the countries them-selves. Discussions highlighted the importance ofsetting priorities, strengthening of local financinginstitutions, efficient use of scarce resources and ofusing external financing as a catalyst to leveragedomestic financing.
At the third ministerial conference in Sofia in 1995it was acknowledged that demand for environmentalfinancing was still low throughout the region. It wasrecognised that the major obstacles to increased envi-ronmental financing were more closely related to thehigh price of commercial financing, limitations on flex-ibility and low absorption capacity rather than to thelack of financing itself. Thus discussions focused onthe development of flexible financing mechanismsand soft financing.
At the Aarhus conference in 1998 it was recognisedthat there was a need to increase the focus on EECCA,as the gap between environmental financing levelsthere and in the candidate countries had becomeevident. Developments in environmental financing inthe candidate countries were increasingly driven by EUaccession and directive implementation. For the coun-tries of EECCA there were no equivalent motivatingfactors or clear goals for environmental development.Some improvements were significant, but these wereexceptions. The Aarhus conference provided the venuefor refocusing the implementation of the Environmental
E N V I R O N M E N TA L F I N A N C I N G I N C E N T R A L A N D E A S T E R N E U R O P E 13
Chapter 1Background and Introduction
Action Programme implementation task force. Its activi-ities would shift from the candidate countries to theEECCA, with particular emphasis on integrating envi-ronmental concerns into economic development,strengthening capacity for environmental financing andfocusing on public private partnerships.
In 2000, the ministries of environment of SEE1
countries, which were members of the Stability Pactfor SEE, designed and endorsed the RegionalEnvironmental Reconstruction Programme (REReP)for SEE. The programme reflects the SEE govern-ments’ commitment to integrate environmentalconsiderations into the regional reconstructionprocess. Within its framework the donor communityprovides funding to specific projects in environmentalpriority areas2.
The Environment for Europe Process resulted in astrong analytical work on developments in environ-mental financing in the regions. Regular reporting onexternal funding (donors and international financialinstitutions) together with new methods of accountingfor domestic environmental financing provided valu-able information for this report.
Scope of the ReportIn this report environmental financing has been
analysed only in the beneficiary countries of the REC.These are:
• The EU candidate countries of CEE: Bulgaria, theCzech Republic, Estonia, Hungary, Latvia, Lithuania,Poland, Romania, Slovakia and Slovenia.
• SEE countries: Albania, Bosnia and Herzegovina(Federation of Bosnia and Herzegovina and RepublicaSrbska), Croatia, FYR Macedonia, Serbia andMontenegro (Republic of Montenegro, Republic ofSerbia and Kosovo [Territory Currently Under UNAdministration]).
Environmental financing from the following sourceshas been analysed in this report:
• total environmental expenditure in the region;
• national sources of finance for environmental pro-jects (public and private);
• international environmentally related assistance(including assistance from bilateral donors, theEuropean Commission and international financialinstitutions); andThe main focus in this report has been placed on
expenditure on environmental investment projects.
ApproachPresentation of environmental financing data can be
made in a number of different ways. The difference inthe approach can have significant effects on the conclu-sions and recommendations for the future.
Therefore it is crucial to present our approach inregard to conducting the study, the sources of data andmajor limitations involved.
While preparing the report the project team under-took the following steps:
• collected data from domestic and internationalsources;
• presented trends in environmental financing; and
• identified options for future courses of action.
The data have been collected from internationaldatabases, international financial institutions and donorcountries. National official statistics were obtained fromcountries that do not report to international databases.The data have been cross-referenced where possible,and institutions and countries that are members of theEnvironmental Action Programme Task Force, havebeen requested to clarify country-specific data.
The report follows the internationally agreedsystems of environmental expenditure where availabledata allowed. The details of the inherent limitations aredescribed in the sections below.
It must be noted that although the report covers theperiod 1996-2001, the data presented often cover onlythe period 1996-2000 due to the lack of more recentinformation.
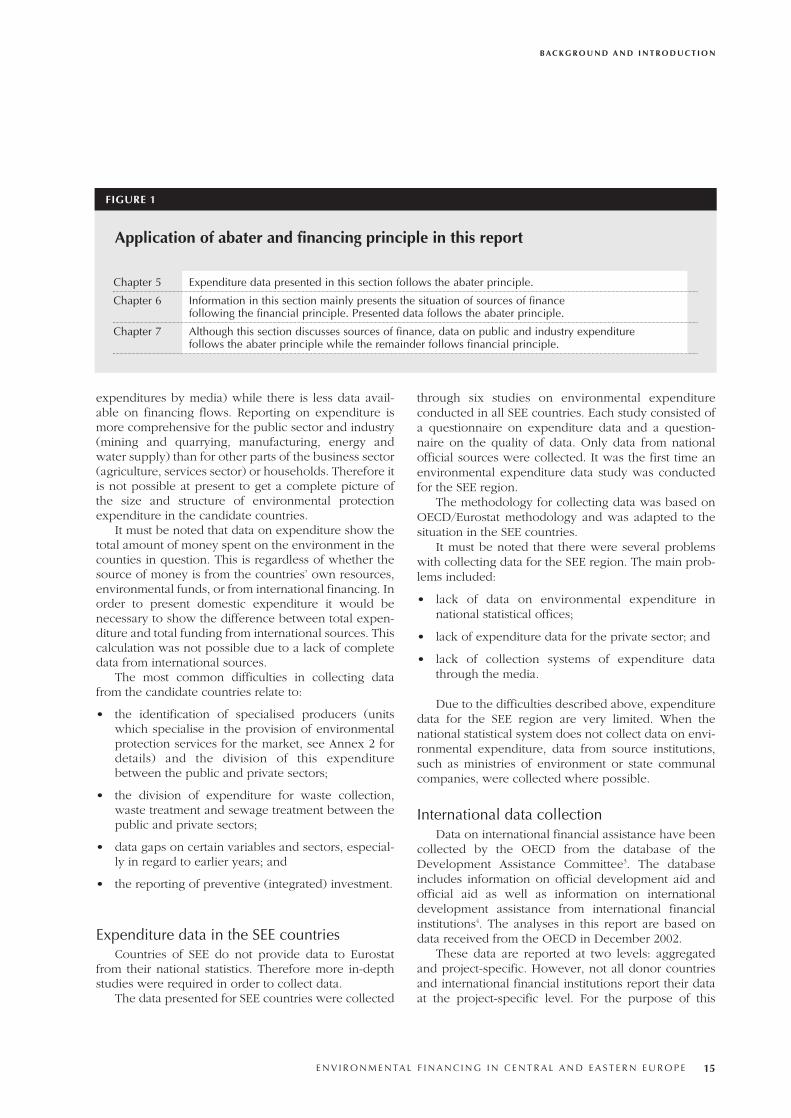
In this report data and information presentedfollows abater and financial principles (for details onthe aforementioned principles see Annex 2).
Our approach toward the above-mentioned princi-ples is summarised in figure 1.
Expenditure data in the candidate countriesThe data presented for candidate countries refer to
statistics on environmental protection expenditureproduced by the Statistical Office for the EuropeanCommunities (Eurostat), collected from national statis-tics of countries through Organisation for EconomicCooperation and Development (OECD)/Eurostat JointQuestionnaire 2002. A detailed methodologicalapproach and definitions used in the questionnaire aredescribed in Annex 2.
In the candidate countries statistics on environ-mental protection expenditure are under developmentand the availability and quality of data still variesbetween countries. In general, data quality pertaining torecent years is the most reliable. More data is availableon how money was spent (expenditure types and
B AC K G R O U N D A N D I N T R O D U C T I O N
14 E N V I R O N M E N TA L F I N A N C I N G I N C E N T R A L A N D E A S T E R N E U R O P E
expenditures by media) while there is less data avail-able on financing flows. Reporting on expenditure ismore comprehensive for the public sector and industry(mining and quarrying, manufacturing, energy andwater supply) than for other parts of the business sector(agriculture, services sector) or households. Therefore itis not possible at present to get a complete picture ofthe size and structure of environmental protectionexpenditure in the candidate countries.
It must be noted that data on expenditure show thetotal amount of money spent on the environment in thecounties in question. This is regardless of whether thesource of money is from the countries’ own resources,environmental funds, or from international financing. Inorder to present domestic expenditure it would benecessary to show the difference between total expen-diture and total funding from international sources. Thiscalculation was not possible due to a lack of completedata from international sources.
The most common difficulties in collecting datafrom the candidate countries relate to:
• the identification of specialised producers (unitswhich specialise in the provision of environmentalprotection services for the market, see Annex 2 fordetails) and the division of this expenditurebetween the public and private sectors;
• the division of expenditure for waste collection,waste treatment and sewage treatment between thepublic and private sectors;
• data gaps on certain variables and sectors, especial-ly in regard to earlier years; and
• the reporting of preventive (integrated) investment.
Expenditure data in the SEE countriesCountries of SEE do not provide data to Eurostat
from their national statistics. Therefore more in-depthstudies were required in order to collect data.
The data presented for SEE countries were collected
through six studies on environmental expenditureconducted in all SEE countries. Each study consisted ofa questionnaire on expenditure data and a question-naire on the quality of data. Only data from nationalofficial sources were collected. It was the first time anenvironmental expenditure data study was conductedfor the SEE region.
The methodology for collecting data was based onOECD/Eurostat methodology and was adapted to thesituation in the SEE countries.
It must be noted that there were several problemswith collecting data for the SEE region. The main prob-lems included:
• lack of data on environmental expenditure innational statistical offices;
• lack of expenditure data for the private sector; and
• lack of collection systems of expenditure datathrough the media.
Due to the difficulties described above, expendituredata for the SEE region are very limited. When thenational statistical system does not collect data on envi-ronmental expenditure, data from source institutions,such as ministries of environment or state communalcompanies, were collected where possible.
International data collectionData on international financial assistance have been
collected by the OECD from the database of theDevelopment Assistance Committee3. The databaseincludes information on official development aid andofficial aid as well as information on internationaldevelopment assistance from international financialinstitutions4. The analyses in this report are based ondata received from the OECD in December 2002.
These data are reported at two levels: aggregatedand project-specific. However, not all donor countriesand international financial institutions report their dataat the project-specific level. For the purpose of this
B AC K G R O U N D A N D I N T R O D U C T I O N
E N V I R O N M E N TA L F I N A N C I N G I N C E N T R A L A N D E A S T E R N E U R O P E 15
Application of abater and financing principle in this report
FIGURE 1
Chapter 5 Expenditure data presented in this section follows the abater principle.
Chapter 6 Information in this section mainly presents the situation of sources of finance following the financial principle. Presented data follows the abater principle.
Chapter 7 Although this section discusses sources of finance, data on public and industry expenditure follows the abater principle while the remainder follows financial principle.
report the OECD has additionally requested majordonors and international financial institutions active inboth regions to update information specifically relatedto environmental assistance. Further information on themethodology of data collection applied by the OECDcan be found in Annex 2 and 3.
In the case of environmentally related assistanceprovided by the European Commission (EC), apart fromusing the data collected by the OECD, authors of thisreport gathered information from the EuropeanCommission’s EuropeAid Cooperation Office projectdatabase and the European Commission’s annualreports on assistance programmes.
Further information on the methodology of datacollection can be also found in Annex 2.
The data on international environmental assistanceanalysed in this report, are reported based on commit-ments not disbursements. Due to the fact thatcommitments might be postponed or even cancelled,their value can significantly differ from the amount ofassistance which a recipient country actually received.Hence the figures reflecting commitments are oftenoverestimated. Another issue related to the analysis ofcommitments is their comparison with macroeconomicindicators, e.g. gross domestic product (GDP). Thelatter reflects expenditure in specific years, whereascommitments provided in one year may involvedisbursements over several years or may not bedisbursed at all5.
Recipients of official assistance (OA) covered by thisreport are: Bulgaria, the Czech Republic, Estonia,Hungary, Latvia, Lithuania, Poland, Romania, Slovakiaand Slovenia.
Recipients of official development assistance (ODA)covered by this report are: Albania, Bosnia andHerzegovina, Croatia, FYR Macedonia and Serbia andMontenegro including Kosovo.
While gathering the data on international environ-mental assistance two major obstacles were identified:
• First the EC does not have a comprehensive databaseon its environmental assistance; existing databaseseither do not include all programmes within whichassistance for the environment was provided such asPhare, Phare Cross Border Cooperation, PhareMultibeneficiary and others (concerns assistance tothe candidate countries), or do not differentiate chan-nelled assistance between different sectors, such asthe environment. This is true of assistance to the SEE.
• Secondly, although all major donors and internation-al financial institutions provided updated data oncommitments for environmental assistance, not all ofthem provided project-specific information; as aresult data at the project level accounts for about 60percent of the total environmental assistance;
Report StructureThe report is structured as follows:
• Chapter 1 presents background information aboutthis report and the adopted approach.
• Chapter 2 presents information about the politicaland economic situations in the countries.
• Chapter 3 presents information about major envi-ronmental issues in the countries.
• Chapter 4 discusses the need for investment in thecountries.
• Chapter 5 presents the expenditure data in the EUcandidate states of CEE.
• Chapter 6 describes the environmental financingsituation in the SEE countries.
• Chapter 7 discusses public and private sources offinancing in the countries.
• Chapter 8 presents international environmentalassistance provided to the countries.
• Chapter 9 presents key conclusions for all countries.
• Chapter 10 discusses options for the future.
• Chapter 11 presents recommendations for thefuture action.
Endnotes1 In a regional environmental reconstruction programme context SEE coun-tries include Albania, Bosnia and Herzegovina, Bulgaria, Croatia, FYRMacedonia, Romania, Serbia and Montenegro and Kosovo (currently underUN interim administration). In an analysis SEE excludes Bulgaria andRomania as these countries are discussed in an accession context and areincluded in the candidate country sections. In this study, SEE countriesexcluding Bulgaria and Romania are termed the SEE countries.
2 Initially there were five priority areas within the REReP: (1) institutionalstrengthening and policy development, (2) environmental civil societybuilding, (3) emergency assistance for environmental infrastructure andremediation of war damage, (4) reinforcement of existing cooperativemechanisms and structures, and development of regional cross-border pro-jects, and (5) support to priority national and local environmental projects.(In 2001 the priority areas were revised reflecting the new political situa-tion in the region in relation to the stabilisation and association process andconsist of: institution building, support to environmental civil society, sup-port to existing environmental regional co-operation mechanisms and crossborder projects as well as the reduction of environmental health threats.)
3 The OECD’s Development Assistance Committee is the principal bodythrough which the Organisation deals with issues related to cooperationwith developing countries. The Development Assistance Committee is oneof the key forums in which the major bilateral donors work together toincrease the effectiveness of their common efforts to support sustainabledevelopment. The Development Assistance Committee comprises 22 donorcountries and the EC. OECD website 2002
B AC K G R O U N D A N D I N T R O D U C T I O N
16 E N V I R O N M E N TA L F I N A N C I N G I N C E N T R A L A N D E A S T E R N E U R O P E
4 Official development assistance and official assistance are defined as aidflows to developing countries and countries in transition (see List ofAbbreviations for detailed list of countries). To qualify as official develop-ment assistance/official assistance, a transaction must be (a) undertaken bythe official sector; (b) with promotion of economic development and wel-fare as the main objective; (c) with concessional financial terms (in the caseof loans a grant element must account for at least 25 percent). In additionto financial flows, technical cooperation is included in aid. Grants, loansand credits for military purposes are excluded. Transfer payments to privateindividuals (e.g. pensions, reparations or insurance payouts) are in generalnot counted. Data are collected annually from the members of the OECD’sDevelopment Assistance Committee. OECD website 2002
5 OECD 2002
B AC K G R O U N D A N D I N T R O D U C T I O N
E N V I R O N M E N TA L F I N A N C I N G I N C E N T R A L A N D E A S T E R N E U R O P E 17

18 E N V I R O N M E N TA L F I N A N C I N G I N C E N T R A L A N D E A S T E R N E U R O P E
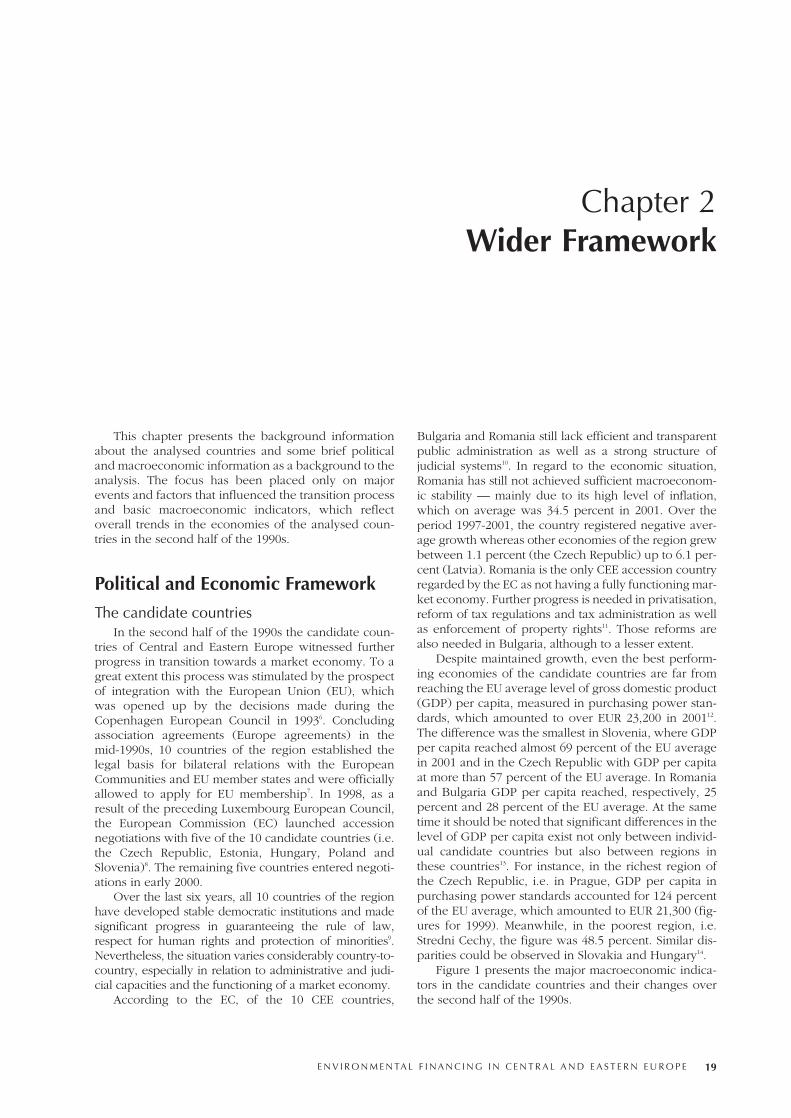
This chapter presents the background informationabout the analysed countries and some brief politicaland macroeconomic information as a background to theanalysis. The focus has been placed only on majorevents and factors that influenced the transition processand basic macroeconomic indicators, which reflectoverall trends in the economies of the analysed coun-tries in the second half of the 1990s.
Political and Economic Framework
The candidate countriesIn the second half of the 1990s the candidate coun-
tries of Central and Eastern Europe witnessed furtherprogress in transition towards a market economy. To agreat extent this process was stimulated by the prospectof integration with the European Union (EU), whichwas opened up by the decisions made during theCopenhagen European Council in 19936. Concludingassociation agreements (Europe agreements) in themid-1990s, 10 countries of the region established thelegal basis for bilateral relations with the EuropeanCommunities and EU member states and were officiallyallowed to apply for EU membership7. In 1998, as aresult of the preceding Luxembourg European Council,the European Commission (EC) launched accessionnegotiations with five of the 10 candidate countries (i.e.the Czech Republic, Estonia, Hungary, Poland andSlovenia)8. The remaining five countries entered negoti-ations in early 2000.
Over the last six years, all 10 countries of the regionhave developed stable democratic institutions and madesignificant progress in guaranteeing the rule of law,respect for human rights and protection of minorities9.Nevertheless, the situation varies considerably country-to-country, especially in relation to administrative and judi-cial capacities and the functioning of a market economy.
According to the EC, of the 10 CEE countries,
Bulgaria and Romania still lack efficient and transparentpublic administration as well as a strong structure ofjudicial systems10. In regard to the economic situation,Romania has still not achieved sufficient macroeconom-ic stability — mainly due to its high level of inflation,which on average was 34.5 percent in 2001. Over theperiod 1997-2001, the country registered negative aver-age growth whereas other economies of the region grewbetween 1.1 percent (the Czech Republic) up to 6.1 per-cent (Latvia). Romania is the only CEE accession countryregarded by the EC as not having a fully functioning mar-ket economy. Further progress is needed in privatisation,reform of tax regulations and tax administration as wellas enforcement of property rights11. Those reforms arealso needed in Bulgaria, although to a lesser extent.
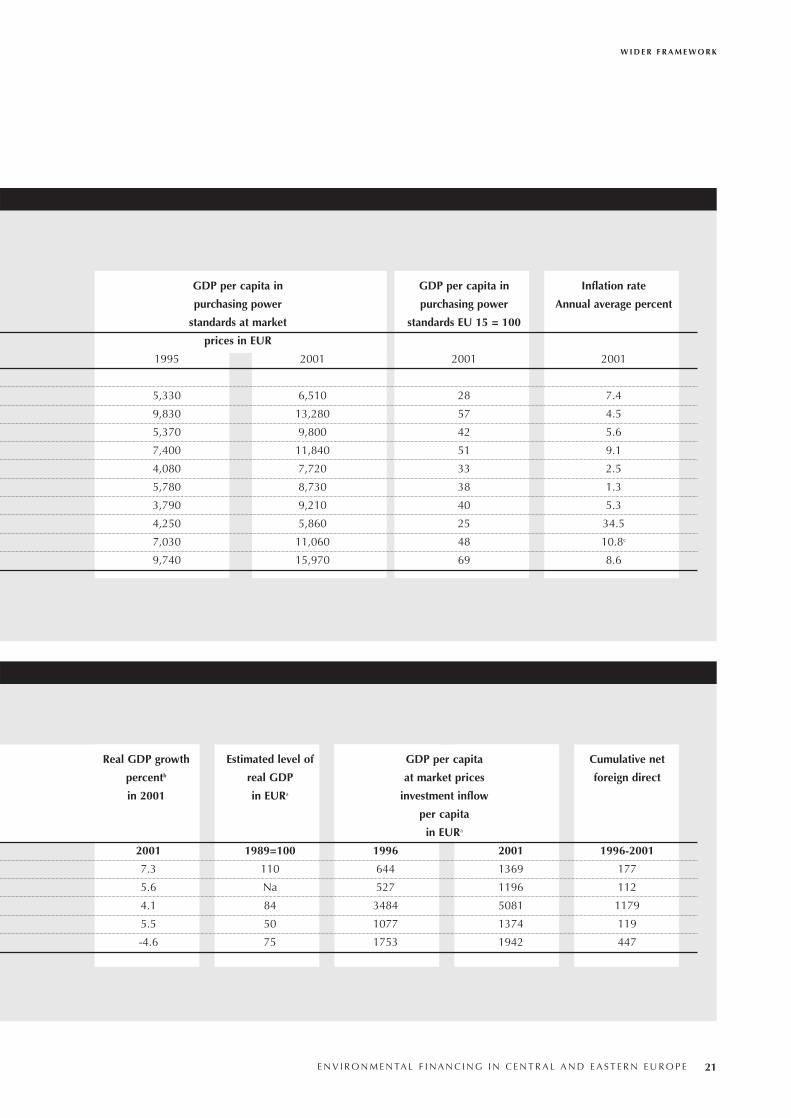
Despite maintained growth, even the best perform-ing economies of the candidate countries are far fromreaching the EU average level of gross domestic product(GDP) per capita, measured in purchasing power stan-dards, which amounted to over EUR 23,200 in 200112.The difference was the smallest in Slovenia, where GDPper capita reached almost 69 percent of the EU averagein 2001 and in the Czech Republic with GDP per capitaat more than 57 percent of the EU average. In Romaniaand Bulgaria GDP per capita reached, respectively, 25percent and 28 percent of the EU average. At the sametime it should be noted that significant differences in thelevel of GDP per capita exist not only between individ-ual candidate countries but also between regions inthese countries13. For instance, in the richest region ofthe Czech Republic, i.e. in Prague, GDP per capita inpurchasing power standards accounted for 124 percentof the EU average, which amounted to EUR 21,300 (fig-ures for 1999). Meanwhile, in the poorest region, i.e.Stredni Cechy, the figure was 48.5 percent. Similar dis-parities could be observed in Slovakia and Hungary14.
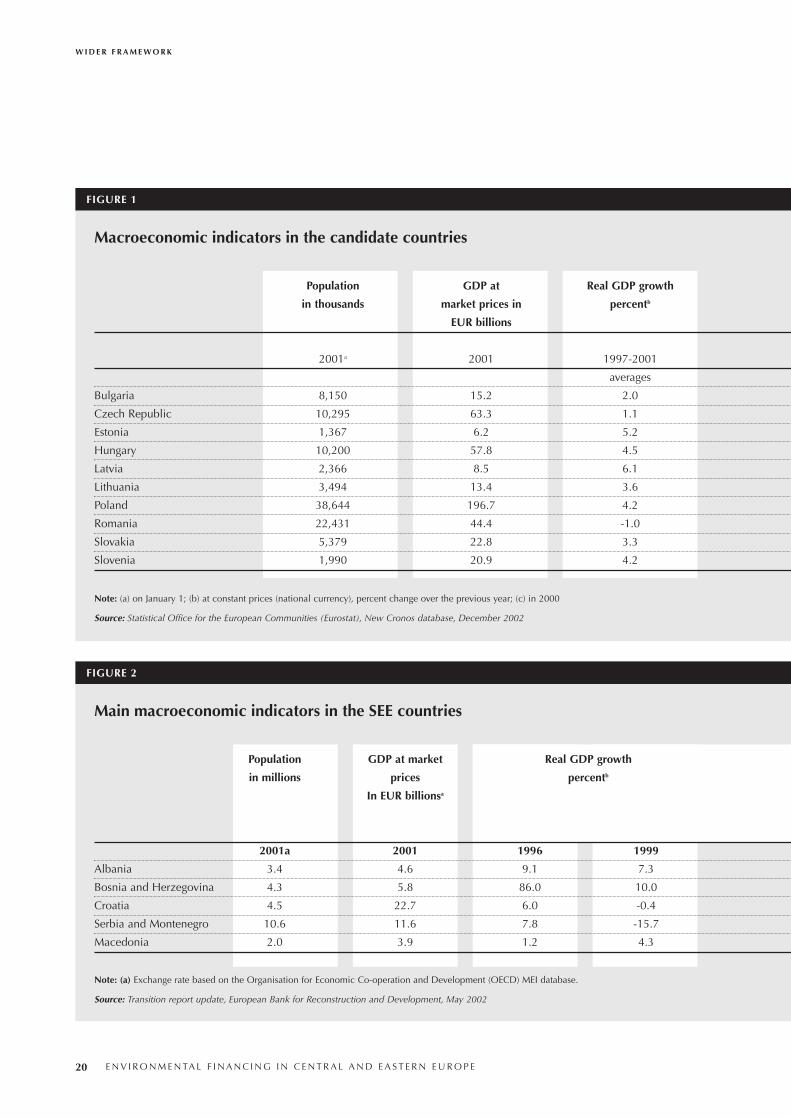
Figure 1 presents the major macroeconomic indica-tors in the candidate countries and their changes overthe second half of the 1990s.
E N V I R O N M E N TA L F I N A N C I N G I N C E N T R A L A N D E A S T E R N E U R O P E 19
Chapter 2Wider Framework
W I D E R F R A M E W O R K
20 E N V I R O N M E N TA L F I N A N C I N G I N C E N T R A L A N D E A S T E R N E U R O P E
Macroeconomic indicators in the candidate countries
FIGURE 1
Population GDP at Real GDP growth
in thousands market prices in percentb
EUR billions
2001a 2001 1997-2001
averages
Bulgaria 8,150 15.2 2.0
Czech Republic 10,295 63.3 1.1
Estonia 1,367 6.2 5.2
Hungary 10,200 57.8 4.5
Latvia 2,366 8.5 6.1
Lithuania 3,494 13.4 3.6
Poland 38,644 196.7 4.2
Romania 22,431 44.4 -1.0
Slovakia 5,379 22.8 3.3
Slovenia 1,990 20.9 4.2
Note: (a) on January 1; (b) at constant prices (national currency), percent change over the previous year; (c) in 2000
Source: Statistical Office for the European Communities (Eurostat), New Cronos database, December 2002
Main macroeconomic indicators in the SEE countries
FIGURE 2
Population GDP at market Real GDP growth
in millions prices percentb
In EUR billionsa
2001a 2001 1996 1999
Albania 3.4 4.6 9.1 7.3
Bosnia and Herzegovina 4.3 5.8 86.0 10.0
Croatia 4.5 22.7 6.0 -0.4
Serbia and Montenegro 10.6 11.6 7.8 -15.7
Macedonia 2.0 3.9 1.2 4.3
Note: (a) Exchange rate based on the Organisation for Economic Co-operation and Development (OECD) MEI database.
Source: Transition report update, European Bank for Reconstruction and Development, May 2002
W I D E R F R A M E W O R K
E N V I R O N M E N TA L F I N A N C I N G I N C E N T R A L A N D E A S T E R N E U R O P E 21
GDP per capita in GDP per capita in Inflation rate
purchasing power purchasing power Annual average percent
standards at market standards EU 15 = 100
prices in EUR
1995 2001 2001 2001
5,330 6,510 28 7.4
9,830 13,280 57 4.5
5,370 9,800 42 5.6
7,400 11,840 51 9.1
4,080 7,720 33 2.5
5,780 8,730 38 1.3
3,790 9,210 40 5.3
4,250 5,860 25 34.5
7,030 11,060 48 10.8c
9,740 15,970 69 8.6
Real GDP growth Estimated level of GDP per capita Cumulative net
percentb real GDP at market prices foreign direct
in 2001 in EURa investment inflow
per capita
in EURa
2001 1989=100 1996 2001 1996-2001
7.3 110 644 1369 177
5.6 Na 527 1196 112
4.1 84 3484 5081 1179
5.5 50 1077 1374 119
-4.6 75 1753 1942 447
In October 2002, the EC, recognising differences inthe pace of reforms and level of alignment with EU leg-islation within the group of the 10 candidate countries,recommended that the conclusion of accession negotia-tions be made with only with eight of them15. At thesame time the Commission proposed the preparation ofroadmaps (i.e. guidelines with detailed timetables) forBulgaria and Romania “which would help to advancethe process of accession and support those countries inachieving their objective of membership in 2007”16.
Negotiations with the EC were officially closed witheight countries at the Copenhagen European Council inDecember 2002 and the eight candidate countries weregiven an opportunity of membership from May 1, 2004.
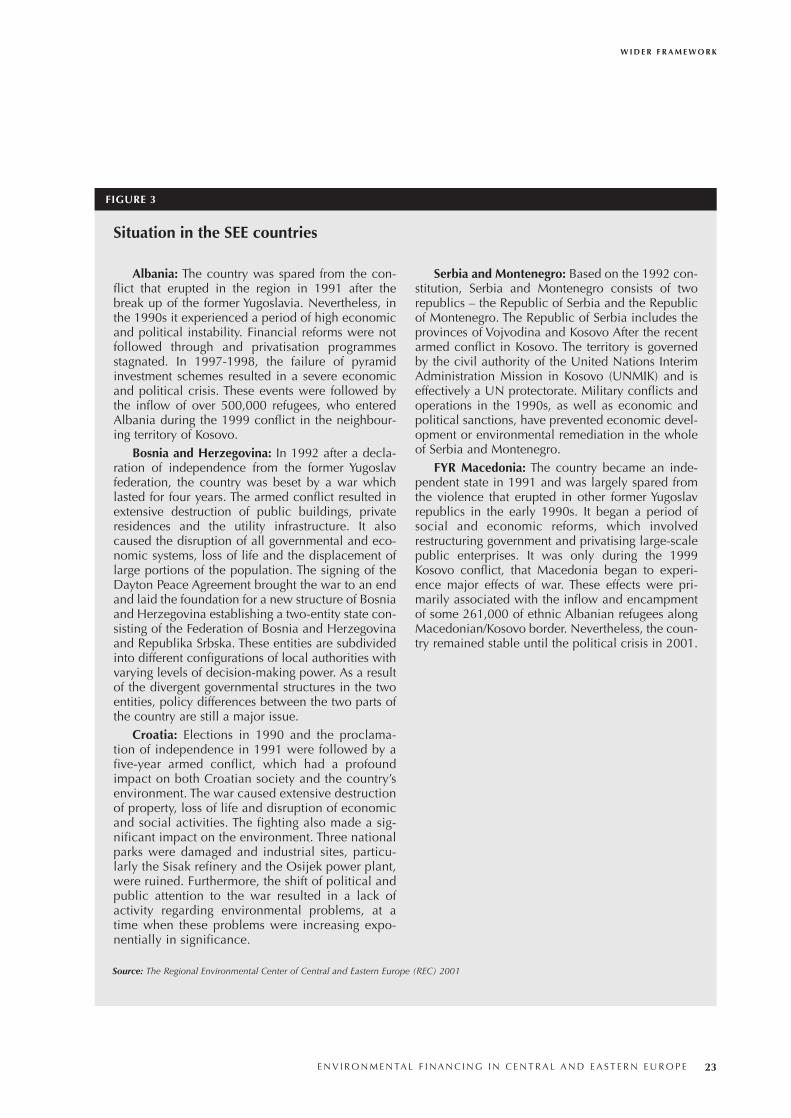
South Eastern Europe (SEE) countriesWhile the candidate countries of CEE continued to
progress in their transition reforms throughout the sec-ond half of the 1990s, the SEE struggled with the lega-cy of the break-up of the former Yugoslavia andnumerous armed conflicts. Today, the region is highlyfragmented and characterised by a complex political,economic and social situation with a large number ofrefugees and displaced persons. Figure 3 gives a shortoverview of the situation in each of the SEE countries.
In 1999, after the armed conflict in Kosovo, the inter-national community, at the EU’s initiative, launched theStability Pact for South Eastern Europe (SEE), whichaimed at strengthening the countries of the region "intheir efforts to foster peace, democracy, respect forhuman rights and economic prosperity in order toachieve regional stability"17. The initiative was addressedto all countries of the SEE as well as Bulgaria andRomania. Serbia and Montenegro was allowed to jointhe Pact only in October 2000, following the collapse ofits autocratic regime and after demonstrating a strongcommitment to implement structural reforms.
In parallel the EU has started the process ofStabilisation and Association in the SEE offering thecountries of the region the prospect of future member-ship. The process consists of two elements, namelyStabilisation and Association agreements (the aims ofwhich are the gradual implementation of a free tradearea and reforms designed to achieve the adoption ofEU standards)18 as well as financial assistance (providingsupport for the reforms and institution building neces-sary to implement the obligations in the agreements;within the framework of the CARDS Programme)19. Theprocess highlights the importance of regional coopera-tion and requires each signatory to conclude a bilateralconvention with other signatories in order to supportthe creation of links between the involved countries20.The first Stabilisation and Association Agreements weresigned with FYR Macedonia, in April 2001, and Croatia,in October 2001 (Croatia’s relations with the EU
improved significantly only after the January 2000Parliamentary and Presidential elections, which broughta change in the country’s leadership).
Despite considerable differences between individualcountries, all SEE states are relatively new democraciesthat need to establish more effective state structures.This includes respect for the rule of law and the eradi-cation of corruption and organised crime, strengtheningpublic administration both on national and local levelsas well as building civil society and supporting an inde-pendent media21.
Since the mid-1990s all countries of the SEE haveregistered overall growth in real GDP, however most ofthem are still far from reaching the level of real GDPfrom 1989. Albania is the only exception, though itshould be noted that the country started its growth froma very low basis. Concerning the level of GDP per capi-ta, there is a significant difference between Croatia,where GDP per capita amounted to over EUR 5,000 in2001, and other countries of the region, where GDP percapita did not exceed the threshold of EUR 2,000, thisbeing the lowest in Bosnia and Herzegovina.
According to the EC opinion, none of the five SEEcountries, not even Croatia, which had the strongesteconomy and was the most advanced in economicreforms, could be considered to have a functioningmarket economy. Though to a different extent, allcountries are characterised by a slow pace of large-scale privatisation, an underdeveloped financial sectorand the lack of a favourable environment for domesticand foreign investment22. Over the period 1996-2001net foreign direct investment inflow per capita rangedfrom around EUR 110-120 in Bosnia and Herzegovinaand Serbia and Montenegro up to almost EUR 1,200 inCroatia. The low level of foreign investment in the for-mer two countries was caused mainly by underdevel-oped legislative frameworks and weak public adminis-tration and judiciary systems, which hamper effectiveimplementation and enforcement of existing commer-cial laws. Figure 2 presents the main macroeconomicindicators in the SEE countries.
Conclusions• In the second half of the 1990s, 10 candidate countries
developed stable democratic institutions and madefurther progress in their transition towards marketeconomies, nevertheless they need to further strength-en their public administration and judicial systems.
• The SEE countries are still relatively new democra-cies that need to establish more effective state struc-tures as well as achieve macroeconomic stability.
W I D E R F R A M E W O R K
22 E N V I R O N M E N TA L F I N A N C I N G I N C E N T R A L A N D E A S T E R N E U R O P E
W I D E R F R A M E W O R K
E N V I R O N M E N TA L F I N A N C I N G I N C E N T R A L A N D E A S T E R N E U R O P E 23
FIGURE 3
Albania: The country was spared from the con-flict that erupted in the region in 1991 after thebreak up of the former Yugoslavia. Nevertheless, inthe 1990s it experienced a period of high economicand political instability. Financial reforms were notfollowed through and privatisation programmesstagnated. In 1997-1998, the failure of pyramidinvestment schemes resulted in a severe economicand political crisis. These events were followed bythe inflow of over 500,000 refugees, who enteredAlbania during the 1999 conflict in the neighbour-ing territory of Kosovo.
Bosnia and Herzegovina: In 1992 after a decla-ration of independence from the former Yugoslavfederation, the country was beset by a war whichlasted for four years. The armed conflict resulted inextensive destruction of public buildings, privateresidences and the utility infrastructure. It alsocaused the disruption of all governmental and eco-nomic systems, loss of life and the displacement oflarge portions of the population. The signing of theDayton Peace Agreement brought the war to an endand laid the foundation for a new structure of Bosniaand Herzegovina establishing a two-entity state con-sisting of the Federation of Bosnia and Herzegovinaand Republika Srbska. These entities are subdividedinto different configurations of local authorities withvarying levels of decision-making power. As a resultof the divergent governmental structures in the twoentities, policy differences between the two parts ofthe country are still a major issue.
Croatia: Elections in 1990 and the proclama-tion of independence in 1991 were followed by afive-year armed conflict, which had a profoundimpact on both Croatian society and the country’senvironment. The war caused extensive destructionof property, loss of life and disruption of economicand social activities. The fighting also made a sig-nificant impact on the environment. Three nationalparks were damaged and industrial sites, particu-larly the Sisak refinery and the Osijek power plant,were ruined. Furthermore, the shift of political andpublic attention to the war resulted in a lack ofactivity regarding environmental problems, at atime when these problems were increasing expo-nentially in significance.
Serbia and Montenegro: Based on the 1992 con-stitution, Serbia and Montenegro consists of tworepublics – the Republic of Serbia and the Republicof Montenegro. The Republic of Serbia includes theprovinces of Vojvodina and Kosovo After the recentarmed conflict in Kosovo. The territory is governedby the civil authority of the United Nations InterimAdministration Mission in Kosovo (UNMIK) and iseffectively a UN protectorate. Military conflicts andoperations in the 1990s, as well as economic andpolitical sanctions, have prevented economic devel-opment or environmental remediation in the wholeof Serbia and Montenegro.
FYR Macedonia: The country became an inde-pendent state in 1991 and was largely spared fromthe violence that erupted in other former Yugoslavrepublics in the early 1990s. It began a period ofsocial and economic reforms, which involvedrestructuring government and privatising large-scalepublic enterprises. It was only during the 1999Kosovo conflict, that Macedonia began to experi-ence major effects of war. These effects were pri-marily associated with the inflow and encampmentof some 261,000 of ethnic Albanian refugees alongMacedonian/Kosovo border. Nevertheless, the coun-try remained stable until the political crisis in 2001.
Situation in the SEE countries
Source: The Regional Environmental Center of Central and Eastern Europe (REC) 2001
Endnotes6 Among others the Council declared that "the associated countries inCentral and Eastern Europe that so desire shall become members of theEuropean Union" and defined conditions of the membership, i.e. the so-called Copenhagen criteria (political, economic and acquis, i.e. ability toimplement and enforce the EU’s legislation).
7 Hungary and Poland applied to join as early as 1994; Bulgaria, Estonia,Latvia, Lithuania, Romania and Slovakia in 1995; the Czech Republic andSlovenia in 1996.
8 That year the EC started negotiations also with Cyprus.
9 EC 2002a
10 EC 2002b
11 EC 2002a, EC 2002b
12 Eurostat, New Cronos database 2002
13 The data that has been presented refers to the regions defined accordingto principles similar to those used in the establishment of the EuropeanCommunity nomenclature of territorial units for statistic the so-calledNUTS.
14 Eurostat op.cit.
15 These countries include the Czech Republic, Estonia, Hungary, Latvia,Lithuania, Poland, the Slovakia and Slovenia as well as Cyprus and Malta.
16 EC 2002b
17 Stability Pact 1999
18 The idea of agreements is based on lessons learnt from implementationof the earlier described Europe agreements
19 CARDS programme Community Assistance for Reconstruction,Development and Stabilisation.
20 EC 2001a, EC 2002c
21 EC 2002c
22 EC 2002c
W I D E R F R A M E W O R K
24 E N V I R O N M E N TA L F I N A N C I N G I N C E N T R A L A N D E A S T E R N E U R O P E
In this chapter environmental status and major envi-ronmental issues have been presented as backgroundinformation for further conducted analysis. Informationis presented separately for the EU candidate countries ofCentral and Eastern Europe (CEE) and also for thenations of South Eastern Europe (SEE).
Candidate CountriesFor the 10 candidate countries the principle envi-
ronmental indicators referring to air quality, watermanagement and waste management have beenanalysed. Detailed tables with data on indicators canbe found in Annex 1.
The economic recession of the early 1990s, whichresulted in a sharp decline of industrial output in all can-didate countries, is said to have been the main factor inthe improvement of the environment in the region sincethe mid 1990s. Political and economic reforms initiatedat that time as well as process of accession with the EUsignificantly contributed to development of environ-mental policies and the generation of resources forinvestment in cleaner and more efficient technologies.Therefore, the role of these factors in the overallimprovement of the state of the environment should notbe underestimated23.
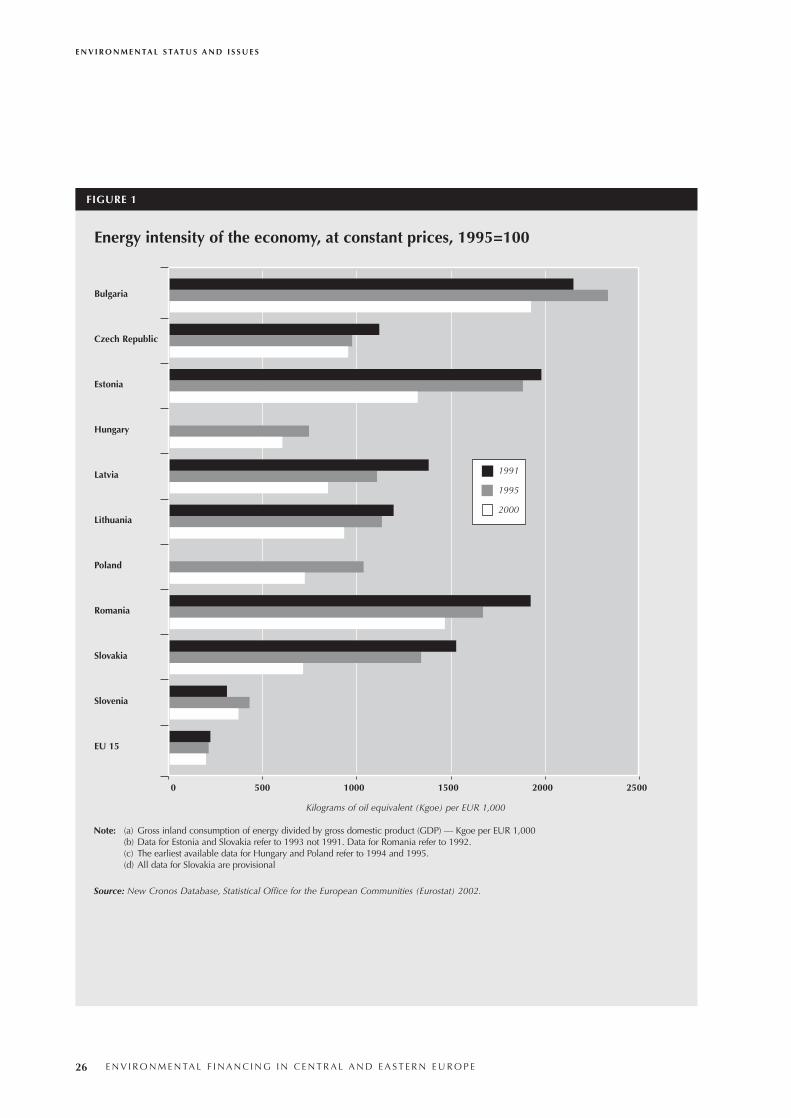
Figure 1 indicates the decreasing energy intensity ofthe candidate country economies over the last six years24.Nevertheless, in 2000, even the least energy intensiveeconomy, i.e. that of Slovenia, used about twice as muchenergy as an average EU member state. The most energyintensive were the economies of Bulgaria and Romania,which used 1,920 and 1,460 kg of oil equivalent per EUR1,000 respectively (i.e. 7.5 to 10 times more than the EUaverage).
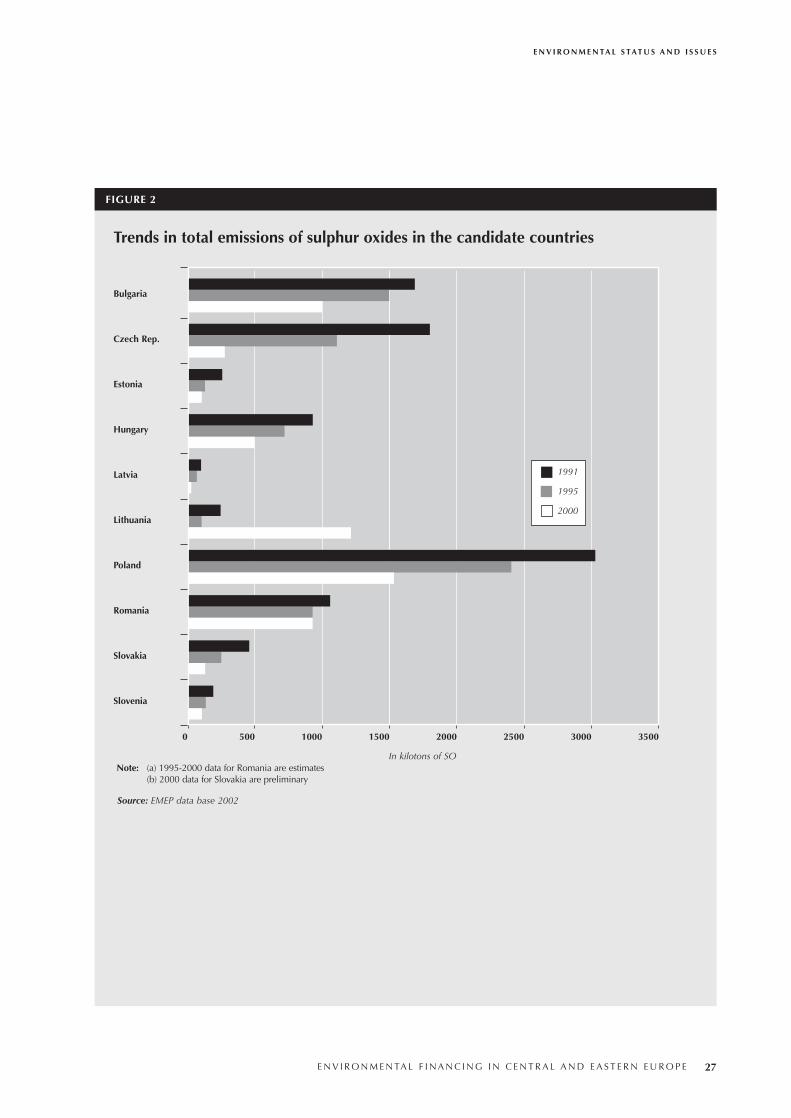
Positive changes in the state of the environmenthave been registered, especially with regard to air qual-ity. For instance, over the period 1991-2000, emissions
of SO2 decreased by 40-50 percent — in Bulgaria,Slovenia, Hungary and Poland — and over 80 percent— in Latvia, Lithuania and the Czech Republic25. Itshould be noted that the majority of the SO2 emissionreduction took place in the period 1995-2000, whichproves that the decrease was to a large extent connect-ed with increased energy efficiency, use better fuels andinvestment in abatement technologies rather then reces-sion and industrial decline26.
Though gaseous emissions decreased significantly,they are still higher per capita than the average for the EUmember states. For instance, at the end of the 1990s SOX
emissions per capita amounted to 120 kg in Bulgaria, 60-70 kg in Hungary and Estonia and 40-50 kg in Romania,Poland and Slovenia, whereas the EU average was 21 kgper capita27. It is expected that air pollution from thetransport sector could worsen. In tandem with economicprogress, all candidate countries registered growth in thenumber of cars and a rapid increase of road traffic, whichresulted in higher emissions of NOX
28.In recent years the CEE candidate countries have
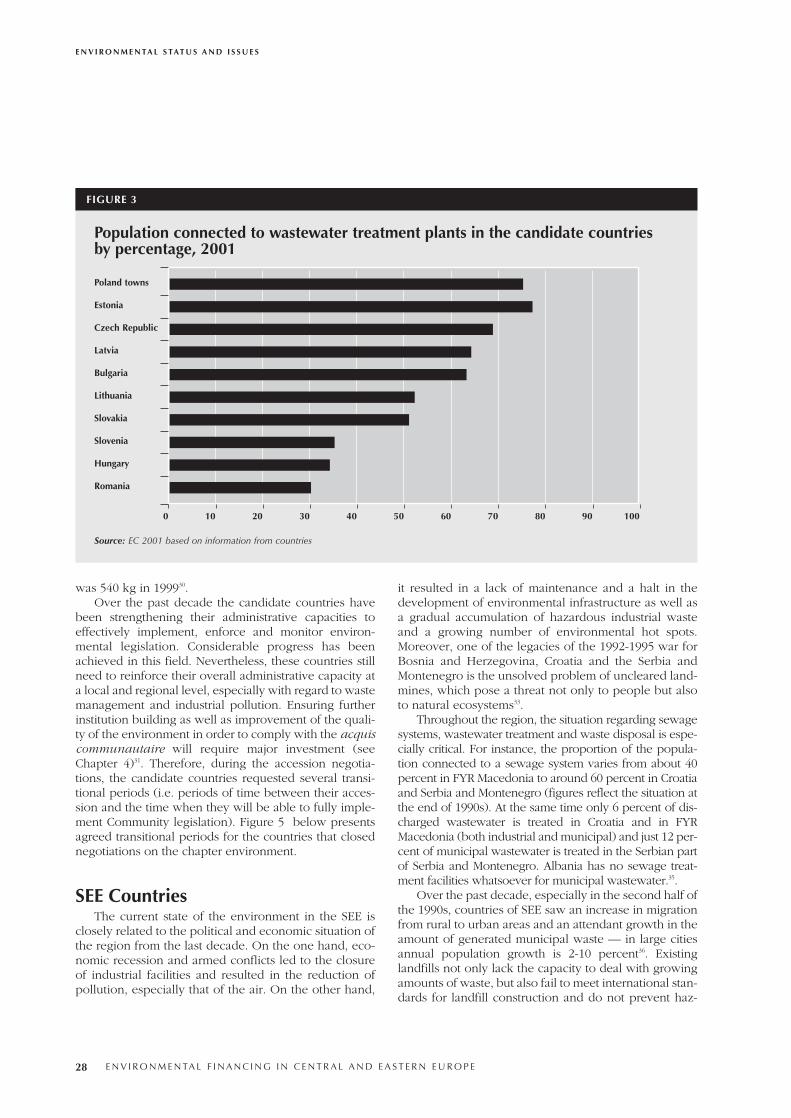
improved their water quality29. This was mainly due tothe increase in the treatment of wastewater. Major invest-ment in this field was closely related to the process ofapproximation with the EU requirements, especiallyconcerning treatment of urban wastewater. In 2001 morethan 60 percent of urban population was connected tothe wastewater treatment plants in Estonia, the CzechRepublic, Latvia and Poland. The percentage was lowerthan 40 percent in Slovenia, Hungary and Romania.Improvements in water quality remain one of the biggestchallenges of candidate countries.
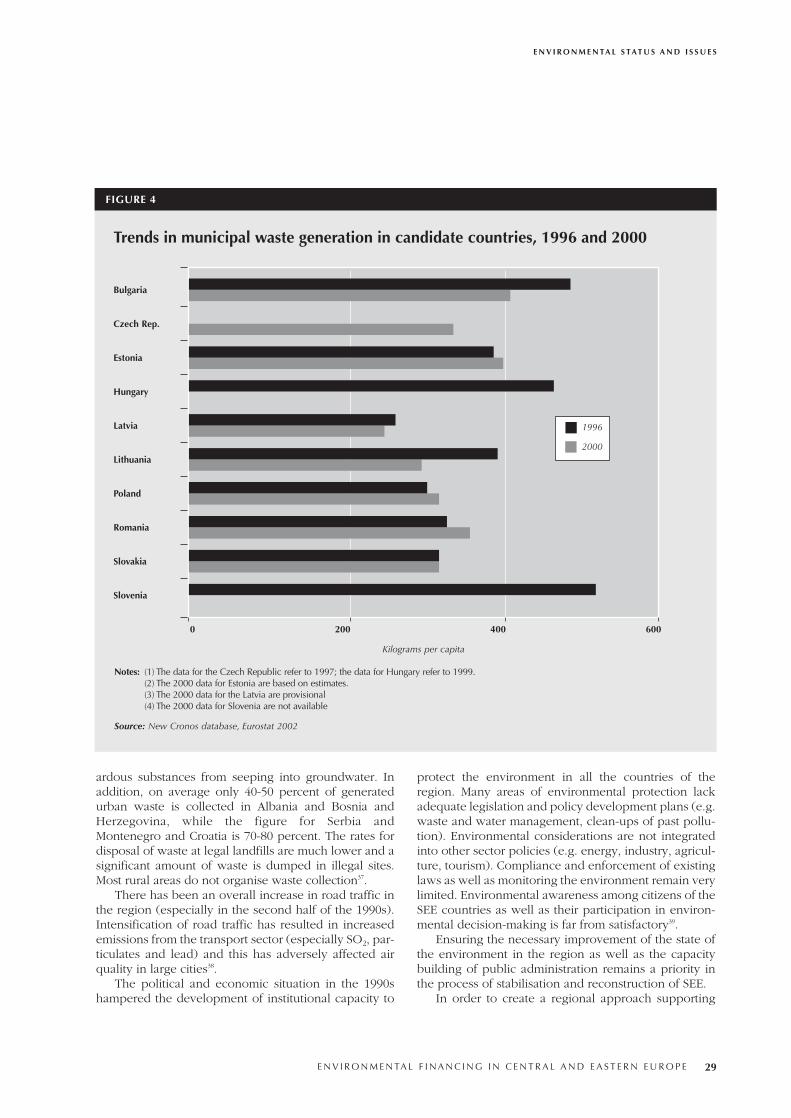
Most candidate countries experienced an increase inthe generation of municipal waste. The Czech Republic,Estonia, Hungary, Poland and Romania saw increases,while Bulgaria, Latvia and Lithuania saw decreases. Thehighest levels of municipal waste generation were inHungary, Bulgaria and Estonia. Municipal waste gener-ation per capita is lower than the EU average, which
E N V I R O N M E N TA L F I N A N C I N G I N C E N T R A L A N D E A S T E R N E U R O P E 25
Chapter 3Environmental Status and Issues
E N V I R O N M E N TA L S TAT U S A N D I S S U E S
26 E N V I R O N M E N TA L F I N A N C I N G I N C E N T R A L A N D E A S T E R N E U R O P E
Energy intensity of the economy, at constant prices, 1995=100
FIGURE 1
Bulgaria
Czech Republic
Estonia
Hungary
Latvia
Lithuania
Poland
Romania
Slovakia
Slovenia
EU 15
Kilograms of oil equivalent (Kgoe) per EUR 1,000
0 500 1000 1500 2000 2500
1991
1995
2000
Note: (a) Gross inland consumption of energy divided by gross domestic product (GDP) — Kgoe per EUR 1,000 (b) Data for Estonia and Slovakia refer to 1993 not 1991. Data for Romania refer to 1992. (c) The earliest available data for Hungary and Poland refer to 1994 and 1995. (d) All data for Slovakia are provisional
Source: New Cronos Database, Statistical Office for the European Communities (Eurostat) 2002.
E N V I R O N M E N TA L S TAT U S A N D I S S U E S
E N V I R O N M E N TA L F I N A N C I N G I N C E N T R A L A N D E A S T E R N E U R O P E 27
Trends in total emissions of sulphur oxides in the candidate countries
FIGURE 2
Bulgaria
Czech Rep.
Estonia
Hungary
Latvia
Lithuania
Poland
Romania
Slovakia
Slovenia
Source: EMEP data base 2002
In kilotons of SO
0 500 1000 1500 2000 2500 3000 3500
1991
1995
2000
Note: (a) 1995-2000 data for Romania are estimates(b) 2000 data for Slovakia are preliminary
was 540 kg in 199930.Over the past decade the candidate countries have
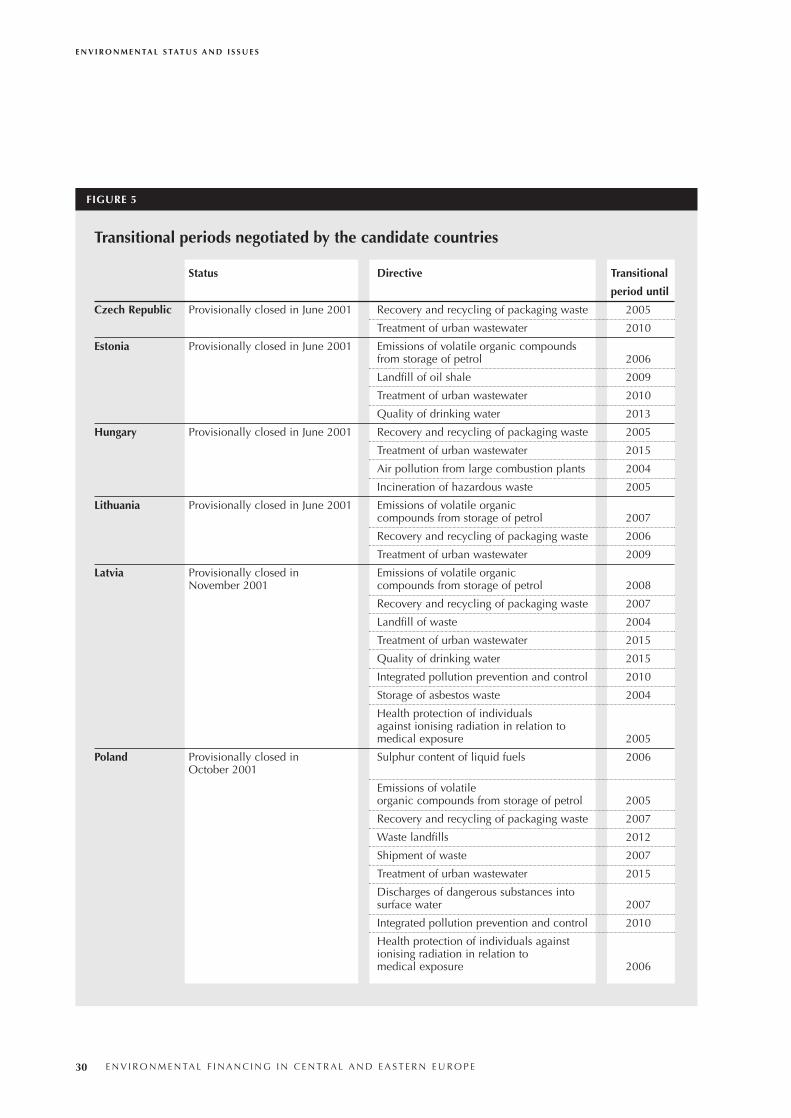
been strengthening their administrative capacities toeffectively implement, enforce and monitor environ-mental legislation. Considerable progress has beenachieved in this field. Nevertheless, these countries stillneed to reinforce their overall administrative capacity ata local and regional level, especially with regard to wastemanagement and industrial pollution. Ensuring furtherinstitution building as well as improvement of the quali-ty of the environment in order to comply with the acquiscommunautaire will require major investment (seeChapter 4)31. Therefore, during the accession negotia-tions, the candidate countries requested several transi-tional periods (i.e. periods of time between their acces-sion and the time when they will be able to fully imple-ment Community legislation). Figure 5 below presentsagreed transitional periods for the countries that closednegotiations on the chapter environment.
SEE CountriesThe current state of the environment in the SEE is
closely related to the political and economic situation ofthe region from the last decade. On the one hand, eco-nomic recession and armed conflicts led to the closureof industrial facilities and resulted in the reduction ofpollution, especially that of the air. On the other hand,
it resulted in a lack of maintenance and a halt in thedevelopment of environmental infrastructure as well asa gradual accumulation of hazardous industrial wasteand a growing number of environmental hot spots.Moreover, one of the legacies of the 1992-1995 war forBosnia and Herzegovina, Croatia and the Serbia andMontenegro is the unsolved problem of uncleared land-mines, which pose a threat not only to people but alsoto natural ecosystems33.
Throughout the region, the situation regarding sewagesystems, wastewater treatment and waste disposal is espe-cially critical. For instance, the proportion of the popula-tion connected to a sewage system varies from about 40percent in FYR Macedonia to around 60 percent in Croatiaand Serbia and Montenegro (figures reflect the situation atthe end of 1990s). At the same time only 6 percent of dis-charged wastewater is treated in Croatia and in FYRMacedonia (both industrial and municipal) and just 12 per-cent of municipal wastewater is treated in the Serbian partof Serbia and Montenegro. Albania has no sewage treat-ment facilities whatsoever for municipal wastewater.35.
Over the past decade, especially in the second half ofthe 1990s, countries of SEE saw an increase in migrationfrom rural to urban areas and an attendant growth in theamount of generated municipal waste — in large citiesannual population growth is 2-10 percent36. Existinglandfills not only lack the capacity to deal with growingamounts of waste, but also fail to meet international stan-dards for landfill construction and do not prevent haz-
E N V I R O N M E N TA L S TAT U S A N D I S S U E S
28 E N V I R O N M E N TA L F I N A N C I N G I N C E N T R A L A N D E A S T E R N E U R O P E
FIGURE 3
Poland towns
Estonia
Czech Republic
Latvia
Bulgaria
Lithuania
Slovakia
Slovenia
Hungary
Romania
Source: EC 2001 based on information from countries
0 10 20 30 40 50 60 70 80 90 100
Population connected to wastewater treatment plants in the candidate countries by percentage, 2001
ardous substances from seeping into groundwater. Inaddition, on average only 40-50 percent of generatedurban waste is collected in Albania and Bosnia andHerzegovina, while the figure for Serbia andMontenegro and Croatia is 70-80 percent. The rates fordisposal of waste at legal landfills are much lower and asignificant amount of waste is dumped in illegal sites.Most rural areas do not organise waste collection37.
There has been an overall increase in road traffic inthe region (especially in the second half of the 1990s).Intensification of road traffic has resulted in increasedemissions from the transport sector (especially SO2, par-ticulates and lead) and this has adversely affected airquality in large cities38.
The political and economic situation in the 1990shampered the development of institutional capacity to
protect the environment in all the countries of theregion. Many areas of environmental protection lackadequate legislation and policy development plans (e.g.waste and water management, clean-ups of past pollu-tion). Environmental considerations are not integratedinto other sector policies (e.g. energy, industry, agricul-ture, tourism). Compliance and enforcement of existinglaws as well as monitoring the environment remain verylimited. Environmental awareness among citizens of theSEE countries as well as their participation in environ-mental decision-making is far from satisfactory39.
Ensuring the necessary improvement of the state ofthe environment in the region as well as the capacitybuilding of public administration remains a priority inthe process of stabilisation and reconstruction of SEE.
In order to create a regional approach supporting
E N V I R O N M E N TA L S TAT U S A N D I S S U E S
E N V I R O N M E N TA L F I N A N C I N G I N C E N T R A L A N D E A S T E R N E U R O P E 29
Trends in municipal waste generation in candidate countries, 1996 and 2000
FIGURE 4
Bulgaria
Czech Rep.
Estonia
Hungary
Latvia
Lithuania
Poland
Romania
Slovakia
Slovenia
Source: New Cronos database, Eurostat 2002
0 200 400 600
Kilograms per capita
1996
2000
Notes: (1) The data for the Czech Republic refer to 1997; the data for Hungary refer to 1999.(2) The 2000 data for Estonia are based on estimates.(3) The 2000 data for the Latvia are provisional (4) The 2000 data for Slovenia are not available
E N V I R O N M E N TA L S TAT U S A N D I S S U E S
30 E N V I R O N M E N TA L F I N A N C I N G I N C E N T R A L A N D E A S T E R N E U R O P E
Transitional periods negotiated by the candidate countries
FIGURE 5
Status Directive Transitional
period until
Czech Republic Provisionally closed in June 2001 Recovery and recycling of packaging waste 2005
Treatment of urban wastewater 2010
Estonia Provisionally closed in June 2001 Emissions of volatile organic compounds from storage of petrol 2006
Landfill of oil shale 2009
Treatment of urban wastewater 2010
Quality of drinking water 2013
Hungary Provisionally closed in June 2001 Recovery and recycling of packaging waste 2005
Treatment of urban wastewater 2015
Air pollution from large combustion plants 2004
Incineration of hazardous waste 2005
Lithuania Provisionally closed in June 2001 Emissions of volatile organic compounds from storage of petrol 2007
Recovery and recycling of packaging waste 2006
Treatment of urban wastewater 2009
Latvia Provisionally closed in Emissions of volatile organic November 2001 compounds from storage of petrol 2008
Recovery and recycling of packaging waste 2007
Landfill of waste 2004
Treatment of urban wastewater 2015
Quality of drinking water 2015
Integrated pollution prevention and control 2010
Storage of asbestos waste 2004
Health protection of individuals against ionising radiation in relation to medical exposure 2005
Poland Provisionally closed in Sulphur content of liquid fuels 2006October 2001
Emissions of volatile organic compounds from storage of petrol 2005
Recovery and recycling of packaging waste 2007
Waste landfills 2012
Shipment of waste 2007
Treatment of urban wastewater 2015
Discharges of dangerous substances into surface water 2007
Integrated pollution prevention and control 2010
Health protection of individuals against ionising radiation in relation to medical exposure 2006
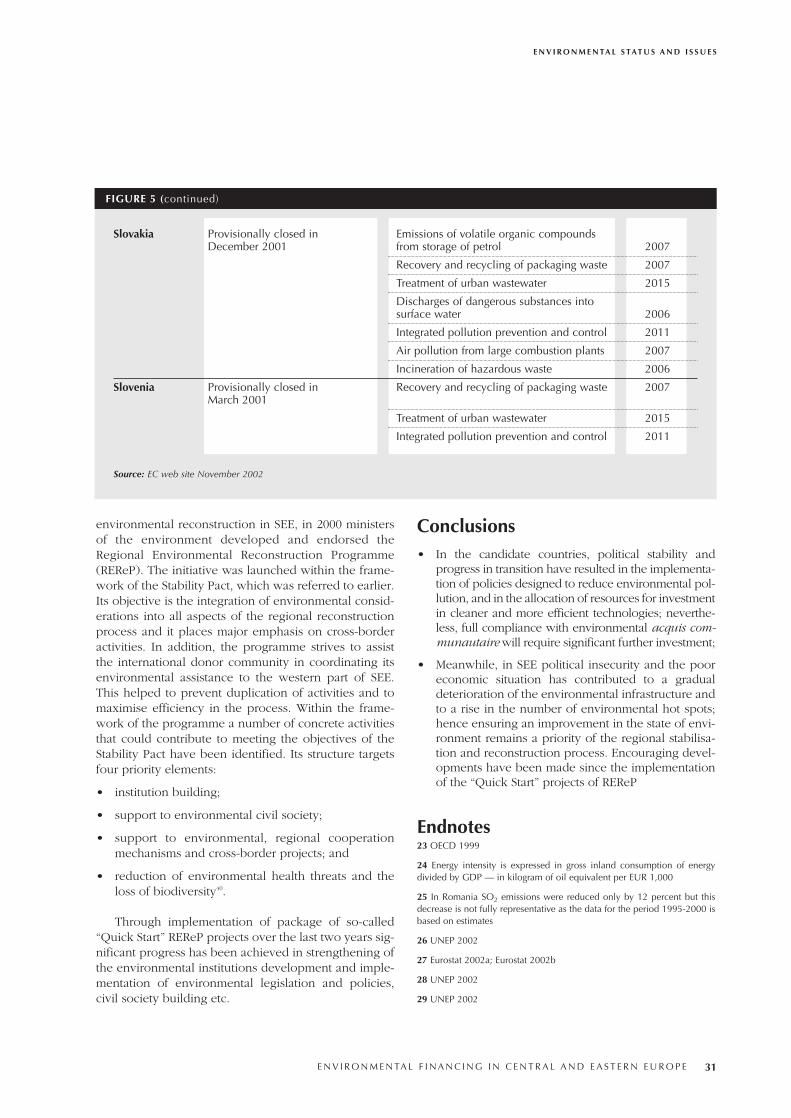
environmental reconstruction in SEE, in 2000 ministersof the environment developed and endorsed theRegional Environmental Reconstruction Programme(REReP). The initiative was launched within the frame-work of the Stability Pact, which was referred to earlier.Its objective is the integration of environmental consid-erations into all aspects of the regional reconstructionprocess and it places major emphasis on cross-borderactivities. In addition, the programme strives to assistthe international donor community in coordinating itsenvironmental assistance to the western part of SEE.This helped to prevent duplication of activities and tomaximise efficiency in the process. Within the frame-work of the programme a number of concrete activitiesthat could contribute to meeting the objectives of theStability Pact have been identified. Its structure targetsfour priority elements:
• institution building;
• support to environmental civil society;
• support to environmental, regional cooperationmechanisms and cross-border projects; and
• reduction of environmental health threats and theloss of biodiversity40.
Through implementation of package of so-called“Quick Start” REReP projects over the last two years sig-nificant progress has been achieved in strengthening ofthe environmental institutions development and imple-mentation of environmental legislation and policies,civil society building etc.
Conclusions• In the candidate countries, political stability and
progress in transition have resulted in the implementa-tion of policies designed to reduce environmental pol-lution, and in the allocation of resources for investmentin cleaner and more efficient technologies; neverthe-less, full compliance with environmental acquis com-munautaire will require significant further investment;
• Meanwhile, in SEE political insecurity and the pooreconomic situation has contributed to a gradualdeterioration of the environmental infrastructure andto a rise in the number of environmental hot spots;hence ensuring an improvement in the state of envi-ronment remains a priority of the regional stabilisa-tion and reconstruction process. Encouraging devel-opments have been made since the implementationof the “Quick Start” projects of REReP
Endnotes23 OECD 1999
24 Energy intensity is expressed in gross inland consumption of energydivided by GDP — in kilogram of oil equivalent per EUR 1,000
25 In Romania SO2 emissions were reduced only by 12 percent but thisdecrease is not fully representative as the data for the period 1995-2000 isbased on estimates
26 UNEP 2002
27 Eurostat 2002a; Eurostat 2002b
28 UNEP 2002
29 UNEP 2002
E N V I R O N M E N TA L S TAT U S A N D I S S U E S
E N V I R O N M E N TA L F I N A N C I N G I N C E N T R A L A N D E A S T E R N E U R O P E 31
Slovakia Provisionally closed in Emissions of volatile organic compoundsDecember 2001 from storage of petrol 2007
Recovery and recycling of packaging waste 2007
Treatment of urban wastewater 2015
Discharges of dangerous substances into surface water 2006
Integrated pollution prevention and control 2011
Air pollution from large combustion plants 2007
Incineration of hazardous waste 2006
Slovenia Provisionally closed in Recovery and recycling of packaging waste 2007March 2001
Treatment of urban wastewater 2015
Integrated pollution prevention and control 2011
Source: EC web site November 2002
FIGURE 5 (continued)
30 EEA 1999
31 EC 2002a
32 United Nations Economic Commission for Europe (UNECE) 1999, 2000,2001, 2002, EC 2001, 2002c
33 REC 2001a
34 The figure for Serbia and Montenegro does not include Kosovo (TerritoryCurrently Under Interim UN Administration).
35 UNECE 1999, 2000, 2001, 2002, EC 2001, 2002c
36 UNECE 2000, 2001, 2002
37 UNECE 2000, 2001, 2002; World Bank 2002, MZOPU 2001
38 UNECE 2000, 2001, 2002
39 EC 2002c
40 REC 2001a
E N V I R O N M E N TA L S TAT U S A N D I S S U E S
32 E N V I R O N M E N TA L F I N A N C I N G I N C E N T R A L A N D E A S T E R N E U R O P E
The mobilisation of adequate funds to achieve envi-ronmental goals is a challenging task. Environmentalimprovements must compete with countless otherpressing claims on an extremely thin capital base bothin the private and public sectors. It is also important tomention that investment needs can only be fulfilled overa period of time and the period over which the invest-ment need will be met depends on a range of factorsincluding the economic and political situation, environ-mental policy and enforcement. The situation in theregion is very complex. The economies of South EasternEurope (SEE) countries have contracted severely since1989 to the point that many are now classified interna-tionally as lower-middle-income countries41. Manycountries of the region are classified as upper-middleincome countries42 and Slovenia is classified as a high-income country43.
Candidate CountriesIn the candidate countries of Central and Eastern
Europe (CEE), the need for environmental investment ismainly driven by the European Union (EU) accessionprocess. The investment challenge of implementing EUlegislation is connected to the implementation of so-calledkey investment-heavy directives44. Implementation ofthese directives not only requires major investment butalso poses the greatest problems in terms of the numberof projects needed and the scale of the investment. Recentestimates of investment needed to comply with EU heavyinvestment directives range between EUR 80 and 110 bil-lion. However, it must be noted that the estimates do notinclude the investment needs for the implementation ofthe Water Framework Directive and revisions to the LargeCombustion Plant Directive. Some of the estimates haveexcluded operation and maintenance costs, and privatesector investment has not always been included45.
In many candidate countries, particularly inadvanced reform countries, there has been a recent
improvement in conditions for environmental invest-ment. In most candidate countries economic growth hasresumed, generating resources for investment, whilemacroeconomic stabilisation has helped reduce interestrates and inflation. The reduction of subsidies on ener-gy, water and other resources in the region has createdincentives for greater efficiency. New trade relationshave required exporters to pay more attention to envi-ronmental issues, and new policies and programmes,including the national environmental action pro-grammes and accession strategies, and economic instru-ments have promoted better implementation of the pol-luter-pays principle. Decentralisation is creatingdemand for better environmental services at the locallevel, while public awareness and, in some cases, will-ingness to pay for environmental improvements areincreasing. Obligations under regional and global envi-ronmental conventions provide loans for investment,often with international assistance.
SEE CountriesIn the SEE countries the poor state of the environ-
mental protection infrastructure and the resulting signif-icant levels of pollution require major investment.Future prospects of EU integration are also a driver butin comparison with the candidate countries not such asignificant one. To date there are no estimates of invest-ment needs for the SEE countries.
In the SEE countries conditions for implementingenvironmental investment projects are very poor in boththe private sector and municipalities. There are manyreasons for this, especially the continuing legacy of laxenvironmental enforcement, an ambiguous legal frame-work for past pollution, and heavy state subsidies toboth enterprises and co-funding for municipalities. Inaddition many enterprises have low liquidity, low prof-itability and low expectations for growth and profit,which limit the opportunities for non-profit environ-
E N V I R O N M E N TA L F I N A N C I N G I N C E N T R A L A N D E A S T E R N E U R O P E 33
Chapter 4Need for Investment
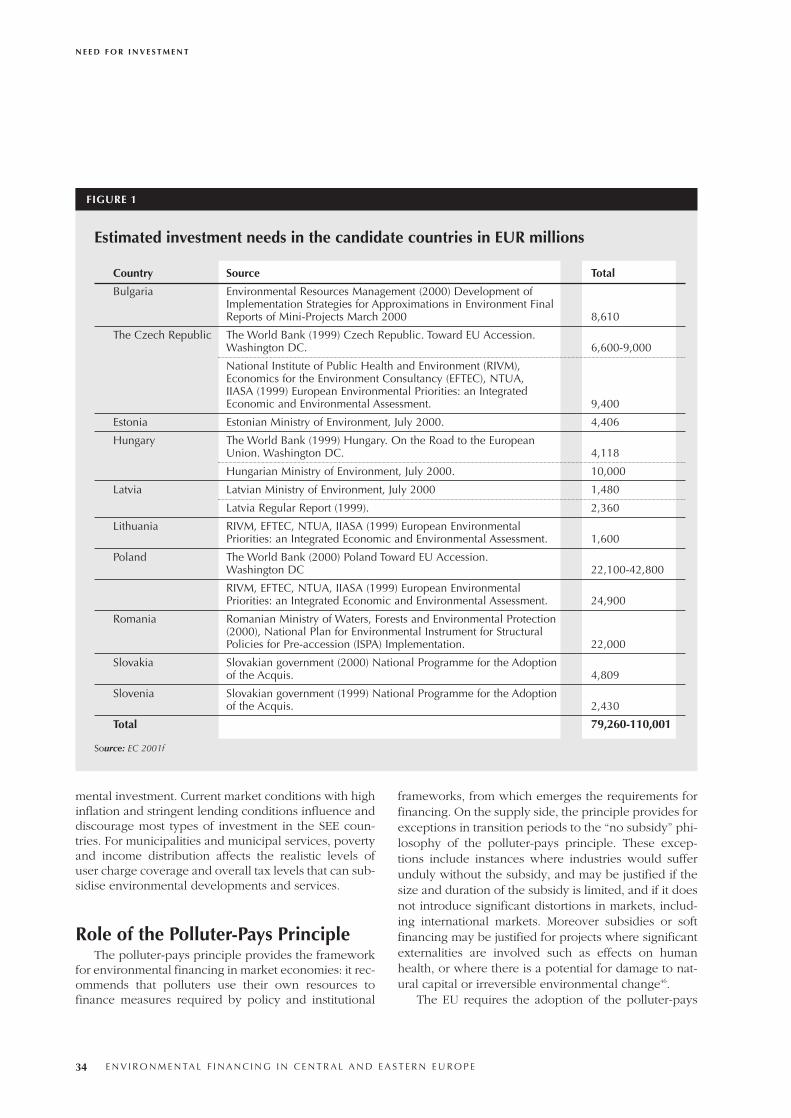
mental investment. Current market conditions with highinflation and stringent lending conditions influence anddiscourage most types of investment in the SEE coun-tries. For municipalities and municipal services, povertyand income distribution affects the realistic levels ofuser charge coverage and overall tax levels that can sub-sidise environmental developments and services.
Role of the Polluter-Pays PrincipleThe polluter-pays principle provides the framework
for environmental financing in market economies: it rec-ommends that polluters use their own resources tofinance measures required by policy and institutional
frameworks, from which emerges the requirements forfinancing. On the supply side, the principle provides forexceptions in transition periods to the “no subsidy” phi-losophy of the polluter-pays principle. These excep-tions include instances where industries would sufferunduly without the subsidy, and may be justified if thesize and duration of the subsidy is limited, and if it doesnot introduce significant distortions in markets, includ-ing international markets. Moreover subsidies or softfinancing may be justified for projects where significantexternalities are involved such as effects on humanhealth, or where there is a potential for damage to nat-ural capital or irreversible environmental change46.
The EU requires the adoption of the polluter-pays
N E E D F O R I N V E S T M E N T
34 E N V I R O N M E N TA L F I N A N C I N G I N C E N T R A L A N D E A S T E R N E U R O P E
Estimated investment needs in the candidate countries in EUR millions
Country Source Total
Bulgaria Environmental Resources Management (2000) Development of Implementation Strategies for Approximations in Environment Final Reports of Mini-Projects March 2000 8,610
The Czech Republic The World Bank (1999) Czech Republic. Toward EU Accession. Washington DC. 6,600-9,000
National Institute of Public Health and Environment (RIVM), Economics for the Environment Consultancy (EFTEC), NTUA, IIASA (1999) European Environmental Priorities: an Integrated Economic and Environmental Assessment. 9,400
Estonia Estonian Ministry of Environment, July 2000. 4,406
Hungary The World Bank (1999) Hungary. On the Road to the European Union. Washington DC. 4,118
Hungarian Ministry of Environment, July 2000. 10,000
Latvia Latvian Ministry of Environment, July 2000 1,480
Latvia Regular Report (1999). 2,360
Lithuania RIVM, EFTEC, NTUA, IIASA (1999) European Environmental Priorities: an Integrated Economic and Environmental Assessment. 1,600
Poland The World Bank (2000) Poland Toward EU Accession. Washington DC 22,100-42,800
RIVM, EFTEC, NTUA, IIASA (1999) European Environmental Priorities: an Integrated Economic and Environmental Assessment. 24,900
Romania Romanian Ministry of Waters, Forests and Environmental Protection (2000), National Plan for Environmental Instrument for Structural Policies for Pre-accession (ISPA) Implementation. 22,000
Slovakia Slovakian government (2000) National Programme for the Adoption of the Acquis. 4,809
Slovenia Slovakian government (1999) National Programme for the Adoption of the Acquis. 2,430
Total 79,260-110,001
Source: EC 2001f
FIGURE 1
principle. It is not only in relation to sectoral policiesbut its application should also take place, for example,in relation to the EU assistance channelled throughStructural and Cohesion Funds. The commission’s com-munication on guidance for programming in the period2000-06 sets out the basic elements of a framework forthe application of the principle, when providing assis-tance47, which are as follows:
• A system should be promoted through the differen-tiation of rates of assistance, whereby the environ-mental costs related to the treatment of pollutionand/or preventive actions are borne by those whocause the pollution.
• The application of the polluter-pays principle mustbe compatible with the goals of economic andsocial cohesion.
• Its development should be progressive and concernthe range of infrastructure sectors covered byCommunity funding.
• It should take into account the social acceptanceof charging.
• It should take into account treaty provisions relatedto the careful and rational use of resources, espe-cially water and energy.
Conclusions:• Financing investment needs is a long-term process
for all countries of the region, depending on manydifferent factors.
• The EU Accession process is the motivating factorfor environmental investment for all countries inthe region.
• Investment needs for the candidate countries wereestimated in 1999/2000 before the transitional peri-ods were negotiated.
• There is no estimate of investment needs for theSEE countries.
• In the candidate countries the conditions for envi-ronmental investment are better than in many SEEcountries.
Endnotes41 According to the World Bank definition, a lower-middle-income country
is a country with an annual gross national income (GNI) per capita between
USD 756-2995 in 2000. There are currently 52 lower-middle-income coun-
tries in the world, including: Albania, Bosnia and Herzegovina, Bulgaria,
FYR Macedonia, Romania and Serbia and Montenegro.
42 According to the World Bank definition, an upper-middle-income coun-
try is a country with a GNI per capita between USD 2,996-9,265 in 2000.
There are currently 38 upper-middle-income countries in the world,
including: Croatia, the Czech Republic, Estonia, Hungary, Latvia,
Lithuania, Poland and Slovakia.
43 According to the World Bank definition, a high-income country is a
country with an annual GNI per capita higher than USD 9,266 in 2000.
There are 52 high-income countries including Slovenia.
44 Key “investment-heavy” directives include: the Urban Wastewater
Treatment Directive, Drinking Water Directive, Dangerous Substances into
Water Directives, Nitrates Directives, Landfill Directive, Municipal Waste
Incineration Directives, Hazardous Waste Incineration Directive, Packaging
Waste Directive, Large Combustion Plants Directive, Fuel Quality
Directives, Air Quality Directives, IPPC Directive, VOC Solvents Directive.
45 EC 2001f
46 OECD 1998
47 EC 1999b
N E E D F O R I N V E S T M E N T
E N V I R O N M E N TA L F I N A N C I N G I N C E N T R A L A N D E A S T E R N E U R O P E 35

36 E N V I R O N M E N TA L F I N A N C I N G I N C E N T R A L A N D E A S T E R N E U R O P E
This chapter presents levels and trends in environ-mental expenditure in EU candidate countries of Centraland Eastern Europe (CEE). The size of the environmentalmarket is shown (figure 1) as well as environmentalexpenditure as a share of gross domestic product (GDP)(figure 2) and per capita (figure 4). The share of invest-ment and current expenditure is presented (figure 3)along with distribution of expenditure by the environ-mental media (figure 5). All data are based on the Eurostat2002 publication. For details of definitions see Annex 2.
Figure 1 shows the total environmental expendi-ture48 in 2000 in order to show the size of the environ-mental market. The countries with the highest totalenvironmental expenditure are Poland and the CzechRepublic, where expenditure reached more than EUR1,000 million. In Hungary and Romania the total expen-diture varies between EUR 510 and 559 million. ForSlovakia and Bulgaria it remains between EUR 200 and231 million. The countries with the lowest expenditureare Lithuania, Slovenia, Estonia and Latvia, which canbe partly explained by the physical size of these coun-tries and their respective populations.
As figure 2 demonstrates, levels of the total envi-ronmental expenditure as a share of GDP were thehighest in the Czech Republic, Slovakia and Romania.Latvia and Slovenia belong to the countries that spentthe lowest share of their GDP on the environment.Total environmental expenditure as a share of GDPdecreased over the period 1996 -2000 in almost all can-didate countries that had high levels of total expendi-ture prior to 1996. This was especially true for Estonia,where expenditure decreased from 2.2 percent in 1996to 1.2 percent in 2000 and in the Czech Republic whereit decreased from 2.3 percent in 1996 reaching 3 per-cent in 1997 and decreasing to 2.0 percent in 2000.Only Bulgaria and Lithuania increased expenditure lev-els significantly from 1996 to 2000. On average in 2000,candidate countries spent 1.26 percent of GDP on envi-ronmental protection.
Caution should be taken when interpreting the lev-els of expenditure presented in the figures below, as theonly countries with complete expenditure data for allsectors and years are Estonia and Romania. It must bealso noted that GDP in candidate countries increasedsignificantly over the period 1996-2000.
Total levels of environmental expenditure in EURper capita vary greatly between counties. The highestlevels in 2000 were reached by the Czech Republic atEUR 106, Hungary at EUR 85, Poland at EUR 70 andSlovenia at EUR 64. The lowest per capita expenditureswere by Latvia at EUR 17, Romania at EUR 23 andBulgaria at EUR 24. On average in 2000 the candidatecountries spent EUR 51.5 per capita. There is no regionwide trend of environmental expenditure per capita.The Czech Republic and Slovakia decreased their levelsof expenditure over the period. In Estonia and Romanialevels were constant. Other candidate countries —Hungary, Latvia, Lithuania, Poland and Slovenia —increased levels of expenditure, especially in 2000.
In 2000 there was no region-wide tendency on thedivision of investment and current expenditure of totalenvironmental expenditure in selected countries of theregion. In Slovenia and Estonia investment accountedfor more that 60 percent of total expenditure, while inSlovakia, Romania and Latvia investment was below 40percent of total environmental expenditure.
The distribution of expenditure by environmentalmedia varies between countries and sectors, as follows:
• In Bulgaria public sector expenditure was focusedon wastewater at 35 percent and on the air sector at25 percent. Industry spent money mainly in the airsector at 40 percent and wastewater at 32 percent.
• In The Czech Republic expenditure was dominatedby the air and wastewater sectors, which accountedfor 85 percent of total expenditure by the public sec-tor and 77 percent by industry.
E N V I R O N M E N TA L F I N A N C I N G I N C E N T R A L A N D E A S T E R N E U R O P E 37
Chapter 5Environmental Expenditure in the Candidate Countries
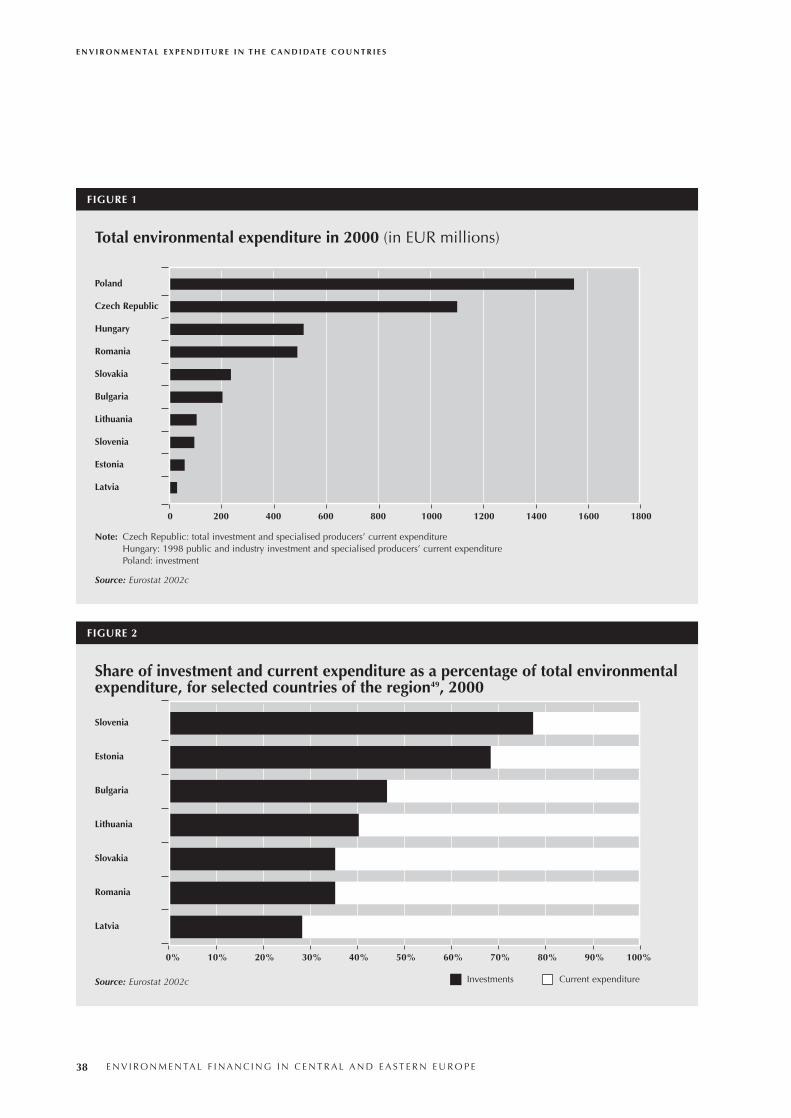
E N V I R O N M E N TA L E X P E N D I T U R E I N T H E C A N D I DAT E C O U N T R I E S
38 E N V I R O N M E N TA L F I N A N C I N G I N C E N T R A L A N D E A S T E R N E U R O P E
Total environmental expenditure in 2000 (in EUR millions)
FIGURE 1
Poland
Czech Republic
Hungary
Romania
Slovakia
Bulgaria
Lithuania
Slovenia
Estonia
Latvia
Source: Eurostat 2002c
Note: Czech Republic: total investment and specialised producers’ current expenditureHungary: 1998 public and industry investment and specialised producers’ current expenditurePoland: investment
0 200 400 600 800 1000 1200 1400 1600 1800
Share of investment and current expenditure as a percentage of total environmentalexpenditure, for selected countries of the region49, 2000
FIGURE 2
Slovenia
Estonia
Bulgaria
Lithuania
Slovakia
Romania
Latvia
Source: Eurostat 2002c
0% 10% 20% 30% 40% 50% 60% 70% 80% 90% 100%
Investments Current expenditure
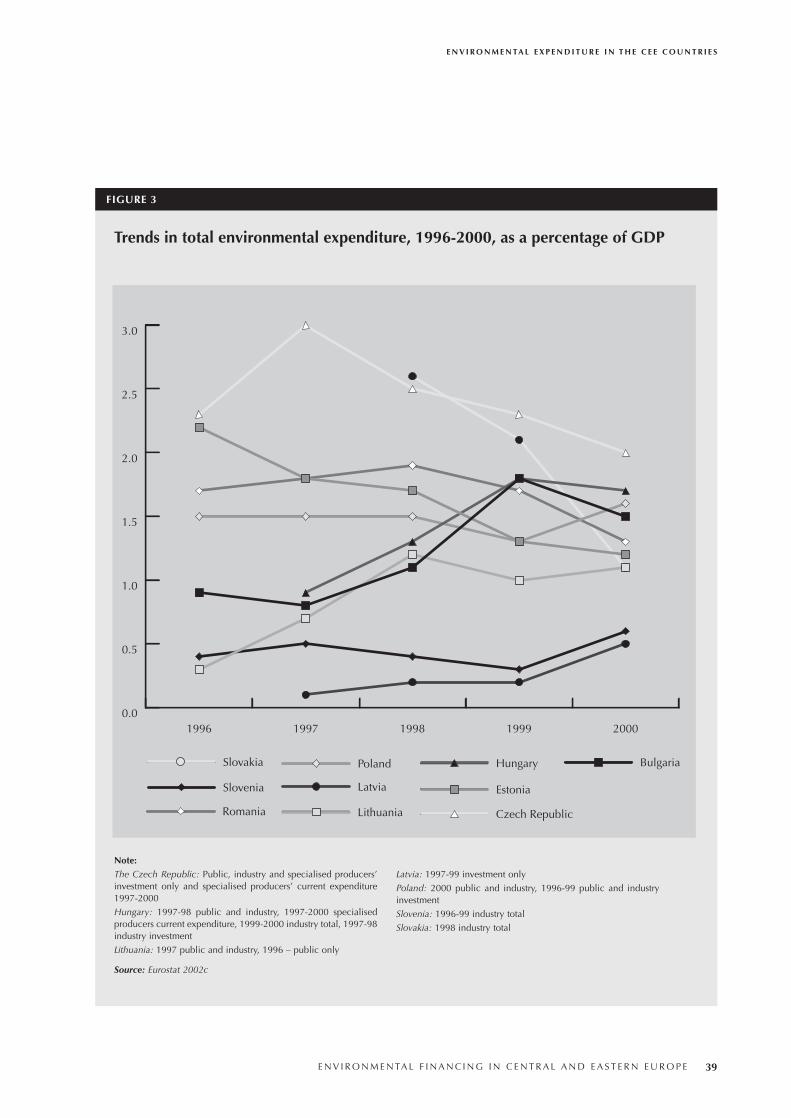
E N V I R O N M E N TA L E X P E N D I T U R E I N T H E C E E C O U N T R I E S
E N V I R O N M E N TA L F I N A N C I N G I N C E N T R A L A N D E A S T E R N E U R O P E 39
Trends in total environmental expenditure, 1996-2000, as a percentage of GDP
FIGURE 3
Source: Eurostat 2002c
Note: The Czech Republic: Public, industry and specialised producers’investment only and specialised producers’ current expenditure1997-2000
Hungary: 1997-98 public and industry, 1997-2000 specialisedproducers current expenditure, 1999-2000 industry total, 1997-98industry investment
Lithuania: 1997 public and industry, 1996 – public only
Latvia: 1997-99 investment only
Poland: 2000 public and industry, 1996-99 public and industryinvestment
Slovenia: 1996-99 industry total
Slovakia: 1998 industry total
0.0
0.5
1.0
1.5
2.0
2.5
3.0
Slovakia
Slovenia
Romania
Poland
Latvia
Lithuania
Hungary
Estonia
Czech Republic
Bulgaria
20001999199819971996
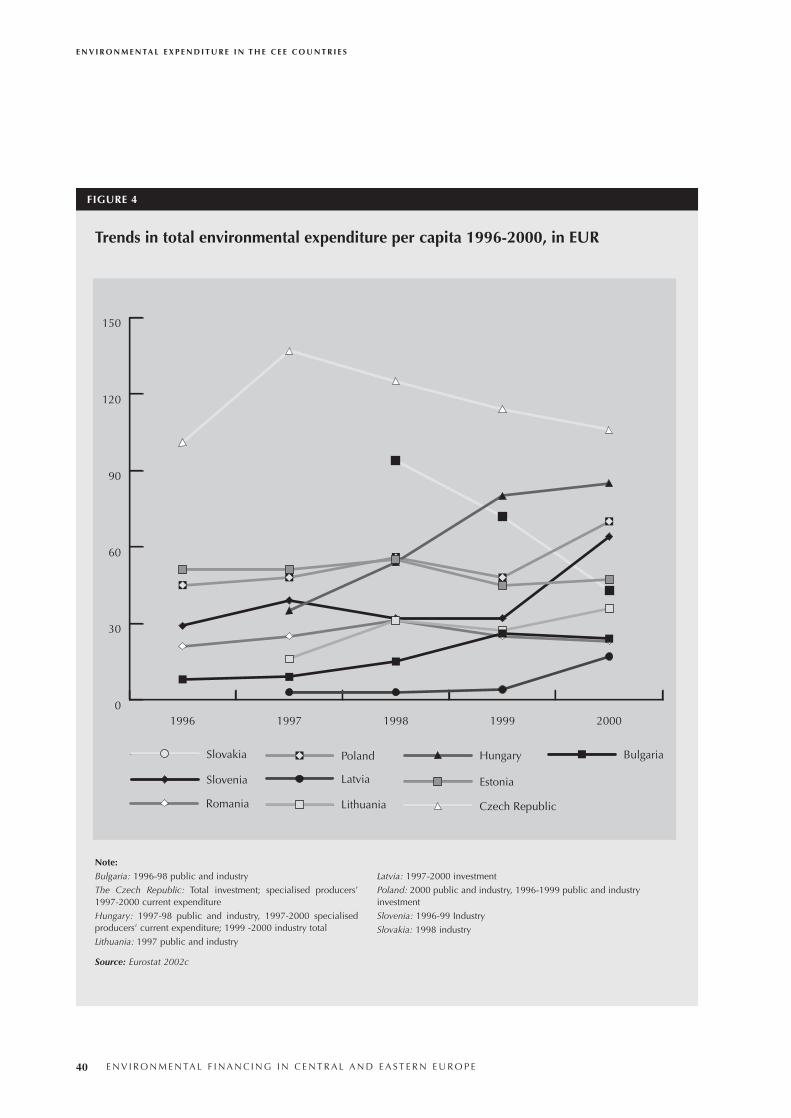
E N V I R O N M E N TA L E X P E N D I T U R E I N T H E C E E C O U N T R I E S
40 E N V I R O N M E N TA L F I N A N C I N G I N C E N T R A L A N D E A S T E R N E U R O P E
Trends in total environmental expenditure per capita 1996-2000, in EUR
FIGURE 4
Source: Eurostat 2002c
Note: Bulgaria: 1996-98 public and industry
The Czech Republic: Total investment; specialised producers’1997-2000 current expenditure
Hungary: 1997-98 public and industry, 1997-2000 specialisedproducers’ current expenditure; 1999 -2000 industry total
Lithuania: 1997 public and industry
Latvia: 1997-2000 investment
Poland: 2000 public and industry, 1996-1999 public and industryinvestment
Slovenia: 1996-99 Industry
Slovakia: 1998 industry
0
30
60
90
120
150
Slovakia
Slovenia
Romania
Poland
Latvia
Lithuania
Hungary
Estonia
Czech Republic
Bulgaria
20001999199819971996
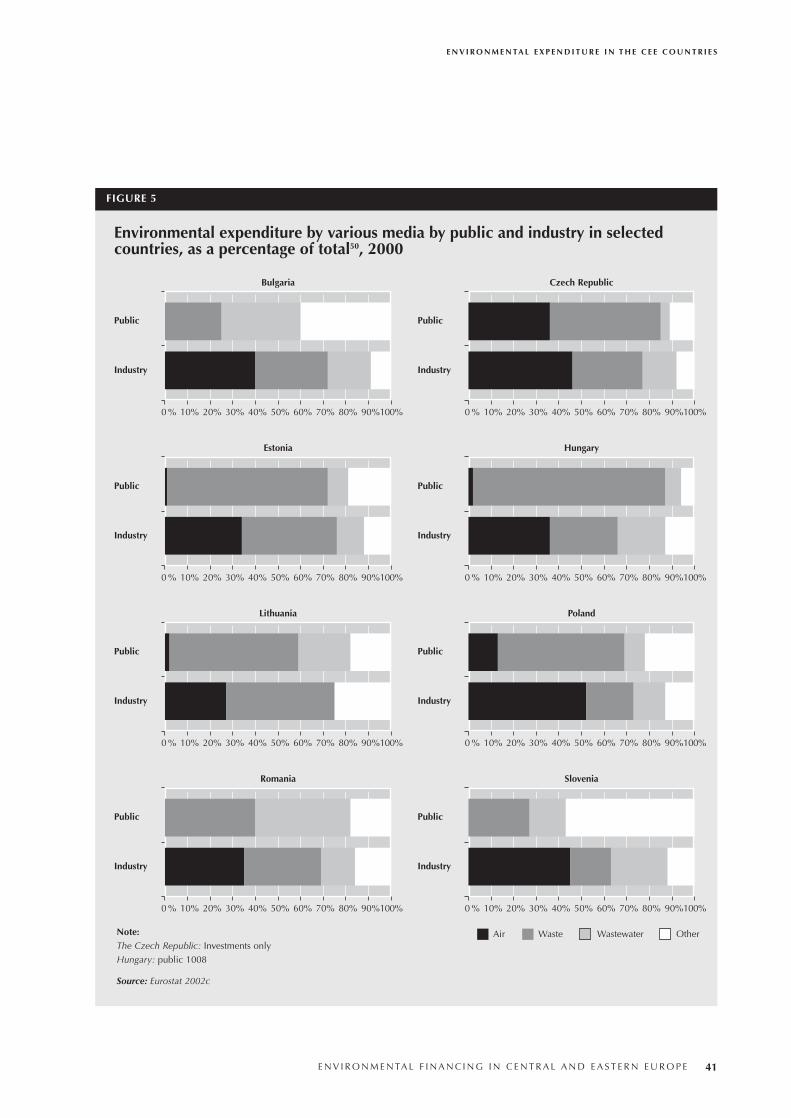
E N V I R O N M E N TA L E X P E N D I T U R E I N T H E C E E C O U N T R I E S
E N V I R O N M E N TA L F I N A N C I N G I N C E N T R A L A N D E A S T E R N E U R O P E 41
FIGURE 5
Environmental expenditure by various media by public and industry in selectedcountries, as a percentage of total50, 2000
Source: Eurostat 2002c
Bulgaria
Public
Industry
0 % 10% 20% 30% 40% 50% 60% 70% 80% 90%100%
Czech Republic
Public
Industry
0 % 10% 20% 30% 40% 50% 60% 70% 80% 90%100%
Estonia
Public
Industry
0 % 10% 20% 30% 40% 50% 60% 70% 80% 90%100%
Hungary
Public
Industry
0 % 10% 20% 30% 40% 50% 60% 70% 80% 90%100%
Lithuania
Public
Industry
0 % 10% 20% 30% 40% 50% 60% 70% 80% 90%100%
Poland
Public
Industry
0 % 10% 20% 30% 40% 50% 60% 70% 80% 90%100%
Romania
Public
Industry
0 % 10% 20% 30% 40% 50% 60% 70% 80% 90%100%
Slovenia
Public
Industry
0 % 10% 20% 30% 40% 50% 60% 70% 80% 90%100%
Air Waste Wastewater OtherNote:The Czech Republic: Investments only
Hungary: public 1008
• The Estonian public sector spent money mainly onwastewater at 71 percent and industry spent 34 per-cent on the air sector and 42 percent on wastewater.
• The greatest part of expenditure by the public sectorin Hungary went on the wastewater sector at 85 per-cent while industry spent 36 percent on the air sec-tor and 30 percent on wastewater.
• In Lithuania the public sector spent 57 percent onwastewater and 23 percent on waste, while industryspent 27 percent on the air sector and 48 percent onwastewater.
• The Polish public sector spent money mainly onwastewater at 56 percent, while industry spent 52 per-cent on the air sector and 21 percent on wastewater.
• In Romania the public sector spent 40 percent onwastewater and 42 percent on waste while industryspent 35 percent on the air sector and 34 percent onwastewater.
• In Slovenia public expenditure was focused on otherexpenditure 57 percent than in air, wastewater orwaste, industry spent 45 percent on the air sectorand 25 percent on waste.
In general in the candidate countries, in 2000, themajority of expenditure by the public sector was distrib-uted on the wastewater sector where in six out of eightcountries it accounted for more than 40 percent of totalexpenditure. Industry expenditure in the candidate coun-tries was focused on the air sector, where in six out ofeight countries it accounted for more than 35 percent oftotal expenditure. Only in the public sectors of Bulgariaand Romania did expenditure on the waste sectoraccount for more than 30 percent of total expenditure.
Conclusions:• The largest environmental markets, in 2000, were in
Poland and the Czech Republic, while the smallestwere in Estonia and Latvia.
• The range of total levels of expenditure in variouscountries was smaller in 2000 than in 1996.
• The countries in which expenditure was high at thebeginning of the analysed period decreased theirexpenditure over the period.
• The range of a share of investment and currentexpenditure ranges from 30 percent to 70 percent.
• Public sector expenditure, in 2000 was focusedon wastewater and the waste sector, while indus-try focused its expenditure on the air and waste-water sectors.
• Total reported levels of expenditure for the analysedperiod could only be presented for Estonia andRomania. For other countries data are missing fordifferent sectors or years.
Endnotes48 See Annex 2 for definition
49 The figure presents only these countries for which data on total envi-ronmental expenditure are available, which therefore made it possible tomake a credible comparison of investment and current expenditure.Countries omitted include The Czech Republic, Hungary and Poland.
50 Due to the lack of data it is not possible to present expenditure by mediaby specialized producers sector. In Latvia and Slovakia data on environ-mental media does not exist.
E N V I R O N M E N TA L E X P E N D I T U R E I N T H E C E E C O U N T R I E S
42 E N V I R O N M E N TA L F I N A N C I N G I N C E N T R A L A N D E A S T E R N E U R O P E
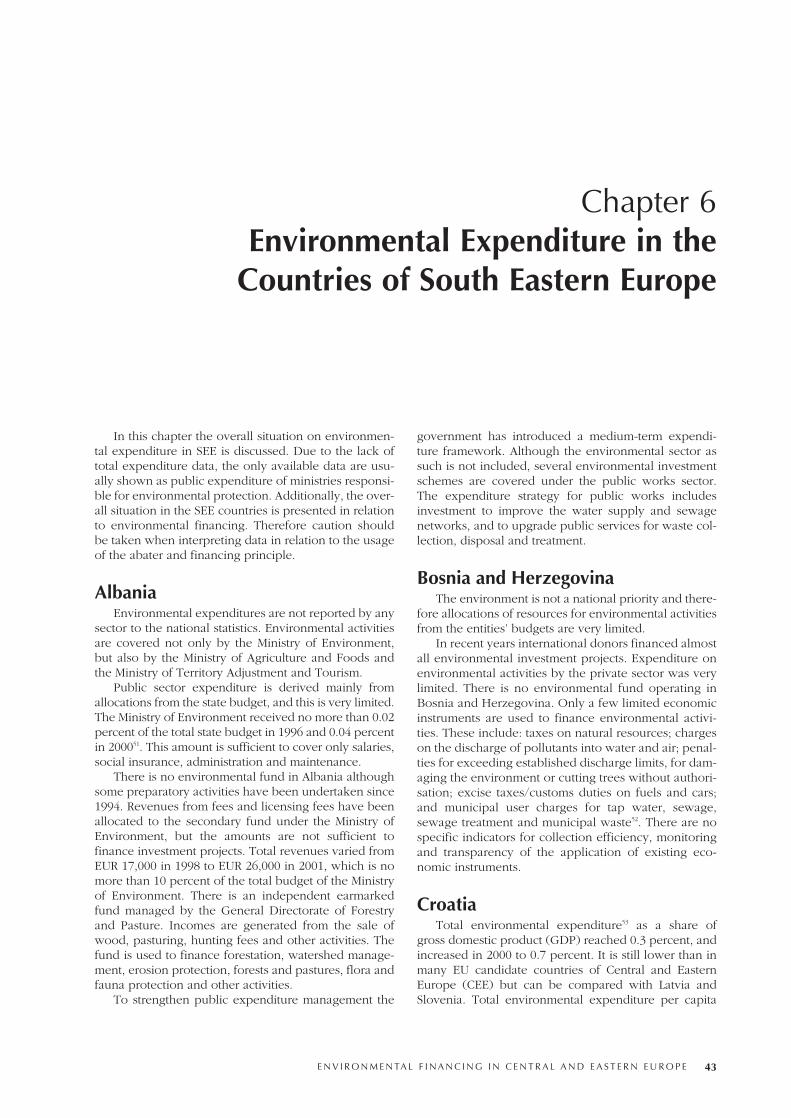
In this chapter the overall situation on environmen-tal expenditure in SEE is discussed. Due to the lack oftotal expenditure data, the only available data are usu-ally shown as public expenditure of ministries responsi-ble for environmental protection. Additionally, the over-all situation in the SEE countries is presented in relationto environmental financing. Therefore caution shouldbe taken when interpreting data in relation to the usageof the abater and financing principle.
AlbaniaEnvironmental expenditures are not reported by any
sector to the national statistics. Environmental activitiesare covered not only by the Ministry of Environment,but also by the Ministry of Agriculture and Foods andthe Ministry of Territory Adjustment and Tourism.
Public sector expenditure is derived mainly fromallocations from the state budget, and this is very limited.The Ministry of Environment received no more than 0.02percent of the total state budget in 1996 and 0.04 percentin 200051. This amount is sufficient to cover only salaries,social insurance, administration and maintenance.
There is no environmental fund in Albania althoughsome preparatory activities have been undertaken since1994. Revenues from fees and licensing fees have beenallocated to the secondary fund under the Ministry ofEnvironment, but the amounts are not sufficient tofinance investment projects. Total revenues varied fromEUR 17,000 in 1998 to EUR 26,000 in 2001, which is nomore than 10 percent of the total budget of the Ministryof Environment. There is an independent earmarkedfund managed by the General Directorate of Forestryand Pasture. Incomes are generated from the sale ofwood, pasturing, hunting fees and other activities. Thefund is used to finance forestation, watershed manage-ment, erosion protection, forests and pastures, flora andfauna protection and other activities.
To strengthen public expenditure management the
government has introduced a medium-term expendi-ture framework. Although the environmental sector assuch is not included, several environmental investmentschemes are covered under the public works sector.The expenditure strategy for public works includesinvestment to improve the water supply and sewagenetworks, and to upgrade public services for waste col-lection, disposal and treatment.
Bosnia and HerzegovinaThe environment is not a national priority and there-
fore allocations of resources for environmental activitiesfrom the entities’ budgets are very limited.
In recent years international donors financed almostall environmental investment projects. Expenditure onenvironmental activities by the private sector was verylimited. There is no environmental fund operating inBosnia and Herzegovina. Only a few limited economicinstruments are used to finance environmental activi-ties. These include: taxes on natural resources; chargeson the discharge of pollutants into water and air; penal-ties for exceeding established discharge limits, for dam-aging the environment or cutting trees without authori-sation; excise taxes/customs duties on fuels and cars;and municipal user charges for tap water, sewage,sewage treatment and municipal waste52. There are nospecific indicators for collection efficiency, monitoringand transparency of the application of existing eco-nomic instruments.
CroatiaTotal environmental expenditure53 as a share of
gross domestic product (GDP) reached 0.3 percent, andincreased in 2000 to 0.7 percent. It is still lower than inmany EU candidate countries of Central and EasternEurope (CEE) but can be compared with Latvia andSlovenia. Total environmental expenditure per capita
E N V I R O N M E N TA L F I N A N C I N G I N C E N T R A L A N D E A S T E R N E U R O P E 43
Chapter 6Environmental Expenditure in the
Countries of South Eastern Europe
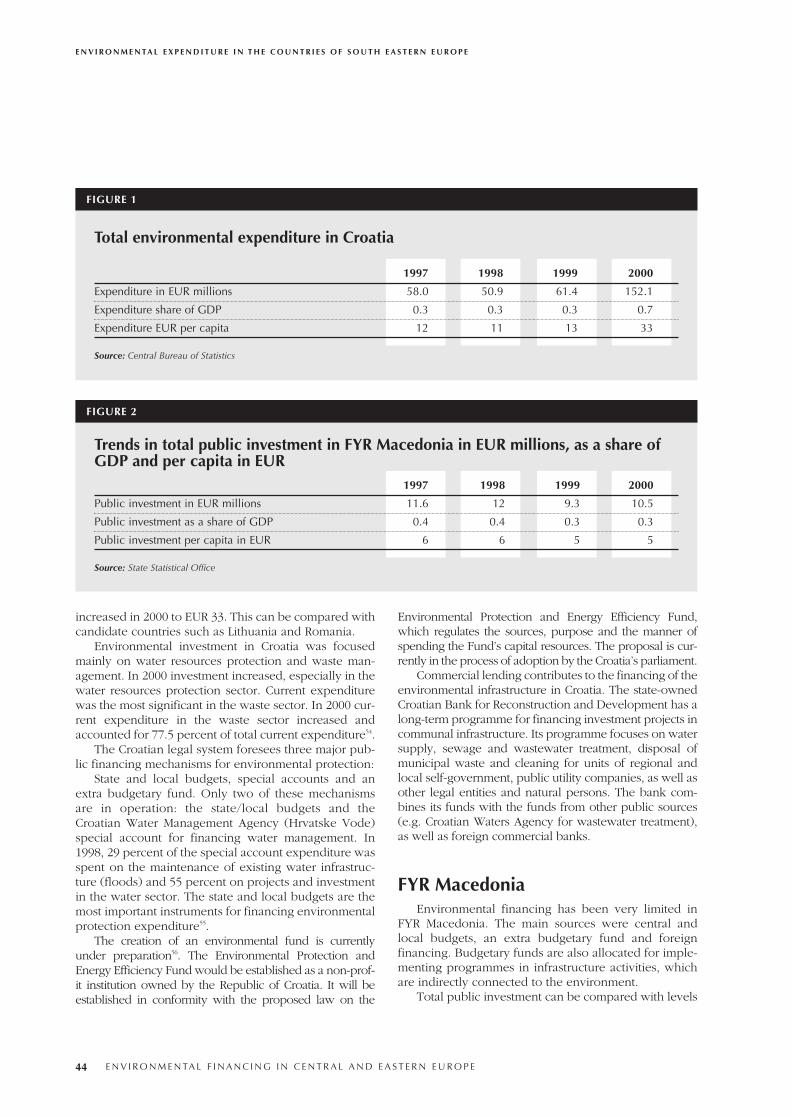
increased in 2000 to EUR 33. This can be compared withcandidate countries such as Lithuania and Romania.
Environmental investment in Croatia was focusedmainly on water resources protection and waste man-agement. In 2000 investment increased, especially in thewater resources protection sector. Current expenditurewas the most significant in the waste sector. In 2000 cur-rent expenditure in the waste sector increased andaccounted for 77.5 percent of total current expenditure54.
The Croatian legal system foresees three major pub-lic financing mechanisms for environmental protection:
State and local budgets, special accounts and anextra budgetary fund. Only two of these mechanismsare in operation: the state/local budgets and theCroatian Water Management Agency (Hrvatske Vode)special account for financing water management. In1998, 29 percent of the special account expenditure wasspent on the maintenance of existing water infrastruc-ture (floods) and 55 percent on projects and investmentin the water sector. The state and local budgets are themost important instruments for financing environmentalprotection expenditure55.
The creation of an environmental fund is currentlyunder preparation56. The Environmental Protection andEnergy Efficiency Fund would be established as a non-prof-it institution owned by the Republic of Croatia. It will beestablished in conformity with the proposed law on the
Environmental Protection and Energy Efficiency Fund,which regulates the sources, purpose and the manner ofspending the Fund’s capital resources. The proposal is cur-rently in the process of adoption by the Croatia’s parliament.
Commercial lending contributes to the financing of theenvironmental infrastructure in Croatia. The state-ownedCroatian Bank for Reconstruction and Development has along-term programme for financing investment projects incommunal infrastructure. Its programme focuses on watersupply, sewage and wastewater treatment, disposal ofmunicipal waste and cleaning for units of regional andlocal self-government, public utility companies, as well asother legal entities and natural persons. The bank com-bines its funds with the funds from other public sources(e.g. Croatian Waters Agency for wastewater treatment),as well as foreign commercial banks.
FYR Macedonia Environmental financing has been very limited in
FYR Macedonia. The main sources were central andlocal budgets, an extra budgetary fund and foreignfinancing. Budgetary funds are also allocated for imple-menting programmes in infrastructure activities, whichare indirectly connected to the environment.
Total public investment can be compared with levels
E N V I R O N M E N TA L E X P E N D I T U R E I N T H E C O U N T R I E S O F S O U T H E A S T E R N E U R O P E
44 E N V I R O N M E N TA L F I N A N C I N G I N C E N T R A L A N D E A S T E R N E U R O P E
Total environmental expenditure in Croatia
FIGURE 1
1997 1998 1999 2000
Expenditure in EUR millions 58.0 50.9 61.4 152.1
Expenditure share of GDP 0.3 0.3 0.3 0.7
Expenditure EUR per capita 12 11 13 33
Source: Central Bureau of Statistics
FIGURE 2
1997 1998 1999 2000
Public investment in EUR millions 11.6 12 9.3 10.5
Public investment as a share of GDP 0.4 0.4 0.3 0.3
Public investment per capita in EUR 6 6 5 5
Source: State Statistical Office
Trends in total public investment in FYR Macedonia in EUR millions, as a share ofGDP and per capita in EUR
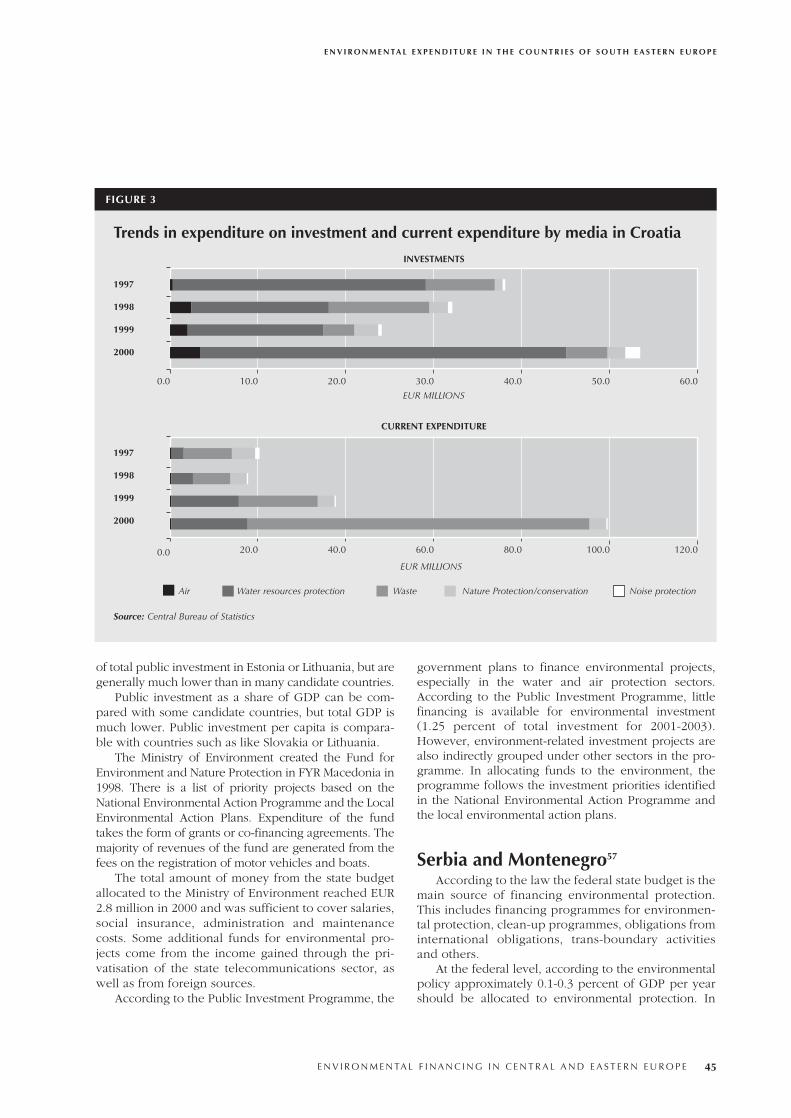
of total public investment in Estonia or Lithuania, but aregenerally much lower than in many candidate countries.
Public investment as a share of GDP can be com-pared with some candidate countries, but total GDP ismuch lower. Public investment per capita is compara-ble with countries such as like Slovakia or Lithuania.
The Ministry of Environment created the Fund forEnvironment and Nature Protection in FYR Macedonia in1998. There is a list of priority projects based on theNational Environmental Action Programme and the LocalEnvironmental Action Plans. Expenditure of the fundtakes the form of grants or co-financing agreements. Themajority of revenues of the fund are generated from thefees on the registration of motor vehicles and boats.
The total amount of money from the state budgetallocated to the Ministry of Environment reached EUR2.8 million in 2000 and was sufficient to cover salaries,social insurance, administration and maintenancecosts. Some additional funds for environmental pro-jects come from the income gained through the pri-vatisation of the state telecommunications sector, aswell as from foreign sources.
According to the Public Investment Programme, the
government plans to finance environmental projects,especially in the water and air protection sectors.According to the Public Investment Programme, littlefinancing is available for environmental investment(1.25 percent of total investment for 2001-2003).However, environment-related investment projects arealso indirectly grouped under other sectors in the pro-gramme. In allocating funds to the environment, theprogramme follows the investment priorities identifiedin the National Environmental Action Programme andthe local environmental action plans.
Serbia and Montenegro57
According to the law the federal state budget is themain source of financing environmental protection.This includes financing programmes for environmen-tal protection, clean-up programmes, obligations frominternational obligations, trans-boundary activitiesand others.
At the federal level, according to the environmentalpolicy approximately 0.1-0.3 percent of GDP per yearshould be allocated to environmental protection. In
E N V I R O N M E N TA L E X P E N D I T U R E I N T H E C O U N T R I E S O F S O U T H E A S T E R N E U R O P E
E N V I R O N M E N TA L F I N A N C I N G I N C E N T R A L A N D E A S T E R N E U R O P E 45
FIGURE 3
Trends in expenditure on investment and current expenditure by media in Croatia
1997
1998
1999
2000
INVESTMENTS
0.0 10.0 20.0 30.0 40.0 50.0 60.0
EUR MILLIONS
1997
1998
1999
2000
CURRENT EXPENDITURE
Source: Central Bureau of Statistics
0.0 20.0 40.0 60.0 80.0 100.0 120.0
Air Water resources protection Waste Nature Protection/conservation Noise protection
EUR MILLIONS
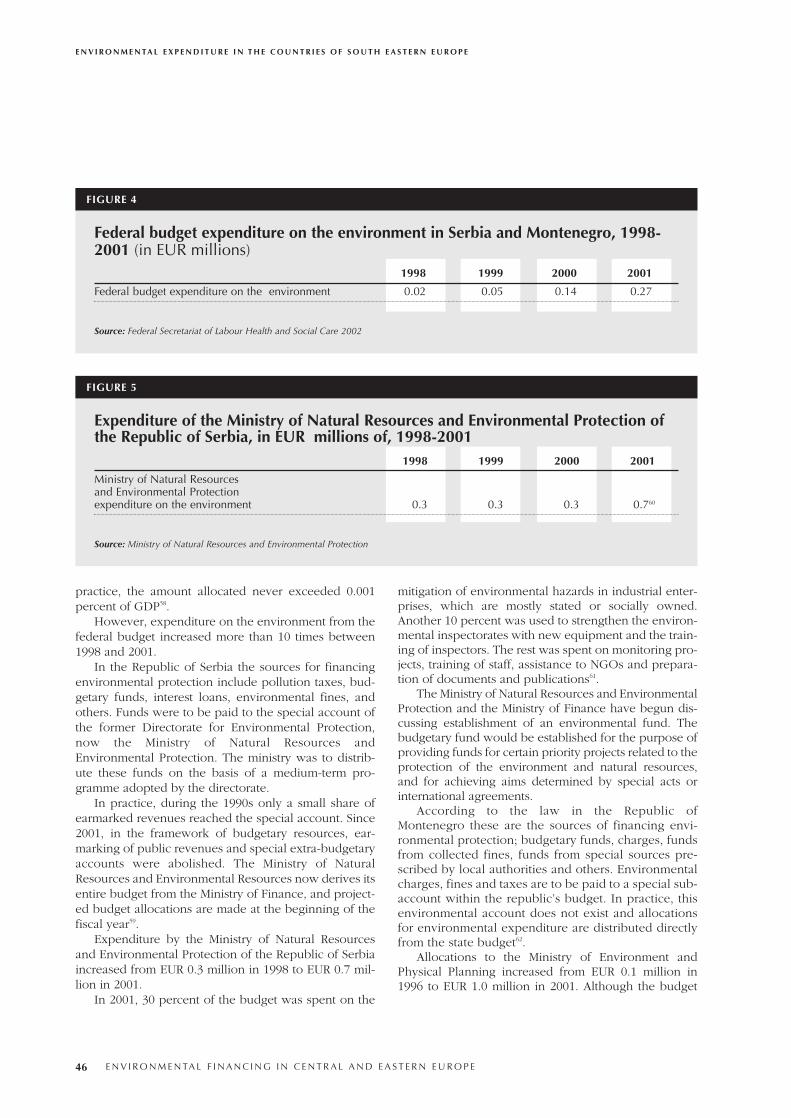
practice, the amount allocated never exceeded 0.001percent of GDP58.
However, expenditure on the environment from thefederal budget increased more than 10 times between1998 and 2001.
In the Republic of Serbia the sources for financingenvironmental protection include pollution taxes, bud-getary funds, interest loans, environmental fines, andothers. Funds were to be paid to the special account ofthe former Directorate for Environmental Protection,now the Ministry of Natural Resources andEnvironmental Protection. The ministry was to distrib-ute these funds on the basis of a medium-term pro-gramme adopted by the directorate.
In practice, during the 1990s only a small share ofearmarked revenues reached the special account. Since2001, in the framework of budgetary resources, ear-marking of public revenues and special extra-budgetaryaccounts were abolished. The Ministry of NaturalResources and Environmental Resources now derives itsentire budget from the Ministry of Finance, and project-ed budget allocations are made at the beginning of thefiscal year59.
Expenditure by the Ministry of Natural Resourcesand Environmental Protection of the Republic of Serbiaincreased from EUR 0.3 million in 1998 to EUR 0.7 mil-lion in 2001.
In 2001, 30 percent of the budget was spent on the
mitigation of environmental hazards in industrial enter-prises, which are mostly stated or socially owned.Another 10 percent was used to strengthen the environ-mental inspectorates with new equipment and the train-ing of inspectors. The rest was spent on monitoring pro-jects, training of staff, assistance to NGOs and prepara-tion of documents and publications61.
The Ministry of Natural Resources and EnvironmentalProtection and the Ministry of Finance have begun dis-cussing establishment of an environmental fund. Thebudgetary fund would be established for the purpose ofproviding funds for certain priority projects related to theprotection of the environment and natural resources,and for achieving aims determined by special acts orinternational agreements.
According to the law in the Republic ofMontenegro these are the sources of financing envi-ronmental protection; budgetary funds, charges, fundsfrom collected fines, funds from special sources pre-scribed by local authorities and others. Environmentalcharges, fines and taxes are to be paid to a special sub-account within the republic’s budget. In practice, thisenvironmental account does not exist and allocationsfor environmental expenditure are distributed directlyfrom the state budget62.
Allocations to the Ministry of Environment andPhysical Planning increased from EUR 0.1 million in1996 to EUR 1.0 million in 2001. Although the budget
E N V I R O N M E N TA L E X P E N D I T U R E I N T H E C O U N T R I E S O F S O U T H E A S T E R N E U R O P E
46 E N V I R O N M E N TA L F I N A N C I N G I N C E N T R A L A N D E A S T E R N E U R O P E
FIGURE 4
1998 1999 2000 2001
Federal budget expenditure on the environment 0.02 0.05 0.14 0.27
Source: Federal Secretariat of Labour Health and Social Care 2002
Federal budget expenditure on the environment in Serbia and Montenegro, 1998-2001 (in EUR millions)
FIGURE 5
1998 1999 2000 2001
Ministry of Natural Resources and Environmental Protection expenditure on the environment 0.3 0.3 0.3 0.760
Source: Ministry of Natural Resources and Environmental Protection
Expenditure of the Ministry of Natural Resources and Environmental Protection ofthe Republic of Serbia, in EUR millions of, 1998-2001
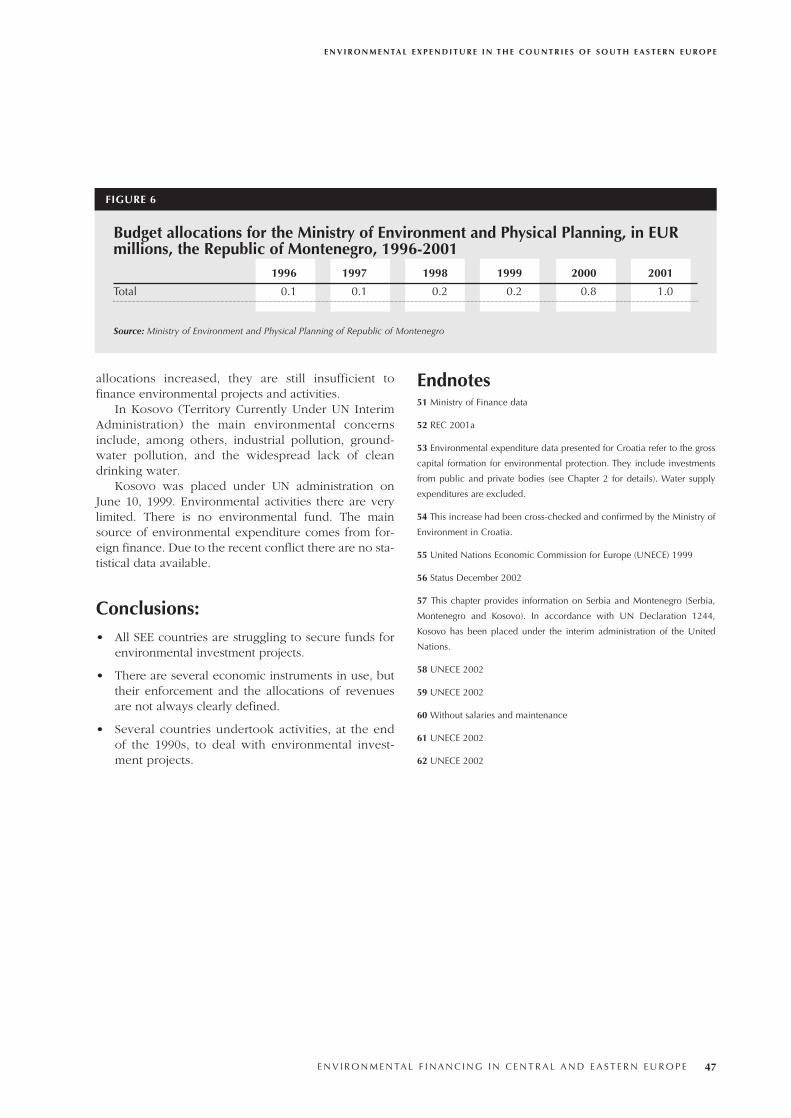
allocations increased, they are still insufficient tofinance environmental projects and activities.
In Kosovo (Territory Currently Under UN InterimAdministration) the main environmental concernsinclude, among others, industrial pollution, ground-water pollution, and the widespread lack of cleandrinking water.
Kosovo was placed under UN administration onJune 10, 1999. Environmental activities there are verylimited. There is no environmental fund. The mainsource of environmental expenditure comes from for-eign finance. Due to the recent conflict there are no sta-tistical data available.
Conclusions:• All SEE countries are struggling to secure funds for
environmental investment projects.
• There are several economic instruments in use, buttheir enforcement and the allocations of revenuesare not always clearly defined.
• Several countries undertook activities, at the endof the 1990s, to deal with environmental invest-ment projects.
Endnotes51 Ministry of Finance data
52 REC 2001a
53 Environmental expenditure data presented for Croatia refer to the gross
capital formation for environmental protection. They include investments
from public and private bodies (see Chapter 2 for details). Water supply
expenditures are excluded.
54 This increase had been cross-checked and confirmed by the Ministry of
Environment in Croatia.
55 United Nations Economic Commission for Europe (UNECE) 1999
56 Status December 2002
57 This chapter provides information on Serbia and Montenegro (Serbia,
Montenegro and Kosovo). In accordance with UN Declaration 1244,
Kosovo has been placed under the interim administration of the United
Nations.
58 UNECE 2002
59 UNECE 2002
60 Without salaries and maintenance
61 UNECE 2002
62 UNECE 2002
E N V I R O N M E N TA L E X P E N D I T U R E I N T H E C O U N T R I E S O F S O U T H E A S T E R N E U R O P E
E N V I R O N M E N TA L F I N A N C I N G I N C E N T R A L A N D E A S T E R N E U R O P E 47
FIGURE 6
1996 1997 1998 1999 2000 2001
Total 0.1 0.1 0.2 0.2 0.8 1.0
Source: Ministry of Environment and Physical Planning of Republic of Montenegro
Budget allocations for the Ministry of Environment and Physical Planning, in EURmillions, the Republic of Montenegro, 1996-2001

48 E N V I R O N M E N TA L F I N A N C I N G I N C E N T R A L A N D E A S T E R N E U R O P E
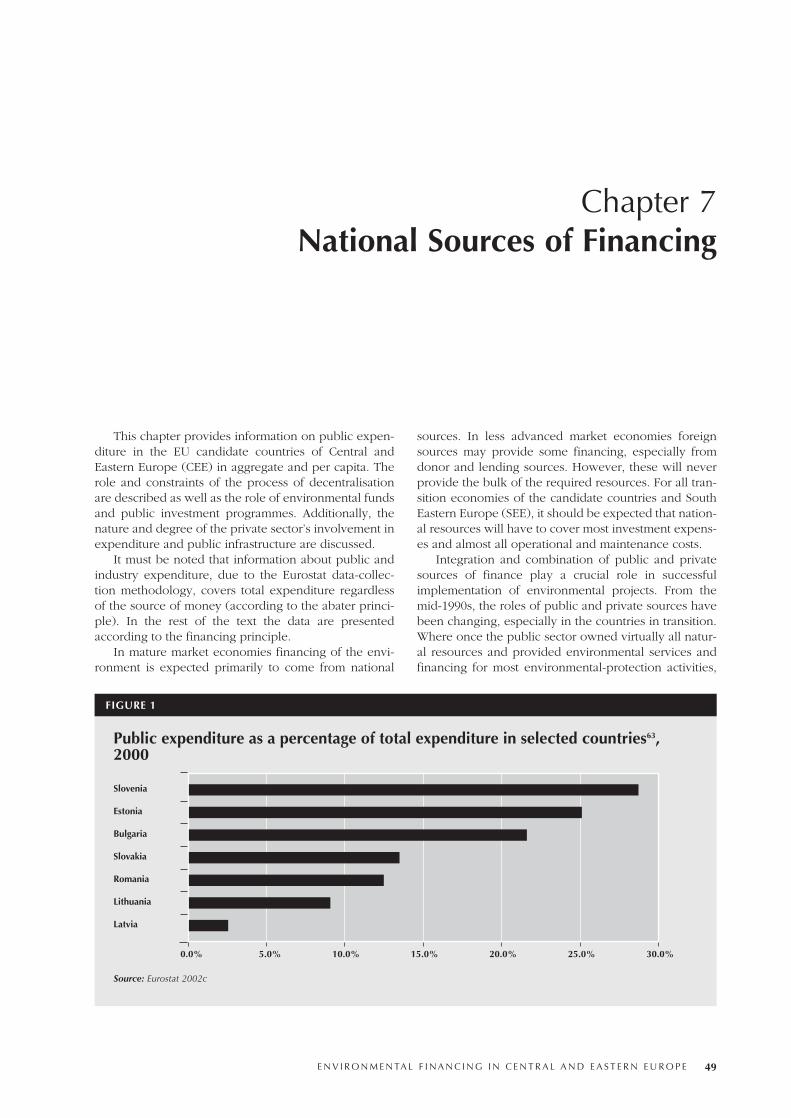
This chapter provides information on public expen-diture in the EU candidate countries of Central andEastern Europe (CEE) in aggregate and per capita. Therole and constraints of the process of decentralisationare described as well as the role of environmental fundsand public investment programmes. Additionally, thenature and degree of the private sector’s involvement inexpenditure and public infrastructure are discussed.
It must be noted that information about public andindustry expenditure, due to the Eurostat data-collec-tion methodology, covers total expenditure regardlessof the source of money (according to the abater princi-ple). In the rest of the text the data are presentedaccording to the financing principle.
In mature market economies financing of the envi-ronment is expected primarily to come from national
sources. In less advanced market economies foreignsources may provide some financing, especially fromdonor and lending sources. However, these will neverprovide the bulk of the required resources. For all tran-sition economies of the candidate countries and SouthEastern Europe (SEE), it should be expected that nation-al resources will have to cover most investment expens-es and almost all operational and maintenance costs.
Integration and combination of public and privatesources of finance play a crucial role in successfulimplementation of environmental projects. From themid-1990s, the roles of public and private sources havebeen changing, especially in the countries in transition.Where once the public sector owned virtually all natur-al resources and provided environmental services andfinancing for most environmental-protection activities,
E N V I R O N M E N TA L F I N A N C I N G I N C E N T R A L A N D E A S T E R N E U R O P E 49
Chapter 7National Sources of Financing
FIGURE 1
Slovenia
Estonia
Bulgaria
Slovakia
Romania
Lithuania
Latvia
Source: Eurostat 2002c
0.0% 15.0% 20.0% 25.0% 30.0%
Public expenditure as a percentage of total expenditure in selected countries63,2000
10.0%5.0%
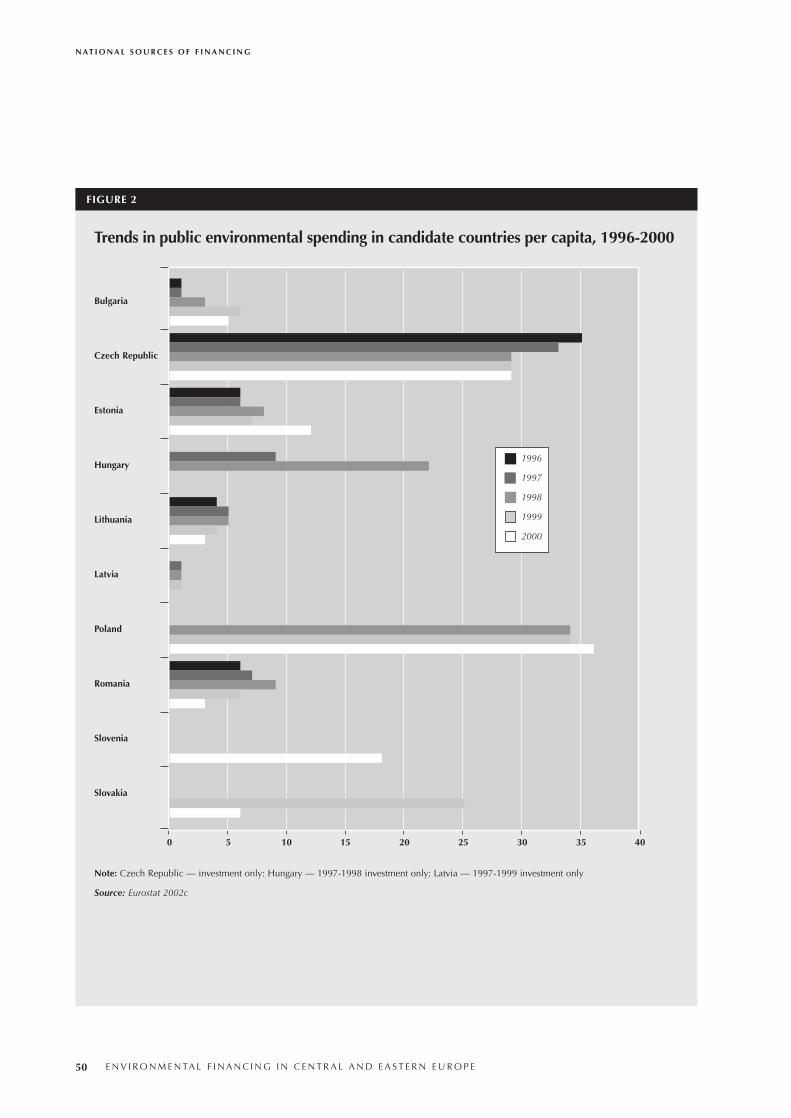
N AT I O N A L S O U R C E S O F F I N A N C I N G
50 E N V I R O N M E N TA L F I N A N C I N G I N C E N T R A L A N D E A S T E R N E U R O P E
Trends in public environmental spending in candidate countries per capita, 1996-2000
FIGURE 2
Bulgaria
Czech Republic
Estonia
Hungary
Lithuania
Latvia
Poland
Romania
Slovenia
Slovakia
0 5 10 15 20 25 30 35 40
Note: Czech Republic — investment only: Hungary — 1997-1998 investment only; Latvia — 1997-1999 investment only
Source: Eurostat 2002c
1996
1997
1998
1999
2000
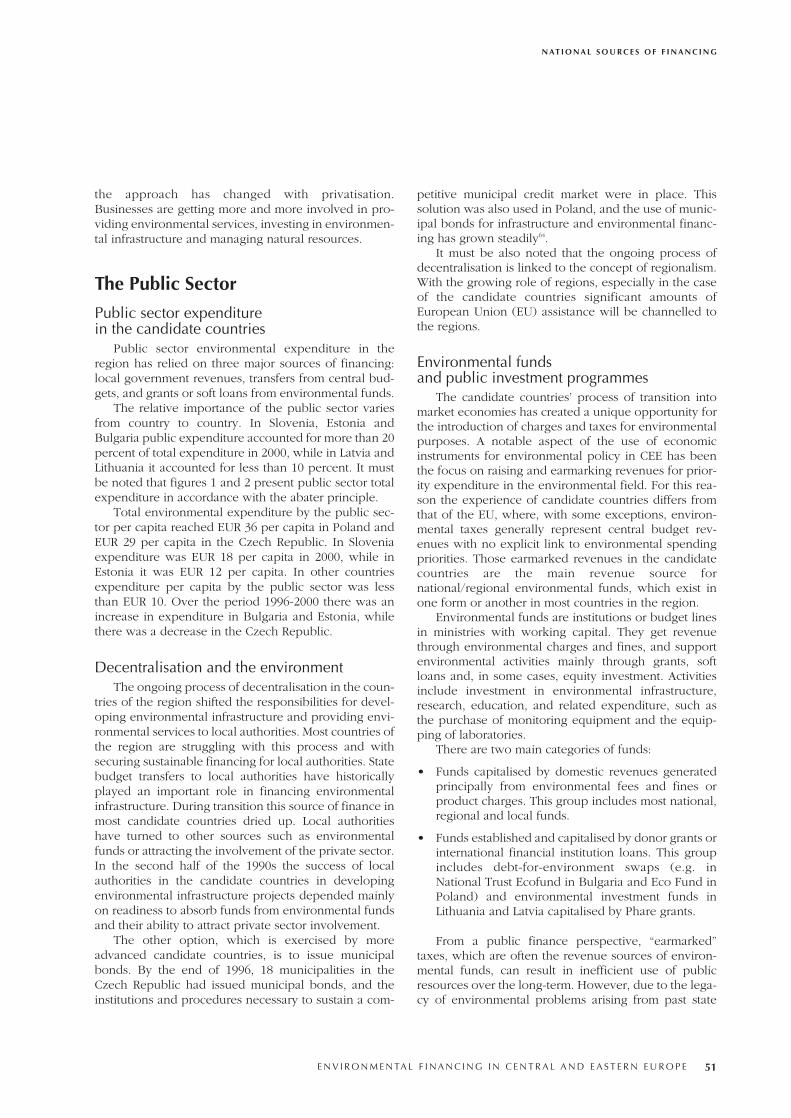
the approach has changed with privatisation.Businesses are getting more and more involved in pro-viding environmental services, investing in environmen-tal infrastructure and managing natural resources.
The Public Sector
Public sector expenditure in the candidate countries
Public sector environmental expenditure in theregion has relied on three major sources of financing:local government revenues, transfers from central bud-gets, and grants or soft loans from environmental funds.
The relative importance of the public sector variesfrom country to country. In Slovenia, Estonia andBulgaria public expenditure accounted for more than 20percent of total expenditure in 2000, while in Latvia andLithuania it accounted for less than 10 percent. It mustbe noted that figures 1 and 2 present public sector totalexpenditure in accordance with the abater principle.
Total environmental expenditure by the public sec-tor per capita reached EUR 36 per capita in Poland andEUR 29 per capita in the Czech Republic. In Sloveniaexpenditure was EUR 18 per capita in 2000, while inEstonia it was EUR 12 per capita. In other countriesexpenditure per capita by the public sector was lessthan EUR 10. Over the period 1996-2000 there was anincrease in expenditure in Bulgaria and Estonia, whilethere was a decrease in the Czech Republic.
Decentralisation and the environmentThe ongoing process of decentralisation in the coun-
tries of the region shifted the responsibilities for devel-oping environmental infrastructure and providing envi-ronmental services to local authorities. Most countries ofthe region are struggling with this process and withsecuring sustainable financing for local authorities. Statebudget transfers to local authorities have historicallyplayed an important role in financing environmentalinfrastructure. During transition this source of finance inmost candidate countries dried up. Local authoritieshave turned to other sources such as environmentalfunds or attracting the involvement of the private sector.In the second half of the 1990s the success of localauthorities in the candidate countries in developingenvironmental infrastructure projects depended mainlyon readiness to absorb funds from environmental fundsand their ability to attract private sector involvement.
The other option, which is exercised by moreadvanced candidate countries, is to issue municipalbonds. By the end of 1996, 18 municipalities in theCzech Republic had issued municipal bonds, and theinstitutions and procedures necessary to sustain a com-
petitive municipal credit market were in place. Thissolution was also used in Poland, and the use of munic-ipal bonds for infrastructure and environmental financ-ing has grown steadily64.
It must be also noted that the ongoing process ofdecentralisation is linked to the concept of regionalism.With the growing role of regions, especially in the caseof the candidate countries significant amounts ofEuropean Union (EU) assistance will be channelled tothe regions.
Environmental funds and public investment programmes
The candidate countries’ process of transition intomarket economies has created a unique opportunity forthe introduction of charges and taxes for environmentalpurposes. A notable aspect of the use of economicinstruments for environmental policy in CEE has beenthe focus on raising and earmarking revenues for prior-ity expenditure in the environmental field. For this rea-son the experience of candidate countries differs fromthat of the EU, where, with some exceptions, environ-mental taxes generally represent central budget rev-enues with no explicit link to environmental spendingpriorities. Those earmarked revenues in the candidatecountries are the main revenue source fornational/regional environmental funds, which exist inone form or another in most countries in the region.
Environmental funds are institutions or budget linesin ministries with working capital. They get revenuethrough environmental charges and fines, and supportenvironmental activities mainly through grants, softloans and, in some cases, equity investment. Activitiesinclude investment in environmental infrastructure,research, education, and related expenditure, such asthe purchase of monitoring equipment and the equip-ping of laboratories.
There are two main categories of funds:
• Funds capitalised by domestic revenues generatedprincipally from environmental fees and fines orproduct charges. This group includes most national,regional and local funds.
• Funds established and capitalised by donor grants orinternational financial institution loans. This groupincludes debt-for-environment swaps (e.g. inNational Trust Ecofund in Bulgaria and Eco Fund inPoland) and environmental investment funds inLithuania and Latvia capitalised by Phare grants.
From a public finance perspective, “earmarked”taxes, which are often the revenue sources of environ-mental funds, can result in inefficient use of publicresources over the long-term. However, due to the lega-cy of environmental problems arising from past state
N AT I O N A L S O U R C E S O F F I N A N C I N G
E N V I R O N M E N TA L F I N A N C I N G I N C E N T R A L A N D E A S T E R N E U R O P E 51
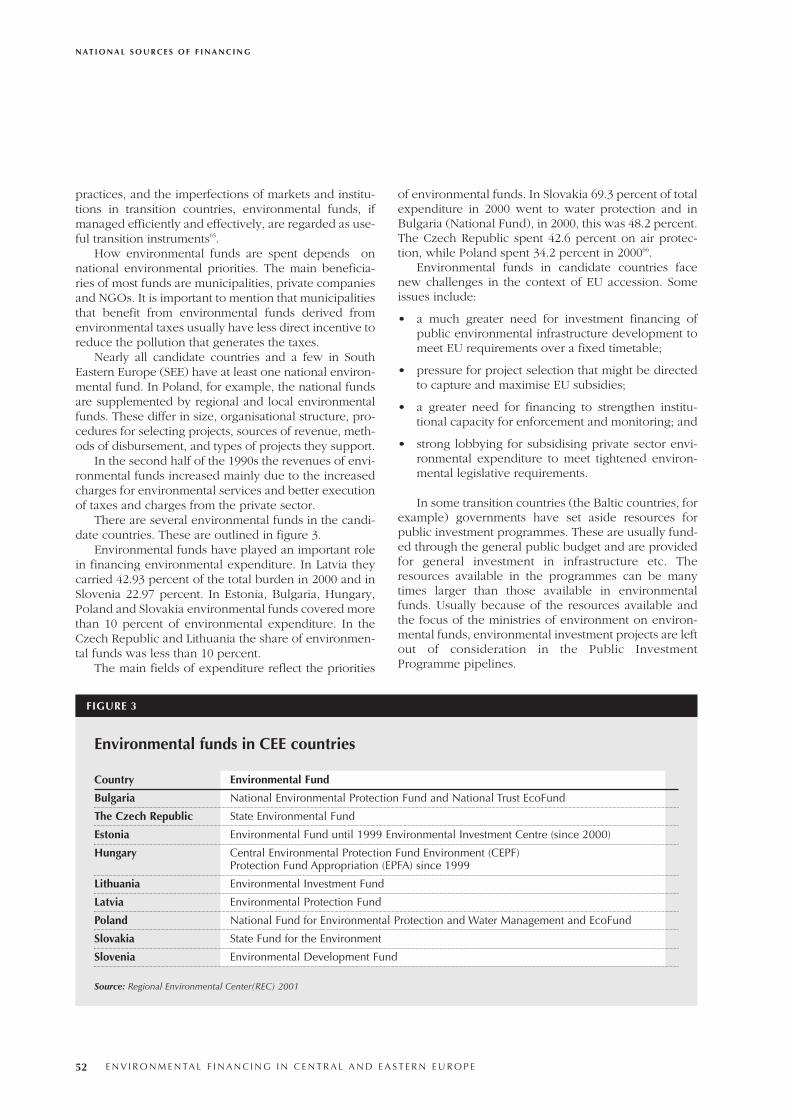
practices, and the imperfections of markets and institu-tions in transition countries, environmental funds, ifmanaged efficiently and effectively, are regarded as use-ful transition instruments65.
How environmental funds are spent depends onnational environmental priorities. The main beneficia-ries of most funds are municipalities, private companiesand NGOs. It is important to mention that municipalitiesthat benefit from environmental funds derived fromenvironmental taxes usually have less direct incentive toreduce the pollution that generates the taxes.
Nearly all candidate countries and a few in SouthEastern Europe (SEE) have at least one national environ-mental fund. In Poland, for example, the national fundsare supplemented by regional and local environmentalfunds. These differ in size, organisational structure, pro-cedures for selecting projects, sources of revenue, meth-ods of disbursement, and types of projects they support.
In the second half of the 1990s the revenues of envi-ronmental funds increased mainly due to the increasedcharges for environmental services and better executionof taxes and charges from the private sector.
There are several environmental funds in the candi-date countries. These are outlined in figure 3.
Environmental funds have played an important rolein financing environmental expenditure. In Latvia theycarried 42.93 percent of the total burden in 2000 and inSlovenia 22.97 percent. In Estonia, Bulgaria, Hungary,Poland and Slovakia environmental funds covered morethan 10 percent of environmental expenditure. In theCzech Republic and Lithuania the share of environmen-tal funds was less than 10 percent.
The main fields of expenditure reflect the priorities
of environmental funds. In Slovakia 69.3 percent of totalexpenditure in 2000 went to water protection and inBulgaria (National Fund), in 2000, this was 48.2 percent.The Czech Republic spent 42.6 percent on air protec-tion, while Poland spent 34.2 percent in 200066.
Environmental funds in candidate countries facenew challenges in the context of EU accession. Someissues include:
• a much greater need for investment financing ofpublic environmental infrastructure development tomeet EU requirements over a fixed timetable;
• pressure for project selection that might be directedto capture and maximise EU subsidies;
• a greater need for financing to strengthen institu-tional capacity for enforcement and monitoring; and
• strong lobbying for subsidising private sector envi-ronmental expenditure to meet tightened environ-mental legislative requirements.
In some transition countries (the Baltic countries, forexample) governments have set aside resources forpublic investment programmes. These are usually fund-ed through the general public budget and are providedfor general investment in infrastructure etc. Theresources available in the programmes can be manytimes larger than those available in environmentalfunds. Usually because of the resources available andthe focus of the ministries of environment on environ-mental funds, environmental investment projects are leftout of consideration in the Public InvestmentProgramme pipelines.
N AT I O N A L S O U R C E S O F F I N A N C I N G
52 E N V I R O N M E N TA L F I N A N C I N G I N C E N T R A L A N D E A S T E R N E U R O P E
Environmental funds in CEE countries
FIGURE 3
Country Environmental Fund
Bulgaria National Environmental Protection Fund and National Trust EcoFund
The Czech Republic State Environmental Fund
Estonia Environmental Fund until 1999 Environmental Investment Centre (since 2000)
Hungary Central Environmental Protection Fund Environment (CEPF) Protection Fund Appropriation (EPFA) since 1999
Lithuania Environmental Investment Fund
Latvia Environmental Protection Fund
Poland National Fund for Environmental Protection and Water Management and EcoFund
Slovakia State Fund for the Environment
Slovenia Environmental Development Fund
Source: Regional Environmental Center(REC) 2001
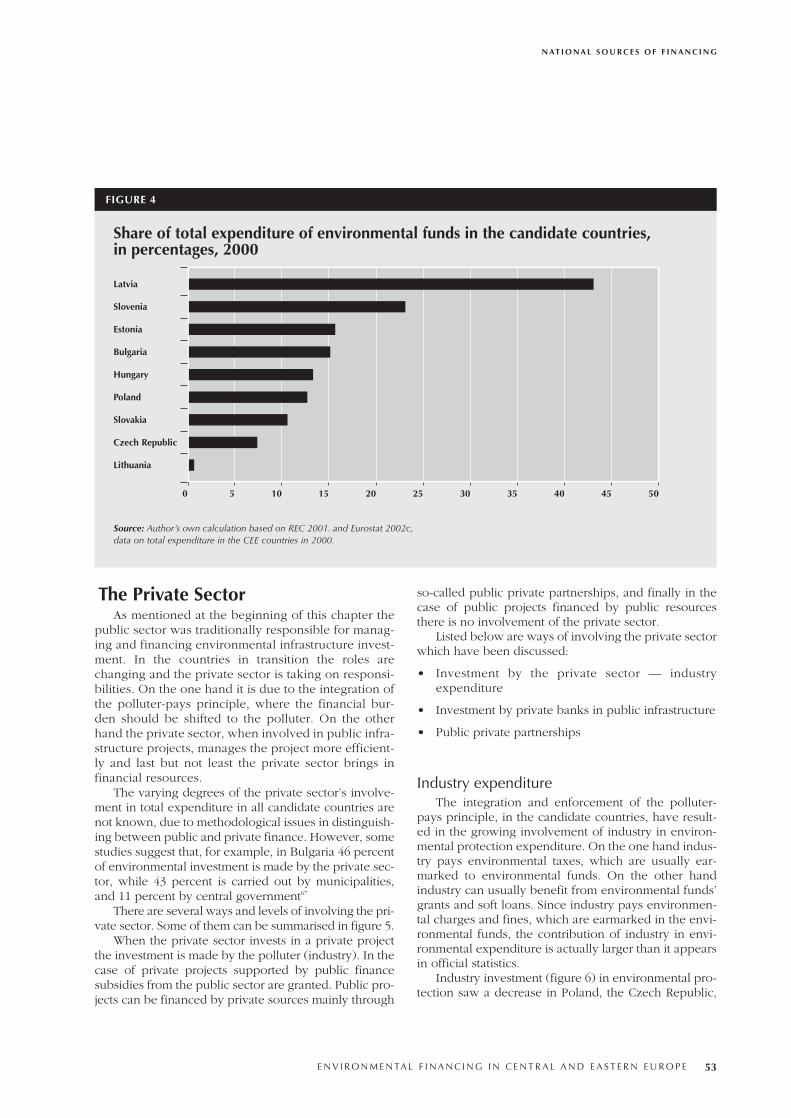
The Private Sector As mentioned at the beginning of this chapter the
public sector was traditionally responsible for manag-ing and financing environmental infrastructure invest-ment. In the countries in transition the roles arechanging and the private sector is taking on responsi-bilities. On the one hand it is due to the integration ofthe polluter-pays principle, where the financial bur-den should be shifted to the polluter. On the otherhand the private sector, when involved in public infra-structure projects, manages the project more efficient-ly and last but not least the private sector brings infinancial resources.
The varying degrees of the private sector’s involve-ment in total expenditure in all candidate countries arenot known, due to methodological issues in distinguish-ing between public and private finance. However, somestudies suggest that, for example, in Bulgaria 46 percentof environmental investment is made by the private sec-tor, while 43 percent is carried out by municipalities,and 11 percent by central government67
There are several ways and levels of involving the pri-vate sector. Some of them can be summarised in figure 5.
When the private sector invests in a private projectthe investment is made by the polluter (industry). In thecase of private projects supported by public financesubsidies from the public sector are granted. Public pro-jects can be financed by private sources mainly through
so-called public private partnerships, and finally in thecase of public projects financed by public resourcesthere is no involvement of the private sector.
Listed below are ways of involving the private sectorwhich have been discussed:
• Investment by the private sector — industryexpenditure
• Investment by private banks in public infrastructure
• Public private partnerships
Industry expenditureThe integration and enforcement of the polluter-
pays principle, in the candidate countries, have result-ed in the growing involvement of industry in environ-mental protection expenditure. On the one hand indus-try pays environmental taxes, which are usually ear-marked to environmental funds. On the other handindustry can usually benefit from environmental funds’grants and soft loans. Since industry pays environmen-tal charges and fines, which are earmarked in the envi-ronmental funds, the contribution of industry in envi-ronmental expenditure is actually larger than it appearsin official statistics.
Industry investment (figure 6) in environmental pro-tection saw a decrease in Poland, the Czech Republic,
N AT I O N A L S O U R C E S O F F I N A N C I N G
E N V I R O N M E N TA L F I N A N C I N G I N C E N T R A L A N D E A S T E R N E U R O P E 53
FIGURE 4
Latvia
Slovenia
Estonia
Bulgaria
Hungary
Poland
Slovakia
Czech Republic
Lithuania
Source: Author’s own calculation based on REC 2001. and Eurostat 2002c,data on total expenditure in the CEE countries in 2000.
0 5 10 15 20 25 30 35 40 45 50
Share of total expenditure of environmental funds in the candidate countries, in percentages, 2000
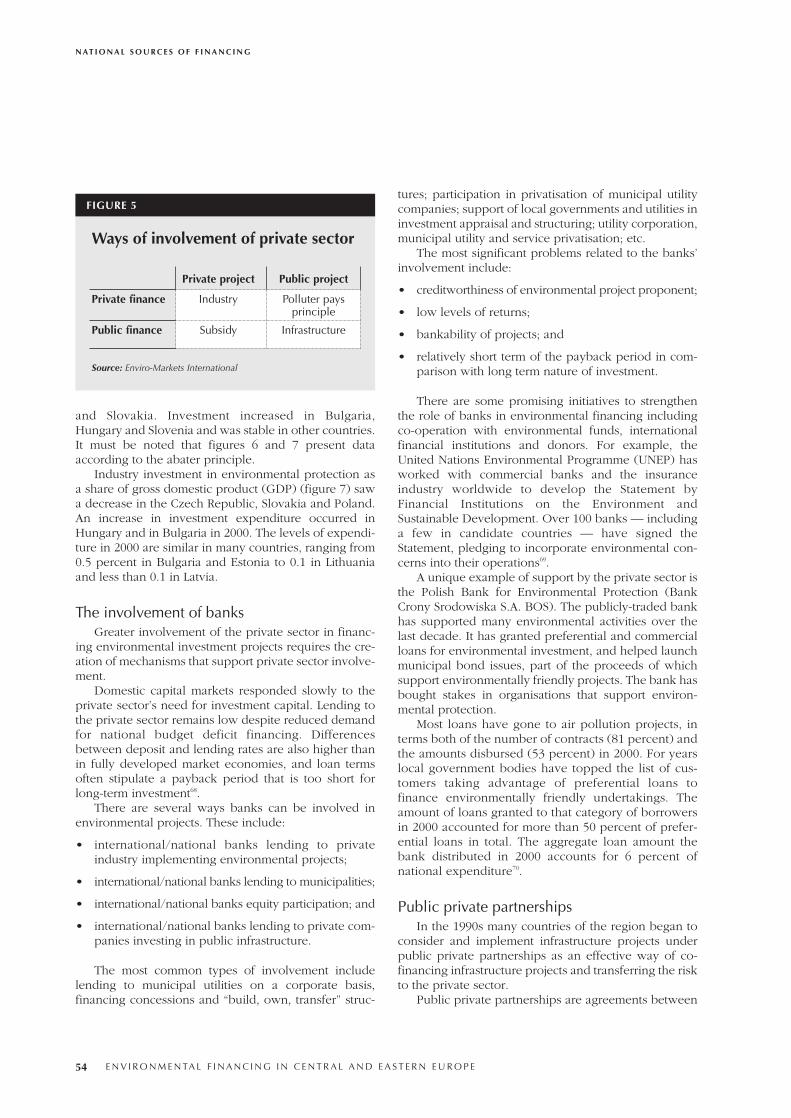
and Slovakia. Investment increased in Bulgaria,Hungary and Slovenia and was stable in other countries.It must be noted that figures 6 and 7 present dataaccording to the abater principle.
Industry investment in environmental protection asa share of gross domestic product (GDP) (figure 7) sawa decrease in the Czech Republic, Slovakia and Poland.An increase in investment expenditure occurred inHungary and in Bulgaria in 2000. The levels of expendi-ture in 2000 are similar in many countries, ranging from0.5 percent in Bulgaria and Estonia to 0.1 in Lithuaniaand less than 0.1 in Latvia.
The involvement of banks Greater involvement of the private sector in financ-
ing environmental investment projects requires the cre-ation of mechanisms that support private sector involve-ment.
Domestic capital markets responded slowly to theprivate sector’s need for investment capital. Lending tothe private sector remains low despite reduced demandfor national budget deficit financing. Differencesbetween deposit and lending rates are also higher thanin fully developed market economies, and loan termsoften stipulate a payback period that is too short forlong-term investment68.
There are several ways banks can be involved inenvironmental projects. These include:
• international/national banks lending to privateindustry implementing environmental projects;
• international/national banks lending to municipalities;
• international/national banks equity participation; and
• international/national banks lending to private com-panies investing in public infrastructure.
The most common types of involvement includelending to municipal utilities on a corporate basis,financing concessions and “build, own, transfer” struc-
tures; participation in privatisation of municipal utilitycompanies; support of local governments and utilities ininvestment appraisal and structuring; utility corporation,municipal utility and service privatisation; etc.
The most significant problems related to the banks’involvement include:
• creditworthiness of environmental project proponent;
• low levels of returns;
• bankability of projects; and
• relatively short term of the payback period in com-parison with long term nature of investment.
There are some promising initiatives to strengthenthe role of banks in environmental financing includingco-operation with environmental funds, internationalfinancial institutions and donors. For example, theUnited Nations Environmental Programme (UNEP) hasworked with commercial banks and the insuranceindustry worldwide to develop the Statement byFinancial Institutions on the Environment andSustainable Development. Over 100 banks — includinga few in candidate countries — have signed theStatement, pledging to incorporate environmental con-cerns into their operations69.
A unique example of support by the private sector isthe Polish Bank for Environmental Protection (BankCrony Srodowiska S.A. BOS). The publicly-traded bankhas supported many environmental activities over thelast decade. It has granted preferential and commercialloans for environmental investment, and helped launchmunicipal bond issues, part of the proceeds of whichsupport environmentally friendly projects. The bank hasbought stakes in organisations that support environ-mental protection.
Most loans have gone to air pollution projects, interms both of the number of contracts (81 percent) andthe amounts disbursed (53 percent) in 2000. For yearslocal government bodies have topped the list of cus-tomers taking advantage of preferential loans tofinance environmentally friendly undertakings. Theamount of loans granted to that category of borrowersin 2000 accounted for more than 50 percent of prefer-ential loans in total. The aggregate loan amount thebank distributed in 2000 accounts for 6 percent ofnational expenditure70.
Public private partnershipsIn the 1990s many countries of the region began to
consider and implement infrastructure projects underpublic private partnerships as an effective way of co-financing infrastructure projects and transferring the riskto the private sector.
Public private partnerships are agreements between
N AT I O N A L S O U R C E S O F F I N A N C I N G
54 E N V I R O N M E N TA L F I N A N C I N G I N C E N T R A L A N D E A S T E R N E U R O P E
FIGURE 5
Ways of involvement of private sector
Private project Public project
Private finance Industry Polluter paysprinciple
Public finance Subsidy Infrastructure
Source: Enviro-Markets International
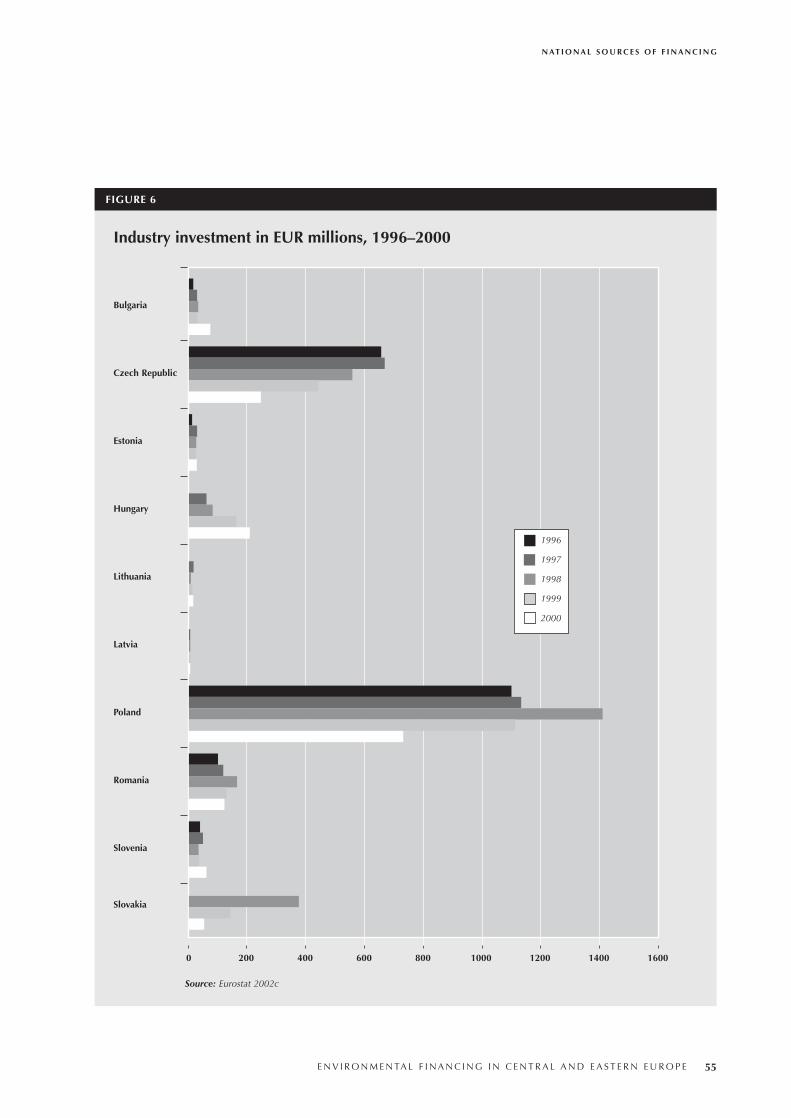
N AT I O N A L S O U R C E S O F F I N A N C I N G
E N V I R O N M E N TA L F I N A N C I N G I N C E N T R A L A N D E A S T E R N E U R O P E 55
Industry investment in EUR millions, 1996–2000
FIGURE 6
Bulgaria
Czech Republic
Estonia
Hungary
Lithuania
Latvia
Poland
Romania
Slovenia
Slovakia
0 200 400 600 1000800 1200 1400 1600
Source: Eurostat 2002c
1996
1997
1998
1999
2000
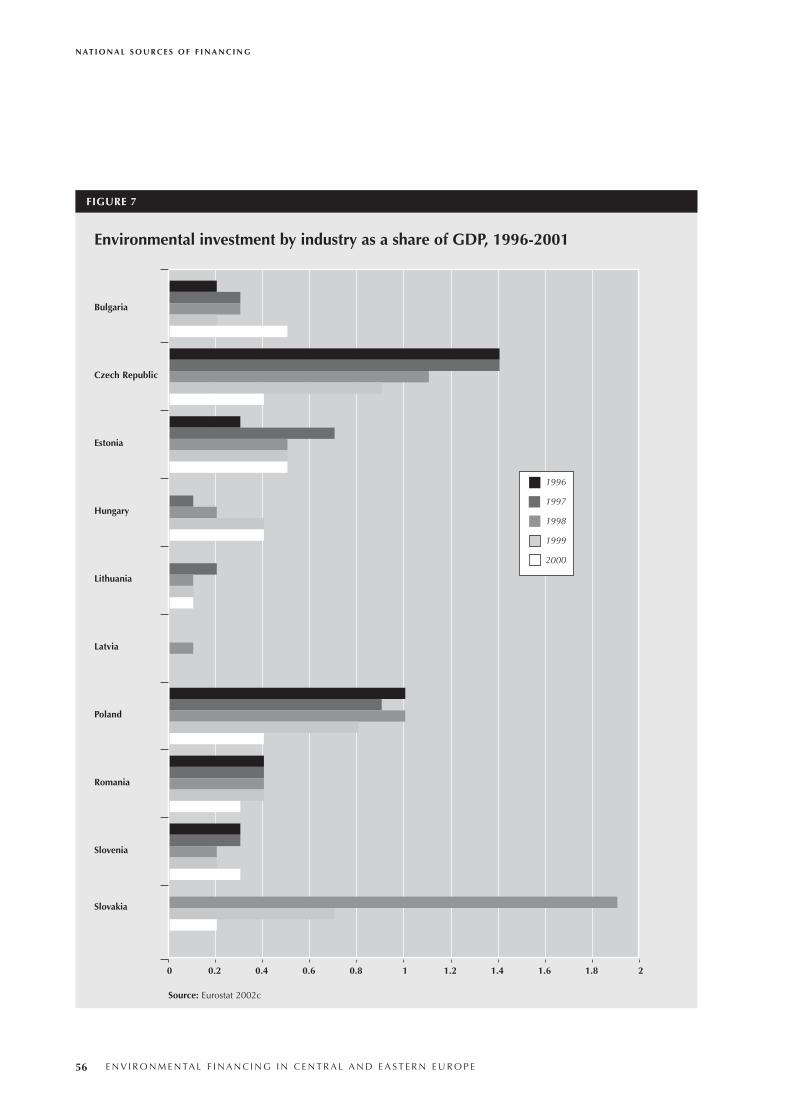
N AT I O N A L S O U R C E S O F F I N A N C I N G
56 E N V I R O N M E N TA L F I N A N C I N G I N C E N T R A L A N D E A S T E R N E U R O P E
Environmental investment by industry as a share of GDP, 1996-2001
FIGURE 7
Bulgaria
Czech Republic
Estonia
Hungary
Lithuania
Latvia
Poland
Romania
Slovenia
Slovakia
0 0.2 0.4 0.6 0.8 1 1.2 1.4 1.6 1.8 2
Source: Eurostat 2002c
1996
1997
1998
1999
2000
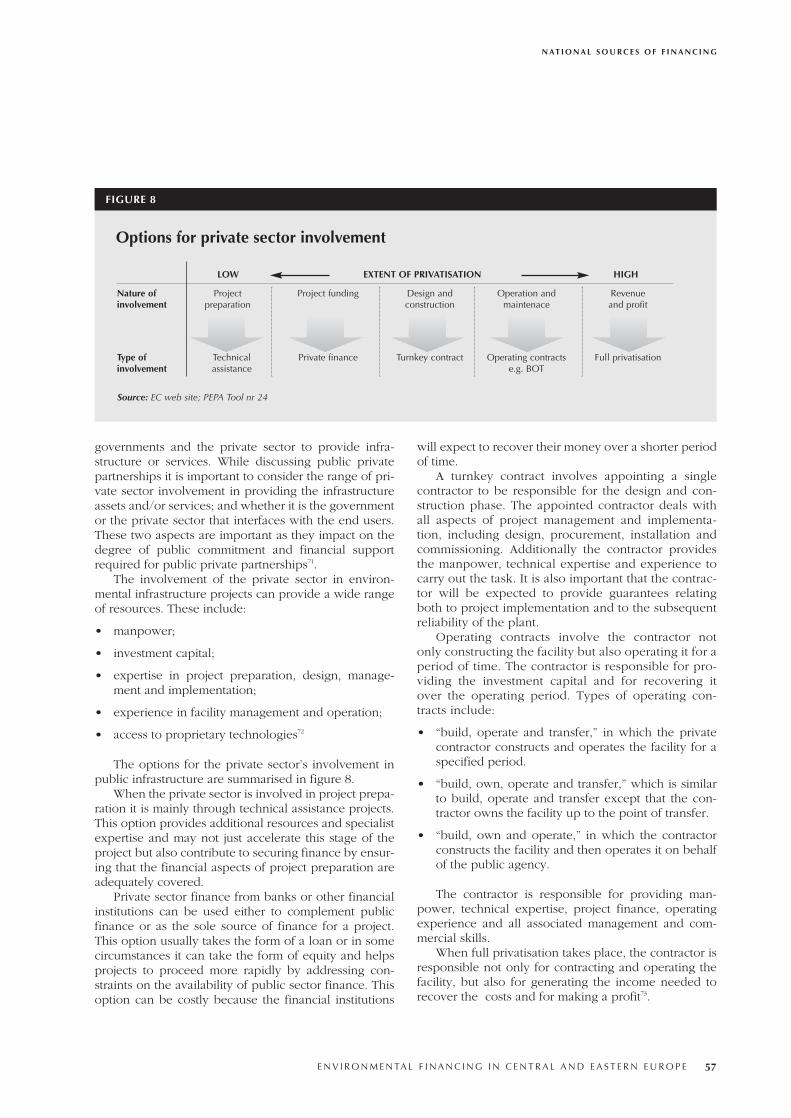
governments and the private sector to provide infra-structure or services. While discussing public privatepartnerships it is important to consider the range of pri-vate sector involvement in providing the infrastructureassets and/or services; and whether it is the governmentor the private sector that interfaces with the end users.These two aspects are important as they impact on thedegree of public commitment and financial supportrequired for public private partnerships71.
The involvement of the private sector in environ-mental infrastructure projects can provide a wide rangeof resources. These include:
• manpower;
• investment capital;
• expertise in project preparation, design, manage-ment and implementation;
• experience in facility management and operation;
• access to proprietary technologies72
The options for the private sector’s involvement inpublic infrastructure are summarised in figure 8.
When the private sector is involved in project prepa-ration it is mainly through technical assistance projects.This option provides additional resources and specialistexpertise and may not just accelerate this stage of theproject but also contribute to securing finance by ensur-ing that the financial aspects of project preparation areadequately covered.
Private sector finance from banks or other financialinstitutions can be used either to complement publicfinance or as the sole source of finance for a project.This option usually takes the form of a loan or in somecircumstances it can take the form of equity and helpsprojects to proceed more rapidly by addressing con-straints on the availability of public sector finance. Thisoption can be costly because the financial institutions
will expect to recover their money over a shorter periodof time.
A turnkey contract involves appointing a singlecontractor to be responsible for the design and con-struction phase. The appointed contractor deals withall aspects of project management and implementa-tion, including design, procurement, installation andcommissioning. Additionally the contractor providesthe manpower, technical expertise and experience tocarry out the task. It is also important that the contrac-tor will be expected to provide guarantees relatingboth to project implementation and to the subsequentreliability of the plant.
Operating contracts involve the contractor notonly constructing the facility but also operating it for aperiod of time. The contractor is responsible for pro-viding the investment capital and for recovering itover the operating period. Types of operating con-tracts include:
• “build, operate and transfer,” in which the privatecontractor constructs and operates the facility for aspecified period.
• “build, own, operate and transfer,” which is similarto build, operate and transfer except that the con-tractor owns the facility up to the point of transfer.
• “build, own and operate,” in which the contractorconstructs the facility and then operates it on behalfof the public agency.
The contractor is responsible for providing man-power, technical expertise, project finance, operatingexperience and all associated management and com-mercial skills.
When full privatisation takes place, the contractor isresponsible not only for contracting and operating thefacility, but also for generating the income needed torecover the costs and for making a profit73.
N AT I O N A L S O U R C E S O F F I N A N C I N G
E N V I R O N M E N TA L F I N A N C I N G I N C E N T R A L A N D E A S T E R N E U R O P E 57
Source: EC web site; PEPA Tool nr 24
Options for private sector involvement
FIGURE 8
LOW EXTENT OF PRIVATISATION HIGH
Nature of Project Project funding Design and Operation and Revenue involvement preparation construction maintenace and profit
Type of Technical Private finance Turnkey contract Operating contracts Full privatisationinvolvement assistance e.g. BOT
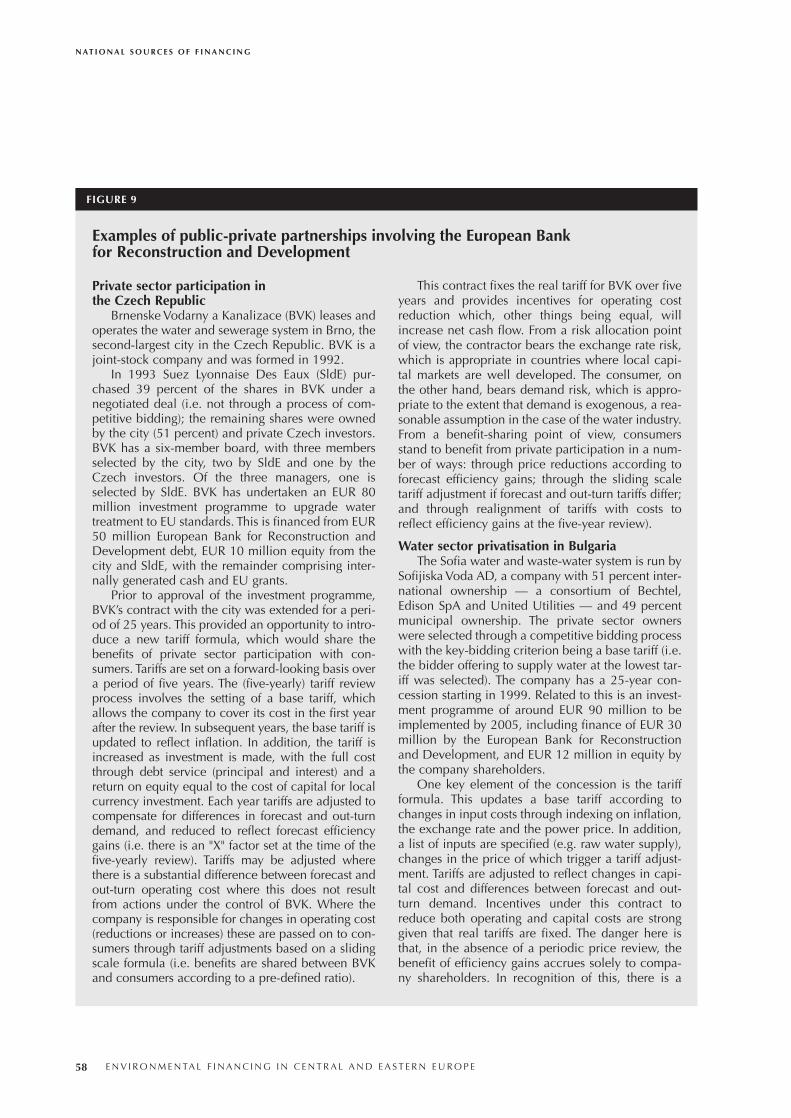
N AT I O N A L S O U R C E S O F F I N A N C I N G
58 E N V I R O N M E N TA L F I N A N C I N G I N C E N T R A L A N D E A S T E R N E U R O P E
FIGURE 9
Private sector participation in the Czech Republic
Brnenske Vodarny a Kanalizace (BVK) leases andoperates the water and sewerage system in Brno, thesecond-largest city in the Czech Republic. BVK is ajoint-stock company and was formed in 1992.
In 1993 Suez Lyonnaise Des Eaux (SldE) pur-chased 39 percent of the shares in BVK under anegotiated deal (i.e. not through a process of com-petitive bidding); the remaining shares were ownedby the city (51 percent) and private Czech investors.BVK has a six-member board, with three membersselected by the city, two by SldE and one by theCzech investors. Of the three managers, one isselected by SldE. BVK has undertaken an EUR 80million investment programme to upgrade watertreatment to EU standards. This is financed from EUR50 million European Bank for Reconstruction andDevelopment debt, EUR 10 million equity from thecity and SldE, with the remainder comprising inter-nally generated cash and EU grants.
Prior to approval of the investment programme,BVK’s contract with the city was extended for a peri-od of 25 years. This provided an opportunity to intro-duce a new tariff formula, which would share thebenefits of private sector participation with con-sumers. Tariffs are set on a forward-looking basis overa period of five years. The (five-yearly) tariff reviewprocess involves the setting of a base tariff, whichallows the company to cover its cost in the first yearafter the review. In subsequent years, the base tariff isupdated to reflect inflation. In addition, the tariff isincreased as investment is made, with the full costthrough debt service (principal and interest) and areturn on equity equal to the cost of capital for localcurrency investment. Each year tariffs are adjusted tocompensate for differences in forecast and out-turndemand, and reduced to reflect forecast efficiencygains (i.e. there is an "X" factor set at the time of thefive-yearly review). Tariffs may be adjusted wherethere is a substantial difference between forecast andout-turn operating cost where this does not resultfrom actions under the control of BVK. Where thecompany is responsible for changes in operating cost(reductions or increases) these are passed on to con-sumers through tariff adjustments based on a slidingscale formula (i.e. benefits are shared between BVKand consumers according to a pre-defined ratio).
This contract fixes the real tariff for BVK over fiveyears and provides incentives for operating costreduction which, other things being equal, willincrease net cash flow. From a risk allocation pointof view, the contractor bears the exchange rate risk,which is appropriate in countries where local capi-tal markets are well developed. The consumer, onthe other hand, bears demand risk, which is appro-priate to the extent that demand is exogenous, a rea-sonable assumption in the case of the water industry.From a benefit-sharing point of view, consumersstand to benefit from private participation in a num-ber of ways: through price reductions according toforecast efficiency gains; through the sliding scaletariff adjustment if forecast and out-turn tariffs differ;and through realignment of tariffs with costs toreflect efficiency gains at the five-year review).
Water sector privatisation in BulgariaThe Sofia water and waste-water system is run by
Sofijiska Voda AD, a company with 51 percent inter-national ownership — a consortium of Bechtel,Edison SpA and United Utilities — and 49 percentmunicipal ownership. The private sector ownerswere selected through a competitive bidding processwith the key-bidding criterion being a base tariff (i.e.the bidder offering to supply water at the lowest tar-iff was selected). The company has a 25-year con-cession starting in 1999. Related to this is an invest-ment programme of around EUR 90 million to beimplemented by 2005, including finance of EUR 30million by the European Bank for Reconstructionand Development, and EUR 12 million in equity bythe company shareholders.
One key element of the concession is the tariffformula. This updates a base tariff according tochanges in input costs through indexing on inflation,the exchange rate and the power price. In addition,a list of inputs are specified (e.g. raw water supply),changes in the price of which trigger a tariff adjust-ment. Tariffs are adjusted to reflect changes in capi-tal cost and differences between forecast and out-turn demand. Incentives under this contract toreduce both operating and capital costs are stronggiven that real tariffs are fixed. The danger here isthat, in the absence of a periodic price review, thebenefit of efficiency gains accrues solely to compa-ny shareholders. In recognition of this, there is a
Examples of public-private partnerships involving the European Bank for Reconstruction and Development
Conclusions:• The roles of public and private sector involvement in
financing environmental infrastructure projects arechanging, with the public sector becoming moreinvolved in management and enforcement, whilethe private sector becomes more involved in provid-ing environmental services and investing in environ-mental infrastructure.
• Public sector expenditure was less than 30 percentof total expenditure in the candidate countries.
• The process of decentralisation shifted many envi-ronmental responsibilities onto the regional/locallevel. Together with the EU regional approachtoward future financial assistance it poses a majorchallenge for regional/local authorities.
• Environmental funds played an important role inmany candidate countries in the second half of the1990s. However, with the prospects of EU integra-tion their future is uncertain.
• There were several successful initiatives in the can-didate countries to involve the private sector in envi-ronmental expenditure.
Endnotes63 The Czech Republic, Hungary and Poland are not included due to lackof data.
64 Bazaniak 1998
65 OECD 1999
66 REC 2001a
67 EC 2001f
69 OCED 1999
69 OECD 1999
70 BOS 2001
71 EBRD 2001
72 EC web site; PEPA Tool nr 24
73 based on EC web site; PEPA Tool nr 24
N AT I O N A L S O U R C E S O F F I N A N C I N G
E N V I R O N M E N TA L F I N A N C I N G I N C E N T R A L A N D E A S T E R N E U R O P E 59
FIGURE 9 (continued)
profit-sharing mechanism, which allows tariffs tofall (by 25 percent of the value of the excess cash)when there is excess cash (resulting from costreductions) in the company.
This tariff mechanism minimises the potential fordispute through the absence of an “X” factor and aperiodic review. Regulatory risk is further reducedthrough design of the institutional setting forenforcement of the concession. The concession isoverseen by a specially designated monitoring unit
— a quasi-independent body — within the munici-pality. Though this is helpful in de-politicising theprocess of contract enforcement, it cannot be fullyeffective in this respect. Should a contract disputearise, both parties have recourse to a dispute reso-lution committee: a three-person body comprisinginternational experts. This is a cheap alternative tointernational arbitration, something to which partieshave recourse should the dispute resolution com-mittee not be successful.
Source: European Bank for Reconstruction and Development 2002, extract from Working Paper Nr 75
Examples of public-private partnerships involving the European Bank for Reconstruction and Development (continued)

60 E N V I R O N M E N TA L F I N A N C I N G I N C E N T R A L A N D E A S T E R N E U R O P E
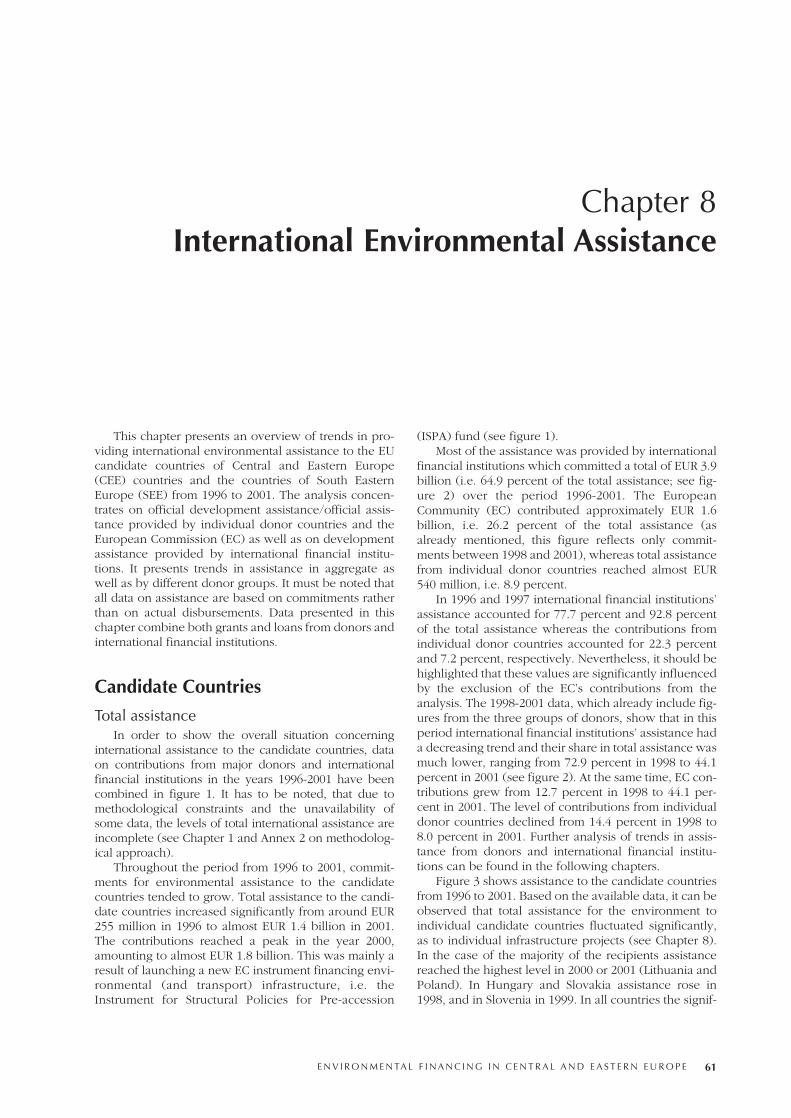
This chapter presents an overview of trends in pro-viding international environmental assistance to the EUcandidate countries of Central and Eastern Europe(CEE) countries and the countries of South EasternEurope (SEE) from 1996 to 2001. The analysis concen-trates on official development assistance/official assis-tance provided by individual donor countries and theEuropean Commission (EC) as well as on developmentassistance provided by international financial institu-tions. It presents trends in assistance in aggregate aswell as by different donor groups. It must be noted thatall data on assistance are based on commitments ratherthan on actual disbursements. Data presented in thischapter combine both grants and loans from donors andinternational financial institutions.
Candidate Countries
Total assistanceIn order to show the overall situation concerning
international assistance to the candidate countries, dataon contributions from major donors and internationalfinancial institutions in the years 1996-2001 have beencombined in figure 1. It has to be noted, that due tomethodological constraints and the unavailability ofsome data, the levels of total international assistance areincomplete (see Chapter 1 and Annex 2 on methodolog-ical approach).
Throughout the period from 1996 to 2001, commit-ments for environmental assistance to the candidatecountries tended to grow. Total assistance to the candi-date countries increased significantly from around EUR255 million in 1996 to almost EUR 1.4 billion in 2001.The contributions reached a peak in the year 2000,amounting to almost EUR 1.8 billion. This was mainly aresult of launching a new EC instrument financing envi-ronmental (and transport) infrastructure, i.e. theInstrument for Structural Policies for Pre-accession
(ISPA) fund (see figure 1).Most of the assistance was provided by international
financial institutions which committed a total of EUR 3.9billion (i.e. 64.9 percent of the total assistance; see fig-ure 2) over the period 1996-2001. The EuropeanCommunity (EC) contributed approximately EUR 1.6billion, i.e. 26.2 percent of the total assistance (asalready mentioned, this figure reflects only commit-ments between 1998 and 2001), whereas total assistancefrom individual donor countries reached almost EUR540 million, i.e. 8.9 percent.
In 1996 and 1997 international financial institutions’assistance accounted for 77.7 percent and 92.8 percentof the total assistance whereas the contributions fromindividual donor countries accounted for 22.3 percentand 7.2 percent, respectively. Nevertheless, it should behighlighted that these values are significantly influencedby the exclusion of the EC’s contributions from theanalysis. The 1998-2001 data, which already include fig-ures from the three groups of donors, show that in thisperiod international financial institutions’ assistance hada decreasing trend and their share in total assistance wasmuch lower, ranging from 72.9 percent in 1998 to 44.1percent in 2001 (see figure 2). At the same time, EC con-tributions grew from 12.7 percent in 1998 to 44.1 per-cent in 2001. The level of contributions from individualdonor countries declined from 14.4 percent in 1998 to8.0 percent in 2001. Further analysis of trends in assis-tance from donors and international financial institu-tions can be found in the following chapters.
Figure 3 shows assistance to the candidate countriesfrom 1996 to 2001. Based on the available data, it can beobserved that total assistance for the environment toindividual candidate countries fluctuated significantly,as to individual infrastructure projects (see Chapter 8).In the case of the majority of the recipients assistancereached the highest level in 2000 or 2001 (Lithuania andPoland). In Hungary and Slovakia assistance rose in1998, and in Slovenia in 1999. In all countries the signif-
E N V I R O N M E N TA L F I N A N C I N G I N C E N T R A L A N D E A S T E R N E U R O P E 61
Chapter 8International Environmental Assistance
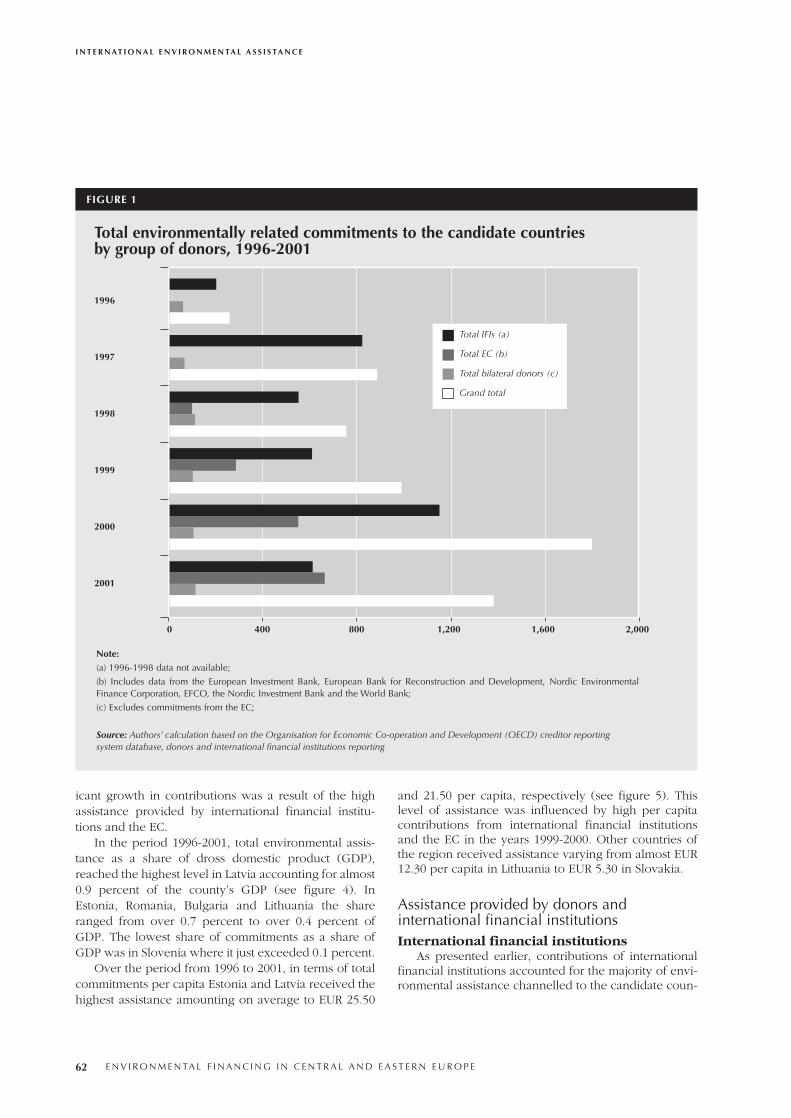
icant growth in contributions was a result of the highassistance provided by international financial institu-tions and the EC.
In the period 1996-2001, total environmental assis-tance as a share of dross domestic product (GDP),reached the highest level in Latvia accounting for almost0.9 percent of the county’s GDP (see figure 4). InEstonia, Romania, Bulgaria and Lithuania the shareranged from over 0.7 percent to over 0.4 percent ofGDP. The lowest share of commitments as a share ofGDP was in Slovenia where it just exceeded 0.1 percent.
Over the period from 1996 to 2001, in terms of totalcommitments per capita Estonia and Latvia received thehighest assistance amounting on average to EUR 25.50
and 21.50 per capita, respectively (see figure 5). Thislevel of assistance was influenced by high per capitacontributions from international financial institutionsand the EC in the years 1999-2000. Other countries ofthe region received assistance varying from almost EUR12.30 per capita in Lithuania to EUR 5.30 in Slovakia.
Assistance provided by donors andinternational financial institutionsInternational financial institutions
As presented earlier, contributions of internationalfinancial institutions accounted for the majority of envi-ronmental assistance channelled to the candidate coun-
I N T E R N AT I O N A L E N V I R O N M E N TA L A S S I S TA N C E
62 E N V I R O N M E N TA L F I N A N C I N G I N C E N T R A L A N D E A S T E R N E U R O P E
FIGURE 1
1996
1997
1998
1999
2000
2001
0 400 800 1,200 1,600 2,000
Note: (a) 1996-1998 data not available;
(b) Includes data from the European Investment Bank, European Bank for Reconstruction and Development, Nordic EnvironmentalFinance Corporation, EFCO, the Nordic Investment Bank and the World Bank;
(c) Excludes commitments from the EC;
Total environmentally related commitments to the candidate countries by group of donors, 1996-2001
Total IFIs (a)
Total EC (b)
Total bilateral donors (c)
Grand total
Source: Authors’ calculation based on the Organisation for Economic Co-operation and Development (OECD) creditor reportingsystem database, donors and international financial institutions reporting
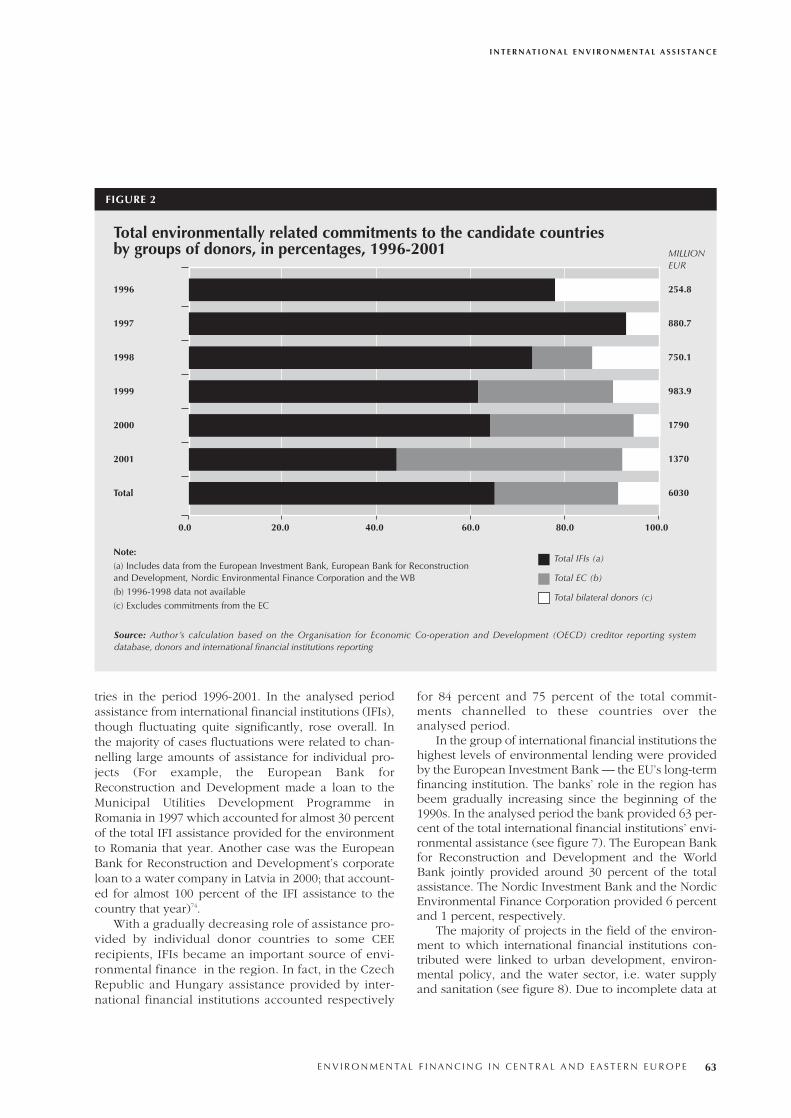
tries in the period 1996-2001. In the analysed periodassistance from international financial institutions (IFIs),though fluctuating quite significantly, rose overall. Inthe majority of cases fluctuations were related to chan-nelling large amounts of assistance for individual pro-jects (For example, the European Bank forReconstruction and Development made a loan to theMunicipal Utilities Development Programme inRomania in 1997 which accounted for almost 30 percentof the total IFI assistance provided for the environmentto Romania that year. Another case was the EuropeanBank for Reconstruction and Development’s corporateloan to a water company in Latvia in 2000; that account-ed for almost 100 percent of the IFI assistance to thecountry that year)74.
With a gradually decreasing role of assistance pro-vided by individual donor countries to some CEErecipients, IFIs became an important source of envi-ronmental finance in the region. In fact, in the CzechRepublic and Hungary assistance provided by inter-national financial institutions accounted respectively
for 84 percent and 75 percent of the total commit-ments channelled to these countries over theanalysed period.
In the group of international financial institutions thehighest levels of environmental lending were providedby the European Investment Bank — the EU’s long-termfinancing institution. The banks’ role in the region hasbeem gradually increasing since the beginning of the1990s. In the analysed period the bank provided 63 per-cent of the total international financial institutions’ envi-ronmental assistance (see figure 7). The European Bankfor Reconstruction and Development and the WorldBank jointly provided around 30 percent of the totalassistance. The Nordic Investment Bank and the NordicEnvironmental Finance Corporation provided 6 percentand 1 percent, respectively.
The majority of projects in the field of the environ-ment to which international financial institutions con-tributed were linked to urban development, environ-mental policy, and the water sector, i.e. water supplyand sanitation (see figure 8). Due to incomplete data at
I N T E R N AT I O N A L E N V I R O N M E N TA L A S S I S TA N C E
E N V I R O N M E N TA L F I N A N C I N G I N C E N T R A L A N D E A S T E R N E U R O P E 63
FIGURE 2
1996
1997
1998
1999
2000
2001
Total
0.0 20.0 40.0 60.0 80.0 100.0
Note: (a) Includes data from the European Investment Bank, European Bank for Reconstructionand Development, Nordic Environmental Finance Corporation and the WB
(b) 1996-1998 data not available
(c) Excludes commitments from the EC
Total environmentally related commitments to the candidate countries by groups of donors, in percentages, 1996-2001 MILLION
EUR
254.8
880.7
750.1
983.9
1790
1370
6030
Total IFIs (a)
Total EC (b)
Total bilateral donors (c)
Source: Author’s calculation based on the Organisation for Economic Co-operation and Development (OECD) creditor reporting systemdatabase, donors and international financial institutions reporting
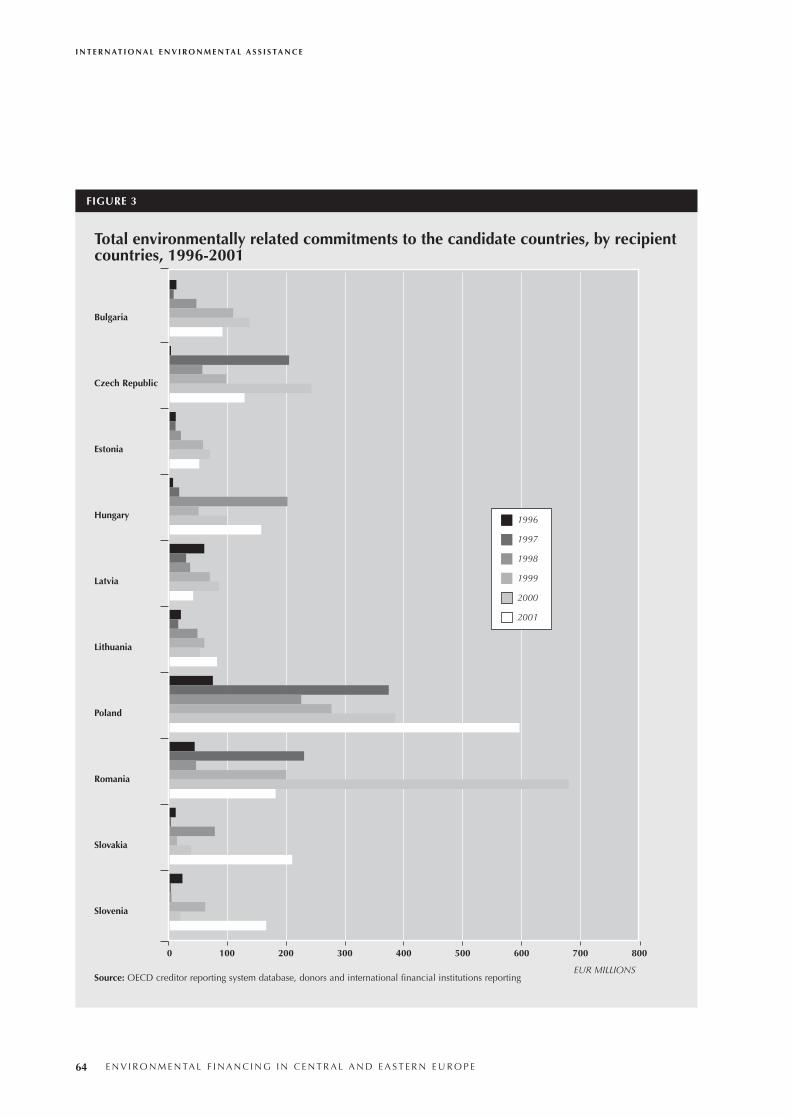
I N T E R N AT I O N A L E N V I R O N M E N TA L A S S I S TA N C E
64 E N V I R O N M E N TA L F I N A N C I N G I N C E N T R A L A N D E A S T E R N E U R O P E
Total environmentally related commitments to the candidate countries, by recipientcountries, 1996-2001
Bulgaria
Czech Republic
Estonia
Hungary
Latvia
Lithuania
Poland
Romania
Slovakia
Slovenia
0 200 300 400 500 600 700 800100
FIGURE 3
1996
1997
1998
1999
2000
2001
Source: OECD creditor reporting system database, donors and international financial institutions reportingEUR MILLIONS
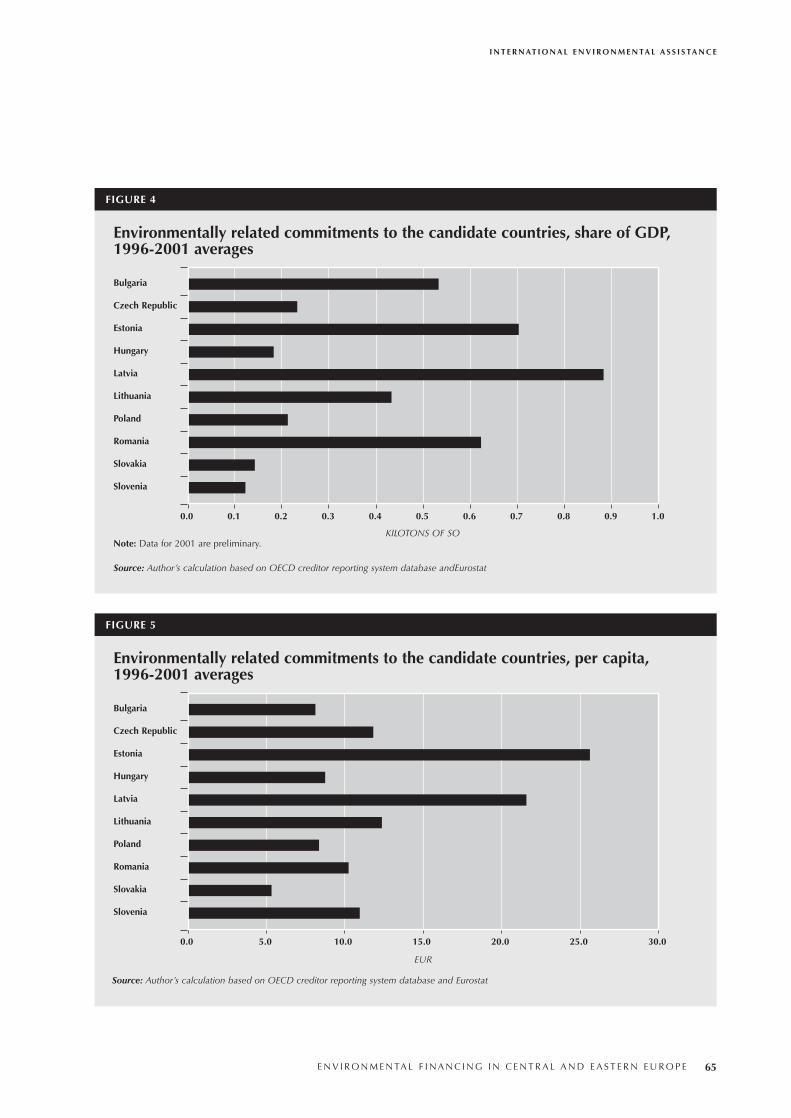
I N T E R N AT I O N A L E N V I R O N M E N TA L A S S I S TA N C E
E N V I R O N M E N TA L F I N A N C I N G I N C E N T R A L A N D E A S T E R N E U R O P E 65
FIGURE 4
Bulgaria
Czech Republic
Estonia
Hungary
Latvia
Lithuania
Poland
Romania
Slovakia
Slovenia
Note: Data for 2001 are preliminary.
0.0 0.1 0.2 0.3 0.4 0.5 0.6 0.7 0.8 0.9 1.0
Environmentally related commitments to the candidate countries, share of GDP,1996-2001 averages
KILOTONS OF SO
FIGURE 5
Bulgaria
Czech Republic
Estonia
Hungary
Latvia
Lithuania
Poland
Romania
Slovakia
Slovenia
Source: Author’s calculation based on OECD creditor reporting system database and Eurostat
0.0 5.0 10.0 15.0 20.0 25.0 30.0
Environmentally related commitments to the candidate countries, per capita, 1996-2001 averages
EUR
Source: Author’s calculation based on OECD creditor reporting system database andEurostat
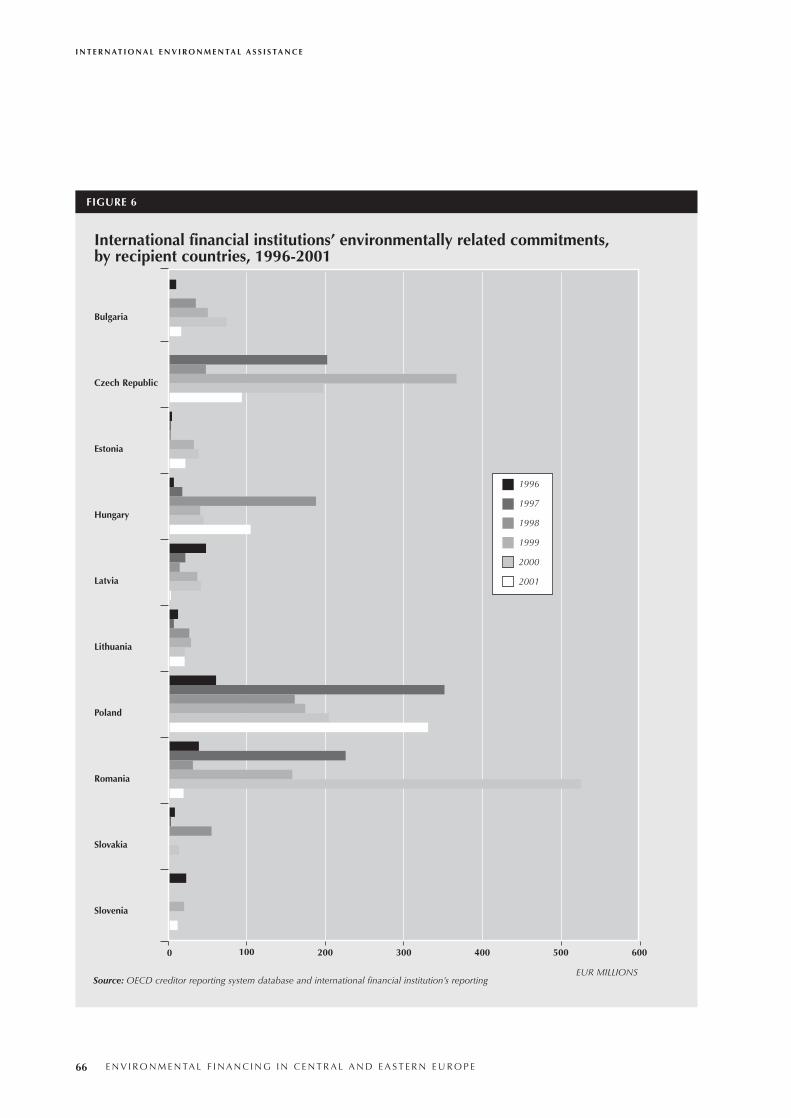
I N T E R N AT I O N A L E N V I R O N M E N TA L A S S I S TA N C E
66 E N V I R O N M E N TA L F I N A N C I N G I N C E N T R A L A N D E A S T E R N E U R O P E
International financial institutions’ environmentally related commitments, by recipient countries, 1996-2001
Bulgaria
Czech Republic
Estonia
Hungary
Latvia
Lithuania
Poland
Romania
Slovakia
Slovenia
0
Source: OECD creditor reporting system database and international financial institution’s reporting
100 200 300 400 500 600
1996
1997
1998
1999
2000
2001
FIGURE 6
EUR MILLIONS
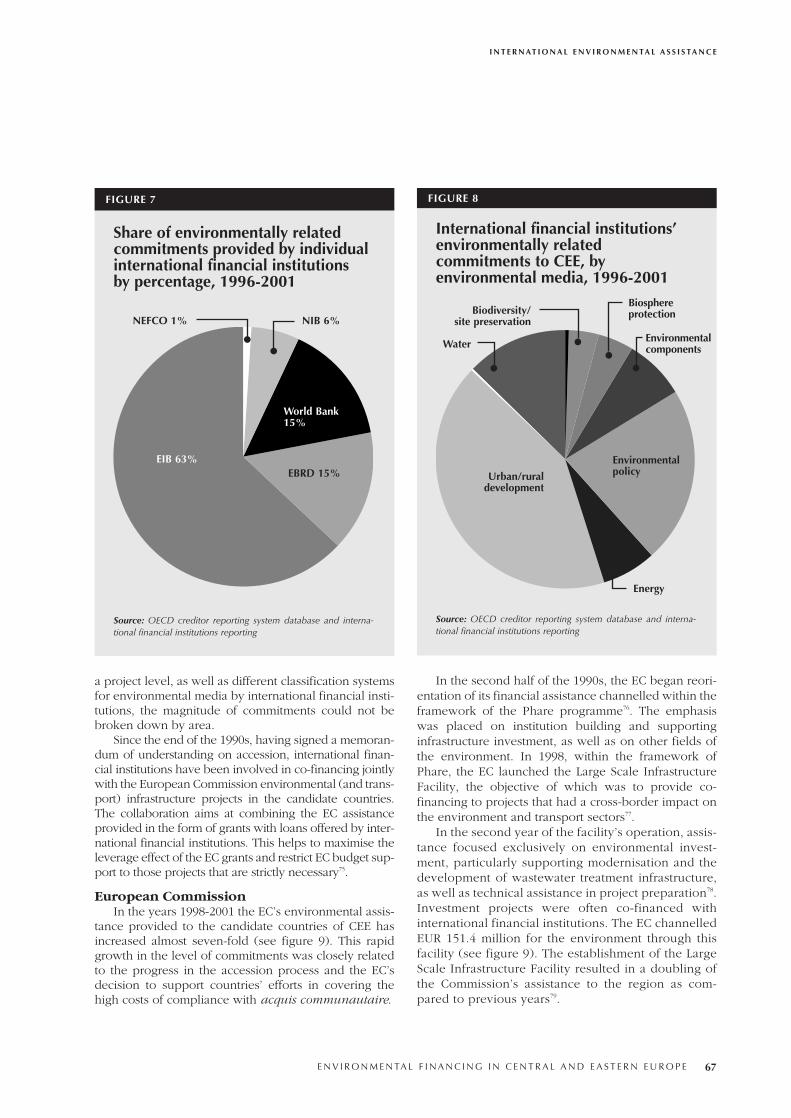
a project level, as well as different classification systemsfor environmental media by international financial insti-tutions, the magnitude of commitments could not bebroken down by area.
Since the end of the 1990s, having signed a memoran-dum of understanding on accession, international finan-cial institutions have been involved in co-financing jointlywith the European Commission environmental (and trans-port) infrastructure projects in the candidate countries.The collaboration aims at combining the EC assistanceprovided in the form of grants with loans offered by inter-national financial institutions. This helps to maximise theleverage effect of the EC grants and restrict EC budget sup-port to those projects that are strictly necessary75.
European CommissionIn the years 1998-2001 the EC’s environmental assis-
tance provided to the candidate countries of CEE hasincreased almost seven-fold (see figure 9). This rapidgrowth in the level of commitments was closely relatedto the progress in the accession process and the EC’sdecision to support countries’ efforts in covering thehigh costs of compliance with acquis communautaire.
In the second half of the 1990s, the EC began reori-entation of its financial assistance channelled within theframework of the Phare programme76. The emphasiswas placed on institution building and supportinginfrastructure investment, as well as on other fields ofthe environment. In 1998, within the framework ofPhare, the EC launched the Large Scale InfrastructureFacility, the objective of which was to provide co-financing to projects that had a cross-border impact onthe environment and transport sectors77.
In the second year of the facility’s operation, assis-tance focused exclusively on environmental invest-ment, particularly supporting modernisation and thedevelopment of wastewater treatment infrastructure,as well as technical assistance in project preparation78.Investment projects were often co-financed withinternational financial institutions. The EC channelledEUR 151.4 million for the environment through thisfacility (see figure 9). The establishment of the LargeScale Infrastructure Facility resulted in a doubling ofthe Commission’s assistance to the region as com-pared to previous years79.
I N T E R N AT I O N A L E N V I R O N M E N TA L A S S I S TA N C E
E N V I R O N M E N TA L F I N A N C I N G I N C E N T R A L A N D E A S T E R N E U R O P E 67
FIGURE 7
Share of environmentally relatedcommitments provided by individualinternational financial institutions by percentage, 1996-2001
Source: OECD creditor reporting system database and interna-tional financial institutions reporting
FIGURE 8
International financial institutions’environmentally relatedcommitments to CEE, byenvironmental media, 1996-2001
Source: OECD creditor reporting system database and interna-tional financial institutions reporting
NEFCO 1% NIB 6%
World Bank15%
EIB 63%
Urban/ruraldevelopment
Water
Biodiversity/site preservation
Environmentalpolicy
Environmentalcomponents
Biosphereprotection
Energy
EBRD 15%
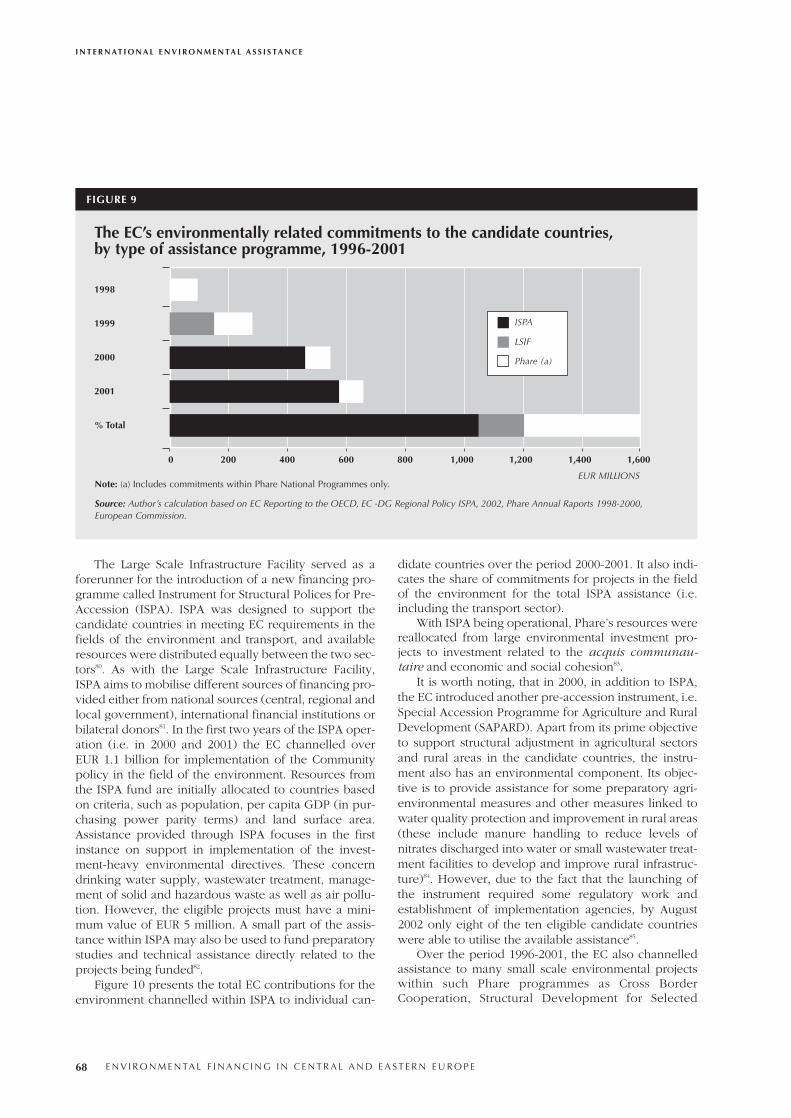
The Large Scale Infrastructure Facility served as aforerunner for the introduction of a new financing pro-gramme called Instrument for Structural Polices for Pre-Accession (ISPA). ISPA was designed to support thecandidate countries in meeting EC requirements in thefields of the environment and transport, and availableresources were distributed equally between the two sec-tors80. As with the Large Scale Infrastructure Facility,ISPA aims to mobilise different sources of financing pro-vided either from national sources (central, regional andlocal government), international financial institutions orbilateral donors81. In the first two years of the ISPA oper-ation (i.e. in 2000 and 2001) the EC channelled overEUR 1.1 billion for implementation of the Communitypolicy in the field of the environment. Resources fromthe ISPA fund are initially allocated to countries basedon criteria, such as population, per capita GDP (in pur-chasing power parity terms) and land surface area.Assistance provided through ISPA focuses in the firstinstance on support in implementation of the invest-ment-heavy environmental directives. These concerndrinking water supply, wastewater treatment, manage-ment of solid and hazardous waste as well as air pollu-tion. However, the eligible projects must have a mini-mum value of EUR 5 million. A small part of the assis-tance within ISPA may also be used to fund preparatorystudies and technical assistance directly related to theprojects being funded82.
Figure 10 presents the total EC contributions for theenvironment channelled within ISPA to individual can-
didate countries over the period 2000-2001. It also indi-cates the share of commitments for projects in the fieldof the environment for the total ISPA assistance (i.e.including the transport sector).
With ISPA being operational, Phare’s resources werereallocated from large environmental investment pro-jects to investment related to the acquis communau-taire and economic and social cohesion83.
It is worth noting, that in 2000, in addition to ISPA,the EC introduced another pre-accession instrument, i.e.Special Accession Programme for Agriculture and RuralDevelopment (SAPARD). Apart from its prime objectiveto support structural adjustment in agricultural sectorsand rural areas in the candidate countries, the instru-ment also has an environmental component. Its objec-tive is to provide assistance for some preparatory agri-environmental measures and other measures linked towater quality protection and improvement in rural areas(these include manure handling to reduce levels ofnitrates discharged into water or small wastewater treat-ment facilities to develop and improve rural infrastruc-ture)84. However, due to the fact that the launching ofthe instrument required some regulatory work andestablishment of implementation agencies, by August2002 only eight of the ten eligible candidate countrieswere able to utilise the available assistance85.
Over the period 1996-2001, the EC also channelledassistance to many small scale environmental projectswithin such Phare programmes as Cross BorderCooperation, Structural Development for Selected
I N T E R N AT I O N A L E N V I R O N M E N TA L A S S I S TA N C E
68 E N V I R O N M E N TA L F I N A N C I N G I N C E N T R A L A N D E A S T E R N E U R O P E
FIGURE 9
1998
1999
2000
2001
% Total
0 200 400 600 800 1,000 1,200 1,400 1,600
Note: (a) Includes commitments within Phare National Programmes only.
Source: Author’s calculation based on EC Reporting to the OECD, EC -DG Regional Policy ISPA, 2002, Phare Annual Raports 1998-2000,European Commission.
The EC’s environmentally related commitments to the candidate countries, by type of assistance programme, 1996-2001
ISPA
LSIF
Phare (a)
EUR MILLIONS
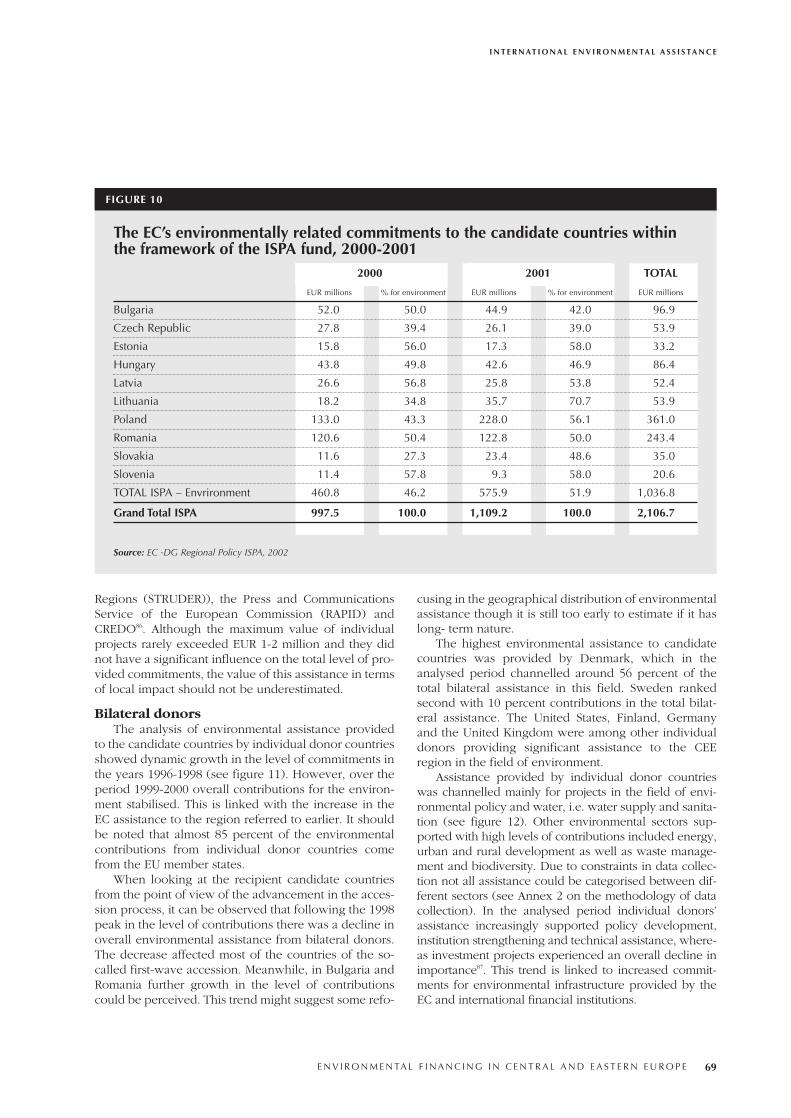
Regions (STRUDER)), the Press and CommunicationsService of the European Commission (RAPID) andCREDO86. Although the maximum value of individualprojects rarely exceeded EUR 1-2 million and they didnot have a significant influence on the total level of pro-vided commitments, the value of this assistance in termsof local impact should not be underestimated.
Bilateral donorsThe analysis of environmental assistance provided
to the candidate countries by individual donor countriesshowed dynamic growth in the level of commitments inthe years 1996-1998 (see figure 11). However, over theperiod 1999-2000 overall contributions for the environ-ment stabilised. This is linked with the increase in theEC assistance to the region referred to earlier. It shouldbe noted that almost 85 percent of the environmentalcontributions from individual donor countries comefrom the EU member states.
When looking at the recipient candidate countriesfrom the point of view of the advancement in the acces-sion process, it can be observed that following the 1998peak in the level of contributions there was a decline inoverall environmental assistance from bilateral donors.The decrease affected most of the countries of the so-called first-wave accession. Meanwhile, in Bulgaria andRomania further growth in the level of contributionscould be perceived. This trend might suggest some refo-
cusing in the geographical distribution of environmentalassistance though it is still too early to estimate if it haslong- term nature.
The highest environmental assistance to candidatecountries was provided by Denmark, which in theanalysed period channelled around 56 percent of thetotal bilateral assistance in this field. Sweden rankedsecond with 10 percent contributions in the total bilat-eral assistance. The United States, Finland, Germanyand the United Kingdom were among other individualdonors providing significant assistance to the CEEregion in the field of environment.
Assistance provided by individual donor countrieswas channelled mainly for projects in the field of envi-ronmental policy and water, i.e. water supply and sanita-tion (see figure 12). Other environmental sectors sup-ported with high levels of contributions included energy,urban and rural development as well as waste manage-ment and biodiversity. Due to constraints in data collec-tion not all assistance could be categorised between dif-ferent sectors (see Annex 2 on the methodology of datacollection). In the analysed period individual donors’assistance increasingly supported policy development,institution strengthening and technical assistance, where-as investment projects experienced an overall decline inimportance87. This trend is linked to increased commit-ments for environmental infrastructure provided by theEC and international financial institutions.
I N T E R N AT I O N A L E N V I R O N M E N TA L A S S I S TA N C E
E N V I R O N M E N TA L F I N A N C I N G I N C E N T R A L A N D E A S T E R N E U R O P E 69
FIGURE 10
2000 2001 TOTAL
EUR millions % for environment EUR millions % for environment EUR millions
Bulgaria 52.0 50.0 44.9 42.0 96.9
Czech Republic 27.8 39.4 26.1 39.0 53.9
Estonia 15.8 56.0 17.3 58.0 33.2
Hungary 43.8 49.8 42.6 46.9 86.4
Latvia 26.6 56.8 25.8 53.8 52.4
Lithuania 18.2 34.8 35.7 70.7 53.9
Poland 133.0 43.3 228.0 56.1 361.0
Romania 120.6 50.4 122.8 50.0 243.4
Slovakia 11.6 27.3 23.4 48.6 35.0
Slovenia 11.4 57.8 9.3 58.0 20.6
TOTAL ISPA – Envrironment 460.8 46.2 575.9 51.9 1,036.8
Grand Total ISPA 997.5 100.0 1,109.2 100.0 2,106.7
Source: EC -DG Regional Policy ISPA, 2002
The EC’s environmentally related commitments to the candidate countries withinthe framework of the ISPA fund, 2000-2001
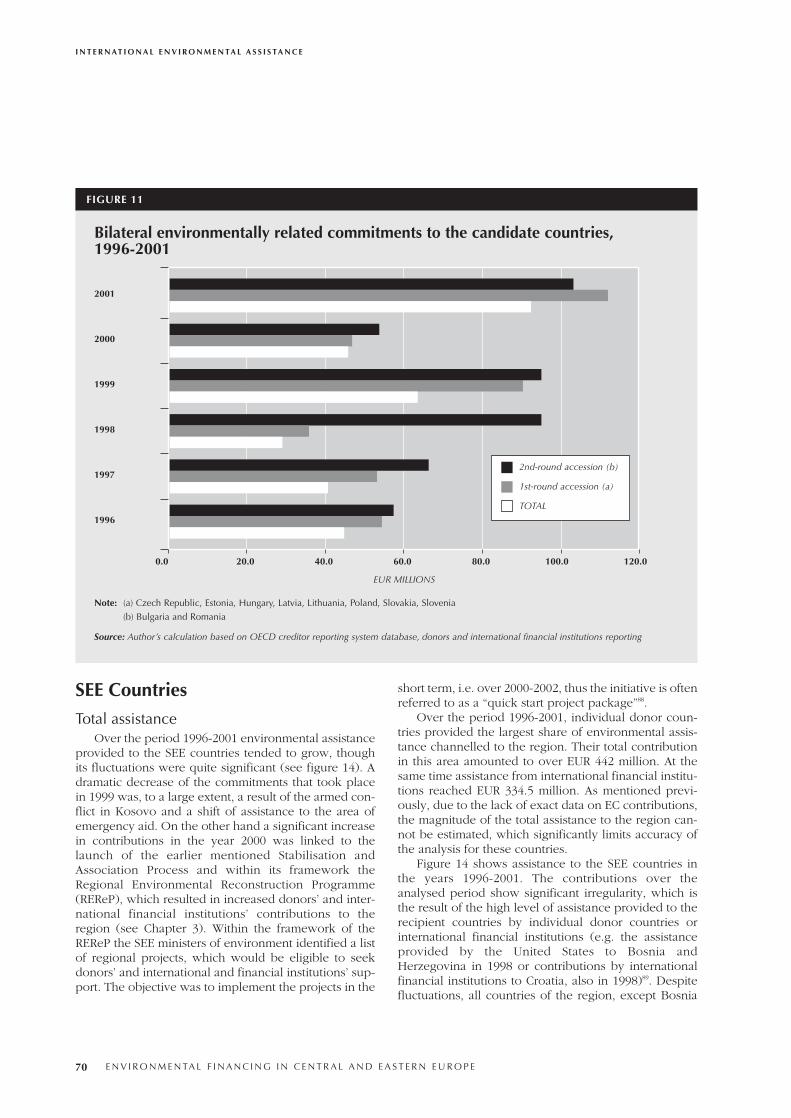
SEE Countries
Total assistanceOver the period 1996-2001 environmental assistance
provided to the SEE countries tended to grow, thoughits fluctuations were quite significant (see figure 14). Adramatic decrease of the commitments that took placein 1999 was, to a large extent, a result of the armed con-flict in Kosovo and a shift of assistance to the area ofemergency aid. On the other hand a significant increasein contributions in the year 2000 was linked to thelaunch of the earlier mentioned Stabilisation andAssociation Process and within its framework theRegional Environmental Reconstruction Programme(REReP), which resulted in increased donors’ and inter-national financial institutions’ contributions to theregion (see Chapter 3). Within the framework of theREReP the SEE ministers of environment identified a listof regional projects, which would be eligible to seekdonors’ and international and financial institutions’ sup-port. The objective was to implement the projects in the
short term, i.e. over 2000-2002, thus the initiative is oftenreferred to as a “quick start project package”88.
Over the period 1996-2001, individual donor coun-tries provided the largest share of environmental assis-tance channelled to the region. Their total contributionin this area amounted to over EUR 442 million. At thesame time assistance from international financial institu-tions reached EUR 334.5 million. As mentioned previ-ously, due to the lack of exact data on EC contributions,the magnitude of the total assistance to the region can-not be estimated, which significantly limits accuracy ofthe analysis for these countries.
Figure 14 shows assistance to the SEE countries inthe years 1996-2001. The contributions over theanalysed period show significant irregularity, which isthe result of the high level of assistance provided to therecipient countries by individual donor countries orinternational financial institutions (e.g. the assistanceprovided by the United States to Bosnia andHerzegovina in 1998 or contributions by internationalfinancial institutions to Croatia, also in 1998)89. Despitefluctuations, all countries of the region, except Bosnia
I N T E R N AT I O N A L E N V I R O N M E N TA L A S S I S TA N C E
70 E N V I R O N M E N TA L F I N A N C I N G I N C E N T R A L A N D E A S T E R N E U R O P E
FIGURE 11
2001
2000
1999
1998
1997
1996
Note: (a) Czech Republic, Estonia, Hungary, Latvia, Lithuania, Poland, Slovakia, Slovenia
(b) Bulgaria and Romania
0.0 20.0 40.0 60.0 80.0 100.0 120.0
Bilateral environmentally related commitments to the candidate countries, 1996-2001
2nd-round accession (b)
1st-round accession (a)
TOTAL
Source: Author’s calculation based on OECD creditor reporting system database, donors and international financial institutions reporting
EUR MILLIONS
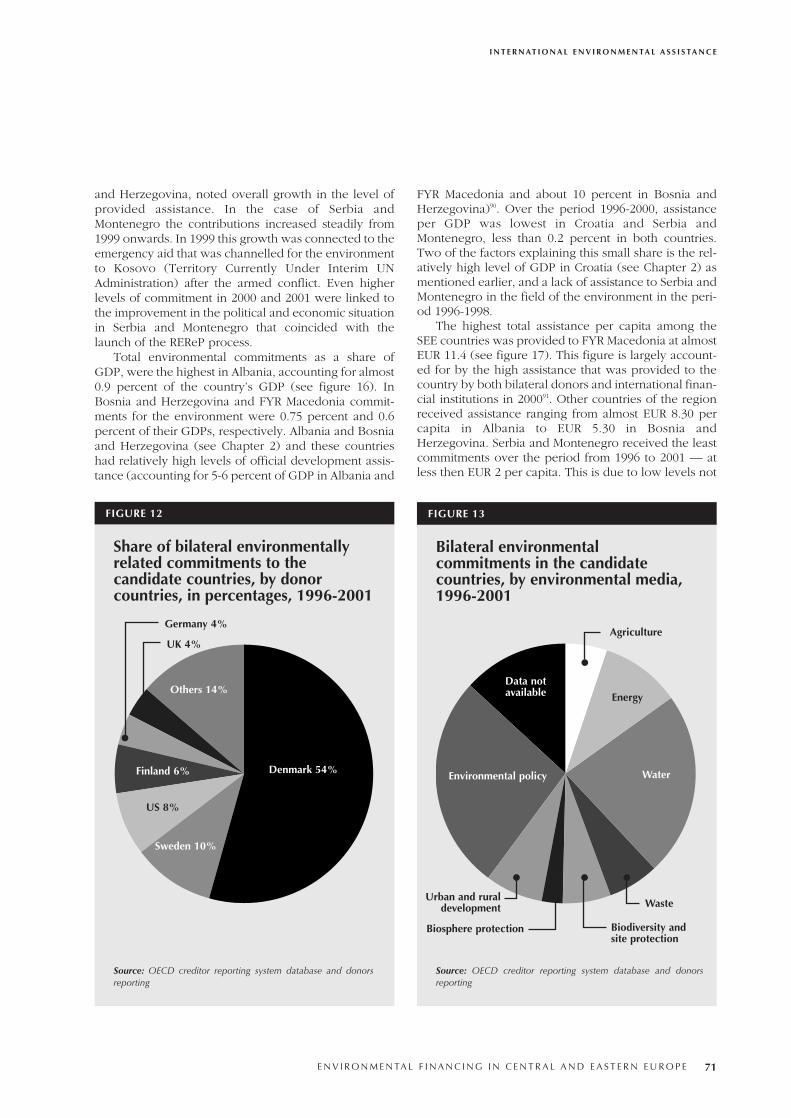
and Herzegovina, noted overall growth in the level ofprovided assistance. In the case of Serbia andMontenegro the contributions increased steadily from1999 onwards. In 1999 this growth was connected to theemergency aid that was channelled for the environmentto Kosovo (Territory Currently Under Interim UNAdministration) after the armed conflict. Even higherlevels of commitment in 2000 and 2001 were linked tothe improvement in the political and economic situationin Serbia and Montenegro that coincided with thelaunch of the REReP process.
Total environmental commitments as a share ofGDP, were the highest in Albania, accounting for almost0.9 percent of the country’s GDP (see figure 16). InBosnia and Herzegovina and FYR Macedonia commit-ments for the environment were 0.75 percent and 0.6percent of their GDPs, respectively. Albania and Bosniaand Herzegovina (see Chapter 2) and these countrieshad relatively high levels of official development assis-tance (accounting for 5-6 percent of GDP in Albania and
FYR Macedonia and about 10 percent in Bosnia andHerzegovina)90. Over the period 1996-2000, assistanceper GDP was lowest in Croatia and Serbia andMontenegro, less than 0.2 percent in both countries.Two of the factors explaining this small share is the rel-atively high level of GDP in Croatia (see Chapter 2) asmentioned earlier, and a lack of assistance to Serbia andMontenegro in the field of the environment in the peri-od 1996-1998.
The highest total assistance per capita among theSEE countries was provided to FYR Macedonia at almostEUR 11.4 (see figure 17). This figure is largely account-ed for by the high assistance that was provided to thecountry by both bilateral donors and international finan-cial institutions in 200091. Other countries of the regionreceived assistance ranging from almost EUR 8.30 percapita in Albania to EUR 5.30 in Bosnia andHerzegovina. Serbia and Montenegro received the leastcommitments over the period from 1996 to 2001 — atless then EUR 2 per capita. This is due to low levels not
I N T E R N AT I O N A L E N V I R O N M E N TA L A S S I S TA N C E
E N V I R O N M E N TA L F I N A N C I N G I N C E N T R A L A N D E A S T E R N E U R O P E 71
FIGURE 12
Share of bilateral environmentallyrelated commitments to thecandidate countries, by donorcountries, in percentages, 1996-2001
Source: OECD creditor reporting system database and donorsreporting
FIGURE 13
Bilateral environmentalcommitments in the candidatecountries, by environmental media,1996-2001
Source: OECD creditor reporting system database and donorsreporting
Denmark 54%Environmental policy
Data notavailable
Water
Energy
Urban and ruraldevelopment Waste
Biodiversity and site protection
Biosphere protection
Others 14%
UK 4%
Germany 4%
Finland 6%
Sweden 10%
US 8%
Agriculture
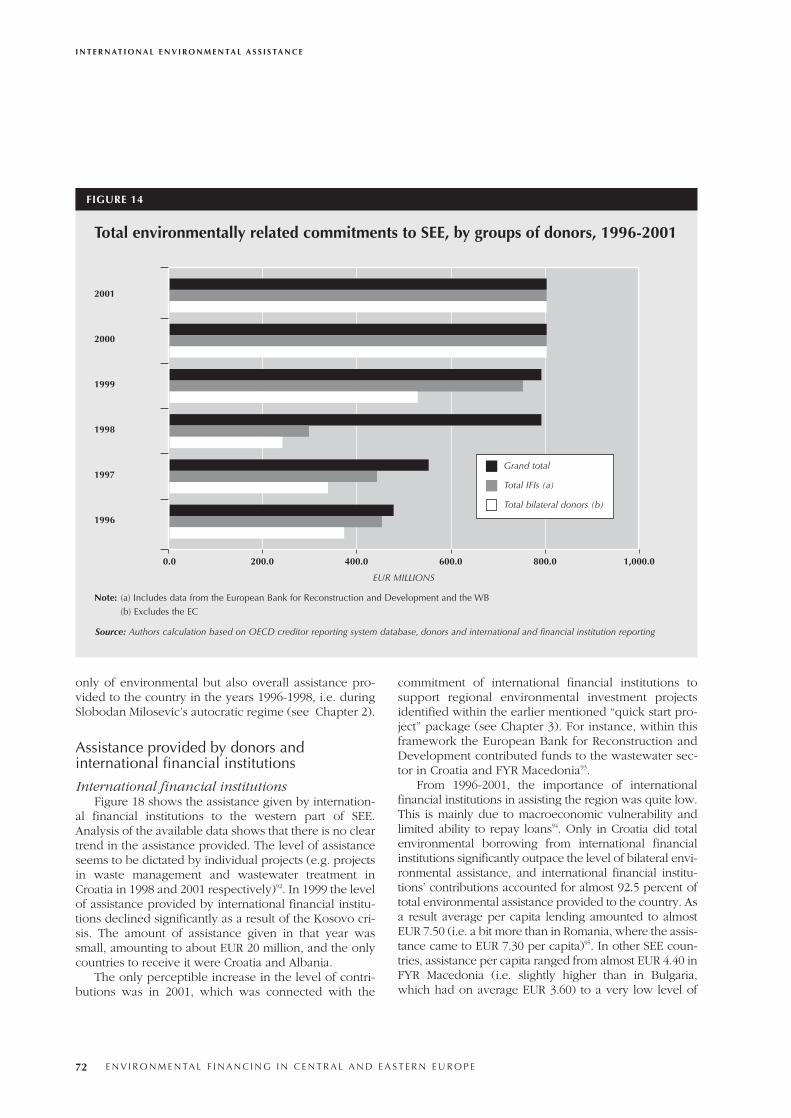
only of environmental but also overall assistance pro-vided to the country in the years 1996-1998, i.e. duringSlobodan Milosevic’s autocratic regime (see Chapter 2).
Assistance provided by donors andinternational financial institutions
International financial institutionsFigure 18 shows the assistance given by internation-
al financial institutions to the western part of SEE.Analysis of the available data shows that there is no cleartrend in the assistance provided. The level of assistanceseems to be dictated by individual projects (e.g. projectsin waste management and wastewater treatment inCroatia in 1998 and 2001 respectively)92. In 1999 the levelof assistance provided by international financial institu-tions declined significantly as a result of the Kosovo cri-sis. The amount of assistance given in that year wassmall, amounting to about EUR 20 million, and the onlycountries to receive it were Croatia and Albania.
The only perceptible increase in the level of contri-butions was in 2001, which was connected with the
commitment of international financial institutions tosupport regional environmental investment projectsidentified within the earlier mentioned “quick start pro-ject” package (see Chapter 3). For instance, within thisframework the European Bank for Reconstruction andDevelopment contributed funds to the wastewater sec-tor in Croatia and FYR Macedonia93.
From 1996-2001, the importance of internationalfinancial institutions in assisting the region was quite low.This is mainly due to macroeconomic vulnerability andlimited ability to repay loans94. Only in Croatia did totalenvironmental borrowing from international financialinstitutions significantly outpace the level of bilateral envi-ronmental assistance, and international financial institu-tions’ contributions accounted for almost 92.5 percent oftotal environmental assistance provided to the country. Asa result average per capita lending amounted to almostEUR 7.50 (i.e. a bit more than in Romania, where the assis-tance came to EUR 7.30 per capita)95. In other SEE coun-tries, assistance per capita ranged from almost EUR 4.40 inFYR Macedonia (i.e. slightly higher than in Bulgaria,which had on average EUR 3.60) to a very low level of
I N T E R N AT I O N A L E N V I R O N M E N TA L A S S I S TA N C E
72 E N V I R O N M E N TA L F I N A N C I N G I N C E N T R A L A N D E A S T E R N E U R O P E
FIGURE 14
2001
2000
1999
1998
1997
1996
Note: (a) Includes data from the European Bank for Reconstruction and Development and the WB
(b) Excludes the EC
0.0 200.0 400.0 600.0 800.0 1,000.0
Total environmentally related commitments to SEE, by groups of donors, 1996-2001
Grand total
Total IFIs (a)
Total bilateral donors (b)
Source: Authors calculation based on OECD creditor reporting system database, donors and international and financial institution reporting
EUR MILLIONS
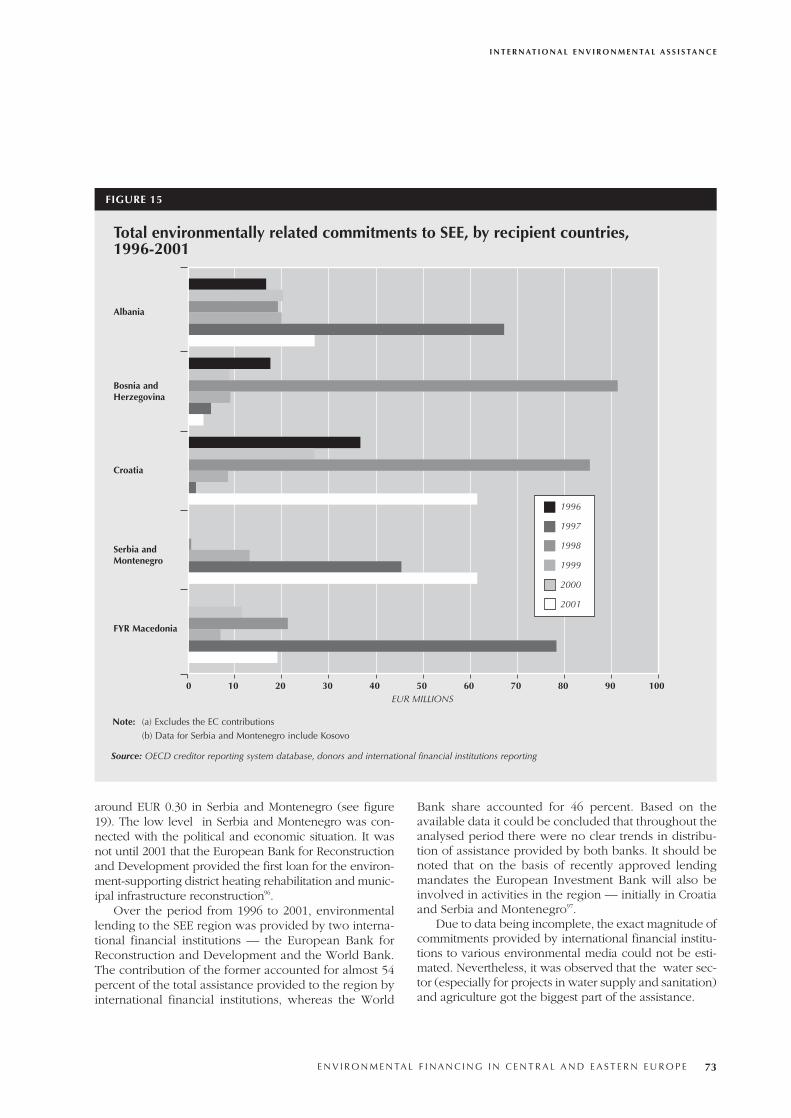
around EUR 0.30 in Serbia and Montenegro (see figure19). The low level in Serbia and Montenegro was con-nected with the political and economic situation. It wasnot until 2001 that the European Bank for Reconstructionand Development provided the first loan for the environ-ment-supporting district heating rehabilitation and munic-ipal infrastructure reconstruction96.
Over the period from 1996 to 2001, environmentallending to the SEE region was provided by two interna-tional financial institutions — the European Bank forReconstruction and Development and the World Bank.The contribution of the former accounted for almost 54percent of the total assistance provided to the region byinternational financial institutions, whereas the World
Bank share accounted for 46 percent. Based on theavailable data it could be concluded that throughout theanalysed period there were no clear trends in distribu-tion of assistance provided by both banks. It should benoted that on the basis of recently approved lendingmandates the European Investment Bank will also beinvolved in activities in the region — initially in Croatiaand Serbia and Montenegro97.
Due to data being incomplete, the exact magnitude ofcommitments provided by international financial institu-tions to various environmental media could not be esti-mated. Nevertheless, it was observed that the water sec-tor (especially for projects in water supply and sanitation)and agriculture got the biggest part of the assistance.
I N T E R N AT I O N A L E N V I R O N M E N TA L A S S I S TA N C E
E N V I R O N M E N TA L F I N A N C I N G I N C E N T R A L A N D E A S T E R N E U R O P E 73
FIGURE 15
Albania
Bosnia andHerzegovina
Croatia
Serbia andMontenegro
FYR Macedonia
0
Note: (a) Excludes the EC contributions
(b) Data for Serbia and Montenegro include Kosovo
Total environmentally related commitments to SEE, by recipient countries, 1996-2001
EUR MILLIONS10 20 30 40 50 60 70 80 90 100
1996
1997
1998
1999
2000
2001
Source: OECD creditor reporting system database, donors and international financial institutions reporting
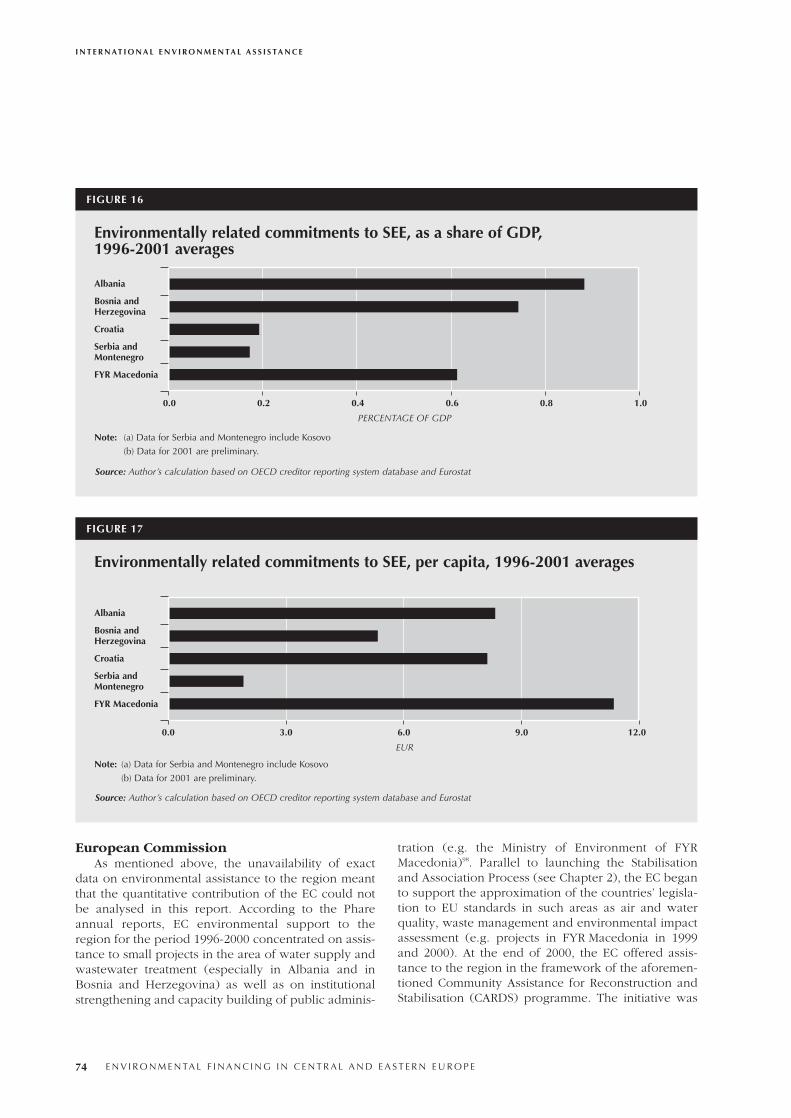
European CommissionAs mentioned above, the unavailability of exact
data on environmental assistance to the region meantthat the quantitative contribution of the EC could notbe analysed in this report. According to the Phareannual reports, EC environmental support to theregion for the period 1996-2000 concentrated on assis-tance to small projects in the area of water supply andwastewater treatment (especially in Albania and inBosnia and Herzegovina) as well as on institutionalstrengthening and capacity building of public adminis-
tration (e.g. the Ministry of Environment of FYRMacedonia)98. Parallel to launching the Stabilisationand Association Process (see Chapter 2), the EC beganto support the approximation of the countries’ legisla-tion to EU standards in such areas as air and waterquality, waste management and environmental impactassessment (e.g. projects in FYR Macedonia in 1999and 2000). At the end of 2000, the EC offered assis-tance to the region in the framework of the aforemen-tioned Community Assistance for Reconstruction andStabilisation (CARDS) programme. The initiative was
I N T E R N AT I O N A L E N V I R O N M E N TA L A S S I S TA N C E
74 E N V I R O N M E N TA L F I N A N C I N G I N C E N T R A L A N D E A S T E R N E U R O P E
FIGURE 16
Albania
Bosnia andHerzegovina
Croatia
Serbia andMontenegro
FYR Macedonia
Note: (a) Data for Serbia and Montenegro include Kosovo
(b) Data for 2001 are preliminary.
0.0 0.2 0.4 0.6 0.8 1.0
Environmentally related commitments to SEE, as a share of GDP, 1996-2001 averages
PERCENTAGE OF GDP
FIGURE 17
Albania
Bosnia andHerzegovina
Croatia
Serbia andMontenegro
FYR Macedonia
Note: (a) Data for Serbia and Montenegro include Kosovo
(b) Data for 2001 are preliminary.
0.0
Environmentally related commitments to SEE, per capita, 1996-2001 averages
EUR
3.0 6.0 9.0 12.0
Source: Author’s calculation based on OECD creditor reporting system database and Eurostat
Source: Author’s calculation based on OECD creditor reporting system database and Eurostat
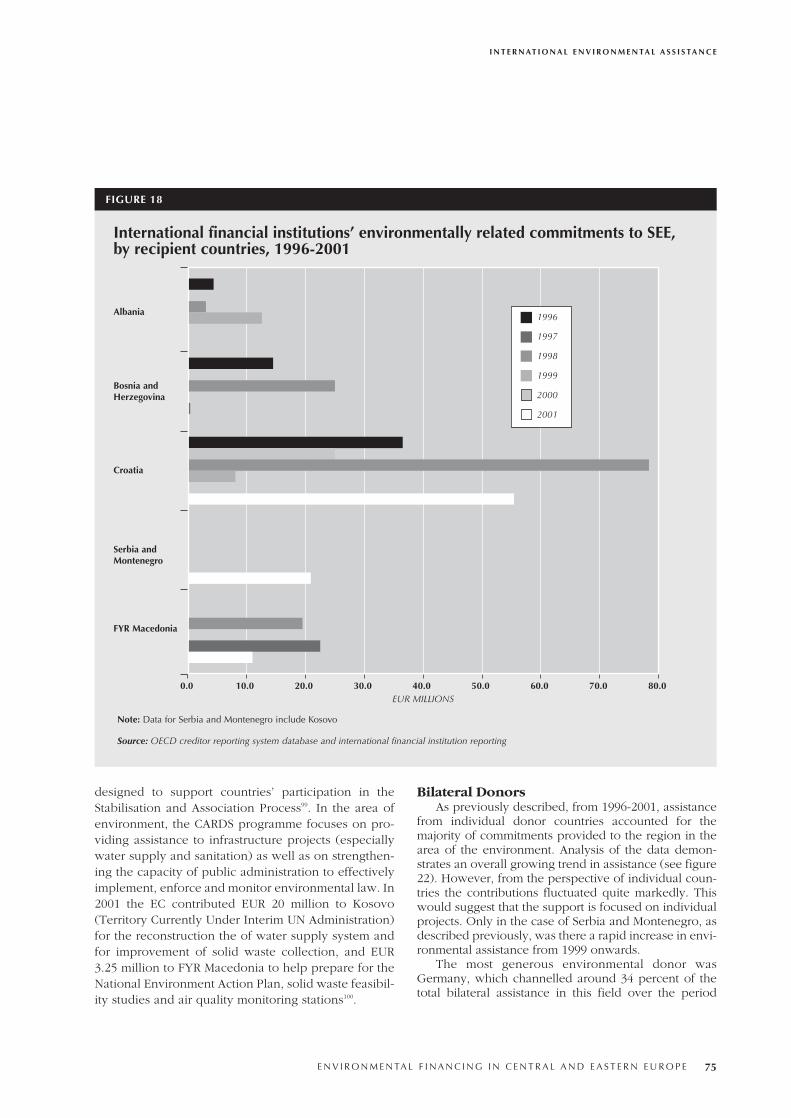
designed to support countries’ participation in theStabilisation and Association Process99. In the area ofenvironment, the CARDS programme focuses on pro-viding assistance to infrastructure projects (especiallywater supply and sanitation) as well as on strengthen-ing the capacity of public administration to effectivelyimplement, enforce and monitor environmental law. In2001 the EC contributed EUR 20 million to Kosovo(Territory Currently Under Interim UN Administration)for the reconstruction the of water supply system andfor improvement of solid waste collection, and EUR3.25 million to FYR Macedonia to help prepare for theNational Environment Action Plan, solid waste feasibil-ity studies and air quality monitoring stations100.
Bilateral DonorsAs previously described, from 1996-2001, assistance
from individual donor countries accounted for themajority of commitments provided to the region in thearea of the environment. Analysis of the data demon-strates an overall growing trend in assistance (see figure22). However, from the perspective of individual coun-tries the contributions fluctuated quite markedly. Thiswould suggest that the support is focused on individualprojects. Only in the case of Serbia and Montenegro, asdescribed previously, was there a rapid increase in envi-ronmental assistance from 1999 onwards.
The most generous environmental donor wasGermany, which channelled around 34 percent of thetotal bilateral assistance in this field over the period
I N T E R N AT I O N A L E N V I R O N M E N TA L A S S I S TA N C E
E N V I R O N M E N TA L F I N A N C I N G I N C E N T R A L A N D E A S T E R N E U R O P E 75
FIGURE 18
Albania
Bosnia andHerzegovina
Croatia
Serbia andMontenegro
FYR Macedonia
0.0 10.0 20.0 30.0 40.0 50.0 60.0 70.0 80.0
Note: Data for Serbia and Montenegro include Kosovo
International financial institutions’ environmentally related commitments to SEE, by recipient countries, 1996-2001
EUR MILLIONS
Source: OECD creditor reporting system database and international financial institution reporting
1996
1997
1998
1999
2000
2001
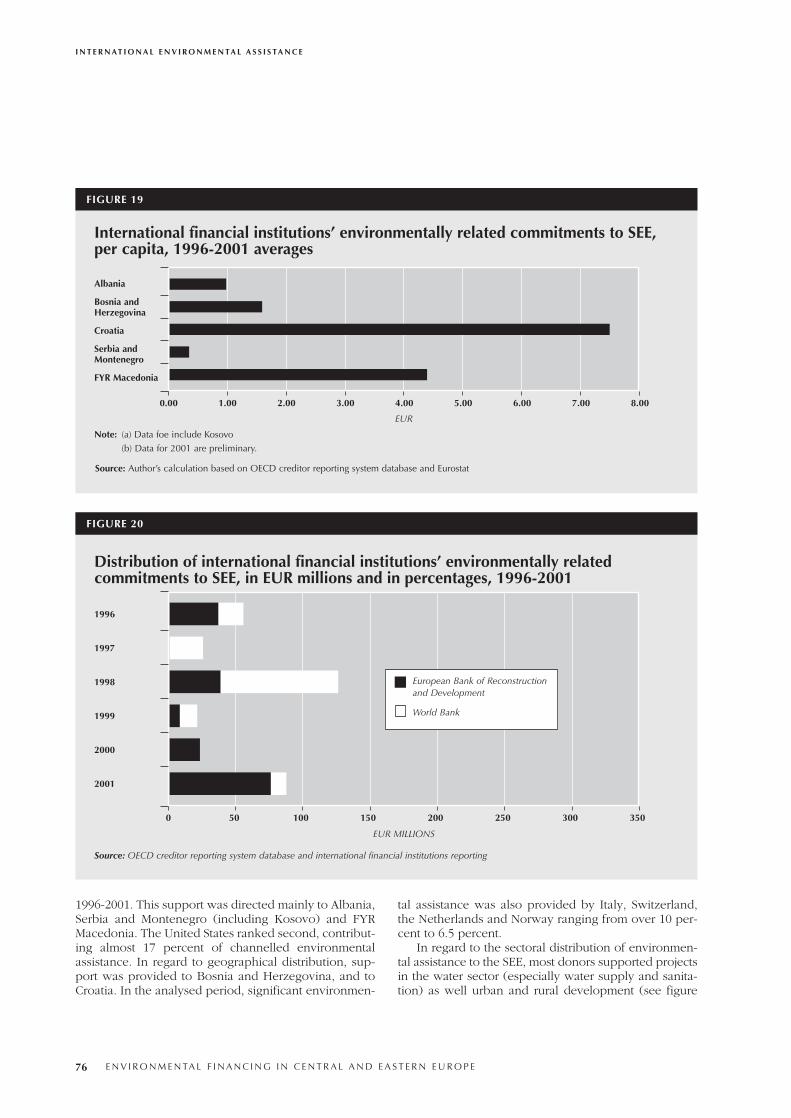
1996-2001. This support was directed mainly to Albania,Serbia and Montenegro (including Kosovo) and FYRMacedonia. The United States ranked second, contribut-ing almost 17 percent of channelled environmentalassistance. In regard to geographical distribution, sup-port was provided to Bosnia and Herzegovina, and toCroatia. In the analysed period, significant environmen-
tal assistance was also provided by Italy, Switzerland,the Netherlands and Norway ranging from over 10 per-cent to 6.5 percent.
In regard to the sectoral distribution of environmen-tal assistance to the SEE, most donors supported projectsin the water sector (especially water supply and sanita-tion) as well urban and rural development (see figure
I N T E R N AT I O N A L E N V I R O N M E N TA L A S S I S TA N C E
76 E N V I R O N M E N TA L F I N A N C I N G I N C E N T R A L A N D E A S T E R N E U R O P E
FIGURE 19
Albania
Bosnia andHerzegovina
Croatia
Serbia andMontenegro
FYR Macedonia
Note: (a) Data foe include Kosovo
(b) Data for 2001 are preliminary.
International financial institutions’ environmentally related commitments to SEE,per capita, 1996-2001 averages
0.00 1.00 2.00 3.00 4.00 5.00 6.00 7.00 8.00
Distribution of international financial institutions’ environmentally relatedcommitments to SEE, in EUR millions and in percentages, 1996-2001
FIGURE 20
1996
1997
1998
1999
2000
2001
Source: OECD creditor reporting system database and international financial institutions reporting
0 50 100 150 200 250 300 350
EUR MILLIONS
Source: Author’s calculation based on OECD creditor reporting system database and Eurostat
EUR
European Bank of Reconstruction and Development
World Bank
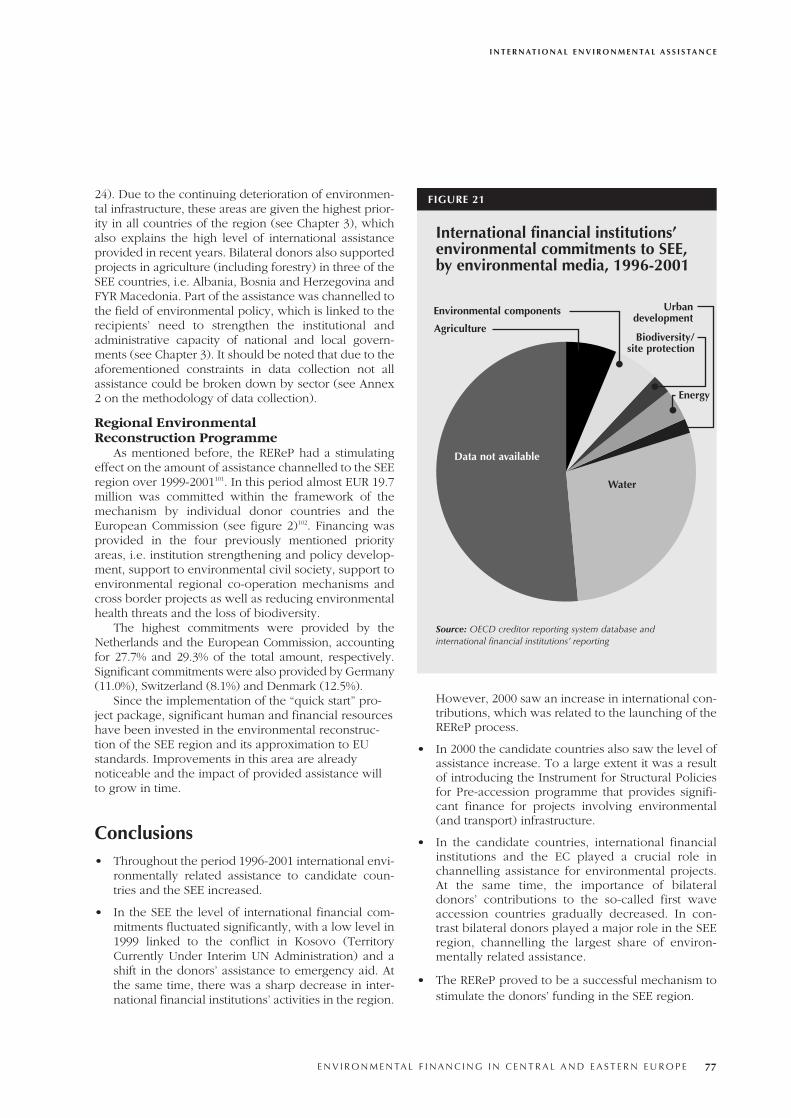
24). Due to the continuing deterioration of environmen-tal infrastructure, these areas are given the highest prior-ity in all countries of the region (see Chapter 3), whichalso explains the high level of international assistanceprovided in recent years. Bilateral donors also supportedprojects in agriculture (including forestry) in three of theSEE countries, i.e. Albania, Bosnia and Herzegovina andFYR Macedonia. Part of the assistance was channelled tothe field of environmental policy, which is linked to therecipients’ need to strengthen the institutional andadministrative capacity of national and local govern-ments (see Chapter 3). It should be noted that due to theaforementioned constraints in data collection not allassistance could be broken down by sector (see Annex2 on the methodology of data collection).
Regional Environmental Reconstruction Programme
As mentioned before, the REReP had a stimulatingeffect on the amount of assistance channelled to the SEEregion over 1999-2001101. In this period almost EUR 19.7million was committed within the framework of themechanism by individual donor countries and theEuropean Commission (see figure 2)102. Financing wasprovided in the four previously mentioned priorityareas, i.e. institution strengthening and policy develop-ment, support to environmental civil society, support toenvironmental regional co-operation mechanisms andcross border projects as well as reducing environmentalhealth threats and the loss of biodiversity.
The highest commitments were provided by theNetherlands and the European Commission, accountingfor 27.7% and 29.3% of the total amount, respectively.Significant commitments were also provided by Germany(11.0%), Switzerland (8.1%) and Denmark (12.5%).
Since the implementation of the “quick start” pro-ject package, significant human and financial resourceshave been invested in the environmental reconstruc-tion of the SEE region and its approximation to EUstandards. Improvements in this area are alreadynoticeable and the impact of provided assistance willto grow in time.
Conclusions• Throughout the period 1996-2001 international envi-
ronmentally related assistance to candidate coun-tries and the SEE increased.
• In the SEE the level of international financial com-mitments fluctuated significantly, with a low level in1999 linked to the conflict in Kosovo (TerritoryCurrently Under Interim UN Administration) and ashift in the donors’ assistance to emergency aid. Atthe same time, there was a sharp decrease in inter-national financial institutions’ activities in the region.
However, 2000 saw an increase in international con-tributions, which was related to the launching of theREReP process.
• In 2000 the candidate countries also saw the level ofassistance increase. To a large extent it was a resultof introducing the Instrument for Structural Policiesfor Pre-accession programme that provides signifi-cant finance for projects involving environmental(and transport) infrastructure.
• In the candidate countries, international financialinstitutions and the EC played a crucial role inchannelling assistance for environmental projects.At the same time, the importance of bilateraldonors’ contributions to the so-called first waveaccession countries gradually decreased. In con-trast bilateral donors played a major role in the SEEregion, channelling the largest share of environ-mentally related assistance.
• The REReP proved to be a successful mechanism tostimulate the donors’ funding in the SEE region.
I N T E R N AT I O N A L E N V I R O N M E N TA L A S S I S TA N C E
E N V I R O N M E N TA L F I N A N C I N G I N C E N T R A L A N D E A S T E R N E U R O P E 77
FIGURE 21
International financial institutions’environmental commitments to SEE,by environmental media, 1996-2001
Source: OECD creditor reporting system database and international financial institutions’ reporting
Data not available
Water
Biodiversity/site protection
Energy
Urbandevelopment
Agriculture
Environmental components
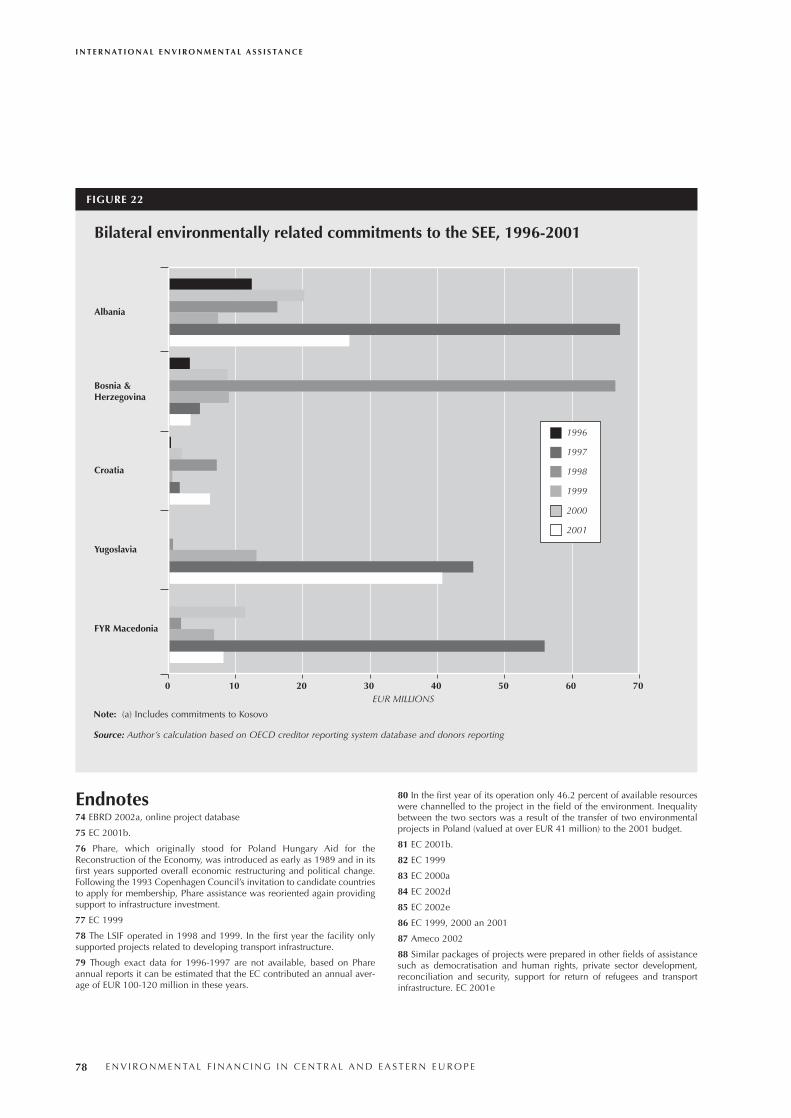
Endnotes74 EBRD 2002a, online project database
75 EC 2001b.
76 Phare, which originally stood for Poland Hungary Aid for theReconstruction of the Economy, was introduced as early as 1989 and in itsfirst years supported overall economic restructuring and political change.Following the 1993 Copenhagen Council’s invitation to candidate countriesto apply for membership, Phare assistance was reoriented again providingsupport to infrastructure investment.
77 EC 1999
78 The LSIF operated in 1998 and 1999. In the first year the facility onlysupported projects related to developing transport infrastructure.
79 Though exact data for 1996-1997 are not available, based on Phareannual reports it can be estimated that the EC contributed an annual aver-age of EUR 100-120 million in these years.
80 In the first year of its operation only 46.2 percent of available resourceswere channelled to the project in the field of the environment. Inequalitybetween the two sectors was a result of the transfer of two environmentalprojects in Poland (valued at over EUR 41 million) to the 2001 budget.
81 EC 2001b.
82 EC 1999
83 EC 2000a
84 EC 2002d
85 EC 2002e
86 EC 1999, 2000 an 2001
87 Ameco 2002
88 Similar packages of projects were prepared in other fields of assistancesuch as democratisation and human rights, private sector development,reconciliation and security, support for return of refugees and transportinfrastructure. EC 2001e
I N T E R N AT I O N A L E N V I R O N M E N TA L A S S I S TA N C E
78 E N V I R O N M E N TA L F I N A N C I N G I N C E N T R A L A N D E A S T E R N E U R O P E
FIGURE 22
Albania
Bosnia &Herzegovina
Croatia
Yugoslavia
FYR Macedonia
Note: (a) Includes commitments to Kosovo
Bilateral environmentally related commitments to the SEE, 1996-2001
EUR MILLIONS0 10 20 30 40 50 60 70
Source: Author’s calculation based on OECD creditor reporting system database and donors reporting
1996
1997
1998
1999
2000
2001
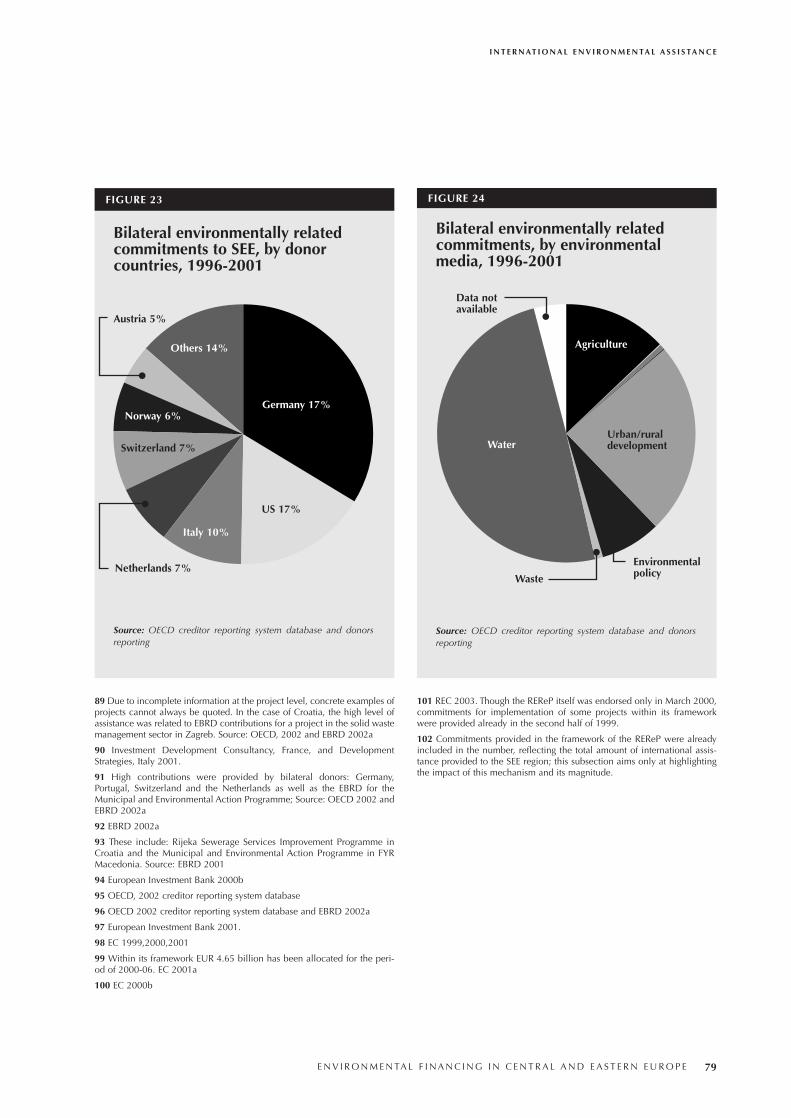
89 Due to incomplete information at the project level, concrete examples ofprojects cannot always be quoted. In the case of Croatia, the high level ofassistance was related to EBRD contributions for a project in the solid wastemanagement sector in Zagreb. Source: OECD, 2002 and EBRD 2002a
90 Investment Development Consultancy, France, and DevelopmentStrategies, Italy 2001.
91 High contributions were provided by bilateral donors: Germany,Portugal, Switzerland and the Netherlands as well as the EBRD for theMunicipal and Environmental Action Programme; Source: OECD 2002 andEBRD 2002a
92 EBRD 2002a
93 These include: Rijeka Sewerage Services Improvement Programme inCroatia and the Municipal and Environmental Action Programme in FYRMacedonia. Source: EBRD 2001
94 European Investment Bank 2000b
95 OECD, 2002 creditor reporting system database
96 OECD 2002 creditor reporting system database and EBRD 2002a
97 European Investment Bank 2001.
98 EC 1999,2000,2001
99 Within its framework EUR 4.65 billion has been allocated for the peri-od of 2000-06. EC 2001a
100 EC 2000b
101 REC 2003. Though the REReP itself was endorsed only in March 2000,commitments for implementation of some projects within its frameworkwere provided already in the second half of 1999.
102 Commitments provided in the framework of the REReP were alreadyincluded in the number, reflecting the total amount of international assis-tance provided to the SEE region; this subsection aims only at highlightingthe impact of this mechanism and its magnitude.
I N T E R N AT I O N A L E N V I R O N M E N TA L A S S I S TA N C E
E N V I R O N M E N TA L F I N A N C I N G I N C E N T R A L A N D E A S T E R N E U R O P E 79
FIGURE 23
Bilateral environmentally relatedcommitments to SEE, by donorcountries, 1996-2001
Source: OECD creditor reporting system database and donorsreporting
FIGURE 24
Bilateral environmentally relatedcommitments, by environmentalmedia, 1996-2001
Source: OECD creditor reporting system database and donorsreporting
US 17%
Netherlands 7%
Switzerland 7%
Austria 5%
Germany 17%
Others 14%
Norway 6%
Italy 10%
Water
Agriculture
Urban/ruraldevelopment
EnvironmentalpolicyWaste
Data not available
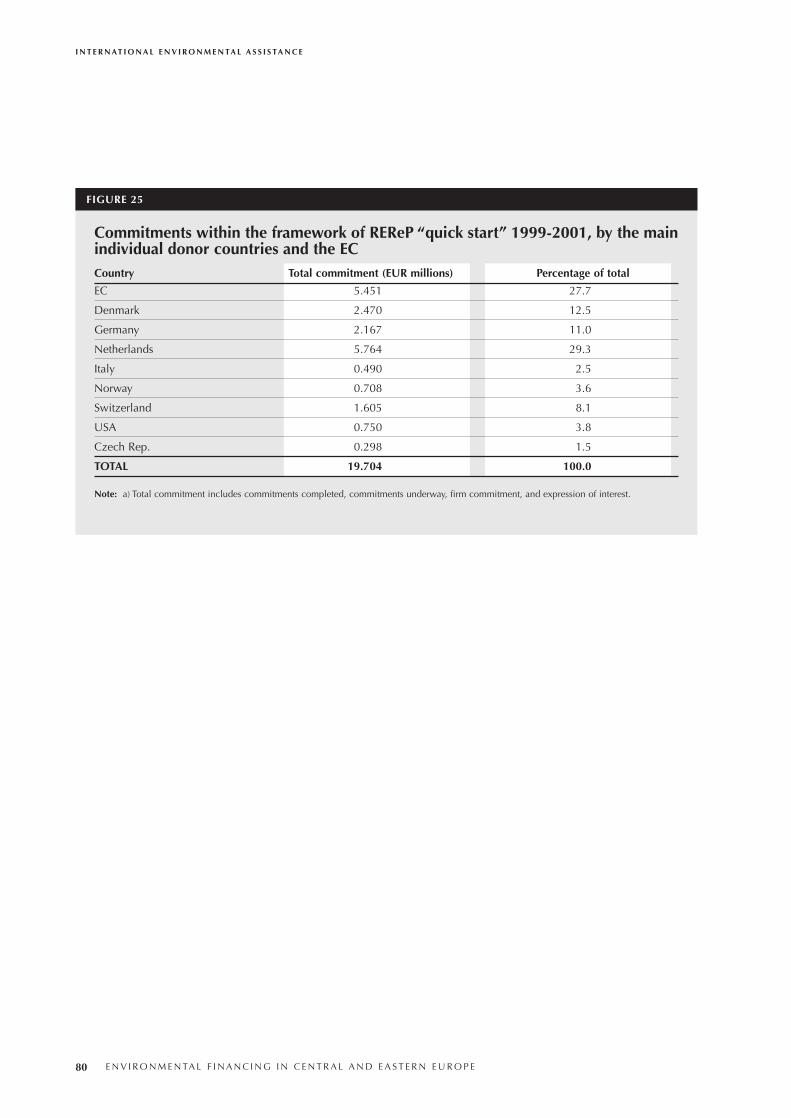
FIGURE 25
I N T E R N AT I O N A L E N V I R O N M E N TA L A S S I S TA N C E
80 E N V I R O N M E N TA L F I N A N C I N G I N C E N T R A L A N D E A S T E R N E U R O P E
Country Total commitment (EUR millions) Percentage of total
EC 5.451 27.7
Denmark 2.470 12.5
Germany 2.167 11.0
Netherlands 5.764 29.3
Italy 0.490 2.5
Norway 0.708 3.6
Switzerland 1.605 8.1
USA 0.750 3.8
Czech Rep. 0.298 1.5
TOTAL 19.704 100.0
Note: a) Total commitment includes commitments completed, commitments underway, firm commitment, and expression of interest.
Commitments within the framework of REReP “quick start” 1999-2001, by the mainindividual donor countries and the EC
Specific Conclusions — the Candidate Countries • As a result of improved harmonisation of expendi-
ture data collection systems in all EU candidatecountries of Central and Eastern Europe (CEE) coun-tries through the Statistical Office of the EuropeanCommunities (Eurostat) system, a clearer picture oftheir environmental expenditure is now emerging.However this transition is still not complete, and fur-ther work is needed in this area.
• The necessary investment required to comply withthe European Union (EU) key investment heavydirectives were estimated in 1999 or 2000, whencountries were negotiating transitional periods.Some estimates were prepared by countries them-selves, and some by international organisations. Atthe moment eight of the 10 candidate countriesanalysed in this report closed negotiations with theEU on the environmental chapter of the acquis com-munautaire and consequently several transitionalperiods for some directives were approved.
• In absolute terms, the size of environmental marketsvaries between countries, with the biggest market inPoland and the Czech Republic reaching more thanEUR 1,000 million in 2000, and the smallest at lessthan EUR 100 million in Estonia and Latvia.
• The total environmental expenditure as a percent-age of gross domestic product (GDP) over the peri-od 1996-2000 decreased in many candidate coun-tries, including Estonia and the Czech Republic. Anincrease was observed in Lithuania and Bulgaria.
• The total environmental expenditure per capita alsoshowed a wide difference between countries, withthe highest expenditure in the Czech Republic (EUR106), Hungary (EUR 85), Poland (EUR 70) andSlovenia (EUR 64) in 2000. In contrast, expenditure
was below EUR 30 per capita in Latvia, Romania,and Bulgaria in 2000.
• Public sector expenditure in the candidate countrieswas initially mainly targeted at the wastewater sec-tor and subsequently at the waste management sec-tor too. The private sector (industry expenditurewas focused mainly on the air sector and the waste-water sector.
• National sources of funding for public sector expen-diture included local government revenues, transfersfrom central government budgets, and grants andsoft loans from environmental funds. There was anincrease in funding from these sources in Bulgariaand Estonia and a decrease in the Czech Republic.
• Progressive integration of the polluter pays principleresulted in higher levels of environmental expendi-ture by industry. Investment by industry increased inBulgaria, Hungary and Slovenia, while it decreasedin Poland, the Czech Republic and Slovakia, remain-ing constant in other countries.
• The highest levels of expenditure by the private sec-tor in relation to industry on a per capita basis werein Slovenia, the Czech Republic and Hungary (allreaching more than EUR 20 per capita in 2000) andthe lowest were in Bulgaria, Romania, Lithuania andLatvia (less than EUR 10 per capita in 2000).
• Many candidate countries involved the private sec-tor in public infrastructure environmental projectsthrough public private partnerships. The ways ofinvolving the private sector through public privatepartnerships ranged from technical assistance deliv-ered by the private sector, through turnkey contractsand operating contracts such as the “build, operate,transfer” and “build, own, operate and transfer”schemes to the full privatisation.
E N V I R O N M E N TA L F I N A N C I N G I N C E N T R A L A N D E A S T E R N E U R O P E 81
Chapter 9Key Conclusions
• The overall levels of international assistanceincreased from 1996 to 2001. The launching of theISPA instrument by the European Community (EC),together with co-financing from international finan-cial institutions such as the European InvestmentBank and European Bank for Reconstruction andDevelopment contributed to this increase, and theseinstitutions played a crucial role in providing 91 per-cent of total environmental assistance to the region.
• In contrast, the contribution of bilateral donors tothe first wave accession countries has decreasedsignificantly since 1998.
Specific Conclusions — the SEE countries• The levels of investment needs in order to comply
with EU key investment heavy directives are notknown at the moment for any of the SEE countries.
• Although there is some work currently in progresscollecting expenditure data in some countries, thelevels of comparable environmental expenditure arenot presently known in the SEE countries. As a con-sequence it was only possible to show trends andlevels of environmental expenditure in a small num-ber of these countries.
• Many SEE countries were dependent almost exclu-sively on international assistance for funding envi-ronmental investment projects. Funding fromdomestic (national) sources was very limited.
• In some countries courses of action were taken tostrengthen environmental financing. For example,an environmental fund was set up in FYRMacedonia, and in Croatia environmental infrastruc-ture projects were funded by the Croatian Bank forReconstruction and Development.
• At this stage, the involvement of the private sector inpublic infrastructure projects in the SEE is very limited.
• Overall, international assistance channelled to theregion for environmental projects increased over theperiod. However, levels of assistance fluctuatedfrom year to year, for example as a result of the con-flict in Kosovo (Territory Currently Under InterimUN Administration) in 1999. In this region bilateraldonors played an important role, providing almost57 percent of the external assistance in this field.
• The implementation of the Regional EnvironmentalReconstruction Programme proved to be a success-ful mechanism facilitating the donors’ assistancechannelled to the SEE region.
K E Y C O N C L U S I O N S
82 E N V I R O N M E N TA L F I N A N C I N G I N C E N T R A L A N D E A S T E R N E U R O P E
This chapter discusses several options for the futureactions to be undertaken by different stakeholders,including governments, local authorities, industry, inter-national financing institutions, donors’ communities andothers in order to find the best solutions for futurecourses of action.
Revising and Identifying Investment Needs
In the EU candidate countries of Central and EasternEurope (CEE), the investment needs were identified in1999 and 2000, i.e. before several transitional periodsfor directives were granted for eight out of 10 countries.Additionally different studies were undertaken by dif-ferent organisations and it can be observed that therange of estimates is quite significant. When the transi-tional periods are granted it would be useful for thosecountries to revise their investment needs in order toestimate the expenditures needed to comply withEuropean Union (EU) directives in general, and espe-cially before the end of the transitional periods.
For the remaining two candidate countries for whichnegotiations are open, the revision of estimated invest-ment needs could facilitate the process of identifyingthe more realistic transitional periods.
For the South Eastern Europe (SEE) countries withfuture prospects of EU integration associated with theStabilisation and Association Process, it would be usefulto estimate the investment needs in order to complywith future EU requirements.
Using Investment More Efficiently Additionally, developing and improving clearly
defined financing strategies can help the candidatecountries to reach their targets of compliance in a short-
er time period and more effectively. Financing strategiesare closely related to setting a priorities mechanism atthe strategic level. Clearly defined priorities in financingstrategies help countries not only to use investmentmore effectively but also to facilitate access to the post-accession Community Structural and Cohesion Funds.Moreover, for those countries still negotiating transition-al periods (Bulgaria, Romania) well-defined prioritiesand funding strategies can better justify requests forextra time. For the countries of SEE it is essential first todefine targets, and then to prepare the environmentalfinancial strategies.
Additionally all countries of the region can benefitfrom developing lists of priority investment projects. Abottom-up approach will allow projects to be conceivedby municipalities and the other stakeholders who areresponsible for the final investment. Priority setting atthe project level needs to involve responsible institu-tions from the national and local levels, in order toensure that the policy targets which were set at thenational level match investment needs at the local leveland in order to ensure affordability of the projects.
Coordinating Sources of FinanceIn the countries in transition international environ-
mental assistance is regarded as a tool that should helpto leverage domestic environmental expenditure.International assistance can be focused on financinginfrastructure projects as well as providing technicalassistance. In both cases it is important to tailor theprocess of international assistance to the countries’needs. Imposing international priorities that force thecountries to adapt their requests to the available assis-tance may result in weak ownership of implementedprojects. The candidate countries will put efforts to max-imise their benefits from the Structural and CohesionFunds and will benefit more frequently from interna-
E N V I R O N M E N TA L F I N A N C I N G I N C E N T R A L A N D E A S T E R N E U R O P E 83
Chapter 10Options for the Future
tional financial institution loans. While EC assistance isincreasing, bilateral donors’ overall assistance to the firstround candidate countries has been decreasing. Thebilateral donors’ savings from the decreased assistanceto the first round accession countries could be trans-ferred to the second round accession countries as wellas to the SEE countries.
Lending by international financial institutions willbecome more commonplace in all countries of theregion. In order to minimise the risk of loan default orproject failure, before a large loan is agreed, donorscould help to minimise the risk. From the recent experi-ence of the Project Preparation Committee103 specificways of involving the international financial institutiondonors in investment project include:
• funding feasibility studies during the project prepa-ration stage;
• funding technical assistance or equipment purchaseduring implementation;
• extending a guarantee on behalf of the recipientcountry or municipality instead of providing a grantfor investment (This reduces the risk of lending andallows the borrower to receive funds on morefavourable terms.).
• increasing a borrower’s borrowing capacity, there-by extending the overall size and scope of aninvestment;
• reducing a borrower’s debt service burden by reduc-ing interest payments on a loan, thus allowing theborrower to attend to other issues, such as tariffincreases or reduction of government subsidiesmore quickly.
Additionally, co-ordination of activities betweendonors and international financial institutions can lever-age the amount of assistance provided to countries,where for example coordination of activities betweendonors can result in quicker implementation of aninvestment project. Donors’ grants for technical assis-tance with project preparation and loans from an inter-national financial institution at the investment stagewould be helpful.
Increasing Absorption Capacity As discussed in the previous chapters, in the coming
years countries of both candidate countries and the SEEwill be eligible for increased levels of EC assistance inthe field of environment as well as in others. First roundaccession countries will benefit from financing withinCohesion and Structural Funds (see figure 1). At thesame time the level of assistance provided to the sec-
ond round accession countries within the framework ofexisting programmes such as Instrument for StructuralPolicies for Pre-accession (ISPA), Special AccessionProgramme for Agricultural and Rural Development(SAPARD) and Phare will rise considerably104. Finally,the region of SEE will continue to benefit from the aidchannelled through the Community Assistance forReconstruction, Development and Stabilisation pro-gramme (CARDS). EC assistance should help tomobilise financing from other international sources, i.e.from international financial institutions and individualdonor countries (in the case of the SEE and the secondround accession countries).
The extent to which the recipient countries will ben-efit from prospects of increased assistance depends to alarge degree on their absorption capacity, i.e. ability todisburse in an effective and efficient way the allocatedfinancial resources. To date, due to the limited capacityof public administration to prepare and implement pro-jects as well as manage and use funds, the absorptionremains low (see also figure 2). For instance, the ISPAapplication forms approved and sent in by some candi-date countries in the year 2000 did not always corre-spond with the funding criteria and often lacked thenecessary studies on the economic or financial aspectsof the projects105.
In order to increase absorption capacity and theuse of available international assistance, countriesshould strengthen public administration and improvecoordination of cooperation between various institu-tions at a national level (especially in the SEE coun-tries). The former involves providing training in pro-ject preparation, implementation and monitoring,training in financial appraisal and analysis as a com-ponent of programme development and projectpreparation, as well as adoption of donors’ adminis-trative and reporting requirements. These activitiesshould assist countries in the gradual decentralisationof project implementation that will be necessary witheffect from new sources of assistance (especially inthe framework of Cohesion and Structural Funds).Additionally, countries should enhance mobilisationof their own resources, both public and private, andplan and guarantee national contributions in multi-annual budgets106.
In the candidate countries, the issue of developingabsorption capacity has been supported by the EC with-in the framework of the Phare programme since 2000107.Though the candidate countries made significantprogress in this field, they have not yet established thecapacity to effectively manage programmes, especially ata regional level108. It is important to note that as memberstates control Structural and Cohesion Funds themselves,more training is needed in programming and monitoring.
O P T I O N S F O R T H E F U T U R E
84 E N V I R O N M E N TA L F I N A N C I N G I N C E N T R A L A N D E A S T E R N E U R O P E
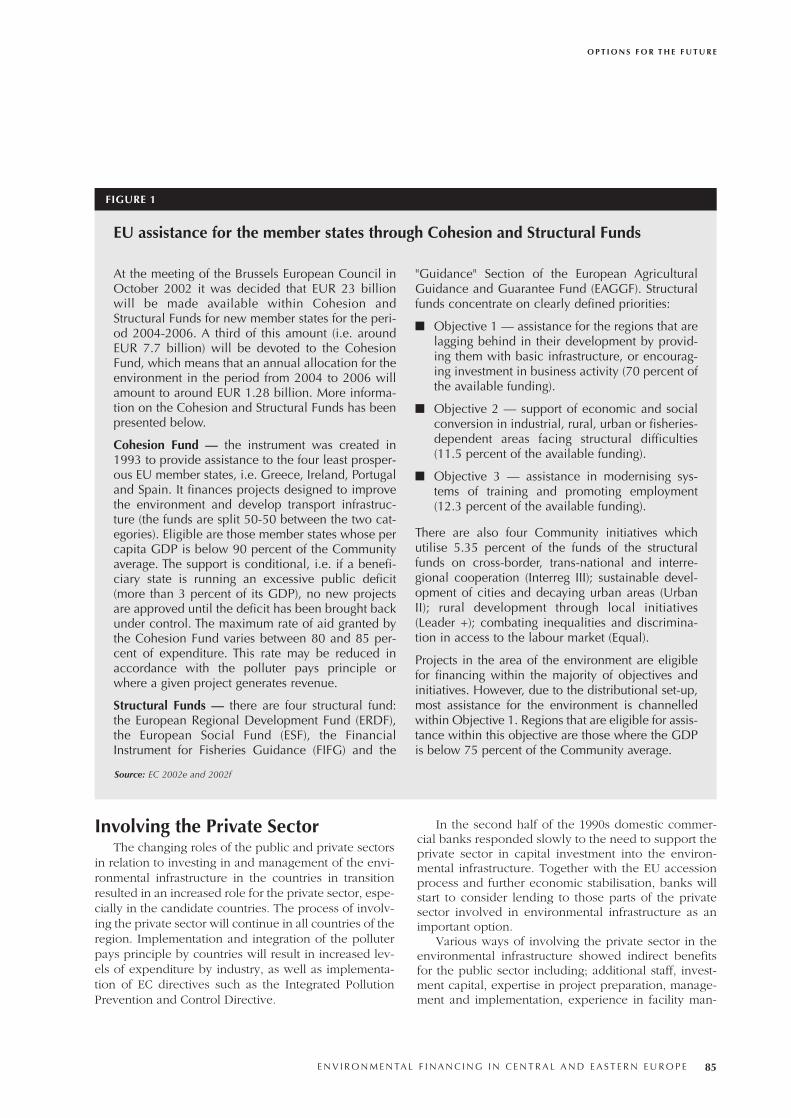
Involving the Private SectorThe changing roles of the public and private sectors
in relation to investing in and management of the envi-ronmental infrastructure in the countries in transitionresulted in an increased role for the private sector, espe-cially in the candidate countries. The process of involv-ing the private sector will continue in all countries of theregion. Implementation and integration of the polluterpays principle by countries will result in increased lev-els of expenditure by industry, as well as implementa-tion of EC directives such as the Integrated PollutionPrevention and Control Directive.
In the second half of the 1990s domestic commer-cial banks responded slowly to the need to support theprivate sector in capital investment into the environ-mental infrastructure. Together with the EU accessionprocess and further economic stabilisation, banks willstart to consider lending to those parts of the privatesector involved in environmental infrastructure as animportant option.
Various ways of involving the private sector in theenvironmental infrastructure showed indirect benefitsfor the public sector including; additional staff, invest-ment capital, expertise in project preparation, manage-ment and implementation, experience in facility man-
O P T I O N S F O R T H E F U T U R E
E N V I R O N M E N TA L F I N A N C I N G I N C E N T R A L A N D E A S T E R N E U R O P E 85
FIGURE 1
At the meeting of the Brussels European Council inOctober 2002 it was decided that EUR 23 billionwill be made available within Cohesion andStructural Funds for new member states for the peri-od 2004-2006. A third of this amount (i.e. aroundEUR 7.7 billion) will be devoted to the CohesionFund, which means that an annual allocation for theenvironment in the period from 2004 to 2006 willamount to around EUR 1.28 billion. More informa-tion on the Cohesion and Structural Funds has beenpresented below.
Cohesion Fund — the instrument was created in1993 to provide assistance to the four least prosper-ous EU member states, i.e. Greece, Ireland, Portugaland Spain. It finances projects designed to improvethe environment and develop transport infrastruc-ture (the funds are split 50-50 between the two cat-egories). Eligible are those member states whose percapita GDP is below 90 percent of the Communityaverage. The support is conditional, i.e. if a benefi-ciary state is running an excessive public deficit(more than 3 percent of its GDP), no new projectsare approved until the deficit has been brought backunder control. The maximum rate of aid granted bythe Cohesion Fund varies between 80 and 85 per-cent of expenditure. This rate may be reduced inaccordance with the polluter pays principle orwhere a given project generates revenue.
Structural Funds — there are four structural fund:the European Regional Development Fund (ERDF),the European Social Fund (ESF), the FinancialInstrument for Fisheries Guidance (FIFG) and the
"Guidance" Section of the European AgriculturalGuidance and Guarantee Fund (EAGGF). Structuralfunds concentrate on clearly defined priorities:
■ Objective 1 — assistance for the regions that arelagging behind in their development by provid-ing them with basic infrastructure, or encourag-ing investment in business activity (70 percent ofthe available funding).
■ Objective 2 — support of economic and socialconversion in industrial, rural, urban or fisheries-dependent areas facing structural difficulties(11.5 percent of the available funding).
■ Objective 3 — assistance in modernising sys-tems of training and promoting employment(12.3 percent of the available funding).
There are also four Community initiatives whichutilise 5.35 percent of the funds of the structuralfunds on cross-border, trans-national and interre-gional cooperation (Interreg III); sustainable devel-opment of cities and decaying urban areas (UrbanII); rural development through local initiatives(Leader +); combating inequalities and discrimina-tion in access to the labour market (Equal).
Projects in the area of the environment are eligiblefor financing within the majority of objectives andinitiatives. However, due to the distributional set-up,most assistance for the environment is channelledwithin Objective 1. Regions that are eligible for assis-tance within this objective are those where the GDPis below 75 percent of the Community average.
EU assistance for the member states through Cohesion and Structural Funds
Source: EC 2002e and 2002f
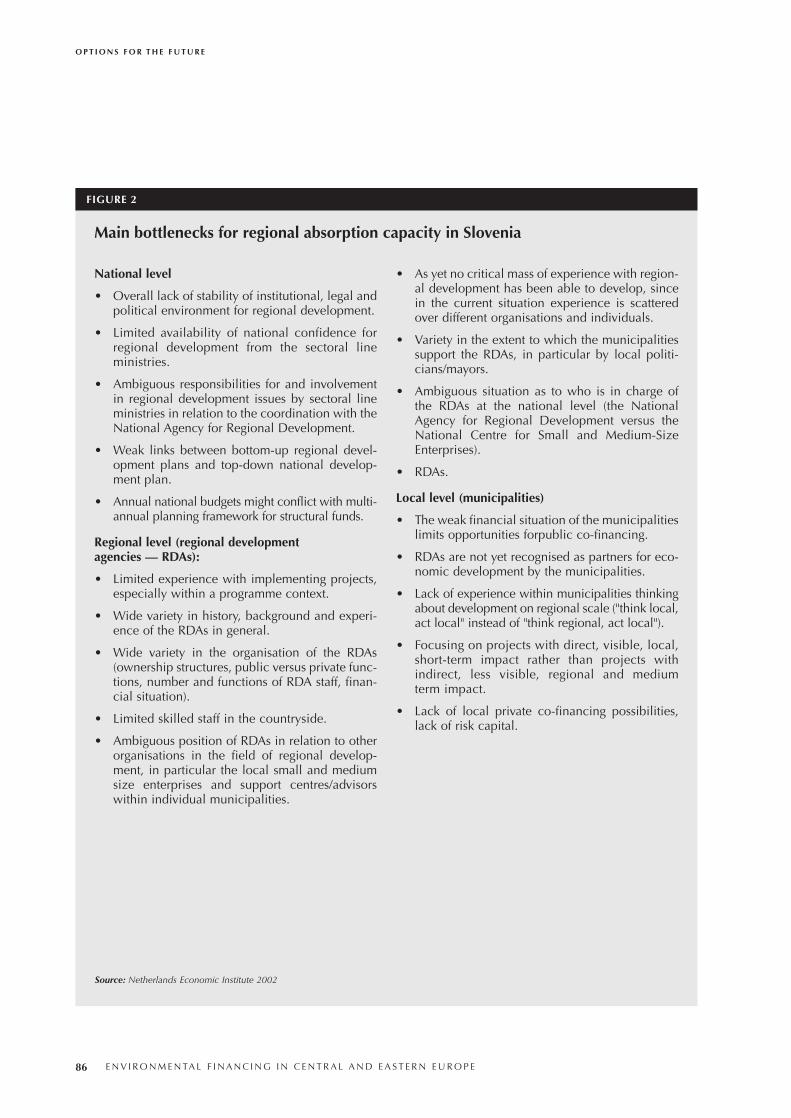
O P T I O N S F O R T H E F U T U R E
86 E N V I R O N M E N TA L F I N A N C I N G I N C E N T R A L A N D E A S T E R N E U R O P E
FIGURE 2
National level
• Overall lack of stability of institutional, legal andpolitical environment for regional development.
• Limited availability of national confidence forregional development from the sectoral lineministries.
• Ambiguous responsibilities for and involvementin regional development issues by sectoral lineministries in relation to the coordination with theNational Agency for Regional Development.
• Weak links between bottom-up regional devel-opment plans and top-down national develop-ment plan.
• Annual national budgets might conflict with multi-annual planning framework for structural funds.
Regional level (regional development agencies — RDAs):
• Limited experience with implementing projects,especially within a programme context.
• Wide variety in history, background and experi-ence of the RDAs in general.
• Wide variety in the organisation of the RDAs(ownership structures, public versus private func-tions, number and functions of RDA staff, finan-cial situation).
• Limited skilled staff in the countryside.
• Ambiguous position of RDAs in relation to otherorganisations in the field of regional develop-ment, in particular the local small and mediumsize enterprises and support centres/advisorswithin individual municipalities.
• As yet no critical mass of experience with region-al development has been able to develop, sincein the current situation experience is scatteredover different organisations and individuals.
• Variety in the extent to which the municipalitiessupport the RDAs, in particular by local politi-cians/mayors.
• Ambiguous situation as to who is in charge ofthe RDAs at the national level (the NationalAgency for Regional Development versus theNational Centre for Small and Medium-SizeEnterprises).
• RDAs.
Local level (municipalities)
• The weak financial situation of the municipalitieslimits opportunities forpublic co-financing.
• RDAs are not yet recognised as partners for eco-nomic development by the municipalities.
• Lack of experience within municipalities thinkingabout development on regional scale ("think local,act local" instead of "think regional, act local").
• Focusing on projects with direct, visible, local,short-term impact rather than projects withindirect, less visible, regional and mediumterm impact.
• Lack of local private co-financing possibilities,lack of risk capital.
Main bottlenecks for regional absorption capacity in Slovenia
Source: Netherlands Economic Institute 2002
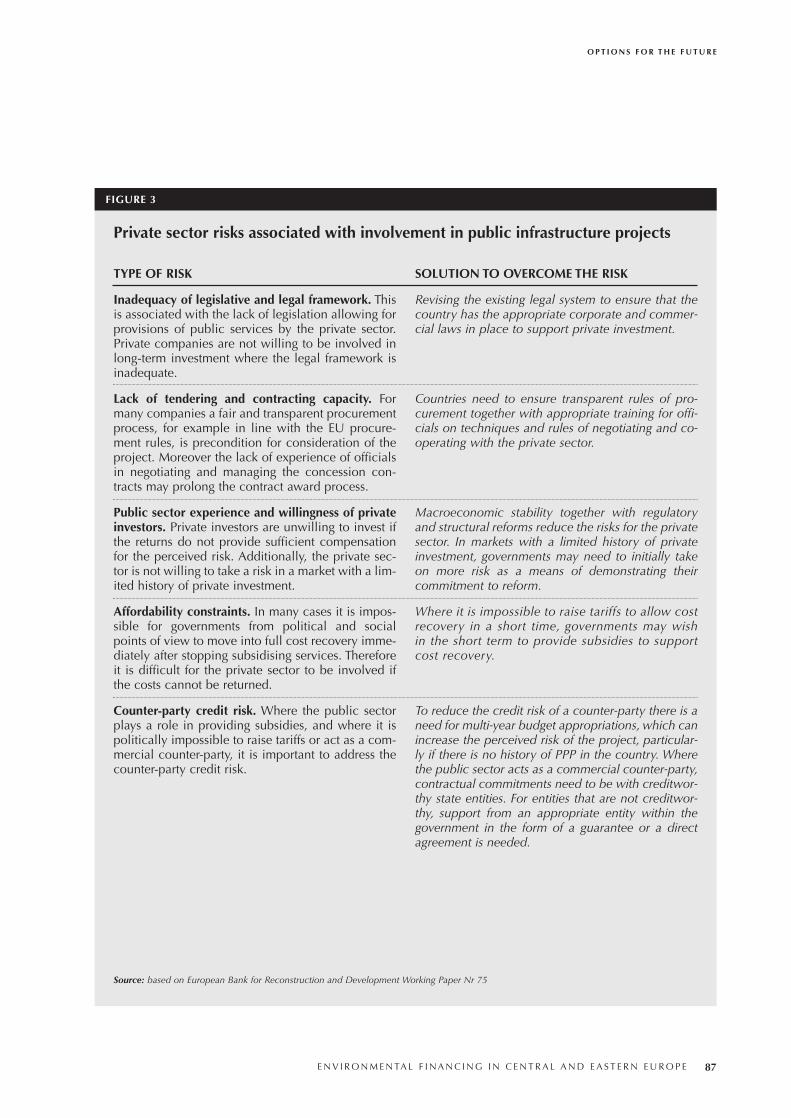
O P T I O N S F O R T H E F U T U R E
E N V I R O N M E N TA L F I N A N C I N G I N C E N T R A L A N D E A S T E R N E U R O P E 87
FIGURE 3
TYPE OF RISK
Inadequacy of legislative and legal framework. Thisis associated with the lack of legislation allowing forprovisions of public services by the private sector.Private companies are not willing to be involved inlong-term investment where the legal framework isinadequate.
Lack of tendering and contracting capacity. Formany companies a fair and transparent procurementprocess, for example in line with the EU procure-ment rules, is precondition for consideration of theproject. Moreover the lack of experience of officialsin negotiating and managing the concession con-tracts may prolong the contract award process.
Public sector experience and willingness of privateinvestors. Private investors are unwilling to invest ifthe returns do not provide sufficient compensationfor the perceived risk. Additionally, the private sec-tor is not willing to take a risk in a market with a lim-ited history of private investment.
Affordability constraints. In many cases it is impos-sible for governments from political and socialpoints of view to move into full cost recovery imme-diately after stopping subsidising services. Thereforeit is difficult for the private sector to be involved ifthe costs cannot be returned.
Counter-party credit risk. Where the public sectorplays a role in providing subsidies, and where it ispolitically impossible to raise tariffs or act as a com-mercial counter-party, it is important to address thecounter-party credit risk.
SOLUTION TO OVERCOME THE RISK
Revising the existing legal system to ensure that thecountry has the appropriate corporate and commer-cial laws in place to support private investment.
Countries need to ensure transparent rules of pro-curement together with appropriate training for offi-cials on techniques and rules of negotiating and co-operating with the private sector.
Macroeconomic stability together with regulatoryand structural reforms reduce the risks for the privatesector. In markets with a limited history of privateinvestment, governments may need to initially takeon more risk as a means of demonstrating theircommitment to reform.
Where it is impossible to raise tariffs to allow costrecovery in a short time, governments may wishin the short term to provide subsidies to supportcost recovery.
To reduce the credit risk of a counter-party there is aneed for multi-year budget appropriations, which canincrease the perceived risk of the project, particular-ly if there is no history of PPP in the country. Wherethe public sector acts as a commercial counter-party,contractual commitments need to be with creditwor-thy state entities. For entities that are not creditwor-thy, support from an appropriate entity within thegovernment in the form of a guarantee or a directagreement is needed.
Private sector risks associated with involvement in public infrastructure projects
Source: based on European Bank for Reconstruction and Development Working Paper Nr 75
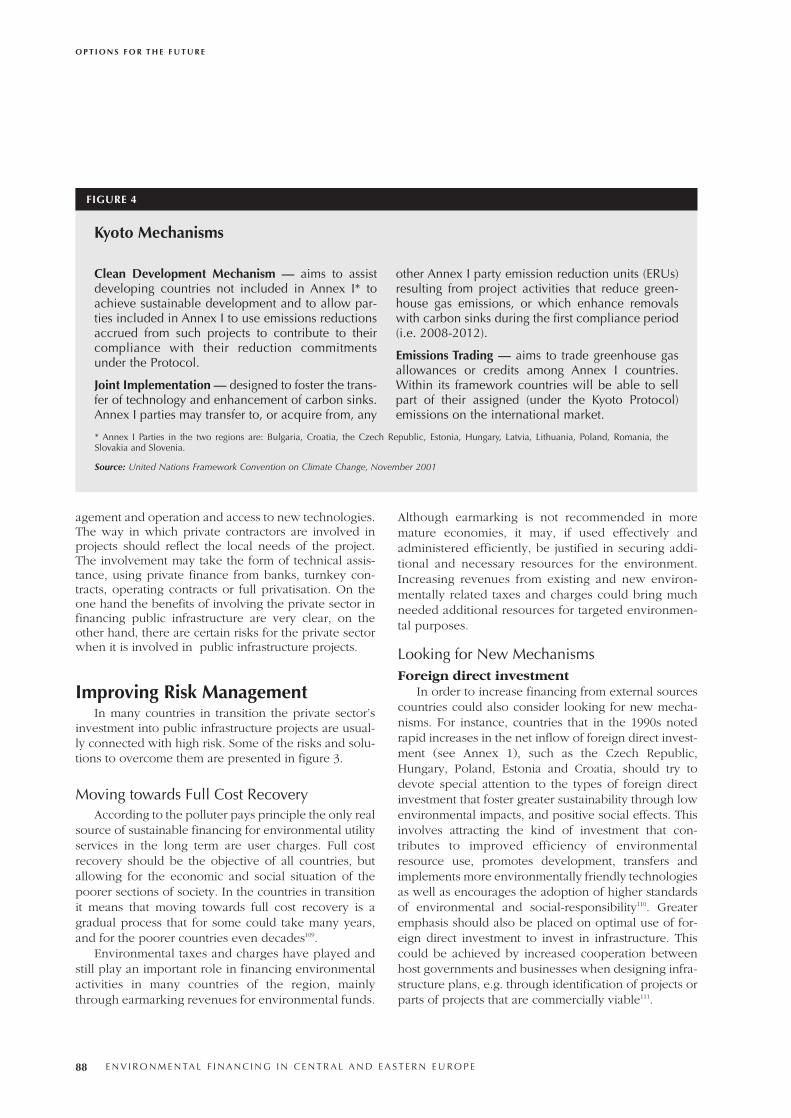
agement and operation and access to new technologies.The way in which private contractors are involved inprojects should reflect the local needs of the project.The involvement may take the form of technical assis-tance, using private finance from banks, turnkey con-tracts, operating contracts or full privatisation. On theone hand the benefits of involving the private sector infinancing public infrastructure are very clear, on theother hand, there are certain risks for the private sectorwhen it is involved in public infrastructure projects.
Improving Risk ManagementIn many countries in transition the private sector’s
investment into public infrastructure projects are usual-ly connected with high risk. Some of the risks and solu-tions to overcome them are presented in figure 3.
Moving towards Full Cost RecoveryAccording to the polluter pays principle the only real
source of sustainable financing for environmental utilityservices in the long term are user charges. Full costrecovery should be the objective of all countries, butallowing for the economic and social situation of thepoorer sections of society. In the countries in transitionit means that moving towards full cost recovery is agradual process that for some could take many years,and for the poorer countries even decades109.
Environmental taxes and charges have played andstill play an important role in financing environmentalactivities in many countries of the region, mainlythrough earmarking revenues for environmental funds.
Although earmarking is not recommended in moremature economies, it may, if used effectively andadministered efficiently, be justified in securing addi-tional and necessary resources for the environment.Increasing revenues from existing and new environ-mentally related taxes and charges could bring muchneeded additional resources for targeted environmen-tal purposes.
Looking for New MechanismsForeign direct investment
In order to increase financing from external sourcescountries could also consider looking for new mecha-nisms. For instance, countries that in the 1990s notedrapid increases in the net inflow of foreign direct invest-ment (see Annex 1), such as the Czech Republic,Hungary, Poland, Estonia and Croatia, should try todevote special attention to the types of foreign directinvestment that foster greater sustainability through lowenvironmental impacts, and positive social effects. Thisinvolves attracting the kind of investment that con-tributes to improved efficiency of environmentalresource use, promotes development, transfers andimplements more environmentally friendly technologiesas well as encourages the adoption of higher standardsof environmental and social-responsibility110. Greateremphasis should also be placed on optimal use of for-eign direct investment to invest in infrastructure. Thiscould be achieved by increased cooperation betweenhost governments and businesses when designing infra-structure plans, e.g. through identification of projects orparts of projects that are commercially viable111.
O P T I O N S F O R T H E F U T U R E
88 E N V I R O N M E N TA L F I N A N C I N G I N C E N T R A L A N D E A S T E R N E U R O P E
FIGURE 4
Clean Development Mechanism — aims to assistdeveloping countries not included in Annex I* toachieve sustainable development and to allow par-ties included in Annex I to use emissions reductionsaccrued from such projects to contribute to theircompliance with their reduction commitmentsunder the Protocol.
Joint Implementation — designed to foster the trans-fer of technology and enhancement of carbon sinks.Annex I parties may transfer to, or acquire from, any
other Annex I party emission reduction units (ERUs)resulting from project activities that reduce green-house gas emissions, or which enhance removalswith carbon sinks during the first compliance period(i.e. 2008-2012).
Emissions Trading — aims to trade greenhouse gasallowances or credits among Annex I countries.Within its framework countries will be able to sellpart of their assigned (under the Kyoto Protocol)emissions on the international market.
Kyoto Mechanisms
* Annex I Parties in the two regions are: Bulgaria, Croatia, the Czech Republic, Estonia, Hungary, Latvia, Lithuania, Poland, Romania, theSlovakia and Slovenia.
Source: United Nations Framework Convention on Climate Change, November 2001
Climate change mechanismsThe seventh Conference of the Parties to the UN
Framework Convention on Climate Change held inMarrakech in 2001 brought certain progress in decisionson the implementation of the three Kyoto mechanisms,establishing a regulatory framework for their operation.Their specifics are described in figure 4.
The mechanisms provide opportunities for coun-tries in both regions to finance environmental projectscontributing to greenhouse gas reductions. However,from now on only the Clean Development Mechanismis operational, and two other mechanisms will startonly from 2008 onwards112. To benefit from the threemechanisms, the countries should streamline selec-tion, approval, disclosure, and participation proce-dures along with developing the capacity to proposeprojects to investors and leverage financing from vari-ous sources113.
Endnotes103 Project Preparation Committee web site
104 According to the EC proposal, the assistance to Bulgaria and Romaniashould increase progressively (from 2004) reaching up to 40 percent in2006, on condition that countries make progress in implementation of theaccession partnerships. The increase is to take as its base line the averageassistance under Phare/ISPA/SAPARD for the two countries in the period2001 to 2003. Source: EC 2002b.
105 EC 2001c
106 EC 2000a and NEI Regional and Urban Development 2002
107 EC 2000a op. cit.
108 NEI op. cit.
109 REC 2001b
110 OECD 1999; World Bank Council for Sustainable Development(WBCSD)*et al, August 2002.
111 WBCSD op cit.
112 UNFCCC November 2001
113 In 1995 some CEE counties started the pilot phase of ActivitiesImplemented Jointly. Source: WRI 2000
O P T I O N S F O R T H E F U T U R E
E N V I R O N M E N TA L F I N A N C I N G I N C E N T R A L A N D E A S T E R N E U R O P E 89

90 E N V I R O N M E N TA L F I N A N C I N G I N C E N T R A L A N D E A S T E R N E U R O P E
The following recommendations for action by vari-ous stakeholders are based on presented information inchapters 2-8, the key conclusions, and the options forthe future presented in Chapter 10.
Recommendations for the Governments of the Candidate Countries • Revisions of estimates of investment needs are need-
ed in order to assess the real investment needs with-in the directives’ deadlines in general and grantedtransitional periods in particular.
• Clearly defined financial strategies and lists of priorityprojects need to be developed in order both to attractdonors and to use the available funding more effi-ciently. For the first round accession countries, finan-cial strategies will facilitate the absorption ofincreased levels of post-accession assistance ofStructural and Cohesion Funds. By developing appro-priate financing strategies, the second round acces-sion countries (Bulgaria and Romania) will be betterable to justify requests for transitional periods in thecourse of their negotiations, and to absorb increasedpre-accession funding e.g. through the Instrument forStructural Policies for Pre-accession (ISPA).
• A further harmonisation of statistical systems withthe Statistical Office for the European Communities(Eurostat) needs to be achieved in order to trackchanges in levels and trends of environmentalexpenditure in all countries.
• Further increase of administrative capacity is neededat a national level in order to effectively managepost-accession assistance and increased levels ofpre-accession assistance to Bulgaria and Romania.
• Administrative capacity at the regional and local lev-els needs to be strengthened in order to absorbinternational assistance. In the case of the first roundaccession countries, this will leverage absorption ofthe increased amounts of assistance channelledthrough cohesion and structural funds. In the case ofsecond round accession countries, it will help toabsorb pre-accession funds before post-accessionassistance becomes available.
• Training for all levels of administration needs to be pro-vided by governments in order to create favourableconditions for managing environmental investmentprojects (e.g. financial evaluation, tendering, and pro-ject management involving the private sector).
• Governments must minimise the risk of involvementfor the private sector. It can be done by more clear-ly defining legal and administrative frameworks forpublic-private partnership projects, or by offeringtraining in development, implementation and man-agement of public private-partnership projects.
• Further support is needed for the private sector inorder to create better conditions for the private sec-tor to be involved in environmental projects. It canbe done by providing training in requirements ofpost-accession assistance and different types of pub-lic private partnerships, etc.
Recommendations for the Governments of South Eastern Europe • Investment needs have to be estimated by govern-
ments in order to design credible financial strategies.
• Domestic financing mechanisms need to be devel-oped by governments to support environmental
E N V I R O N M E N TA L F I N A N C I N G I N C E N T R A L A N D E A S T E R N E U R O P E 91
Chapter 11The Way Forward —
Recommendations for Action
expenditure, especially in environmental infrastruc-ture development. This can be done by introducingeconomic instruments and strengthening those thatalready exist.
• Clearly defined financing strategies and lists of pri-ority projects need to be developed to use invest-ments more efficiently and, also, to attract donors.
• Administrative capacity at the national level and atregional and local levels needs to be improved toabsorb the assistance channelled to the countries ofthe region and as a precondition for development ofdomestic financial mechanisms. This can be done byimproving training in project preparation, imple-mentation and monitoring as well as by adoptingdonors’ administrative and reporting requirements.
• There needs to be better co-ordination of activitiesbetween institutions within the countries, especiallyin those countries that are divided into entities, andwhere environmental investment is handled by dif-ferent ministries.
• Support is needed for the emerging domestic eco-industries market (including; national consultingcompanies providing technical assistance in the pro-ject preparation phase as well as national companiessupplying environmental equipment for infrastruc-ture projects) in order to implement infrastructureprojects in a more effective and efficient way and toensure the transfer of the best technologies.Additionally, development of eco-industries has apositive effect on the reduction of unemployment. Itcan be done by giving tax breaks to eco-industrycompanies, establishing national/international exhi-bitions or by creating favourable conditions for jointventures.
• Support is needed for the development of collectionsystems of data on environmental expenditure inorder to track the levels and trends of environmentalexpenditure in the countries.
• Governments must minimise the risk of involvementof the private sector. This can be done for examplethrough a more clearly defined legal and administra-tive framework for public-private partnership pro-jects, or by offering training in the development,implementation and management of such projects.
Recommendations for the Private Sector• Commercial banks should give more support to pri-
vate companies that invest in environmental infra-structure projects.
• Training for private sector companies is needed inorder to better assess how to improve risk manage-ment as well as to more effectively identify futureopportunities to be involved in public infrastruc-ture projects.
• Further improvement of environmental standards byindustry is needed. This can be done by introducingthe Eco-Management and Audit Scheme or ISO14,000, or supporting industry with the training.
Recommendations for Donors • International assistance needs to be better co-ordinat-
ed by donors in order to target countries’ national pri-orities more effectively.
• With the increased levels of post-accession assistancefrom the EU, donors need to re-focus their assistanceon the SEE countries.
• Support from international financial institutions isneeded (including funding for feasibility studies,technical assistance and loan guarantees for recipi-ent countries etc) in order to leverage the effect ofthe provided assistance.
• Donors need to support SEE countries in developingtheir domestic financial mechanisms in order toleverage the effect of assistance.
• Further work is needed to more clearly define frame-works for funding according to the types of projects,absolute levels of funding, specific requirements forco-funding as well as rules relating to private sectorinvolvement, etc.
T H E WAY F O R WA R D — R E C O M M E N DAT I O N S F O R AC T I O N
92 E N V I R O N M E N TA L F I N A N C I N G I N C E N T R A L A N D E A S T E R N E U R O P E
Ameco. 2002. Compilation of Project Preparation Committee DonorProfiles. A survey of donor funding for environmental assistance to Centraland Eastern Europe (CEE) and the network information system.
Bazaniak. 1998. Non-Public Issue of Municipal Bonds in the MiesciskoCommune as a Pioneering Source of Financing a Wastewater TreatmentPlant and Sewerage Project in Poland, in Innovating Financing forEnvironmental Investment: Looking Toward the Future. US Agency forInternational Development (USAID).
BOS. 2001. Bank Ochrony Srodowiska, environmental protection report.
Donge, Kato and Maurer. An Environmental Analysis of Recent Trends inInternational Financial Flows with a Special Focus on Japan. WRI. 2001.
European Bank for Reconstruction and Development (EBRD). 2000. TheEBRD’s contribution to the environment and nuclear safety.
EBRD 2001. Water Strategy: Regional Approach for South Eastern Europe.
EBRD 2002a. Database of signed projects, online documentwww.ebrd.com/projects/signed/main.htm.
EBRD 2002b. Transition report update.
EBRD 2002c. Working Paper Nr 75, Contracting in transition economymunicipal projects.
EEA. 1999. The Environment in the EU at the Turn of the Century.
European Investment Bank 2000a. Lending in Central European AccessionCountries.
European Investment Bank 2000b. Basic Infrastructure Investment in South-Eastern Europe, regional project review.
European Investment Bank 2001. The bank’s operations in the accessioncountries of CEE: Review of current and future lending policy.
Petkov, Elenaa and Baumert, Kevin A. Making Joint Implementation Work:Lessons from CEE. WRI. November 2000.
EMEP Database. 2002. Cooperative programme for monitoring and evalua-tion of long range transmissions of air pollutants in Europe.
European Commission. 1999, 2000, 2001. The Poland Hungary Aid for theReconstruction of the Economy (Phare) programme: Annual programmes1998-2000.
European Commission 1999b. Commission Communication COM (1999)344 on guidance for programmes in the period 2000-06.
European Commission 1999a. COUNCIL REGULATION (EC) No1267/1999 of June 21, 1999 establishing an Instrument for StructuralPolicies for Pre-accession; L 161/73. Official Journal of the EuropeanCommunities. June 26, 1999.
European Commission 2000a. Phare 2000 Review: StrengtheningPreparations for Membership.
European Commission 2000b. CARDS — support programme for Kosovo.
European Commission 2001a. CARDS Assistance Programme to theWestern Balkans. Regional and Country Strategy Papers 2002-2006.
European Commission 2001b. Report from the Commission Annual Reportof the ISPA, 2000.
European Commission 2001c. Annual Report of the Instrument forStructural Policy For Pre-Accession, 2000.
European Commission 2001d. CARDS Programme. Country Strategy Paper2002-2006, European Commission November 2001, and Stabilisation andAssociation Report.
European Commission 2001e. Report on Activities of the EuropeanCommission/World Bank Office for South Eastern Europe, 2001.
European Commission 2001f. Communication from the Commission: TheChallenge of Environmental Financing in the Candidate Countries,COM(2001)304 final.
European Commission 2002a. Towards the Enlarged Union Strategy Paperand Report of the European Commission on the progress towards accessionby each of the candidate countries.
European Commission 2002b. Communication from the Commission to theCouncil and the European Parliament, Roadmaps for Bulgaria and Romania.
European Commission 2002c. Report from the Commission: TheStabilisation and Association Process for South Eastern Europe First AnnualReport.
European Commission 2002d. Statement by Catherine Day, DirectorGeneral for Environment during the Conference on the use of EU pre-acces-sion funds and their environmental and social implications. Billions forSustainability? Lessons learned from the use of pre-accession funds.
European Commission 2002e. Special Accession Programme forAgricultural and Rural Development (SAPARD) Annual Report — Year2001, Report from the Commission to the European Parliament, theCouncil, the Economic and Social Committee and the Committee of theRegions.
E N V I R O N M E N TA L F I N A N C I N G I N C E N T R A L A N D E A S T E R N E U R O P E 93
References
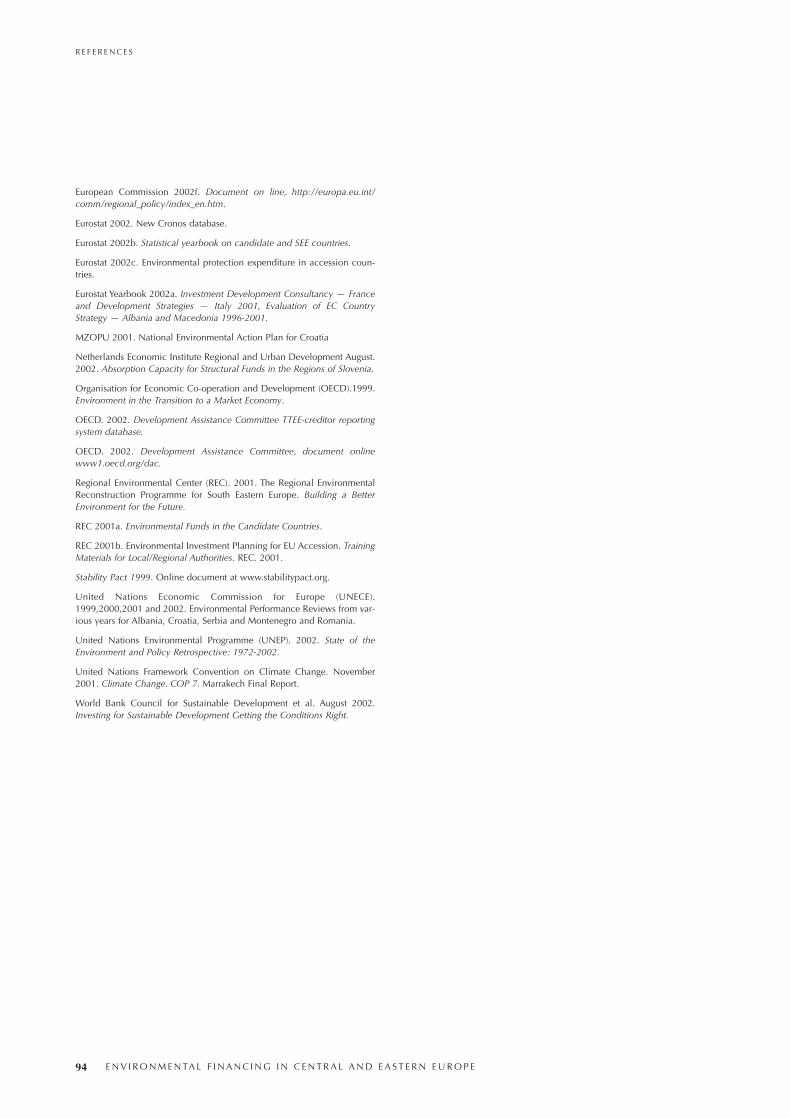
European Commission 2002f. Document on line, http://europa.eu.int/comm/regional_policy/index_en.htm.
Eurostat 2002. New Cronos database.
Eurostat 2002b. Statistical yearbook on candidate and SEE countries.
Eurostat 2002c. Environmental protection expenditure in accession coun-tries.
Eurostat Yearbook 2002a. Investment Development Consultancy — Franceand Development Strategies — Italy 2001, Evaluation of EC CountryStrategy — Albania and Macedonia 1996-2001.
MZOPU 2001. National Environmental Action Plan for Croatia
Netherlands Economic Institute Regional and Urban Development August.2002. Absorption Capacity for Structural Funds in the Regions of Slovenia.
Organisation for Economic Co-operation and Development (OECD).1999.Environment in the Transition to a Market Economy.
OECD. 2002. Development Assistance Committee TTEE-creditor reportingsystem database.
OECD. 2002. Development Assistance Committee, document onlinewww1.oecd.org/dac.
Regional Environmental Center (REC). 2001. The Regional EnvironmentalReconstruction Programme for South Eastern Europe. Building a BetterEnvironment for the Future.
REC 2001a. Environmental Funds in the Candidate Countries.
REC 2001b. Environmental Investment Planning for EU Accession. TrainingMaterials for Local/Regional Authorities. REC. 2001.
Stability Pact 1999. Online document at www.stabilitypact.org.
United Nations Economic Commission for Europe (UNECE).1999,2000,2001 and 2002. Environmental Performance Reviews from var-ious years for Albania, Croatia, Serbia and Montenegro and Romania.
United Nations Environmental Programme (UNEP). 2002. State of theEnvironment and Policy Retrospective: 1972-2002.
United Nations Framework Convention on Climate Change. November2001. Climate Change. COP 7. Marrakech Final Report.
World Bank Council for Sustainable Development et al. August 2002.Investing for Sustainable Development Getting the Conditions Right.
R E F E R E N C E S
94 E N V I R O N M E N TA L F I N A N C I N G I N C E N T R A L A N D E A S T E R N E U R O P E
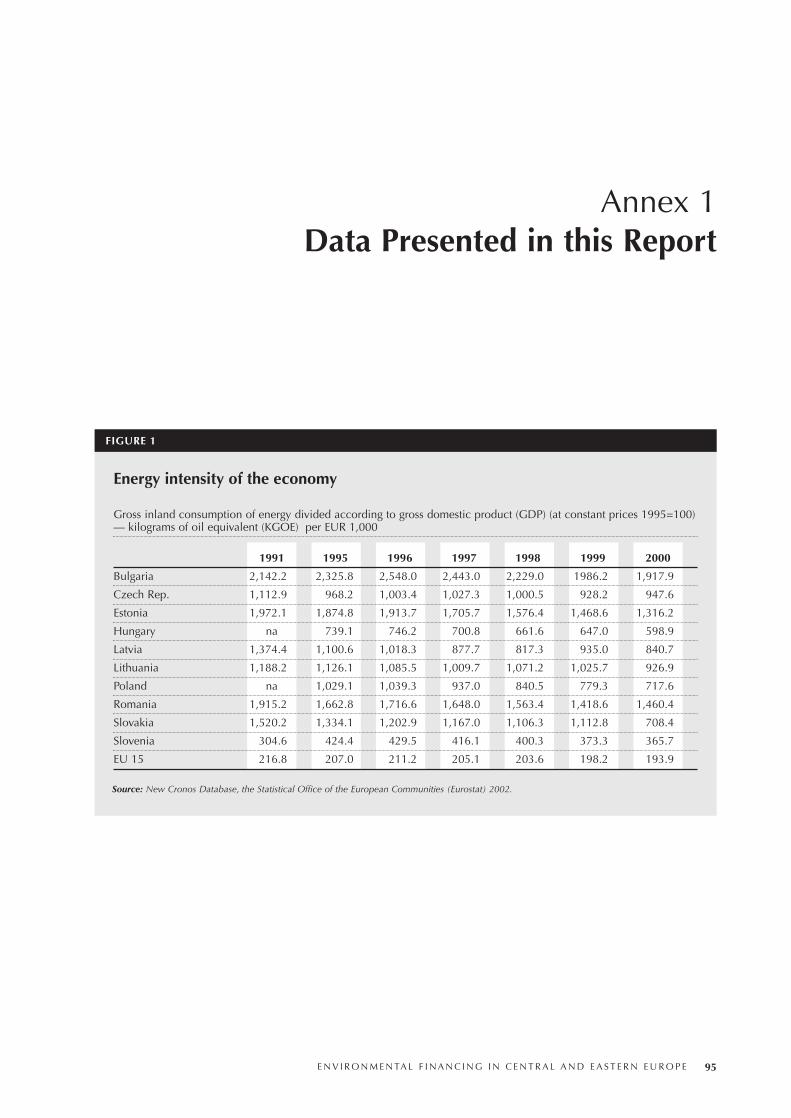
E N V I R O N M E N TA L F I N A N C I N G I N C E N T R A L A N D E A S T E R N E U R O P E 95
Annex 1Data Presented in this Report
Energy intensity of the economy
Gross inland consumption of energy divided according to gross domestic product (GDP) (at constant prices 1995=100)— kilograms of oil equivalent (KGOE) per EUR 1,000
1991 1995 1996 1997 1998 1999 2000
Bulgaria 2,142.2 2,325.8 2,548.0 2,443.0 2,229.0 1986.2 1,917.9
Czech Rep. 1,112.9 968.2 1,003.4 1,027.3 1,000.5 928.2 947.6
Estonia 1,972.1 1,874.8 1,913.7 1,705.7 1,576.4 1,468.6 1,316.2
Hungary na 739.1 746.2 700.8 661.6 647.0 598.9
Latvia 1,374.4 1,100.6 1,018.3 877.7 817.3 935.0 840.7
Lithuania 1,188.2 1,126.1 1,085.5 1,009.7 1,071.2 1,025.7 926.9
Poland na 1,029.1 1,039.3 937.0 840.5 779.3 717.6
Romania 1,915.2 1,662.8 1,716.6 1,648.0 1,563.4 1,418.6 1,460.4
Slovakia 1,520.2 1,334.1 1,202.9 1,167.0 1,106.3 1,112.8 708.4
Slovenia 304.6 424.4 429.5 416.1 400.3 373.3 365.7
EU 15 216.8 207.0 211.2 205.1 203.6 198.2 193.9
FIGURE 1
Source: New Cronos Database, the Statistical Office of the European Communities (Eurostat) 2002.
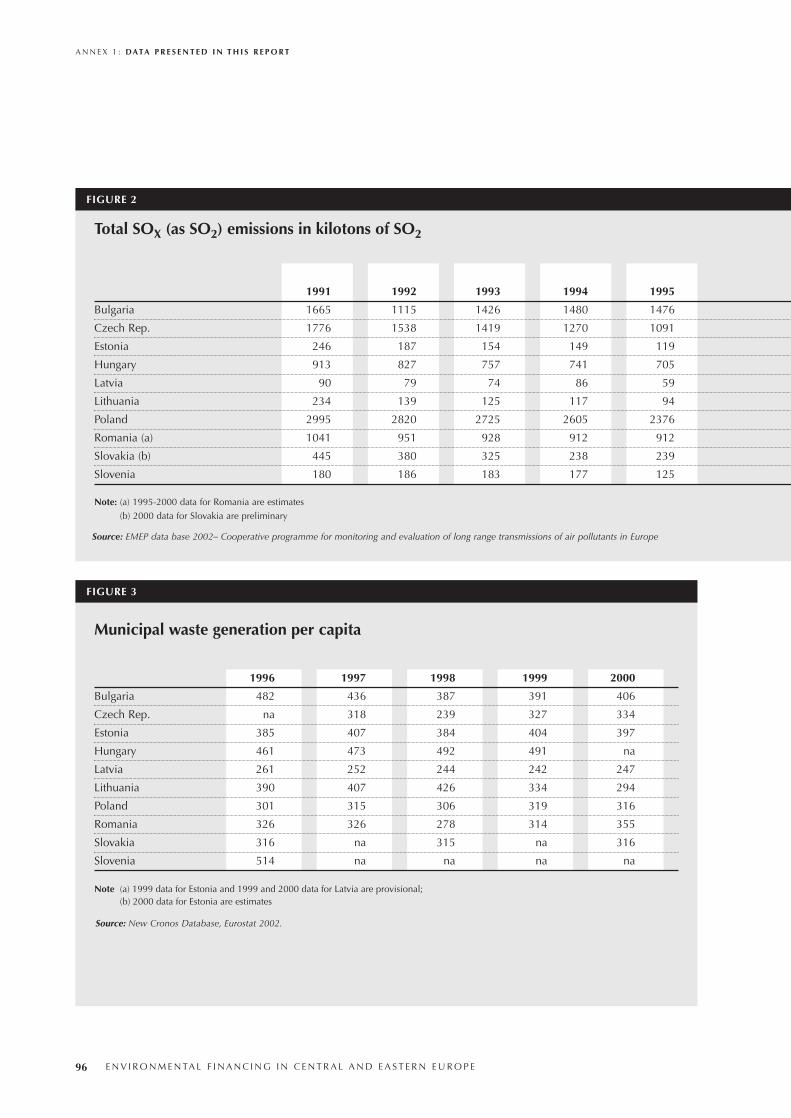
A N N E X 1 : DATA P R E S E N T E D I N T H I S R E P O R T
96 E N V I R O N M E N TA L F I N A N C I N G I N C E N T R A L A N D E A S T E R N E U R O P E
1991 1992 1993 1994 1995
Bulgaria 1665 1115 1426 1480 1476
Czech Rep. 1776 1538 1419 1270 1091
Estonia 246 187 154 149 119
Hungary 913 827 757 741 705
Latvia 90 79 74 86 59
Lithuania 234 139 125 117 94
Poland 2995 2820 2725 2605 2376
Romania (a) 1041 951 928 912 912
Slovakia (b) 445 380 325 238 239
Slovenia 180 186 183 177 125
Note: (a) 1995-2000 data for Romania are estimates
(b) 2000 data for Slovakia are preliminary
Municipal waste generation per capita
1996 1997 1998 1999 2000
Bulgaria 482 436 387 391 406
Czech Rep. na 318 239 327 334
Estonia 385 407 384 404 397
Hungary 461 473 492 491 na
Latvia 261 252 244 242 247
Lithuania 390 407 426 334 294
Poland 301 315 306 319 316
Romania 326 326 278 314 355
Slovakia 316 na 315 na 316
Slovenia 514 na na na na
Note (a) 1999 data for Estonia and 1999 and 2000 data for Latvia are provisional; (b) 2000 data for Estonia are estimates
FIGURE 2
FIGURE 3
Total SOX (as SO2) emissions in kilotons of SO2
Source: EMEP data base 2002– Cooperative programme for monitoring and evaluation of long range transmissions of air pollutants in Europe
Source: New Cronos Database, Eurostat 2002.
A N N E X 1 : DATA P R E S E N T E D I N T H I S R E P O R T
E N V I R O N M E N TA L F I N A N C I N G I N C E N T R A L A N D E A S T E R N E U R O P E 97
1991-2000 1995-2000
1996 1997 1998 1999 2000 % change % change
1420 1365 1251 943 982 41.0 33.5
946 701 443 269 265 85.1 75.7
125 119 110 103 95 61.1 19.4
673 659 592 590 485 46.8 31.2
59 44 40 31 18 80.0 69.4
93 77 94 70 43 81.6 54.1
2368 2181 1897 1719 1511 49.5 36.4
912 912 912 912 912 12.4 0.0
227 202 179 171 120 73.0 49.8
112 118 123 104 96 46.7 23.2
EUR millions
Bulgaria 200
Czech Rep. 1097
Estonia 68
Hungary 548
Lithuania 133
Latvia 40
Poland 1539
Romania 510
Slovakia 231
Slovenia 126
Note: The Czech Republic: total investment, specialised producers’ current expenditureHungary: 1998 public and industry investment and specialised producers’ current expenditure Poland: investment
Total environmental expenditure, in EUR millions, 2000
FIGURE 4
Source: Eurostat 2002c
Investments Current
Slovenia 0.77 0.23
Estonia 0.68 0.32
Bulgaria 0.46 0.55
Lithuania 0.40 0.60
Slovakia 0.35 0.65
Romania 0.35 0.65
Latvia 0.28 0.73
Source: Eurostat 2002c
Share of investment and currentexpenditure in 2000 in selected countries as a percentageof total expenditure
FIGURE 5
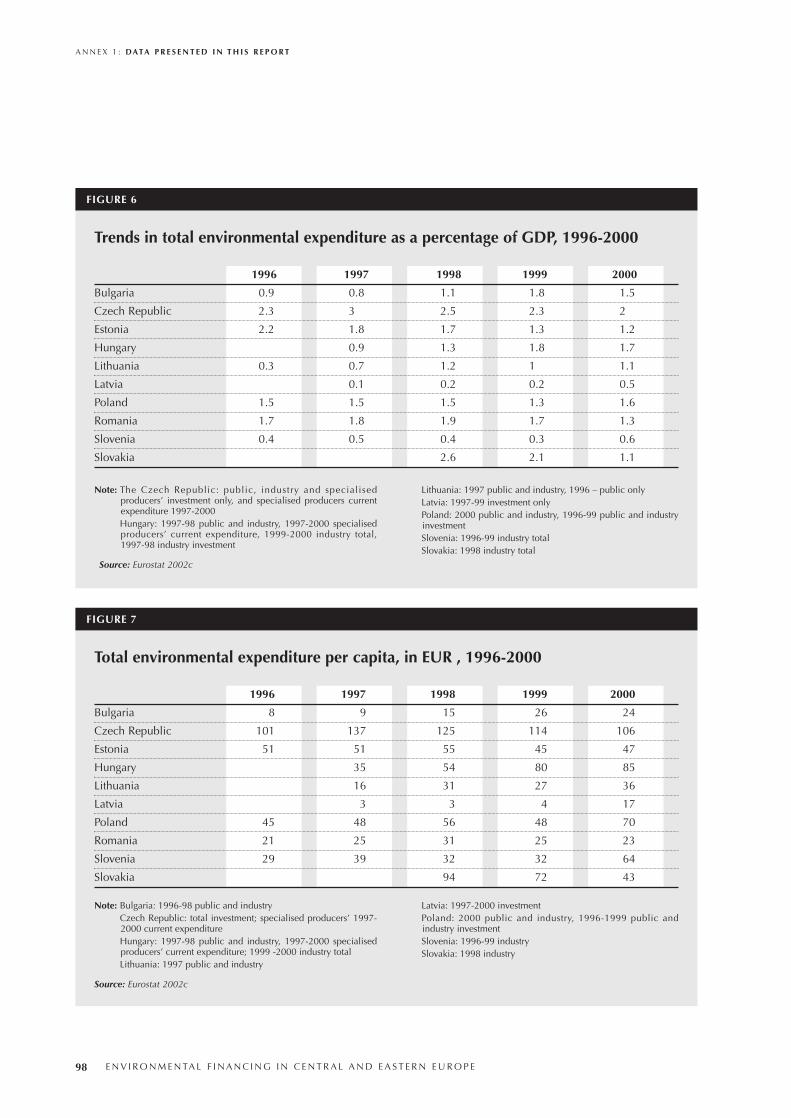
A N N E X 1 : DATA P R E S E N T E D I N T H I S R E P O R T
98 E N V I R O N M E N TA L F I N A N C I N G I N C E N T R A L A N D E A S T E R N E U R O P E
1996 1997 1998 1999 2000
Bulgaria 0.9 0.8 1.1 1.8 1.5
Czech Republic 2.3 3 2.5 2.3 2
Estonia 2.2 1.8 1.7 1.3 1.2
Hungary 0.9 1.3 1.8 1.7
Lithuania 0.3 0.7 1.2 1 1.1
Latvia 0.1 0.2 0.2 0.5
Poland 1.5 1.5 1.5 1.3 1.6
Romania 1.7 1.8 1.9 1.7 1.3
Slovenia 0.4 0.5 0.4 0.3 0.6
Slovakia 2.6 2.1 1.1
Note: The Czech Republic: public, industry and specialisedproducers’ investment only, and specialised producers currentexpenditure 1997-2000Hungary: 1997-98 public and industry, 1997-2000 specialisedproducers’ current expenditure, 1999-2000 industry total,1997-98 industry investment
Lithuania: 1997 public and industry, 1996 – public onlyLatvia: 1997-99 investment onlyPoland: 2000 public and industry, 1996-99 public and industryinvestmentSlovenia: 1996-99 industry totalSlovakia: 1998 industry total
1996 1997 1998 1999 2000
Bulgaria 8 9 15 26 24
Czech Republic 101 137 125 114 106
Estonia 51 51 55 45 47
Hungary 35 54 80 85
Lithuania 16 31 27 36
Latvia 3 3 4 17
Poland 45 48 56 48 70
Romania 21 25 31 25 23
Slovenia 29 39 32 32 64
Slovakia 94 72 43
Note: Bulgaria: 1996-98 public and industryCzech Republic: total investment; specialised producers’ 1997-2000 current expenditureHungary: 1997-98 public and industry, 1997-2000 specialisedproducers’ current expenditure; 1999 -2000 industry totalLithuania: 1997 public and industry
Latvia: 1997-2000 investmentPoland: 2000 public and industry, 1996-1999 public andindustry investment Slovenia: 1996-99 industrySlovakia: 1998 industry
Total environmental expenditure per capita, in EUR , 1996-2000
FIGURE 7
Trends in total environmental expenditure as a percentage of GDP, 1996-2000
FIGURE 6
Source: Eurostat 2002c
Source: Eurostat 2002c
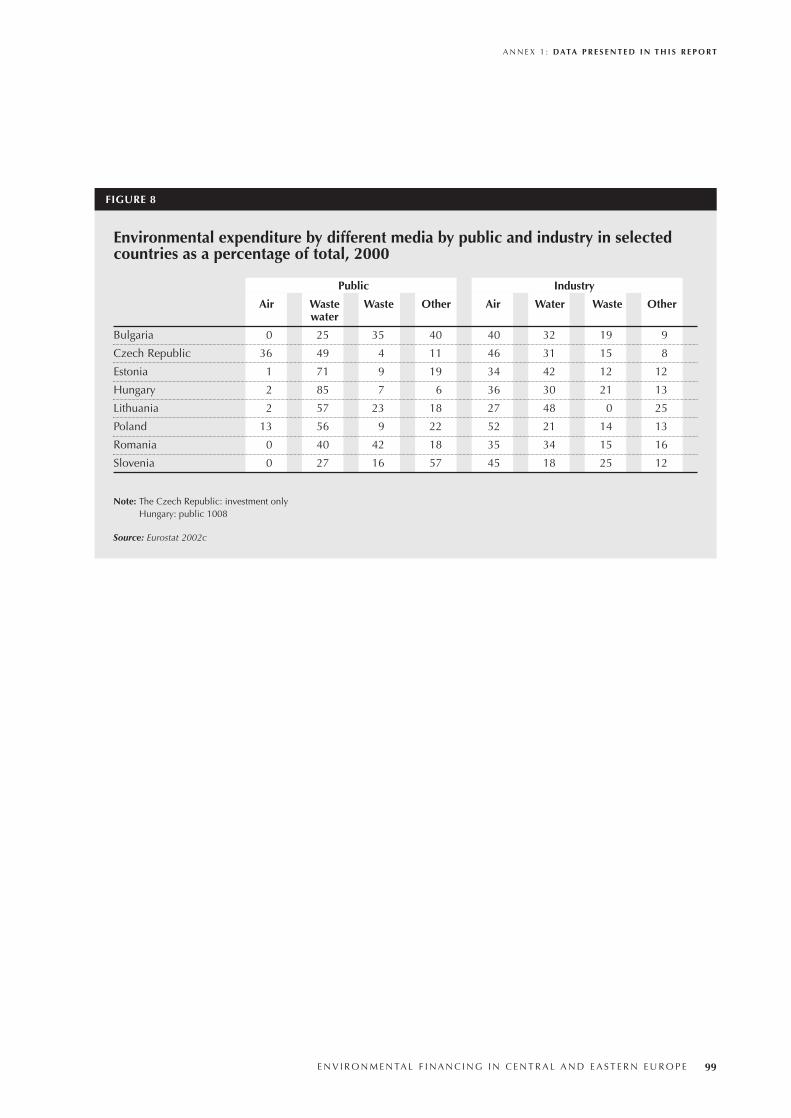
A N N E X 1 : DATA P R E S E N T E D I N T H I S R E P O R T
E N V I R O N M E N TA L F I N A N C I N G I N C E N T R A L A N D E A S T E R N E U R O P E 99
Public Industry
Air Waste Waste Other Air Water Waste Otherwater
Bulgaria 0 25 35 40 40 32 19 9
Czech Republic 36 49 4 11 46 31 15 8
Estonia 1 71 9 19 34 42 12 12
Hungary 2 85 7 6 36 30 21 13
Lithuania 2 57 23 18 27 48 0 25
Poland 13 56 9 22 52 21 14 13
Romania 0 40 42 18 35 34 15 16
Slovenia 0 27 16 57 45 18 25 12
Note: The Czech Republic: investment onlyHungary: public 1008
Environmental expenditure by different media by public and industry in selectedcountries as a percentage of total, 2000
FIGURE 8
Source: Eurostat 2002c
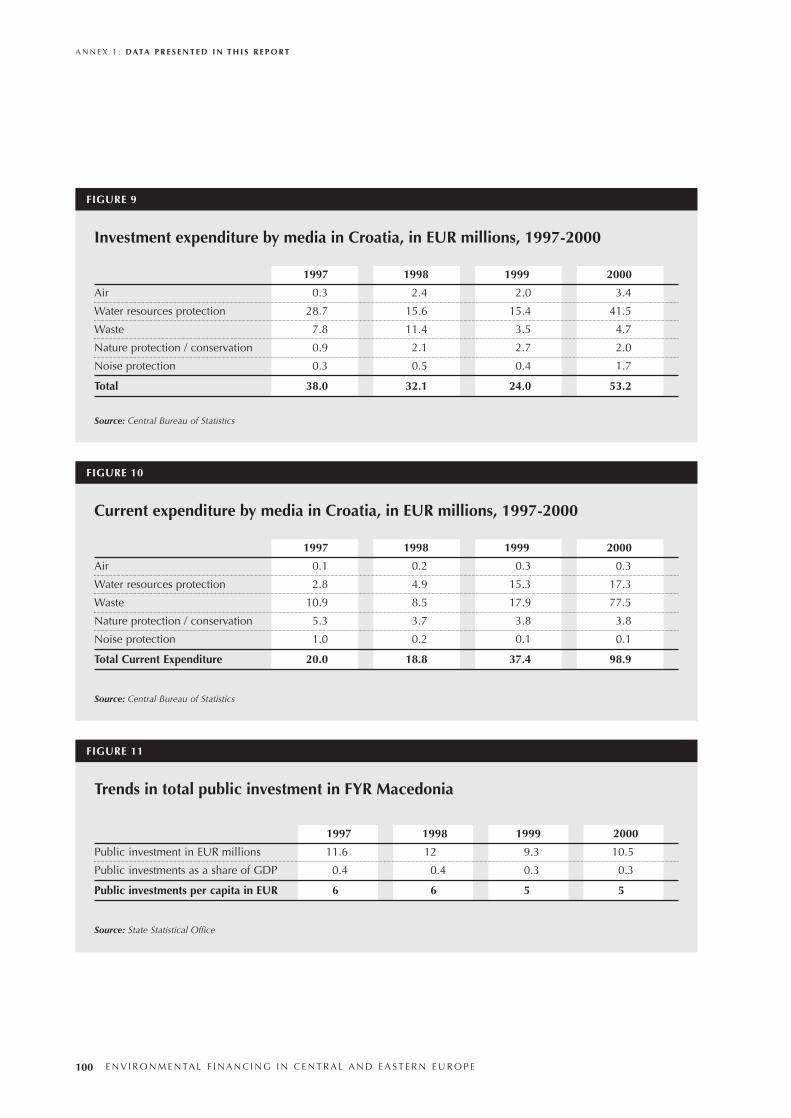
A N N E X 1 : DATA P R E S E N T E D I N T H I S R E P O R T
100 E N V I R O N M E N TA L F I N A N C I N G I N C E N T R A L A N D E A S T E R N E U R O P E
1997 1998 1999 2000
Air 0.3 2.4 2.0 3.4
Water resources protection 28.7 15.6 15.4 41.5
Waste 7.8 11.4 3.5 4.7
Nature protection / conservation 0.9 2.1 2.7 2.0
Noise protection 0.3 0.5 0.4 1.7
Total 38.0 32.1 24.0 53.2
Source: Central Bureau of Statistics
Investment expenditure by media in Croatia, in EUR millions, 1997-2000
FIGURE 9
1997 1998 1999 2000
Air 0.1 0.2 0.3 0.3
Water resources protection 2.8 4.9 15.3 17.3
Waste 10.9 8.5 17.9 77.5
Nature protection / conservation 5.3 3.7 3.8 3.8
Noise protection 1.0 0.2 0.1 0.1
Total Current Expenditure 20.0 18.8 37.4 98.9
Source: Central Bureau of Statistics
Current expenditure by media in Croatia, in EUR millions, 1997-2000
FIGURE 10
1997 1998 1999 2000
Public investment in EUR millions 11.6 12 9.3 10.5
Public investments as a share of GDP 0.4 0.4 0.3 0.3
Public investments per capita in EUR 6 6 5 5
Source: State Statistical Office
Trends in total public investment in FYR Macedonia
FIGURE 11
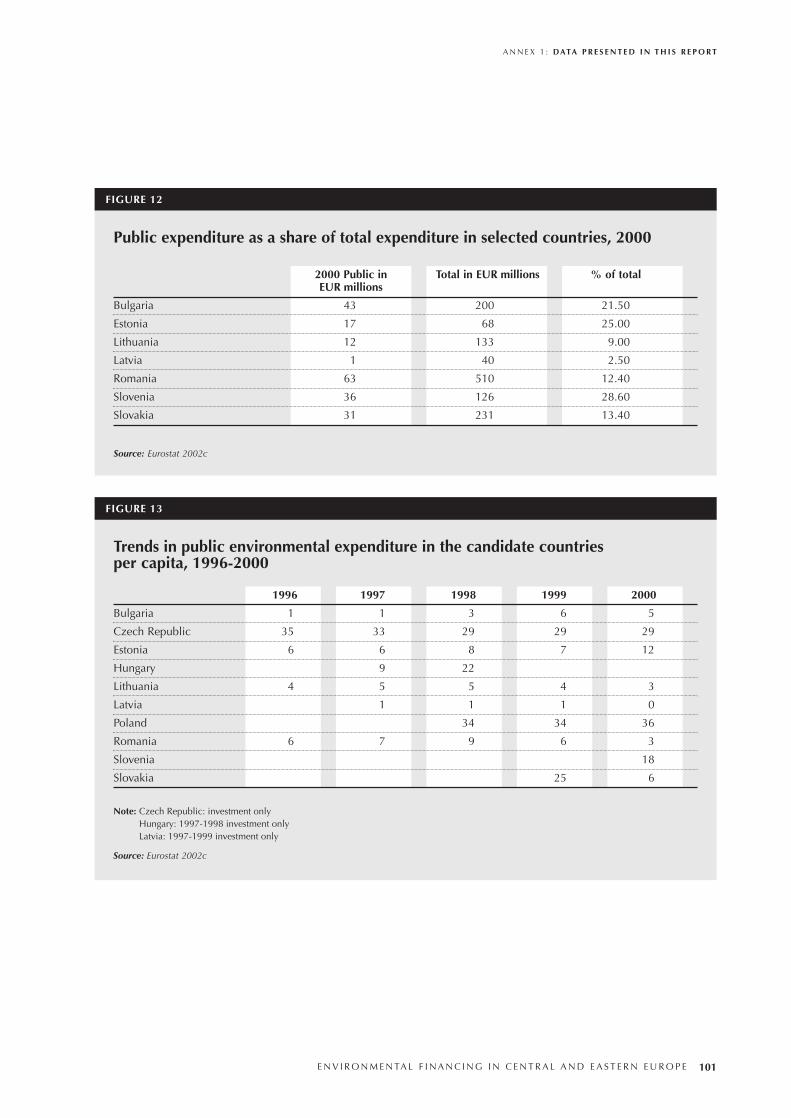
A N N E X 1 : DATA P R E S E N T E D I N T H I S R E P O R T
E N V I R O N M E N TA L F I N A N C I N G I N C E N T R A L A N D E A S T E R N E U R O P E 101
2000 Public in Total in EUR millions % of totalEUR millions
Bulgaria 43 200 21.50
Estonia 17 68 25.00
Lithuania 12 133 9.00
Latvia 1 40 2.50
Romania 63 510 12.40
Slovenia 36 126 28.60
Slovakia 31 231 13.40
Source: Eurostat 2002c
Public expenditure as a share of total expenditure in selected countries, 2000
FIGURE 12
1996 1997 1998 1999 2000
Bulgaria 1 1 3 6 5
Czech Republic 35 33 29 29 29
Estonia 6 6 8 7 12
Hungary 9 22
Lithuania 4 5 5 4 3
Latvia 1 1 1 0
Poland 34 34 36
Romania 6 7 9 6 3
Slovenia 18
Slovakia 25 6
Note: Czech Republic: investment onlyHungary: 1997-1998 investment onlyLatvia: 1997-1999 investment only
Trends in public environmental expenditure in the candidate countries per capita, 1996-2000
FIGURE 13
Source: Eurostat 2002c
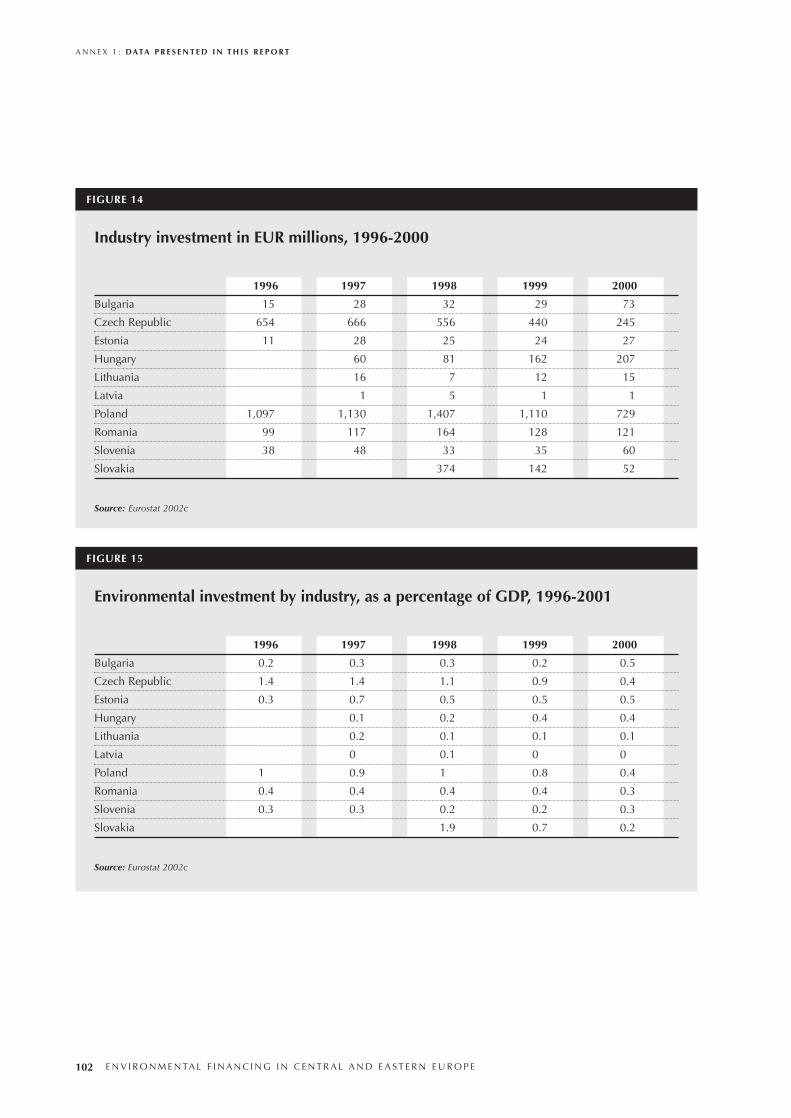
A N N E X 1 : DATA P R E S E N T E D I N T H I S R E P O R T
102 E N V I R O N M E N TA L F I N A N C I N G I N C E N T R A L A N D E A S T E R N E U R O P E
1996 1997 1998 1999 2000
Bulgaria 15 28 32 29 73
Czech Republic 654 666 556 440 245
Estonia 11 28 25 24 27
Hungary 60 81 162 207
Lithuania 16 7 12 15
Latvia 1 5 1 1
Poland 1,097 1,130 1,407 1,110 729
Romania 99 117 164 128 121
Slovenia 38 48 33 35 60
Slovakia 374 142 52
Source: Eurostat 2002c
Industry investment in EUR millions, 1996-2000
FIGURE 14
1996 1997 1998 1999 2000
Bulgaria 0.2 0.3 0.3 0.2 0.5
Czech Republic 1.4 1.4 1.1 0.9 0.4
Estonia 0.3 0.7 0.5 0.5 0.5
Hungary 0.1 0.2 0.4 0.4
Lithuania 0.2 0.1 0.1 0.1
Latvia 0 0.1 0 0
Poland 1 0.9 1 0.8 0.4
Romania 0.4 0.4 0.4 0.4 0.3
Slovenia 0.3 0.3 0.2 0.2 0.3
Slovakia 1.9 0.7 0.2
Source: Eurostat 2002c
Environmental investment by industry, as a percentage of GDP, 1996-2001
FIGURE 15
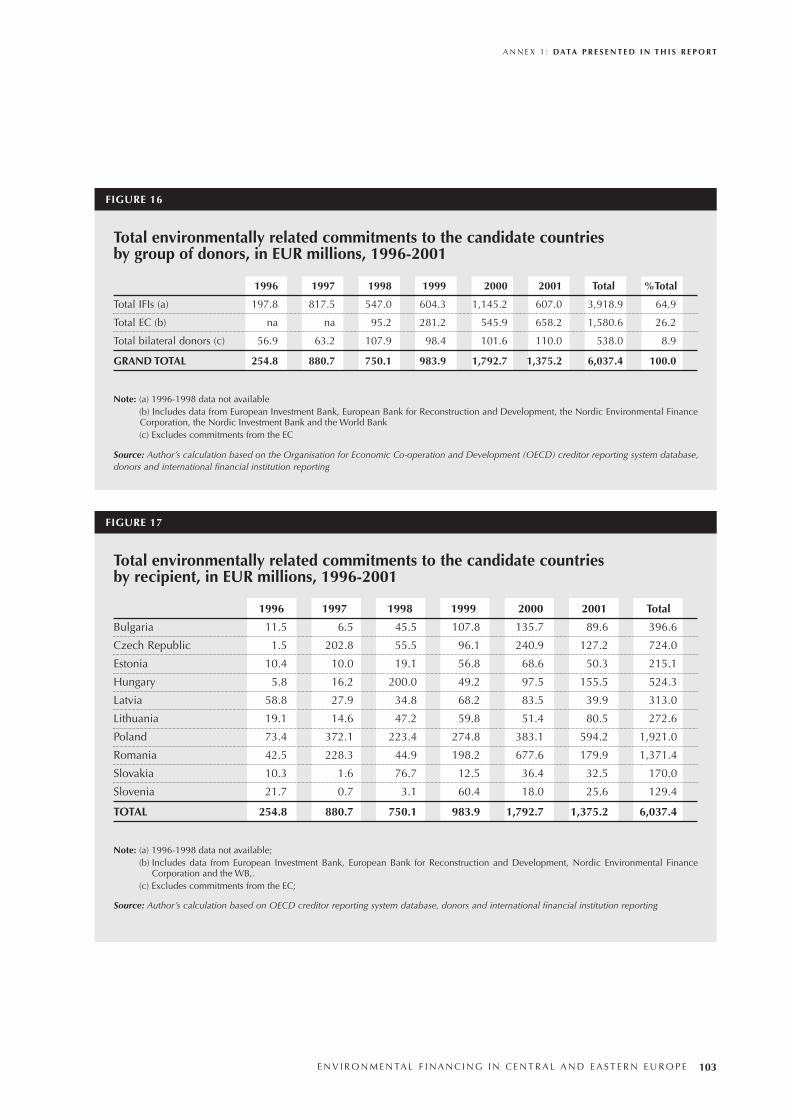
A N N E X 1 : DATA P R E S E N T E D I N T H I S R E P O R T
E N V I R O N M E N TA L F I N A N C I N G I N C E N T R A L A N D E A S T E R N E U R O P E 103
1996 1997 1998 1999 2000 2001 Total %Total
Total IFIs (a) 197.8 817.5 547.0 604.3 1,145.2 607.0 3,918.9 64.9
Total EC (b) na na 95.2 281.2 545.9 658.2 1,580.6 26.2
Total bilateral donors (c) 56.9 63.2 107.9 98.4 101.6 110.0 538.0 8.9
GRAND TOTAL 254.8 880.7 750.1 983.9 1,792.7 1,375.2 6,037.4 100.0
Note: (a) 1996-1998 data not available (b) Includes data from European Investment Bank, European Bank for Reconstruction and Development, the Nordic Environmental FinanceCorporation, the Nordic Investment Bank and the World Bank(c) Excludes commitments from the EC
Total environmentally related commitments to the candidate countries by group of donors, in EUR millions, 1996-2001
FIGURE 16
1996 1997 1998 1999 2000 2001 Total
Bulgaria 11.5 6.5 45.5 107.8 135.7 89.6 396.6
Czech Republic 1.5 202.8 55.5 96.1 240.9 127.2 724.0
Estonia 10.4 10.0 19.1 56.8 68.6 50.3 215.1
Hungary 5.8 16.2 200.0 49.2 97.5 155.5 524.3
Latvia 58.8 27.9 34.8 68.2 83.5 39.9 313.0
Lithuania 19.1 14.6 47.2 59.8 51.4 80.5 272.6
Poland 73.4 372.1 223.4 274.8 383.1 594.2 1,921.0
Romania 42.5 228.3 44.9 198.2 677.6 179.9 1,371.4
Slovakia 10.3 1.6 76.7 12.5 36.4 32.5 170.0
Slovenia 21.7 0.7 3.1 60.4 18.0 25.6 129.4
TOTAL 254.8 880.7 750.1 983.9 1,792.7 1,375.2 6,037.4
Note: (a) 1996-1998 data not available; (b) Includes data from European Investment Bank, European Bank for Reconstruction and Development, Nordic Environmental Finance
Corporation and the WB,.(c) Excludes commitments from the EC;
Total environmentally related commitments to the candidate countries by recipient, in EUR millions, 1996-2001
FIGURE 17
Source: Author’s calculation based on the Organisation for Economic Co-operation and Development (OECD) creditor reporting system database,donors and international financial institution reporting
Source: Author’s calculation based on OECD creditor reporting system database, donors and international financial institution reporting
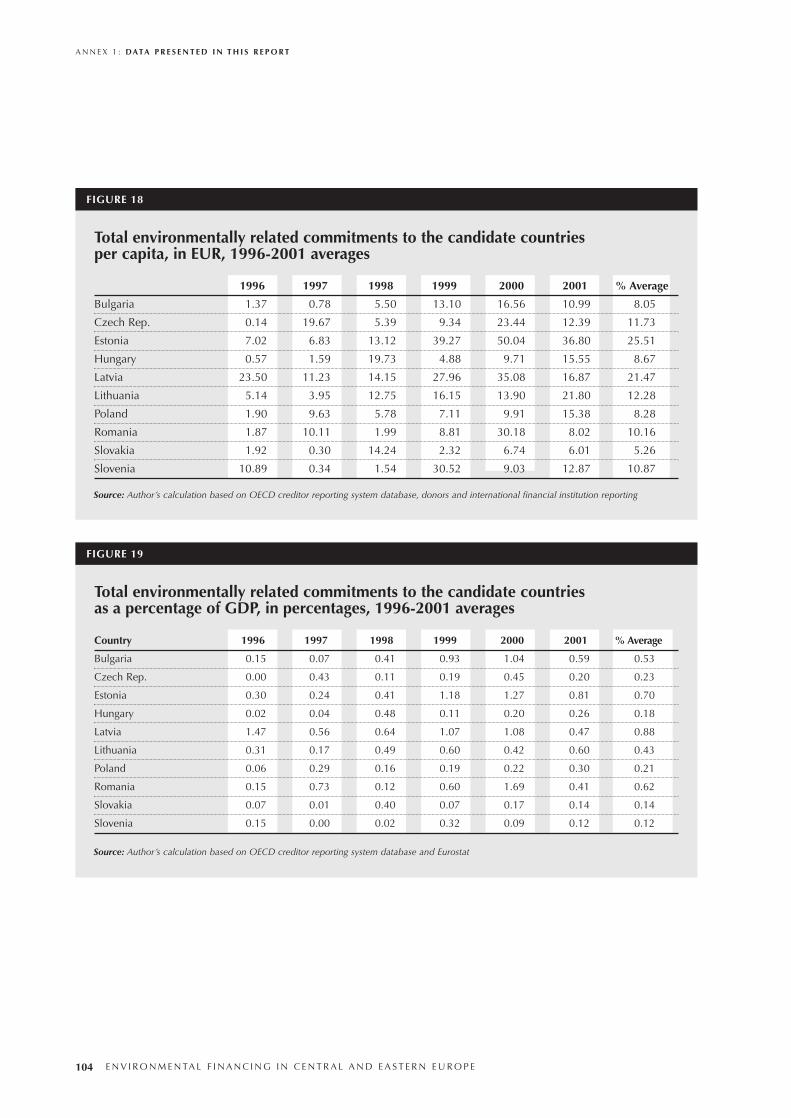
A N N E X 1 : DATA P R E S E N T E D I N T H I S R E P O R T
104 E N V I R O N M E N TA L F I N A N C I N G I N C E N T R A L A N D E A S T E R N E U R O P E
1996 1997 1998 1999 2000 2001 % Average
Bulgaria 1.37 0.78 5.50 13.10 16.56 10.99 8.05
Czech Rep. 0.14 19.67 5.39 9.34 23.44 12.39 11.73
Estonia 7.02 6.83 13.12 39.27 50.04 36.80 25.51
Hungary 0.57 1.59 19.73 4.88 9.71 15.55 8.67
Latvia 23.50 11.23 14.15 27.96 35.08 16.87 21.47
Lithuania 5.14 3.95 12.75 16.15 13.90 21.80 12.28
Poland 1.90 9.63 5.78 7.11 9.91 15.38 8.28
Romania 1.87 10.11 1.99 8.81 30.18 8.02 10.16
Slovakia 1.92 0.30 14.24 2.32 6.74 6.01 5.26
Slovenia 10.89 0.34 1.54 30.52 9.03 12.87 10.87
Total environmentally related commitments to the candidate countries per capita, in EUR, 1996-2001 averages
FIGURE 18
Country 1996 1997 1998 1999 2000 2001 % Average
Bulgaria 0.15 0.07 0.41 0.93 1.04 0.59 0.53
Czech Rep. 0.00 0.43 0.11 0.19 0.45 0.20 0.23
Estonia 0.30 0.24 0.41 1.18 1.27 0.81 0.70
Hungary 0.02 0.04 0.48 0.11 0.20 0.26 0.18
Latvia 1.47 0.56 0.64 1.07 1.08 0.47 0.88
Lithuania 0.31 0.17 0.49 0.60 0.42 0.60 0.43
Poland 0.06 0.29 0.16 0.19 0.22 0.30 0.21
Romania 0.15 0.73 0.12 0.60 1.69 0.41 0.62
Slovakia 0.07 0.01 0.40 0.07 0.17 0.14 0.14
Slovenia 0.15 0.00 0.02 0.32 0.09 0.12 0.12
Total environmentally related commitments to the candidate countries as a percentage of GDP, in percentages, 1996-2001 averages
FIGURE 19
Source: Author’s calculation based on OECD creditor reporting system database, donors and international financial institution reporting
Source: Author’s calculation based on OECD creditor reporting system database and Eurostat
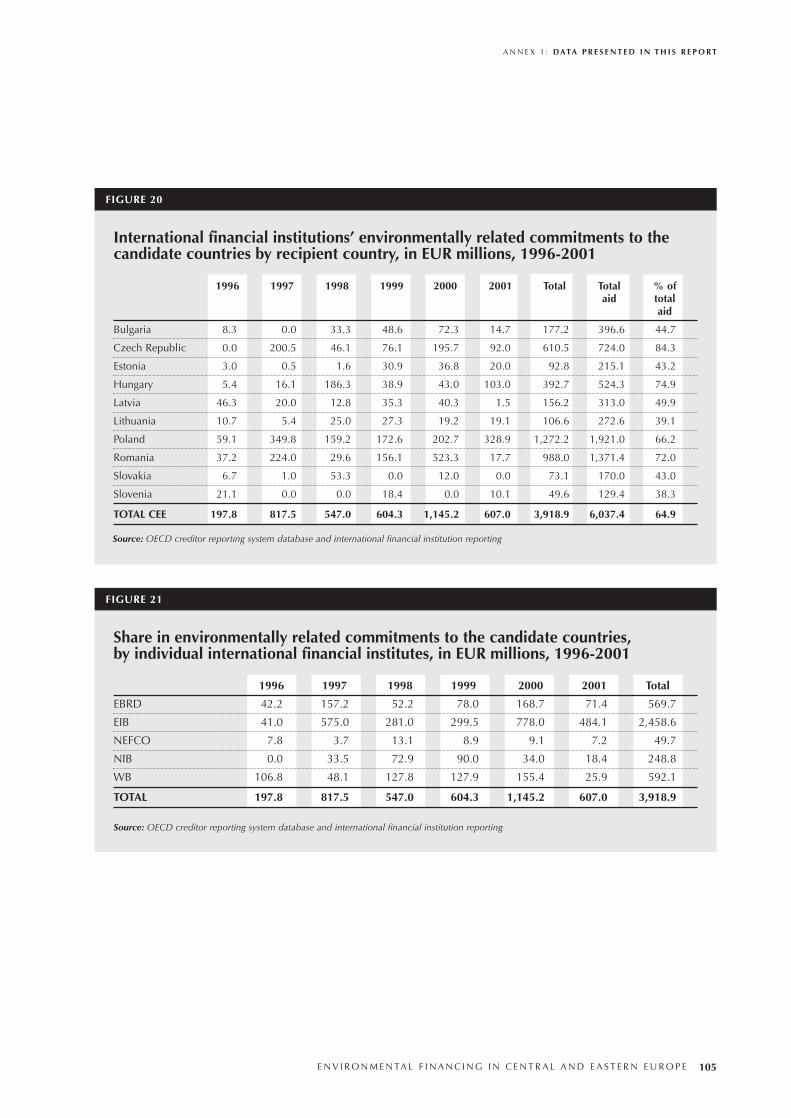
A N N E X 1 : DATA P R E S E N T E D I N T H I S R E P O R T
E N V I R O N M E N TA L F I N A N C I N G I N C E N T R A L A N D E A S T E R N E U R O P E 105
1996 1997 1998 1999 2000 2001 Total
EBRD 42.2 157.2 52.2 78.0 168.7 71.4 569.7
EIB 41.0 575.0 281.0 299.5 778.0 484.1 2,458.6
NEFCO 7.8 3.7 13.1 8.9 9.1 7.2 49.7
NIB 0.0 33.5 72.9 90.0 34.0 18.4 248.8
WB 106.8 48.1 127.8 127.9 155.4 25.9 592.1
TOTAL 197.8 817.5 547.0 604.3 1,145.2 607.0 3,918.9
Share in environmentally related commitments to the candidate countries, by individual international financial institutes, in EUR millions, 1996-2001
FIGURE 21
1996 1997 1998 1999 2000 2001 Total Total % ofaid total
aid
Bulgaria 8.3 0.0 33.3 48.6 72.3 14.7 177.2 396.6 44.7
Czech Republic 0.0 200.5 46.1 76.1 195.7 92.0 610.5 724.0 84.3
Estonia 3.0 0.5 1.6 30.9 36.8 20.0 92.8 215.1 43.2
Hungary 5.4 16.1 186.3 38.9 43.0 103.0 392.7 524.3 74.9
Latvia 46.3 20.0 12.8 35.3 40.3 1.5 156.2 313.0 49.9
Lithuania 10.7 5.4 25.0 27.3 19.2 19.1 106.6 272.6 39.1
Poland 59.1 349.8 159.2 172.6 202.7 328.9 1,272.2 1,921.0 66.2
Romania 37.2 224.0 29.6 156.1 523.3 17.7 988.0 1,371.4 72.0
Slovakia 6.7 1.0 53.3 0.0 12.0 0.0 73.1 170.0 43.0
Slovenia 21.1 0.0 0.0 18.4 0.0 10.1 49.6 129.4 38.3
TOTAL CEE 197.8 817.5 547.0 604.3 1,145.2 607.0 3,918.9 6,037.4 64.9
International financial institutions’ environmentally related commitments to thecandidate countries by recipient country, in EUR millions, 1996-2001
FIGURE 20
Source: OECD creditor reporting system database and international financial institution reporting
Source: OECD creditor reporting system database and international financial institution reporting
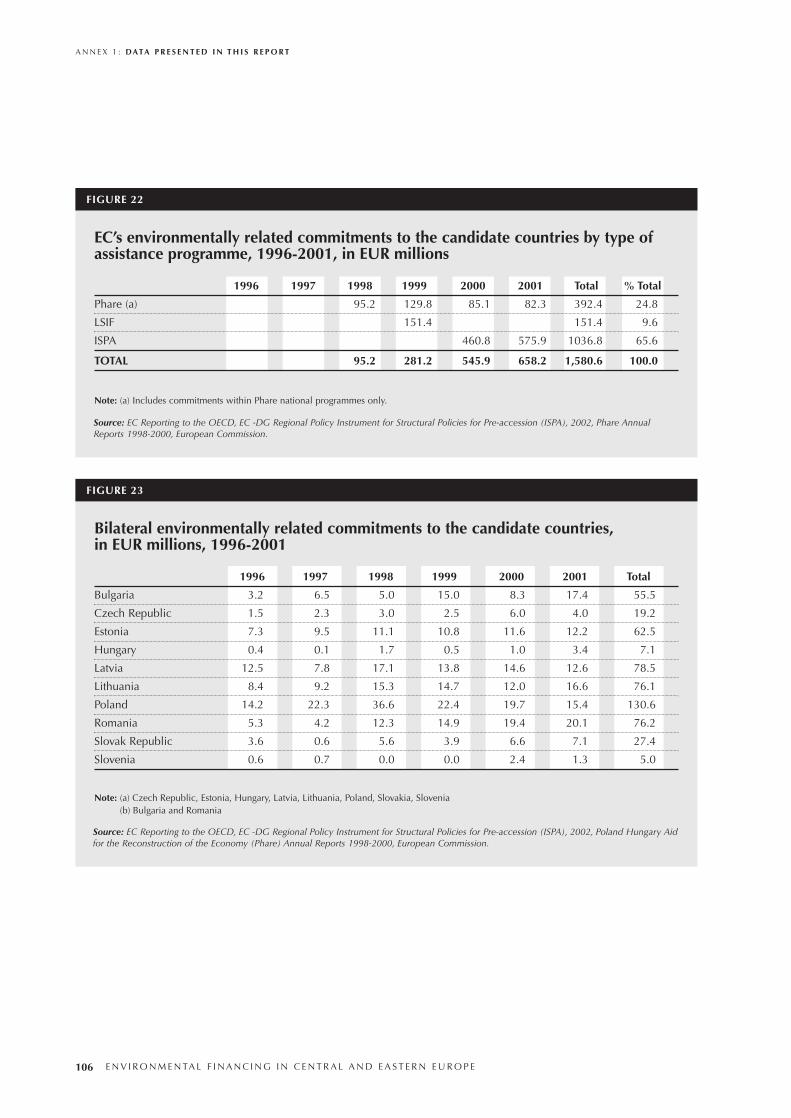
A N N E X 1 : DATA P R E S E N T E D I N T H I S R E P O R T
106 E N V I R O N M E N TA L F I N A N C I N G I N C E N T R A L A N D E A S T E R N E U R O P E
1996 1997 1998 1999 2000 2001 Total % Total
Phare (a) 95.2 129.8 85.1 82.3 392.4 24.8
LSIF 151.4 151.4 9.6
ISPA 460.8 575.9 1036.8 65.6
TOTAL 95.2 281.2 545.9 658.2 1,580.6 100.0
Note: (a) Includes commitments within Phare national programmes only.
EC’s environmentally related commitments to the candidate countries by type ofassistance programme, 1996-2001, in EUR millions
FIGURE 22
1996 1997 1998 1999 2000 2001 Total
Bulgaria 3.2 6.5 5.0 15.0 8.3 17.4 55.5
Czech Republic 1.5 2.3 3.0 2.5 6.0 4.0 19.2
Estonia 7.3 9.5 11.1 10.8 11.6 12.2 62.5
Hungary 0.4 0.1 1.7 0.5 1.0 3.4 7.1
Latvia 12.5 7.8 17.1 13.8 14.6 12.6 78.5
Lithuania 8.4 9.2 15.3 14.7 12.0 16.6 76.1
Poland 14.2 22.3 36.6 22.4 19.7 15.4 130.6
Romania 5.3 4.2 12.3 14.9 19.4 20.1 76.2
Slovak Republic 3.6 0.6 5.6 3.9 6.6 7.1 27.4
Slovenia 0.6 0.7 0.0 0.0 2.4 1.3 5.0
Note: (a) Czech Republic, Estonia, Hungary, Latvia, Lithuania, Poland, Slovakia, Slovenia(b) Bulgaria and Romania
Bilateral environmentally related commitments to the candidate countries, in EUR millions, 1996-2001
FIGURE 23
Source: EC Reporting to the OECD, EC -DG Regional Policy Instrument for Structural Policies for Pre-accession (ISPA), 2002, Phare AnnualReports 1998-2000, European Commission.
Source: EC Reporting to the OECD, EC -DG Regional Policy Instrument for Structural Policies for Pre-accession (ISPA), 2002, Poland Hungary Aidfor the Reconstruction of the Economy (Phare) Annual Reports 1998-2000, European Commission.
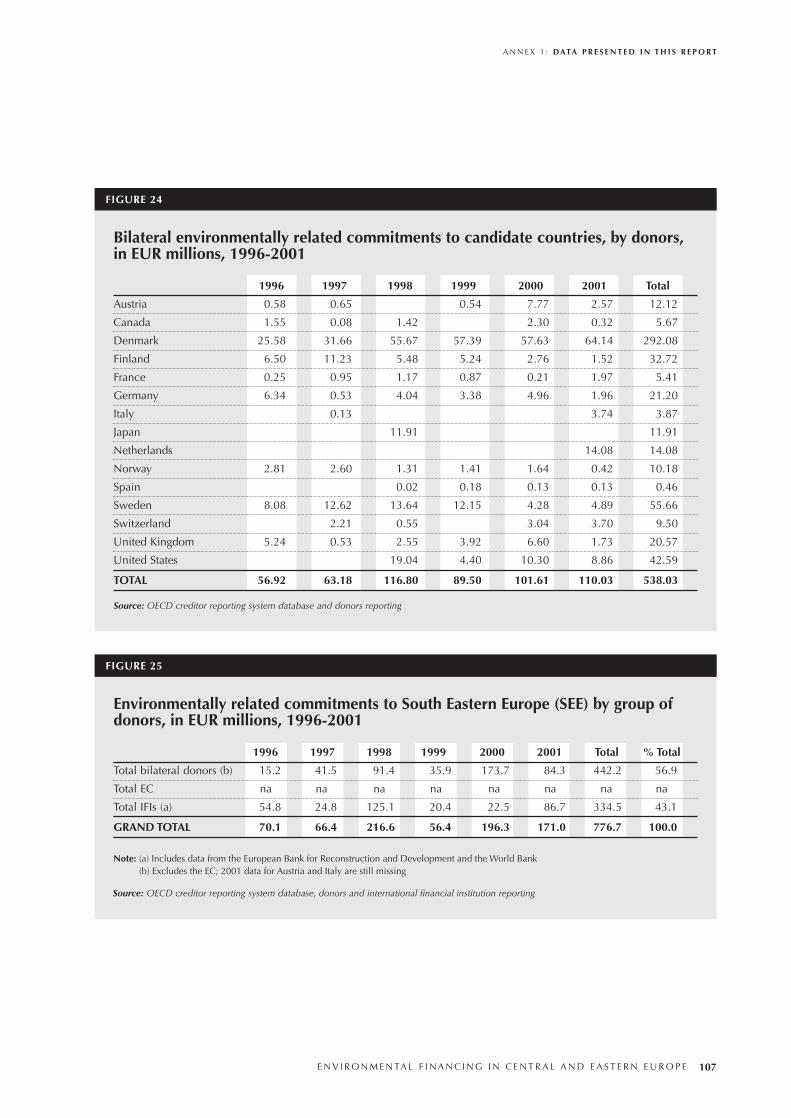
A N N E X 1 : DATA P R E S E N T E D I N T H I S R E P O R T
E N V I R O N M E N TA L F I N A N C I N G I N C E N T R A L A N D E A S T E R N E U R O P E 107
1996 1997 1998 1999 2000 2001 Total
Austria 0.58 0.65 0.54 7.77 2.57 12.12
Canada 1.55 0.08 1.42 2.30 0.32 5.67
Denmark 25.58 31.66 55.67 57.39 57.63 64.14 292.08
Finland 6.50 11.23 5.48 5.24 2.76 1.52 32.72
France 0.25 0.95 1.17 0.87 0.21 1.97 5.41
Germany 6.34 0.53 4.04 3.38 4.96 1.96 21.20
Italy 0.13 3.74 3.87
Japan 11.91 11.91
Netherlands 14.08 14.08
Norway 2.81 2.60 1.31 1.41 1.64 0.42 10.18
Spain 0.02 0.18 0.13 0.13 0.46
Sweden 8.08 12.62 13.64 12.15 4.28 4.89 55.66
Switzerland 2.21 0.55 3.04 3.70 9.50
United Kingdom 5.24 0.53 2.55 3.92 6.60 1.73 20.57
United States 19.04 4.40 10.30 8.86 42.59
TOTAL 56.92 63.18 116.80 89.50 101.61 110.03 538.03
Bilateral environmentally related commitments to candidate countries, by donors, in EUR millions, 1996-2001
FIGURE 24
1996 1997 1998 1999 2000 2001 Total % Total
Total bilateral donors (b) 15.2 41.5 91.4 35.9 173.7 84.3 442.2 56.9
Total EC na na na na na na na na
Total IFIs (a) 54.8 24.8 125.1 20.4 22.5 86.7 334.5 43.1
GRAND TOTAL 70.1 66.4 216.6 56.4 196.3 171.0 776.7 100.0
Note: (a) Includes data from the European Bank for Reconstruction and Development and the World Bank(b) Excludes the EC; 2001 data for Austria and Italy are still missing
Environmentally related commitments to South Eastern Europe (SEE) by group ofdonors, in EUR millions, 1996-2001
FIGURE 25
Source: OECD creditor reporting system database and donors reporting
Source: OECD creditor reporting system database, donors and international financial institution reporting
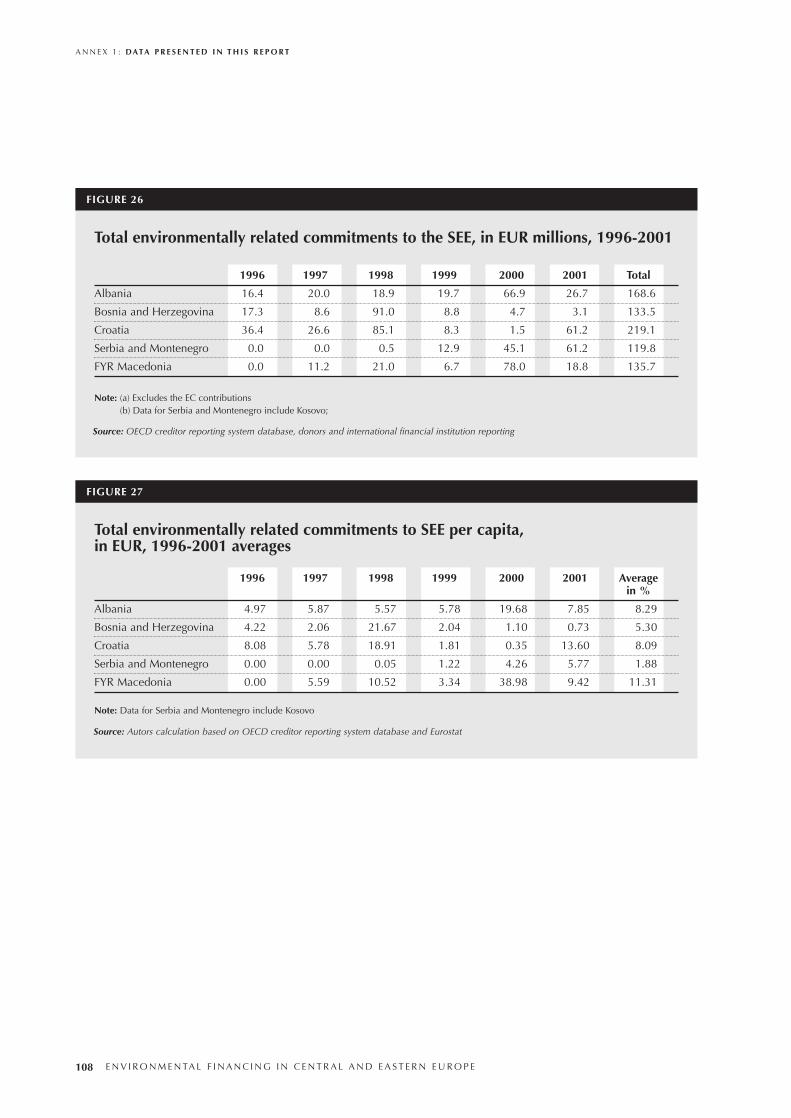
A N N E X 1 : DATA P R E S E N T E D I N T H I S R E P O R T
108 E N V I R O N M E N TA L F I N A N C I N G I N C E N T R A L A N D E A S T E R N E U R O P E
1996 1997 1998 1999 2000 2001 Total
Albania 16.4 20.0 18.9 19.7 66.9 26.7 168.6
Bosnia and Herzegovina 17.3 8.6 91.0 8.8 4.7 3.1 133.5
Croatia 36.4 26.6 85.1 8.3 1.5 61.2 219.1
Serbia and Montenegro 0.0 0.0 0.5 12.9 45.1 61.2 119.8
FYR Macedonia 0.0 11.2 21.0 6.7 78.0 18.8 135.7
Note: (a) Excludes the EC contributions (b) Data for Serbia and Montenegro include Kosovo;
Total environmentally related commitments to the SEE, in EUR millions, 1996-2001
FIGURE 26
1996 1997 1998 1999 2000 2001 Average in %
Albania 4.97 5.87 5.57 5.78 19.68 7.85 8.29
Bosnia and Herzegovina 4.22 2.06 21.67 2.04 1.10 0.73 5.30
Croatia 8.08 5.78 18.91 1.81 0.35 13.60 8.09
Serbia and Montenegro 0.00 0.00 0.05 1.22 4.26 5.77 1.88
FYR Macedonia 0.00 5.59 10.52 3.34 38.98 9.42 11.31
Note: Data for Serbia and Montenegro include Kosovo
Total environmentally related commitments to SEE per capita, in EUR, 1996-2001 averages
FIGURE 27
Source: OECD creditor reporting system database, donors and international financial institution reporting
Source: Autors calculation based on OECD creditor reporting system database and Eurostat
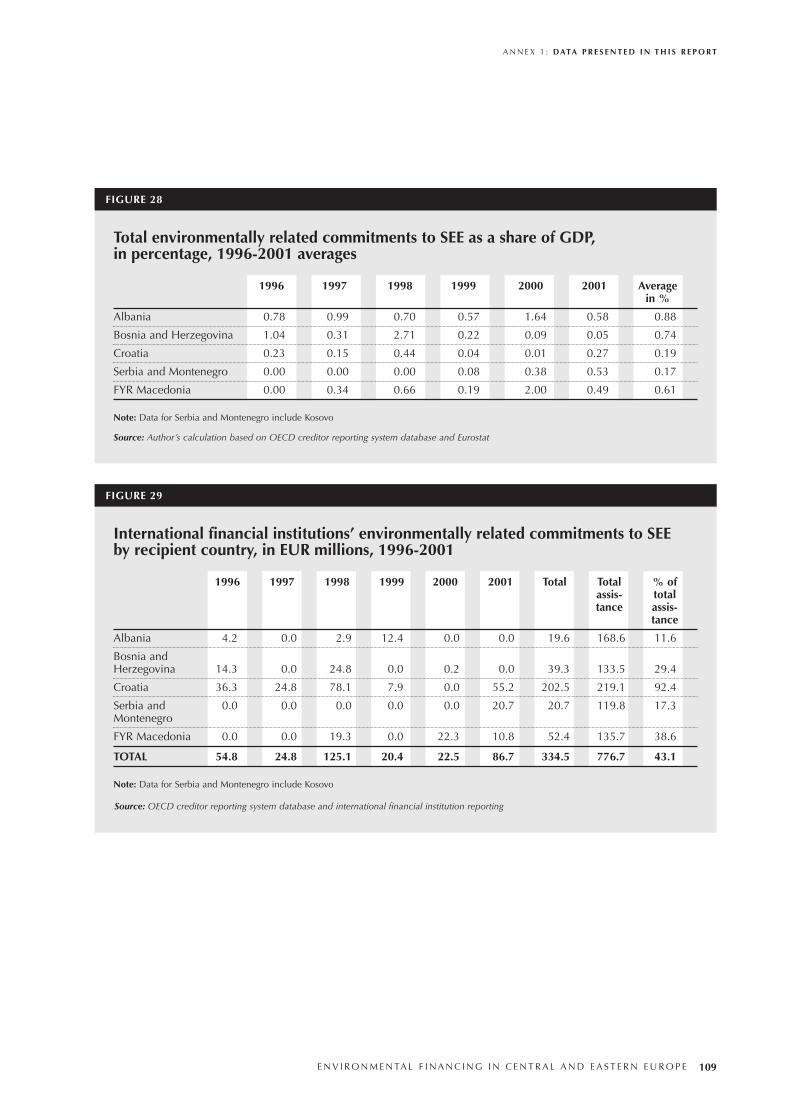
A N N E X 1 : DATA P R E S E N T E D I N T H I S R E P O R T
E N V I R O N M E N TA L F I N A N C I N G I N C E N T R A L A N D E A S T E R N E U R O P E 109
1996 1997 1998 1999 2000 2001 Average in %
Albania 0.78 0.99 0.70 0.57 1.64 0.58 0.88
Bosnia and Herzegovina 1.04 0.31 2.71 0.22 0.09 0.05 0.74
Croatia 0.23 0.15 0.44 0.04 0.01 0.27 0.19
Serbia and Montenegro 0.00 0.00 0.00 0.08 0.38 0.53 0.17
FYR Macedonia 0.00 0.34 0.66 0.19 2.00 0.49 0.61
Note: Data for Serbia and Montenegro include Kosovo
Total environmentally related commitments to SEE as a share of GDP, in percentage, 1996-2001 averages
FIGURE 28
1996 1997 1998 1999 2000 2001 Total Total % ofassis- totaltance assis-
tance
Albania 4.2 0.0 2.9 12.4 0.0 0.0 19.6 168.6 11.6
Bosnia and Herzegovina 14.3 0.0 24.8 0.0 0.2 0.0 39.3 133.5 29.4
Croatia 36.3 24.8 78.1 7.9 0.0 55.2 202.5 219.1 92.4
Serbia and 0.0 0.0 0.0 0.0 0.0 20.7 20.7 119.8 17.3Montenegro
FYR Macedonia 0.0 0.0 19.3 0.0 22.3 10.8 52.4 135.7 38.6
TOTAL 54.8 24.8 125.1 20.4 22.5 86.7 334.5 776.7 43.1
Note: Data for Serbia and Montenegro include Kosovo
International financial institutions’ environmentally related commitments to SEE by recipient country, in EUR millions, 1996-2001
FIGURE 29
Source: Author’s calculation based on OECD creditor reporting system database and Eurostat
Source: OECD creditor reporting system database and international financial institution reporting
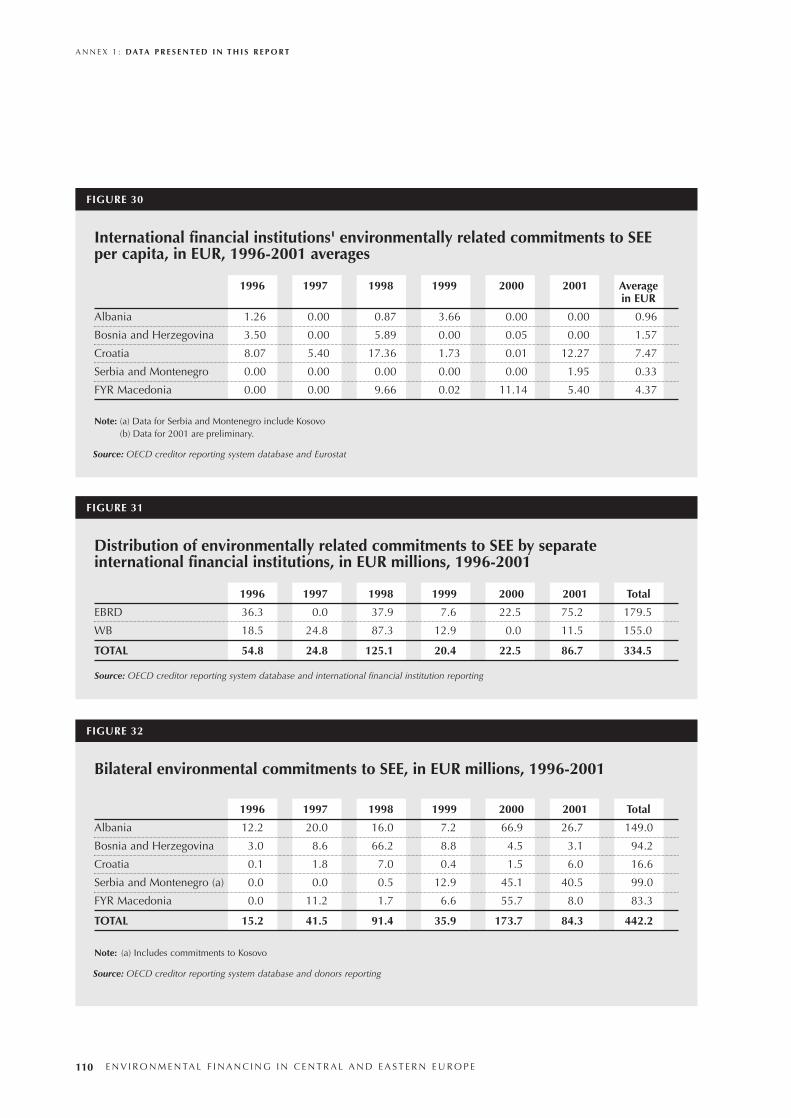
A N N E X 1 : DATA P R E S E N T E D I N T H I S R E P O R T
110 E N V I R O N M E N TA L F I N A N C I N G I N C E N T R A L A N D E A S T E R N E U R O P E
1996 1997 1998 1999 2000 2001 Average in EUR
Albania 1.26 0.00 0.87 3.66 0.00 0.00 0.96
Bosnia and Herzegovina 3.50 0.00 5.89 0.00 0.05 0.00 1.57
Croatia 8.07 5.40 17.36 1.73 0.01 12.27 7.47
Serbia and Montenegro 0.00 0.00 0.00 0.00 0.00 1.95 0.33
FYR Macedonia 0.00 0.00 9.66 0.02 11.14 5.40 4.37
Note: (a) Data for Serbia and Montenegro include Kosovo(b) Data for 2001 are preliminary.
International financial institutions' environmentally related commitments to SEEper capita, in EUR, 1996-2001 averages
FIGURE 30
1996 1997 1998 1999 2000 2001 Total
EBRD 36.3 0.0 37.9 7.6 22.5 75.2 179.5
WB 18.5 24.8 87.3 12.9 0.0 11.5 155.0
TOTAL 54.8 24.8 125.1 20.4 22.5 86.7 334.5
Distribution of environmentally related commitments to SEE by separateinternational financial institutions, in EUR millions, 1996-2001
FIGURE 31
1996 1997 1998 1999 2000 2001 Total
Albania 12.2 20.0 16.0 7.2 66.9 26.7 149.0
Bosnia and Herzegovina 3.0 8.6 66.2 8.8 4.5 3.1 94.2
Croatia 0.1 1.8 7.0 0.4 1.5 6.0 16.6
Serbia and Montenegro (a) 0.0 0.0 0.5 12.9 45.1 40.5 99.0
FYR Macedonia 0.0 11.2 1.7 6.6 55.7 8.0 83.3
TOTAL 15.2 41.5 91.4 35.9 173.7 84.3 442.2
Note: (a) Includes commitments to Kosovo
Bilateral environmental commitments to SEE, in EUR millions, 1996-2001
FIGURE 32
Source: OECD creditor reporting system database and Eurostat
Source: OECD creditor reporting system database and international financial institution reporting
Source: OECD creditor reporting system database and donors reporting
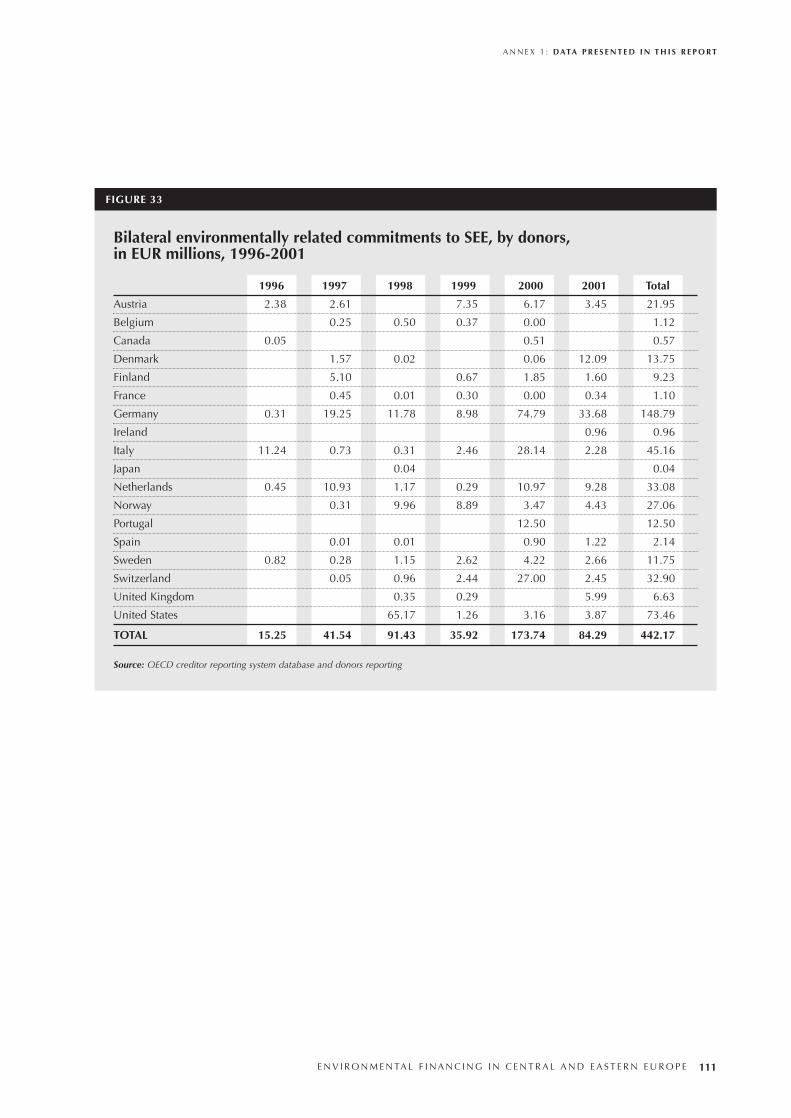
A N N E X 1 : DATA P R E S E N T E D I N T H I S R E P O R T
E N V I R O N M E N TA L F I N A N C I N G I N C E N T R A L A N D E A S T E R N E U R O P E 111
1996 1997 1998 1999 2000 2001 Total
Austria 2.38 2.61 7.35 6.17 3.45 21.95
Belgium 0.25 0.50 0.37 0.00 1.12
Canada 0.05 0.51 0.57
Denmark 1.57 0.02 0.06 12.09 13.75
Finland 5.10 0.67 1.85 1.60 9.23
France 0.45 0.01 0.30 0.00 0.34 1.10
Germany 0.31 19.25 11.78 8.98 74.79 33.68 148.79
Ireland 0.96 0.96
Italy 11.24 0.73 0.31 2.46 28.14 2.28 45.16
Japan 0.04 0.04
Netherlands 0.45 10.93 1.17 0.29 10.97 9.28 33.08
Norway 0.31 9.96 8.89 3.47 4.43 27.06
Portugal 12.50 12.50
Spain 0.01 0.01 0.90 1.22 2.14
Sweden 0.82 0.28 1.15 2.62 4.22 2.66 11.75
Switzerland 0.05 0.96 2.44 27.00 2.45 32.90
United Kingdom 0.35 0.29 5.99 6.63
United States 65.17 1.26 3.16 3.87 73.46
TOTAL 15.25 41.54 91.43 35.92 173.74 84.29 442.17
Bilateral environmentally related commitments to SEE, by donors, in EUR millions, 1996-2001
FIGURE 33
Source: OECD creditor reporting system database and donors reporting
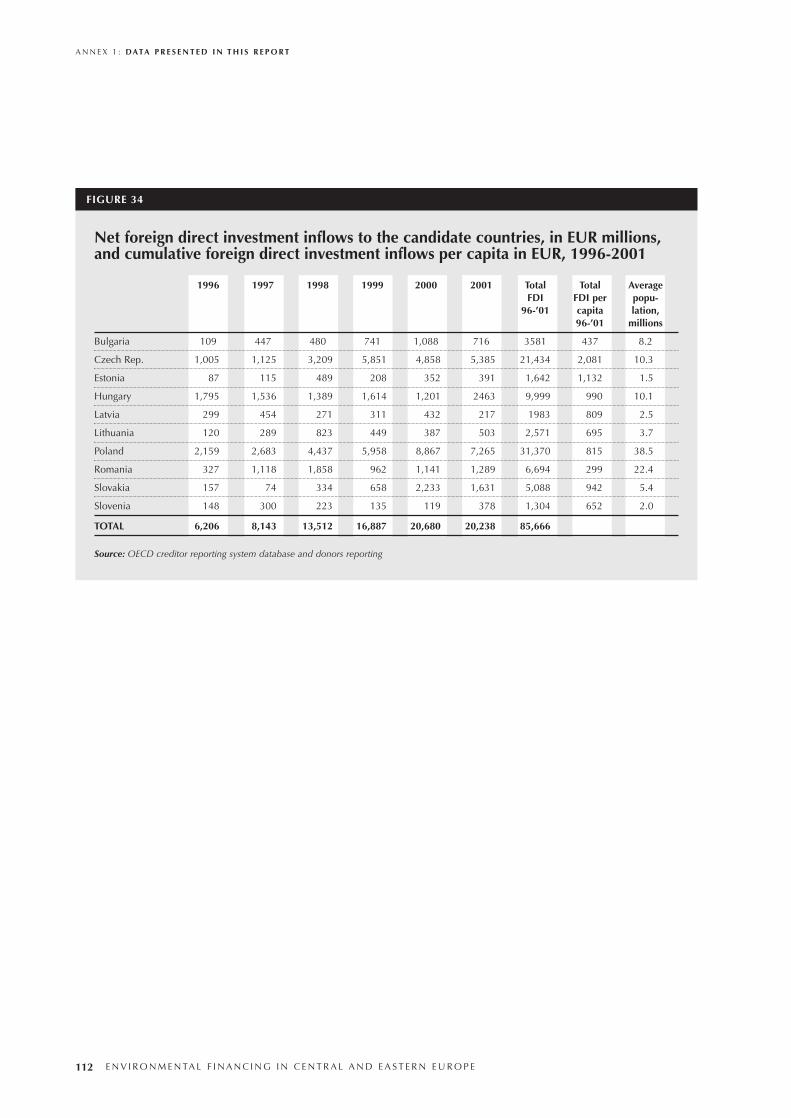
A N N E X 1 : DATA P R E S E N T E D I N T H I S R E P O R T
112 E N V I R O N M E N TA L F I N A N C I N G I N C E N T R A L A N D E A S T E R N E U R O P E
1996 1997 1998 1999 2000 2001 Total Total AverageFDI FDI per popu-
96-’01 capita lation,96-’01 millions
Bulgaria 109 447 480 741 1,088 716 3581 437 8.2
Czech Rep. 1,005 1,125 3,209 5,851 4,858 5,385 21,434 2,081 10.3
Estonia 87 115 489 208 352 391 1,642 1,132 1.5
Hungary 1,795 1,536 1,389 1,614 1,201 2463 9,999 990 10.1
Latvia 299 454 271 311 432 217 1983 809 2.5
Lithuania 120 289 823 449 387 503 2,571 695 3.7
Poland 2,159 2,683 4,437 5,958 8,867 7,265 31,370 815 38.5
Romania 327 1,118 1,858 962 1,141 1,289 6,694 299 22.4
Slovakia 157 74 334 658 2,233 1,631 5,088 942 5.4
Slovenia 148 300 223 135 119 378 1,304 652 2.0
TOTAL 6,206 8,143 13,512 16,887 20,680 20,238 85,666
Net foreign direct investment inflows to the candidate countries, in EUR millions,and cumulative foreign direct investment inflows per capita in EUR, 1996-2001
FIGURE 34
Source: OECD creditor reporting system database and donors reporting
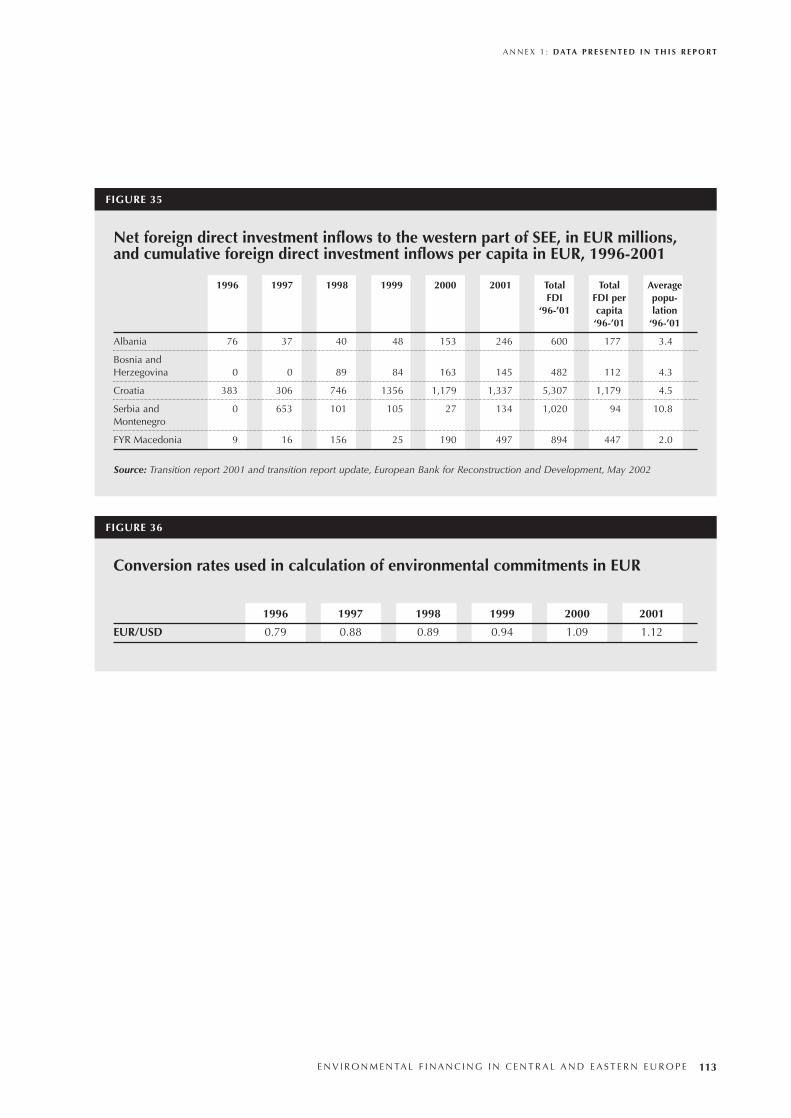
A N N E X 1 : DATA P R E S E N T E D I N T H I S R E P O R T
E N V I R O N M E N TA L F I N A N C I N G I N C E N T R A L A N D E A S T E R N E U R O P E 113
1996 1997 1998 1999 2000 2001 Total Total AverageFDI FDI per popu-
‘96-’01 capita lation‘96-’01 ‘96-’01
Albania 76 37 40 48 153 246 600 177 3.4
Bosnia andHerzegovina 0 0 89 84 163 145 482 112 4.3
Croatia 383 306 746 1356 1,179 1,337 5,307 1,179 4.5
Serbia and 0 653 101 105 27 134 1,020 94 10.8Montenegro
FYR Macedonia 9 16 156 25 190 497 894 447 2.0
Net foreign direct investment inflows to the western part of SEE, in EUR millions,and cumulative foreign direct investment inflows per capita in EUR, 1996-2001
FIGURE 35
1996 1997 1998 1999 2000 2001
EUR/USD 0.79 0.88 0.89 0.94 1.09 1.12
Conversion rates used in calculation of environmental commitments in EUR
FIGURE 36
Source: Transition report 2001 and transition report update, European Bank for Reconstruction and Development, May 2002

114 E N V I R O N M E N TA L F I N A N C I N G I N C E N T R A L A N D E A S T E R N E U R O P E
Environmental Expenditure in the Candidate Countries
As cited in the report data, environmental expendi-ture in the EU candidate countries of CEE were collect-ed by the Statistical Office of the European Communities(Eurostat) and presented in the Eurostat 2002: environ-mental protection expenditure in accession countries.Definitions used by Eurostat are presented below.
Environmental protection expenditure Environmental protection expenditure is spending
on all activities directly aimed at the prevention, reduc-tion and elimination of pollution or any other threat tothe environment. The data on environmental protectionexpenditure exclude:
• activities that, while beneficial to the environment,primarily satisfy technical needs or health and safetyrequirements;
• expenditure linked to mobilisation of naturalresources (e.g., water supply);
• calculated cost items, such as depreciation (con-sumption of fixed capital) or the cost of capital, asthe questionnaire only records actual outlays;
• payments of interest, fines and penalties for non-compliance with environmental regulations or com-pensation to third parties etc, as they are not direct-ly linked with environmental protection activity; and
• activities such as energy and material conservationto the extent that their main goal is environmentalprotection, such as recycling, which is included onlyto the extent that it constitutes a substitute for wastemanagement.
Environmental domains Environmental protection expenditure is classified in
various environmental domains according to the mediaor type of pollution/degradation concerned. Eurostat,when collecting data on environmental protectionexpenditure; used the following domain breakdown:
• Protection of ambient air and climate.
• Wastewater management (includes prevention ofemissions to surface water).
• Waste management (includes treatment of low levelradioactive waste, composting, street cleaning andsweeping, and recycling).
• Protection and remediation of soil, groundwater andsurface water (includes all clean-up activities).
• Noise and vibration abatement (excluding work-place protection).
• Protection of biodiversity and landscape.
• Others: Sum of protection against radiation(excluding external safety), research and develop-ment, other environmental protection activities(including general environmental administrationand management, education, training and informa-tion, invisible expenditure and expenditure notclassified elsewhere).
Investment expenditureTotal environmental protection expenditure used for
CEE data is the sum of investment and current expendi-ture. Investment expenditure includes all outlays in agiven year (purchases and own-account production) forenvironmental protection purposes. There are two fun-damental types of environmental protection investment:
E N V I R O N M E N TA L F I N A N C I N G I N C E N T R A L A N D E A S T E R N E U R O P E 115
Annex 2Methodological Issues
• Pollution treatment (end-of-pipe): Investment doesnot affect the production process itself, and theamount of pollution generated; instead it serves totreat the pollution already generated.
• Pollution prevention (process-integrated): Investmentthat leads to a modified or adapted productionprocess. It serves to reduce the amount of pollutiongenerated. When a new production process is intro-duced, the environmental protection expenditureconsists of outlays over and above what would havebeen paid for cheaper, viable, but less environmen-tally benign equipment. When an existing plant ismodified, the environmental investment is equal tototal outlays for the environmental adaptation.
Current expenditureCurrent expenditure is the sum of two categories:
• Internal current expenditures are environmental ser-vices for own benefit, such as wages, salaries, rents,energy, maintenance and other such expenses thatgo toward environmental protection purposes.
• Fees or purchases include all purchases of environ-mental protection services from the market (e.g. forrubbish collection), both from public and private pro-ducers. These payments are clearly linked to an envi-ronmental protection activity outside the enterpriseand should be excluded (e.g. fines and penalties).
The payments include:
• Those to specialised producers (enterprises) forwaste and wastewater collection and treatment andpayments to environmental consultants in, for exam-ple, environmental management and education.
• Payments to the public sector for waste and waste-water collection and treatment (whatever the nameof the payments — fees, charges etc) as well as per-mits and observation fees.
Payments of taxes directly used for financing envi-ronmental protection expenditure, so-called earmarkedenvironmental taxes, are excluded.
Public sectorThe public sector in the Eurostat publication
includes central, regional and local governments,authorities, communities and government agencies.Data reported should be the net of any transfersbetween these government bodies.
IndustryEurostat publication data for CEE industrial sectors
presents only data for the part of the business sector relat-ed to industry for reasons of data availability. Thisincludes enterprises and other units whose main activity isin the following branches of industries according to theGeneral Industrial Classification of Economic Activitieswithin the European Communities - NACE (Nomenclaturedes Activités des Communautés Européennes):
• 10-14 Mining and quarrying.
• 15-37 Manufacturing.
• 15-16 Food producers, beverages and tobacco.
• 20 Wood and wood products.
• 21-22 Pulp, paper and paper products, publishingand printing.
• 23 Refineries: coke, refined petroleum products andnuclear fuel.
• 24-25 Chemicals, chemical products and man-madefibres, rubber and plastic products.
• 26 Other non-metallic mineral products.
• 27 Basic metal.
• 28-36 Metal products and others.
• 40- 41 Electricity, gas and water supply.
Specialised ProducersSpecialised producers of environmental services are
units that specialise in the provision of environmentalprotection services for the market (e.g. waste collection,waste treatment and sewage treatment). These aremainly found in NACE 90 (sewage and refuse disposal,sanitation and similar activities).
Classification of environmental protection activities Protection of ambient air and climate
• Prevention of pollution through in-process modifi-cations for the protection of ambient air and for theprotection of the climate and ozone layers.
• Treatment of exhaust gases and ventilation air forthe protection of ambient air and of the climate andozone layer.
• Measurement, control, laboratory work and the like.
• Other activities.
A N N E X 2 : M E T H O D O L O G I C A L I S S U E S
116 E N V I R O N M E N TA L F I N A N C I N G I N C E N T R A L A N D E A S T E R N E U R O P E
Wastewater management
• Prevention of pollution through in-process modifi-cations.
• Sewerage network operation.
• Wastewater treatment.
• Treatment of cooling water.
• Measurement, control, laboratories and the like.
• Other activities (excluding the supply and treatmentof drinking water).
Waste management
• Prevention of pollution through in-process modifications.
• Collection and transport.
• Treatment and disposal of hazardous waste includ-ing; thermal treatment, landfill, other treatment anddisposal.
• Treatment and disposal of non-hazardous waste,including incineration, landfill, other treatmentand disposal.
Noise and vibration abatement (excluding workplace protection)
• Reducing noise and vibration from road and rail traf-fic (preventive in-process modifications at the sourceand construction of anti noise/vibration facilities).
• Reducing air traffic noise (preventive in-processmodifications at the source and construction of antinoise/vibration facilities).
• Dampening industrial process noise and vibrations.
• Measurement, control, laboratory work and the like.
• Other activities.
Protection of soil and groundwater
• Prevention of pollutant infiltrations.
• Decontamination of soils.
• Measurement, control, laboratory work and the like.
• Other activities.
Protection against radiation
• Protection of ambient media.
• Measurement, control, laboratory work and the like.
• Other activities.
Research and development
• Protection of ambient air and climate.
• Protection of ambient water.
• Waste management.
• Protection of soil and groundwater.
• Abatement of noise and vibration.
• Protection of species and habitats.
• Protection against radiation.
• Other research on the environment.
Protection of biodiversity and landscapes
• Protection of species.
• Protection of landscapes and habitats including pro-tection of forest.
• Rehabilitation of species populations and landscapes.
• Restoration and cleaning of water bodies.
• Measurement, control, laboratories and the like.
• Other activities
Other environmental protection activities
• General environmental administration and man-agement.
• Education, training and information.
• Activities leading to indivisible expenditure.
• Activities not classified elsewhere.
Within the Organisation for Economic Co-operationand Development (OECD) framework114 environmentalexpenditure for a particular sector can be distinguishedin two ways:
• according to the financial principle (who pays forthe activity), or
• according to the abater principle (where the activityoccurs.
The main difficulties identified during collectingexpenditure data by Eurostat are presented in table 1.
Environmental Expenditure in theCountries of South Eastern Europe
As cited in Chapter 4, the SEE countries do not reportto Eurostat. Although the questionnaires on data expen-diture were distributed to all countries, in the majority ofcases they were returned without expenditure data.
The main difficulties in data collection are listed inthe figure 2.
A N N E X 2 : M E T H O D O L O G I C A L I S S U E S
E N V I R O N M E N TA L F I N A N C I N G I N C E N T R A L A N D E A S T E R N E U R O P E 117
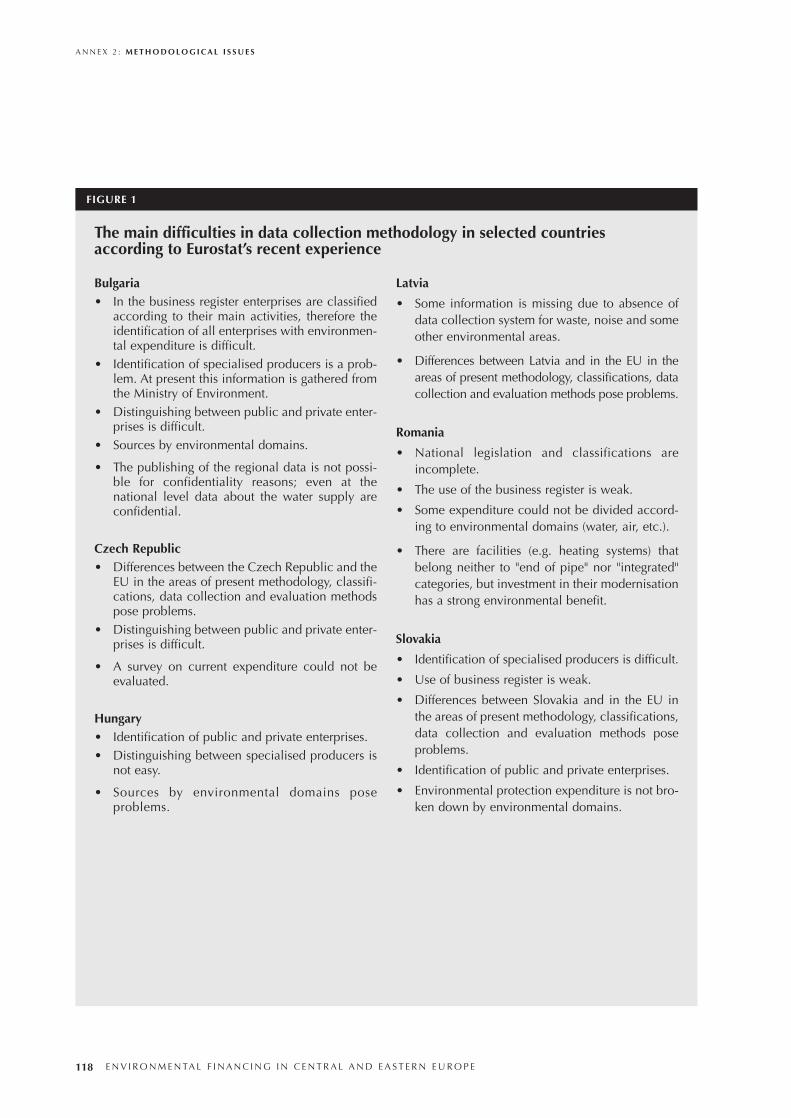
A N N E X 2 : M E T H O D O L O G I C A L I S S U E S
118 E N V I R O N M E N TA L F I N A N C I N G I N C E N T R A L A N D E A S T E R N E U R O P E
FIGURE 1
Bulgaria• In the business register enterprises are classified
according to their main activities, therefore theidentification of all enterprises with environmen-tal expenditure is difficult.
• Identification of specialised producers is a prob-lem. At present this information is gathered fromthe Ministry of Environment.
• Distinguishing between public and private enter-prises is difficult.
• Sources by environmental domains.
• The publishing of the regional data is not possi-ble for confidentiality reasons; even at thenational level data about the water supply areconfidential.
Czech Republic• Differences between the Czech Republic and the
EU in the areas of present methodology, classifi-cations, data collection and evaluation methodspose problems.
• Distinguishing between public and private enter-prises is difficult.
• A survey on current expenditure could not beevaluated.
Hungary• Identification of public and private enterprises.• Distinguishing between specialised producers is
not easy.
• Sources by environmental domains poseproblems.
Latvia
• Some information is missing due to absence ofdata collection system for waste, noise and someother environmental areas.
• Differences between Latvia and in the EU in theareas of present methodology, classifications, datacollection and evaluation methods pose problems.
Romania
• National legislation and classifications areincomplete.
• The use of the business register is weak.
• Some expenditure could not be divided accord-ing to environmental domains (water, air, etc.).
• There are facilities (e.g. heating systems) thatbelong neither to "end of pipe" nor "integrated"categories, but investment in their modernisationhas a strong environmental benefit.
Slovakia
• Identification of specialised producers is difficult.
• Use of business register is weak.
• Differences between Slovakia and in the EU inthe areas of present methodology, classifications,data collection and evaluation methods poseproblems.
• Identification of public and private enterprises.
• Environmental protection expenditure is not bro-ken down by environmental domains.
The main difficulties in data collection methodology in selected countriesaccording to Eurostat’s recent experience
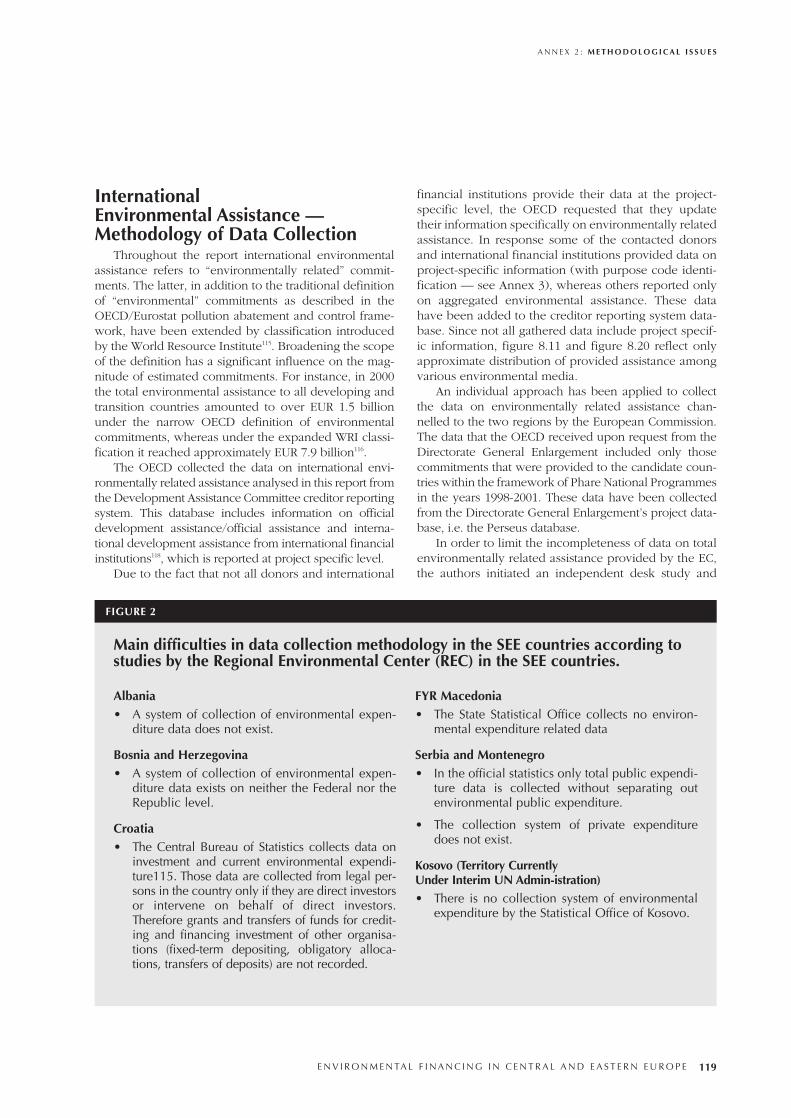
International Environmental Assistance —Methodology of Data Collection
Throughout the report international environmentalassistance refers to “environmentally related” commit-ments. The latter, in addition to the traditional definitionof “environmental” commitments as described in theOECD/Eurostat pollution abatement and control frame-work, have been extended by classification introducedby the World Resource Institute115. Broadening the scopeof the definition has a significant influence on the mag-nitude of estimated commitments. For instance, in 2000the total environmental assistance to all developing andtransition countries amounted to over EUR 1.5 billionunder the narrow OECD definition of environmentalcommitments, whereas under the expanded WRI classi-fication it reached approximately EUR 7.9 billion116.
The OECD collected the data on international envi-ronmentally related assistance analysed in this report fromthe Development Assistance Committee creditor reportingsystem. This database includes information on officialdevelopment assistance/official assistance and interna-tional development assistance from international financialinstitutions118, which is reported at project specific level.
Due to the fact that not all donors and international
financial institutions provide their data at the project-specific level, the OECD requested that they updatetheir information specifically on environmentally relatedassistance. In response some of the contacted donorsand international financial institutions provided data onproject-specific information (with purpose code identi-fication — see Annex 3), whereas others reported onlyon aggregated environmental assistance. These datahave been added to the creditor reporting system data-base. Since not all gathered data include project specif-ic information, figure 8.11 and figure 8.20 reflect onlyapproximate distribution of provided assistance amongvarious environmental media.
An individual approach has been applied to collectthe data on environmentally related assistance chan-nelled to the two regions by the European Commission.The data that the OECD received upon request from theDirectorate General Enlargement included only thosecommitments that were provided to the candidate coun-tries within the framework of Phare National Programmesin the years 1998-2001. These data have been collectedfrom the Directorate General Enlargement’s project data-base, i.e. the Perseus database.
In order to limit the incompleteness of data on totalenvironmentally related assistance provided by the EC,the authors initiated an independent desk study and
A N N E X 2 : M E T H O D O L O G I C A L I S S U E S
E N V I R O N M E N TA L F I N A N C I N G I N C E N T R A L A N D E A S T E R N E U R O P E 119
FIGURE 2
Albania• A system of collection of environmental expen-
diture data does not exist.
Bosnia and Herzegovina• A system of collection of environmental expen-
diture data exists on neither the Federal nor theRepublic level.
Croatia• The Central Bureau of Statistics collects data on
investment and current environmental expendi-ture115. Those data are collected from legal per-sons in the country only if they are direct investorsor intervene on behalf of direct investors.Therefore grants and transfers of funds for credit-ing and financing investment of other organisa-tions (fixed-term depositing, obligatory alloca-tions, transfers of deposits) are not recorded.
FYR Macedonia• The State Statistical Office collects no environ-
mental expenditure related data
Serbia and Montenegro• In the official statistics only total public expendi-
ture data is collected without separating outenvironmental public expenditure.
• The collection system of private expendituredoes not exist.
Kosovo (Territory Currently Under Interim UN Admin-istration)• There is no collection system of environmental
expenditure by the Statistical Office of Kosovo.
Main difficulties in data collection methodology in the SEE countries according tostudies by the Regional Environmental Center (REC) in the SEE countries.
paid a visit to the Directorate General EuropAid head-quarters. As a result, based on the information collectedfrom the Phare and Instrument for Structural Policies forPre-accession (ISPA) annual reports as well as theCurrent Research Information System (Cris) database,the authors were able to collect the data on the EC’scontributions to the CEE candidate countries withinLarge Scale Infrastructure Facility and ISPA pro-grammes. The data on the EC’s environmentally relatedassistance to the CEE candidate countries within theframework of Phare Cross Border Cooperation andPhare Multibeneficiary programme as well as contribu-tions to the SEE countries within the Phare, Obnova andCARDS programmes could not be gathered. Thereforethe assistance provided within the framework of theseprogrammes has been excluded from the analysis pre-sented in this report.
The main reason for the unavailability of the infor-mation on the EC’s environmentally related assistance isthe fact that a comprehensive database which couldprovide information on the EC’s sectoral contributions,inter alia environment, within the framework of all assis-tance programmes has not been yet established.
The limited scope of the data on the EC’s environ-mental contributions imposes serious constraints onthe adequacy of the analysis of aggregated internation-al assistance to both the candidate countries and SEEregion (see Chapter 8) as well the analysis of total ECassistance (also in Chapter 8).
Endnotes114 OECD 1996
115 The Croatian Central Bureau of Statistics definition on:
1. The gross fixed capital formation for environmental protection includesinvestment in land, facilities, equipment and tools for: (1) collection, trans-portation, processing, depositing and storage of waste; (2) reducing or pro-tection of surface water from wastewater; (3) reduction, abatement or elim-ination of noise; (4) elimination, abatement or reduction of pollutants fromwaste gases in the air; (5) protection of ground and surface water, and (6)protection of nature and landscape.
2. Current expenditures for environmental protection are all expendituresby which adverse environmental impacts from enterprises are prevented,eliminated or reduced (without investment and redemption): (1) Relating toappliances and equipment for environmental protection (current expendi-ture for electricity consumption, spare parts, employees, services within thecompany, external services, interests); (2) other expenditure for planning,research, development, taxes, insurance, penalties, indemnities etc.
116 WRI 2001
117 OECD 2002
118 This report covers international development assistance by the follow-ing IFI – European Investment Bank, EBOR, World Bank and the NordicEnvironment Finance Corporation (in the case of assistance provided to theCEE region) and EBOR and the World Bank (in the case of assistance chan-nelled to the western part of SEE).
A N N E X 2 : M E T H O D O L O G I C A L I S S U E S
120 E N V I R O N M E N TA L F I N A N C I N G I N C E N T R A L A N D E A S T E R N E U R O P E
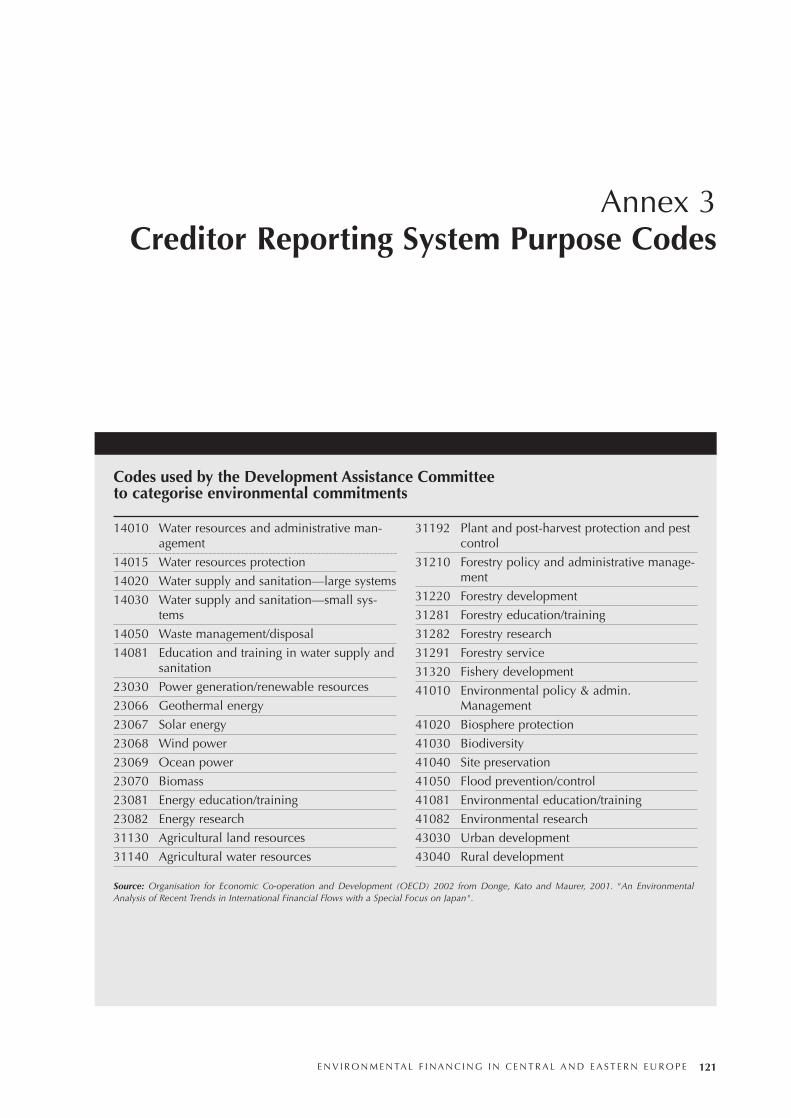
E N V I R O N M E N TA L F I N A N C I N G I N C E N T R A L A N D E A S T E R N E U R O P E 121
Annex 3Creditor Reporting System Purpose Codes
14010 Water resources and administrative man-agement
14015 Water resources protection
14020 Water supply and sanitation—large systems
14030 Water supply and sanitation—small sys-tems
14050 Waste management/disposal
14081 Education and training in water supply andsanitation
23030 Power generation/renewable resources
23066 Geothermal energy
23067 Solar energy
23068 Wind power
23069 Ocean power
23070 Biomass
23081 Energy education/training
23082 Energy research
31130 Agricultural land resources
31140 Agricultural water resources
31192 Plant and post-harvest protection and pestcontrol
31210 Forestry policy and administrative manage-ment
31220 Forestry development
31281 Forestry education/training
31282 Forestry research
31291 Forestry service
31320 Fishery development
41010 Environmental policy & admin.Management
41020 Biosphere protection
41030 Biodiversity
41040 Site preservation
41050 Flood prevention/control
41081 Environmental education/training
41082 Environmental research
43030 Urban development
43040 Rural development
Codes used by the Development Assistance Committee to categorise environmental commitments
Source: Organisation for Economic Co-operation and Development (OECD) 2002 from Donge, Kato and Maurer, 2001. "An EnvironmentalAnalysis of Recent Trends in International Financial Flows with a Special Focus on Japan".

122 E N V I R O N M E N TA L F I N A N C I N G I N C E N T R A L A N D E A S T E R N E U R O P E

THE REGIONAL ENVIRONMENTAL CENTER FOR CENTRAL AND EASTERN
EUROPE (REC) is a non-partisan, non-advocacy, not-for-profit organisation
with a mission to assist in solving environmental problems in Central and
Eastern Europe (CEE). The Center fulfils this mission by encouraging cooperation
among non-governmental organisations, governments, businesses and other
environmental stakeholders, by supporting the free exchange of information
and by promoting public participation in environmental decision-making.
The REC was established in 1990 by the United States, the European Commission
and Hungary. Today, the REC is legally based on a Charter signed by the
governments of 27 countries and the European Commission, and on an
International Agreement with the Government of Hungary. The REC has its
headquarters in Szentendre, Hungary, and local offices in each of its 15
beneficiary CEE countries, which are: Albania, Bosnia and Herzegovina, Bulgaria,
Croatia, the Czech Republic, Estonia, Hungary, Latvia, Lithuania, FYR Macedonia,
Poland, Romania, Serbia and Montenegro, Slovakia and Slovenia.
Recent donors are the European Commission and the governments of
Albania, Belgium, Bosnia and Herzegovina, Bulgaria, Canada, the Czech
Republic, Denmark, Estonia, Finland, France, Germany, Italy, Japan, Latvia,
Lithuania, the Netherlands, Poland, Serbia and Montenegro, Slovenia,
Sweden,
Switzerland, the United Kingdom and the United States, as well as other
inter-governmental and private institutions.
Environmental Financing in Central and Eastern Europe