Embed Size (px)
Citation preview

Martice Vasquez
UC Davis
October 13, 2009
Environmental fate of etofenprox, an ether pyrethroid, under California rice
growing conditions

Structure of Presentation
Etofenprox Introduction and Background Why a unique pyrethroid?Etofenprox in rice culture – environmental fatePartitioning between air, water and soilMicrobial and photolytic degradationConclusion

Etofenprox – A Synthetic Ether Pyrethroid
MW = 376 g/mol1VP = 8.3 x 10⁻⁷ Pa @ 25°C1Csat = 22.5 ug/L @ 20°C1Log Kow = 7.052Log Koc = 6.0-6.4
O
O
O
Physical/Chemical Properties:

Etofenprox Target in Rice Culture
Scarring of blades; destroy rootsTargets Na Channel of insects Both adult and larvae susceptible
Pupae
Larvae
RICE WATER WEEVIL
Adult

Etofenprox – A Unique Pyrethroid
Ether not ester bond is central linkageNon-halogenated
O
H
O
C
N
C
OH
H
CH
C
Cl
C
F
F
F
O
O
O
ETOFENPROX
λ-CYHALOTHRIN3
VP = 1 x 10⁻⁶
Pa @ 25°CCsat
= 5 ug/L @ 20°CLog Kow
= 6.8MW = 450 g/mol

Pyrethroid Issues
Acute toxicity to aquatic species–
Rainbow trout LC50
= 2.5-32 ppb eto4; 0.54ppb cyhalothrin5, 5.4ppb permethrin6
–
Aquatic invertebrates vulnerable
Toxicity events associated with pyrethroids in urban and agricultural waterways7,8
Re-registration in California

What are the dominant processes that control dissipation?
Log Koc = 6.0-6.4
3.49x10⁻² Pa•m3/mol

Apply
etofen
prox
Straw
incorporation;
winter flooding?
Dominant dissipation processes
Aerobic microbial; Soil photolysis
Anaerobic microbial
Partitioning; Aqueous photolysis
Anaerobic microbial
Aerobic microbial; soil photolysis
Winter flooding Anaerobic microbial
No Winter flooding
-300mV
-200mV
-100mV
100mV
0 mV

Air-Water and Soil-Water Partitioning
Compare volatilization and soil sorption processes to determine respective contribution to overall dissipation of etofenprox under California rice growing conditions.
Hypothesis: Sorption will contribute greater to the overall dissipation of etofenprox from water than volatilization.

Air-Water Partitioning
Henry’s constant: a measure of volatilization
KH
= pg
/Cw
Pg = vapor pressureCw
= water solubility(At defined Temp)
Gas stripping apparatus9

Air-Water Partitioning: Temperature effectsETOFENPROX
PHYSICAL/CHEMICAL PROPERTY
ESTIMATED VALUE
MANUFACTURER REPORTED VALUE
BOILING POINT 461°C NA
VAPOR PRESSURE (Pa)
5°C 4.11 x 10-06
15°C 1.85 x 10-05
20°C 3.75 x 10-05
25°C 7.43 x 10-05 8.13 X10⁻⁷(exp)35°C 2.71 x 10-04
40°C 4.99 x 10-04
AQUEOUS SOLUBILITY (mg/L)
5°C 2.75 x 10-01
15°C 3.57 x 10-01
20°C 4.05 x 10-01 2.25 x 10-02 (exp)25°C 4.57 x 10-01
35°C 5.75 x 10-01
40°C 6.41 x 10-01
HENRY’S CONSTANT (Pa·m3/mol)
5°C 5.62 x 10-03
15°C 1.94 x 10-02
20°C 3.49 x 10-02 1.36 x 10-02
25°C 1.22 x 10-02
35°C 1.77 x 10-01
0.010.020.030.040.050.060.070.0
Column Walls PUF % leftover mass insystem (bydifference)
% E
tofe
npro
x in
sys
tem
Mass distribution of etofenprox in apparatus during experimental
determination of Henry’s constant.
Aqueous phase decrease due to sorption, not volatilization; temperature showed little effect
Table from Vasquez, et al 2009.

Soil-Water Partitioning of Etofenprox
Soil property Soil (0-10 cm)
Princeton Richvale
Straw removal practice Burned Incorporate
Sand (%) 14 23
Silt (%) 49 26
Clay (%) 37 51
Organic matter (%) 3.10 2.18
Total available nitrogen (μg/g) 0.175 0.142
Nitrate (NO3
) nitrogen (μg/g) 8.6 0.3
Exchangeable K (μg/g) 157 178
Exchangeable S (SO42-; μg/g) 23 41
Phosphorus (μg/g) 6.2 2.4
Determine Soil-Water distribution coefficient (Kd
) using representative rice soils
at 25°C and 35°C.
Kd
= Cs
/ Cw
Cs
= equilibrium soil concentration
Cw
= equilibrium aqueous concentration
Table from Vasquez, et al 2009.

Experimental Approach: Three Phase Model
Mix on Shaker in Dark @ °C
Centrifuge
Hexane extract aqueous phase; rinse bottles
GC/MS SIM mode
Calculate Mass Distribution
Construct Isotherm
(1st determine soil to solution ratio and time to equilibrium)
[Soil = Initial –
(aqueous + bottle)]Triplicate samples and control(no
soil) at each conccentration
level
5 –
15 ppb initial Cw
Soil (0.1g)
+ Aqueous Solution (125mL NH4
HCO3
+ NaN3
)

0.96976.424849231.332304Richvale25
0.96466.113930001.825074Princeton35
0.98266.09166671.816500Princeton25
r2log Koc (mL/g)KocfocKd (mL/g)SoilTemp (°C)
02468
1012141618
0 2 4 6 8Aqueous Concentration ( ug/mL x10-4 )
Soil
Con
cent
ratio
n (u
g/g)
Soil-Water Partitioning: Temperature and soil type effects2
■▲♦

Microbial Degradation
Compare anaerobic (flooded) and aerobic (drained) soil degradation to determine the effect of water regime on the overall dissipation of etofenprox in California rice culture.

Anaerobic Experimental Approach
•
Etofenprox added once system anaerobic (after 14 days of flooding)
• Incubate in Dark @ RT over 126 days
•
Triplicate Samples and Controls t=0,1,3,7,14,21,28,35,42,56,126 day
• Soil: Aqueous Solution (50g:60mL)
•
Application rate of 3 mg/kg (+150 ug
etofenprox per bottle)
Controls: (sterilized-
autoclaved; azide/dark)
•
Soil Collected from Rice Experiment Station May 2008 –
characterization by DANR lab
•
Irrigation Water collected from campus outfall of Berryessa irrigation district; pH 7.5

-300.00
-200.00
-100.00
0.00
100.00
200.00
300.00
400.00
0 10 20 30 40 50 60 70
Day
Red
ox P
oten
tial (
rela
tive
mill
ivol
ts)
Redox potential of soil water system over time: anoxic conditions by day 10

ExtractionAdd 60 mL acetone to system and shake at 135 rpm overnight
Blown down and dissolve in 40:60 ACN:H2O (~2mL); filter
LC/MS-MSTriplicate controls at each sampling interval: (sterilized/dark)
Filter, blow off acetone, liquid/liquid extract water with hexane; dry hexane extract with Na2
SO4

Products targeted by LC/MS/MS
4’-OHα-CO
3-PBA
Etofenprox

Dissipation of etofenprox in flooded rice soil
0
20
40
60
80
100
120
140
0 20 40 60 80 100 120 140Days after application
Am
ount
of o
rigin
al e
tofe
npro
x (1
50ug
) app
lied
(%)
Active soil- not autoclaved Sterilized soil - autoclaved
Points represent the mean ±
SD (n = 3).

-0.6
-0.4
-0.2
0
0.2
0.4
0.6
0.8
1
1.2
0 20 40 60 80 100 120 140
Days after application
ln s
oil c
once
ntra
tion
(ug/
g
Active Soil Sterilized soil Slow kinetics fast kinetics
Model Rate Constant (1/day) t1/2 (days) Correlation
fast kinetics -0.1967 3.5 0.6873
slow kinetics k -0.0045 154 0.7629
linear 1st order -0.0069 100 0.5081
Control (linear) -0.0023 462 0.3868
Mitsui half-life = 174 days (1st
order; 0.9705)1
1st order kinetics of anaerobic rice soil microbial degradation of etofenprox
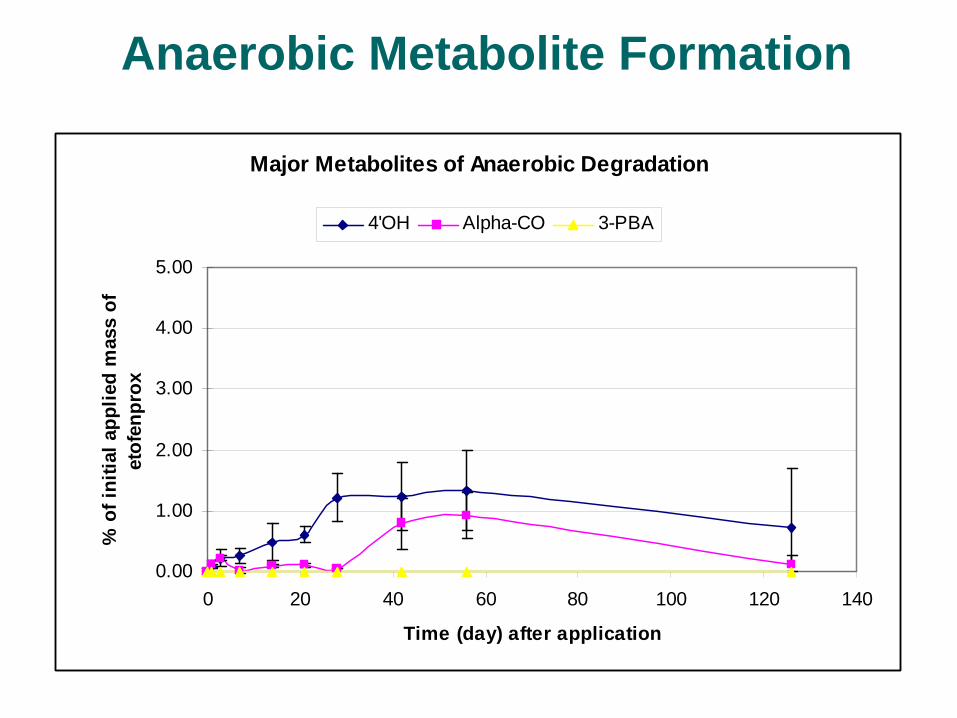
Anaerobic Metabolite Formation
Major Metabolites of Anaerobic Degradation
0.00
1.00
2.00
3.00
4.00
5.00
0 20 40 60 80 100 120 140
Time (day) after application
% o
f ini
tial a
pplie
d m
ass
of
etof
enpr
ox
4'OH Alpha-CO 3-PBA

OH2C
H3C
C
CH3
CH3
CH2
O
CH2 O
OO
O
OH
4’-OH
PROPOSED ANAEROBIC DEGRADATION
OHO
O
OH
O 3-PBA
OO
O
O
α-CO
H2
O
dehydrogenaseH2
O -2H
dehydrogenaseH2
O-2H
?

Anaerobic Summary
Dissipation rates and half-lives calculated4’OH was major metabolite; alpha-CO producedOther unknowns in low abundance? –
Didn’t detect 3-PBAAerobic degradation experiments in progressAerobic and Anaerobic Experiments at 40°

Photolysis
Compare aqueous and soil surface photolytic degradation to determine respective contribution to overall dissipation of etofenprox under California rice growing conditions.

Photolysis of etofenprox in literature
Photolysis study10 in mixture of 2:3 ACN:H2O–
Not representative of environmental conditions–
Solubility poses issuesEtofenprox capable of photolytic transformation10

Concluding remarks
Analytical Challenges–
Extremely low water solubility–
Significant sorption the glasswareOffsite movement unlikely unless in bound statePreliminary microbial work suggests transformation possible by endemic microbesKinetics are messy but residues detectable at 126 days after application

THANK YOU

References1. Mitsui Chemicals, Inc. Etofenprox Data Sheet MSDS # 62141E. Tokyo, Japan (2005). 2. Vasquez, M; Gunasekara, A; Cahill, T; Tjeerdema, R. Partitioning of etofenprox under smulated
Califonia
rice growing conditions. (2009)
Pest Man Sci.( (www.interscience.wiley.com) DOI 10.1002/ps.1826.3. Laskowski
DA, Physical and Chemical Properties of Pyrethroids. (2002) Rev. Environ. Contam. Toxicol. 174:49-170
4. Report of the Joint Meeting of the FAO Panel of Experts on Pesticide Residues in Food and the Environment. World Health Organization, Geneva, Switzerland, September
20-29:
357-381 (1993).5. Tomlin, C.D.S. (ed.). The Pesticide Manual -
World Compendium. 10th ed. Surrey, UK: The British Crop Protection Council, 1994., p. 253.
6. Tomlin, C.D.S. (ed.). The Pesticide Manual -
World Compendium. 10th ed. Surrey, UK: The British Crop Protection Council, 1994., p. 785.
7. Weston, et al. Aquatic Effects of Aerial Spraying for Mosquito Control over an Urban Area. (2006) Env Sci Tech 40:5817-5822
8. Weston, et al. Distribution and toxicity of sediment-associated pesticides in agriculture-dominated water bodies of California's Central Valley. (2004) Env Sci Tech 38:2752-9.
9. Lau FK, Charles MJ, Cahill TM. (2006) Evaluation of gas-stripping methods for the determination of Henry's law constants for polybrominated
diphenyl
ethers and polychlorinated biphenyls. J. Chem. Eng. Data. 51:871-878.
10. Class, T., Casida, J., Ruzo, L. (1989) Photochemistry of ethofenprox
and three related pyrethroids with ether, alkane, and alkene
central linkages. Journal of Agricultural and Food Chemistry 37: 216-222.