Embed Size (px)
Citation preview
1
Environmentalfateofchemicalsreleasedfromconsumerproducts
‐ Multimediamodellingstrategies
AnnaPalmCousins
DoctoralThesis
DepartmentofAppliedEnvironmentalScience(ITM)
StockholmUniversity
2013
2
Doctoralthesis,2013AnnaPalmCousinsDepartmentofAppliedEnvironmentalScience(ITM)StockholmUniversityS‐10691StockholmSweden©AnnaPalmCousins,Stockholm2013ISBN978-91-7447-690-3PrintedinSwedenbyUniversitetsserviceUS‐AB,Stockholm2013Distributor:DepartmentofAppliedEnvironmentalScience(ITM)Covergraphic:EmilyCousins

3
TillEmily,LinneaochOlivia
4
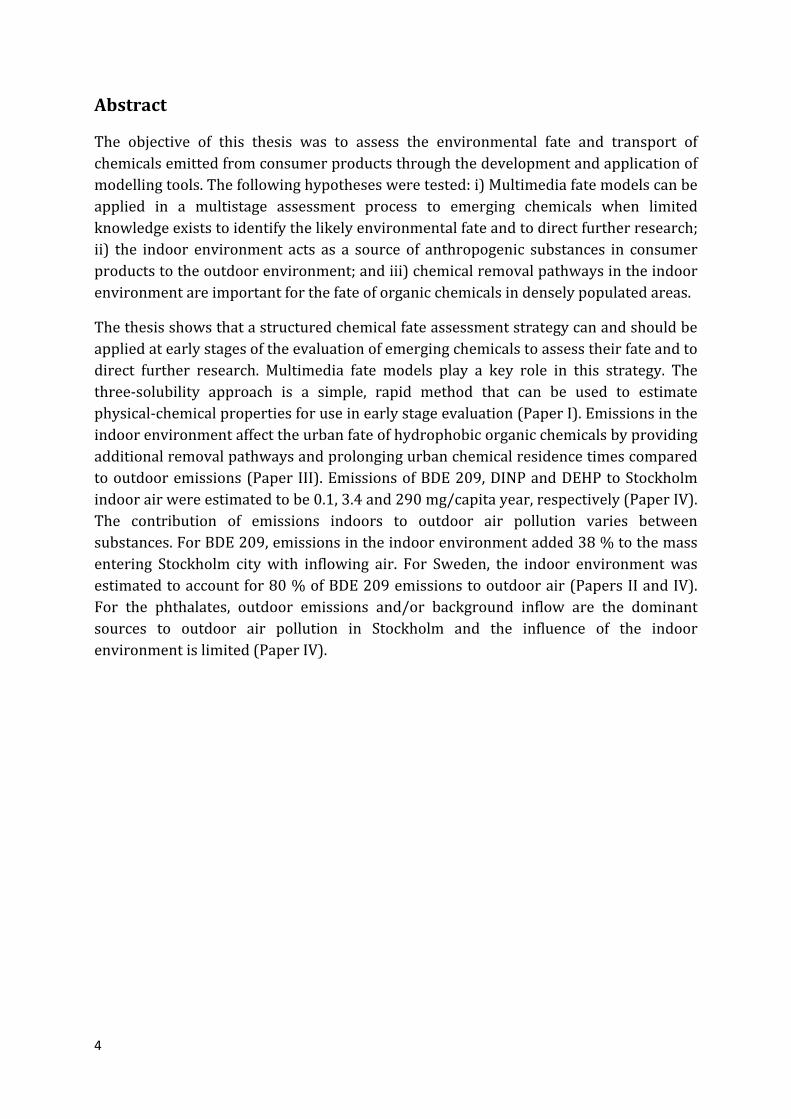
Abstract
The objective of this thesis was to assess the environmental fate and transport ofchemicalsemittedfromconsumerproductsthroughthedevelopmentandapplicationofmodellingtools.Thefollowinghypothesesweretested:i)Multimediafatemodelscanbeapplied in a multistage assessment process to emerging chemicals when limitedknowledgeexiststoidentifythelikelyenvironmentalfateandtodirectfurtherresearch;ii) the indoor environment acts as a source of anthropogenic substances in consumerproductstotheoutdoorenvironment;andiii)chemicalremovalpathwaysintheindoorenvironmentareimportantforthefateoforganicchemicalsindenselypopulatedareas.
Thethesisshowsthatastructuredchemicalfateassessmentstrategycanandshouldbeappliedatearlystagesoftheevaluationofemergingchemicalstoassesstheirfateandtodirect further research. Multimedia fate models play a key role in this strategy. Thethree‐solubility approach is a simple, rapid method that can be used to estimatephysical‐chemicalpropertiesforuseinearlystageevaluation(PaperI).Emissionsintheindoorenvironmentaffecttheurbanfateofhydrophobicorganicchemicalsbyprovidingadditionalremovalpathwaysandprolongingurbanchemicalresidencetimescomparedtooutdooremissions(Paper III).EmissionsofBDE209,DINPandDEHPtoStockholmindoorairwereestimatedtobe0.1,3.4and290mg/capitayear,respectively(PaperIV).The contribution of emissions indoors to outdoor air pollution varies betweensubstances.ForBDE209,emissionsintheindoorenvironmentadded38%tothemassentering Stockholm citywith inflowing air. For Sweden, the indoor environmentwasestimatedtoaccountfor80%ofBDE209emissionstooutdoorair(PapersIIandIV).For the phthalates, outdoor emissions and/or background inflow are the dominantsources to outdoor air pollution in Stockholm and the influence of the indoorenvironmentislimited(PaperIV).
5
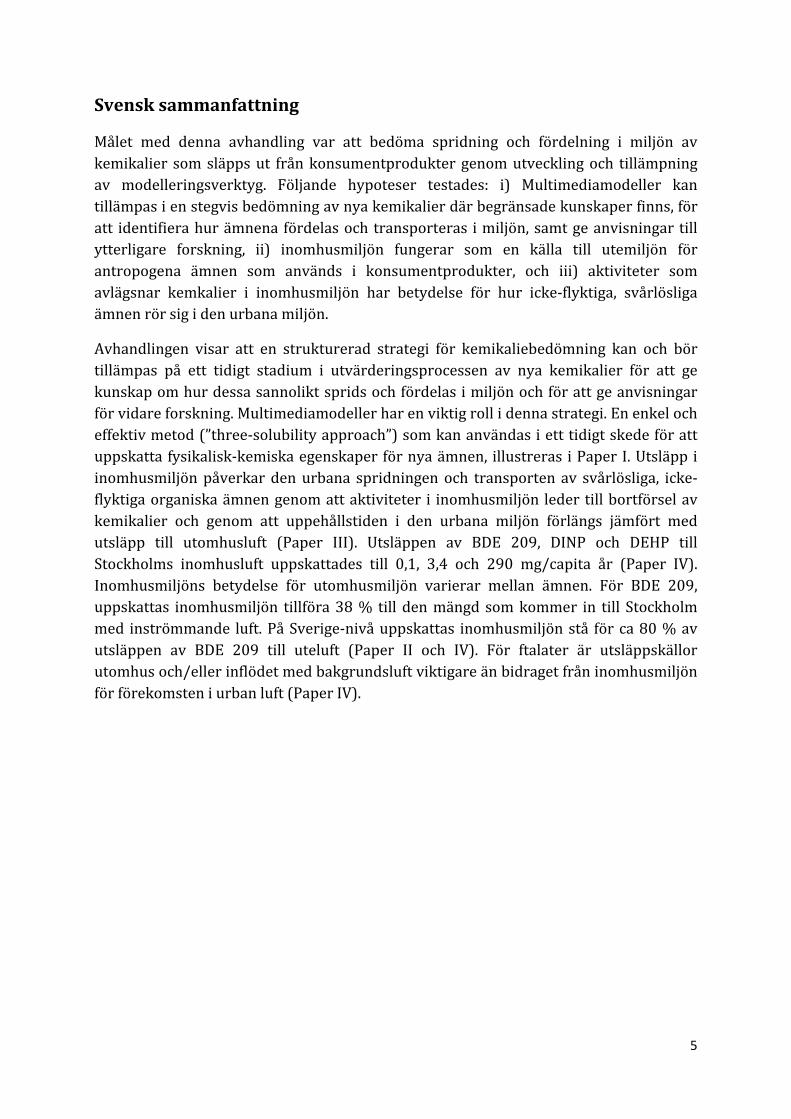
Svensksammanfattning
Målet med denna avhandling var att bedöma spridning och fördelning i miljön avkemikalier somsläppsut frånkonsumentproduktergenomutvecklingoch tillämpningav modelleringsverktyg. Följande hypoteser testades: i) Multimediamodeller kantillämpasienstegvisbedömningavnyakemikalierdärbegränsadekunskaperfinns,föratt identifierahurämnenafördelasochtransporteras imiljön,samtgeanvisningartillytterligare forskning, ii) inomhusmiljön fungerar som en källa till utemiljön förantropogena ämnen som används i konsumentprodukter, och iii) aktiviteter somavlägsnar kemkalier i inomhusmiljön har betydelse för hur icke‐flyktiga, svårlösligaämnenrörsigidenurbanamiljön.
Avhandlingen visar att en strukturerad strategi för kemikaliebedömning kan och börtillämpas på ett tidigt stadium i utvärderingsprocessen av nya kemikalier för att gekunskapomhurdessasannoliktspridsochfördelasimiljönochförattgeanvisningarförvidareforskning.Multimediamodellerharenviktigrollidennastrategi.Enenkelocheffektivmetod(”three‐solubilityapproach”)somkananvändasietttidigtskedeförattuppskatta fysikalisk‐kemiskaegenskaperförnyaämnen, illustreras iPaperI.Utsläppiinomhusmiljönpåverkardenurbana spridningenoch transportenav svårlösliga, icke‐flyktigaorganiskaämnengenomattaktiviteter i inomhusmiljön ledertillbortförselavkemikalier och genom att uppehållstiden i den urbana miljön förlängs jämfört medutsläpp till utomhusluft (Paper III). Utsläppen av BDE 209, DINP och DEHP tillStockholms inomhusluft uppskattades till 0,1, 3,4 och 290 mg/capita år (Paper IV).Inomhusmiljöns betydelse för utomhusmiljön varierar mellan ämnen. För BDE 209,uppskattas inomhusmiljön tillföra38% till denmängd somkommer in till Stockholmmed inströmmande luft.PåSverige‐nivåuppskattas inomhusmiljönstå förca80%avutsläppen av BDE 209 till uteluft (Paper II och IV). För ftalater är utsläppskällorutomhusoch/ellerinflödetmedbakgrundsluftviktigareänbidragetfråninomhusmiljönförförekomsteniurbanluft(PaperIV).
6
Listofpapers
Thisthesisisbasedonthefollowingpapers,referredtointhetextbytheirRomannumerals:
I PalmA,CousinsI.T.,MackayD,TysklindM,MetcalfeC,AlaeeM.2002.Assessingtheenvironmentalfateofchemicalsofemergingconcern:Acasestudyofthepolybrominateddiphenylethers.EnvironmentalPollution,117(2),pp195‐213
II BjörklundJ.A.,ThuressonK.,CousinsAP.,SellströmU.,EmeniusG.,deWit,C.2012.Indoorairisasignificantsourceoftri‐decabrominateddiphenyletherstooutdoorairviaventilationsystems.EnvironmentalScience&Technology,46(11),pp5876–5884
III CousinsA.P.2012.Theeffectoftheindoorenvironmentonthefateoforganicchemicalsintheurbanlandscape.ScienceoftheTotalEnvironment,438,pp233‐241
IV CousinsA.P.,HolmgrenT.,RembergerM.EmissionsoftwophthalateestersandBDE209toindoorairandtheirimpactonurbanairquality.(manuscript)
PaperIwasreproducedwithpermissionfromElsevier,PaperIIwasreproducedwithpermission from the American Chemical Society andPaper III was reproduced withpermissionfromElsevier
7
Statement
I,AnnaPalmCousins,madethefollowingcontributionstothepaperspresentedinthisthesis:
PaperI
I was responsible for data acquisition and performed the calculations of chemicalproperties and emissions. I did the model calculations and I took the lead role inauthoringthepaper.
PaperII
IwasresponsibleforcalculatingemissionstoairfromotherthanindoorsourcesusingsubstanceflowanalysismethodologyandIassistedinwritingthepaper.
PaperIII
Iplannedthestudy,developedthemodel,didallthecalculationsandwrotethepaper.
PaperIV
Iwasinvolvedinplanningtheprojectapartfromtheemissionexperiments.Iperformedthemodelcalculations,thedataevaluationandtheuncertaintyanalysis,andItooktheleadroleinauthoringthepaper.
8
TableofContentsList of abbreviations ................................................................................................................................ 9
Objectives .............................................................................................................................................. 10
1 Introduction ................................................................................................................................... 11
1.1 Human exposure to environmental pollutants – historical background .............................. 11
1.2 Urban chemical accumulation ............................................................................................... 11
1.3 Multimedia Fate Models as tools for assessing chemical fate .............................................. 12
1.4 Challenges in assessing the fate of chemicals released from consumer products ............... 13
2 Methods ........................................................................................................................................ 15
2.1 Study substances ................................................................................................................... 15
2.2 The six‐stage strategy ............................................................................................................ 15
2.3 Estimating physical‐chemical properties of emerging chemicals ......................................... 16
2.4 Estimating emissions of chemicals released from consumer products ................................ 17
2.5 Evaluative fate assessment ................................................................................................... 18
2.6 Regional and local – scale fate assessment ........................................................................... 18
3 Overall results and discussion ....................................................................................................... 20
3.1 Physical‐chemical properties ................................................................................................. 20
3.2 Emissions ............................................................................................................................... 24
3.3 Evaluative fate assessment ................................................................................................... 27
3.4 Regional and local‐scale fate assessment ............................................................................. 31
3.4.1 Influence of the indoor environment on chemical fate in urban centres ..................... 31
4 Conclusions .................................................................................................................................... 32
5 Future challenges .......................................................................................................................... 33
6 Acknowledgements ....................................................................................................................... 35
7 References ..................................................................................................................................... 37
9
Listofabbreviations
2,4,6‐TBP 2,4,6‐tribromophenol
BDE47 2,3,4,6‐tetrabromodiphenylether
BDE209 Decabromodiphenylether
BFR Brominatedflameretardant
CTD Characteristictraveldistance
DEHP Diethylhexylphthtalate
DINP Diisononylphthalate
EPIWIN EstimationprogramsinterfacesuiteforWindows
EQC Equilibriumcriterionmodel
EURAR EUriskassessmentreport
KAW Air‐waterpartitioncoefficient
KOA Octanol‐airpartitioncoefficient
KOW Octanol‐waterpartitioncoefficient
MFM Multimediafatemodel
PBDE Polybrominateddiphenylether
pentaBDE pentabrominateddiphenylether,commercialmixture
PSL Sub‐cooledliquidvapourpressure
PSS Solidphasevapourpressure
PVC Polyvinylchloride
QSPR Quantitativestructurepropertyrelationship
SA Solubilityinair
SFA Substanceflowanalysis
SMURF Stockholmmultimediaurbanfatemodel
SO Solubilityinoctanol
SVOC Semivolatileorganicchemical
SW Solubilityinwater
TaPL3 TransportandpersistencelevelIIImodel
VOC Volatileorganicchemical
10
ObjectivesThe overriding objectives of this thesis were to assess the environmental fate andtransportofchemicalsemitted fromconsumerproducts throughthedevelopmentandapplicationofmodellingtools.Thiswasperformedbytestingthefollowinghypotheses:i) Multimedia fate models can be applied in a multistage assessment process toemergingchemicalswherelimitedknowledgeexists,toidentifythelikelyenvironmentalfate and to direct further research; ii) the indoor environment acts as a source ofanthropogenicsubstancesemployedinconsumerproductstotheoutdoorenvironment;andiii)chemicalremovalpathwaysintheindoorenvironmentareimportantforthefateoforganicchemicalsindenselypopulatedareas.
ThespecificobjectivesofpapersI‐IVwere:
PaperI
Themainpurposeofthispaperwastodemonstrateasix‐stageassessmentprocessforevaluationof chemicalsof emerging concern.Theapproachwasdemonstrated for thepolybrominated diphenyl ethers (PBDEs), a class of chemical substances extensivelyused in consumerproducts, forwhich the knowledge onproperties, sources, fate andeffectsatthetimeofwriting(2001)waslimited.
PaperII
Themain objective of this paperwas to investigate the importance of indoor air as asourceofPBDEstourbanoutdoorair.
PaperIII
The main objective of this paper was to evaluate the influence of the indoorenvironmentonthefateoforganicchemicalsindenselypopulatedareasbydevelopingamodellingtoolwhichincorporatestheindoorenvironmentasaconstituentoftheurbanenvironment.Theobjectivewasalsotoidentifykeytransportpathwaysandtostudytheconditionsunderwhichthesepathwaysareimportant.
PaperIV
ThemainobjectiveofthispaperwastoapplythemodeldevelopedinPaperIIItoassesswhetherrealistic,measurementbasedemissionestimatestoindooraircanexplaintheoccurrence of BDE 209 and two phthalate esters in the indoor environment and toassesshowsuchemissionscontributetourbanoutdoorairpollution.
11
1 Introduction
1.1 Humanexposuretoenvironmentalpollutants–historicalbackgroundHistorically,organicchemicalswerereleasedfromindustrialprocesseswithoutfurthertreatmentofairexhaustsorwastewatereffluents (dioxins,PAHs,PCBs,biocides).Theadverse environmental impact was sometimes immediate and obvious. This led toextensive regulatory measures, eventually resulting in the strict control programs ofindustrial chemical emissions thatwe see today. In addition, specific substanceswerealso banned or severely regulated. For example, as a result of their persistence,bioaccumulation,andlong‐rangetransportpotential,chemicalssuchasPCBs,DDTandHCHare today listed for a global restriction/banunder theStockholmConvention forPersistentOrganicPollutants(HagenandWalls,2005).
Regulatory actions to reduce emissions may affect human exposure to industrialchemicals. Swedish biomonitoring studies using human milk show declining trendssincetheearly70’sofindustrialsemivolatileorganicchemicals(SVOCs)thathavebeensubject to strict regulations. Examples of such SVOCs are polychlorinated biphenyls(PCBs), dioxins and some pesticides. Meanwhile, levels of others, e.g. thepolybrominateddiphenylethers(PBDEs),increaseduntilthelate90’s(Fängströmetal.,2008; Solomon andWeiss, 2002). Since 2000, the levels of lower brominated PBDEsappear to have declined whereas higher brominated congeners continued to rise(Fängström et al., 2008). This is possibly a result of the European ban of lowerbrominated BDEs. In 2005, theWorldWildlife Fund published a biomonitoring studywherewomen’sbloodfromthreegenerationsof13familiesacrossEuropewasanalyzedfor 107 different industrial chemicals (WWF, 2005). This study observed a changingchemical pattern from old to young, where the blood of the younger generationwascontaminated with “modern” chemicals commonly applied in everyday consumerproducts.Thebloodoftheoldergenerationcontainedalargernumberofchemicals,butmainlyrestrictedorbannedsubstances,suchasPCBs,DDTsetc.Itwasstrikingthatthechildren’sbloodwasalsocontaminatedwithPCBs,althoughtheywerebornyearsafterthebanwasintroduced.Since1999,theU.S.NationalHealthandNutritionExaminationSurvey(NHANES)haveregularlymonitoredenvironmentalpollutantsinhumantissuesin the North American population. These surveys indicate widespread occurrence ofindustrial organic chemicals (e.g. PBDEs, bisphenol A and PFOA) across the NorthAmerican population. Altogether, these biomonitoring studies show that despite ourefforts to, sometimes effectively,minimize chemical pollution from industrial sourcesand regulate theuseofproblematic substances,humanexposure to industrialorganicchemicalsstilloccurs.
1.2 UrbanchemicalaccumulationOneexplanationforthecontinuedexposuretoindustrialorganicchemicalsisthat–inlinewith technical development andmaterial refinement –more synthetic functionalchemicals have come into use. The increased economic well‐being in modern anddevelopingsocietieshasledtoanincreasingdemandformodernelectronicequipment,
12
plasticpolymers, clothing, andbuildingmaterials. Forexample, theglobaldemand forpolymersforelectricalandelectronicapplications isexpectedto increaseatanannualgrowth rate of 6.9% from 15.6 Mtons in 2011 to over 23 Mtons in 2017(www.plastemart.com).Thishasresultedinproductionandapplicationofthousandsofnewchemicalswhichareincorporatedineverydayconsumerarticles.Ashumanstendtoclusterincities,consumerarticlesandtherebychemicalsincorporatedinthemtendtoalsoaccumulateintheseareas.Manyofthechemicalsoccurinthearticlesasresiduesor additives, and may be released from these throughout the product lifetime. As aresult,exposuretosuchchemicalsmaynotprimarilyoccurattheindustrialsitewheretheyareproduced,butratherwheretheyareused.Exposuremayalsooccurindirectlythroughcontactwithoringestionofe.g.indoordustorbiologicalmatriceswherethesechemicals have ended up. The exposure to organic chemicals of anthropogenic originmaybeofparticularlyhighconcerninurbanareasbecauseofthehigherconcentrationofproductsandgoods.
Ultimately,exposureofhumansandwildlifetoanthropogenicsubstanceswithpotentialnegative health effects should be avoided. Biomonitoring studies are helpful inmeasuringexposurethathasalreadytakenplace,butothertoolsareneededtoassessfuture exposure as well as exposure that cannot be readily measured. An integratedanalysis of the implications for human exposure of chemical release pathways,properties and partitioning behaviour as well as environmental properties requiresinstruments that take all these aspects into consideration. This has led to thedevelopment of multimedia fate models (MFMs) (Mackay, 2001; Wania and Mackay,1999),whichhavenowbeeninuseformorethan30years(Buseretal.,2012).
1.3 MultimediaFateModelsastoolsforassessingchemicalfateMFMsarecomputerbasedtoolsthatutiliseknowledgeofchemicalproperties,releases,transportpathways,andenvironmentalpropertiestocalculateconcentrationsintargetenvironmentalmedia.Thesecanbeusedinachemicalexposureand/orriskassessment.MFMshavebeenusedfordecadestoestimatechemicaltransportandfateondifferentgeographical scales to assist in decision making and risk assessment, to identifyvulnerableriskgroups,andtoprioritizechemicalsforregionalmonitoringorregulatorymeasures. MFMs strive to mimic the nature of a defined environmental system in asimplified manner but with enough complexity to produce realistic estimates ofenvironmental concentrations.MFMscanalsobeused topredict chemicalpersistenceand response time to changes in release and/or environmental conditions.CompartmentsusuallyincludedinMFMsareair,water,soil,andsediment,butalsosub‐compartmentssuchasparticles, interstitialwater,orairmayalsobedefined(Mackay,2001). Depending on the purpose of the model, some MFMs include multiplecompartment layers and/or vegetation (e.g. Bennett et al. (1998); Cahill andMackay(2003);McKoneandBennett(2003)). MFMshavealsobeendevelopedspecificallyforurbanenvironments,oneof themajordifferences to thegenericenvironmentalMFMsbeingtheincorporationofimpervioussurfaces(Diamondetal.,2001;Prevedourosetal.,2008).More recently, indoor chemical fatemodels have been developed to study the
13
indoorfateofpesticides(BennettandFurtaw,2004)andPBDEs(Zhangetal.,2009)andthe resulting implications for human exposure, thus providing a first step towardsindoorMFMsforapplicationtochemicalsused inconsumerproducts.However, fewifanyattemptshavebeenmadetospecificallyaddressthelinkagebetweentheindoorandtheurbanoutdoorenvironment,anditsimplicationsforchemicalfateandexposure.
1.4 Challengesinassessingthefateofchemicalsreleasedfromconsumerproducts
Assessingthefateandexposureofchemicals inconsumerproductsposesanumberofchallenges to theenvironmentalmodeller.This isespecially trueatearlystages in theassessmentprocess,whenlimitedknowledgeexistsregardingpropertiesandemissions,and for chemicals with no clear “point sources”. Three main challenges are outlinedbelow:
1) Physical‐chemicalproperties.Emergingchemicalsincorporatedinnewconsumerproducts are often poorly characterised regarding their physical‐chemicalproperties. In some cases where the knowledge exists, it may be restricted toproducingcompaniesthatdonotdisclose ittothegeneralpublic.Thiscanbeamajorhindrancetoindependentexposureassessment.
2) Quantificationof emissions.Emission sources of chemicals applied in consumerproductsareoftenmultipleanddiffuseandthusdifficulttoquantify.AspointedoutbyWaniaandMackay(1999),eventhebestemissionestimatesofchemicalswithlimitedandspecificapplications,suchaspesticides,arehighlyuncertainandcan vary by orders ofmagnitude. For chemicals that havemultiple and varieduses,thisisnaturallyevenmoredifficult.Ifthechemicalis“new”onthemarket,the actual emission sources may also be poorly identified. Furthermore, intoday’s age of global trade, chemicals are usually imported, and they are oftenalready incorporated in finishedarticles.Thevolumesof chemicals inproductsenteringacertainregionareoftenunknown, limitingthepossibilitytoquantifychemicalstocksandemissions.
3) Release and transport pathways. Many modern chemicals are applied in andpotentially released from articles used in the indoor environment, leading tohumanexposureand/or further transport to theoutdoor environment. Studiesaddressingindoor/outdoorconcentrationratioshaveindicatedapotentialoftheindoorenvironmenttoactasasourcetothelocaloutdoorenvironment(Buttetal., 2003; Jamshidi et al., 2007; Shoeib et al., 2004; Shoeib et al., 2005).Subsequent transport from the local to the regional environment has beenillustratedinstudiesmeasuringurban‐rural‐gradientsofSVOCs(Buttetal.,2003;Gouin et al., 2005;Harner et al., 2004;Wong et al., 2009). Detailed knowledgeabout the chemical’s uses is therefore needed to properly determine thedominantreleaseandtransportpathways.
The state‐of the‐art in local and regional scale chemical risk assessment is to assignemissions to air, water or soil (ECB, 2002; ECB, 2003; ECB, 2008a; ECB, 2008b).
14
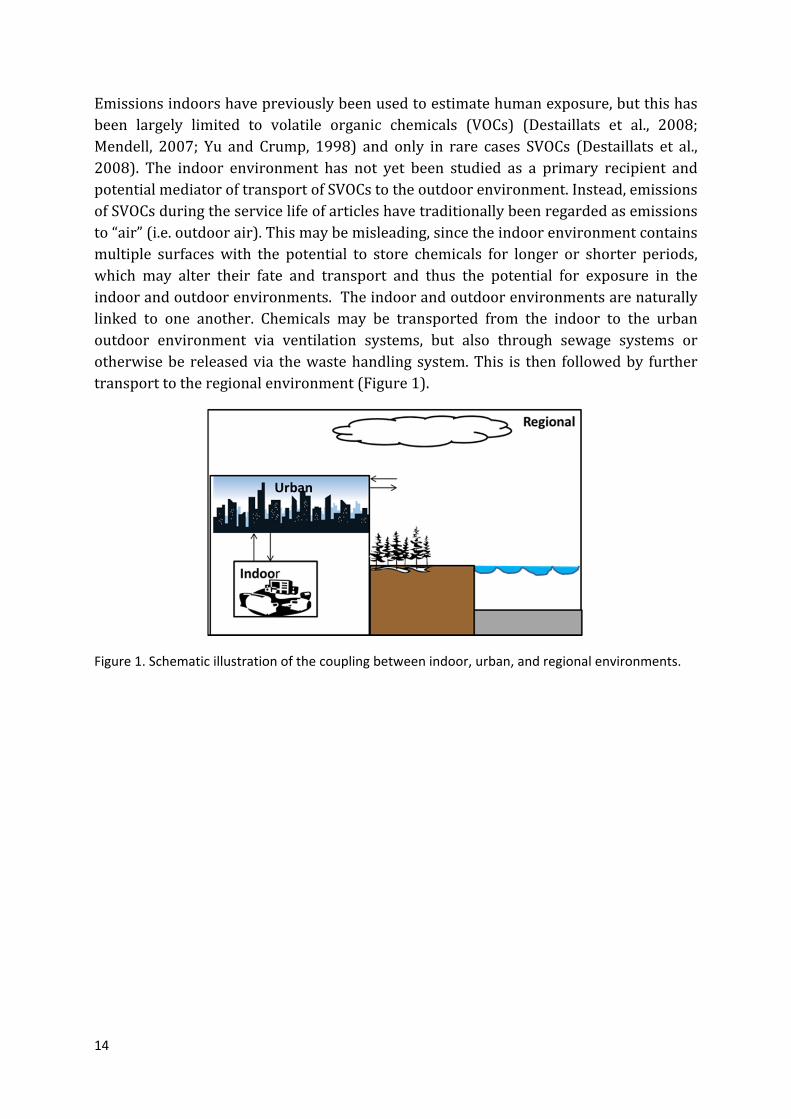
Emissionsindoorshavepreviouslybeenusedtoestimatehumanexposure,butthishasbeen largely limited to volatile organic chemicals (VOCs) (Destaillats et al., 2008;Mendell, 2007; Yu and Crump, 1998) and only in rare cases SVOCs (Destaillats et al.,2008). The indoor environment has not yet been studied as a primary recipient andpotentialmediatoroftransportofSVOCstotheoutdoorenvironment.Instead,emissionsofSVOCsduringtheservicelifeofarticleshavetraditionallybeenregardedasemissionsto“air”(i.e.outdoorair).Thismaybemisleading,sincetheindoorenvironmentcontainsmultiple surfaceswith the potential to store chemicals for longer or shorter periods,which may alter their fate and transport and thus the potential for exposure in theindoorandoutdoorenvironments.Theindoorandoutdoorenvironmentsarenaturallylinked to one another. Chemicals may be transported from the indoor to the urbanoutdoor environment via ventilation systems, but also through sewage systems orotherwisebe releasedvia thewastehandlingsystem.This is then followedby furthertransporttotheregionalenvironment(Figure1).
Figure 1. Schematic illustration of the coupling between indoor, urban, and regional environments.
15
2 Methods
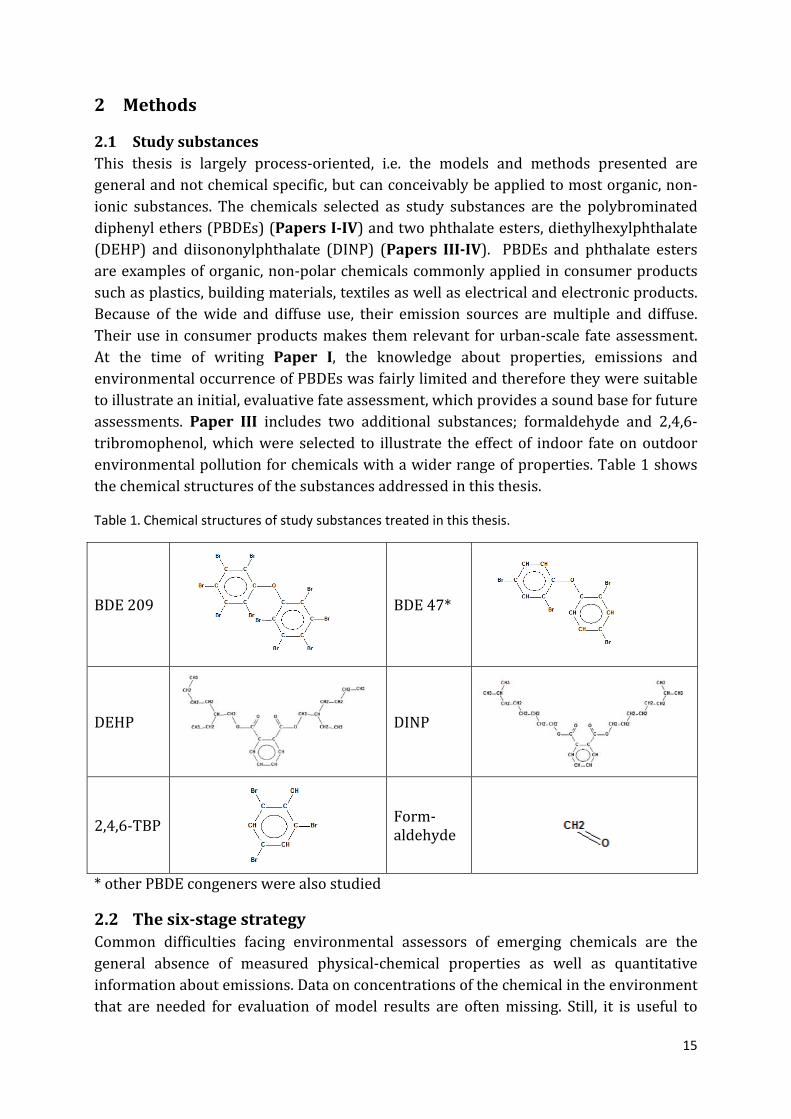
2.1 StudysubstancesThis thesis is largely process‐oriented, i.e. the models and methods presented aregeneralandnotchemicalspecific,butcanconceivablybeappliedtomostorganic,non‐ionic substances. The chemicals selected as study substances are the polybrominateddiphenylethers(PBDEs)(PapersI‐IV)andtwophthalateesters,diethylhexylphthalate(DEHP) and diisononylphthalate (DINP) (Papers III‐IV). PBDEs and phthalate estersareexamplesoforganic,non‐polarchemicalscommonlyappliedinconsumerproductssuchasplastics,buildingmaterials,textilesaswellaselectricalandelectronicproducts.Because of thewide and diffuse use, their emission sources aremultiple and diffuse.Theiruse inconsumerproductsmakes themrelevant forurban‐scale fateassessment.At the time of writing Paper I, the knowledge about properties, emissions andenvironmentaloccurrenceofPBDEswasfairlylimitedandthereforetheyweresuitabletoillustrateaninitial,evaluativefateassessment,whichprovidesasoundbaseforfutureassessments. Paper III includes two additional substances; formaldehyde and 2,4,6‐tribromophenol,whichwere selected to illustrate theeffect of indoor fateonoutdoorenvironmentalpollutionforchemicalswithawiderrangeofproperties.Table1showsthechemicalstructuresofthesubstancesaddressedinthisthesis.
Table 1.Chemical structures of study substances treated in this thesis.
BDE209 BDE47*
DEHP DINP
2,4,6‐TBPForm‐aldehyde
*otherPBDEcongenerswerealsostudied
2.2 Thesix‐stagestrategyCommon difficulties facing environmental assessors of emerging chemicals are thegeneral absence of measured physical‐chemical properties as well as quantitativeinformationaboutemissions.Dataonconcentrationsofthechemicalintheenvironmentthat are needed for evaluation ofmodel results are oftenmissing. Still, it is useful to
16
perform early assessments with limited information, as they can identify keyweaknesses in theknowledgebaseandgive importantdirections to furtherstudies tostrengthen it.PaperI illustratesasix‐stagestrategy todo this,originallyproposedbyMackay and co‐workers (Mackay et al., 1996a; Mackay et al., 1996b; Mackay et al.,1996c;MacLeodandMackay,1999),byapplyingit tothePBDEs,which,at thetimeofpublishing were fairly “new” in an environmental context. The six assessment stagesinclude:
1) Chemicalclassificationanddeterminationofproperties2) Acquisitionofdischargeoremissiondataandenvironmentalconcentrations3) Evaluativeassessmentofthelikelybehaviourofthechemicalintheenvironment4) Regionalor“far‐field”evaluationoffate,toestimateregionalfateand
concentrations,withvalidationwherepossible5) Localornear‐fieldevaluationoffate,toestablishbehaviourandconcentrations
inhighlyexposedlocalities,againwithvalidationwherepossible;and6) Comparisonoftheseestimatedandobservedconcentrationswitheffectorno‐
effectlevels.
Theworkpresentedinthisthesisfocussedonthefirstfivestages,whichareaddressedtovariousextentsthroughoutthethesis.
2.3 Estimatingphysical‐chemicalpropertiesofemergingchemicalsPhysical‐chemical properties of emerging pollutants are seldom reported in theliterature, and lack of pure compounds may hinder property determination. Forchemicals belonging to a homologue series, such as the PBDEs and phthalate esters,propertydata reported for someof the substanceswithin the series canbeused as abasis to estimate properties for other substances within the same group. This isachieved through the application of a quantitative structure‐property relationship(QSPR)method.Theso‐called“threesolubilityapproach”providesasystematicschemewhere QSPRs are used to relate physical‐chemical properties to environmentalpartitioning and to generate internally consistent estimates of key partitioningparameters. It was originally developed and applied to the chlorobenzenes (Cole andMackay,2000)andlatertothephthalateesters(CousinsandMackay,2000).InPaperI,itwasappliedtothePBDEs.
In brief, the three solubilities (mol/m3): SA in air, SW in water and SO in octanol arecalculatedasfollows:
SA=PSL/RT; (1) SW=WS/MF; (2)SO=KOWSW (3)
HereRisthegasconstant(8.314Pam3/Kmol),Tisthetemperature(K),WSisthesolidsolubility in water (g/m3), M is molar mass (g/mol) and KOW is the octanol‐waterpartitioncoefficient.Finequation2isthefugacityratio,whichisestimatedfrom
17
LogF=‐6.79(TM‐T)/(2.303T) (4)
whereTMisthemeltingpointandTisthetemperatureofthesystem(Mackay,2001).PSLin equation 1 is the sub‐cooled liquid vapor pressure (Pa),which is derived from thesolidvaporpressurePSS(Pa)andthefugacityratioFthrough
PSL=PSs/F (5)
By calculating solubilities based on all available reported data and correlating themagainstamoleculardescriptor,inthiscasetheLeBasmolarvolume(Reidetal.,1987),best‐estimates of the three solubilities can be derived for the entire chemical group.Fromthese,thekeypartitioncoefficientsKOW,KAWandKOAwerederived.
2.4 EstimatingemissionsofchemicalsreleasedfromconsumerproductsEmission estimates have been amajor question throughout this thesis. Four differentmethodswereapplied:
a) Population‐basedextrapolationofanationalsubstance‐flowanalysis(SFA)studycombined with industrial and technical information for homologue‐specificreleaseestimates(PBDEs,PaperI).
b) Region‐specific SFA calculations (PBDEs, Paper II). This usually considersemissionsfromproductsaswellaspotentialindustrialsources.
c) Inverse multimedia fate modelling, i.e. tuning emissions to fit the model’spredictions of concentrations in environmental media to environmentalmonitoringdata(PBDEs+phthalateesters,PaperIV)
d) Experimentalmeasurementsofsource‐specificreleaserates(PBDEs+phthalateestersPaperIIandIV).Thismethodcanbeusedonitsownorasacomponentinmethodb.
In Paper I, emissions of PBDEs were estimated based on a Danish substance flowanalysisofbrominatedflameretardantsasagroup(Lassenetal.,1999).NoemissionsoftechnicalproductsorspecificcongenerswerepresentedintheDanishstudy.TechnicalandindustryinformationonmarketsharesofdifferentBFRproductsweresoughtandthe general congener composition of these products was used to estimate per capitaemissions to air, water and soil. InPaper II, a region‐specific SFA was employed tocalculate emissions of PBDEs to outdoor air. Thiswas combinedwith new, empiricalmeasurementsofreleasesfromtheindoorenvironment.Theliteraturewassearchedforadditionalpotentialemissionsourcesandmeasuredemissionratesandtheoccurrenceof such sources in Sweden was investigated. One chemical for which emissions fromproducts(i.e.PVC)hasbeeninvestigatedinanumberofstudiesisDEHP(Afsharietal.,2004;Clausenetal.,2004;Clausenetal.,2011;Clausenetal.,2010;Clausenetal.,2007).InPaperIV,similarmeasurementswereconductedforDINP.
18
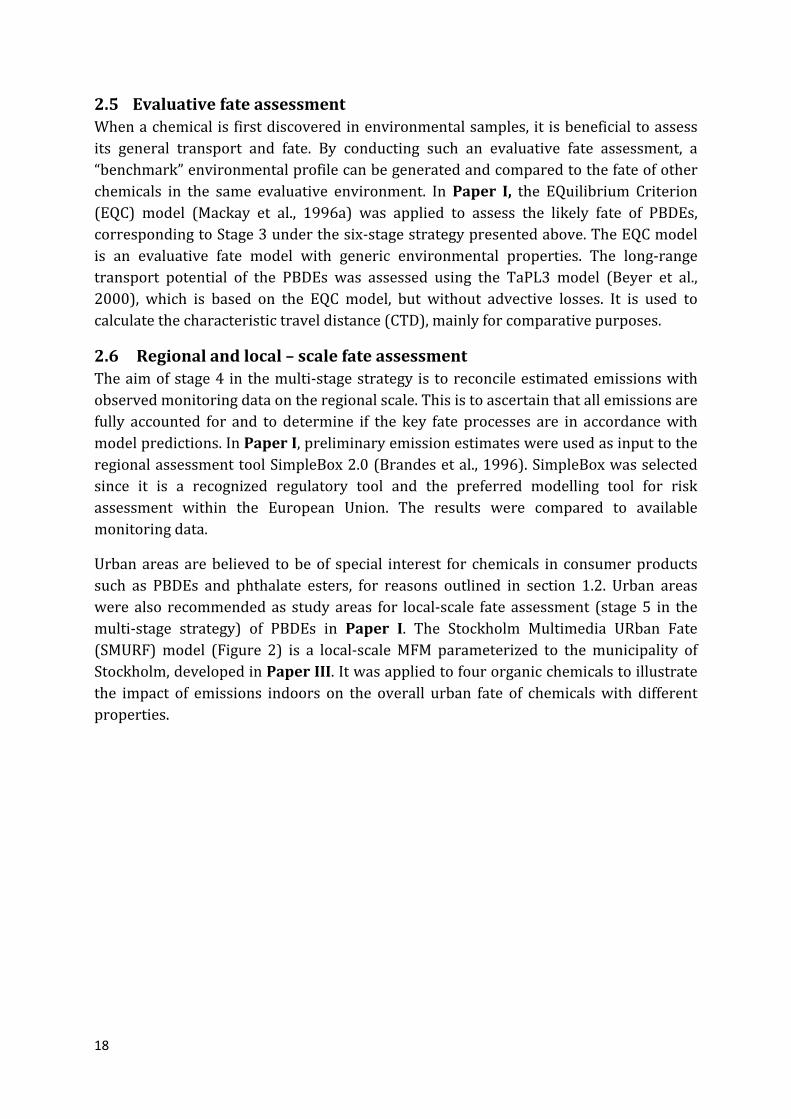
2.5 EvaluativefateassessmentWhenachemicalisfirstdiscoveredinenvironmentalsamples, it isbeneficialtoassessits general transport and fate. By conducting such an evaluative fate assessment, a“benchmark”environmentalprofilecanbegeneratedandcomparedtothefateofotherchemicals in the same evaluative environment. InPaper I, the EQuilibrium Criterion(EQC) model (Mackay et al., 1996a) was applied to assess the likely fate of PBDEs,correspondingtoStage3underthesix‐stagestrategypresentedabove.TheEQCmodelis an evaluative fate model with generic environmental properties. The long‐rangetransport potential of the PBDEs was assessed using the TaPL3 model (Beyer et al.,2000), which is based on the EQC model, but without advective losses. It is used tocalculatethecharacteristictraveldistance(CTD),mainlyforcomparativepurposes.
2.6 Regionalandlocal–scalefateassessmentTheaimofstage4 in themulti‐stagestrategy is toreconcileestimatedemissionswithobservedmonitoringdataontheregionalscale.Thisistoascertainthatallemissionsarefully accounted for and to determine if the key fate processes are in accordancewithmodelpredictions.InPaperI,preliminaryemissionestimateswereusedasinputtotheregionalassessmenttoolSimpleBox2.0(Brandesetal.,1996).SimpleBoxwasselectedsince it is a recognized regulatory tool and the preferred modelling tool for riskassessment within the European Union. The results were compared to availablemonitoringdata.
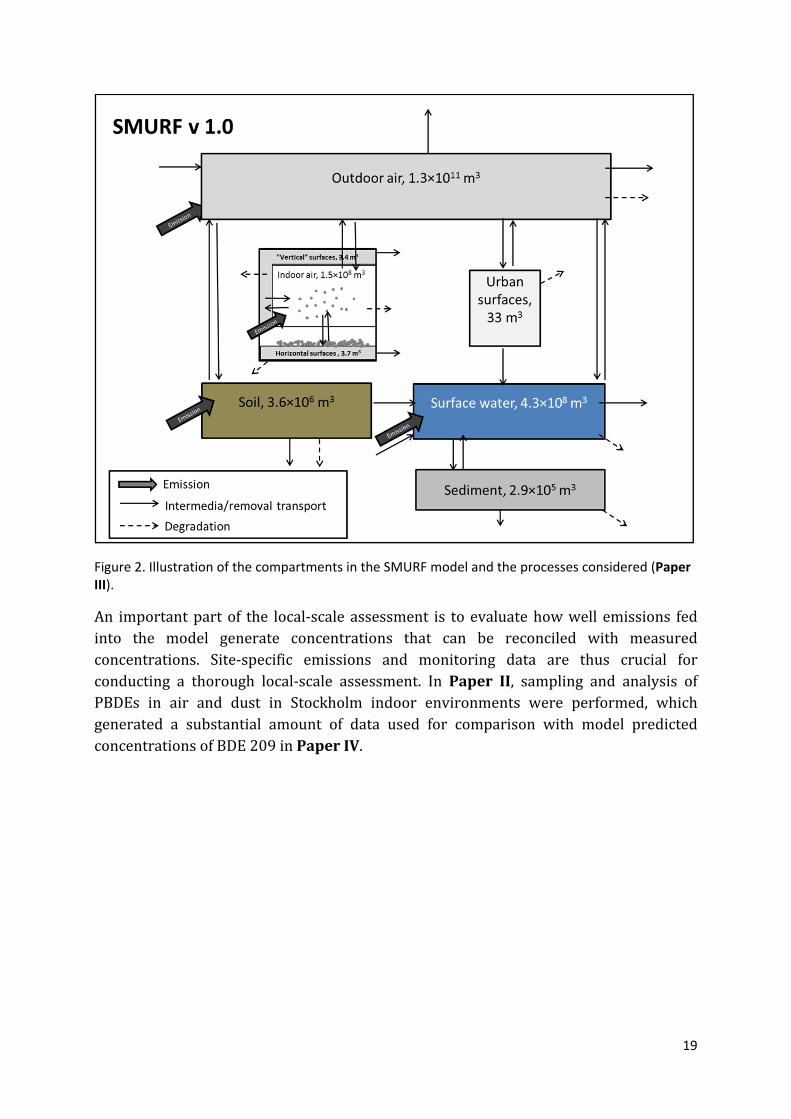
Urbanareasarebelieved tobeof special interest for chemicals in consumerproductssuch as PBDEs and phthalate esters, for reasons outlined in section 1.2. Urban areaswerealso recommendedas studyareas for local‐scale fate assessment (stage5 in themulti‐stage strategy) of PBDEs in Paper I. The Stockholm Multimedia URban Fate(SMURF)model (Figure 2) is a local‐scaleMFM parameterized to themunicipality ofStockholm,developedinPaperIII.Itwasappliedtofourorganicchemicalstoillustratethe impact of emissions indoors on the overall urban fate of chemicalswith differentproperties.
19
Figure 2. Illustration of the compartments in the SMURF model and the processes considered (Paper III).
An importantpartof the local‐scale assessment is to evaluatehowwell emissions fedinto the model generate concentrations that can be reconciled with measuredconcentrations. Site‐specific emissions and monitoring data are thus crucial forconducting a thorough local‐scale assessment. In Paper II, sampling and analysis ofPBDEs in air and dust in Stockholm indoor environments were performed, whichgenerated a substantial amount of data used for comparison with model predictedconcentrationsofBDE209inPaperIV.
20
3 Overallresultsanddiscussion
3.1 Physical‐chemicalpropertiesOne of the innovative elements of Paper I was the application of the three‐solubilityapproach to estimate the physical‐chemical properties of the PBDEs. Using theinformationavailable in the literature,correlationsbetweenthesolubilities inair (SA),water(SW),andoctanol(SO)(mol/m3)ontheonehandandtheLeBasmolarvolumes(V,cm3/mol)ontheotherwereobtained:
log(SA)=3.5737–0.035V,r2=0.84,SE=0.64 (6)
log(SW)=7.9418–0.044V,r2=0.95,SE=0.45 (7)
log(SO)=5.4075–0.012V,r2=0.36,SE=0.67 (8)
Fromequations(6)to(8)theequationsforthepartitioncoefficientswerederived:
logKOW=log(SO)–log(SW)=‐2.5343+0.032V (9)
logKAW=log(SA)–log(SW)=‐4.3681+0.009V (10)
logKOA=log(SO)–log(SA)=1.8338+0.023V (11)
where KOW, KAW and KOA are the octanol‐water, air‐water and octanol‐air partitioncoefficients,respectively.
These preliminary property correlations inPaper Ihave stood upwell to the test oftime, as the later discussion will show. Some of the uncertainties were due to thenecessity of using property estimates derived from commercially available softwaretools, because of the scarcity of experimental data. Estimated properties sometimesdiffered considerably from experimental values. This was particularly the case formeltingpointsused tocalculate fugacityratios. Inaddition, the fewexperimentaldataavailable were often in conflict. Uncertainties associated with solubilities in air andoctanolpropagatedthroughtotheestimatesofpartitioningcoefficients.
In the 10 years that followed after the publication of Paper I, more data and morerefined methods have become available. A comparison between the estimatedproperties derived from the equations in Paper I and three more recent studies isshowninFigure3anddiscussedbelow.
More measured data became available already at the time of or shortly after thepublicationofPaperI(e.g.Braekeveltetal.(2003);TittlemierandTomy(2001)).Thesewere used to update the initial estimates, whereby the majority of the softwaregenerateddatawereexcluded(CousinsandPalm,2003).Theupdatedcalculationsofthesub‐cooledliquidvapourpressurewerefairlysimilartotheoriginalestimatesinPaperI, (see Figure 3a), in particular for the lower brominated congeners. The sub‐cooledliquidsolubilityinwater(Figure3b)showedamarkedlyreduceddecreaseperbromine
21
added relative to the original estimates (0.49 compared to 1.03 log units inPaper I),althoughthedecreaseswerecomparableuptoabrominesubstitutionlevelofabout4.TheKOWwaspredictedtoincreaseby0.46logunitsperaddedbromine,thusshowingaflatter slope than in Paper I (0.75 log units per bromine added). The observeddiscrepancies between the two assessments, in particular for solubility inwater, alsoresultedinareverseintheslopeoftheKAW;fromanestimatedincreasewithincreasingsubstitution(Figure3ainPaperI)toadecreaseof0.35logunitsperbromineaddedinCousins andPalm (2003).Theupdatedproperties thus imply adecreasingpreferenceforpartitioningtoairrelativetowaterwithincreasingsubstitution,whichhasalsobeenobserved for other homologue series such as the chlorobenzenes (Cole and Mackay,2000)andthePAHs(deMaagdetal.,1998).Thestandarderrorsfortheregressionlineswere improvedbyabout0.1 logunits for thesolubilities inairandoctanolwhenonlyexperimental datawere used, but theywere similar to the original regression for thesolubilityinwater.
Wania and Dugani (2003) estimated the properties of the PBDEs using a similarapproach as in Paper I, with molecular weight as the descriptor. In addition, theyaccounted for the apparent uncertainty in the reported values by considering thestandarddeviationofcalculatedaveragesaswellasmeasurementuncertainty.Theyalsoadded an adjustment procedure (Beyer et al., 2002) to generate internally consistentproperties for use in the derivation ofQSPR equations. The resultingpropertieswereverysimilartotheupdatedvaluesderivedwiththethreesolubilityapproach(Cousinsand Palm, 2003). Consequently, the discrepancies between the Wania and Duganiestimates and the original estimates (Paper I) are similar to those described in thepreviousparagraph.
Braekevelt et al. (2003) derived a QSPR for estimating log KOW for PBDEs, based ondirectmeasurementsofthisproperty(Figure3c).Theseestimatesshowedanincreasingdiscrepancy from the estimates in Paper I with increasing level of substitution. Themaximaldifferenceof0.8logunitswasobservedforthedecabrominatedcongener.Forthedi‐tetrasubstitutedcongeners,thedifferenceswerelessthan0.4logunits.
Anevenmoresophisticatedapproachwas takenbyPapaetal. (2009).Theyused602different molecular descriptors to derive optimized QSPR models for Henry’s Lawconstant,meltingpoint,sub‐cooledliquidvapourpressure,watersolubility,logKOAandlog KOW of PBDEs. The trend of increasing vapour pressure with molar volume wassimilartothatinPaperI,andinmostcasesthecalculatedrangeofvapourpressuresperhomologuecoveredthesinglevalueinPaperI(Figure3a).Papaetal.(2009)foundanincreaseinlogKOWwithincreasingsubstitution,theslopebeingsimilartothatinPaperI,with amaximumdiscrepancyof 1.3 logunits forBDE209. For thewater solubility,however,theaveragedecreaseperbromineaddedwasonly0.22logunits,comparedto1.03 log units as estimated inPaper I. In addition, Papa et al. showed a considerablevariability in properties within a given homologue (e.g. up to nearly four orders ofmagnitudedifferenceinthewatersolubilityfordifferentpentabrominatedisomers).As
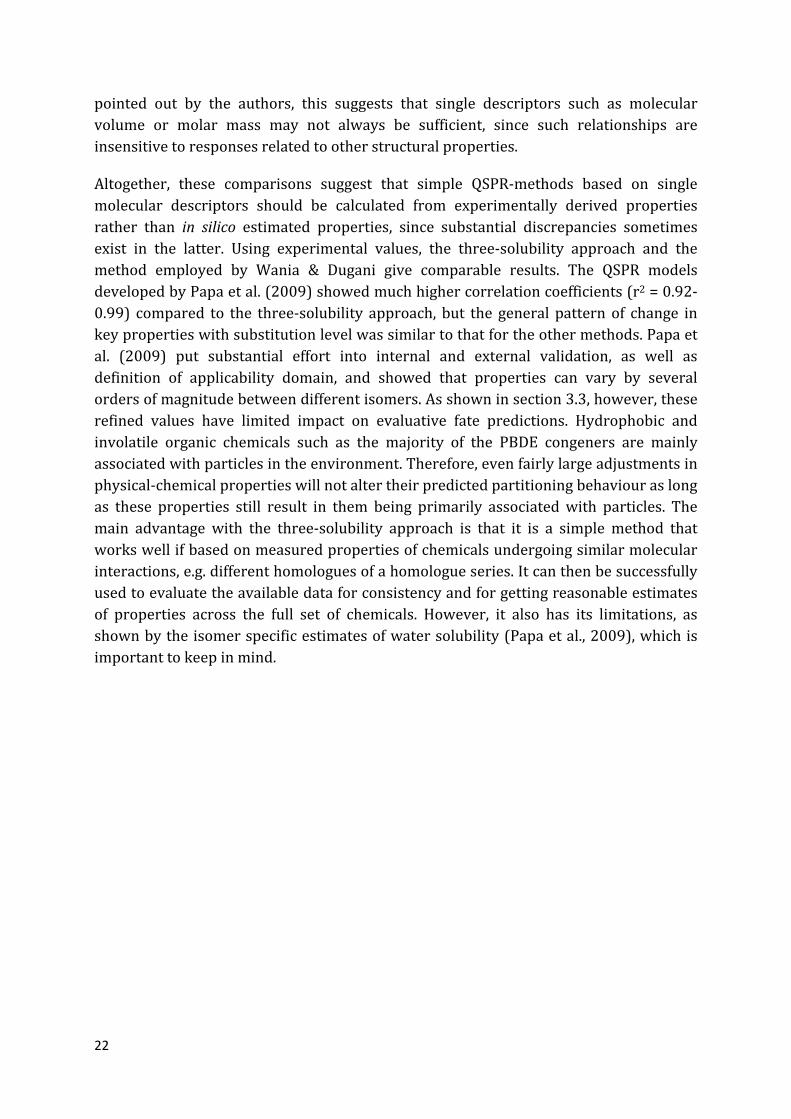
22
pointed out by the authors, this suggests that single descriptors such as molecularvolume or molar mass may not always be sufficient, since such relationships areinsensitivetoresponsesrelatedtootherstructuralproperties.
Altogether, these comparisons suggest that simple QSPR‐methods based on singlemolecular descriptors should be calculated from experimentally derived propertiesrather than in silico estimated properties, since substantial discrepancies sometimesexist in the latter. Using experimental values, the three‐solubility approach and themethod employed by Wania & Dugani give comparable results. The QSPR modelsdevelopedbyPapaetal.(2009)showedmuchhighercorrelationcoefficients(r2=0.92‐0.99) compared to the three‐solubility approach, but the general pattern of change inkeypropertieswithsubstitutionlevelwassimilartothatfortheothermethods.Papaetal. (2009) put substantial effort into internal and external validation, as well asdefinition of applicability domain, and showed that properties can vary by severalordersofmagnitudebetweendifferentisomers.Asshowninsection3.3,however,theserefined values have limited impact on evaluative fate predictions. Hydrophobic andinvolatile organic chemicals such as the majority of the PBDE congeners are mainlyassociatedwithparticlesintheenvironment.Therefore,evenfairlylargeadjustmentsinphysical‐chemicalpropertieswillnotaltertheirpredictedpartitioningbehaviouraslongas these properties still result in them being primarily associatedwith particles. Themain advantage with the three‐solubility approach is that it is a simple method thatworkswellifbasedonmeasuredpropertiesofchemicalsundergoingsimilarmolecularinteractions,e.g.differenthomologuesofahomologueseries.Itcanthenbesuccessfullyusedtoevaluatetheavailabledataforconsistencyandforgettingreasonableestimatesof properties across the full set of chemicals. However, it also has its limitations, asshownbytheisomerspecificestimatesofwatersolubility(Papaetal.,2009),whichisimportanttokeepinmind.
23
Figure 3.Comparison of estimated physical‐chemical properties (Log KOW, Log SW,L and Log PL, the subcooled liquid vapour pressure) of PBDEs in Paper I, to the later updated values (Cousins and Palm, 2003; Palm et al., 2004) applied in Paper IV and estimated values by Wania and Dugani (2003), Braekevelt et al. (2003) and Papa et al. (2009).
24
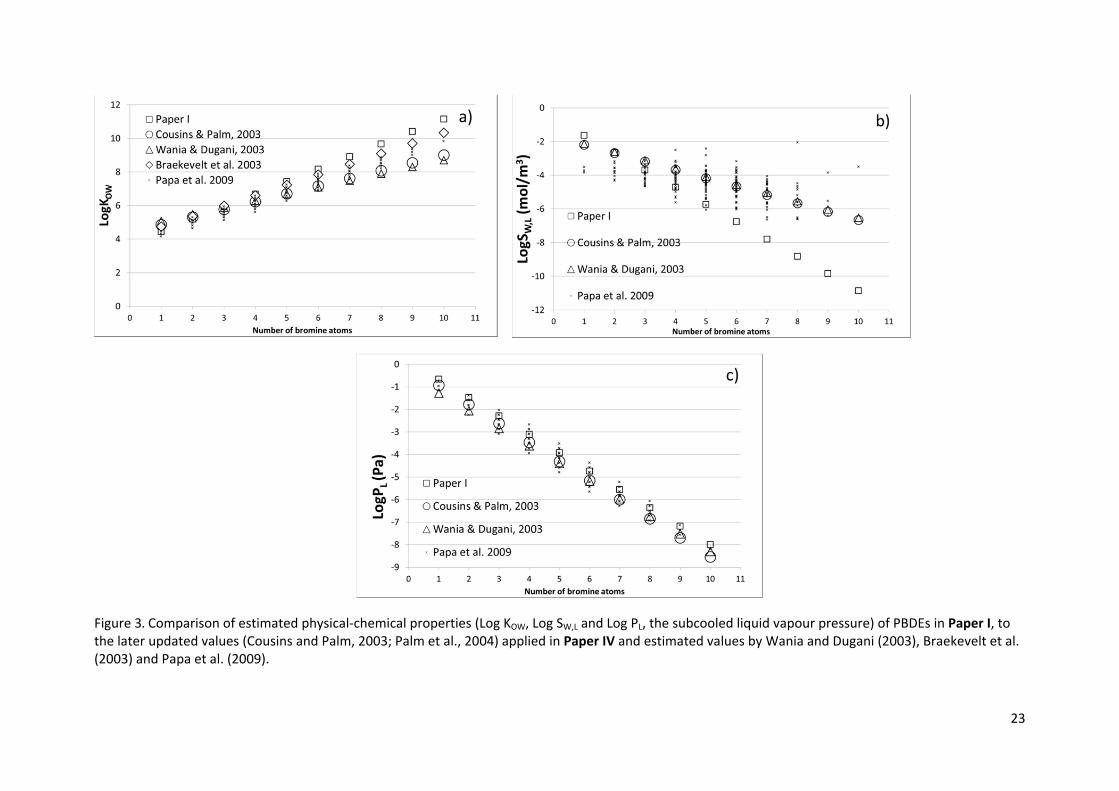
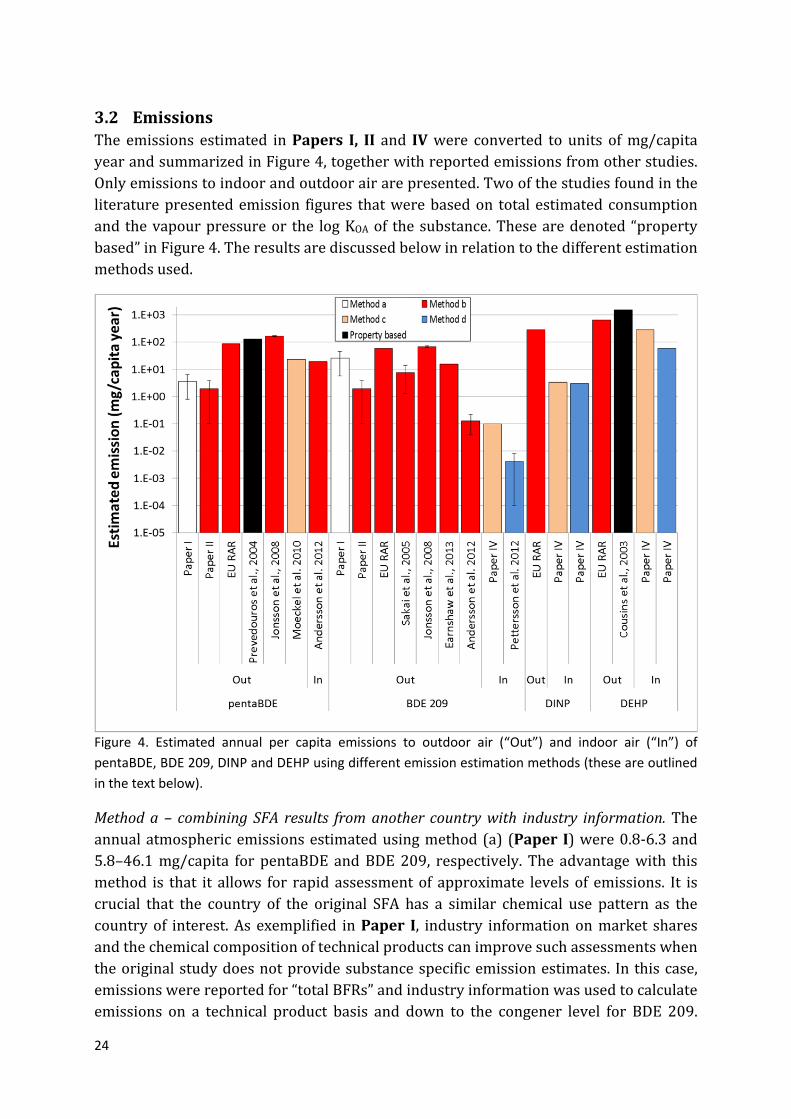
3.2 EmissionsThe emissions estimated inPapers I, IIand IVwere converted to units ofmg/capitayearandsummarizedinFigure4,togetherwithreportedemissionsfromotherstudies.Onlyemissionstoindoorandoutdoorairarepresented.Twoofthestudiesfoundintheliteraturepresentedemission figures thatwerebasedon totalestimatedconsumptionandthevapourpressureor the logKOAof thesubstance.Thesearedenoted“propertybased”inFigure4.Theresultsarediscussedbelowinrelationtothedifferentestimationmethodsused.
Figure 4. Estimated annual per capita emissions to outdoor air (“Out”) and indoor air (“In”) of
pentaBDE, BDE 209, DINP and DEHP using different emission estimation methods (these are outlined
in the text below).
Methoda–combiningSFA results fromanothercountrywith industry information. Theannualatmosphericemissionsestimatedusingmethod(a) (Paper I)were0.8‐6.3and5.8–46.1mg/capita for pentaBDE andBDE209, respectively. The advantagewith thismethod is that it allows for rapidassessmentof approximate levelsof emissions. It iscrucial that the country of the original SFA has a similar chemical use pattern as thecountryof interest.As exemplified inPaper I, industry informationonmarket sharesandthechemicalcompositionoftechnicalproductscanimprovesuchassessmentswhentheoriginalstudydoesnotprovidesubstancespecificemissionestimates. Inthiscase,emissionswerereportedfor“totalBFRs”andindustryinformationwasusedtocalculateemissions on a technical product basis and down to the congener level for BDE 209.
25
These firstemissionestimates liesomewhere in themiddleor in the lowerendof theestimatespresentedinlaterstudies(whitebarsinFigure4).
Methodb–region‐specificSFAstudies.InPaperII,aregion‐specificSFAwasconductedto quantify atmospheric releases of PBDEs in Sweden. The estimates for annualemissions to air were 0.35‐11 and 0.1‐3.8 mg/capita for pentaBDE and BDE 209,respectively. For pentaBDE this range was of a similar order of magnitude as theestimatefromPaperI,butforBDE209itwasafactorof10‐60lower.The10yearsthatpassedbetween the twostudiesshouldnothaveaffected theBDE209emissions.TheemissionsofBDE209arelikelytohavepeakedaround2004,andshouldbeaboutthesame order of magnitude in 2012 as in 2000 (Earnshaw et al., 2013). PentaBDEemissions,however,areexpectedtohavedeclinedsincethemid‐90s(Prevedourosetal.,2004),whichisnotreflectedinthetwoestimatesofPapersIandII.
Turningtotheliterature,foreachchemicalstudiedherethereareordersofmagnitudedifferencesbetweentheemissionestimatesindifferentstudiesthatappliedmethod(b)(Figure 4). There are several possible explanations for this. First, the European riskassessments (labelled EU RAR in Figure 4) were conducted so that the result is“conservative”, i.e. that emissions are rather over‐ than underestimated. This mayexplainwhy the EU RAR figures are among the highest. A second explanation is thatemissions can vary between different geographical regions. Therefore, normalising topopulationmaynotalwaysbeappropriate.Evenintheabsenceofproductionfacilities,variationsinactivitiessuchasrecycling,wastetreatment,combustionandaccumulationof consumer products may also give rise to different emission patterns. EmissionsgeneratedforSweden(PaperII)maythereforenotbedirectlycomparabletoemissionsgeneratedfortheEU(Earnshawetal.(2013);Anderssonetal.(2012)),Japan(Sakaietal. (2006))or Stockholm (Jonssonet al. (2008)).A thirdexplanation is that emissionsmaydifferbetweenyears.Earnshawetal.(2013)addressedthisbyapplyingadynamicSFAmodeltoenableassessmentofchangingemissionswithtime.Itwaspointedoutbythe authors that experimentally derived emission factors for release from consumerproducts andwastewere still lacking, rendering the estimates uncertain. Fourth andforemost, SFA studies are subjective by nature. They include multiple decisions andexpertjudgementsregardingthevalidityoftheunderlyingdataused.Apotentialsourcemaybesuspectedtoberelevant,butduetolackofinformationregardingemissionratesand activity, that source may be excluded or extrapolated from data sources of highuncertainty.Hencedifferent scientistsprovidedwith the same information foranSFAcanobtaindifferentresults.
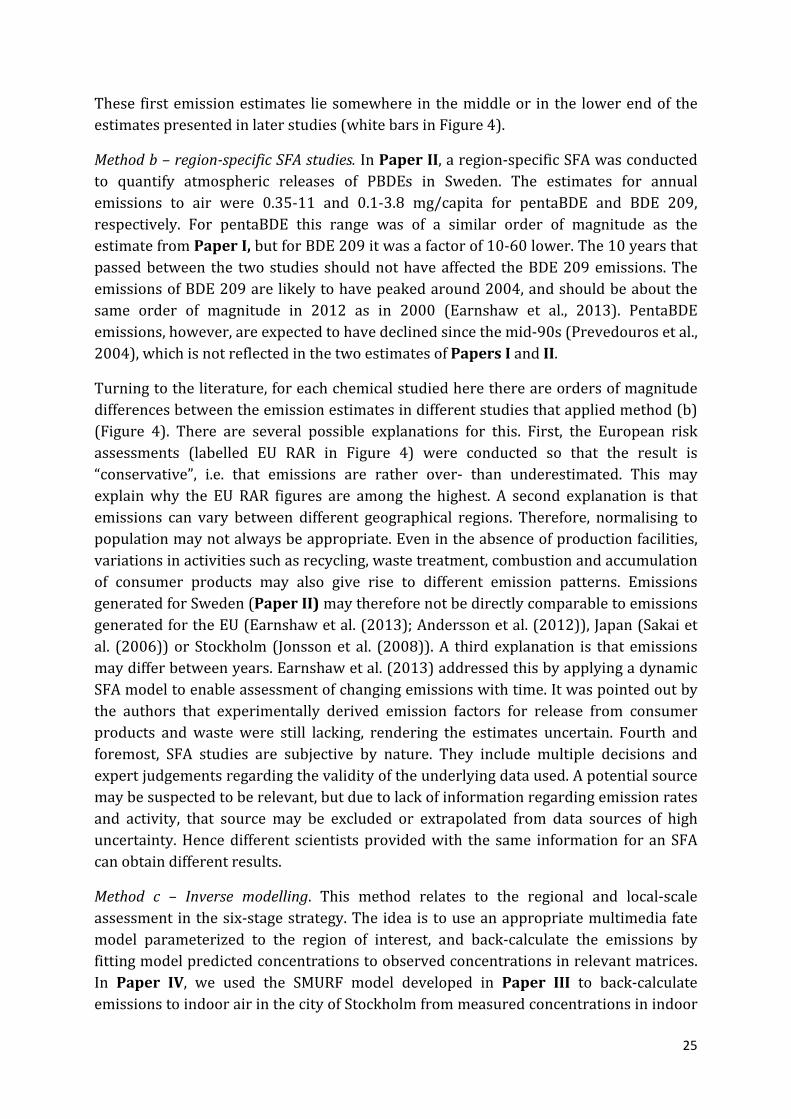
Method c – Inverse modelling. This method relates to the regional and local‐scaleassessmentinthesix‐stagestrategy.Theideaistouseanappropriatemultimediafatemodel parameterized to the region of interest, and back‐calculate the emissions byfittingmodelpredictedconcentrationstoobservedconcentrationsinrelevantmatrices.In Paper IV, we used the SMURF model developed in Paper III to back‐calculateemissionstoindoorairinthecityofStockholmfrommeasuredconcentrationsinindoor
26
airanddust.Onapercapitabasis,annualemissionsof0.1mgforBDE209,290mgforDEHP and 3.4 mg for DINP were proven to explain the observed concentrations inindoor air and dust. Most other studies for these chemicals concern emissions tooutdoor air and often include emissions from products or indirect releases from theindoorenvironment.Thismakesitdifficulttocomparetheindooremissionsestimatedin Paper IV to outdoor emissions calculated using other methods without detailedinformationaboutthesourcesincludedintheseotherstudies.
Amoregeneralpictureoftheurbanemissionsignalofchemicalsinconsumerproductscan be obtained by fitting an urbanmodel to outdoor air concentrations, as done inMoeckel et al. (2010). They used amodelling approach to back‐calculate atmosphericPBDEemissions for the cityofZürich, Switzerland,basedon thedielpatternofPBDEconcentrationsinambientair.Intheirmodeltheyassumedavariable“PBDEpoolarea”as the pure volatilization source in the city and varied the area until reconciliation ofmodelpredictedPBDEconcentrationsinambientairwithobservedconcentrationswasobtained.TheresultingpercapitaemissionsforthesumoffourPBDEcongenersinthepentamixturearewithinaboutafactorof10oftheotherestimatesandonlyafactorof6 different than the original estimate in Paper I. Furthermore, the Moeckel et al.estimatesagreewiththeestimatesofemissionstoindoorairbyAnderssonetal.(2012)fortheEU(Figure4).IfoneassumesthatemissionsofPBDEstoindoorairaresimilartotheoverallemissionstourbanair(whichissupportedbyPaperII,wherereleasesfromtheindoorenvironmentwereestimatedtocontribute80%oftotalemissionstooutdoorair of pentaBDE), then these two studies are very consistent with each other. BothPaper IV andMoeckel et al. illustrate the necessity of having a relevant, site‐specificmodellingtoolandhigh‐qualitymonitoringdatatoobtainagoodquantitativeestimateofemissionsusingmethod(c).
Methodd–Source‐specificemissionmeasurements. InPapersIIandIV,source–specificemissionratesofDINPandBDE209weremeasuredandusedtoderiveemissionrates.The results from Paper II were used as a component in the regional SFA and arediscussed above. In Paper IV, previously measured emission rates of DEHP (seereferences inPaper IV)were re‐calculated forSwedish conditionsandused toderiveemissionratesfromPVC.CombinedwithindustryinformationontotalPVCsurfaceareasoldperyear,annualemissionswerecalculatedtobe3and58mg/capitaforDINPandDEHP, respectively. The emissions obtained for DINP were in good agreement withemissionscalculatedusingmethodcaspresentedabove,buttheestimatedemissionsofDEHPdifferedbyafactorof5comparedtothoseobtainedusingmethod(c).Petterssonetal.(2012)estimatedBDE209indooremissionstobe0.004mg/capitayearbasedonmeasuredreleaserates frompersonalcomputersandstatistical informationonPCs inuse.Thesewereafactorof30lowerthanthefiguresobtainedwithmethod(c)(PaperIV), suggesting that number of PCswere underestimated by Pettersson et al., or thatemissionrateswerenotrepresentative.Itcouldalsobethatadditionalsourcesexistinthe indoor environment, for which there is some evidence (deWit et al., 2012). Onelimitation ofmethod (d) is the difficulty in obtaining representative conditions in the
27
experimental set‐up. For example, volatilization of chemicals is dependent on factorssuchas temperatureandwindspeedorventilationrateand itmaythusbedifficult togenerateemissionfactorsthataregenerallyapplicable.
Basedonthediscrepancyintheemissionestimatesobtainedwiththedifferentmethods,it is difficult to recommend onemethod as better than another. Eachmethod has itsstrengths and weaknesses as discussed above. They can rather be seen as beingcomplementarytoeachother.Noneofthemethodsabovecanbyitselfprovidereliableemissionsestimatesacross largespatialand temporal scales.Togainconfidence inanemissionestimate,itisimportanttocross‐checkitwithalternativemethods,ratherthantorepeatthesamemethod.ItisencouragingthatthefirstemissionestimatesofPBDEs(PaperI)areinthemiddleoftherangeoflaterestimates.Thisillustratestheusefulnessoftheearlyassessmentmethod(a)toprovidefirstestimatesthatcanserveasabasisforlaterandmorerefinedestimates.Theregion‐specificSFAmethod(b) is limitedbythefact that it usually relies on existing data (sometimes complemented with newmeasurements,asinPaperII).Thecompletenessoftheemissioninventorydependsontheavailabilityofsuchdata.Therefore,method(d)isanessentialelementofmethod(b).Theadvantagewith theSFAmethodology is that it cangenerateanunderstanding forthelikelihoodthatacertainemissionsourceisimportantandalsopointoutwheremoredata are needed. Estimating emissions from consumer products is particularly trickysinceitrequirescarefulmappingofalltheproductswherethechemicalisapplied,andideally a large database of measured releases from these products (d), includinginformationontheenvironmentalconditionsunderwhichtheseemissionsoccur.Suchdatabasesarerarelyavailable.Inthesecases,method(c)maybethemostappropriatetoachieveanunderstandingoftheemissionstrength.Method(c)canbeconductedontheurbanscaleas inMoeckeletal. (2010) if ageneralpictureof the regional to localscale emission strength is desired, or closer to the suspected sources as done for theindoorenvironmentinPaperIV.
3.3 EvaluativefateassessmentAnevaluativefateassessmentwasconductedforthePBDEsinPaperIusingthegenericenvironmental fatemodelEQC.Long‐range transportpotentialwasassessedusing theTaPL3model.Theassessmentindicatedapreferencetopartitiontoorganiccarbonrichmatrices for all of themodelled congeners, andhighbioaccumulationpotential.Theseinitial conclusions have been verified in many studies since then, and PBDEs arecommonlyfoundinhighconcentrationsinaquaticbiotaandsediment,andonlyatlowconcentrationsinwater(deWitetal.,2010).
Paper I also suggested that long‐range transport of the highly brominated congenerswould be limited, a conclusion that was also drawn by Wania and Dugani (2003).However,thereisnowstrongevidenceshowingthateventhedecabrominatedcongeneristransportedtoremoteregionsandthatatmosphericlevelsintheArcticareincreasing(deWitetal.,2010;Hungetal.,2010;Suetal.,2007).Thesecontradictoryobservationshave led to new insights into how hydrophobic chemicals are transported in the
28
atmosphere.ThehighlybrominatedBDEsaretransportedprimarilyinassociationwithparticles(e.g.Gouinetal.(2006)).Chemical fatemodelsthatassumethatparticlesarecontinuallybeingremovedfromtheatmosphereviawetdeposition(astheTaPL3)mayunderestimatethe longrangetransportpotentialofchemicals in theparticulatephase(Breivik et al. (2006)). In reality, wet deposition is intermittent, not continuous, andduring periods with no deposition these chemicals can be transported over longdistances.
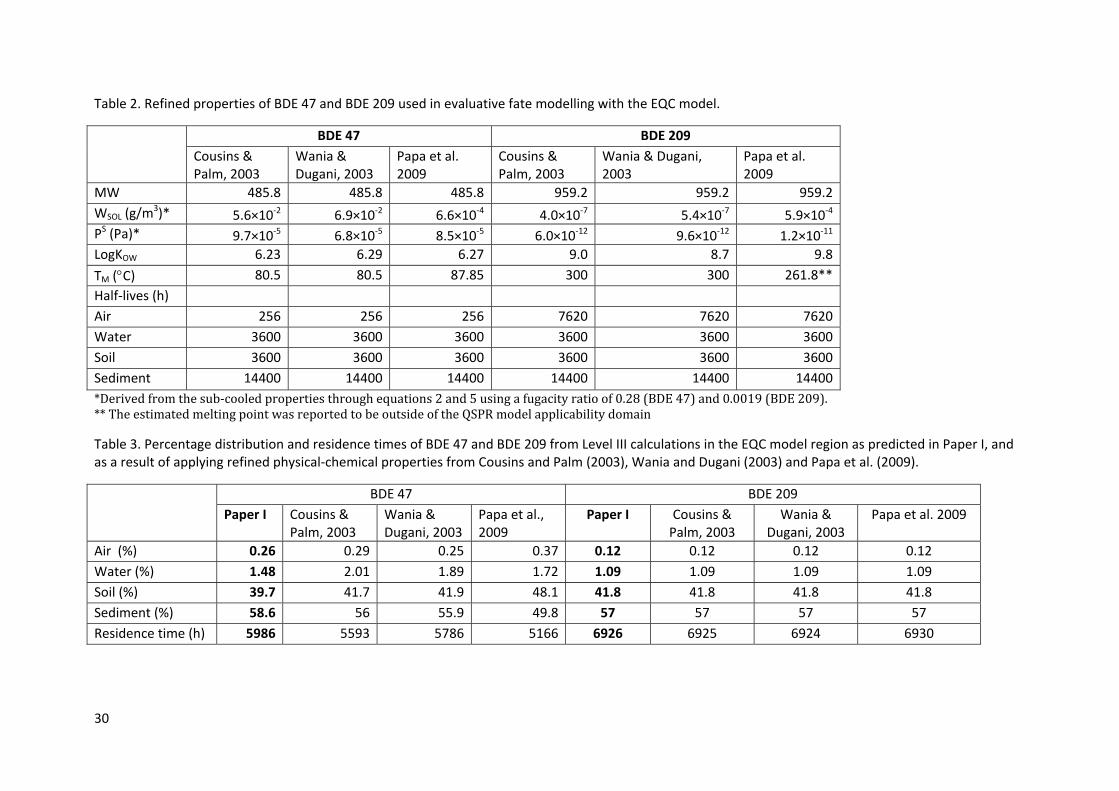
Asshowninsection3.1, thephysical‐chemicalpropertiesofPBDEsderivedinPaperIwere later refinedwith the help of updated and/ormore sophisticatedQSPRmodels.ThegreatestdiscrepanciesbetweentheearlyestimatesandthelaterandmorerefinedestimateswereobservedforBDE209,butdifferenceswerealsoobservedforthelowerbrominated congeners. It is interesting to evaluate if these differences would haveinfluenced the general conclusions about the environmental fate of PBDEs made inPaper I, had theybeenknownat the timeof that firstassessment.Therefore,BDE47andBDE209wererunthroughtheEQCmodel(i.e.asdoneinPaperI)usingtherefinedproperties (Table2). For simplicity, uniformvaluesof the fugacity ratio F (F=0.28 forBDE47and0.0019forBDE209)wereusedtoconvertliquidphasepropertiestosolidphaseproperties(equations2and5insection2.3).Theassumeddegradationhalf‐liveswere the same as in Paper I. Emissions were assigned to air, water and soilsimultaneouslywiththeillustrativeemissionrateof1000kg/h.
TheEQCmodeloutputsaresimilarforthefourdifferentpropertycombinations(Table3).Infact,forBDE209,thepredictedpercentagepartitioningisidenticalforallsetsofproperties.ThereasonforthisisthattheextremelyhydrophobicandinvolatilenatureofBDE209means that thechemicalwillbemoreor lessexclusivelyassociatedwith thesolidphaseinthedifferentcompartments,andthiswillnotchangeasaresultofalteredphysical‐chemical propertieswithin the range given in Table 2. The evaluative fate isinstead entirely controlled by the assumed degradation rates. For BDE 47, slightdifferences are observed in the percentage partitioning, but the general pattern issimilar for all property combinations; limited partitioning to air and water,approximately equal distribution between soil and sediment, and an environmentalresidencetimeofabout7‐8months.
This exercise shows that the three‐solubility approach, even at a very early stage,producedpropertyestimatesthatwerefullyadequatetoassesstheevaluativefateofthePBDEs(Paper I). Improvement inQSPR‐predictionsregardingbasicphysical‐chemicalproperties does not appear to have a significant impact on the environmental fateassessment for very hydrophobic and involatile chemicals such as BDE 209. Instead,focus should be put on understanding degradation rates. For the lower halogenatedBDEs, theoriginalpropertyestimateswere similar to the refinedproperties, and thusthe conclusion regarding the environmental fate of these chemicals did not change.Assessingtheimpactonmodeloutputofdifferentmodelinputparameterssuchasthephysical‐chemicalpropertiescanandshouldalsobeaddressedineachmodellingstudy
29
byconductingasensitivityand/oruncertaintyanalysis,aswasdoneinPapersIIIandIV.
In conclusion, Paper I suggests that evaluative fate modelling can and should beperformedatearlystagesinthechemicalassessmentprocess,evenifonlyfewdataareavailableandemissionsarepoorlyquantified.Itillustrateshowearlystageassessmentcan identify the likely fateofachemicaloragroupofchemicalsand identifykeydatagaps. In Paper I, the PBDEs were confirmed to be of environmental concern, andespeciallythetetra‐andpentabrominatedcompoundswerehighlightedasproblematic.Later on, the European risk assessment came to the same conclusion, leading to aEuropean ban of pentaBDE and octaBDE in 2004 (EU, 2003) and of decaBDE inelectronicalproducts in2008 (EU,2008).PBDEswerealso included in theStockholmConventiononPersistentOrganicPollutantsin2009(UNEP,2009).
30
Table 2. Refined properties of BDE 47 and BDE 209 used in evaluative fate modelling with the EQC model.
*Derivedfromthesub‐cooledpropertiesthroughequations2and5usingafugacityratioof0.28(BDE47)and0.0019(BDE209).**TheestimatedmeltingpointwasreportedtobeoutsideoftheQSPRmodelapplicabilitydomain
Table 3. Percentage distribution and residence times of BDE 47 and BDE 209 from Level III calculations in the EQC model region as predicted in Paper I, and as a result of applying refined physical‐chemical properties from Cousins and Palm (2003), Wania and Dugani (2003) and Papa et al. (2009).
BDE 47 BDE 209
Paper I Cousins & Palm, 2003
Wania & Dugani, 2003
Papa et al., 2009
Paper I Cousins & Palm, 2003
Wania & Dugani, 2003
Papa et al. 2009
Air (%) 0.26 0.29 0.25 0.37 0.12 0.12 0.12 0.12
Water (%) 1.48 2.01 1.89 1.72 1.09 1.09 1.09 1.09
Soil (%) 39.7 41.7 41.9 48.1 41.8 41.8 41.8 41.8
Sediment (%) 58.6 56 55.9 49.8 57 57 57 57
Residence time (h) 5986 5593 5786 5166 6926 6925 6924 6930
BDE 47 BDE 209
Cousins & Palm, 2003
Wania & Dugani, 2003
Papa et al. 2009
Cousins & Palm, 2003
Wania & Dugani, 2003
Papa et al. 2009
MW 485.8 485.8 485.8 959.2 959.2 959.2
WSOL (g/m3)* 5.6×10‐2 6.9×10‐2 6.6×10‐4 4.0×10‐7 5.4×10‐7 5.9×10‐4
PS (Pa)* 9.7×10‐5 6.8×10‐5 8.5×10‐5 6.0×10‐12 9.6×10‐12 1.2×10‐11
LogKOW 6.23 6.29 6.27 9.0 8.7 9.8
TM (C) 80.5 80.5 87.85 300 300 261.8**
Half‐lives (h)
Air 256 256 256 7620 7620 7620
Water 3600 3600 3600 3600 3600 3600
Soil 3600 3600 3600 3600 3600 3600
Sediment 14400 14400 14400 14400 14400 14400
31
3.4 Regionalandlocal‐scalefateassessmentThe regional scale assessment conductedwith the SimpleBox 2.0 regional scenario inPaperIresultedinpredictedairconcentrationsthatwerewithintheobservedranges.This implies that the assigned emissions to air had the right order ofmagnitude. TheconclusionisstrengthenedbyFigure4,whichshowsthattheearlyemissionestimatesareinthemiddleoftherangeofthelaterestimates,asdiscussedpreviously.Theneedforrepresentativemonitoringdatainsoilsandsedimentstostrengthentheassessmentwasalsohighlighted.
A local‐scale assessment is an important part of a human risk assessment. Onceadequate certainty has been gained in emission estimates by cross‐checking usingalternative methods, the local‐scale fate model is an appropriate tool to predictenvironmental concentrations to use for estimating exposure. As discussed in theprevious section, local‐scaleassessment in itself canbeused toestimateemissionsbyfittingobservedenvironmentalconcentrationstomodelpredictions,anditcanbeusedtobetter characterize suspected sources and to assess their relative contributions.Anincreasingamountof literaturehaspointedtowardsurbanenvironmentsasimportantsource areas of PBDEs and other consumer chemicals (Butt et al., 2003; Harrad andHunter, 2006). This led to the hypothesis that the indoor environment may play animportantroleasasourcetotheoutdoorenvironment.
3.4.1 InfluenceoftheindoorenvironmentonchemicalfateinurbancentresTheimpactofchemicalemissionsfromconsumerproductstoindooraironthelevelsofthechemicals in theoutdoorenvironmentwasaddressed inPapers II‐IV. InPaper IIchemical concentrations in air and dust were monitored in different Swedishmicroenvironments.Median10PBDEconcentrationsinindoorair(93‐3700pg/m3)fordifferentbuilding types correspondedwell to the concentrations inventilationoutlets(92‐4700pg/m3).BDE209wasthemostabundantPBDEcongenerinindoorairaswellasinventilationoutlets.ThisshowsthatdespitethehighlogKOAthischemicalmaystillbereleasedfromconsumerproductsintheindoorenvironmentandbetransportedoutofthebuildingsinsubstantialamountsattachedtoveryfineparticles.Onceoutdoors,itmay be subject to atmospheric dilution and long‐range transport. Observedconcentrations in Stockholm ventilation outlets were used to estimate the annualoutflowratesofPBDEsfromprivateandpublic indoorenvironmentstooutdoorair inSweden.TheannualoutflowofpentaBDE (sumof congeners28,47,99and153)wasestimatedtobe0.28‐9.6kg/yearandtheoutflowofBDE209wasestimatedtobe0.84‐32 kg/year. These flows were compared to estimated emissions to outdoor air fromothersources(PaperII)anditwasconcludedthatindoorairmaycontributeasmuchas81‐82%and84‐87%of total emissions to outdoor air of pentaBDE andBDE209 inSweden.
ThemodelstudyinPaperIIIshowedthattheindoorenvironmentcontainsadditionalchemicalremovalmechanismsthatarenotaccountedforintraditionalMFMmodelling,andthatthisaffectstheurbanfateofhydrophobicsubstances.Hydrophobicchemicals
32
with a high tendency to partition to indoor surfaces and dust (log KOA > 9) areparticularlysusceptibletoremovalintheindoorenvironment.Thenestedcharacterofthe indoorenvironmentwithintheoutdoorenvironmentalso leadsto longerchemicalresidencetimes,notjustforhydrophobicchemicalsbutalsoformorevolatileandwatersolublespecies,suchasformaldehydeand2,4,6‐tribromophenol(PaperI).
InPaperIV,theSMURFmodelwasusedtoreconcileemissionsofDINP,DEHPandBDE209withmeasuredindoorconcentrationsandtoassesstheimpactofemissionsindoorson urban air quality. For urban Stockholm, inflowing airwas shown to dominate thechemicalmassbalanceoftheatmosphereforthestudiedsubstances.ForBDE209,theindooremissionsadded38%tothemassenteringthecitywithinflowingair.Whilethisappears tobe incontradictionof the finding inPaper II that themajorityofBDE209emissions to outdoor air come from indoor air, this may simply be evidence thatadvective transport into Stockholm/Sweden is relatively more important than theinternalemissions.TheBDE209advected intoStockholmmayalsohaveoriginated inindoor environments in other regions. For the phthalates,Paper IV showed that theassumeduncertainty inbackgroundconcentrations in inflowingaircontributednearly100%tothemodelledvarianceinoutdoorairconcentrations,whereasthecontributionoftheassumeduncertaintyinindooremissionshadnegligibleimpactontheoutdoorairconcentration. The model predicted much lower concentrations of phthalates inStockholmairthanobservations,indicatingthattheimpactofemissionsfromindooraircouldbeevenlesssignificant.
The finding that indoor air may be an important source to outdoor air pollution forPBDEs raised questions about the validity of current exposure assessment methods,wheretheenvironmentalfateisusuallyassessedbyassumingemissionstooutdoorair,waterandsoil.Becauseofthedifferentcharacteroftheindoorenvironment,chemicalsreleased indoors may follow different transport pathways that should be taken intoaccount to achieve a sounddescription of chemical fate, especially in urban areas. Anintegrated indoor – outdoormodel such as the SMURFmodel allows for a combinedindoor‐outdoorexposureassessment.Also, toachieveawiderunderstandingofurbanchemical flowssuchasreleasestothewastewatersystem, itmaybenecessarytotaketheindoorenvironmentintoaccount.
4 Conclusions
Themostimportantcontributionsfromtheworkpresentedinthisthesisare:
Astructured chemical fate assessment strategy canand shouldbe appliedat earlystagesoftheevaluationofemergingchemicalstoassesstheirlikelyfateandtodirectfurther research, even if data availability is limited. Evaluative multimedia fatemodelsplayacentralroleinthisstrategy(PaperI).
33
Thethree‐solubilityapproachisasimpleandrapidQSPR‐methodthatcanbeusedatearly stagesof the evaluationof emerging chemicals to estimatephysical‐chemicalproperties,evenifonly limitedexperimentaldataareavailable(PaperI;summarysection3.3)
EmissionsofBDE209,DINPandDEHPtoStockholmindoorairareestimatedtobe
0.1,3.4and290mg/capitaandyear,respectively(PaperIV).
TheindoorenvironmentisasignificantsourceofPBDEstooutdoorair.ForBDE209,itadded38%totheBDE209massenteringStockholmcitywithinflowingair.ForSwedenasawhole,theindoorenvironmentwasestimatedtoaccountforca80%ofallBDE209emissionstooutdoorair(PapersIIandIV).
For thephthalates,outdooremissionsand/orbackground infloware thedominant
sources of outdoor air pollution in Stockholm; the influence of the indoorenvironmentislimited(PaperIV).
Compared to emissions tooutdoor air, emissions in the indoorenvironment affect
the urban fate of hydrophobic organic chemicals by providing additional removalpathwaysandbyprolongingurbanchemicalresidencetimes(PaperIII).
Emissions of chemicals from consumer products are best assessed by combining
different estimation methods and should be cross‐checked through fittingmultimedia fate models against empirical monitoring data. As a first approach,substanceflowanalysismethodologymaybeappliedandscaledusingpopulation,aslongastheinformationusedisvalidforthecontextoftheSFA(PapersI,IIandIV).
5 Futurechallenges
This thesis provides valuable insights into the use of modelling tools to assess theenvironmentalfateandbehaviourofchemicalsreleasedfromconsumerproducts.ItwasshownthatcurrentemissionestimatesofphthalateesterstoindooraircannotexplaintheobservedconcentrationsinStockholmoutdoorair.Itwouldthereforebevaluabletoconductanurbanupwind‐downwindmonitoringstudyofphthalateesters in thearea,whereconcentrationsaremeasuredoveralongerperiodoftime.Thiscouldbeusedtoestimate the atmospheric emissions of the phthalates on the urban scale by fittingconcentrations predicted with an environmental fate model to the observedconcentrations.Thiswouldgive important informationabout therelativecontributionfrom other local sources relative to the influence of regional background inflow andgenerateimprovedunderstandingoftheemissionsofphthalateestersinurbanareas.
The thesis also highlights the high potential of indoor surfaces to store hydrophobicchemicals, which affects their urban residence time and has implications for their
34
environmental fate as well as for human exposure. An improved characterization ofindoorsurfaces,aswellaschemicalremovalprocessesintheindoorenvironmentwouldhelpimprovingfuturemodellingstudiesontheindoorfateofhydrophobicsubstances.For example, it would be valuable to investigate the occurrence and thickness of theorganicfilmondifferenttypesofindoorsurfaces,aswellastoperformamulti‐buildinginventory on the occurrence of hard and soft surfaces, since these have presumablydifferentpartitioningproperties.Acontrolledstudyespeciallytargetingindoorremovalprocesses (e.g.dust removal throughvacuumingandwetmopping, sorption to indoormaterialsetc.)couldprovidevaluablecontribution to theunderstandingof theoverallmassbalanceoforganiccontaminantsindoors.
This thesis has mainly focussed on the contribution of indoor chemical releases tooutdoorairpollutionthroughtransportviatheventilationsystem.Thereare,however,alternativereleasepathwaysfromtheindoortotheoutdoorenvironment.Forexample,variouscleaningandwashingactivitiesmaygeneratesubstantialchemicaltransporttothewastewater treatment system thatmaybe of relevance for outflow to the aquaticenvironment.Thisisatopicthatwouldbeofinteresttoaddressinfuturestudies.
Finally, the assessment strategy illustrated inPaper I should be applied to emergingchemicals for which current knowledge is limited, such as for example the siloxanes,novelBFRs,orotherchemicalgroups listed in therecentreviewbyHowardandMuir(2010).

35
6 Acknowledgements
Phew!Såvardetdåäntligendagsattavrundadettaomfattandearbete,ochdetgenomattriktanågravarmatacktillallaersompåolikasättbidragittillatt jagsentomsiderlyckatsuppnåmittmålatterhållaendoktorsexamen.
First,IwouldliketothankmysupervisorMichaelMcLachlan,fortakingmeunderyourwings and guidingme through themost intensive parts of writing, always givingmeconstructiveandcriticalcommentsthatmademethinkdeeper,harderanddifferently.Ihavelearnedalot!
Ialsowishtothankallmyco‐authorstoPapersI,II,andIV.EttsärskilttackvilljagriktatillJustinaBjörklund,TomasHolmgren,MikaelRembergerochCindydeWit förertovärderligabidrag.
Stort tackockså tillmina tidigare lärare iUmeåsom fickmigattvåga ta språngetut istora världen, och även för intressanta senare samarbeten: Karin Wiberg, MatsTysklind,PeterHaglundochPatrikAndersson.
ThankstoMattMacLeodandIanCousinsforrecruitingmewhenIwasstillayoungandeager student up in Umeå. How coincidental that you both eventually ended up inSweden!
I will always be grateful to Don Mackay, who introduced me into the world ofenvironmental fatemodels.Yougavemethegreateststartofmyprofessionalcareer Icouldhavedreamedof,anunforgettableexperienceand...well,youknowtherest.Thankyoueversomuch!IamalsogratefultothebunchofpeoplewhoworkedatCEMCinthesummer 2000 and gaveme a very pleasant first encounter with the field;Matt, Ian,Todd,Alison,Angela,Steve,Lynne,Tom,Eva,DavidandRajeshaswellastheplayersintheinfamousPeterborough“yellowsoccerteam”andallthefellowsattheThursdaypubnights.
Ettstort tackvill jagocksåriktatillallaminanuvarandeochtidigarekollegorvid IVL:EvaBrorström‐Lundén som anställdemig, tack för allt stöd och uppmuntran genomåren.JohnSternbeck,somlotsademiginiyrkeslivetpåettföredömligtsätt.Tackocksåtill Tomas Rydberg, Martin Erlandsson, Anna Jöborn, Björne Olsson, MickeOlshammar och Helene Ejhed, ert stöd och er förståelse har varit helt avgörande!Övrigakollegorvidenhet6000samtövrigaIVLsomgörattdetärroligtattgåtilljobbetvarjedag.Eranamnskulletauppytterligarefemsidoridennaavhandling.
ThankstoallITMstaffforalwaysmakingmefeelwelcomeduringmyshortsessionsatthedepartment.
Tack,mammaochpappaförattnialltidtrottpåmigochföralluppmuntranvadjagäntagitförmig,varesigdethandlatomtyska,skidåkning,fotbollellernaturvetenskap.Detär tryggt att veta att ni alltid finns där!Dessutom för hjälpmed barnpassning och all
36
annanpraktisksupport(ochokejdåpappa,tackförattduskjutsadesåofta).Tackocksåtill min käre bror Anders, för teknisk support och för din förmåga att lugna ner enyrhättatilllillasyster.OchförståsKarinochWilmaförattnifinnsochberikarmittliv.
Och sistmen inteminst,minunderbara familj,mitt andningshålochminenergikälla itillvaron. Emily, Linnea ochOlivia, ni är mitt livs största glädje, och världens bästatjejer!Tackförerförståelsenärmammasuttituppeochjobbatsenanätter,ochförerafina teckningar till avhandlingen. Ian, jag nyper mig fortfarande i armen med jämnamellanrumförattförsäkramigomattalltintebaraärenvackerdröm.Detärenynnestatt få ha dig som livskamrat och från tid till annan även som kollega. Du är bäst! Jagälskardig.
Forskningen har finansierats genom en kombination avmedel från TrentUniversity iCanada,frånEUgenomprojektetCOHIBA,NaturvårdsverketochforskningsprogrammetChEmiTecssamtdetnationellascreeningprogrammet,samtStockholmsUniversitet.
37
7 ReferencesAfshari A, Gunnarsen L, Clausen PA, Hansen V. Emission of phthalates from PVC and other materials.
Indoor Air 2004; 14: 120‐128. Andersson H, Cousins AP, Munthe J, Brorström‐Lundén E, Wickman T, Pettersson M, et al. WP4
Background paper ‐ Identification of sources and estimation of inputs to the Baltic Sea ‐ Final Version 2012.
Bennett DH, Furtaw EJ. Fugacity‐based indoor residential pesticide fate model. Environmental Science & Technology 2004; 38: 2142‐2152.
Bennett DH, Kastenberg WE, McKone TE. General Formulation of Characteristic Time for Persistent Chemicals in a Multimedia Environment. Environmental Science & Technology 1998; 33: 503‐509.
Beyer A, Mackay D, Matthies M, Wania F, Webster E. Assessing Long‐Range Transport Potential of Persistent Organic Pollutants. Environmental Science & Technology 2000; 34: 699‐703.
Beyer A, Wania F, Gouin T, Mackay D, Matthies M. Selecting internally consistent physicochemical properties of organic compounds. Environmental Toxicology and Chemistry 2002; 21: 941‐953.
Braekevelt E, Tittlemier SA, Tomy GT. Direct measurement of octanol–water partition coefficients of some environmentally relevant brominated diphenyl ether congeners. Chemosphere 2003; 51: 563‐567.
Brandes LJ, Hollander Hd, Meent Dvd. SimpleBox 2.0: a nested multimedia fate model for evaluating the environmental fate of chemicals. SimpleBox 2.0: een 'genest' multimedia lotgevallen model voor milieu en chemicalieen. Rijksinstituut voor Volksgezondheid en Milieu RIVM, 1996.
Breivik K, Wania F, Muir DCG, Alaee M, Backus S, Pacepavicius G. Empirical and Modeling Evidence of the Long‐Range Atmospheric Transport of Decabromodiphenyl Ether. Environmental Science & Technology 2006; 40: 4612‐4618.
Buser AM, MacLeod M, Scheringer M, Mackay D, Bonnell M, Russell MH, et al. Good modeling practice guidelines for applying multimedia models in chemical assessments. Integrated Environmental Assessment and Management 2012; 8: 703‐708.
Butt CM, Diamond ML, Truong J, Ikonomou MG, ter Schure AFH. Spatial Distribution of Polybrominated Diphenyl Ethers in Southern Ontario As Measured in Indoor and Outdoor Window Organic Films. Environmental Science & Technology 2003; 38: 724‐731.
Cahill TM, Mackay D. A high‐resolution model for estimating the environmental fate of multi‐species chemicals: application to malathion and pentachlorophenol. Chemosphere 2003; 53: 571‐581.
Clausen PA, Hansen V, Gunnarsen L, Afshari A, Wolkoff P. Emission of Di‐2‐ethylhexyl Phthalate from PVC Flooring into Air and Uptake in Dust: Emission and Sorption Experiments in FLEC and CLIMPAQ. Environmental Science & Technology 2004; 38: 2531‐2537.
Clausen PA, Liu Z, Kofoed‐Sørensen V, Little J, Wolkoff P. Influence of Temperature on the Emission of Di‐(2‐ethylhexyl)phthalate (DEHP) from PVC Flooring in the Emission Cell FLEC. Environmental Science & Technology 2011; 46: 909‐915.
Clausen PA, Liu Z, Xu Y, Kofoed‐Sørensen V, Little JC. Influence of air flow rate on emission of DEHP from vinyl flooring in the emission cell FLEC: Measurements and CFD simulation. Atmospheric Environment 2010; 44: 2760‐2766.
Clausen PA, Xu Y, Kofoed‐Sørensen V, Little JC, Wolkoff P. The influence of humidity on the emission of di‐(2‐ethylhexyl) phthalate (DEHP) from vinyl flooring in the emission cell “FLEC”. Atmospheric Environment 2007; 41: 3217‐3224.
Cole JG, Mackay D. Correlating environmental partitioning properties of organic compounds: The three solubility approach. Environmental Toxicology and Chemistry 2000; 19: 265‐270.
Cousins I, Mackay D. Correlating the physical–chemical properties of phthalate esters using the `three solubility' approach. Chemosphere 2000; 41: 1389‐1399.
38
Cousins IT, Palm A. Physical‐Chemical Properties and Estimated Environmental Fate of Brominated and Iodinated Organic Compounds. In: Neilson AH, editor. The Handbook of Environmental Chemistry. 3R. Springer‐Verlag, Berlin / Heidelberg, 2003, pp. 301‐334.
de Maagd PG‐J, ten Hulscher DTEM, van den Heuvel H, Opperhuizen A, Sijm DTHM. Physicochemical properties of polycyclic aromatic hydrocarbons: Aqueous solubilities, n‐octanol/water partition coefficients, and Henry's law constants. Environmental Toxicology and Chemistry 1998; 17: 251‐257.
de Wit CA, Björklund JA, Thuresson K. Tri‐decabrominated diphenyl ethers and hexabromocyclododecane in indoor air and dust from Stockholm microenvironments 2: Indoor sources and human exposure. Environment International 2012; 39: 141‐147.
de Wit CA, Herzke D, Vorkamp K. Brominated flame retardants in the Arctic environment — trends and new candidates. Science of The Total Environment 2010; 408: 2885‐2918.
Destaillats H, Maddalena RL, Singer BC, Hodgson AT, McKone TE. Indoor pollutants emitted by office equipment: A review of reported data and information needs. Atmospheric Environment 2008; 42: 1371‐1388.
Diamond ML, Priemer DA, Law NL. Developing a multimedia model of chemical dynamics in an urban area. Chemosphere 2001; 44: 1655‐1667.
Earnshaw MR, Jones KC, Sweetman AJ. Estimating European historical production, consumption and atmospheric emissions of decabromodiphenyl ether. Science of The Total Environment 2013; 447: 133‐142.
ECB. European Union Risk Assessment Report on 4‐nonylphenol (branched) and nonylphenol (EU RAR), 2002.
ECB. European Union Risk Assessment Report on 1,2‐Benzenedicarboxylic acid, di‐C8‐10‐branched alkyl esters, C9‐rich and di‐“isononyl” phthalate (DINP). European Commission, Joint Research Centre, Institute of Health and Consumer Protection (IHCP), Toxicology and Chemical Substances (TCS), 2003.
ECB. European Union Risk Assessment Report on Bis(2‐Ethylhexyl)phthalate (DEHP). European Commission, Joint Research Centre, Institute of Health and Consumer Protection (IHCP), Toxicology and Chemical Substances (TCS), 2008a.
ECB. Risk Assessment Hexabromocyclododecane. European Chemicals Bureau 2008b. EU. Directive 2003/11/EC of the European Parliament and of the Council of 6 February 2003
amending for the 24th time Council Directive 76/769/EEC relating to restrictions on the marketing and use of certain dangerous substances and preparations (pentabromodiphenyl ether, octabromodiphenyl ether). In: Parliament E, editor, Official Journal of the European Union, 2003.
EU. Court Proceedings ‐ Court of Justice ‐ Designation of the Chamber responsible for cases of the kind referred to in Article 104b of the Rules of Procedure of the Court of Justice. In: Justice ECo, editor. Official Journal of the European Union, 2008.
Fängström B, Athanassiadis I, Odsjo T, Noren K, Bergman Å. Temporal trends of polybrominated diphenyl ethers and hexabromocyclododecane in milk from Stockholm mothers, 1980‐2004. Mol Nutr Food Res 2008; 52: 187‐93.
Gouin T, Harner T, Daly GL, Wania F, Mackay D, Jones KC. Variability of concentrations of polybrominated diphenyl ethers and polychlorinated biphenyls in air: implications for monitoring, modeling and control. Atmospheric Environment 2005; 39: 151‐166.
Gouin T, Thomas GO, Chaemfa C, Harner T, Mackay D, Jones KC. Concentrations of decabromodiphenyl ether in air from Southern Ontario: Implications for particle‐bound transport. Chemosphere 2006; 64: 256‐261.
Hagen PE, Walls MP. The Stockholm Convention on Persistent Organic Pollutants. Natural Resources and Environment 2005; 19: 49‐52.
Harner T, Shoeib M, Diamond M, Stern G, Rosenberg B. Using Passive Air Samplers To Assess Urban−Rural Trends for Persistent Organic Pollutants. 1. Polychlorinated Biphenyls and Organochlorine Pesticides. Environmental Science & Technology 2004; 38: 4474‐4483.
39
Harrad S, Hunter S. Concentrations of Polybrominated Diphenyl Ethers in Air and Soil on a Rural−Urban Transect Across a Major UK Conurba on. Environmental Science & Technology 2006; 40: 4548‐4553.
Howard PH, Muir DCG. Identifying New Persistent and Bioaccumulative Organics Among Chemicals in Commerce. Environmental Science & Technology 2010; 44: 2277‐2285.
Hung H, Kallenborn R, Breivik K, Su Y, Brorström‐Lundén E, Olafsdottir K, et al. Atmospheric monitoring of organic pollutants in the Arctic under the Arctic Monitoring and Assessment Programme (AMAP): 1993–2006. Science of The Total Environment 2010; 408: 2854‐2873.
Jamshidi A, Hunter S, Hazrati S, Harrad S. Concentrations and Chiral Signatures of Polychlorinated Biphenyls in Outdoor and Indoor Air and Soil in a Major U.K. Conurbation. Environmental Science & Technology 2007; 41: 2153‐2158.
Jonsson A, Fridén U, Thuresson K, Sörme L. Substance Flow Analyses of Organic Pollutants in Stockholm. Water, Air, & Soil Pollution: Focus 2008; 8: 433‐443.
Lassen C, Løkke S, Andersen LI. Brominated Flame Retardants ‐ Substance Flow Analysis and Assessment of Alternatives., Denmark, 1999.
Mackay D. Multimedia Environmental Models: The Fugacity Approach. New York: Lewis Publishers, 2001.
Mackay D, Di Guardo A, Paterson S, Cowan CE. Evaluating the environmental fate of a variety of types of chemicals using the EQC model. Environmental Toxicology and Chemistry 1996a; 15: 1627‐1637.
Mackay D, Di Guardo A, Paterson S, Kicsi G, Cowan CE. Assessing the fate of new and existing chemicals: A five‐stage process. Environmental Toxicology and Chemistry 1996b; 15: 1618‐1626.
Mackay D, Di Guardo A, Paterson S, Kicsi G, Cowan CE, Kane DM. Assessment of chemical fate in the environment using evaluative, regional and local‐scale models: Illustrative application to chlorobenzene and linear alkylbenzene sulfonates. Environmental Toxicology and Chemistry 1996c; 15: 1638‐1648.
MacLeod M, Mackay D. An assessment of the environmental fate and exposure of benzene and the chlorobenzenes in Canada. Chemosphere 1999; 38: 1777‐1796.
McKone TE, Bennett DH. Chemical‐Specific Representation of Air−Soil Exchange and Soil Penetra on in Regional Multimedia Models. Environmental Science & Technology 2003; 37: 3123‐3132.
Mendell MJ. Indoor residential chemical emissions as risk factors for respiratory and allergic effects in children: a review. Indoor Air 2007; 17: 259‐277.
Moeckel C, Gasic B, MacLeod M, Scheringer M, Jones KC, Hungerbühler K. Estimation of the Source Strength of Polybrominated Diphenyl Ethers Based on Their Diel Variability in Air in Zurich, Switzerland. Environmental Science & Technology 2010; 44: 4225‐4231.
Palm A, Breivik K, Brorström‐Lundén E. Transport and fate of polybrominated diphenyl ethers in the Baltic and Arctic regions. TemaNord 2004:554, 2004.
Papa E, Kovarich S, Gramatica P. Development, Validation and Inspection of the Applicability Domain of QSPR Models for Physicochemical Properties of Polybrominated Diphenyl Ethers. QSAR & Combinatorial Science 2009; 28: 790‐796.
Pettersson M, Palm Cousins A, Hansson K. Stockholm case study ‐ Work package 4: Identification of sources and estimation of inputs/impacts on the Baltic Sea, 2012.
Prevedouros K, Jones KC, Sweetman AJ. Estimation of the Production, Consumption, and Atmospheric Emissions of Pentabrominated Diphenyl Ether in Europe between 1970 and 2000. Environmental Science & Technology 2004; 38: 3224‐3231.
Prevedouros K, Palm‐Cousins A, Gustafsson O, Cousins IT. Development of a black carbon‐inclusive multi‐media model: application for PAHs in Stockholm. Chemosphere 2008; 70: 607‐615.
Reid RC, Prausnitz JM, Poling BE. The properties of gases and liquids. New York, NY: McGraw‐Hill, 1987.
Sakai S‐i, Hirai Y, Aizawa H, Ota S, Muroishi Y. Emission inventory of deca‐brominated diphenyl ether (DBDE) in Japan. Journal of Material Cycles and Waste Management 2006; 8: 56‐62.
40
Shoeib M, Harner T, Ikonomou M, Kannan K. Indoor and Outdoor Air Concentrations and Phase Partitioning of Perfluoroalkyl Sulfonamides and Polybrominated Diphenyl Ethers. Environmental Science & Technology 2004; 38: 1313‐1320.
Shoeib M, Harner T, Wilford BH, Jones KC, Zhu J. Perfluorinated Sulfonamides in Indoor and Outdoor Air and Indoor Dust: Occurrence, Partitioning, and Human Exposure. Environmental Science & Technology 2005; 39: 6599‐6606.
Solomon GM, Weiss PM. Chemical contaminants in breast milk: time trends and regional variability. Environ Health Perspect 2002; 110: A339‐47.
Su Y, Hung H, Sverko E, Fellin P, Li H. Multi‐year measurements of polybrominated diphenyl ethers (PBDEs) in the Arctic atmosphere. Atmospheric Environment 2007; 41: 8725‐8735.
Tittlemier SA, Tomy GT. Vapor pressures of six brominated diphenyl ether congeners. Environmental Toxicology and Chemistry 2001; 20: 146‐148.
UNEP. Report of the Conference of the Parties of the Stockholm Convention on Persistent Organic Pollutants on the work of its fourth meeting. In: UNEP, editor, Geneva, 2009.
Wania F, Dugani CB. Assessing the long‐range transport potential of polybrominated diphenyl ethers: A comparison of four multimedia models. Environmental Toxicology and Chemistry 2003; 22: 1252‐1261.
Wania F, Mackay D. The evolution of mass balance models of persistent organic pollutant fate in the environment. Environmental Pollution 1999; 100: 223‐240.
Wong F, Robson M, Diamond ML, Harrad S, Truong J. Concentrations and chiral signatures of POPs in soils and sediments: A comparative urban versus rural study in Canada and UK. Chemosphere 2009; 74: 404‐411.
WWF. Generations X ‐ Results of WWF's European Family Biomonitoring Survey, Brussels, Belgium, 2005.
Yu C, Crump D. A review of the emission of VOCs from polymeric materials used in buildings. Building and Environment 1998; 33: 357‐374.
Zhang X, Diamond ML, Ibarra C, Harrad S. Multimedia Modeling of Polybrominated Diphenyl Ether Emissions and Fate Indoors. Environmental Science & Technology 2009; 43: 2845‐2850.