Embed Size (px)
Citation preview
REPORT ON Safe Accessand Operationswithin New Zealand Ports and Harbours
MARITIME SAFETY AUTHORITY OF NEW ZEALANDKia Maanu Kia Ora
Maritime Safety
KEEPING YOUR SEA SAFE FOR LIFE
Environmental Factors Affecting

Report on Environmental Factors
Affecting Safe Access and Operations within New Zealand
Ports and Harbours
February 2005
Report on Environmental Factors Affecting Safe Access & Operations within New Zealand Ports and Harbours
Disclaimer: All care and diligence has been used in extracting, analysing and compiling this information, however, the Maritime Safety Authority gives no warranty that the information provided is without error. Copyright Maritime Safety Authority 2005 ISBN 0-418-18808-0
2
Report on Environmental Factors Affecting Safe Access & Operations within New Zealand Ports and Harbours
TABLE OF CONTENTS
PREFACE............................................................................................................ 4
SUMMARY OF CONTENTS .................................................................................... 5
OBJECTIVES ....................................................................................................... 6
INTRODUCTION .................................................................................................. 6
REPORT ARRANGEMENT ..................................................................................... 7
PART 1: ENVIRONMENTAL ASSESSMENT FACTORS & CONSIDERATIONS ................. 8
1.1 Environmental Factors............................................................................... 8 1.2 Decision Making ....................................................................................10 1.3 Chronological Categorisation of Environmental Factors .....................................10 1.4 Minimum Requirements and Considerations for all Ports ....................................11 1.5 Additional Notes and Advice for All Ports......................................................12 1.6 Ports with Special Requirements: Additional Factors to Consider ..........................13 1.7 Monitoring............................................................................................15 1.8 Operational Considerations ........................................................................16 1.9 Dynamic Under Keel Clearance ..................................................................16
PART 2: TECHNICAL NOTES ...............................................................................17
2.1 Accuracy of Information ...........................................................................17 2.2 Accuracy and Limitations of Marine Forecasts ................................................17 2.3 Knowledge of Equipment ..........................................................................18 2.4 Observation Networks ..............................................................................18 2.5 Appropriate Safety Margins and Levels of Accuracy .........................................18 2.6 Cooperative Arrangements.........................................................................18 2.7 Issues ..................................................................................................19
2.7.1 General Issues ....................................................................19 2.7.2 LINZ Issues ......................................................................19 2.7.3 Meteorological Issues ...........................................................20
PART 3: RISK REDUCTION MEASURES .................................................................22
3.1 Table of Environmental Factors and Risk Reduction Measures .............................22
APPENDIX A: WAVES (DEFINITIONS).................................................................. A1
APPENDIX B: SEA LEVEL RECORDERS COORDINATED BY NIWA........................... B1
APPENDIX C: MAP OF WEATHER STATIONS AROUND THE NEW ZEALAND COAST . C1
APPENDIX D: METSERVICE EATF SUBMISSION.................................................... D1
APPENDIX E: SUMMARY OF NIWA EATF SUBMISSION.......................................... E1
3
Report on Environmental Factors Affecting Safe Access & Operations within New Zealand Ports and Harbours
PREFACE This report, one of a series of documents supporting the New Zealand Port & Harbour Marine Safety Code, aims to assist regional councils and port operators to identify environmental factors affecting safe access to, and operations within, ports and harbours. The report sits alongside guidelines on port and harbour risk assessment and safety management systems; the provision of aids to navigation; and good practice for hydrographic surveys. In line with the goal of continually improving safety management in our ports and harbours, these documents will be updated from time to time to reflect advances in technical knowledge and capability, and the lessons drawn from experience, including those resulting from accident and incident analysis. Further guides are planned over the next year, covering vessel traffic and port information services, and competency standards for harbourmasters. At the same time, work will get underway to review the legislative framework for the national port and harbour safety system. Comments and queries relating to the New Zealand Port & Harbour Marine Safety Code, its associated guidelines, and this report should be addressed to: Nautical Analyst Maritime Safety Authority PO Box 27006 Wellington e-mail [email protected], phone 04 473 0111 (toll free 0508 225522), fax 04 494 1263 Printed and compact disc copies of this report, the Code and associated guidelines are available free of charge. PDF versions are available from www.msa.govt.nz Russell Kilvington Director of Maritime Safety February 2005
4
Report on Environmental Factors Affecting Safe Access & Operations within New Zealand Ports and Harbours
SUMMARY OF CONTENTS The information contained in this report covers:
1. Environmental factors that affect shipping and port and harbour marine operations are identified.
2. Decisions made within ports and harbours that are affected by environmental factors are summarised.
3. Division of environmental factors into real time (for on the day decision making), the short and medium term (for forecasting and prediction), and the long term (for modelling and forward planning).
4. Certain environmental factors that only affect certain ports, based on their geomorphic, morphodynamic, sedimentary and hydrodynamic environments. These and other additional factors are summarised. Individual ports are advised to assess their risk factors and the consequent risk reduction measures.
5. Summaries of technical requirements for environmental monitoring along with standards, where applicable.
6. Other requirements that will assist in the safe operation of ports and harbours, including the benefits of research and links to specialist institutions. The importance of sharing data and information is stressed.
7. The table in Part 3 summarises the environmental factors, the consequential risk and the measures that can be taken for the safe operation of all ports. The table provides a checklist of items for use when carrying out a port risk assessment. All risks need to be assessed and managed, although it may be possible to manage these risks by means other than those listed in the table.
8. The appendices to the report include information that ports and harbours may find useful, such as maps of sea level recorders around the coast, maps of climate stations near or on the coast. A full copy of the MetService submission to the Environmental Assessment Task Force (EATF), and a summary of the NIWA submission are incorporated.
5
Report on Environmental Factors Affecting Safe Access & Operations within New Zealand Ports and Harbours
Objectives The objectives of this report are to assist port and harbour risk managers to:
• identify the environmental factors that affect safe access to, and operation in, ports and harbours; and
• develop a safety management system to manage the environmental risks relevant to their operations. (See MSA document Guidelines for Port and Harbour Risk Assessment and Safety Management Systems in New Zealand for details for developing a safety management system.)
In the context of ports and harbours, risk managers include, but are not limited to, harbourmasters, pilots, marine operations managers and designated persons ashore (DPA). Introduction This report has been prepared as part of the development of a wider project initiated by the MSA to improve safety in New Zealand ports and harbours. The National Port and Harbour Safety System (PHSS) addresses a number of key areas where improvements relating to safety can be made. This project is being staged over several phases under the guidance of a National Advisory Committee (NAC), comprising representatives from MSA, shipping agents, the Harbourmasters’ Special Interest Group, Land Information New Zealand (LINZ), Occupational Safety and Health (OSH), trade unions, maritime/fishing industry groups, port companies, regional councils and the insurance sector. To successfully operate ships into and out of ports and harbours it is essential to apply an accurate assessment of the relevant environmental phenomena. During the launch stage for phase 1 of the development project, the National Advisory Committee (NAC) for Port and Harbour Safety requested that a group be established who could provide information/guidance to port and harbour safety managers to assist their understanding of environmental factors that pose a potential risk. The NAC considered that an added perspective from expert organisations would benefit all ports and harbours, in particular with regard to further options that could assist the management of environment related risk to shipping. Subsequently, an Environmental Assessment Task Force (EATF) was established. The EATF consists of national experts in the environmental analysis field and this report records their recommendations. EATF membership comprises the MSA, Royal New Zealand Navy, NIWA, MetService, LINZ, Waikato University (Coastal Marine Group), Harbourmasters’ Special Interest Group, New Zealand Maritime Pilots’ Association, New Zealand Shipping Federation and the regional councils.
6
Report on Environmental Factors Affecting Safe Access & Operations within New Zealand Ports and Harbours
Report Arrangement This report is in three parts. Part 1 details the environmental factors and decision making considerations for ports and harbours. It states the minimum considerations that should be factored into all port risk assessments and safety management systems. Part 2 details technical notes and advice that may be of use to ports for operational decision making. Part 3 provides a table that summarises the factors, risks and risk reduction measures. It is provided for the convenience of those carrying out a port risk assessment. The information is tabulated and, therefore, is brief; further relevant details should be sought within this report and the enclosed annexes, and from research obtained by the port or harbour authority. The EATF MetService submission is attached in full as Appendix D, and provides details of the services provided, as well as services that are available on an individual basis. The full NIWA EATF submission to this report, which provides further background and information on national systems and the services available through them, is not included in this report and is available online at www.msa.govt.nz . A summary of the NIWA submission is attached at Appendix E.
7
Report on Environmental Factors Affecting Safe Access & Operations within New Zealand Ports and Harbours
PART 1: ENVIRONMENTAL ASSESSMENT FACTORS & CONSIDERATIONS This sections sets down the environmental factors and considerations that can affect the safe management of port and harbour access by vessels. 1.1 Environmental Factors
The following factors constitute the environmental assessment requirements for ensuring safe access and navigation within ports and harbours by shipping.
a) Weather, which includes:
long period infragravity waves and long swell. wind: mean wind velocity, gust velocity, wind shear, leeway, surface generated
currents, higher or lower sea levels from wind set up or set down, local sea state, lower under keel clearance due to waves/swell.
visibility: including fog, mist and heavy rain (humidity, air and sea temperature).
visibility: day/night. barometric pressure: low or high, can lead to sea levels that are temporarily
higher or depressed relative to the predicted tide level.
b) Sea conditions, which include:
waves: related to local wind speed. (See Appendix 1 for a full description of wave types.)
swell: waves generated elsewhere.
c) Current: main influences are tides, winds, atmospheric pressure, oceanic current incursions, density stratification with depth, seabed bathymetry and coastline shape or constrictions. Forcing mechanisms in harbours are:
tidal flow or stream, which is inherently predictable, but can change over time if there are changes to the bathymetry (shape of the sea floor) or changes to stratification (density layering of the water column).
wind: significant wind events, or ocean set up or set down in sea level can induce variations in currents.
river flows: the input of fresh water can change surface current flow, buoyancy and stratification, possibly leading to vertical shear (current flowing in different directions at different depths).
d) Tides, which include: the tidal stream (described above) and other sea level effects such as:
tidal cuts or surges due to offshore depressions or areas of high pressure. changes in tidal height (from those predicted) due to daily, seasonal or storm
surges. Changes may arise from a combination of atmospheric pressure, wind stress and trapped coastal waves.
8
Report on Environmental Factors Affecting Safe Access & Operations within New Zealand Ports and Harbours
e) Reduction in available navigable water due to silt build up, including the depth alongside berths. Sedimentation can change due to harbour works.
f) Ice: not an issue in New Zealand ports and harbours.
g) Changes in swell and wave characteristics due to:
long period infragravity waves and long swell (refer to appendix 1). shallowing effects, refraction (change of direction) of waves occurs on reaching
shallower water. bathymetric changes, such as steps/bars. changes in beach morphology that affect reflected wave/swell patterns from the
shore.
h) Constructive interference of more than one wave/swell system.
i) Presence of excessive organisms/silt: for example extreme quantities of jellyfish, algal blooms, krill in water can pose a potential threat to ships’ seawater engine coolant intakes; similar effects occur from suspended sediments and silts in narrow channels.
j) Water borne storm debris, for example logs.
k) Changes to water density, which include:
transition from open sea to fresh water. freshwater/seawater wedges in river ports. suspended sediment from major dredging operations.
l) Tsunamis, rissaga, seiches. Also called long waves, see the Appendix on waves.
m) Impact on navigable water due to major works in ports and harbours.
n) Slopes/gradients of rivers, which can cause fresh water drainage into harbours and affect water depth and density, as well as water flow.
o) Characteristics of environmental phenomena, which include grouping of waves and freak waves.
9
Report on Environmental Factors Affecting Safe Access & Operations within New Zealand Ports and Harbours
1.2 Decision Making
Operational decisions affecting vessel safety in the marine environment can be summarised as:
a) Is it safe to approach the port or to stay anchored in the vicinity of the port?
b) Is it safe to enter the port and/or berth as scheduled?
c) Whilst in the port:
is it safe to continue cargo operations?
is there a requirement for increased moorings or tug assistance?
is it safe to remain berthed or should the vessel depart for sea?
d) Is it safe to unberth/depart the port as scheduled?
e) What environmental factors will affect a vessel’s decision on the coastal route taken, its speed and whether to shelter and/or anchor?
f) Is it safe to continue multiple concurrent ship movements or restrict a shipping channel to single ship movements?
g) Is it safe to embark/disembark the pilot?
h) Is it safe to continue immediate work within the port, such as dredging, crane operations, and/or repair work., and for long term decision making operations such as deepening the port, changing port layout, and/or building new structures.
1.3 Chronological Categorisation of Environmental Factors
The environmental factors for port and harbour risk assessment can be loosely categorised chronologically:
On the day assessment and decision making using real time monitoring. Short and medium term assessment using forecasting and prediction. Long term assessment using modelling and planning.
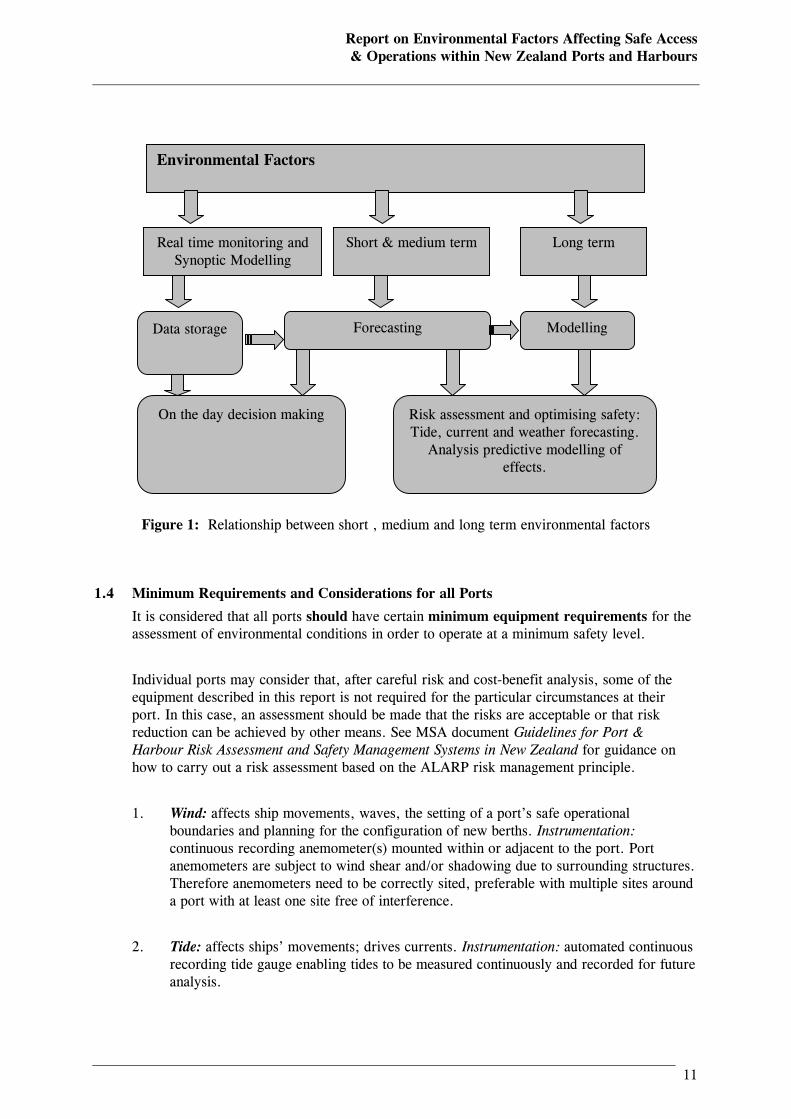
Real time assessment/monitoring of conditions is the most effective way to determine the safe access into or out of a port or harbour on any particular day. However, forecasting and modelling also have their place in providing decision makers with information to preserve and optimise safety in ports and harbours. See Figure 1 for the relationship between categories.
10
Report on Environmental Factors Affecting Safe Access & Operations within New Zealand Ports and Harbours
Short & medium term Long term
Data storage Forecasting Modelling
On the day decision making
Real time monitoring and Synoptic Modelling
Risk assessment and optimising safety:Tide, current and weather forecasting.
Analysis predictive modelling of effects.
Environmental Factors
Figure 1: Relationship between short , medium and long term environmental factors
1.4 Minimum Requirements and Considerations for all Ports
It is considered that all ports should have certain minimum equipment requirements for the assessment of environmental conditions in order to operate at a minimum safety level.
Individual ports may consider that, after careful risk and cost-benefit analysis, some of the equipment described in this report is not required for the particular circumstances at their port. In this case, an assessment should be made that the risks are acceptable or that risk reduction can be achieved by other means. See MSA document Guidelines for Port & Harbour Risk Assessment and Safety Management Systems in New Zealand for guidance on how to carry out a risk assessment based on the ALARP risk management principle.
1. Wind: affects ship movements, waves, the setting of a port’s safe operational boundaries and planning for the configuration of new berths. Instrumentation: continuous recording anemometer(s) mounted within or adjacent to the port. Port anemometers are subject to wind shear and/or shadowing due to surrounding structures. Therefore anemometers need to be correctly sited, preferable with multiple sites around a port with at least one site free of interference.
2. Tide: affects ships’ movements; drives currents. Instrumentation: automated continuous recording tide gauge enabling tides to be measured continuously and recorded for future analysis.
11
Report on Environmental Factors Affecting Safe Access & Operations within New Zealand Ports and Harbours
3. Waves: affects ships’ movements, sediment transport. Instrumentation: one or more wave measuring devices in situ that relay data to maritime operations staff and record these data for future analysis. See monitoring section (Sect 1.7) for some options available.
4. Current: affects ships’ movements, sediment transport. Instrumentation: a moored recording current meter. This could be an Acoustic Doppler Current Profile (ACDP) type of current meter, which can measure current shear through the water as well as suspended sediment levels.
5. Wave direction: affects ships’ motion, wave height at harbour entrance, and sediment transport. Instrumentation: directional wave rider buoys or combined wave gauge/current meters are available and provide wave direction as well as height and period. Place adjacent to the entrance of the navigation channel. Example: the Banks Peninsula wave rider buoy gathers directional wave spectra, significant wave height, maximum wave height, and mean wave period and direction.
6. Barometric pressure monitoring at port sea level. This can improve understanding about the difference between predicted and actual tides at a port. Tides are greatly affected by barometric pressure. Barometric and meteorological changes can only be identified using a system that compares real time actual tides (sea level) with predicted tides. Many ports have this facility in their tide monitoring software. LINZ provides 15 minute tidal predictions to ports at no cost for this purpose, and to aid ongoing validation of the tide gauge. NIWA also coordinates a sea level monitoring network that provides a daily update on barometric and meteorological changes around New Zealand (including the Chatham Islands and Scott Base).
Data of this type have two main uses, real time for on the spot decision making, and archive data storage for calibrating computer models, engineering design and development, ship handling studies/simulators and risk analysis. Therefore, all the above are recommended with real time direct readout and archive data storage. Quality data recorded over a sufficient period will allow quality modelling.
1.5 Additional Notes and Advice for All Ports
It is of considerable importance that up to date environmental data are provided to the correct personnel who make the decisions within the port or harbour. A wide range of data transfer options are now available and should be used to provide, for instance, the pilot, ship master, Bridge Resource Management (BRM) team and harbourmaster with real time information both immediately prior to, and whilst berthing or unberthing a vessel.
It is invaluable for a pilot to have the ability to access accurate wind, sea and tidal information at various points along the route, and this will greatly assist in the ability to make an informed decision. The establishment of more than one weather station should be a consideration for particular ports.
12
Report on Environmental Factors Affecting Safe Access & Operations within New Zealand Ports and Harbours
Appendix B contains a map of the NIWA coordinated sea level recorder network (which includes some port company gauges). Appendix C shows all the current operational coastal weather stations. These monitoring resources may be of additional use to some ports.
NIWA collate monitoring data from rainfall, climate, water quality, groundwater, river and coastal water level and miscellaneous (including wave gauge) recorder sites within New Zealand. The recorders are mainly land based and are owned and maintained by various parties, such as regional councils and territorial local authorities. The data from the recorders are collated by NIWA and details of the recorder sites can be obtained from NIWA in hardcopy format, through the NIWA website and through various regional council websites. For example, the Port of Westport regularly accesses the West Coast Regional Council website to obtain data from the local river water level recorders to predict the speed of the river into the harbour, which can effect ship movements.
The use of maps of tidal stream and currents in ports and approaches is recommended. NIWA has collated tidal stream information for several regions and ports from previous computer model studies of current flows. ADCP networks are used by several ports, and could be extended to outside the port and harbour entrance.
To provide for consistency in sea level data, ports are encouraged to adopt and use the LINZ Sea Level Standard (TH Standard 54, Standard for Official New Zealand Sea Level Information) available at http://www.linz.govt.nz/rcs/linz/pub/web/root/core/Hydrography/standardsandspecs/index.jsp
1.6 Ports with Special Requirements: Additional Factors to Consider
It is difficult, and perhaps not appropriate, to make blanket recommendations for all ports because physical issues identified for one port will not necessarily apply at another port. It has been suggested that the ports should be classified according to their geomorphic, morphodynamic, sedimentary and hydrodynamic environments, and recommendations be given for the various types.
It is not considered appropriate within this report to decide every port’s individual requirements, and that each port is best placed, from its own knowledge, to decide what environmental factors are at risk, and what action to take to manage these risks.
For each port, the following factors (in addition to the minimum factors detailed previously) should be considered, and a decision made as to whether each factor represents a risk that needs to be managed, together with what action should be taken to manage that risk.
1. Wave interaction: Criticality of wave interaction may require more than one wave gauge system: for instance, an inner and an outer wave gauge, or two different types of wave gauges may be appropriate, depending on the port or harbour.
2. Seiches: These are coastal water oscillations in the form of standing waves in bays, harbours and shelves. The period of this motion depends on the geometry of the body of
13
Report on Environmental Factors Affecting Safe Access & Operations within New Zealand Ports and Harbours
water and they are usually small in amplitude compared with a tide, but can attain heights that match or exceed the local tidal range. For harbour layouts that can experience seiches, a network of sea level height recorders linked around the harbour would identify the problem and give warning.
3. Episodic wave events: For ports subject to episodic wave events (>6m: Gisborne, Napier, Wellington, Bluff, Tauranga, Timaru), the wave gauge should be linked to an operational video camera system focused on the port entrance, as well as a numerical wave model showing the wave field distribution. The real time numerical model will show the spatial wave height fields around and adjacent to the navigation lanes.
4. Sedimentation: Ports with active sedimentation problems that require regular dredging should use the MSA document Guidelines for Good Practice for Hydrographic Surveys in New Zealand Ports and Harbours to monitor depths and, therefore, aid in assessing requirements for dredging.
5. Tsunami: Tsunamis are generated from earthquakes, landslides or volcanic eruptions. The period and wave height of tsunamis vary in relation to the size of the generating source. For ports historically subject to tsunami effects (Gisborne, Napier, Tauranga, Wellington, Lyttelton, Timaru) any operational numerical hydrodynamic model should include the ability to simulate tsunami scenarios generated by local and distant sources. There are tsunami early warning gauges that are operated by NIWA and linked to the Pacific Sea Level Warning Network in Hawaii (Pacific Tsunami Warning Centre). Details of tsunami warnings are sent directly from Hawaii to the Ministry of Civil Defence and Emergency Management in Wellington (24 hour contact) before the appropriate warnings are issued to the public.
6. Fog: Fog can be in the form of land and/or sea fog. It is suggested that ports that may be constrained by fog should provide aids to navigation with fog signals, racons and ramarks. Pilots should also be trained in, and familiar with, blind pilotage.
7. Long period swell: The recording wave gauge sensors should also be capable/calibrated to ensure that long period swells can be measured or identified, particularly if under keel clearance (UKC) is critical. Such waves gauges can only measure swell up to periods of 20-24 seconds, in addition to a shorter period swell, but can also detect swell ‘groups’. Note that ports experiencing these long swell waves may have difficulty setting up equipment if these waves are not accounted for.
8. Rissaga waves: Equipment capable of detecting rissaga waves should be installed as these longer waves also affect UKC. Rissagas are long wave events generated by fast moving low pressure weather systems (particularly to the east of New Zealand). The waves have periods of several minutes and can be up to 1m in height. Such waves cannot be detected by accelerometer type recorders (such as a wave rider), but can be detected by high rate sea level gauges, providing the sampling rate is increased to be at intervals of 1 minute (compared with conventional tide gauges that sample at 5-6 or 10 minute intervals). The rissaga tide gauge needs to be on the open coast, away from harbour protection, and will also double as a monitoring gauge for any tsunami event.
14
Report on Environmental Factors Affecting Safe Access & Operations within New Zealand Ports and Harbours
1.7 Monitoring
Some minimum requirements for environmental monitoring have been mentioned. This part expands on some of the equipment and systems available. The NIWA EATF submission (available on the MSA website) and the MetService submission (Appendix D) contain further details, including national systems and information, that are either available free or through individual arrangements. There is also a wide range of specialist expertise available in New Zealand that can supply surveying, data analysis and modelling, and customised equipment set up for marine environmental monitoring.
Sea surface conditions: At present a wave riding buoy is the most suitable for deployment in water depths greater than 20 metres. These use an accelerometer to record wave driven motions. For example, CentrePort and TranzRail access wave data from a wave buoy at Baring Head through the Greater Wellington Regional Council, which has proven to be very useful for Wellington port and harbour operations and Cook Strait ferry operational wave limits. In shallow environments, bottom mounted pressure sensor instruments (<10 m depth), an ADCP, or surface piercing capacitance wave wires (wave staffs) mounted on structures can all provide information on sea surface conditions, although they may pose some data transfer challenges. On a larger regional scale, NIWA operates a nowcasting (almost real time) wave system for the Canterbury region that is partially funded by Environment Canterbury. The system uses the wave buoy data from Banks Peninsula together with local wind speed to predict wave height and direction from Kaikoura to Oamaru and posts the results on the internet. For a further discussion and information on other systems, such as microwave radar measurements, Cam-Era systems, satellite altimetry and wave prediction modelling, see the NIWA EATF submission on the MSA website.
Currents: There are only a few sites in New Zealand where routine monitoring of currents occurs due to cost and data transfer problems. Usually currents are measured for short term periods of up to a year by deploying a recording current meter. Conventional propeller or electromagnetic current meters anchored on moorings measure a current at one spot. The data are recorded and recovered when the instrument is retrieved and, therefore, are of limited use for real time measurements.
Acoustic measurement of current at various depths using an ADCP can give current speed and direction through the water column. They can be mounted on the bottom to look upwards or can be used from a survey vessel. An example is the bottom mounted ADCP current profiler in the main shipping channel inside Tauranga Harbour. Additional sensors on an ADCP can acquire other parameters such as salinity, temperature, wave and turbidity data (the latter is useful for dredging and dredge disposal monitoring). A number of harbours have been surveyed within New Zealand and using these ADCP methods and it is possible to create both 2-D and 3-D animations of the current flows in a harbour or approach channel over a tide cycle.
Sea level: sea level monitoring is carried out by both individual port companies and a network of 22 gauges around the coast (including one at the Chatham Islands) involving several partnering organisations and is coordinated by NIWA (see Appendix B). Results from the sea level sites are updated daily on www.niwa.co.nz/services/sealevels. Predictions of the meteorological component of sea level for up to one day ahead can be gleaned from the network and have been used during the recovery of grounded vessels. In relation to storm surges, each year NIWA also lists danger dates when extremely high or low tides may combine with adverse weather systems to cause a problem.
15
Report on Environmental Factors Affecting Safe Access & Operations within New Zealand Ports and Harbours
1.8 Operational Considerations
It is recognised that instrumentation is not the only option and, indeed, an over reliance on instruments is not good seamanship or navigational best practice. Good seamanship practices, such as leaving a sufficient safety margin and not relying totally on one instrument, cannot be neglected when making operational decisions. This is particularly applicable when operating in marginal conditions or at the limit of safe operation. For instance, a slight deviation from the planned track of the vessel, a slight inaccuracy of the tidal prediction, sudden loss of visibility, an unforecasted change in weather conditions or other unplanned events must be allowed for and, where possible, contingency plans put in place.
Knowing the weather forecast only helps in the planning stage. However, the provision of accurate and reliable real time data provided directly to those making operational decisions can only assist in making correct and safe decisions.
These decisions should be supported by good safety management practices, both within the port operating company and onboard, such as bridge resource management and passage planning. These are vital for the safe operation of the port/harbour under the full range of environmental conditions that can be expected at that location.
In summary, a combination of good seamanship, safety management, training and planning, together with the use of local environmental data and information from external sources (for example MetService, LINZ, NIWA, etc.), will all play a role in safely managing environmental risks.
1.9 Dynamic Under Keel Clearance
No report on environmental factors affecting ship access to ports would be complete without a mention of dynamic under keel clearance (DUKC). This is a near real time under keel clearance prediction system that takes into account the major factors affecting under keel clearance using real time environmental monitoring data, as well as ship motion and response, and wave and tidal modelling. The data are used to provide forecasting information to aid decision making for shipping movements. The DUKC system has to be individually installed and customised for each specific port. Pilots and other users undergo DUKC awareness and training as part of the installation process. DUKC has the commercial application (which justifies its cost) of maximising drafts for departing vessels, and of determining the earliest and latest time of entry and exit into and out of the port approach channel.
The DUKC system was developed by an Australian company (OMC International) and is in successful operation in Australia, America and New Zealand (Port Taranaki, Port of Napier and Marsden Point have some OMC systems installed). Despite its success, the DUKC system should not be seen as the panacea for predicting safe ship movements in ports and harbours, but as another useful tool to aid in the decision making process and to ensure appropriate safety margins are applied when considering UKC for ship movements.
There are other methods and systems that take into account the relevant environmental factors, together with an assessment of ships characteristics, to predict safe ship movements in a port or harbour, an example being the system in operation at the Port of Tauranga.
16
Report on Environmental Factors Affecting Safe Access & Operations within New Zealand Ports and Harbours
PART 2: TECHNICAL NOTES
2.1 Accuracy of Information
Accuracy of information relating to environmental monitoring technology ensures equipment is capable of fully meeting the user requirements. For hydrographic surveys, LINZ requires that contractors check the accuracy of survey equipment by rigorous testing and calibration, rather than just accept the manufacturer’s specifications. Issues that can be identified from field tests are:
tide gauge transducer calibrations
sampling and recording rates
latency issues in data transfers/handshakes and communications
sensitivity of motion compensators to long period swells
The MetService EATF report (see Appendix D, Section 5) details limitations on the accuracy of marine forecasts.
The accuracy of information relating to forecasting, environmental modelling and ship response techniques has limitations that need to be understood. The calibration of models against observations and subsequent verifications of model outputs is important to prove and refine the models.
2.2 Accuracy and Limitations of Marine Forecasts
(See Weather Forecasts for New Zealand Coasts and Ports in Appendix D)
Coastal forecasts, because of the requirement for clarity and brevity, express the most likely conditions over the greater part of the area. However, some phenomena, areas and small scale variations are not covered. These limitations are outlined in the New Zealand Nautical Almanac as follows:
1. The coastal marine forecasts do not cover inlets and inland waterways, or areas close inshore. This is addressed in some locations by the presence of inshore (so called “recreational”) forecast areas.
2. Wind speed ranges are not given, but a range of plus or minus 5 knots is implied, and wind speeds are in increments of 5 knots. Significant changes or variations in wind speed over time or in location are mentioned. Gusts are not mentioned.
3. Special wind phenomena that may occur near large coastal landforms are not specifically mentioned unless they are expected to cover a large portion of the area.
4. State of sea and swell are mentioned as separate phenomena, although they may be indistinguishable when experienced. The state of the sea is described in qualitative terms (‘slight’, ‘rough’, etc.), and the significant wave height of the swell is forecast in whole metres. Extreme sea and swell heights and combined wave heights are not given.
5. Variations in swell height or direction due to shoaling and refraction are not mentioned.
17
Report on Environmental Factors Affecting Safe Access & Operations within New Zealand Ports and Harbours
2.3 Knowledge of Equipment
Equipment changes rapidly and needs to be fit for the purpose, with adequate funding for calibration and maintenance to be effective.
2.4 Observation Networks
Various bodies provide technical and observation networks to gather data for marine forecasting and monitoring purpose, which can be made available for use. NIWA and the MetService are two such bodies, although there are other bodies in New Zealand and overseas that can provide a similar service for ports and harbours.
2.5 Appropriate Safety Margins and Levels of Accuracy
Appropriate safety margins should be applied to monitoring and forecasting information and hydrographic survey information.
i. For hydrographic surveys LINZ requires an assessment of accuracy, which is shown by mathematical means.
ii. Increasing the accuracy of a survey will also significantly increase both time and cost. It is better to adopt a confidence level that has an associated margin of error (for instance a depth of 5 m ±0.2 m at 95% confidence).
iii. Operators need to grasp the impact of accuracy and errors, as well as the dynamic nature of the environment as ships get bigger and UKC is reduced.
iv. Formal risk assessments would assist ports to establish operating limits and acceptable levels of accuracy. There is potential to put blind faith in computer programs and modelling without understanding the error budgets or inaccuracies that may be present.
v. See MSA Guidelines of Good Practice for Hydrographic Surveys in New Zealand Port and Harbours.
2.6 Cooperative Arrangements
Impact assessments and environmental models can only be achieved with good quality data acquired over a reasonable period of time. The requirements for resource consents and the time and cost of engineering works are all considerable. Therefore, those ports that collect and assess environmental data over considerable time, wherever possible, will save both money and effort. Equally, all models require calibration against observations over a considerable time so that predictions can be verified.
18
Report on Environmental Factors Affecting Safe Access & Operations within New Zealand Ports and Harbours
There is a need for delivery of real time tidal data and the long term capture of data from the approaches to ports. This can be achieved from either buoys or bottom mounted gauges using telemetry to send the data to operation control centres. Tidal time and height differences may vary between approaches and the port.
MSc/PhD thesis projects are a cost effective way to achieve a much wider and more intensive data collection programme and analyses. A good example is the cooperative arrangements that have occurred for several decades between the University of Waikato (Coastal Marine Group) and numerous ports around New Zealand to undertake MSc/PhD thesis projects. Various ports have already had success via this route (Tauranga, Onehunga, Auckland, Northport, Taranaki, Gisborne and various marinas). The theses have become a major repository of knowledge and are extremely useful for subsequent development and impact assessment programmes, such as resource consents. Based on these successes, it is suggested that ports may wish to consider aligning themselves with a group of expertise from a university or similar, and enter into a long term project for collecting basic environmental data, its analysis and for port impact studies. In the past decades, successful outcomes from such cooperative arrangements have been experienced at the ports of Whangarei, Northport, Auckland, Tauranga, Onehunga, Gisborne and Taranaki.
2.7 Issues
During the EATF submission period various issues were raised that fell outside the scope of the Terms of Reference of the Task Force. These are signalled here for further consideration within the context of the ongoing development of the New Zealand port and harbour safety system.
2.7.1 General Issues
It has been noted that there can be extreme pressures placed on the masters of vessels and on harbourmasters, which can lead to unwise decisions being made to enter, operate in or leave a port. These include:
i. financial pressure to get in and unload
ii. time pressure due to overwork
iii. pressure from third parties to berth or enter in unsafe conditions
iv. lack of support for the master’s decision to remain at sea
2.7.2 LINZ Issues
LINZ is responsible for tidal height analysis, tide predictions, datums, and the compilation, publication and distribution of official New Zealand tide tables. Ports are responsible for installation, maintenance and calibration of tide gauges.
The United Kingdom Hydrographic Office (UKHO) is responsible for the compilation, publishing and distribution of the NZ Pilot, and may not necessarily pass information to LINZ. Some environmental data collected by ports and other organisations are made available to LINZ for use in updating the Nautical Almanac and charts, or it may be forwarded direct to the UKHO to update the NZ Pilot.
19
Report on Environmental Factors Affecting Safe Access & Operations within New Zealand Ports and Harbours
There have been examples where cost recovery and restricted access policies have prevented the most recent tidal data from being passed to LINZ for incorporation into the Nautical Almanac. The situation has changed in recent years and mutual data exchange arrangements are to be implemented with all standard ports.
Tidal observations, modelling and predictive analysis need to be carried out in a consistent way across the whole country. LINZ has developed a minimum standard for these purposes. This standard needs to be considered, amended if necessary and then adopted by all ports.
Port operators must notify LINZ of works in the port or of any significant hazards that occur from natural or man made events. LINZ will issue Notices to Mariners advising of the new situation if there is an impact on navigation. Copies of post works surveys containing soundings and new positions of the port shoreline must be forwarded to LINZ. This has been the practice in the past, but has been undertaken on an ad hoc goodwill basis. LINZ will update charts as soon as practicable.
2.7.3 Meteorological Issues
Long range marine forecasts
The MetService has issued 5 day forecasts for land areas since the early 1980s. It is now possible to provide 5 day forecasts for marine purposes. For example, the situation statement in Part I of the Marine Weather Bulletin for New Zealand Coastal Waters now mentions possible severe weather conditions beyond the outlook period. Many other types of extended marine forecasts are possible.
Port forecasts
Although the World Meteorological Organisation (WMO) recommends that national meteorological services provide forecasts for ports and their approaches, the MetService has never done so.
Port forecasts would offer benefits in terms of efficiency and safety for operations such as
• docking of ships, including mooring
• loading by ships and shore cranes
• container stacking
• tug and pilot operations, for instance approach and departure over bars or shallows
20
Report on Environmental Factors Affecting Safe Access & Operations within New Zealand Ports and Harbours
Port forecasts would be issued daily and updated as required. They would contain a section for the approaches, and one for the docks and cargo handling area. Forecasts would contain elements such as:
• situation statement
• wind and gusts
• weather and visibility
• sea, swell and combined waves in terms of significant and extreme wave height
• special conditions such as severe weather (for example, thunderstorms, localised severe winds, long wave1 episodes, abnormal high or low sea level, storm surge, fog, ice accretion)
2. Wider range of marine forecasts
At present, there are relatively few observations of weather, wind, sea and swell available to the MetService. However, there are increasing numbers of wave riders and anemometers at New Zealand ports. Information from these systems would contribute significantly to the accuracy and reliability of all types of marine forecasts. With modern communication technology, these data could be conveyed to the MetService’s marine forecaster at low cost, and could be provided in the spirit of for the common good.
Other ways that observations at sea could be increased are:
• automatic weather stations (AWS) on ships (such as that on the M.V. Tangaroa operated by NIWA)
• formal coded ship reports
• informal plain language reports via the existing network of coastal radio stations or via the coastguard.
Possible Improvements
The inshore recreational forecasts for some areas could be improved by an extension or redefinition of the areas covered. For instance:
1. The southern boundary of the Kapiti Coast inshore forecast area could be extended to the south end of Titahi Bay because of the large amount of small boat activity between Titahi Bay and the present boundary at Pukerua Bay. This extension would then include Mana Marina.
2. Christchurch inshore recreational forecast could be extended to include Lyttelton Harbour.
3. The Auckland inshore recreational area could be extended to include the southern end of Thames Estuary.
21
Report on Environmental Factors Affecting Safe Access & Operations within New Zealand Ports and Harbours
PART 3: RISK REDUCTION MEASURES
3.1 Table of Environmental Factors and Risk Reduction Measures
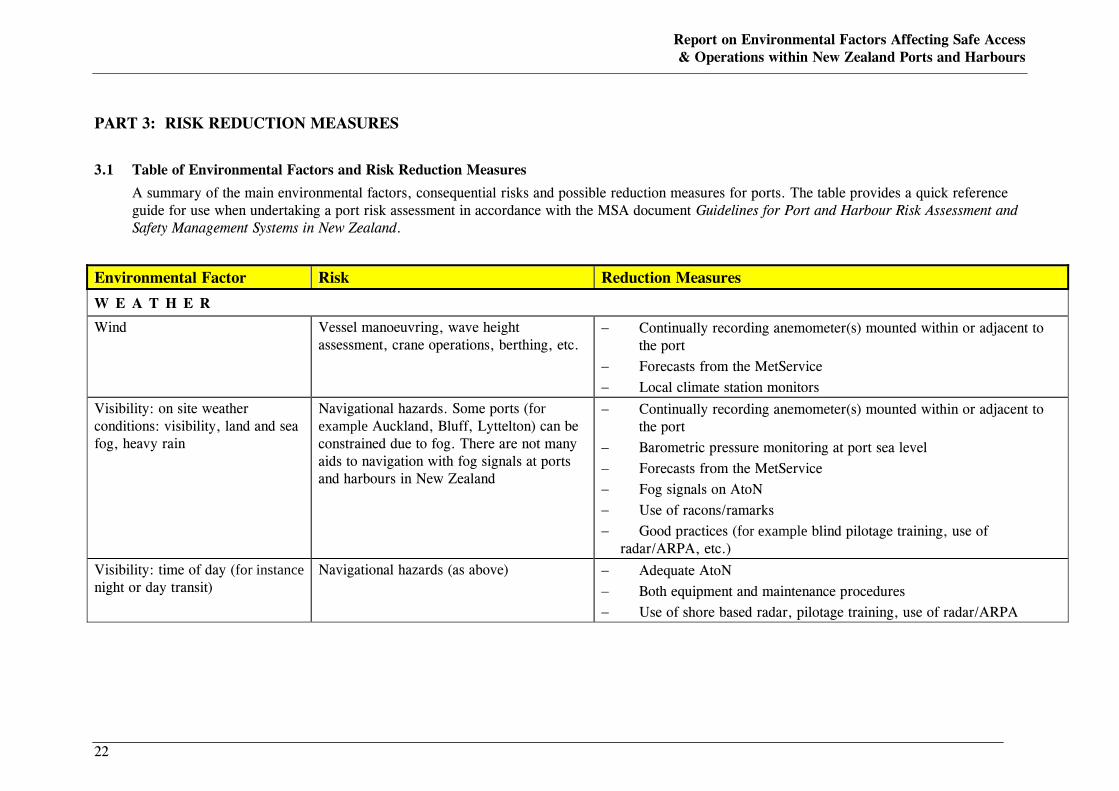
A summary of the main environmental factors, consequential risks and possible reduction measures for ports. The table provides a quick reference guide for use when undertaking a port risk assessment in accordance with the MSA document Guidelines for Port and Harbour Risk Assessment and Safety Management Systems in New Zealand.
Environmental Factor Risk Reduction Measures
W E A T H E R
Wind Vessel manoeuvring, wave height assessment, crane operations, berthing, etc.
− Continually recording anemometer(s) mounted within or adjacent to the port
− Forecasts from the MetService − Local climate station monitors
Visibility: on site weather conditions: visibility, land and sea fog, heavy rain
Navigational hazards. Some ports (for example Auckland, Bluff, Lyttelton) can be constrained due to fog. There are not many aids to navigation with fog signals at ports and harbours in New Zealand
− Continually recording anemometer(s) mounted within or adjacent to the port
− Barometric pressure monitoring at port sea level − Forecasts from the MetService − Fog signals on AtoN − Use of racons/ramarks − Good practices (for example blind pilotage training, use of
radar/ARPA, etc.) Visibility: time of day (for instance night or day transit)
Navigational hazards (as above) − Adequate AtoN − Both equipment and maintenance procedures − Use of shore based radar, pilotage training, use of radar/ARPA
22
Report on Environmental Factors Affecting Safe Access & Operations within New Zealand Ports and Harbours
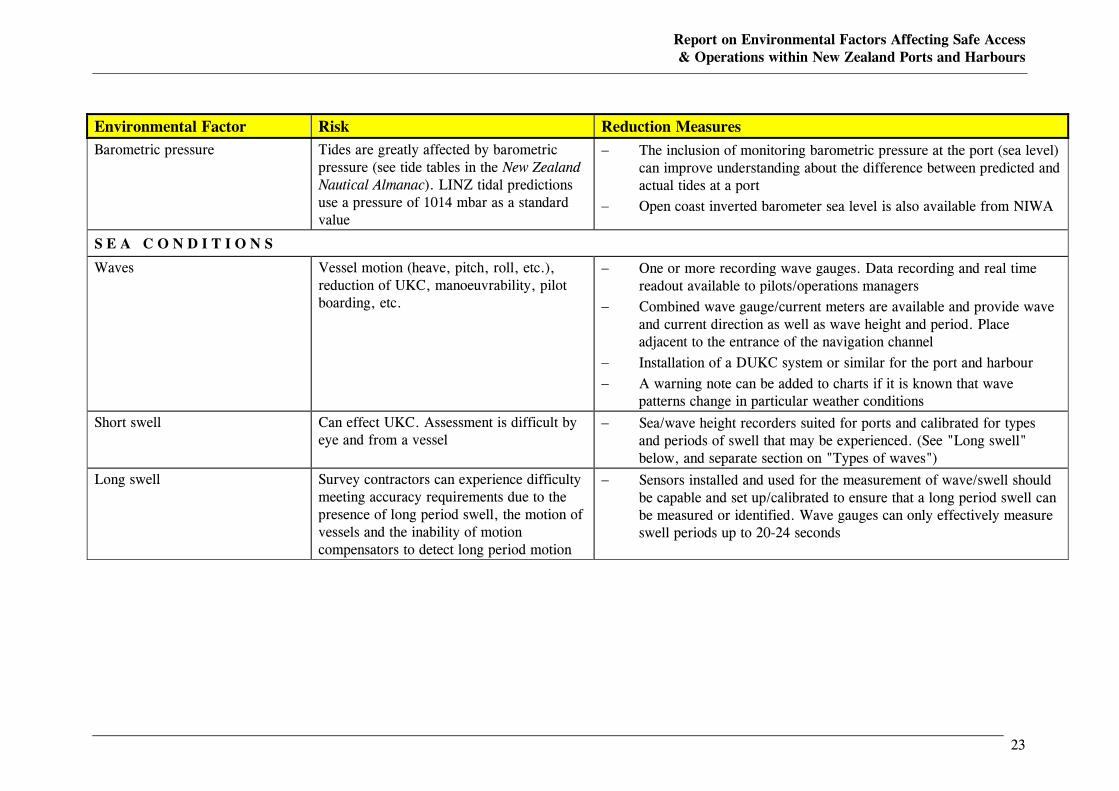
Environmental Factor Risk Reduction Measures Barometric pressure Tides are greatly affected by barometric
pressure (see tide tables in the New Zealand Nautical Almanac). LINZ tidal predictions use a pressure of 1014 mbar as a standard value
− The inclusion of monitoring barometric pressure at the port (sea level) can improve understanding about the difference between predicted and actual tides at a port
− Open coast inverted barometer sea level is also available from NIWA
S E A C O N D I T I O N S
Waves Vessel motion (heave, pitch, roll, etc.), reduction of UKC, manoeuvrability, pilot boarding, etc.
− One or more recording wave gauges. Data recording and real time readout available to pilots/operations managers
− Combined wave gauge/current meters are available and provide wave and current direction as well as wave height and period. Place adjacent to the entrance of the navigation channel
− Installation of a DUKC system or similar for the port and harbour − A warning note can be added to charts if it is known that wave
patterns change in particular weather conditions
Short swell Can effect UKC. Assessment is difficult by eye and from a vessel
− Sea/wave height recorders suited for ports and calibrated for types and periods of swell that may be experienced. (See "Long swell" below, and separate section on "Types of waves")
Long swell Survey contractors can experience difficulty meeting accuracy requirements due to the presence of long period swell, the motion of vessels and the inability of motion compensators to detect long period motion
− Sensors installed and used for the measurement of wave/swell should be capable and set up/calibrated to ensure that a long period swell can be measured or identified. Wave gauges can only effectively measure swell periods up to 20-24 seconds
23
Report on Environmental Factors Affecting Safe Access & Operations within New Zealand Ports and Harbours
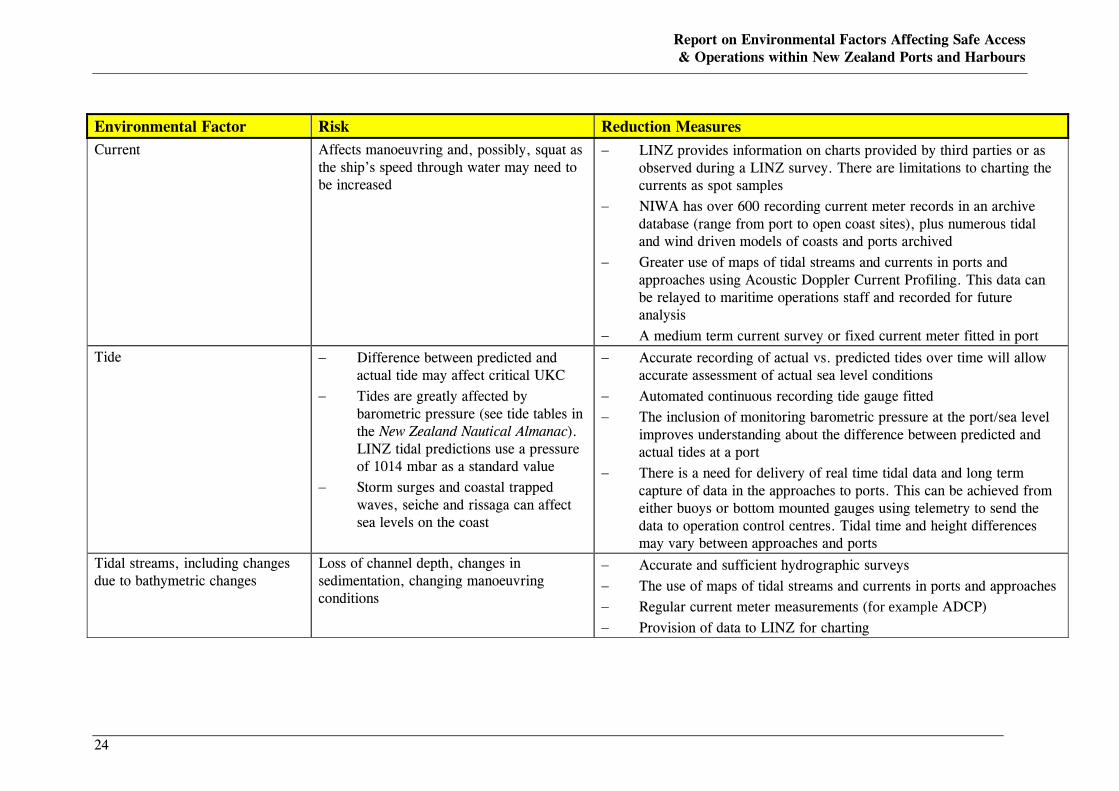
Environmental Factor Risk Reduction Measures Current Affects manoeuvring and, possibly, squat as
the ship’s speed through water may need to be increased
− LINZ provides information on charts provided by third parties or as observed during a LINZ survey. There are limitations to charting the currents as spot samples
− NIWA has over 600 recording current meter records in an archive database (range from port to open coast sites), plus numerous tidal and wind driven models of coasts and ports archived
− Greater use of maps of tidal streams and currents in ports and approaches using Acoustic Doppler Current Profiling. This data can be relayed to maritime operations staff and recorded for future analysis
− A medium term current survey or fixed current meter fitted in port Tide − Difference between predicted and
actual tide may affect critical UKC − Tides are greatly affected by
barometric pressure (see tide tables in the New Zealand Nautical Almanac). LINZ tidal predictions use a pressure of 1014 mbar as a standard value
− Storm surges and coastal trapped waves, seiche and rissaga can affect sea levels on the coast
− Accurate recording of actual vs. predicted tides over time will allow accurate assessment of actual sea level conditions
− Automated continuous recording tide gauge fitted − The inclusion of monitoring barometric pressure at the port/sea level
improves understanding about the difference between predicted and actual tides at a port
− There is a need for delivery of real time tidal data and long term capture of data in the approaches to ports. This can be achieved from either buoys or bottom mounted gauges using telemetry to send the data to operation control centres. Tidal time and height differences may vary between approaches and ports
Tidal streams, including changes due to bathymetric changes
Loss of channel depth, changes in sedimentation, changing manoeuvring conditions
− Accurate and sufficient hydrographic surveys − The use of maps of tidal streams and currents in ports and approaches − Regular current meter measurements (for example ADCP) − Provision of data to LINZ for charting
24
Report on Environmental Factors Affecting Safe Access & Operations within New Zealand Ports and Harbours
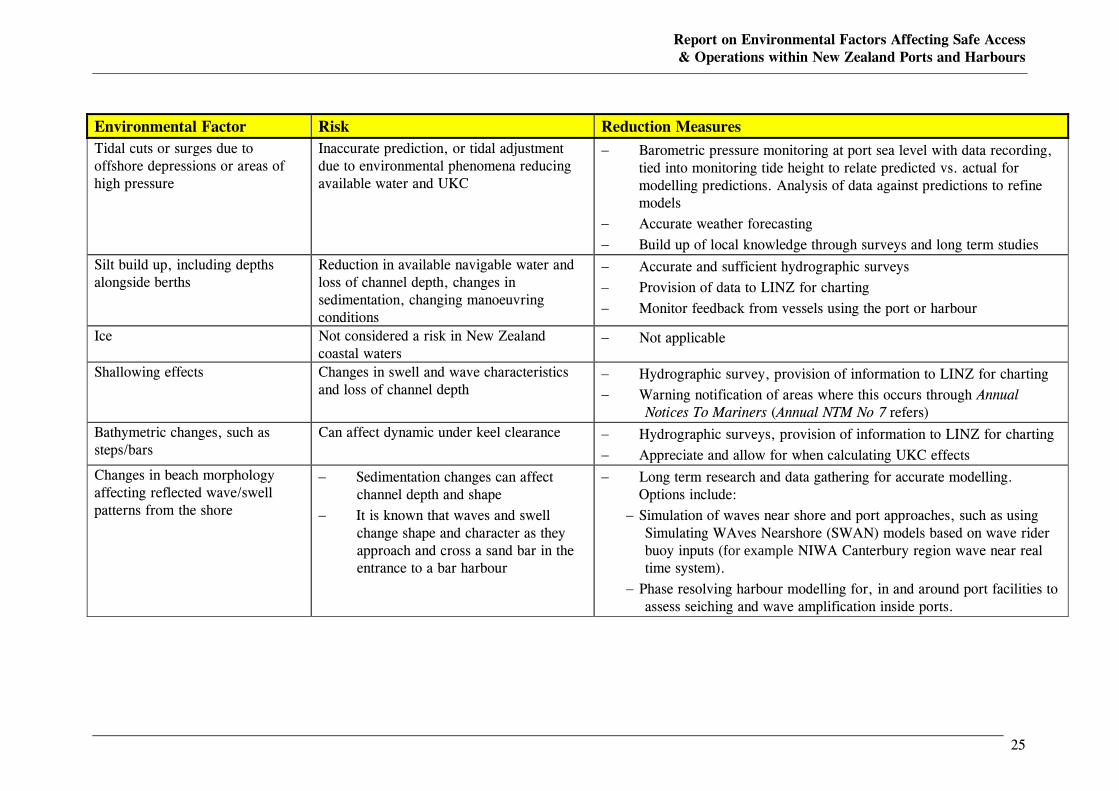
Environmental Factor Risk Reduction Measures Tidal cuts or surges due to offshore depressions or areas of high pressure
Inaccurate prediction, or tidal adjustment due to environmental phenomena reducing available water and UKC
− Barometric pressure monitoring at port sea level with data recording, tied into monitoring tide height to relate predicted vs. actual for modelling predictions. Analysis of data against predictions to refine models
− Accurate weather forecasting − Build up of local knowledge through surveys and long term studies
Silt build up, including depths alongside berths
Reduction in available navigable water and loss of channel depth, changes in sedimentation, changing manoeuvring conditions
− Accurate and sufficient hydrographic surveys − Provision of data to LINZ for charting − Monitor feedback from vessels using the port or harbour
Ice Not considered a risk in New Zealand coastal waters
− Not applicable
Shallowing effects Changes in swell and wave characteristics and loss of channel depth
− Hydrographic survey, provision of information to LINZ for charting − Warning notification of areas where this occurs through Annual
Notices To Mariners (Annual NTM No 7 refers) Bathymetric changes, such as steps/bars
Can affect dynamic under keel clearance − Hydrographic surveys, provision of information to LINZ for charting − Appreciate and allow for when calculating UKC effects
Changes in beach morphology affecting reflected wave/swell patterns from the shore
− Sedimentation changes can affect channel depth and shape
− It is known that waves and swell change shape and character as they approach and cross a sand bar in the entrance to a bar harbour
− Long term research and data gathering for accurate modelling. Options include:
− Simulation of waves near shore and port approaches, such as using Simulating WAves Nearshore (SWAN) models based on wave rider buoy inputs (for example NIWA Canterbury region wave near real time system).
− Phase resolving harbour modelling for, in and around port facilities to assess seiching and wave amplification inside ports.
25
Report on Environmental Factors Affecting Safe Access & Operations within New Zealand Ports and Harbours
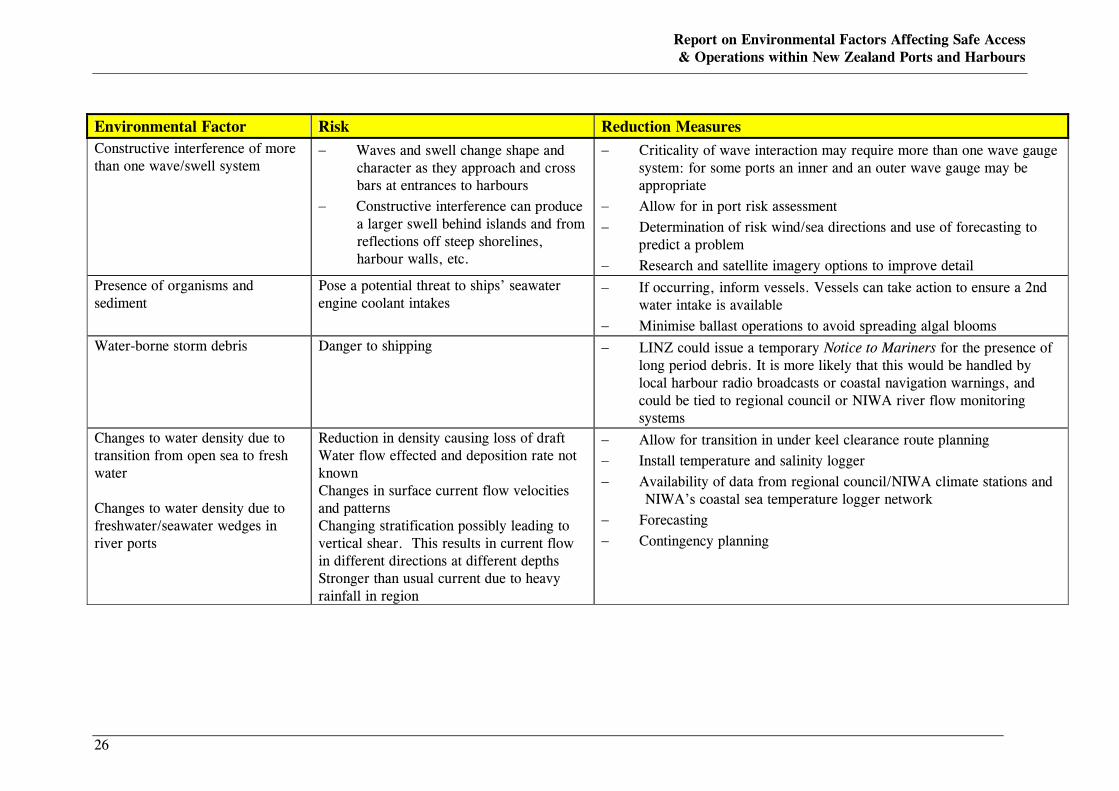
Environmental Factor Risk Reduction Measures Constructive interference of more than one wave/swell system
− Waves and swell change shape and character as they approach and cross bars at entrances to harbours
− Constructive interference can produce a larger swell behind islands and from reflections off steep shorelines, harbour walls, etc.
− Criticality of wave interaction may require more than one wave gauge system: for some ports an inner and an outer wave gauge may be appropriate
− Allow for in port risk assessment − Determination of risk wind/sea directions and use of forecasting to
predict a problem − Research and satellite imagery options to improve detail
Presence of organisms and sediment
Pose a potential threat to ships’ seawater engine coolant intakes
− If occurring, inform vessels. Vessels can take action to ensure a 2nd water intake is available
− Minimise ballast operations to avoid spreading algal blooms Water-borne storm debris Danger to shipping − LINZ could issue a temporary Notice to Mariners for the presence of
long period debris. It is more likely that this would be handled by local harbour radio broadcasts or coastal navigation warnings, and could be tied to regional council or NIWA river flow monitoring systems
Changes to water density due to transition from open sea to fresh water Changes to water density due to freshwater/seawater wedges in river ports
Reduction in density causing loss of draft Water flow effected and deposition rate not known Changes in surface current flow velocities and patterns Changing stratification possibly leading to vertical shear. This results in current flow in different directions at different depths Stronger than usual current due to heavy rainfall in region
− Allow for transition in under keel clearance route planning − Install temperature and salinity logger − Availability of data from regional council/NIWA climate stations and
NIWA’s coastal sea temperature logger network − Forecasting − Contingency planning
26
Report on Environmental Factors Affecting Safe Access & Operations within New Zealand Ports and Harbours
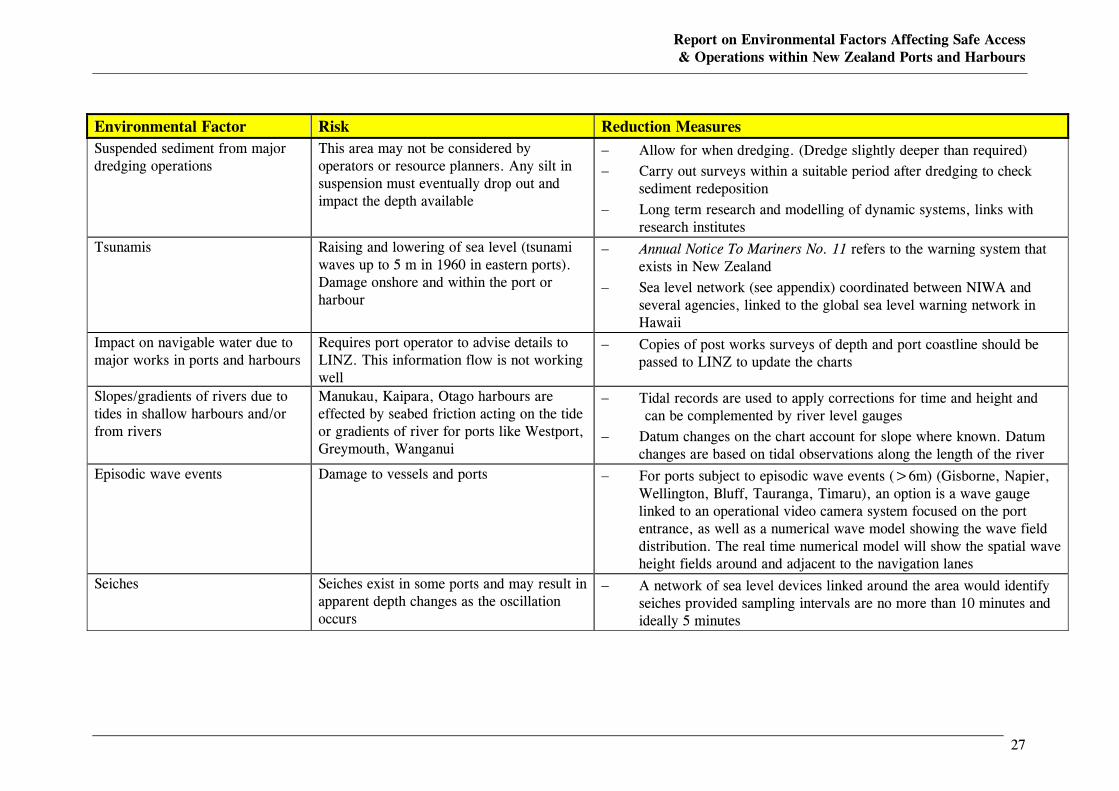
Environmental Factor Risk Reduction Measures Suspended sediment from major dredging operations
This area may not be considered by operators or resource planners. Any silt in suspension must eventually drop out and impact the depth available
− Allow for when dredging. (Dredge slightly deeper than required) − Carry out surveys within a suitable period after dredging to check
sediment redeposition − Long term research and modelling of dynamic systems, links with
research institutes Tsunamis Raising and lowering of sea level (tsunami
waves up to 5 m in 1960 in eastern ports). Damage onshore and within the port or harbour
− Annual Notice To Mariners No. 11 refers to the warning system that exists in New Zealand
− Sea level network (see appendix) coordinated between NIWA and several agencies, linked to the global sea level warning network in Hawaii
Impact on navigable water due to major works in ports and harbours
Requires port operator to advise details to LINZ. This information flow is not working well
− Copies of post works surveys of depth and port coastline should be passed to LINZ to update the charts
Slopes/gradients of rivers due to tides in shallow harbours and/or from rivers
Manukau, Kaipara, Otago harbours are effected by seabed friction acting on the tide or gradients of river for ports like Westport, Greymouth, Wanganui
− Tidal records are used to apply corrections for time and height and can be complemented by river level gauges
− Datum changes on the chart account for slope where known. Datum changes are based on tidal observations along the length of the river
Episodic wave events Damage to vessels and ports − For ports subject to episodic wave events (>6m) (Gisborne, Napier, Wellington, Bluff, Tauranga, Timaru), an option is a wave gauge linked to an operational video camera system focused on the port entrance, as well as a numerical wave model showing the wave field distribution. The real time numerical model will show the spatial wave height fields around and adjacent to the navigation lanes
Seiches Seiches exist in some ports and may result in apparent depth changes as the oscillation occurs
− A network of sea level devices linked around the area would identify seiches provided sampling intervals are no more than 10 minutes and ideally 5 minutes
27
Report on Environmental Factors Affecting Safe Access & Operations within New Zealand Ports and Harbours
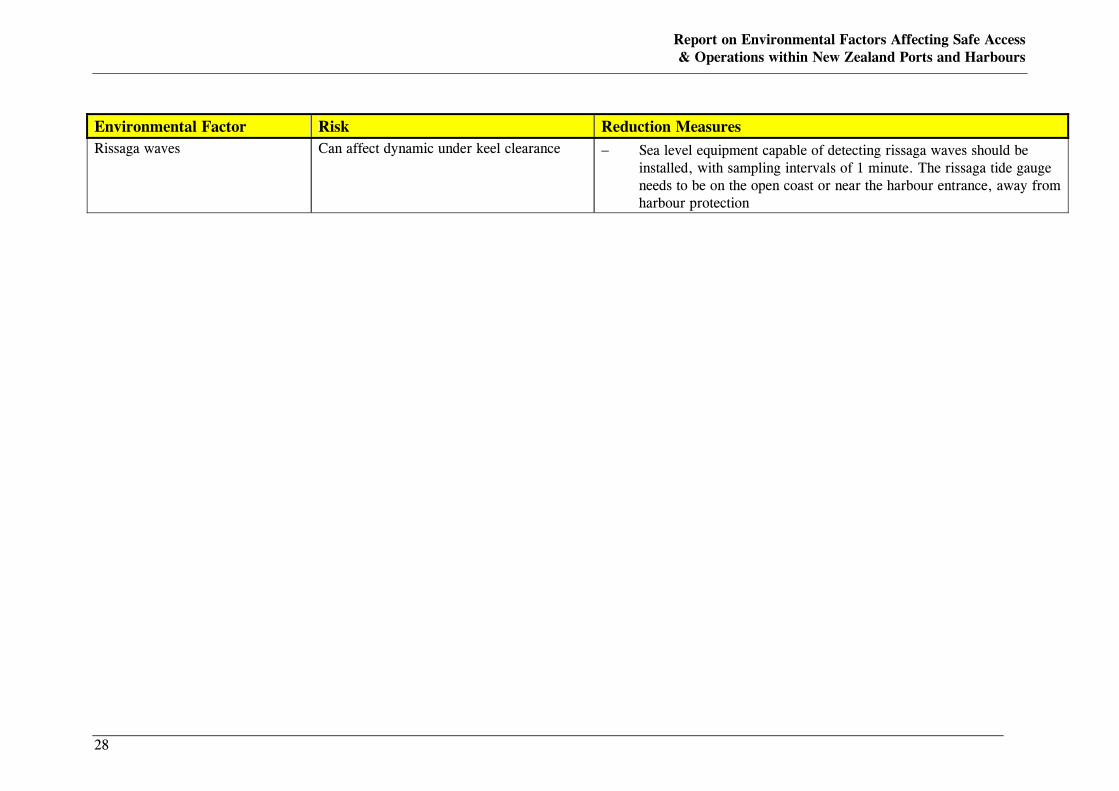
Environmental Factor Risk Reduction Measures Rissaga waves Can affect dynamic under keel clearance − Sea level equipment capable of detecting rissaga waves should be
installed, with sampling intervals of 1 minute. The rissaga tide gauge needs to be on the open coast or near the harbour entrance, away from harbour protection
28
Report on Environmental Factors Affecting Safe Access & Operations within New Zealand Ports and Harbours
Appendix A: Waves (definitions)
General Descriptions of waves can fill whole text books, but, because a number of different terms are used in this report and occur in various accident reports and technical literature, a brief discussion of the types of waves is given here. More information and articles are recommended in the NIWA EATF submission. This is available in full at www.msa.govt.nz Some of the terms are interlinked. The main points to note are what causes the wave, whether it was created in the immediate vicinity or at a great distance, and the height and period of the wave. Waves, essentially transfer energy. When waves arrive in shallower water they may be refracted (change direction), change height and change speed. Wave trains of characteristic wave length (period) and height travel from different wind source regions to reach the same sea area and can interact constructively or destructively. Where they are in phase the displacement is added (constructive interference), where they are out of phase the displacement is reduced (destructive interference). Wave “grouping” is also another aspect of wave behaviour that merits attention, including for UKC. Typically a sea state is a combination of waves of many heights, periods and propagation directions. When the sea state is dominated by swell with a small but finite range of periods and directions, this produces a “beating” effect, where a cluster of several (perhaps 5 to 10) larger wave crests are found grouped together, followed by several smaller waves. Waves can be measured by a variety of methods, for example pressure sensors on the sea floor (<10 m depth only), accelerometers in buoys on the surface, ADCP current meter that measures the underwater wave orbital motions, fixed wire capacitance sensors and remote sensing from satellites. Wave height, period and direction are all of interest.
Types of Waves Although there are small waves (<1.7 cm) such as capillary waves, the surface waves of interest to mariners are all termed gravity waves, this being the principal maintaining force. Waves affect ship movement and sediment transport. In particular, the effect on a ship’s hull also depends on the direction of the waves relative to the hull. Wind waves: these are caused by wind in the immediate vicinity and they have a period of ~ <7 seconds. Most sea surface waves are wind generated. The response of large ships to sea waves is usually very low. The occurrence of large sea waves is usually associated with strong winds, when wind waves can affect the ship’s motions. Swell: caused by a disturbance elsewhere and the waves have travelled from that place of origin. Swells are usually generated by pressure systems far away from the local area and have a period anywhere from 7 to 30 seconds. Sea swell can induce significant vessel motion, particularly in the vertical modes (heave, pitch and roll).
A1
Report on Environmental Factors Affecting Safe Access & Operations within New Zealand Ports and Harbours
Long period infragravity waves: A class of waves longer than swell waves, but shorter than tides. Formed from groups of swell waves that have coalesced after travelling hundreds of kilometres or generated by low pressure storm systems. They are more difficult to detect because they have periods of minutes and most wave detectors are set for a maximum of 20 to 24 second periods. Seiches: Standing waves that can occur in lakes, and in bays, harbours and estuaries that are open to the sea at one end. If the resonant period of the basin or harbour matches the period of the waves, then seiches (natural frequency oscillations) can occur and cause damage to vessels against harbour walls, or even grounding. The name originates from the tide-like oscillations of Lake Geneva in response to wind, but is now used to describe a water body oscillating at its natural frequency. Usually seiches in New Zealand are seldom more than 0.2 m, but, if present during a tsunami event, they can lead to a substantial amplification of the incoming tsunami wave. Rissaga: (also known as a meteorological tsunami) are long wave events that may be generated by fast moving low pressure systems. Typically, rissaga waves have very small wave heights that make them impossible to detect with the naked eye, and have periods of up to several minutes. They can reach up to 1 metre or more in wave height and cause surging of moored vessels in port. Rissaga is also another name given to a type of harbour seiche. The name originates from the 10 minute seiche (which can have amplitudes of up to 2 meters) at the Ciutadella Harbour on Menorca Island, which has caused great damage to the local fishing fleet. Tsunamis: A Japanese word for ocean waves of very great wave length, caused by either a seismic disturbance, volcano or slumping of submarine sediment masses due to gravitational instability. They commonly have wave lengths of hundreds of kilometres. The wave travels at great speed and the height is low until it reaches shallow water, where it can become destructively large near the shore. Tides: Waves generated by gravitational forces exerted by the sun and moon upon the oceans. The effects are on predictable cycles, but can be affected by, for instance, a barometric low pressure and wind set up. Storm surge: The response of the mean level of the ocean surface to changing weather conditions, especially atmospheric pressure and wind. A positive storm surge increases the sea level above the predicted tide and a negative storm surge is the converse, where the sea level is depressed below predicted tide levels. A positive storm surge arises from a combination of low barometric pressure and adverse winds piling water up against the coast, either by strong winds blowing directly onshore, or wind blowing parallel with the coastline, with the coast on its left. (Coriolis deflects the sea movement to the left in the southern hemisphere). Storm surges generated by storms in one area can also get trapped at the coast and move slowly along the coast to a distant location or port, and can therefore precede or arrive after the main storm surge event. These are known as coastal trapped waves. Constructive wave interference: When two or more wave patterns meet, the resulting sea surface can be approximated by adding the surface displacements of the separate wave patterns. The effect may be significant near vertical surfaces such as steep cliffs or harbour walls. Wave grouping: also known as infragravity waves. A combination of waves of many heights, periods and propagation directions can reinforce each other to produce larger waves, or cancel out to produce smaller waves. When the sea state is dominated by a swell with a small but finite range of periods and directions a cluster of several larger wave crests can be found together. The
A2
Report on Environmental Factors Affecting Safe Access & Operations within New Zealand Ports and Harbours
whole group of wave crests moves at a slower speed to the individual wave crests, which form at the rear of the group, and pass through and diminish at the front. This phenomena may be a consideration when making way through the shallowest sections of an approach channel in moderate swell, and can penetrate the port entrance to a limited extent to affect moored vessels. Freak waves: a combination of independent waves patterns combining in a non-linear way to produce, in certain circumstances, the build up of a “freak” wave that lies outside the statistical distribution of wave heights predicted. Storm surges: the response of the mean level of the ocean surface to changing weather conditions, especially atmospheric pressure and wind. A positive storm surge increases the sea level above the predicted tide and a negative storm surge is the converse, where the sea level is depressed below predicted tide levels. This can be caused by a high barometric pressure, winds blowing offshore or parallel to the shore with the coast to the wind’s right, and a draw down of ocean water due to a positive storm surge further away.
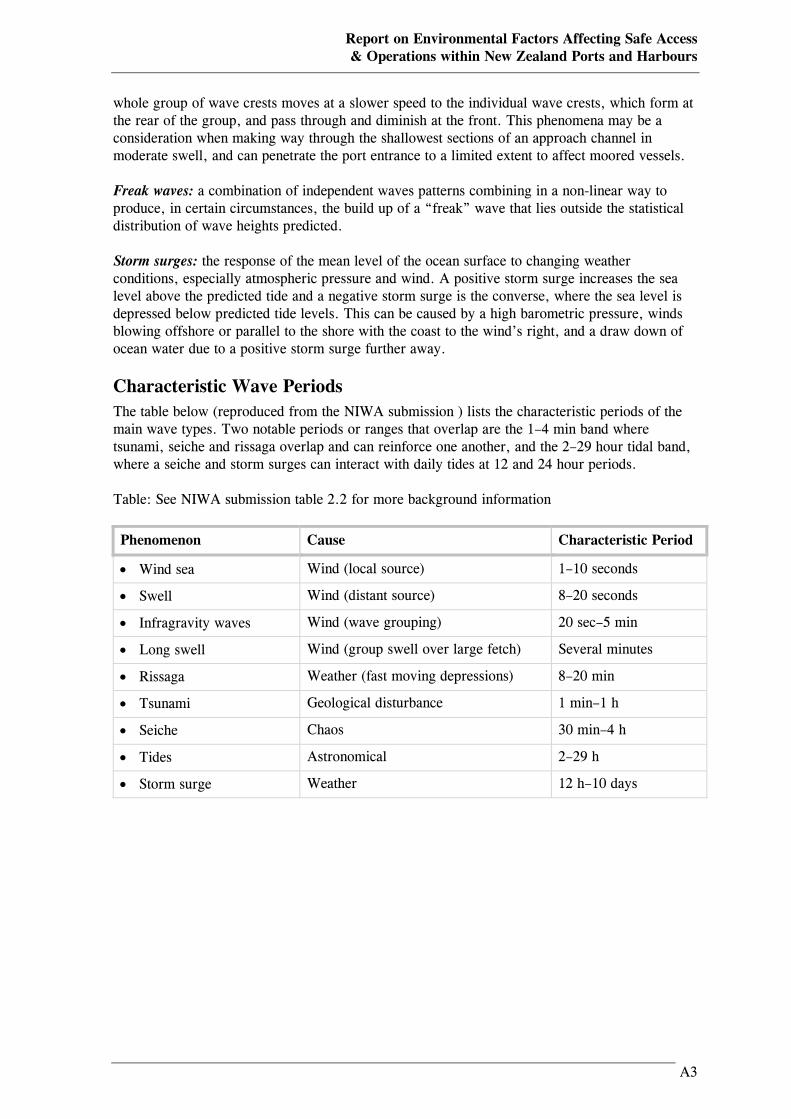
Characteristic Wave Periods The table below (reproduced from the NIWA submission ) lists the characteristic periods of the main wave types. Two notable periods or ranges that overlap are the 1–4 min band where tsunami, seiche and rissaga overlap and can reinforce one another, and the 2–29 hour tidal band, where a seiche and storm surges can interact with daily tides at 12 and 24 hour periods. Table: See NIWA submission table 2.2 for more background information
Phenomenon Cause Characteristic Period
• Wind sea Wind (local source) 1–10 seconds
• Swell Wind (distant source) 8–20 seconds
• Infragravity waves Wind (wave grouping) 20 sec–5 min
• Long swell Wind (group swell over large fetch) Several minutes
• Rissaga Weather (fast moving depressions) 8–20 min
• Tsunami Geological disturbance 1 min–1 h
• Seiche Chaos 30 min–4 h
• Tides Astronomical 2–29 h
• Storm surge Weather 12 h–10 days
A3

Report on Environmental Factors Affecting Safe Access & Operations within New Zealand Ports and Harbours
A4
Report on Environmental Factors Affecting Safe Access & Operations within New Zealand Ports and Harbours
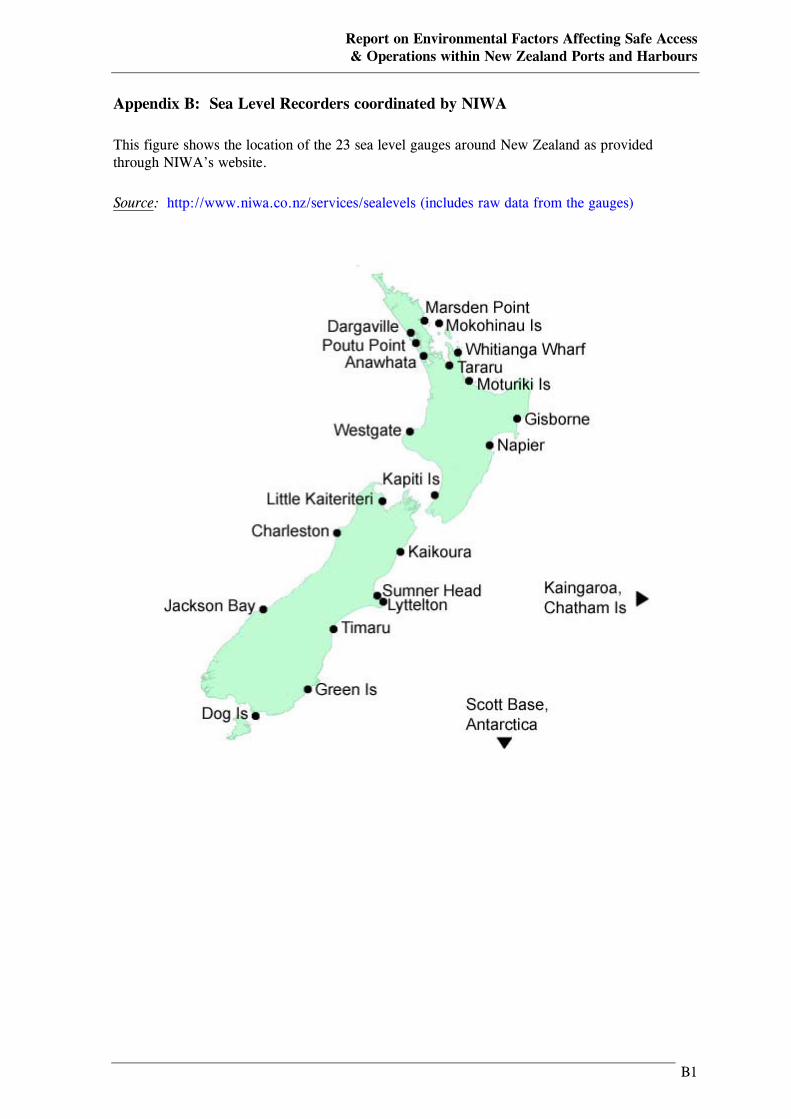
Appendix B: Sea Level Recorders coordinated by NIWA This figure shows the location of the 23 sea level gauges around New Zealand as provided through NIWA’s website.
Source: http://www.niwa.co.nz/services/sealevels (includes raw data from the gauges)
B1

Report on Environmental Factors Affecting Safe Access & Operations within New Zealand Ports and Harbours
B2
Report on Environmental Factors Affecting Safe Access & Operations within New Zealand Ports and Harbours
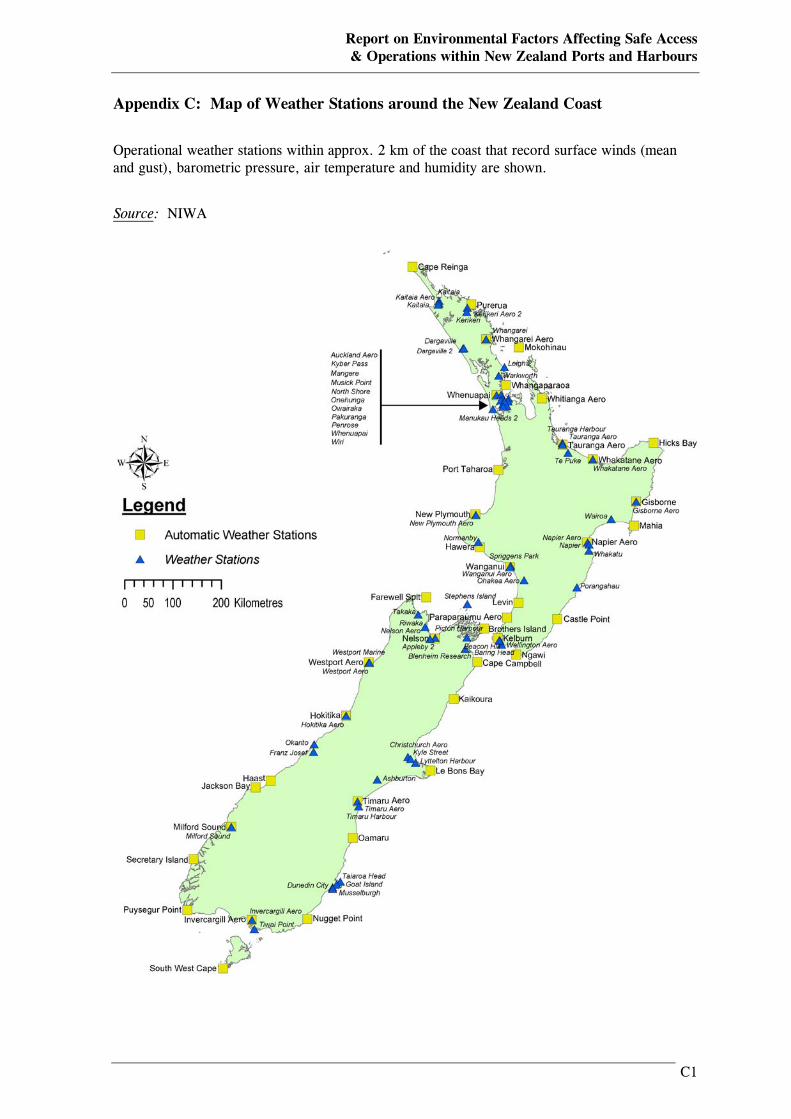
Appendix C: Map of Weather Stations around the New Zealand Coast
Operational weather stations within approx. 2 km of the coast that record surface winds (mean and gust), barometric pressure, air temperature and humidity are shown.
Source: NIWA
C1

Report on Environmental Factors Affecting Safe Access & Operations within New Zealand Ports and Harbours
C2
Report on Environmental Factors Affecting Safe Access & Operations within New Zealand Ports and Harbours
Appendix D: MetService EATF Submission
The following appendix contains the full MetService EATF submission. The information contained in the submission is provided to users of this report for information on the capabilities of, and services available from, the service.
D1

Report on Environmental Factors Affecting Safe Access & Operations within New Zealand Ports and Harbours
D2
D-3
WEATHER FORECASTS FOR NEW ZEALAND COASTS AND PORTS
- a report in response to an Invitation to Comment onNEW ZEALAND PORT & HARBOUR SAFETY CODE & ASSOCIATED GUIDELINES(MSA January 2004)
Meteorological Service of New Zealand Ltd30 Salamanca Rd PO Box 722Wellington, New ZealandTelephone +64-4-4700700Facsimile +64-4-4735231www.metservice.comwww.metservice.co.nz
Authors:Rod StainerRoss Marsden
--------------------------------------------------------------------------------------------------WEATHER FORECASTS FOR NEW ZEALAND COASTS AND PORTSMeteorological Service of New Zealand Limited21 Sep 2004
D-4
WEATHER FORECASTS FOR NEW ZEALAND COASTS AND PORTS
1. Background MeteorologyEncircling the Earth at New Zealand's latitudes is a belt of strong westerly winds. Withinthis belt of westerly winds is an eastward-moving succession of troughs of low pressureand ridges of high pressure. As each of these weather systems passes by, the windsvary in strength and direction, and the weather varies, in a more or less predictable way.If weather systems are passing quickly through the New Zealand area, and/or changingrapidly in nature, changes in wind and weather conditions can be large and sudden.
New Zealand is essentially two long, narrow, mountainous islands lying across this belt ofstrong westerlies. For any given wind flow, New Zealand's topography creates largedifferences in wind speed and direction, and weather, from place to place. It can alsoaccentuate changes in winds and weather as troughs of low pressure and ridges of highpressure pass by.
New Zealand is surrounded by vast expanses of ocean. The nearest continent, Australia,is 2000 kilometres away. This means that the New Zealand coast is exposed to swellsgenerated by distant storms from just about any direction.
2. Forecasting ServicesNational Meteorological Services were set up in many countries in the latter part of the19th century in order to provide warnings of adverse weather to shipping and helpminimise losses. Today, services to shipping and the marine industry still form asignificant part of the work of National Meteorological Services. Basic forecasts andwarnings for mariners are coordinated on a global basis through the World MeteorologicalOrganization (WMO) and supplied as part of the Global Maritime Distress and SafetySystem (GMDSS).
Marine forecast services provided by MetService, funded by the New ZealandGovernment through an Agreement for Meteorological Services with the Minister ofTransport include:
2.1. Warnings and forecasts for the high seas*The high seas areas for which MetService produces forecasts are shown inAppendix I. Warnings for the high seas are routinely issued four times a day andforecasts twice a day. Forecasts are valid for a 24-hour period.
2.2. Warnings and forecasts for coastal waters of New Zealand*These are issued four times a day for 18 sea areas within 60 nautical miles of thecoast around mainland New Zealand, and the sea area within 60 nautical miles ofthe Chatham Islands. Forecasts are valid for 24 hours with an outlook for thefollowing 12 hours. Details of the forecast areas, the issue times and examples arein Appendix II. The product is known as the Marine Weather Bulletin for NZ CoastalWaters.
2.3. Inshore forecasts for recreational users*These are issued four times daily and are aimed at boat operations in harbours andcoastal areas but generally within about 10 kilometres of the shore. The areas forwhich forecasts are issued, and examples, are shown in Appendix III.
2.4. Swell warnings for designated parts of the coast*These are issued to some Regional Councils for heavy swells which may causedamage to coastal areas.
2.5. Forecasts for specified locations and areasMetService provides forecasts on request for specific locations. The format of theforecast is specified by the customer. Examples of these forecast are in theAppendix.
--------------------------------------------------------------------------------------------------WEATHER FORECASTS FOR NEW ZEALAND COASTS AND PORTSMeteorological Service of New Zealand Limited21 Sep 2004
D-5
2.6. Mean Sea Level analysis and prognosis charts*MSL charts for the Tasman Sea and South Pacific Ocean are disseminated byradiofax, and are available on the MetService web site.
2.7. Warnings of abnormally high sea level*Advice is provided on the likelihood of abnormally high water for east coast areasfrom the Bay of Islands down to the Firth of Thames, around the CoromandelPeninsula and along the Bay of Plenty coastline.
3. Other Marine forecasts that could be developed
3.1. Extended Range Marine forecastsMetService has issued five-day forecasts for land areas since the early 1980s. It isnow possible to provide five-day forecasts for marine purposes. For example, theSituation statement in Part I of the Marine Weather Bulletin for NZ Coastal Watersnow mentions possible severe weather conditions beyond the outlook period. Manyother extended range types of marine forecasts are possible. MetService iscurrently in discussions with the Ministry of Transport over including such servicesas part of the Agreement for Meteorological Services with the Minister.
3.2. Port Forecasts WMO recommends that National Meteorological Services provide forecasts for portsand their approaches. Historically, MetService has never done so, and suchservices are not part of the contract with the Minister of Transport. There are policyissues over whether such services should be publicly funded or provided as acommercial service for the specific benefit of port companies and users.
Port forecasts would offer benefits in terms of efficiency and safety for operationssuch as:
• Docking of ships, including mooring• Loading by ships and shore cranes• Container stacking• Tug and pilot operations, approach and departure over bars or shallows
Port forecasts could be issued daily and updated as required. They would contain asection for the approaches, and one for the docks and cargo handling area.Forecasts would contain elements such as:
• Situation statement• Wind and gusts• Weather and visibility• Sea, swell and combined waves in terms of significant and extreme wave height• Special conditions such as severe weather (for example, thunderstorms,
localised severe winds, long-wave1 episodes, abnormal high or low sea level,storm surge, fog, ice accretion).
1 Long-waves are a sea wave phenomenon, sometimes called rissaga, which have only recently been observed andresearched. They are believed to affect mainly the east coasts of New Zealand, and are associated with deepdepressions well to the east of the country.
--------------------------------------------------------------------------------------------------WEATHER FORECASTS FOR NEW ZEALAND COASTS AND PORTSMeteorological Service of New Zealand Limited21 Sep 2004
D-6
4. Additional Information Required to Support a Wider Range of Marine ForecastsAt present there are relatively few observations of weather, wind, sea and swell availableto MetService. However, there are increasing numbers of wave riders and anemometersat New Zealand ports. Information from these systems would contribute significantly tothe accuracy and reliability of all types of marine forecasts.Other ways that observations at sea could be increased are• Automatic weather stations (AWS) on ships (such as that on the MV Tangaroa
operated by NIWA)• Formal coded SHIP reports• Informal plain language reports via the existing network of coastal radio stations or
via the Coastguard
5. Limitations of Marine ForecastsCoastal forecasts, because of the requirement for clarity and brevity, express the mostlikely conditions over the greater part of the area. As such, some phenomena, areas andsmall-scale variations are not covered.5.1. The coastal marine forecasts do not cover inlets and inland waterways, or areas
close inshore. This is addressed in some locations by the presence of the inshore(so-called “recreational”) forecast areas.
5.2. Wind speed ranges are not given, but a range of plus or minus 5 knots is implied,and wind speeds are in increments of 5 knots. Significant changes or variations inwind speed in time or location are mentioned. Gusts are not mentioned but usersshould note that they may be as much as 50% more than the average wind speed.
5.3. Special wind phenomena that may occur near large coastal landforms are notspecifically mentioned unless they are expected to cover a large portion of the area.
5.4. State of sea and swell are mentioned as separate phenomena, although they maybe indistinguishable when experienced.. The state of the sea is described inqualitative terms (“slight”, “rough”, etc.), and the significant wave height of the swellis forecast in whole metres2. Extreme sea and swell heights and combined waveheights are not given.
5.5. Variations in swell height or direction due to shoaling and refraction are notmentioned.
6. Maritime HazardsSome parts of the New Zealand coast are exposed to specific hazards.6.1. The east coast from East Cape to Foveaux Strait is exposed to heavy swells
generated by large storms in the South Pacific Ocean. There are warningprocedures in place to notify Regional Authorities of heavy swells affecting parts ofthe coast that are prone to erosion, flooding or damage to infrastructure.
6.2. Northern ports from Taranaki to Northland and Bay of Plenty may be affected by theclose approach of severe depressions having their origins as Tropical Cyclones.Hazards associated with these storms are severe wind, heavy swell, storm surge,and abnormal sea level.
2 Significant wave height is a defined technical term that is assumed to have a well-known meaning – the averageheight of the highest 1/3 of the (swell) waves present.Sea waves are those waves that are being generated and maintained by the wind in the vicinity. Swell waves arewaves that have propagated into the area, having been generated by wind somewhere else, possibly thousands ofkilometres away.
--------------------------------------------------------------------------------------------------WEATHER FORECASTS FOR NEW ZEALAND COASTS AND PORTSMeteorological Service of New Zealand Limited21 Sep 2004
D-7
7. Enclosed Waterways
7.1. The only lakes for which forecasts are issued are Lake Rotorua and Lake Taupo.These are issued four times daily and distributed with the forecasts for thesurrounding land areas. These forecasts are currently funded through commercialsources, but MetService is in discussions with the Ministry of Transport aboutincluding them in the Agreement for Meteorological Services.
7.2. Forecasts could be prepared for specific harbours and bays of other enclosedwaterways such as Hokianga Harbour, Kaipara Harbour, Lake Waikaremoana, LakeWakatipu and Lake Manapouri.
8. Marine Forecast Supplier Licensing
In considering the provision of meteorological information by bona fide suppliers, it isuseful to outline the situation for the provision of meteorological information to theinternational aviation industry.The Government of New Zealand is a signatory of the ICAO Convention on InternationalCivil Aviation, which provides for the appointment of a designated MeteorologicalAuthority. The Meteorological Authority arranges for the provision of services forinternational civil aviation.
In New Zealand the Meteorological Authority is the Civil Aviation Authority, but CAA doesnot actually provide meteorological services. There is a certification framework ofstandards and quality with which meteorological service providers must comply in order toobtain certification. To obtain their own certificates to operate, civil aviation operatorsmust obtain their meteorological information from a certified provider.
It is conceivable that a similar system could be introduced and operated by the MaritimeSafety Authority.
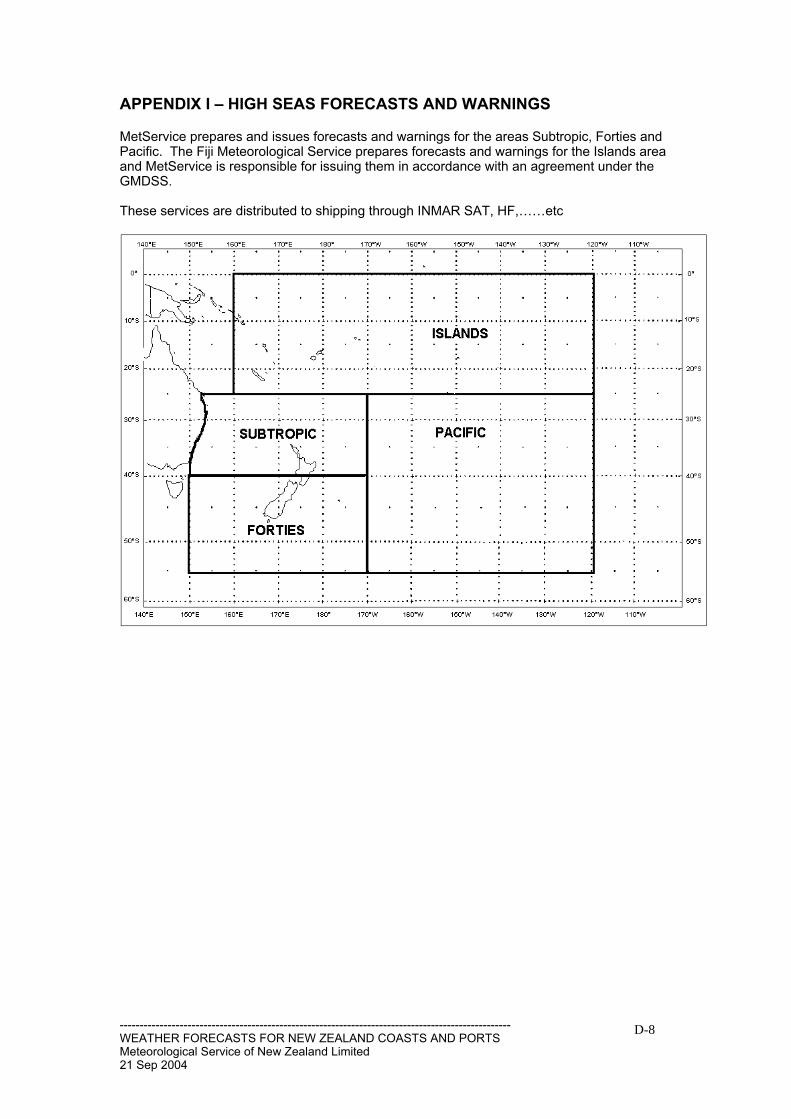
--------------------------------------------------------------------------------------------------WEATHER FORECASTS FOR NEW ZEALAND COASTS AND PORTSMeteorological Service of New Zealand Limited21 Sep 2004
D-8
APPENDIX I – HIGH SEAS FORECASTS AND WARNINGS
MetService prepares and issues forecasts and warnings for the areas Subtropic, Forties andPacific. The Fiji Meteorological Service prepares forecasts and warnings for the Islands areaand MetService is responsible for issuing them in accordance with an agreement under theGMDSS.
These services are distributed to shipping through INMAR SAT, HF,……etc
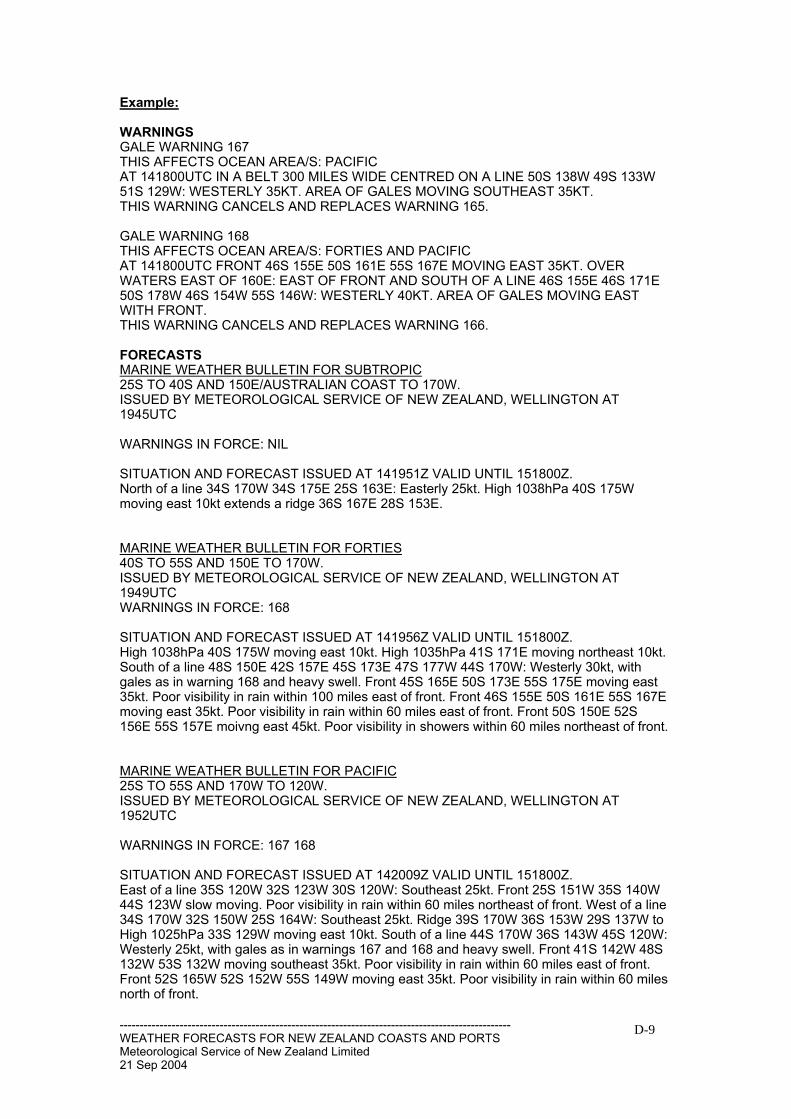
--------------------------------------------------------------------------------------------------WEATHER FORECASTS FOR NEW ZEALAND COASTS AND PORTSMeteorological Service of New Zealand Limited21 Sep 2004
D-9
Example:
WARNINGSGALE WARNING 167THIS AFFECTS OCEAN AREA/S: PACIFICAT 141800UTC IN A BELT 300 MILES WIDE CENTRED ON A LINE 50S 138W 49S 133W51S 129W: WESTERLY 35KT. AREA OF GALES MOVING SOUTHEAST 35KT.THIS WARNING CANCELS AND REPLACES WARNING 165.
GALE WARNING 168THIS AFFECTS OCEAN AREA/S: FORTIES AND PACIFICAT 141800UTC FRONT 46S 155E 50S 161E 55S 167E MOVING EAST 35KT. OVERWATERS EAST OF 160E: EAST OF FRONT AND SOUTH OF A LINE 46S 155E 46S 171E50S 178W 46S 154W 55S 146W: WESTERLY 40KT. AREA OF GALES MOVING EASTWITH FRONT.THIS WARNING CANCELS AND REPLACES WARNING 166.
FORECASTSMARINE WEATHER BULLETIN FOR SUBTROPIC25S TO 40S AND 150E/AUSTRALIAN COAST TO 170W.ISSUED BY METEOROLOGICAL SERVICE OF NEW ZEALAND, WELLINGTON AT1945UTC
WARNINGS IN FORCE: NIL
SITUATION AND FORECAST ISSUED AT 141951Z VALID UNTIL 151800Z.North of a line 34S 170W 34S 175E 25S 163E: Easterly 25kt. High 1038hPa 40S 175Wmoving east 10kt extends a ridge 36S 167E 28S 153E.
MARINE WEATHER BULLETIN FOR FORTIES40S TO 55S AND 150E TO 170W.ISSUED BY METEOROLOGICAL SERVICE OF NEW ZEALAND, WELLINGTON AT1949UTCWARNINGS IN FORCE: 168
SITUATION AND FORECAST ISSUED AT 141956Z VALID UNTIL 151800Z.High 1038hPa 40S 175W moving east 10kt. High 1035hPa 41S 171E moving northeast 10kt.South of a line 48S 150E 42S 157E 45S 173E 47S 177W 44S 170W: Westerly 30kt, withgales as in warning 168 and heavy swell. Front 45S 165E 50S 173E 55S 175E moving east35kt. Poor visibility in rain within 100 miles east of front. Front 46S 155E 50S 161E 55S 167Emoving east 35kt. Poor visibility in rain within 60 miles east of front. Front 50S 150E 52S156E 55S 157E moivng east 45kt. Poor visibility in showers within 60 miles northeast of front.
MARINE WEATHER BULLETIN FOR PACIFIC25S TO 55S AND 170W TO 120W.ISSUED BY METEOROLOGICAL SERVICE OF NEW ZEALAND, WELLINGTON AT1952UTC
WARNINGS IN FORCE: 167 168
SITUATION AND FORECAST ISSUED AT 142009Z VALID UNTIL 151800Z.East of a line 35S 120W 32S 123W 30S 120W: Southeast 25kt. Front 25S 151W 35S 140W44S 123W slow moving. Poor visibility in rain within 60 miles northeast of front. West of a line34S 170W 32S 150W 25S 164W: Southeast 25kt. Ridge 39S 170W 36S 153W 29S 137W toHigh 1025hPa 33S 129W moving east 10kt. South of a line 44S 170W 36S 143W 45S 120W:Westerly 25kt, with gales as in warnings 167 and 168 and heavy swell. Front 41S 142W 48S132W 53S 132W moving southeast 35kt. Poor visibility in rain within 60 miles east of front.Front 52S 165W 52S 152W 55S 149W moving east 35kt. Poor visibility in rain within 60 milesnorth of front.
--------------------------------------------------------------------------------------------------WEATHER FORECASTS FOR NEW ZEALAND COASTS AND PORTSMeteorological Service of New Zealand Limited21 Sep 2004
D-10
MARINE WEATHER BULLETIN FOR ISLANDS AREA5N TO 25S BETWEEN 160E AND 180 AND EQ TO 25S BETWEEN 180 AND 120W.ISSUED BY FIJI METEOROLOGICAL SERVICE Apr 142000 UTC.
PART 1 : WARNING GALE WARNING 034 issued from RSMC NADI Apr 14/1922 UTC 2004UTC.SOUTHEAST WINDS 30 TO 35 KNOTS IN THE AREA BOUNDED 16S 170E 17S 175E 19S174E 18S 170E 16S 170E. AREA OF GALES SLOW MOVING.THIS WARNING CANCELS AND REPLACES PREVIOUS NIL WARNING
PARTS 2 AND 3 : SYNOPSIS AND FORECAST VALID UNTIL Apr 151800 UTC.
CONVERGENCE ZONE CZ1 15S 160E 17S 170E 17S 180 16S 170W SLOW MOVING.POOR VISIBILITY IN RAIN AND SQUALLY THUNDERSTORMS WITHIN 300 MILESSOUTH OF CZ1.
CONVERGENCE ZONE CZ2 02S 180 06S 170W 10S 160W 13S 150W 15S 140W SLOWMOVING. POOR VISIBILITY IN RAIN AND SQUALLY THUNDERSTORMS WITHIN 300MILES OF CZ2 IN AREA BETWEEN 160W AND 145W. ELSEWHERE SOME SHOWERSAND THUNDERSTORMS WITHIN 150 MILES OF CZ2.
CONVERGEBCE ZONE CZ3 09S 160E 13S 163E SLOW MOVING. POOR VISIBILITY INOCCASIONAL SHOWERS AND ISOLATED THUNDERSTORMS WITHIN 100 MILES OFCZ3.
STATIONARY FRONT SF1 23S 170E 23S 180 23S 170W 25S 160W. POOR VISIBILITY INRAIN AND ISOLATED THUNDERSTORMS WITHIN 180 MILES OF SF1.
SOUTHEAST WINDS 25 TO 30 KNOTS IN AREA BOUNDED BY 19S 175E 24S 171E 25S168W 22S 165W 19S 175E. ROUGH TO VERY ROUGH SEAS. MODERATE SOUTHEASTSWELLS.
WINDS GUSTING UP TO 40 KNOTS IN THUNDERSTORM SQUALLS.
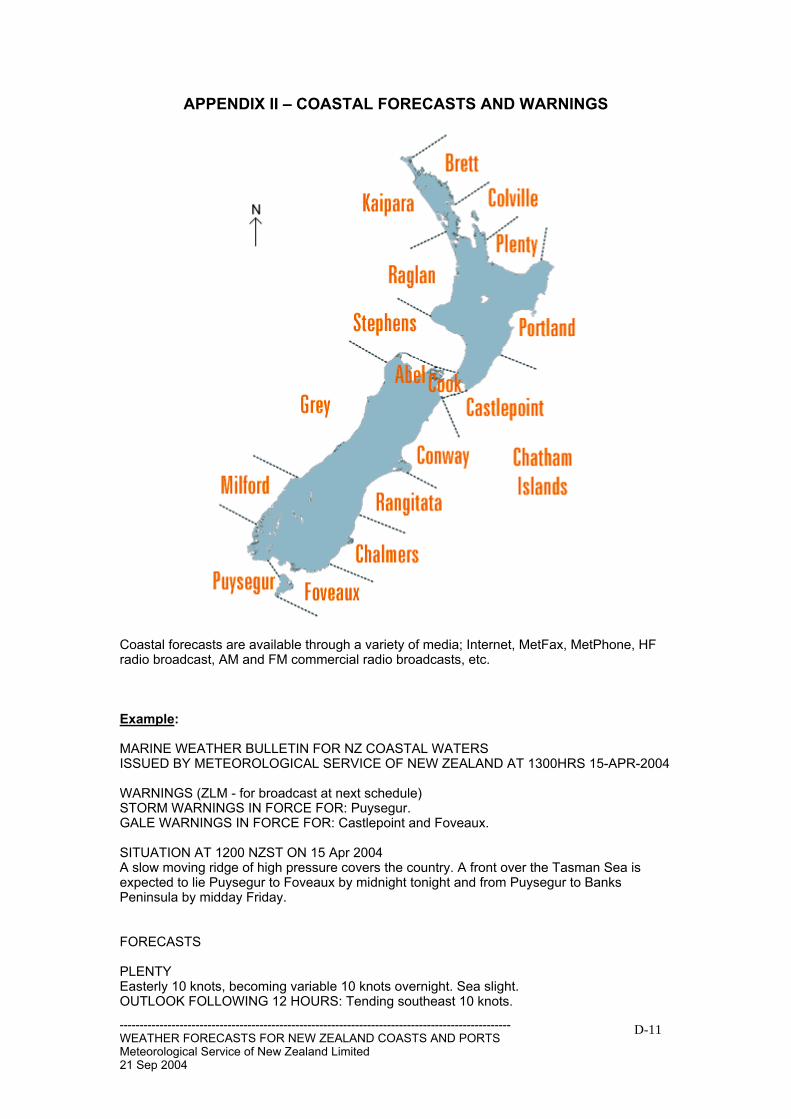
--------------------------------------------------------------------------------------------------WEATHER FORECASTS FOR NEW ZEALAND COASTS AND PORTSMeteorological Service of New Zealand Limited21 Sep 2004
D-11
APPENDIX II – COASTAL FORECASTS AND WARNINGS
Coastal forecasts are available through a variety of media; Internet, MetFax, MetPhone, HFradio broadcast, AM and FM commercial radio broadcasts, etc.
Example:
MARINE WEATHER BULLETIN FOR NZ COASTAL WATERSISSUED BY METEOROLOGICAL SERVICE OF NEW ZEALAND AT 1300HRS 15-APR-2004
WARNINGS (ZLM - for broadcast at next schedule)STORM WARNINGS IN FORCE FOR: Puysegur.GALE WARNINGS IN FORCE FOR: Castlepoint and Foveaux.
SITUATION AT 1200 NZST ON 15 Apr 2004A slow moving ridge of high pressure covers the country. A front over the Tasman Sea isexpected to lie Puysegur to Foveaux by midnight tonight and from Puysegur to BanksPeninsula by midday Friday.
FORECASTS
PLENTYEasterly 10 knots, becoming variable 10 knots overnight. Sea slight.OUTLOOK FOLLOWING 12 HOURS: Tending southeast 10 knots.
--------------------------------------------------------------------------------------------------WEATHER FORECASTS FOR NEW ZEALAND COASTS AND PORTSMeteorological Service of New Zealand Limited21 Sep 2004
D-12
COLVILLE BRETTEasterly easing to 15 knots this afternoon. Moderate sea easing.OUTLOOK FOLLOWING 12 HOURS: Southeast 15 knots.
KAIPARA Easterly 10 knots. Sea slight. Southwest swell 1 metre.OUTLOOK FOLLOWING 12 HOURS: Southeast 10 knots.
RAGLAN Variable 10 knots. Sea slight. Southwest swell 1 metre.OUTLOOK FOLLOWING 12 HOURS: Tending southwest 10 knots.
STEPHENS Northwest 15 knots. Sea slight. Southwest swell 1 metre in the west.OUTLOOK FOLLOWING 12 HOURS: Westerly 15 knots.
COOKNorthwest 30 knots, easing to 20 knots in the morning. Rough sea easing. Southerly swell 1metre. Northerly swell 1 metre, easing.OUTLOOK FOLLOWING 12 HOURS: Northwest 20 knots, dying out.
CASTLEPOINT *GALE WARNING IN FORCE*Northwest rising to 35 knots tonight and easing to 25 knots in the morning. Sea becomingvery rough for a time. Southerly swell 1 metre.OUTLOOK FOLLOWING 12 HOURS: Becoming southwest 10 knots.
PORTLANDNortheast 15 knots, tending northwest overnight. Sea slight. Southerly swell 1 metre.OUTLOOK FOLLOWING 12 HOURS: Becoming southwest 10 knots.
ABELNorthwest 15 knots. Sea slight.OUTLOOK FOLLOWING 12 HOURS: Northwest 10 knots.
GREYNorth of Cape Foulwind: Variable 10 knots, becoming southwest 15 knots this afternoon andrising to 25 knots in the morning. Elsewhere: Northerly 15 knots, becoming southwest 15knots in the morning. Sea becoming rough in the north. Southwest swell rising to 2 metres.Poor visibility in rain developing this evening.OUTLOOK FOLLOWING 12 HOURS: Southwest 15 knots throughout.
MILFORDNortherly 30 knots, easing to northwest 20 knots overnight. Rough sea easing. Westerly swellrising to 3 metres. Poor visibility in rain.OUTLOOK FOLLOWING 12 HOURS: Northwest 20 knots, easing.
PUYSEGUR *STORM WARNING IN FORCE*Northwest 50 knots, easing to 40 knots this afternoon and to 30 knots but 20 knots south ofPuysegur Point late evening. Becoming northwest 20 knots but variable 10 knots in the southin the morning. High sea easing. Northwest swell 3 metres, easing. Southwest swell rising to3 metres. Poor visibility in rain.OUTLOOK FOLLOWING 12 HOURS: Northwest 20 knots throughout.
FOVEAUX *GALE WARNING IN FORCE*Northwest 40 knots, easing to westerly 25 knots early evening and becoming variable 10knots in the morning. Very rough sea easing. Southwest swell rising to 3 metres. Poorvisibility in evening rain. OUTLOOK FOLLOWING 12 HOURS: Westerly 15 knots.
CHALMERSNorthwest 25 knots, becoming southwest 15 knots in the morning. Rough sea easing.Southwest swell rising to 3 metres. Fair visibility in showers.OUTLOOK FOLLOWING 12 HOURS: Westerly 10 knots.
--------------------------------------------------------------------------------------------------WEATHER FORECASTS FOR NEW ZEALAND COASTS AND PORTSMeteorological Service of New Zealand Limited21 Sep 2004
D-13
RANGITATA Northwest rising to 20 knots this evening and becoming southwest 15 knots inthe morning. Sea becoming moderate for a time. Southwest swell rising to 2 metres.OUTLOOK FOLLOWING 12 HOURS: Variable 10 knots.
CONWAY Northwest 20 knots. Sea moderate. Southwest swell rising to 2 metres.OUTLOOK FOLLOWING 12 HOURS: Westerly easing to 10 knots.
CHATHAM ISLANDS Northwest 20 knots, rising to 30 knots this evening. Sea becomingrough. Southwest swell rising to 3 metres.OUTLOOK FOLLOWING 12 HOURS: Becoming southwest 25 knots.
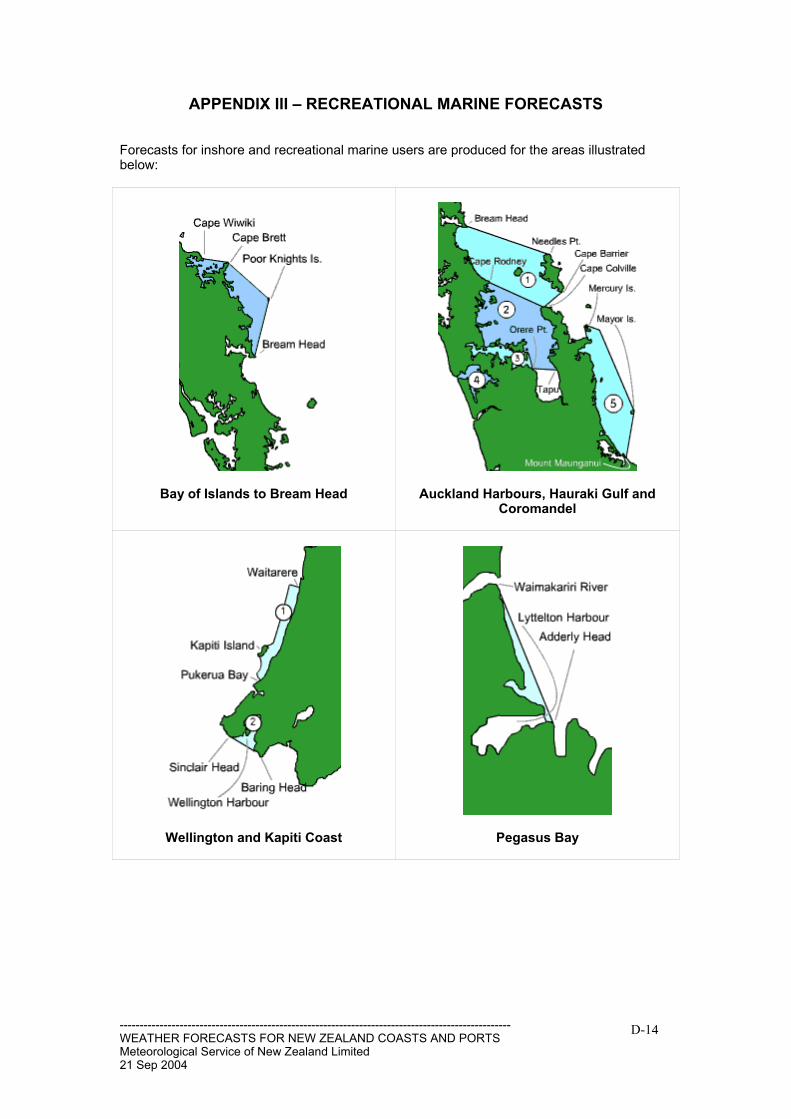
--------------------------------------------------------------------------------------------------WEATHER FORECASTS FOR NEW ZEALAND COASTS AND PORTSMeteorological Service of New Zealand Limited21 Sep 2004
D-14
APPENDIX III – RECREATIONAL MARINE FORECASTS
Forecasts for inshore and recreational marine users are produced for the areas illustratedbelow:
Bay of Islands to Bream Head Auckland Harbours, Hauraki Gulf andCoromandel
Wellington and Kapiti Coast Pegasus Bay
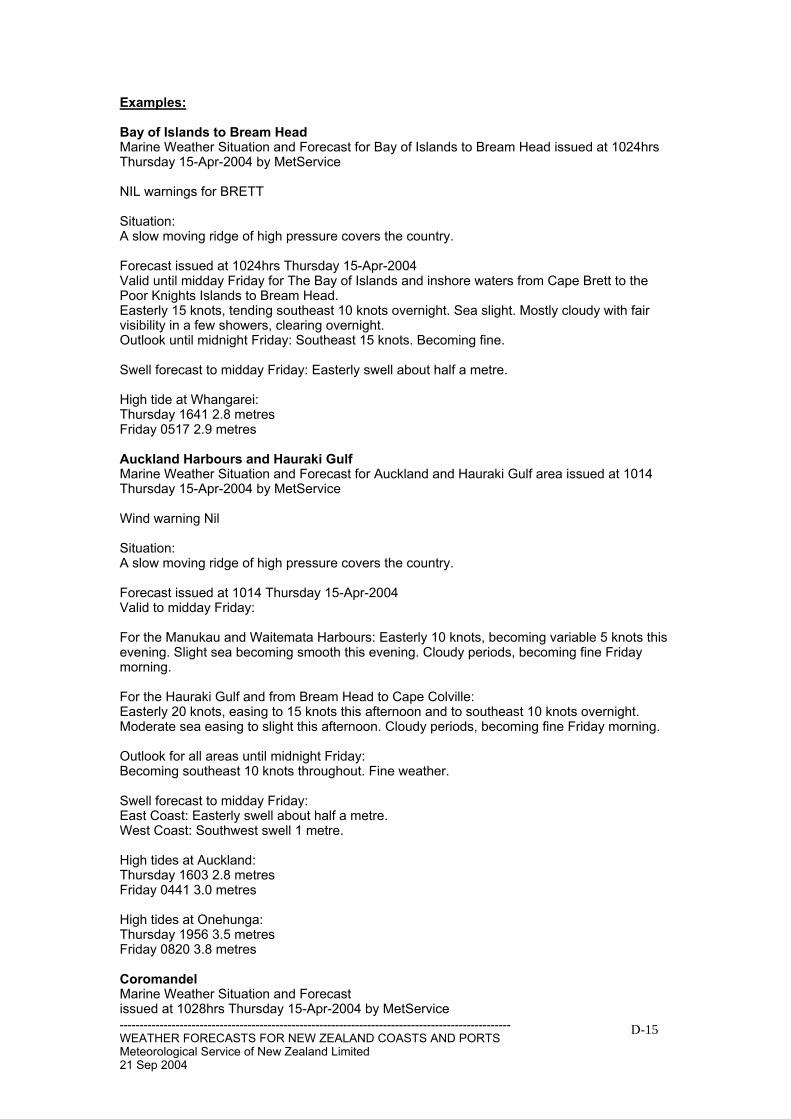
--------------------------------------------------------------------------------------------------WEATHER FORECASTS FOR NEW ZEALAND COASTS AND PORTSMeteorological Service of New Zealand Limited21 Sep 2004
D-15
Examples:
Bay of Islands to Bream HeadMarine Weather Situation and Forecast for Bay of Islands to Bream Head issued at 1024hrsThursday 15-Apr-2004 by MetService
NIL warnings for BRETT
Situation:A slow moving ridge of high pressure covers the country.
Forecast issued at 1024hrs Thursday 15-Apr-2004Valid until midday Friday for The Bay of Islands and inshore waters from Cape Brett to thePoor Knights Islands to Bream Head.Easterly 15 knots, tending southeast 10 knots overnight. Sea slight. Mostly cloudy with fairvisibility in a few showers, clearing overnight.Outlook until midnight Friday: Southeast 15 knots. Becoming fine.
Swell forecast to midday Friday: Easterly swell about half a metre.
High tide at Whangarei:Thursday 1641 2.8 metresFriday 0517 2.9 metres
Auckland Harbours and Hauraki GulfMarine Weather Situation and Forecast for Auckland and Hauraki Gulf area issued at 1014Thursday 15-Apr-2004 by MetService
Wind warning Nil
Situation:A slow moving ridge of high pressure covers the country.
Forecast issued at 1014 Thursday 15-Apr-2004Valid to midday Friday:
For the Manukau and Waitemata Harbours: Easterly 10 knots, becoming variable 5 knots thisevening. Slight sea becoming smooth this evening. Cloudy periods, becoming fine Fridaymorning.
For the Hauraki Gulf and from Bream Head to Cape Colville:Easterly 20 knots, easing to 15 knots this afternoon and to southeast 10 knots overnight.Moderate sea easing to slight this afternoon. Cloudy periods, becoming fine Friday morning.
Outlook for all areas until midnight Friday:Becoming southeast 10 knots throughout. Fine weather.
Swell forecast to midday Friday:East Coast: Easterly swell about half a metre.West Coast: Southwest swell 1 metre.
High tides at Auckland:Thursday 1603 2.8 metresFriday 0441 3.0 metres
High tides at Onehunga:Thursday 1956 3.5 metresFriday 0820 3.8 metres
CoromandelMarine Weather Situation and Forecastissued at 1028hrs Thursday 15-Apr-2004 by MetService
--------------------------------------------------------------------------------------------------WEATHER FORECASTS FOR NEW ZEALAND COASTS AND PORTSMeteorological Service of New Zealand Limited21 Sep 2004
D-16
NIL warnings for PLENTY
Situation:A slow moving ridge of high pressure covers the country.
Forecast issued at 1028hrs Thursday 15-Apr-2004Valid until midday Friday for Inshore waters from Great Mercury Island to Mayor Island to MtMaunganuiEasterly 15 knots, easing to 10 knots tonight and becoming variable 5 knots Friday morning.Slight sea becoming smooth Friday morning. Cloudy periods, clearing and becoming fineFriday morning.
Outlook until midnight Friday: Northeast 10 knots, becoming southwest 10 knots. Mainly fine.
Swell forecast to midday Friday: Easterly swell about half a metre.
High tide at Tauranga:Thursday 1546 1.7 metresFriday 0423 1.8 metres
Kapiti CoastMarine Weather Situation and Forecastissued at 1036HRS Thursday 15-Apr-2004
NIL warnings for COOK or STEPHENS.
Situation:A slow moving ridge of high pressure covers much of the country.
Forecast issued 1036HRS Thursday 15-Apr-2004Valid to midday Friday for Inshore waters from Waitarere to Pukerua Bay and out to KapitiIsland. Northwest 15 knots, rising to 20 knots this evening. Slight sea, becoming moderatethis evening. Cloudy periods.
Outlook until midnight Friday: Westerly easing to 10 knots. Becoming fine.
Swell forecast to midday Friday:No significant swell.
High tides at Paraparaumu:Thursday 1854 1.5 metresFriday 0717 1.6 metres
WellingtonMarine Weather Situation and Forecastissued at 1033HRS Thursday 15-Apr-2004 by MetService
NIL warnings for COOK
Situation: A slow moving ridge of high pressure covers much of the country.
Forecast issued at 1033HRS Thursday 15-Apr-2004Valid until midday Friday for Wellington Harbour and the south coast from Sinclair Head toBaring Head.Northerly 20 knots gusting 35 knots, easing to 15 knots overnight. Moderate sea, easing toslight overnight. Fine weather.
Outlook until midnight Friday: Northerly 15 knots, dying out. Fine weather.
Swell forecast to midday Friday:
--------------------------------------------------------------------------------------------------WEATHER FORECASTS FOR NEW ZEALAND COASTS AND PORTSMeteorological Service of New Zealand Limited21 Sep 2004
D-17
For Wellington South Coast, Palliser Bay and Castlepoint: Southerly swell 1 metre.
High tide at Wellington:Thursday 1326 1.6 metresFriday 0154 1.7 metres
High tide at Plimmerton:Thursday 1901 1.5 metresFriday 0724 1.6 metres
Pegasus BayMarine Weather Situation and Forecastissued at 1038hrs Thursday 15-Apr-2004 by MetService
NIL warnings
Situation:A slow moving ridge of high pressure covers much of the country.
Forecast issued at 1038hrs Thursday 15-Apr-2004Valid until midday Friday for Inshore waters from Lyttelton Harbour Entrance to theWaimakariri River mouth.Northeast 10 knots, tending northwest 15 knots this afternoon. Sea slight. Fine weather, withsome high cloud.
Outlook until midnight Friday:Becoming variable 10 knots. Cloudy periods developing.
Swell forecast to midday Friday:Southeast swell rising to 2 metres.
High tides at Lyttelton :Thursday 1322 2.2 metresFriday 0156 2.3 metres.
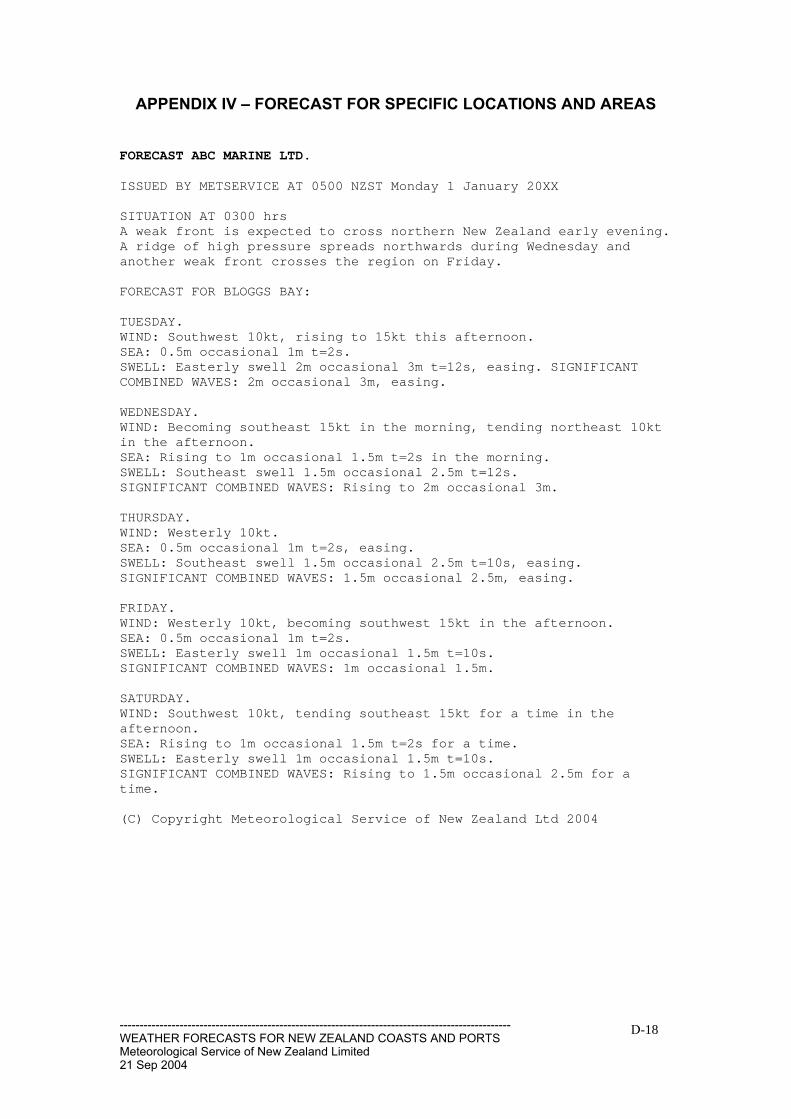
--------------------------------------------------------------------------------------------------WEATHER FORECASTS FOR NEW ZEALAND COASTS AND PORTSMeteorological Service of New Zealand Limited21 Sep 2004
D-18
APPENDIX IV – FORECAST FOR SPECIFIC LOCATIONS AND AREAS
FORECAST ABC MARINE LTD.
ISSUED BY METSERVICE AT 0500 NZST Monday 1 January 20XX
SITUATION AT 0300 hrsA weak front is expected to cross northern New Zealand early evening.A ridge of high pressure spreads northwards during Wednesday andanother weak front crosses the region on Friday.
FORECAST FOR BLOGGS BAY:
TUESDAY.WIND: Southwest 10kt, rising to 15kt this afternoon.SEA: 0.5m occasional 1m t=2s.SWELL: Easterly swell 2m occasional 3m t=12s, easing. SIGNIFICANTCOMBINED WAVES: 2m occasional 3m, easing.
WEDNESDAY.WIND: Becoming southeast 15kt in the morning, tending northeast 10ktin the afternoon.SEA: Rising to 1m occasional 1.5m t=2s in the morning.SWELL: Southeast swell 1.5m occasional 2.5m t=12s.SIGNIFICANT COMBINED WAVES: Rising to 2m occasional 3m.
THURSDAY.WIND: Westerly 10kt.SEA: 0.5m occasional 1m t=2s, easing.SWELL: Southeast swell 1.5m occasional 2.5m t=10s, easing.SIGNIFICANT COMBINED WAVES: 1.5m occasional 2.5m, easing.
FRIDAY.WIND: Westerly 10kt, becoming southwest 15kt in the afternoon.SEA: 0.5m occasional 1m t=2s.SWELL: Easterly swell 1m occasional 1.5m t=10s.SIGNIFICANT COMBINED WAVES: 1m occasional 1.5m.
SATURDAY.WIND: Southwest 10kt, tending southeast 15kt for a time in theafternoon.SEA: Rising to 1m occasional 1.5m t=2s for a time.SWELL: Easterly swell 1m occasional 1.5m t=10s.SIGNIFICANT COMBINED WAVES: Rising to 1.5m occasional 2.5m for atime.
(C) Copyright Meteorological Service of New Zealand Ltd 2004
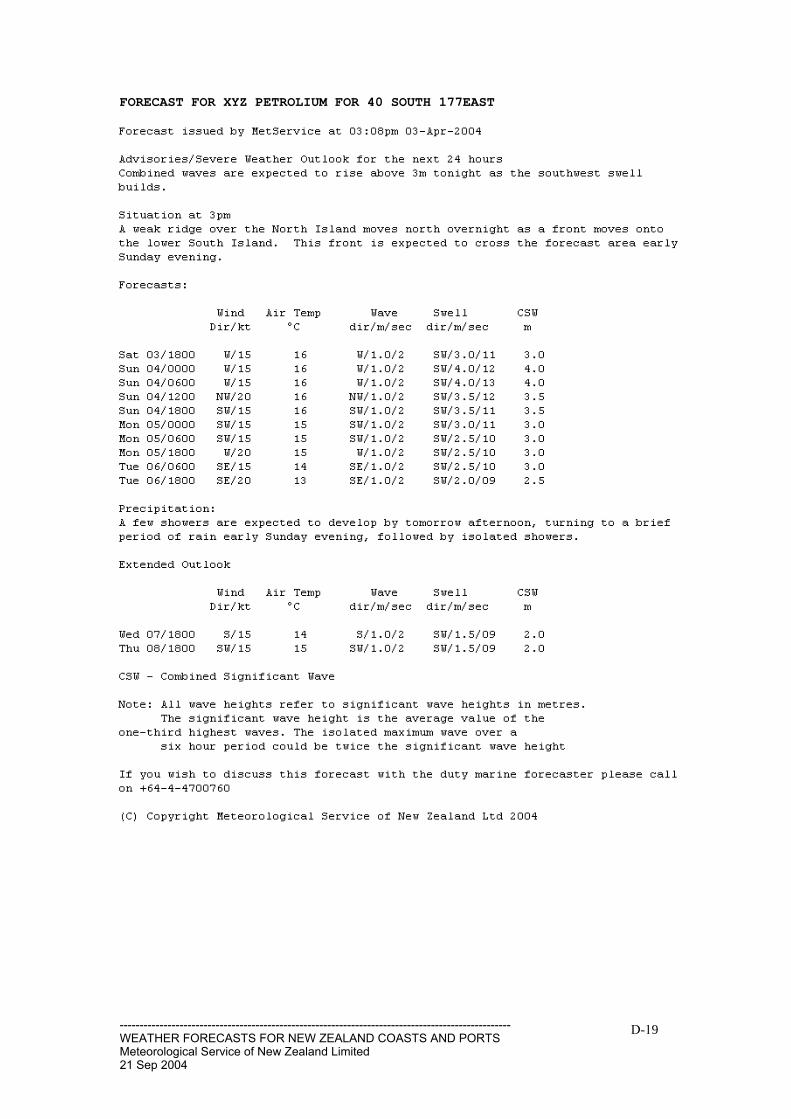
--------------------------------------------------------------------------------------------------WEATHER FORECASTS FOR NEW ZEALAND COASTS AND PORTSMeteorological Service of New Zealand Limited21 Sep 2004
D-19
FORECAST FOR XYZ PETROLIUM FOR 40 SOUTH 177EAST

_____________________________________________________________________ D20
Appendix E: Summary of NIWA EATF Submission
This appendix contains a summary of the NIWA submission to the EATF. The full NIWA submission is available from www.msa.govt.nz. The information contained in this submission is provided to users of this report for information on the capabilities of, and services available from, the Institute.
E1

E2
EATF Report Annex Monitoring, Modelling & Forecasting Maritime Hazards: NIWA Capabilities R Bell R Gorman P Sutton A Laing M Revell M Uddstrom S Burgess Prepared for
Maritime Safety Authority of New Zealand
National Institute of Water & Atmospheric Research Ltd Gate 10, Silverdale Road, Hamilton P O Box 11115, Hamilton, New Zealand Phone +64-7-856 7026, Fax +64-7-856 0151 www.niwa.co.nz
© National Institute of Water & Atmospheric Research Ltd. 2004. E3
Table of Contents 1. Introduction 1 2. Weather and Storms 1 3. Wind Waves and Swell 3 4. Currents 5 5. Sea levels (tides, storm surge, rissaga, tsunami, climate cycles) 6 6. Water-Density Variations 8 7. Siltation and Changes in Seabed Morphology 9
1. Introduction This Annex outlines expertise and services that draw on the skills and experience base NIWA has in oceanography, climate, natural hazards and weather prediction.
NIWA is currently undertaking modelling functions or operating a number of monitoring or forecasting systems, often for other purposes, that could be utilised by port companies and regional harbourmasters for:
a) Supporting the development of a risk mitigation or management plan following a thorough risk assessment and analysis process (e.g., under MSA’s Guidelines for Port & Harbour Risk Assessment and Safety Management Systems in NZ);
b) Provision of routine operational services for monitoring, modelling (engineering design & event scenarios), nowcasting (near real-time) and forecasting important maritime hazard “drivers”.
2. Weather and Storms
2.1. Hazards
Weather hazards may result from both storms in the form of fronts, mid-Tasman depressions and extra-tropical cyclones, and under stable intense anticyclones. Resultant hazards relevant to maritime operations, include: • Wind: - strong local winds (mean wind velocity, gust velocity, wind shear, leeway); • Visibility: land and sea fog (where the cloud base reaches the Earth’s surface and visibility is <1
km), and heavy rain; • Visibility: time of day (i.e. night or day transit); • Barometric pressure (leading to sea levels that are temporarily higher or depressed relative to the
predicted tide level); • Wind driven waves and swell, and sea-level phenomena such as coastal-trapped waves, rissaga
and storm surge that are potential hazards (see later sections).
2.2. Monitoring
The Meteorological Service of NZ (Met Service), crown research institutes (e.g., NIWA, Hort Research), port companies, regional councils, territorial authorities, private companies and individuals monitor New Zealand using a network of manual and automated observing stations. Most of these observations are then stored in the National Climate Database (CliDB) managed by NIWA - New Zealand’s national repository of high-quality climate data. It comprises historical paper-based archives dating back to 1852, together with extensive digital, computer-accessible data series. Web site: http://www.niwa.co.nz/services/clidb/ Currently operational weather stations that record weather
Monitoring, Modelling and Forecasting Maritime Hazards: NIWA Capabilities E4
variables particularly relevant to maritime operations and lie within approximately 1–2 km of the coast are shown in Appendix 3 of the main report.
The instrumental and data processing accuracy of the main weather-station networks is governed and maintained by adherence to World Meteorological Organisation (WMO) standards by major operators such as MetService and NIWA. The other major contributor to uncertainty of the measurements for maritime purposes relate to the relevance of variables like wind (speed and direction) measured at land sites to offshore conditions, especially for the more sheltered on-land sites. Numerical wind models can be used to assess the relevance of onshore weather station observations to offshore or exposed coastal locations.
2.3. Forecasting
NIWA is developing models: for use in diagnosing air-flow over and around structures; to forecast the weather responsible for causing hazards such as waves/swell, meteorological-surge, coastal inundation, changes in water density, river floods, volcanic ash fall; and to predict the consequences of accidental or ongoing discharge of substances into the air. For example:
• The New Zealand Limited Area Model (NZLAM) is being developed in partnership with the UK Met Office and will be used to forecast New Zealand weather conditions (winds, pressure, temperature, humidity) at high spatial (12 km) and temporal (hourly) resolution out to 48 hours. As NZLAM assimilates local observational data, its forecasts are accurate (see section Weather forecast accuracy) and will be useful for driving wave/swell, storm surge and surface current-flow models;
• CALMET, a local boundary-layer diagnostic wind model can be employed to determine localised wind flows over both land and sea (e.g. the inner Hauraki Gulf and Auckland city);
• GERRIS is a new model that can diagnose airflow at very high resolution, including wake effects and gust intensity over individual buildings, port facilities. and vessels.
2.3.1. Weather forecast accuracy
The 12 km resolution NZLAM model is expected to forecast weather variables to the following accuracies:
• Mean sea-level pressure (MSLP): RMS error 2 hPa out to 48 hours;
• Surface wind: RMS error 3.4 ms-1 at analysis stage increasing to 4.1 ms-1 at 48 hours;
• Surface temperature: RMS error 2.3°C out to 48 hours;
• Rain: False alarm rate 16% and probability of detection 67% out to 48 hours. Heavy rain generally forecast better than light rain;
• Visibility: Fog temperature generally predicted within a degree and clearance within 4 hours. Visibility and cloud base categories correctly predicted 80% of the time;
• Timeliness: A 48-hour forecast can be available within 3 hours of analysis time.
Within 3 to 5 years NIWA will be running NZLAM at 4 km resolution and would expect considerable improvement in the prediction of the above variables–particularly rainfall.
2.4. Services available now
• Diagnostic modelling to provide guidance on:
the wind flow around port structures and vessels, and
to investigate local wind flow effects arising from the topography of the land surrounding the port, and to interpret;
Monitoring, Modelling and Forecasting Maritime Hazards: NIWA Capabilities E5
• Access to, and analysis of, official weather observations in the National Climate Data Base;
• Installation, maintenance and management of automated observing stations.
2.5. Services under development
• High resolution forecasts of weather hazards (i.e. winds, visibility, temperature and humidity);
• Forecasting the trajectories of airborne hazards (e.g. pollutants and pests).
3. Wind Waves and Swell
3.1. Hazards
Waves are generated by wind stress on the sea surface. “Wind-sea” are waves from a local wind event, while swell propagates from a distant wind event or storm. (for more details see Appendix 1)
3.2. Monitoring
The ideal method of obtaining information on contemporary wave conditions is to have one or more measurement devices in situ, relaying data to a ground station for further analysis and dissemination to maritime operations staff.
• At present, a wave-riding buoy is the most suitable device for deployments in water depths greater than 20 to 30 m. Currently, NIWA operates two wave buoy stations in conjunction with regional councils, while another five wave buoys are in service, mainly by port operators. The Baring Head buoy operated by NIWA for the Greater Wellington Regional Council is an example of such a deployment, providing data on wave height and period that are used in support of operations in and out of Wellington Harbour. The operational wave buoy sites and agencies involved are listed in Table 3.1.
Table 3.1 Locations and agencies currently involved in surface wave-buoy measurements in New Zealand waters.
Wave-buoy Site Record length (~ yrs) Agencies
Banks Peninsula 4 NIWA, ECAN
Baring Head 8 NIWA, GW, Tranzrail
Bay of Plenty 0.5 EBOP
Taharoa >7 BHP/NZ Steel
Mt Maunganui >5 Port of Tauranga
Marsden Pt. 0.4 NorthTugz, NorthPort
Napier 4 Port of Napier Mokohinau Is. 6 ARC
Note: ECAN = Environment Canterbury; GW = Greater Wellington Regional Council; EBOP = Environment Bay of Plenty; ARC = Auckland Regional Council;
Wave buoy data are currently available via the Web for the following two sites:
Banks Peninsula http://www.ecan.govt.nz/Coast/Wave-Buoy/wave-buoy.html;
Bay of Plenty http://www.boprc.govt.nz/water/levels/wave-bouy.asp;
• In shallower environments, 10–14 m depth or less (typical near shipping channels), bottom-mounted pressure instruments, Acoustic Doppler Current Profiler meters (ADCPs), or surface-piercing capacitance wave wires (wave staffs) are more appropriate. NIWA has instruments suitable for these environments;
Monitoring, Modelling and Forecasting Maritime Hazards: NIWA Capabilities E6
• Waves can also be monitored from headlands using:
Conventional X-band marine radar, with accuracy comparable to those obtained from wave buoy systems. NIWA has developed a portable microwave Doppler radar system from which wave height, period, and surface currents can be obtained. Coverage extends to 1 km offshore given a suitable vantage point;
Remote video or digital camera systems (e.g. NIWA’s Cam-Era network (http://www.niwa.cri.nz/services/cam-era/);
Such systems are useful for monitoring waves at river-bar entrances;
• Waves/swell are also routinely reported by vessels at sea. These are visual observations made as part of the meteorological observation network and are archived in the National Climate Database (see Section 2.2).
Direct measurements of wave height are generally regarded as reliable to within 0.1 m.
3.3. Modelling and forecasting
Point measurements may not be representative of wave conditions over a broader area. Wave modelling is the most useful tool for understanding spatial variations in wave conditions and for wave forecasting:
• Low spatial resolution wave forecasts out to 172 hours (updated 6 hourly) are available from the NOAA/NCEP WAVEWATCH III system (http://polar.wwb.noaa.gov/waves);
• NIWA has also developed a deep-water wave generation model and has used it to simulate wave conditions over the SW Pacific region for a 20-year period. The resulting database provides a consistent deep-water wave climate for the seas (>50 m depth) around New Zealand. This can be used in risk assessment and engineering design associated with maritime activities;
• A real-time wave forecasting system using the NIWA model is now operating with wind fields sourced from a global forecasting centre. This system provides wave forecasts around the New Zealand coast up to 128 hrs ahead. In the future, winds from the NZLAM model (see Section 2.3) will be used and effects from seabed shoaling, refraction, and local generation by winds accounted for – leading to increased forecast accuracy;
• The SWAN (Simulating WAves Nearshore) model can be used to model nearshore environments, within harbours and estuaries, and around port facilities, where shoaling, refraction and breaking wave effects need to be considered. Several nearshore areas around New Zealand have been modelled using SWAN, including Manukau Harbour, Hauraki Gulf, Canterbury Bight and work is commencing on Greater Cook Strait. Near real-time wave conditions are now routinely modelled by the SWAN model (based on wave-rider buoy inputs) for the entire Canterbury region with results updated 3-hourly at http://www.niwa.co.nz/services/waves;
• In shallow waters and port facilities, a model also needs to consider the effects of wave diffraction and reflection from harbour walls, reclamations and breakwaters. Phase-resolving models are able to determine amplification or decay of wave excitation within harbours from waves or wave groups diffracting through the port entrance, particularly those on exposed coasts. Such simulations have been applied in harbour design and environmental studies of several New Zealand ports including Taranaki, Gisborne and Napier.
3.3.1. Wave model accuracy
Wave models are only as accurate as the input information. Winds are often a source of error. Small errors in winds are magnified in wave generation, i.e., a 10% error in wind may lead to a 20% error in wave height. Wave forecast accuracy will increase when high-resolution NZLAM wind forecasts are used to drive the NIWA wave models.
Monitoring, Modelling and Forecasting Maritime Hazards: NIWA Capabilities E7
3.4. Services available now
• Monitoring systems suitable for use in both shallow and deep waters;
• Wave climate data and analyses thereof, for all locations over the south west Pacific;
• Ocean, coastal and harbour wave simulations and analyses;
• Canterbury Bight (Kaikoura to Oamaru) near real-time wave diagnoses (updated 3-hourly).
3.5. Services under development
• High-resolution regional wave forecasts;
• Site forecasts.
4. Currents
4.1. Hazards
The main influences on currents are tides, winds, atmospheric pressure, oceanic current incursions, and seabed bathymetry.
In harbours and estuaries the main current forcing mechanisms are:
• Tidal flows, which dominate the currents in most harbours. They are inherently predictable but may vary in time as a result of changes to the shape of the sea floor or to water column stratification;
• Significant wind events will change the current flows within embayments, estuaries and at harbour mouths/entrances;
• Fresh water input will have several impacts on harbours, including: a) changes in surface current flow velocities; b) changes in buoyancy; and c) changes in stratification and vertical shear down the water column;
• All embayments and harbours are subject to seiching, leading to oscillations in currents and sea level if they are forced (e.g. rissaga and tsunami) near their natural frequency.
Around headlands and in constricted channels tidal currents may dominate with speeds up to several knots. Otherwise along the open coast and continental shelf, currents caused by non-tidal sources are more prominent, usually from winds (regional and local), oceanic current incursions, and coastal-trapped waves.
4.2. Monitoring
There are few sites in NZ where routine monitoring of currents occurs, mostly because of the cost and technical complexities relaying the measurements to a receiving station:
• NIWA holds an archive of around 500 current-meter data records since the late 1970s, largely from coastal, harbour and shelf locations;
• Acoustic Doppler Current Profilers (ADCP) are used to profile the currents. They can be deployed on the sea floor (upward looking, e.g. routine monitoring of the main shipping channel inside Tauranga Harbour), on a vessel (downward looking), or horizontally to profile currents across a channel;
• Radar based CODAR (www.codaros.com) systems can be used to make high-resolution real-time measurements of surface currents up to 70 km offshore and spanning a wide area. At a smaller scale, a microwave radar dish on an elevated position can measure surface currents over smaller areas (as described in Section 3.2).
Monitoring, Modelling and Forecasting Maritime Hazards: NIWA Capabilities E8
4.3. Modelling and prediction
• NIWA uses hydrodynamic models (e.g. MIKE21 and MIKE3 from DHI Water & Environment of Denmark) to simulate flows in harbours, along coasts, and across the continental shelf. These have been applied to a number of locations and harbours around the New Zealand coast;
• In open coastal regions currents are modelled using the NIWA-developed TIDE2D and RiCOM models. NIWA’s Tide Forecaster (www.niwa.co.nz/services/tides/) uses the results from TIDE2D to predict tides (heights and currents) at any point in the EEZ. At present this model has limited coverage of harbours and estuaries, but it is being extended to include the main ports and harbours;
When calibrated from in situ current-flow measurements these models can be used to simulate previous events of interest or to respond to adverse events e.g., storms, tsunami, oil-spill trajectories, search & rescue and ship-handling operations.
4.4. Services available now
• Monitoring systems: current meter and ADCP deployments and data analyses;
• Historic current data and analyses thereof;
• Modelling services (harbour, coastal);
• Tidal current predictions.
4.5. Services under development
• Tidal current predictions in estuaries and inlets;
• Ocean and coastal current prediction systems.
5. Sea levels (tides, storm surge, rissaga, tsunami, climate cycles)
5.1. Hazards
Maritime operations are critically dependent on accurate knowledge of the sea level at any time. The tide height is predictable, but several other processes (across a range of timescales) can contribute to substantial departures of the instantaneous sea level from the predicted tide. The main sea-level phenomenon, and the characteristic time periods they operate across, are listed in Table 5.1:
Monitoring, Modelling and Forecasting Maritime Hazards: NIWA Capabilities E9
Table 5.1 Approximate range of characteristic periods for short to long waves that affect sea level at any location
Phenomenon Cause Characteristic Period wind sea wind (local source) 1 – 10 sec swell wind (distal source) 8 – 20 sec infragravity waves wind (wave grouping) 20 sec – 5 min rissaga weather (depressions?) 8 – 20 min tsunami geological disturbance 1 min – 1 h seiche chaos 30 min – 4 h tides astronomical 2 h – 29 h (+long-period tides) storm surge weather 12 h – 10 d annual temperature 1 year interannual climate (El Niño & La Niña) 1 – 4 years interdecadal climate (Interdecadal Pacific Oscillation or IPO) 20 – 30 years sea-level rise global warming >50 years
• Rissaga can reach up to 1 m or more in height and can be problematic for moored ships, particularly those in east-coast ports. They may also cause problems for large vessels crossing critical sections of an approach channel;
• Tsunami arising from remote sources have caused sea-level changes of up to 5 m (e.g. Lyttelton Harbour following the May 1960 earthquake in Chile. Locally-generated tsunami can cause much larger sea-level changes (e.g. 10 m, north of Gisborne in 1947). The return period of tsunami anywhere in New Zealand is around 8, 18 or 53 years for tsunami wave heights of 1, 5 and 10 m respectively, but return periods for any particular port will be considerably longer;
• Seiche (see Section 4.1). As examples, the natural seiche frequencies for two NZ harbours are (approximately): a) Lyttelton Harbour (160, 96, 16 min); b) Wellington Harbour (160, 27, 22 min);
• Tides. Every 7 months or so, “king tides” (or perigean-spring tides) lead to extreme high and low sea levels, creating situations conducive to coastal inundation (especially if accompanied by a storm) or conversely at low tide, reduced under-keel clearances (UKC);
• Storm surge, driven by atmospheric pressure and wind, increases (or decreases) the sea level above (or below) the predicted tide. Negative storm surges, in combination with very low tides, may compromise UKC;
• Climate cycles (annual to interdecadal) influence the mean level of the sea. The actual mean level of the sea can fluctuate by up to ±0.25 m when all the longer-period cycles of at least 6 months are included;
• The mean sea level has been rising and this is projected to accelerate with increasing global temperatures.
5.2. Monitoring
Sea levels including tides are monitored around New Zealand through two main networks: • Gauges at Standard Ports that are operated by individual port companies and processed and
archived by LINZ; • Open-coast network of 22 gauges coordinated by NIWA and partners (including councils and port
companies). The present sites are shown in Appendix 2 of the main report. Results from most of the stations are updated daily at: http://www.niwa.co.nz/services/sealevels. Measurements are summarised in two sets of plots: a) predicted tides and storm surge from 5-minute data; b) rissaga, seiche and tsunami from 1-minute data.
Monitoring, Modelling and Forecasting Maritime Hazards: NIWA Capabilities E10
5.3. Modelling and forecasting
The same hydrodynamic models described in Section 4.3 are also used to predict tide heights, and the effects of tsunami and storm surge:
• Tide tables are published each year by LINZ for Standard Ports. Tide predictions for these ports will always be more accurate than model-derived tides (as described in Section 4.3);
• NIWA’s on-line Tide Forecaster (http://www.niwa.co.nz/services/tides) provides tidal height predictions at any open-coast location within New Zealand’s EEZ (see Section 4.3);
• Exceedance curves for high and low tides for the next 50 or 100 years can be generated from tidal records. Typically these are used for engineering design of port facilities and under-keel clearances;
• Tidal “red-alert dates” (i.e. those for “king-tides”) are listed on the NIWA web site at http://www.niwa.co.nz/rc/prog/chaz/news/coastal#red. If these dates coincide with weather driven sea-level rise or fall, there is added risk of coastal inundation and/or reduced UKC.
5.4. Services available now
• Installation, maintenance and operation of sea-level monitoring systems;
• Historic sea-level data and analysis;
• Coastal sea level modelling;
• Tide forecasts - “Tide Forecaster”, and “Red-alert days”.
5.5. Services under development
• Tidal predictions in estuaries and inlets;
• Sea-level forecasts− including tide, storm surge, wave set-up.
6. Water-Density Variations
6.1. Hazards
The buoyancy of a vessel is dependent on the density of the water, which changes both with temperature and salt content.
Floods in rivers can also inject large quantities of debris into ports, harbours and coastal waters.
6.2. Monitoring
• NIWA monitors sea-surface temperature (SST) at a number of coastal sites including NIWA’s open-coast sea-level gauges (see Appendix 2 of main report). Full SST coverage for the NZ region is provided through NIWA’s satellite services at http://www.niwa.co.nz/services/sat/;
• The salt content of seawater is measured at ocean/coastal moorings for research purposes and for monitoring aquaculture operations. NIWA has a range of instruments that can be deployed to log salinity and/or temperature;
• NIWA coordinates a nation-wide monitoring network of river flow recorders that can be used to assess freshwater input (and flood debris) into relevant harbours.
6.3. Services available now
• Sea-surface temperature and salinity monitoring;
• Satellite SST Service (updated daily);
Monitoring, Modelling and Forecasting Maritime Hazards: NIWA Capabilities E11
• Historic SST and salinity data and analyses thereof;
• River-flow monitoring.
7. Siltation and Changes in Seabed Morphology
7.1. Hazards
High potential risks are present when vessels are operated through tidal entrances that have mobile sandbars or tidal deltas (flood- or ebb-tide shoals) or where harbour channels and approaches require maintenance dredging.
7.2. Monitoring
There is a range of survey tools available to measure and monitor the seabed including side-scan sonar, single-beam echo sounding, seabed samplers, cameras and multibeam echo sounding. The mapping and/or monitoring requirements and level of maritime risk determines what survey tools should be used.
• NIWA’s side-scan sonar provides high-resolution sonar imagery of the seafloor and wide coverage of the bottom. Conventional single-beam echo sounding provides accurate depth measurements directly under the vessel and some backscatter information, which can assist in mapping seabed characteristics;
• NIWA operates a Simrad EM300 multibeam hydrographic sounder from its research vessel RV Tangaroa. This mid ocean depth system enables highly accurate charts and back scatter images to be produced from depths 75 m to 5000 m;
• NIWA compliments the EM300 system with a shallow water EM3000D hydrographic multibeam system. This system can be operated from RV Tangaroa, NIWA’s coastal research vessel RV Kaharoa and its survey launch Pelorus. It produces very high-resolution hydrographic depth and backscatter images over a swath width up to 10× water depth in waters ranging from 1 to 150 m deep. It has a depth accuracy of 0.05 m RMS and resolution of 0.01 m
Both the EM300 and EM3000D met or exceed IHO and LINZ hydrographic standards.
Multibeam geo-referenced bathymetry and images allow time series evaluations to made to monitor changes in seabed features such as sandbars, approach and harbour channels, sea wall/breakwater environs. It also meets IHO/LINZ standards for charts and can provide data for monitoring dredging operations. NIWA’s hydrographic capability has been used by port companies for charting and dredging and by salvage companies to support vessel salvage.
7.3. Services available now
• Seabed monitoring systems, including multibeam sounding systems (from 1 to 5000 m) and side-scan sonar;
• Historic hydrographic data;
• Modelling (flow, waves and sediment transport).
________________________________
Monitoring, Modelling and Forecasting Maritime Hazards: NIWA Capabilities E12