Embed Size (px)
Citation preview

Prof. Rajesh BhagatAsst. Professor
Civil Engineering Department
Yeshwantrao Chavan College Of Engineering
Nagpur
B. E. (Civil Engg.) M. Tech. (Enviro. Engg.)
GCOE, Amravati VNIT, Nagpur
Mobile No.:- 8483003474 / 8483002277
Email ID:- [email protected]
Website: www.rajeysh7bhagat.wordpress.com
ENVIRONMENTAL ENGINEERING-I

12/21/15

UNIT-I
1) Introduction: Importance and necessity of water supply scheme.
2) Water Demand: Types of demand, factors affecting per capita
demand, variation in demand, design period and population
forecasting methods and examples.
3) Sources of Water: Ground water – springs, infiltration galleries, Dug
wells, tube wells, Surface water – stream, Lake, River, impounding
reservoirs, ponds, etc.
4) Intake Structures: Location types – river, lake, canal, reservoir, etc.
3

4
UNIT - II
1) Conveyance of Water: Types of pipe, joints , valves & fittings.
2) Hydraulic Design Aspects: Manning’s, Darcy’s Weisbach, Hazen
Williams Formulae & Numerical.
3) Rising Main & Pumps: Types, working merits and demerits selection of
pumps.

5
UNIT – III
1) Water Quality : General idea of water borne diseases, Physical,
Chemical and biological characteristics of water, Standards of drinking
water.
2) Water Treatment : Objective of treatment, unit operations and processes.
3) Treatment Flow sheet of conventional water treatment plant.
4) Aeration: Purpose, types of aerators.
5) Coagulation & Flocculation: Definition, Principals, types of coagulants
and Reactions, coagulant doses, types of mixing and flocculation devices.

UNIT-IV
1) Sedimentation: Principles types of setting basins, inlet and outlet
arrangements.
2) Clariflocculators: Principles and operation.
3) Filtration: Mechanism of filtration, types of filters RSF, SSF,
pressure filters, elements of filters, UDS, design aspects of filter and
operational problems in filtration.
6

UNIT-V
1) Disinfection : Purpose, Mechanism, criteria for good disinfectant,
various disinfectants & their characteristics, disinfection by
chlorination using different forms of chlorine.
2) Distribution Systems: Requirements for a good distribution system,
methods of distribution systems and layouts of DS, appurtenance in
water distribution system.
3) Leakage and leak detector.
4) Storage Reservoirs for treated water: Types, capacity of reservoir,
mass curve.
7

UNIT-VI
1) Municipal Solid Waste Management: Generation sources,
composition, Quality, Methods of Collection, transportation,
treatment and disposal, 3Rs.
2) Examples on simple hydraulic design of pipes, estimation of
population and water quality, plain sedimentation tanks, cascade only
simple sizing of units no detailed design.
8
PRACTICALS: - (Min. 10 Experiment)
1) Determination of pH.
2) Determination of Conductivity
3) Determination of Chlorides .
4) Determination of Solids
5) Determination of Turbidity
6) Determination of Alkalinity – Acidity.
7) Determination of Dissolved Oxygen.
8) Determination of Hardness
9) Determination of Available Chlorine
10)Determination of Residual Chlorine
11)Jar Test.
12)Bacteriological Plate count and MPN tests.
13)Only Demonstration of COD and BOD.9

References:-
1) Water Supply & Sanitary Engineering by G. S. Birdie.
2) Water Supply Engineering by B. C. Punmia.
3) Water Supply Engineering by S. K. Garg.
4) Solid Waste Management by A. D. Bhide.
5) Environmental Engg. By Modi.
10

UNIT-I QUESTION BANK
1) Explain the importance and necessity of public water supply scheme and what are the various purposes
for which water is required.
2) What are the sources of water and list of impurities to be removed from surface source of water for
drinking purpose.
3) What are the components of water supply scheme.
4) What do you understand by water demand? How it is determined for a major city? Explain various
types of water demands.
5) What are the factors affecting per capita demand of water and explain.
6) Explain the fluctuation in water demand. What is the effect of these variations on design of treatment
units.
7) What are the different methods of population forecasting and explain.
8) What is Intake Structure? Explain the factors deciding the location of intake structures. Also explain the
requirements of a good intake structure.
9) For the given data, forecast the population data after one, two and three decades beyond the last known
decade by Arithmetic or Geometric or Incremental increase method,
Census 1960 1970 1980 1990 2000
Population 25000 28000 34000 42000 47000
10) Write a short note on
a) Infiltration Gallery b) Design Period c) Impounding Reservoir d) Surface water e) Springs
f) Per capita Demand g) Wet Intake h) Canal Intake i)River Intake j) Wells
11

Objective of Water Supply Scheme:-
To provide reliable good quality and required quantity of water for consumption
and other use to public.
12

Importance & Necessity of Water Supply Scheme:-
Water may be responsible for many diseases therefore it should be free from
impurities.
With advancement of civilization, the utility of water enormously increased &
now without well organized public water supply scheme, it is impossible to run
the present life.
Collective effort.
Water required for various purpose:
Drinking & cooking
Bathing & washing
Lawns, gardens, crops, street washing, fire fighting, various industrial
purposes, heating, air conditioners, etc
13

Water Supply System:
1) Sources of water:
2) Collection works or Intake Structure:
3) Transmission works:
4) Purification works:
5) Distribution Works:
14

Water Demand:
Quantity of water required by per person per day in liters.
270 LPCD & 335 LPCD
Total quantity of water required for town depends on rate of demand, population &
design period.
Types of demand:
Domestic or residential demand 135
Commercial & Industrial demand 40
Demand for public use 25
Compensate losses demand 55
Fire demand 15
Total water Demand = 270 lpcd without full flushing system (LIG)
Total water Demand = 335 lpcd with full flushing system (HIG)
15

Domestic Water Demand for Indian Cities:-
It includes quantity of water required in the houses for drinking, cooking,
bathing, washing, etc.
It mainly depends on the habits, social status, climatic condition, &
custom of people.
1. Drinking 5 lpcd
2. Cooking 5 lpcd
3. Bathing 55 lpcd
4. Washing 40 lpcd
5. Flushing of latrines 30 lpcd
Total Domestic water demand = 135 lpcd as per IS 1172 – 1993 (R 2012)
16

Domestic Water Demand for Indian Cities:-
Population upto 20000 :-
I. Stand post = 40 lpcd
II. House service connection = 70 – 100 lpcd
Population > 20000 & Population < 100000 = 100 – 150 lpcd
Population > 100000 = 150 - 200 lpcd.
17

Water Demand for Indian Cities IS 1172 (1993 R 2007):-
For communities with population up to 20 000 and without flushing system
I. water supply through standpost 40 lphd (Min)
II. Water supply through house service connection 70 to 100 lphd.
for communities with population 20 000 to 100,000 together with full
flushing system 100 to 150 lphd
for communities with population above 1,00000 together with full flushing
system 150 to 200 lphd
NOTE—The value of water supply given as 150 to 200 litres per head per day may be reduced to
135 litres per head per day for houses for Lower Income Groups (LIG) and Economically
Weaker Section of Society (EWS), depending upon prevailing conditions.
18

Water Requirements for Buildings Other than Residences IS 1172 (1993 R 2007):-
Type of Building Consumption Per Day, litres
Factories where bath rooms are required to be provided 45 per head
Factories where no bath rooms are required to be provided 30 per head
Hospital (including laundry) :
a) Number of beds not exceeding 100 340 per head
b) Number of beds exceeding 100 450 per head
Nurses’ homes and medical quarters 135 per head
Hostels 135 per head
Hotel 180 per head
Offices 45 per head
Restaurants 70 per seat
Cinemas, concert halls and theatres 15 per seat
Schools:
a) Day schools 45 per head
b) Boarding schools 135 per head
NOTE—For fire demand in buildings refer IS 9668 : 1981.

Factors Affecting the Rate of Demand:-
1) Size of city.
2) Climatic condition.
3) Living standard of people.
4) Habits and activities.
5) Industrial & Commercial activities.
6) Quality of water supply.
7) Pressure in the distribution system.
8) System of sanitation.
9) Cost of water & policy of metering
10) System of supply. 20


Total Draft:-
1) Maximum hourly demand or sum of maximum daily demand & fire
demand, which ever is more is taken as Total Draft.
2) Max. daily demand = 1.8 x Annual avg. daily demand.
3) Max. hourly demand = 2.7 x Annual avg. hourly demand.
4) Max. hourly demand = 1.5 x Avg. hourly demand of max. daily demand.
5) Fire demand = 15 lpcd
6) Max. seasonal demand = 1.3 x annual avg. daily demand.
7) Max. monthly demand = 1.4 x annual avg. daily demand.
8) Max. daily demand when added to the fire demand is known as
coincident draft.22

Fire Demand:-
Water required for fire fighting is usually known as fire demand.
Fire demand = 15 lpcd.
Kuichling’s formula :- best for Indian cities
Q = 3182 √P
Where, P is population in thousand
23

Design Period:-
1) A reasonable future period for which provision is made.
2) The number of years for which the design of the water works or structure have
been done is known as Design Period.
3) Generally, water supply projects are designed for design period of 20 to 40 years.
4) Time lay between the design & completion should not be more than 2 years.
Components Design Periods in Years
Dams 50
Pumps 15
Water Treatment Units 15
Water Conveying Mains 30
Clear Water Reservoir 15
Distribution System 3024

Factors should be kept in view while fixing the Design Period:-
1) Availability of fund. (More & Less)
2) Life of components & material used. ( More & More)
3) Rate of interest on the loan taken to compete project. (More & Less)
4) Anticipated expansion rate of the town. (More & Less)
It should not be too large to become a burden on the present users or to short to be
uneconomical.
Components Design Demands
Source of supply Max. daily demand
Pipe main Max. daily demand
Water Treatment Units Max. daily demand or twice avg. daily demand
Pumps Twice avg. daily demand
Distribution System Total Draft
Reservoir Hourly fluctuation, fire demand, emergency etc.
25

Points to be considered while designing Water Supply Scheme:-
1) Financial Aspect or availability of fund.
2) Population.
3) Quality of raw water& treated water.
4) Rate of consumption.
5) Source of water supply.
6) Topography of area.
7) Trends of town developments
8) Sanitary system.
26

Population Forecasting
Determination of the population at the end of design period.
Various Methods:-
1. Arithmetical Increase method
2. Geometrical Increase Method
3. Incremental Increase Method
4. Decreasing Rate of Growth Method
5. Graphical Extension Method
6. Graphical Comparison Method
7. Zoning or Master Plan Method
8. Ratio or Correlation Method
9. Growth Composition Analysis Method
10. Logistic Curve Method
Population depends upon living conditions, environment, industrial potential,
state of development, location w.r.t. road & rail links, climatic condition, etc.27

Arithmetic Increase Method
1) Rate of change of population with time is constant.
2) Applicable to old and large cities
3) Also applicable to cities with no industrial growth and reached a saturation or
max. development
4) Yields lower results for rapidly growing cities
Pn = (Po + n.x)
Where, Po = latest known population
Pn = Prospective population after ‘n’ decades
x = avg. increase in population per decade
28

Geometrical Increase Method
1) % increase in population from decade to decade is constant.
2) Avg. % of growth of last few decades is determined and from this forecasting
is done.
Pn = Po (1 + ( r / 100))n
Where, Po = latest known population
Pn = Prospective population after ‘n’ decades
r = geometric mean % increase in population
29

Incremental Increase Method
1) Best method for any city whether old or new.
2) Combination of first two methods.
3) First the avg. of increase in population is calculated according to arithmetical
increase method
4) Then the avg. of the net increment increase is added to this.
Pn = Po + n . x + ( ( (n (n + 1) ) / 2 ) y )
Where, Po = latest known population
Pn = Prospective population after ‘n’ decades
y = avg. of incremental increase in population
30

Simple Graphical Method
1) Graphical extension method.
2) Graph plotted for a city between time & population.
3) Then graph is smoothly extended to the desired time.
4) Very approximate result & Unsafe to use alone
31

Comparative Graphical Method
1) Graphical comparison method.
2) City under consideration may be developed same as the selected similar
cities developed in the past.
3) Based on logical background.
4) Precise & reliable methods.
32

Logistic Curve Method
1. Decreasing rate of growth method.
2. Birth, death, migration etc. don’t produce extraordinary changes.
3. Population-time curve under such condition would be an ideal one known
as a logistic curve (S-shape) as shown.
4. Quite rational method for the cities whose rate of increase goes on reduce,
as they reach saturation..
33
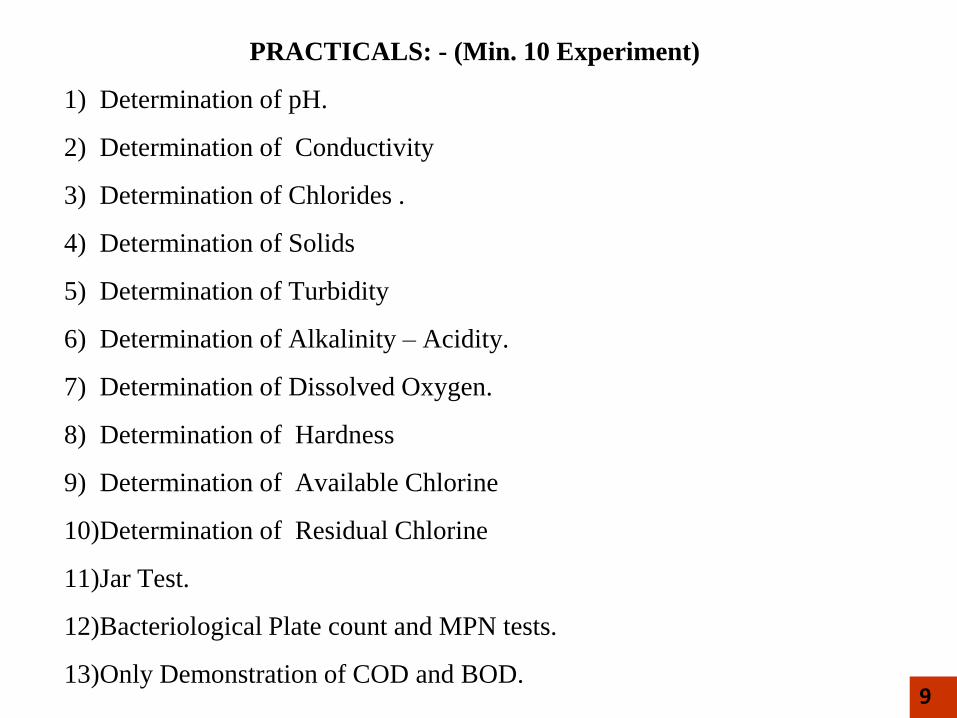
Ratio Method
1) Ratio and correlation method.
2) Population growth of smaller city is related to the growth of a bigger city.
3) Future population of the city is determined by taking same rate of growth.
4) past growth rate of city under consideration are also compared.
5) According future rate of growth for that city is worked out.
6) Not accurate method.
34

Master Plan or Zoning Method
1) Modern and most useful method.
2) Best for big cities and medium cities.
3) City should have provision of master plan.
4) City divided into several zones based on specific use.
Residential
Commercial
Industrial
5) City develop in a definite way based on the master plan.
6) Laws & regulations enforced by municipal corporation & other local bodies
35

Growth Composition Analysis Method
1) Based on the fact that the change in population mainly occurs due to birth,
death and migration.
2) Population can be forecast, If these three factors are properly analyzed.
Future Popn = Present Population + Net Natural Change + Migration
Where, Net natural change is the difference between birth & death.
36

Que. 1: The population of town for the last four census years was recorded as
below. Determine the population in 2011 by using Arithmetic Increase
Method:
Census Population Increase in Population
1971 11092 --
1981 13751 2659
1991 15206 1455
2001 19723 4517
Sol.: Avg. increase in popn per decade (x) = 8631/3 = 2877
Pn = (Po + n.x)
Pn = (19723 + 1x2877) = 22600
37

Que. 2: The population of town for the last four census years was recorded as
below. Determine the population in 2011 by using Geometric Increase
Method:
Census Population Increase in Population % increase in population
1971 11092 -- --
1981 13751 2659 23.97
1991 15206 1455 10.58
2001 19723 4517 29.70
Sol.: Avg. % increase in population per decade (r) = 64.25/3 = 21.42%
Geometric Mean % in population in decade (r) = (23.97 * 10.58 * 29.70 )1/3 =19.6%
Pn = Po (1 + ( r / 100))n
Pn = 19723 (1 + (19.6 / 100))1
Pn = 23589

Que.3 With the help of following data, calculate the population at the end of next three decades by Geometric Increase Method:
Census Population Increase in Population % increase in population
1940 80000 -- --
1950 120000 40000 50.00
1960 168000 48000 28.57
2070 228580 60580 36.06
Sol.: Avg. % increase in population per decade (r) = 114.63/3 = 38.21%
Geometric Mean % in population in decade ( r ) = (50 * 28.57 * 36.06 )1/3 = 37.21%
Pn = Po (1 + ( r / 100))n
Pn = 228580 (1 + (37.21 / 100))3
Pn = 590466.8 or (603471.3)

Que. 4: The population of town for the last four census years was recorded as
below. Determine the population in 2011 by using Incremental Increase
Method:
Census Population Increase in Population Incremental increase
1971 11092 -- --
1981 13751 2659 --
1991 15206 1455 -1204
2001 19723 4517 3062
Sol.: Avg. increase in population per decade (x) = 8631/3 = 2877
Avg. incremental increase in population per decade (y) = 1858/2 = 929
Pn = Po+n.x+(((n(n+1))/2)y)
Pn = 19723+(1x2877)+(((1(1+1))/2)929)
Pn = 23529
40

Que. 5: The population of the city are as below.
Year Population
1911 20,000
1921 25,000
1931 35,000
1941 45,000
1951 55,000
1961 65,000
1971 75,000
1981 85,000
Determine the population in 2011 by using Arithmetic Increase, Geometric
and Incremental Increase Method:
41

Que. 6: The population of the city are as below.:
Year Population
1930 25,000
1940 28,000
1950 34,000
1960 42,000
1970 47,000
Find out the population after one two and three decade beyond last known
decades by using Arithmetic Increase, Geometric and Incremental Increase
Method?
42

Sources of Water:
1) Earth’s surface is covered by 71% water.
2) Essential for life – can survive only a few days without water.
3) Small fraction (.014%) is readily available for human use.

Sources of Water
Surface sources of water:-
River & Stream.
Lakes & Ponds.
Impounded Reservoir.
Oceans.
Sub Surface Sources of water:-
Wells.
Springs.
Infiltration Galleries.

Surface Sources of Water:
1) In which water flows over the surface of earth.
2) Directly available for water supply.
River:
1) Most important source of water.
2) Formed due to discharge of water from many springs & streams.
3) Most of cities are settled near the rivers.
4) Perennial or non-perennial.
5) Quality of water is not reliable due to large amounts of silt, sand, etc.
6) Disposal of sewage in river is further contaminate the water.
7) River water must b properly analyzed and well treated before supplying to the
public.

Streams:
1) In hilly regions streams are formed by the runoff.
2) The streams are flow in valleys and are the main source of water to villages of
hills.
3) The quality of water is good except first runoff.
4) Small streams are not suitable but perennial streams may be used by providing
barrages across them.
Lakes & Ponds:
1) A natural large size depression formed within the surface of the earth.
2) Difference between pond & lake is only that of size.
3) Quantity of water in lake depends on catchment area, annual rainfall, porosity
of ground, etc.
4) Lakes at high altitudes contains almost pure water which can be used without
any treatment.
5) The quality of large lake is good than that of small lakes.

Impounded Reservoir:-
1) A barrier in the form of a dam may be constructed across the river, so as to
form a pool of water on the upstream side of river.
2) This pool or artificial reservoir is known as impounded reservoir.
3) The quality of water is not much different from that of natural lake.
4) Objective is to store water & stabilize flow of water to fulfill the need of water
in summer season.
5) Main source of water for big cities.

Sub Surface Source of Water:
1) The water which gets stored in the ground water reservoir through infiltration,
etc. is known as underground water or subsurface water.
2) This water is generally pure because it undergoes natural filtration during the
percolation through the soil pores.
3) Less contaminated but rich in in dissolved salts, minerals, etc.
Wells:
These are the artificial structure created by the excavation of trends into a
ground.
Depending upon depth & method of construction wells are classified.
1) Shallow well
2) Deep well
3) Tube well

Shallow Well:
1) These are constructed in the uppermost layers of earth’s surface.
2) Diameter varies from 2m to 6m.
3) May be lined or unlined.
4) Quantity of water available from shallow well is generally is limited.

Deep Well:
Obtain their quota of water from an aquifer below an impervious layers.
Water consist of dissolved salts & become hard.

Tube Well:
1) It is deep well having diameter of 5cm to 20 cm.
2) Obtains its quota of water from number of aquifer.
3) Depth of well depends on the quality of water required.
4) Usually depth is about 30 to 50 m but it may be even go upto 300m is some
dry areas.

Springs:
1) When ground water reappears at the ground surface it is called as springs.
2) It is formed near the hills.
3) Quantity of water is provided is less, hence suitable for small town.
4) Certain springs sometimes discharge hot water due to the presence of sulphur
in them.
5) Springs are usually formed under three general condition of geological
formation as below:
A. Artesian springs
B. Gravity springs
C. Surface springs

Artesian Springs:
The ground water comes to the surface under pressure.
This formed due to presence of crack in impervious layer.
These kind of source provide uniform quantity of water through out the year.

Gravity Springs:
This springs develop due to overflowing of the ground water.
When the ground water table rises high & such a springs is known as gravity
spring.
Flow from such a spring varies with rise or fall of the ground water table.

Surface Springs:
This spring will be formed when subsoil water is exposed to the ground surface
by the obstruction of an impervious layer.
The quantity of water available is small and uncertain.
Cut off wall may be constructed to develop such a springs.
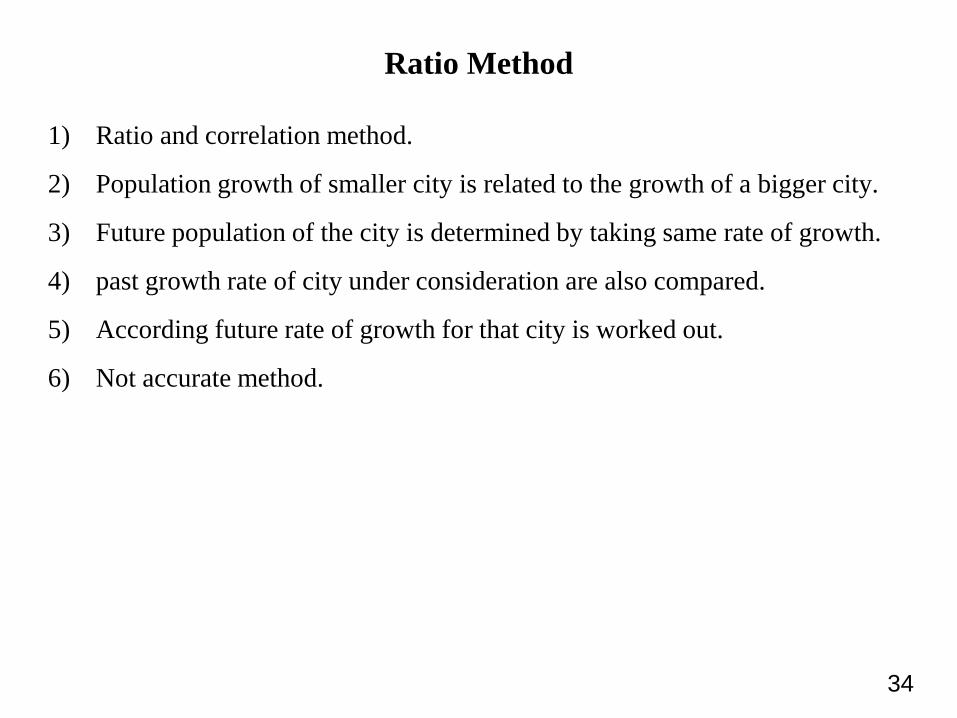
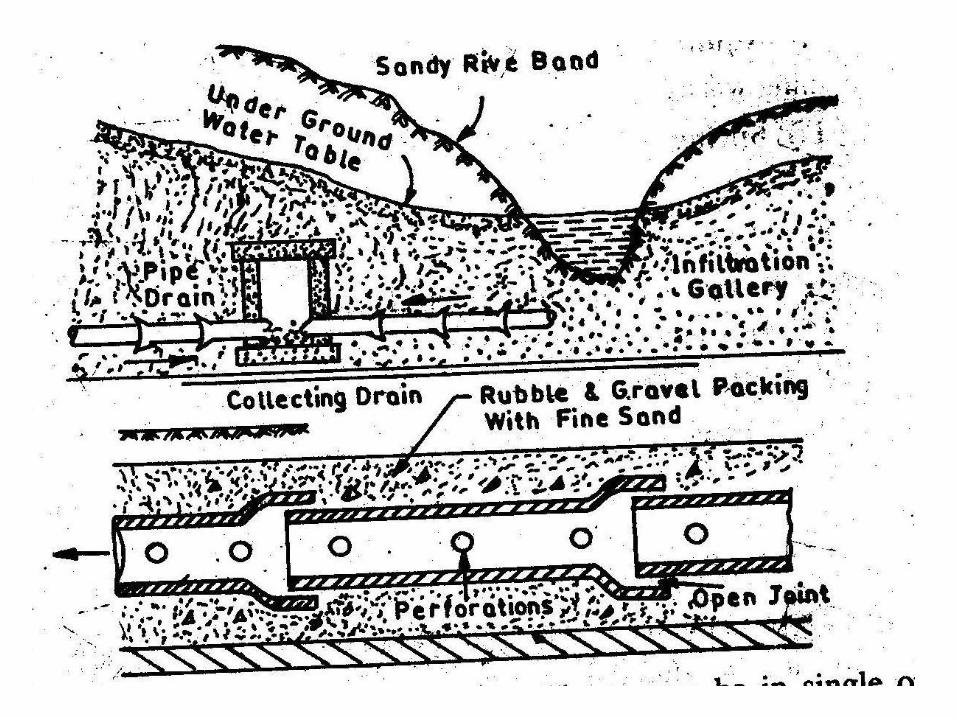
Infiltration Galleries:
1) Artificially constructed structure use for collecting underground water near
river, stream and lakes
2) Horizontal canal type constructed structure with hole on sides at right angle to
the direction flow of underground water.
3) Consist of open jointed perforated concrete pipes embedded in a sandy
subsurface.
4) These pipes are surrounded by aggregates.
5) Ground water percolated through aggregates into pipes & conveyed to a sump
well.


Factors Governing The Selection of Source of Water:-
1) The quantity of available water.
2) Quality of water.
3) Distance of source of supply.
4) General topography of area. ( Not be uneven)
5) Elevation of source of supply.

Intake Structure:-
Use for admitting water from surface sources & conveying it further to
WTP.
Masonary or concrete structure with an aim of providing clear water free
from pollution.
Components of Intake structure:-
A. Conduit with protective works
B. Screens at open ends
C. Gates and valves to regulate flow

Submerged Intake:- constructed entirely under water & used to
obtain water from lake.
Exposed Intake:- in the form of well or tower constructed near
the bank of a river. Common due to its simplicity in operation.
Intake structure
Reservoir Lake Canal River Wet Dry

Site Selection:-
1) Reqd. quantity of water even at worst condition.
2) Near to WTP.
3) Quality of water.
4) Well upstream of points of discharge of waste.
5) Good foundation condition.
6) Scope for future expansion.
7) Not get flooded.
8) Not be located on curves.
9) Never near the navigation channels.

Wet Intake :-
1) Concrete circular shell.
2) Water up to reservoir level.
3) Under gravity or pressure.
4) Opening into outer shell & inner shaft.
5) Gates on inner shaft.
6) Full of water even when gates are closed.


Dry Intake:-
1) Water enters directly into conduit.
2) Entry through ports controlled gates.
3) No water inside when gates closed.


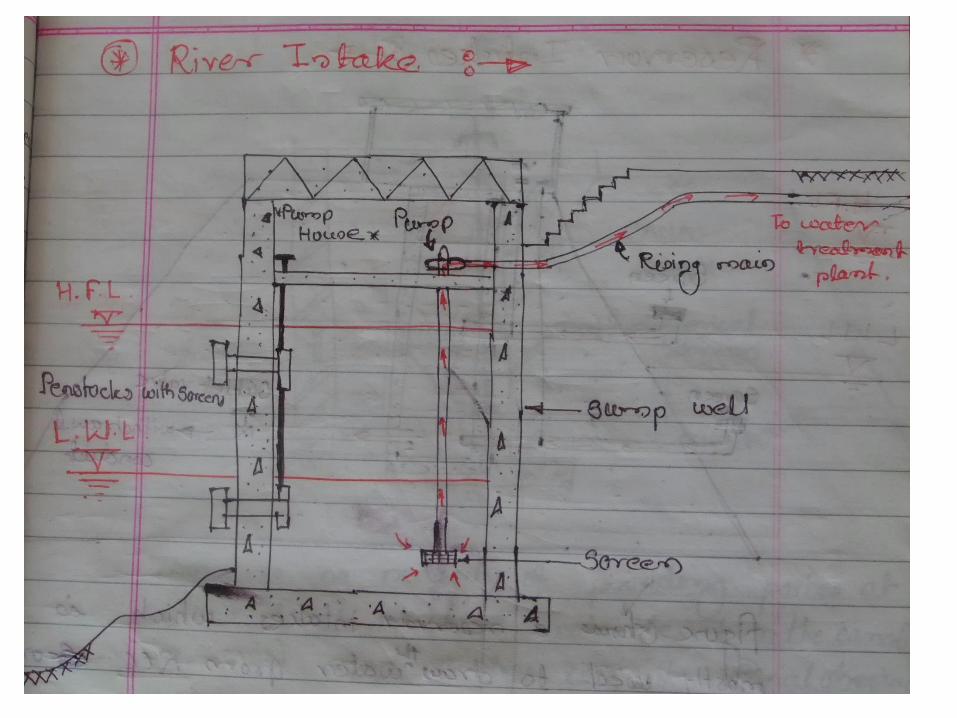
River Intake:-
1) Circular masonry tower of 4 to 7m in dia.
2) Constructed along the bank of river.
3) Required quantity of water even in dry period.
4) Water enters in sump well through penstock.
5) To prevent entry of floating matter, screens fitted to penstock.
6) No. of penstocks at different level.
7) Operation of penstock valve by wheels at pump house..


Reservoir Intake:-
1) RCC masonary dam reservoir.
2) Intake pipes fixed at different level.
3) Screens at mouth of intake pipe.
4) Sluice valve at the top of intake tower.
5) Entered water in vertical portion taken out by outlet pipe.


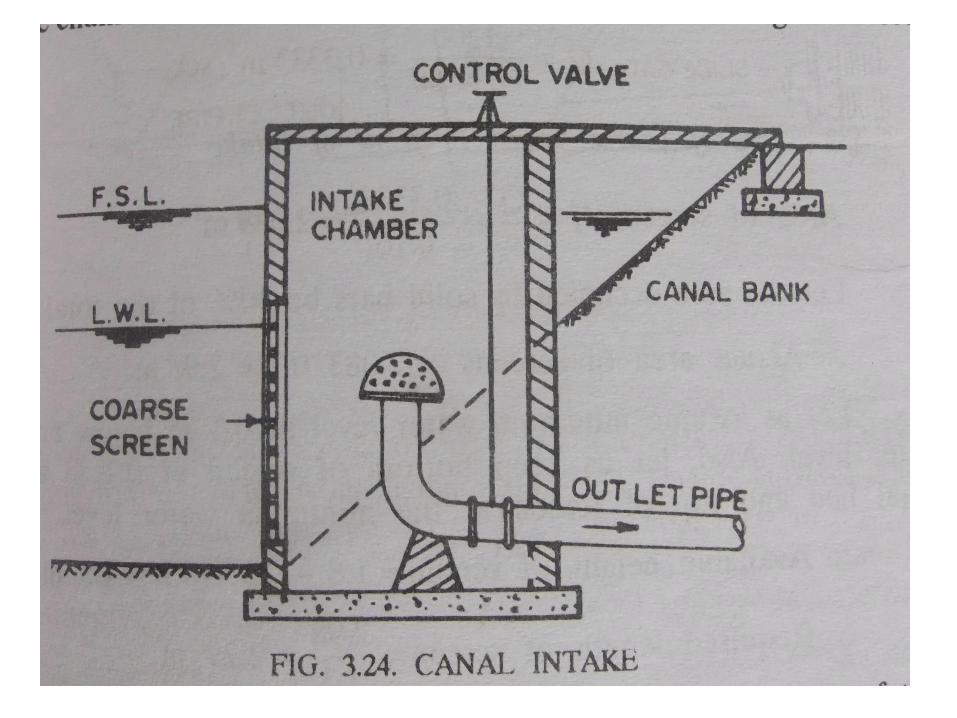
Canal Intake:-
1) No necessity of ports at different levels.
2) Simple structure on bank of canal.
3) Side opening with coarse screen.
4) Water entry controlled by gate valve from top.


Lake Intake:-
1) Submersible intake.
2) Constructed in the bed of lake below LWL.
3) No obstruction to navigation.
4) No danger from floating bodies, etc.
5) Two or more pipes provided to get reqd. water quantity.