Embed Size (px)
Citation preview

Analyzing the Economic Costs of Land Degradationand the Benefits of Sustainable Land Management
Environmental Economics Tool Kit
This document has been produced by the Global Support Unit and waswritten by Lars Hein, Wageningen, the Netherlands
S eptember 2006
GEFGEF
LDC and SIDS Targeted Portfolio Approach for CapacityDevelopment & Mainstreaming of Sustainable Land
Management Project


iii
Preface
This Environmental Economics Toolkit is prepared in the context of the GEF ‘LDC and SIDS Targeted Portfolio
Approach for Capacity Development and Mainstreaming of Sustainable Land Management Project’. The Toolkit
provides guidance on the application of environmental economics, and specifically the analysis and valuation of
ecosystem services, to analyze the costs of land degradation and the benefits of sustainable land management.
The Toolkit is intended to assist technicians and decision makers in their analysis of land degradation and land
management policy options. The Toolkit has been prepared in particular for application in LDC and SIDS
countries. As much as possible, methods have been selected that have minimum data requirements, and the case
studies that illustrate the methodologies reflect issues of potential relevance in LDC and SIDS countries,
including coastal zone management issues.
The Toolkit contains five Tools that together present a detailed description of the various relevant ecological and
economic assessment methodologies. A number of case studies illustrate the application of these
methodologies. For policy makers, an executive summary is provided that describes the basic approach and its
potential to support policy making in the field of land and ecosystem management.
The Toolkit is based on an in-depth literature review of (i) the theories and applications of environmental-
economic valuation techniques; and (ii) the existing experiences with ecosystem services assessment in the
context of sustainable land management. Furthermore, the Toolkit has benefited from comments of stakeholders
involved in SLM including the Technical Advisors of the LDC and SIDS Targeted Portfolio Project.


v
Executive Summary
This Toolkit has been prepared to support the design and implementation of Sustainable Land Management
(SLM) programs. The specific purpose of the Toolkit is: to inform the user of the approaches that can be
followed to analyze and value the economic costs of land degradation and the benefits of sustainable
land management. ‘Land’ is interpreted broadly in the Toolkit, also including wetlands and coastal zones.
The Toolkit follows the general approach of the Millennium Ecosystem Assessment (2003, 2005). Among others,
this means that the Toolkit considers the broad range of benefits provided by agricultural and natural
ecosystems, including provisioning, regulation and cultural services. The various benefits provided by land are
referred to as ‘ecosystem services’ and they may include for example the production of food crops, the regulation
of water flows, and the provision of opportunities for recreation and nature conservation. The Toolkit also
specifically addresses the different scales (local, national, regional, global) at which benefits and potential costs of
SLM are provided or incurred.
Ecosystem services are a central concept in this Toolkit. Economic valuation of ecosystem services can support
land use policy making and implementation in various ways. First, it can reveal the economic costs and benefits
of land use conversion, or of different types of land management. For instance, the economic costs and benefits
of short-term exploitation of forest resources can be compared with those of sustainable management. In this
way, it can also show the trade-offs in land management, i.e., the economic benefits lost and gained, and the
stakeholders benefiting and losing from different policy alternatives. Second, it can show the interests of
different groups of stakeholders in land and ecosystem management, thereby providing a basis for conflict
resolution and integrated, participatory planning of resource management. Third, the approach allows
calculation of economic efficient land management options, for instance the calculation of the optimal degree of
pollution control in a lake ecosystem that is used both as waste outlet for local industries and for water supply,
fishing and recreation. Fourth, it can provide the basis for setting up Payment for Ecosystem Services (PES) type
of schemes, which are a market conform, innovative mechanism for allocating funds from the beneficiaries of
ecosystem services to the providers of these services.
Specifically, this Toolkit contains five complementary Tools. These deal with (i) Selection of the appropriate
assessment approach; (ii) Ecosystem function and services identification; (iii) Ecosystem services assessment (in
bio-physical terms); (iv) Economic valuation; and (v) Ecological-economic modeling. Each Tool contains 2 or 3
subsequent steps, and a number of case studies have been added to illustrate each of the Tools.
The Toolkit allows for three types of assessments. The first type is ‘Partial valuation’. This requires the application
of Tools (i), (ii), (iii) and (iv) and involves the economic valuation of only one or a limited set of ecosystem services.
This type of assessment can be used to show the economic benefits of a certain land use, and the costs or
benefits of land use conversion with regards to specific ecosystem services. It can be applied, for instance, to
assess the economic benefits of eco-tourism on a coral reef, or the economic damages resulting from a loss of
wood production due to forest fires.

viThe second approach is ‘Total valuation’. This approach also requires the application of Tools (i) to (iv), and is
appropriate where a full accounting of the benefits provided by an area under a certain management system is
required. In this case, all significant services need to be identified and valued. For instance, in case a decision
needs to be taken involving the selection of one of two land use conversion options, it is important to analyze all
benefits provided under the two options. This second approach can also be used to compare the economic
benefits generated by two differently managed ecosystems, for instance an area under SLM and an area under
regular management.
The third approach is the ‘Impact analysis’, and involves application of all 5 Tools of the Toolkit. This is a dynamic
approach, which needs to be applied in case of a change in the management of a specific area. In this case, it is
necessary to analyze both the economic value of the benefits generated by the system under consideration, and
how the supply of these benefits will change following a change in management practices. It can be used, for
instance, to analyze the economic benefits of SLM compared to traditional land management, or to assess the
economic impacts of desertification.
The Toolkit describes the various Tools in detail, and explains how they can be applied to support the design and
implementation of SLM programs.

Contents
5TOOL
4TOOL
3TOOL
2TOOL
1TOOL
1
779
10
1213151620
2121252829
3032343637394142454647
48485151545558
59
60
66
69
53444
vii
Introduction ...................................................................................................................................
Selecting the assessment approach ...........................................................................Step 1.1 Problem definition and selection of the valuation approachStep 1.2 Defining the unit of analysisStep 1.3 Defining the system boundaries
Ecosystem Function and Services Identification ............................................Step 2.1 Identification of functions and servicesStep 2.2 Screen the list for potential double counting of servicesStep 2.3 Identification of relevant scales and stakeholdersCase study 1. Ghana Forestry
Ecosystem Services Assessment ....................................................................................Step 3.1 Selection of indicators for ecosystem servicesStep 3.2 Quantitative analysis of ecosystem servicesCase study 2. Assessing the services supplied by forest marginsCase study 3. Erosion control by forest systems in Western China
Economic Valuation ...............................................................................................................Step 4.1 Selection of value indicatorsStep 4.2 Valuation
4.2.1 Averting behavior methods4.2.2 Travel Cost Method4.2.3 Production factor methods4.2.4 The Hedonic Pricing Method (HPM)4.2.5 The Contingent Valuation Method (CVM)
Step 4.3 Selecting the discount rateCase study 4. Value of the pollination service in coffee plantationsCase study 5. Valuation of the tourism service
Assessing the costs and benefits of land use change .................................Step 5.1 Selection of relevant drivers and processesStep 5.2 Quantitative assessment of ecosystem changeStep 5.3 Optimization of ecosystem managementCase study 6. Costs of soil nutrient depletion in Southern MaliCase study 7. Efficient nutrient pollution control in the De Wieden wetlandsCase Study 8. Costs of Coral bleaching in the Indian Ocean
Conclusions & recommendations ...............................................................................
References .......................................................................................................................................
Appendix 1. Glossary ............................................................................................................
Appendix 2. Useful references on the internet ...............................................
List of Boxes providing further information on selected topicsBox 1. Payment for Ecosystem Services Scheme .....................................................................................Box 2. Calculating the Net Present Value .................................................................................................Box 3. Benefit Transfer ..............................................................................................................................

Application of ecosystemservices valuation tosupport SLM
There is a broad recognition that
sustainable land management (SLM) is
crucial for ensuring an adequate, long-
term supply of food, raw materials and
other services provided by the natural
environment to the human society. SLM
involves both the long-term
maintenance of the productive capacity
of agricultural lands, and the
sustainable use of natural and semi-
natural ecosystems, such as semi-arid
rangelands or forests.
Nevertheless, SLM practices are the
exception rather than the rule in many
parts of the world. A whole range of
social, institutional and economic
factors play a role with regards to the
lack of sustainability in the
management of natural resources. For
instance, farmers and local ecosystem
users may be driven by immediate food
and income requirements and may
have limited possibilities to adjust
harvest levels to the carrying capacity
of the ecosystem. Logging companies
or other external users involved in the
exploitation of specific resources may
disregard local interests in land and
ecosystem management.
One of the factors that is often
identified as being critically important
is that the various economic benefits
that are provided by multifunctional
agricultural landscapes and natural
ecosystems tend to be underestimated
in decision making. Agricultural and
natural ecosystems may provide a
whole range of valuable goods and
services, ranging from the supply of
food or medicinal plants, to the
regulation of water flows and
biochemical cycles, to the provision of
sites for recreation or cultural events.
Many of these services directly or
indirectly contribute to human welfare
and, as such, have economic value.
The general lack of recognition of these
values in decision making is caused by
a range of factors. First, these benefits
are often difficult to specify, as they are
widely varying in terms of the type of
benefit supplied, and as they operate
over a range of spatial and temporal
scales. Second, several of these benefits
have a public goods character and/or
are not traded in a market. In spite of
their welfare implications, they
therefore do not show up in economic
statistics. Third, there is often a
mismatch between the stakeholders
that pay the (opportunity) costs of
maintaining an environmental benefit
(e.g. by not converting a forest to
cropland) and the beneficiaries of that
benefit (e.g. downstream water users
benefiting from the regulation of water
flows).
Through assessment of the economic
value of the multiple benefits provided
by land and ecosystems, it is possible to
increase the awareness of stakeholders
and decision makers of the economic
benefits resulting from sustainable land
management. Since economic
considerations generally play a key role
in decision making, it is anticipated that
economic valuation of environmental
benefits can contribute to a more
sustainable and a more efficient
decision making. Analysis and valuation
of ecosystem services can also guide
the setting up of mechanisms to
compensate the suppliers of ecosystem
services for the costs related to
providing those benefits in a Payment
for Ecosystem Services (PES)
mechanism.
However, the economic value attached
to environmental resources should
1
Introduction
United Nations Development Programme – Global Environment Facility | Global Support Unit (GSU) : http://www.gsu.co.za/
TOOL KIT
Environmental Economics
Introduction

always be seen as covering only one of
a set of decision making criteria. It deals
only with the economic (or efficiency)
impacts of decision making, and does
not yield any information on, for
instance, equity issues. It is also
deficient in that not all values can
always be meaningfully transformed
into an economic value estimate (such
as the value of a protected species).
These various constraints to economic
valuation of environmental benefits are
elaborated in the Toolkit (in Tool 4
‘Economic Valuation’), and guidance is
provided on the precise scope and
potential contribution of economic
valuation for the promotion of SLM
practices.
This Toolkit provides guidance on the
use of environmental economics, and in
particular ecosystem services valuation,
to support the design and
implementation of SLM programs and
2
United Nations Development Programme – Global Environment Facility | Global Support Unit (GSU) : http://www.gsu.co.za/
TOOL KIT
Environmental Economics
Figure 1. Structure of the Environmental Economics Toolkit
Define the objectives of the assessment
Identify system type, scaleand boundaries
Select assessmentapproach
Total valuation
Identify relevant functionsand services
Analyze relevant servicesin bio-physical terms
Economic valuation
Synthesis and reporting
Communication tostakeholders and
policy makers
Impact assessment
Identify relevant functionsand services
Analyze relevant servicesin bio-physical terms
Economic valuation
Analyze ecological andeconomic changes
Partial valuation
Identify relevant functionsand services
Analyze relevantservicesin bio-physical terms
Economic valuation
Tool 1: selecting the assessmentapproach
Tool 2: Function and serviceidentification
Tool 3: Services analysis
Tool 4: Valuation
Tool 5: Assessing the costs andbenefits of land use change
Introduction

3
United Nations Development Programme – Global Environment Facility | Global Support Unit (GSU) : http://www.gsu.co.za/
TOOL KIT
Environmental Economics
investments. The general approach of
the Toolkit is in line with the
Millennium Ecosystem Assessment
(2003). The specific purpose of the
Toolkit is to enable the user to analyze
and value the economic costs of land
degradation, and the benefits of
sustainable land management. The
Toolkit includes several case studies
that illustrate the described
methodologies, as well as suggestions
for further reading.
Structure of the Toolkit
The Toolkit comprises five
complementary tools: (i) Selection of
the appropriate assessment approach;
(ii) Identification of ecosystem functions
and services; (iii) Bio-physical
assessment of ecosystem services; (iv)
Economic valuation of ecosystem
services; and (v) Ecological-economic
modeling. The Toolkit can be used for
three distinct approaches to analyzing
the economic benefits of SLM: Partial
Valuation, Total Valuation and Impact
Assessment, see Figure 1.
Partial valuation involves the economic
analysis of only one or a limited set of
services derived from an ecosystem.
Total Valuation is more comprehensive
than Partial Valuation, involving the
analysis of all significant ecosystem
services. It is more accurate, but also
more data intensive than the previous
method. Impact Assessment requires an
additional step, involving the analysis of
how changes in land use or
management will influence ecosystem
services supply. This approach is more
data intensive than the previous two,
and requires additional analysis related
to the modeling of the dynamics of the
ecosystem. Table 1 explains the various
ways in which the three types of
assessment can support policy design
and implementation.
In addition to the applications
described in Table 1, the valuation of
ecosystem services may also support
the formulation of Payment for
Ecosystem Services (PES) schemes.
These schemes involve the monitoring
of ecosystem services, and the
subsequent allocation of payments
from beneficiaries to suppliers of
ecosystem services. These schemes can
support SLM in case there are large
discrepancies between the
stakeholders benefiting from SLM, and
the stakeholders responsible for
management of the ecosystem, for
instance in the case of downstream
water users and upstream stakeholders
responsible for the maintenance of
upland forest that regulate the
downstream water flows (see Box 1).
Application of the Toolkit requires a
multidisciplinary approach. Depending
on the area and ecosystem involved,
the analysis may require ecological,
hydrological, soil sciences, spatial
modeling, policy sciences, anthropology
and economic inputs, and the assessing
team needs to cover the range of
relevant disciplines. In most cases, this
includes at least ecology and
economics.
The Toolkit will not elaborate on the
communication of results to
stakeholders and policy makers, as this
is the topic of several other programs in
the development field, e.g. in the
context of the GEF/UNDP/UNEP
National Communications Support
Program. Note, however, that the Toolkit
can support communications to
decision makers at different stages of
the decision making process. First,
identification of services and
stakeholders (Tool 2) may guide
consultative processes to be
undertaken as part of a decision
making process, by revealing the
Introduction

stakeholders with an interest in the
land management issue at stake.
Second, the Toolkit can be applied to
inform decision makers of the
economic implications of potential land
use change and land use policy
options. Third, combined with an
optimization study (Tool 5, Step 5.3),
the Toolkit can advise policy makers
with regards to optimal responses to
environmental issues.
4
United Nations Development Programme – Global Environment Facility | Global Support Unit (GSU) : http://www.gsu.co.za/
TOOL KIT
Environmental Economics
Approach
Partial Valuation
Total Valuation
Impact Assessment
Potential to support cost-benefit analysis of land degradation and SLM
This approach is useful where only few services provide the majority of the benefits to society, or
where analysis of only few benefits is required to support decision making. In terms of assessing
land degradation, it can be used to compare the key benefits provided by a degraded and a non-
degraded system, or a sustainably and a non-sustainably managed ecosystem. Provided that the
ecosystems are otherwise comparable (in terms of ecosystem type, socio-economic
environment, etc.), this comparison will indicate the overall costs of land degradation and the
benefits of SLM.
Total valuation is appropriate where a full accounting of the benefits provided by an area under a
certain management system is required. This approach can be used, for instance, in case the
benefits of two land use conversion options need to be compared. It can also be used to
compare the benefits of two differently managed ecosystems, for instance an ecosystem under
SLM and an ecosystem under regular management.
This approach can be used to analyze the costs of a continuous, progressive degradation of an
ecosystem, or the benefits of applying SLM in a specific ecosystem. For instance, in case a
rangeland manager decides to adopt a sustainable rangeland management package (involving
e.g. rotational grazing, fire control, seeding of enhanced grasses, optimal stocking, etc.), this will
gradually change the species composition and productivity of the rangeland. Impact Assessment
is required to understand the changes in the ecosystem, and to subsequently analyze the
economic benefits of the new management regime.
Table 1Three approaches to analyze the costs of land degradation and the benefits of SLM.
Introduction

5
United Nations Development Programme – Global Environment Facility | Global Support Unit (GSU) : http://www.gsu.co.za/
TOOL KIT
Environmental Economics
In recent years, PES schemes have emerged as an innovative option to provide incentives for sustainable ecosystemmanagement. PES schemes require the valuation of selected ecosystem services, the identification of beneficiaries andproviders of the services, and the set-up of a payment scheme that regulates the transfer of payments from beneficiariesto providers in return for maintaining the supply of the ecosystem service. PES approaches have been applied in a rangeof settings. For instance, the U.S. government spends over US$1.7 billion per year to induce farmers to protect land. InLatin America, particularly Costa Rica and Mexico, various stakeholders such as irrigation water-user groups, municipalwater supply agencies and other governmental bodies have initiated and executed PES schemes aimed at maintainingdownstream water supply. Other examples are provided by Conservation International, which is protecting 81,000hectares of rainforest in Guyana through a conservation concession that costs US$1.25 per hectare per year, and theWildlife Foundation in Kenya, which is securing migration corridors on private land through conservation leases at US$4 per acre per year (UNEP, 2005). The major benefit of PES schemes is that they can provide a long-term flow of fundsnecessary to protect certain ecosystem services. However, care needs to be taken in the set-up of new PES schemes.Transaction costs can be very high, both with respect to setting up the PES scheme including a trustworthy fundmanager, and for monitoring the flows of ecosystem services that provide the basis for the payments. In addition, PESschemes are unlikely to be successful if local beneficiaries are poor and have no funds available to pay for the ecosystemservices they receive.
Application of the Toolkit; an illustration
In order to further explain how the Toolkit can be applied, an illustration of each Tool is presented, based on a hypothetical
case study in which the costs of land degradation are analyzed (see Table 2).
Step
1. Problem definition
Purpose
Define the study area, the type of
land degradation involved, the relevant
temporal and spatial scales and
potentially relevant institutional
aspects, e.g. land tenure.
Illustrative example
1. The hypothetical study area is an African subhumid ecosystem,
where maize, cowpea, millet and cotton are grown in a varying
landscape consisting of a river bordered by a plain and
surrounding hillsides.
2. The two key types of land degradation are soil nutrient
depletion and erosion.
3.The study deals with the local and national impacts of land
degradation, and has a time horizon of 20 years.
Table 2. Analyzing the costs of land degradation; an example.
BOX 1. Payment for Ecosystem Services (PES) Schemes
Introduction

6
United Nations Development Programme – Global Environment Facility | Global Support Unit (GSU) : http://www.gsu.co.za/
TOOL KIT
Environmental Economics
Step
2. Ecosystem functions and
services identification
3. Ecosystem services
assessment
4. Economic valuation
5. Assessing the costs and
benefits of land use change
Purpose
To identify the key functions and
services provided by the system
Quantification of the services in
biophysical terms
Expressing the services in a
monetary value
Analyzing the impacts of changes
in the landscape on ecosystem
services supply
Illustrative example
The system supplies the following services:
1. Food production through irrigated, non-irrigated lowland, and non-
irrigated upland agriculture;
2. Grazing and animal production;
3. Provision of hunting opportunities on fallow lands;
4. Control of erosion and sedimentation rates by vegetation in
uplands.
1. The system supplies x ton of maize, y ton of millet, and z ton of
cotton, requiring a units of fertilizers, seeds, equipment and labor;
2. Off-take rate: # of animals slaughtered per year, at b labor costs
and c other costs (fencing, veterinary services);
3. Fallow lands provide x ton of bushmeat per year, at labor costs d;
4. Erosion rates in the river are controlled by upland vegetation. With
vegetation, only o ton of sediments would be deposited in the
river, without vegetation this would increase to p ton. Loss of
vegetation would increase sedimentation of a downstream
hydropower dam with q tons of sediments per year.
1. Net value of US$ v per year generated by irrigated and upland and
lowland non-irrigated agriculture;
2. The monetary value of meat, skins and milk is US$ w per year;
3. The monetary value of bushmeat is US$ x per year;
4. The costs of sedimentation in the dam amount to US$ e per year.
1. Soil nutrient depletion is lowering crop yields in upland and
lowland crops with a ton per year, causing an economic loss of
US$ u per year;
2. Erosion is leading to loss of upland crops of b ton per year,
causing an economic loss of US$ y per year;
3. Reduced fallow periods, loss of vegetation cover, and high hunting
pressures have reduced bushmeat harvest with c ton per year,
causing an economic loss of US$ w per year;
4. Siltation of downstream sediments is reducing the lifetime of the
reservoir with d years, causing economic losses of US$ x.
Introduction

7
Selecting the assessment approach
United Nations Development Programme – Global Environment Facility | Global Support Unit (GSU) : http://www.gsu.co.za/
TOOL KIT
Environmental Economics
1TOOL
Tool 1
Introduction
The first step in the application of the
Environmental Economics Toolkit is to
determine the overall objective or
problem to be analyzed. As indicated in
Figure 1, the type of problem will
determine the overall economic
assessment approach that needs to be
followed. Examples of the type of
analysis that can be conducted with the
Environmental Economics toolkit are (i)
the analysis and valuation of the
benefits of adopting SLM practices; (ii)
analysis of the economic costs of land
degradation; or (iii) comparison of two
project alternatives with different
environmental and land management
impacts.
Once the objective or problem is clearly
defined, the user needs to select the
appropriate assessment approach and
the units of the analysis. The Toolkit
allows for three types of Assessments:
Partial Valuation, Total Valuation and
Impact Assessment. The object of the
study can either be an ecologically
defined system, such as a forest plot or
a watershed, or an institutionally
defined system, such as a municipality
or a country. The area can be relatively
homogeneous, including only one main
ecosystem type (e.g. a semi-arid
rangeland), or it can be heterogeneous
(e.g. comprising a mix of agricultural
and semi-natural lands). In case the area
comprises different systems, it is likely
that the sub-systems supply different
types of ecosystem services, which
needs to be accounted for in the
application of Tools 2 and 3.
Subsequently, the user needs to specify
the system boundaries including the
relevant spatial and temporal scales for
the assessment. The benefits of an area
may accrue to stakeholders at different
scales, ranging from local farmers or
users, to regional traders, to national
investors, to the global community that,
for example, may have an interest in
globally important biodiversity
contained in a system. The user needs
to decide if the assessment will extend
to all stakeholders, or if it will be
confined to particular scales (e.g. the
impact of SLM on local food security; or
the global costs of land degradation). It
is also important to select the
appropriate time horizon for the
assessment: is the objective of the
assessment to determine the current
flows of benefits, or is the long-term
supply of benefits relevant ?
Purpose of the Tool
The purpose of the first tool is to guide
the user in clearly defining the
objective of the economic assessment
and the system to be studied, and to
assist the user in selecting the
appropriate valuation approach.
How to use the Tool
The tool provides the starting point for
analyzing ecosystem services in the
context of sustainable land
management. It contains three steps,
dealing with: (i) problem definition; (ii)
selecting the unit of analysis; and (iii)
specification of systems boundaries.
Step 1.1 Problem definition andselection of the valuationapproach
The first step to be carried out in this
Tool is the selection of the appropriate
assessment procedure. As explained in
the Introduction section, the user may
be interested in (i) Partial valuation; (ii)
Total valuation; or (iii) Impact
assessment. Some examples of
potential applications of the 3 valuation
types are provided in Table 3 below.

(i) Partial valuation. Partial valuation
involves the economic valuation of only
one or a limited set of environmental
benefits. It can be used where only few
environmental benefits supply the large
majority of benefits to society, and
where appraisal of only few benefits is
required to support decision making.
This approach can be applied, for
instance, in case the impact of SLM on
food security needs to be assessed.
(ii) Total valuation. The second approach
is ‘Total valuation’. This approach is
appropriate where a full accounting of
the benefits provided by an area under
a certain management system is
required. In this case, all services need
to be identified and valued. For
instance, in case a decision needs to be
taken involving the selection of one of
two land use conversion options, it may
be important to analyze all benefits
provided in the two options. Note that,
in specific cases, it may be clear that
some services only generate a very
minor part of the total benefits, as in
the case of carbon sequestration in a
system that absorbs only minimal
amounts of carbon over time. In this
case, it may be decided to skip these
minor services and include them only
as a pro memory post.
(iii) Impact assessment. The third
approach is ‘Impact assessment’. It
involves analyzing the impacts of
changes in environment and land
management on the supply of benefits
8
United Nations Development Programme – Global Environment Facility | Global Support Unit (GSU) : http://www.gsu.co.za/
TOOL KIT
Environmental Economics
Tool 1
Table 3. Examples of the potential applications of the three main valuation approaches
Valuation approach Examples Partial valuation 1.Valuation of the productive capacity of a semi-arid rangeland.
2.Valuation of the production of wood and/or Non-timber forest products from a specific forest, or
the forests in a country.
3.Valuation of the hydrological service of an upland forest in order to define a payment vehicle from
downstream users to upland managers to maintain this service.
Total valuation 1.Valuation of the ecosystem services supplied by a forest in order to compare the benefits of
timber logging with those of sustainable management
2.Valuation of the services provided by a natural area in order to identify which stakeholders
benefits from the area and which stakeholders may be expected to contribute to financing the
preservation of the area.
Impact assessment 1.Analyzing the impacts of pollution control measures in a wetland on water quality and ecosystem
services supply in order to compare the costs and benefits of pollution control measures
2.Analysis of the impact of disturbances (e.g. road construction, or desertification) on the supply
of ecosystem services.

to society. This approach needs to be
applied in case of a change in the
management of an area (e.g. through
the adoption of various SLM practices).
In this case, it is necessary to analyze
both the economic value of the
benefits generated by the system under
consideration, and how the supply of
these benefits will change following a
change in management practices. This
approach is also relevant for the
prediction of the impact of
environmental pressures, e.g. pollution,
that may cause a change in the state of
the environmental system. Hence,
compared to the two previous
approaches, this approach requires an
additional Tool, dealing with how the
impact of the change in management
or pressures can be analyzed or
modeled.
Step 1.2 Defining the unit ofanalysis
A key question that every user of these
guidelines will come across at some
stage is ‘should the services supplied by
this ecosystem be valued in monetary
terms or not ?’, to be followed by ‘should
all or only some services be valued in
monetary terms, and what do we do
with the other services ?’
It is clear that monetary valuation is no
‘silver bullet’ that provides a
unequivocal approach to measure the
full value of world’s ecosystems. Besides
the practical problems that may occur
in measuring services, it is
fundamentally difficult to translate
subjective values dealing with health,
peoples lives, and nature into the single
unit ‘money’. People do not normally
express everything along one value
type, but are used to thinking of
multiple value types (see e.g. Martinez-
Alier et al. 1998; O’Neill, 2001 and
Munda, 2004 for more information).
However, on the other side, where
decisions are made in formal fora,
decision makers require some kind of a
unit with which to compare costs and
benefits of different policy options, and
the most commonly used unit is a
monetary one. Hence, there is a need to
make sure that as much as reasonably
possible, ecosystem services are
expressed in a monetary unit in order
to be properly accounted for in
decision making processes. Therefore, in
these guidelines, the practical
recommendation is to express as much
services in a monetary unit as is
possible from a theoretical and a
practical perspective. For all production
and most regulation services, it will, in
principle, be possible to estimate the
monetary value of the service, as most
of these services can be either directly
or indirectly related to a market
transaction. In the case of the cultural
services, this is much more complex. For
instance, it may often not be possible to
translate the full value of biodiversity
and nature in a monetary unit, as the
economic value of a species, or a
population of a species, is in most cases
very hard to determine.
In view of the above, money will be the
unit of choice for these guidelines,
complemented with specific indicators
for those services that are hard to
express in monetary terms (such as
biodiversity, as further specified in Tool
3 (‘Bio-physical Assessment’). The
monetary value of an ecosystem service
can be expressed either (i) in terms of
an annual value indicating the flows of
benefits form an ecosystem (e.g.
US$/ha/year); or (ii) as Net Present Value
(NPV), which indicates the sum of the
present and discounted future flows of
net benefits from the ecosystem (e.g.
US$/ha). In this second case, future
flows are discounted with a discount
rate in order to account for the
preference people have for money now
9
United Nations Development Programme – Global Environment Facility | Global Support Unit (GSU) : http://www.gsu.co.za/
TOOL KIT
Environmental Economics
Tool 1

rather than at a later stage. The concept
of NPV is further elaborated in Tool 4.
Step 1.3 Defining the systemboundaries
Valuation (as any other analysis)
requires that the object of the
valuation is clearly defined. Hence, it is
necessary to define the system to be
analyzed, in terms of its spatial and
temporal boundaries. The ecosystem is
the entry point often used for
valuation of ecosystem services and
environmental benefits.
The Convention on Biological Diversity
provided the following definition of an
ecosystem "a dynamic complex of
plant, animal and micro-organism
communities and their nonliving
environment interacting as a functional
unit" (United Nations, 1992). For the
purpose of this Toolkit, this definition is
further operationalised following
Likens (1992) who elaborates on the
spatial aspects of ecosystems:
‘Ecosystems are the individuals, species
and populations in a spatially defined
area, the interactions among them, and
those between the organisms and the
abiotic environment’. This spatial
approach makes it easier to define the
physical boundaries of the area to be
analyzed. Following the Millennium
Ecosystem Assessment, ecosystems
may comprise both natural and/or
strongly man influenced systems such
as agricultural fields.
Note that the ecosystem to be
valued may contain a number of
different (sub-)ecosystems. For
instance, a forest ecosystem may
contain open patches or a set of lakes
or ponds. Spatial heterogeneity is the
rule rather than the exception, and the
user of the guidelines needs to be
aware that ecological sub-systems may
supply entirely different ecosystem
services than the overall study area.
Hence, a choice needs to be made in
terms of system boundaries: are
fundamentally different ecological sub-
systems to be included in the analysis
or not ? For instance, are the ponds
present in a forest to be included in the
analysis or not ? The response will
entirely depend on the formulated
problem. For instance, if the user is
interested only in wood and non-
timber forest products (as in a partial
valuation), he may prefer to exclude
the ponds from the analysis. If, on the
other hand, full valuation including
biodiversity aspects is the study
objective, the ponds need to be
included because they will have a
different species composition and
because they may be essential for
supporting biodiversity in the forest
at large.
Note that ecological and institutional
boundaries seldom coincide, and that
stakeholders in ecosystem services
often cut across a range of institutional
zones and scales. In other words, the
ecosystem may be located in different
municipalities or even countries.
Whereas for the analysis of land
degradation processes, ecosystem
services and ecosystem dynamics the
ecosystem is the appropriate unit of
analysis, in the identification of policy
measures the administrative and
institutional contexts need to be
explicitly considered. This
incongruence between ecological and
political boundaries is very common in
environmental management, and
flexible solutions need to be identified
on a case-by-case basis. In case the
benefits and costs of SLM accrue to
different countries, e.g. where an upper
watershed is protecting downstream
river flows in another country,
economic analysis of costs and benefits
could be used to support PES schemes
10
United Nations Development Programme – Global Environment Facility | Global Support Unit (GSU) : http://www.gsu.co.za/
TOOL KIT
Environmental Economics
Tool 1

in order to compensate the first
country for the supply of the
ecosystem services (see Box 1).
Furthermore, the temporal boundaries
of the system to be analyzed have to be
defined. For partial and total valuation,
the user of the guidelines may be
interested in a ‘snapshot’ analysis of the
benefits supplied by the ecosystem. In
this case, the NPV would be based on
the assumption that the future flows of
ecosystem services would be equal to
the present flows. This, clearly, is a very
strong assumption, and there are
numerous ecosystems (think of many
fish stocks or forests) where
unsustainable harvest rates are being
applied, and where future flows of
ecosystem services can only be
expected to decline. In case of
unsustainably managed ecosystems, a
snap-shot analysis based on current
flows of ecosystem services could
severely overestimate the value of the
ecosystem under current management.
Hence, a snap-shot approach is only
valid in case there are grounds to
assume that the extraction of
ecosystem services do not exceed the
regenerative capacity of the ecosystem.
Otherwise, reductions in flows have to
be accounted for, and a longer time
horizon needs to be accounted for. In
this case, as well as in the case of the
dynamic Impact Assessment, it is up to
the user to chose the time horizon for
the analysis, which can vary from for
instance 20 to 50 years depending on
the time frame relevant for the user,
and the discount rate used.
11
United Nations Development Programme – Global Environment Facility | Global Support Unit (GSU) : http://www.gsu.co.za/
TOOL KIT
Environmental Economics
Tool 1
The Convention on BiologicalDiversity provided thefollowing definition of anecosystem "a dynamiccomplex of plant, animal andmicro-organism communitiesand their nonlivingenvironment interacting as afunctional unit" (UnitedNations, 1992).

Introduction
In the early 1970s, the concept of
ecosystem function was proposed to
facilitate the analysis of the benefits
that ecosystems provide to society. An
ecosystem function can be defined as
“the capacity of the ecosystem to
provide goods and services that satisfy
human needs, directly or indirectly”.
Ecosystem functions depend upon the
state and the functioning of the
ecosystem. For instance, the function
‘production of firewood’ is based on a
range of ecological processes involving
the growth of plants and trees that use
solar energy to convert water, plant
nutrients and CO2 to biomass.
A function may result in the supply of
ecosystem services, depending on the
demand for the good or service
involved. Ecosystem services are the
goods or services provided by the
ecosystem to society (following the
definition of the Millennium Ecosystem
Assessment, 2003). The supply of
ecosystem services will often be
variable over time, and both actual and
potential future supplies of services
should be included in the assessment.
Ecosystem functions, and the services
attached to these functions, vary widely
as a function of the type of ecosystem
and the socio-economic setting
involved. For example, the capacity of
the ecosystem to provide firewood
depends on the forest cover and the
amount of woody plant biomass
contained in the system, as well as, in
the longer term, on the primary
productivity of the forest. However, the
actual supply of firewood also depends
on the demand of different
stakeholders for firewood. This demand
is determined by the need for wood
energy as well as the availability of
other sources to satisfy household
energy needs.
Hence, identification of functions and
supplied ecosystem services is the first
step in analyzing the benefits provided
by an ecosystem to society. In itself, it
allows a qualitative analysis of the
potential consequences of
environmental change, and it also
provides the basis for the next steps of
the Toolbox. Specification of the
functions and services to be studied is
also required to avoid double-counting
of benefits, which may lead to
overestimation of the economic
benefits of an area. Furthermore,
analysis of the different stakeholders
that benefit from ecosystem services
can assist in determining stakeholder
interests in the management of an area
or ecosystem.
Purpose of the Tool
The ecosystem function and services
identification tool allows the user to
identify, from a detailed listing, the
ecosystem services relevant for the
environmental and socio-economic
setting under consideration. It also
facilitates analyzing stakeholder
interests in the management of an area.
How to use the tool
The user is recommended to first
identify the functions and services
relevant for his analysis, using Table 2.
These relevant functions and services
will depend on the objective of the
analysis to be undertaken as well as the
area under consideration. Second, the
user should consider the issue of
double counting, i.e. remove services
from the list that would lead to
inconsistencies in the value estimates
because of the double counting of
services. Third, the user is
recommended to identify the relevant
stakeholders and scales for each of the
selected services. This will guide the
12
Ecosystem Function & Services Identification
United Nations Development Programme – Global Environment Facility | Global Support Unit (GSU) : http://www.gsu.co.za/
TOOL KIT
Environmental Economics
2TOOL
Tool 2

further analysis and valuation of the
services. These three steps are
described below.
Step 2.1 Identification offunctions and services
The analysis of ecosystem services for
SLM starts with the identification of the
functions, and the services provided by
the ecosystem under consideration. In
case of a ‘Total valuation’, all potentially
relevant services need to be considered,
whereas in case of a ‘Partial valuation’, a
selection can be made based on the
purpose of the assessment (as
described in Tool 1). An ‘Impact
assessment’ can be based on either
valuation of all services, or of a selection.
Table 4 provides a comprehensive list
of ecosystem services, containing 24
different types of services. By and large,
the list follows the MEA (2003).
Compared to MEA (2003) some minor
adjustments have been made in order
to ensure consistency in its application
to SLM. The list contains three types of
ecosystem services, which are based on
a different type of interaction between
people and ecosystems. The three types
of functions are:
(i) Provisioning Services.
Provisioning services are the goods and
services produced by or in the
ecosystem, for example a piece of fruit
or a plant with pharmaceutical
properties. The goods and services may
be provided by natural, semi-natural
and agricultural systems and, in the
calculation of the value of the service,
the relevant production and harvest
costs have to be considered.
(ii) Regulation services.
Regulation services result from the
capacity of ecosystems to regulate
climate, hydrological and bio-chemical
cycles, earth surface processes, and a
variety of biological processes. These
services often have an important spatial
aspect; e.g. the flood control service of
an upper watershed forest is only
relevant in the flood zone downstream
of the forest. The nursery service is
classified as a regulation service. It
reflects that some ecosystems provide a
particularly suitable location for
reproduction and involves a regulating
impact of an ecosystem on the
populations of other ecosystems.
(iii) Cultural services. They relate
to the benefits people obtain from
ecosystems through recreation,
cognitive development, relaxation, and
spiritual reflection. This may involve
actual visits to the area, indirectly
enjoying the ecosystem (e.g. through
nature movies), or gaining satisfaction
from the knowledge that an ecosystem
containing important biodiversity or
cultural monuments will be preserved.
The latter may occur without having
the intention of ever visiting the area
(Aldred, 1994). The cultural services
category also includes the habitat
service, that represents the benefits
that people obtain from the existence
of biodiversity and nature (not because
biodiversity provides a number of
services, but because it is important in
itself ). In this way, the list deviates from
the MEA, 2003, where biodiversity is
assumed to support the supply of other
services by enhancing ecosystem
functioning and resilience, but where
the value of biodiversity in itself is not
explicitly recognized. However, this
does not do justice to the importance
of protecting biodiversity in natural
parks for the purpose of conserving
biodiversity in itself. Therefore, the
habitat service is added to the list.
Because the importance attached to
biodiversity is strongly dependent on
the cultural background of the
13
United Nations Development Programme – Global Environment Facility | Global Support Unit (GSU) : http://www.gsu.co.za/
TOOL KIT
Environmental Economics
Tool 2

14
United Nations Development Programme – Global Environment Facility | Global Support Unit (GSU) : http://www.gsu.co.za/
TOOL KIT
Environmental Economics
Tool 2
Table 4. List of ecosystem services (based on Ehrlich and Ehrlich, 1981; Costanza et al., 1997; DeGroot et al., 2002; Millennium Ecosystem Assessment, 2003; Hein et al., 2006). Category
Provisioning services
Regulation services
Cultural services
Provisioning services reflect goods and services
extracted from the ecosystem
Regulation services result from the capacity of
ecosystems to regulate climate, hydrological
and bio-chemical cycles, earth surface
processes, and a variety of biological processes
Cultural services relate to the benefits people
obtain from ecosystems through recreation,
cognitive development, relaxation, and spiritual
reflection
Ecosystem services
l Food
l Fodder (including grass from pastures)
l Fuel (including wood and dung)
l Timber, fibers and other raw materials
l Biochemical and medicinal resources
l Genetic resources
l Ornamentals
l Carbon sequestration
l Climate regulation through control of albedo, temperature and
rainfall patterns
l Hydrological service: regulation of the timing and volume of
river flows
l Protection against floods by coastal or riparian systems
l Control of erosion and sedimentation
l Nursery service: regulation of species reproduction
l Breakdown of excess nutrients and pollution
l Pollination
l Regulation of pests and pathogens
l Protection against storms
l Protection against noise and dust
l Biological nitrogen fixation (BNF)
l Provision of cultural, historical and religious heritage
(e.g. a historical landscape or a sacred forests)
l Scientific and educational information
l Opportunities for recreation and tourism
l Amenity service: provision of attractive housing and living
conditions
l Habitat service: provision of a habitat for wild plant and
animal species

observer, the service is classified as a
cultural service (cf Hein et al., 2006).
Furthermore, contrary to Millennium
Ecosystem Assessment (2003), but
analogous to Costanza et al. (1997) and
Hein et al. (2006), there is no category
‘supporting services’. Supporting
services represent the ecological
processes that underlie the functioning
of the ecosystem. Their inclusion in
valuation may lead to double counting
as their value is reflected in the other
three types of services. In addition,
there are a very large number of
ecological processes that underlie the
functioning of ecosystems, and it is
unclear on which basis supporting
services should be included in, or
excluded from a valuation study.
Therefore, in order to ensure maximum
practical applicability of the Toolkit, this
category of services is not further
considered here.
Note that, in principle, the user has the
choice of valuing services or functions;
both express the benefits supplied by
the natural environment to society. The
main difference is that valuation of
services is based on valuation of the
flow of benefits, and valuation of
functions is based on the environment’s
capacity to supply benefits. The first
expresses clearly the current benefits
received, but additional analyses are
required if the flow of ecosystem
services is likely to change in the short
or medium term (e.g. if current
extraction rates are above the
regenerative capacity of the
ecosystem). In this case, calculation of
the NPV requires that assumptions are
made on the future flows of services.
Functions better indicate the value that
can be extracted in the long-term, and
their value is not biased by temporary
overexploitation. However, it is often
much more difficult to assess the
capacity to supply a service than to
assess the supply of the service itself.
For instance, for the function ‘supply of
fish’, this requires analysis of the
sustainable harvest levels of the fish
stocks involved which needs to be
based on a population model including
reproduction, feed availability and
predation levels. Hence, in most
valuation studies, it is chosen to value
services rather than functions, and to
account for potential changes in
services supply in the assessment.
Step 2.2 Screen the list forpotential double counting ofservices
An important issue in the valuation of
ecosystem services is the double
counting of services (Millennium
Ecosystem Assessment, 2003; Turner et
al., 2003). Specifically, there is a risk of
double counting in relation to the
regulation services that support the
supply of other services from an
ecosystem. For example, consider a
natural ecosystem that harbors various
populations of pollinating insects.
These insects pollinate both the plants
inside the natural ecosystem, and the
fruit trees of adjacent orchards. In an
analysis of the economic value of the
natural area, only the pollination of the
adjacent fruit trees should be included
as a regulation service. As for the
various trees inside the natural area, the
produce from these trees (e.g. wood,
rattan and fruits) should be included in
the valuation (as provisioning services),
but the pollination of these natural
trees should not, as this would lead to
double counting
In general, regulation services should
only be included in the valuation if (i)
they have an impact outside the
15
United Nations Development Programme – Global Environment Facility | Global Support Unit (GSU) : http://www.gsu.co.za/
TOOL KIT
Environmental Economics
Tool 2
ecosystem to be valued; and/or (ii) if
they provide a direct benefit to people
living in the area (i.e. not through
sustaining or improving another
service). The first case is illustrated by
the example of the fruit trees above. An
example of a service that may provide a
direct benefit inside an area that is not
included in other ecological services, is
the service ‘protection against noise
and dust’ provided by a green belt
besides a highway. If this affects the
living conditions of people living inside
the study area, it needs to be included
in the valuation. A prerequisite for
applying this approach to the valuation
of regulation services is that the
ecosystem is defined in terms of it’s
spatial boundaries – otherwise the
external impacts of the regulation
services can not be precisely defined.
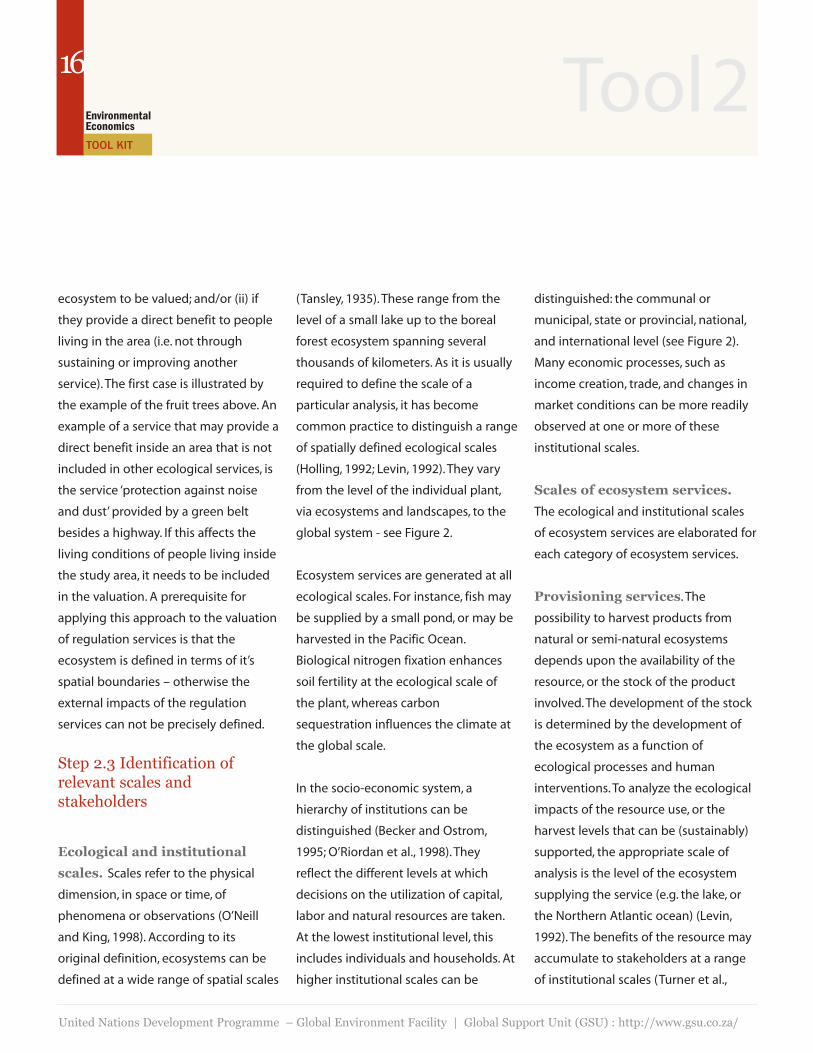
Step 2.3 Identification ofrelevant scales andstakeholders
Ecological and institutional
scales. Scales refer to the physical
dimension, in space or time, of
phenomena or observations (O’Neill
and King, 1998). According to its
original definition, ecosystems can be
defined at a wide range of spatial scales
(Tansley, 1935). These range from the
level of a small lake up to the boreal
forest ecosystem spanning several
thousands of kilometers. As it is usually
required to define the scale of a
particular analysis, it has become
common practice to distinguish a range
of spatially defined ecological scales
(Holling, 1992; Levin, 1992). They vary
from the level of the individual plant,
via ecosystems and landscapes, to the
global system - see Figure 2.
Ecosystem services are generated at all
ecological scales. For instance, fish may
be supplied by a small pond, or may be
harvested in the Pacific Ocean.
Biological nitrogen fixation enhances
soil fertility at the ecological scale of
the plant, whereas carbon
sequestration influences the climate at
the global scale.
In the socio-economic system, a
hierarchy of institutions can be
distinguished (Becker and Ostrom,
1995; O’Riordan et al., 1998). They
reflect the different levels at which
decisions on the utilization of capital,
labor and natural resources are taken.
At the lowest institutional level, this
includes individuals and households. At
higher institutional scales can be
distinguished: the communal or
municipal, state or provincial, national,
and international level (see Figure 2).
Many economic processes, such as
income creation, trade, and changes in
market conditions can be more readily
observed at one or more of these
institutional scales.
Scales of ecosystem services.
The ecological and institutional scales
of ecosystem services are elaborated for
each category of ecosystem services.
Provisioning services. The
possibility to harvest products from
natural or semi-natural ecosystems
depends upon the availability of the
resource, or the stock of the product
involved. The development of the stock
is determined by the development of
the ecosystem as a function of
ecological processes and human
interventions. To analyze the ecological
impacts of the resource use, or the
harvest levels that can be (sustainably)
supported, the appropriate scale of
analysis is the level of the ecosystem
supplying the service (e.g. the lake, or
the Northern Atlantic ocean) (Levin,
1992). The benefits of the resource may
accumulate to stakeholders at a range
of institutional scales (Turner et al.,
16
United Nations Development Programme – Global Environment Facility | Global Support Unit (GSU) : http://www.gsu.co.za/
TOOL KIT
Environmental Economics
Tool 2

2000). Local residents, if present, are
often an important actor in the harvest
of the resources involved, unless they
do not have an interest in, or access to
the resource (e.g. due to a lack of
technology, or because the ownership
or user-right of the resource resides
with other stakeholders). In addition,
there may be stakeholders’ interests at
larger scales if the goods involved are
harvested, processed or consumed at
larger scales. For example, this is the
case if a marine ecosystem is fished by
an international fleet, or if a particular
genetic material or medicinal plants is
processed and/or consumed at a larger
institutional scale (see e.g. Blum, 1993).
Regulation services. A regulation
service can be interpreted as an
ecological process that has (actual or
potential) economic value because it
has an economic impact outside the
studied ecosystem and/or if it provides
a direct benefit to people living in the
area (see the previous section). Because
the ecological processes involved take
place at certain, ecological scales, it is
often possible to define the specific
ecological scale at which the regulation
service is generated (see Table 5). For
many regulation services, not only the
scale, but also the position in the
landscape plays a role – for example,
the impact of the water buffering
capacity of forests will be noticed only
downstream in the same catchment
(Bosch and Hewitt, 1982). Stakeholders
in a regulation service are all people
residing in or otherwise depending
upon the area affected by the service.
Cultural services. Cultural services
may also be supplied by ecosystems at
different ecological scales, such as a
monumental tree or a natural park.
Stakeholders in cultural services can
vary from the individual to the global
scale. For local residents, an important
cultural service is commonly the
enhancement of the aesthetic, cultural,
natural, and recreational quality of their
living environment. In addition, in
particular for indigenous people,
17
United Nations Development Programme – Global Environment Facility | Global Support Unit (GSU) : http://www.gsu.co.za/
TOOL KIT
Environmental Economics
Tool 2
Figure 2. Selected ecological and institutional scales
Ecological scales
global
biome
landscape
ecosystem
plot
plant
Institutional scales
international
national
state/provincial
municipal
family
individual
Human-ecosysteminteractions

ecosystems may also be a place of
rituals and a point of reference in
cultural narratives (Posey, 1999; Infield,
2001). Nature tourism has become a
major cultural service in Western
countries, and it is progressively gaining
importance in developing countries as
well. Because the value attached to the
cultural services depends on the
cultural background of the stakeholders
involved, there may be very different
perceptions of the value of cultural
services among stakeholders at
different scales. Local stakeholders may
attach particular value to local heritage
cultural or amenity services, whereas
national and/or global stakeholders
may have a particular interest in the
conservation of nature and biodiversity
(e.g. Swanson, 1997; Terborgh, 1999).
Scales and stakeholders’
interests. The scales at which
ecosystem services are generated and
supplied determine the interests of the
various stakeholders in the ecosystem.
Services generated at a particular
18
United Nations Development Programme – Global Environment Facility | Global Support Unit (GSU) : http://www.gsu.co.za/
TOOL KIT
Environmental Economics
Tool 2
Table 5. Most relevant ecological scales for the regulation services – note that some services may be relevant at more than one scale.Based upon Hufschmidt et al. (1983), Kramer et al. (1995); Van Beukering et al. (2003); Hein et al. (2006).
Carbon sequestration
Climate regulation through regulation of albedo, temperature and rainfall
patterns
Regulation of the timing and volume of river and ground water flows
Protection against floods by coastal or riparian ecosystems
Regulation of erosion and sedimentation
Regulation of species reproduction (nursery service)
Breakdown of excess nutrients and pollution
Pollination (for most plants)
Regulation of pests and pathogens
Protection against storms
Protection against noise and dust
Control of run-off
Biological nitrogen fixation (BNF)
> 1,000,000 km2
10,000-1000,000 km2
1-10,000 km2
< 1 km2
Global
Biome – landscape
Ecosystem
Plot – plant

ecological level can be provided to
stakeholders at a range of institutional
scales, and stakeholders at an
institutional scale can receive
ecosystem services generated at a
range of ecological scales. When the
value of a particular ecosystem service
is assessed, different indications of its
value will be found depending upon
the institutional level at which the
analysis is performed. For example, local
stakeholders may particularly value a
provisioning service that may be
irrelevant at the national or
international level. Hence, if a valuation
study is implemented with the aim of
supporting decision making on
ecosystems, it is crucial to indicate on
whose perspectives the values are
based.
Stakeholders. A stakeholder is any
entity with a declared or conceivable
interest or stake in a policy concern
(Schmeer, 1999). Stakeholders can be of
different form, size and capacity
including individuals, organizations, or
unorganized groups. In most cases,
stakeholders fall into one or more of
the following categories: international
actors (e.g. donors), national or political
actors (e.g. legislators, governors),
public sector agencies (e.g. MDAs),
interest groups (e.g. unions, medical
associations), commercial/private for-
profit, nonprofit organizations (NGOs,
foundations), civil society members, and
users/consumers. Government
institutions are stakeholders for
resources in their jurisdiction, and
citizens of other countries may be
stakeholders when they derive welfare
from the long-term indirect-benefits
from ecosystem services such as carbon
sequestration, tourism and nature
conservation.
Stakeholders have four main attributes
with respect to their interests in
ecosystem services: the type of
resource use practiced by the
stakeholders, the level of influence
(power) they hold, their degree of
dependency on the ecosystem services
(availability of alternatives), and the
group/coalition to which they belong.
These attributes can be identified
through various data collection
methods, including interviews with
country experts knowledgeable about
stakeholders or with the actual
stakeholders directly. It is clear that the
stakeholders deriving benefits from an
ecosystem may be just as diverse as the
ecosystem services themselves.
Nevertheless, it is crucial to consider the
differences in stakeholders when
analyzing ecosystem services, as
stakeholder interests and access rights
will determine the interests and
motivations of stakeholders in
managing the resource, and
management plans need to be fine-
tuned with these interests in order to
obtain stakeholder collaboration at
different levels. This is further explained
in Case study 1 below.
19
United Nations Development Programme – Global Environment Facility | Global Support Unit (GSU) : http://www.gsu.co.za/
TOOL KIT
Environmental Economics
Tool 2

Stakeholders are present at different institutional levels, but within each institutional level there are also majordifferences between stakeholders in terms of their dependency on the resource (from short term profit generator to longterm livelihood dependency – compare a logging company and local forest dwellers), as well as their access rights to theresource (from traditional/customary to access rights based on negotiated contracts). This is illustrated in Figure 3 thatshow the stakeholders present in relation to the management of a forest system in Ghana (from Kotey et al., 1998). Atthe local scale, there are the forest-edge communities that harvest non-timber forest products, wood, and who benefitfrom the various local regulation and cultural services supplied by the forest. For instance, the forests play a role inmaintaining dry season water supply from local rivers and in recharging aquifers. At the same time, local communitiesmay exert pressure on forests in case they have an interest in converting forests to farmland, or where there iscommercial harvesting of wood for charcoal production. At the district level, there are local authorities as well as peoplethat buy the NTFP and wood from the forest in local markets. At the national level, there are national authorities, loggingcompanies interested in short term exploitation of the forest, and a range of other groups with an interest in forestmanagement (including NGOs, scientists, etc.). Finally, at the global level, there is an interest in the biodiversity of theforests and the carbon sequestered in it. Hence, at all levels, there are stakeholders with interests in different servicessupplied by an ecosystem, and the supply of these services may be compatible or not. Ecosystem services identificationand stakeholder assessment provides a clear overview of the different interests in the management of the ecosystemthat will have to be considered in the preparation of management strategies.
20
United Nations Development Programme – Global Environment Facility | Global Support Unit (GSU) : http://www.gsu.co.za/
TOOL KIT
Environmental Economics
Tool 2
Case study 1. Ghana Forestry
Figure 3. Levels of stakeholders in Ghana’s forests (Kotey et al., 1998).
Universities
Politicalparties
Students
Journalists
EnvironmentalNGO’s
Global community
The labourmovement
Churches
Traditional authorities
Forest-edgecommunities
Timber industry
FarmersGovernment forestry
agenciesFirst ‘level’
Second ‘level’
Third ‘level’

Introduction
The next step in the economic
assessment is the quantification, in bio-
physical units, of the relevant
ecosystem services identified in the
previous step. This quantification is a
prerequisite for the economic valuation
to be undertaken in the next step of
the assessment.
For some ecosystem services,
quantification is relatively
straightforward. For instance, the
service ‘supply of firewood’ involves the
assessment of the amounts of firewood
harvested per time unit, per area unit.
Further specification may be possible, if
required, by indicating the quality of
the firewood (e.g. expressed as caloric
value). Information on the amount of
products harvested in an ecosystem
may be obtained form local surveys,
whereas indications on qualities of
products may be obtained, for instance,
from the consultation of relevant
handbooks. However, for other services,
quantification may be more difficult,
sometimes involving limited or more
extensive environmental modeling. For
instance, the service ‘protection from
floods’ that can be supplied by coastal
mangroves requires analysis of the
flood risks with and without the
ecosystem. This can either be based on
comparison of the impacts of past
floods in areas with and without coastal
mangroves, or it can be based on
modeling of the chances of extreme,
high water levels, the topography of the
coastal zone, the location of population
centers, and the mitigating impact of
mangroves on floods.
Hence, a key step in environmental
economic assessment of ecosystem
services is the selection of the
appropriate indicators and
methodologies for the specification, in
bio-physical terms, of ecosystem
services. These indicators cover such
aspects as the flows of products
extracted from an ecosystem, the
impact of the system on biochemical
cycles, the impacts of regulation
services on the health of people, the
amount of people benefiting from the
service, etc. For this step, the
involvement of ecologists, hydrologists,
soil scientists, etc. can be crucial in the
assessment, in order to determine the
exact bio-physical specifications of the
ecosystem services concerned.
Purpose of the Tool
The Ecosystem Services Assessment
Tool will present the user appropriate
indicators for the quantification of
ecosystem services. These indicators
differ per ecosystem service, and several
sets of indicators will be presented to
the user. Furthermore, easily applicable
methods will be presented that will
allow the user to quantify the relevant
indicators.
How to use the Tool
This tool assists the user in quantifying
the selected services in biophysical
terms, a prerequisite for eventual
valuation of the service. The user can
use Table 6 for the selection of
indicators, whereas section 3.2 provides
more information on a number of
techniques that can be used to quantify
services.
Step 3.1 Selection of indicatorsfor ecosystem services
Before the services can be valued, they
have to be assessed in bio-physical
terms. For provisioning services, this
involves the quantification of the flows
of goods harvested in the ecosystem, in
a physical unit. For most regulation
services, quantification requires
21
Ecosystem Services Assessment
United Nations Development Programme – Global Environment Facility | Global Support Unit (GSU) : http://www.gsu.co.za/
TOOL KIT
Environmental Economics
3TOOL
Tool 3

spatially explicit analysis of the bio-
physical impact of the service on the
environment in or surrounding the
ecosystem. For example, valuation of
the hydrological service of a forest first
requires an assessment of the precise
impact of the forest on the water flow
downstream, including such aspects as
the reduction of peak flows, and the
increase in dry season water supply
(Bosch and Hewitt, 1982). The reduction
of peak flows and flood risks is only
relevant in a specific zone around the
river bed, which needs to be (spatially)
defined before the service can be
valued. An example of a regulation
service that does usually not require
spatially explicit assessment prior to
valuation is the carbon sequestration
service – the value of the carbon
storage does not depend upon where it
is sequestered. Cultural services depend
upon a human interpretation of the
ecosystem, or of specific characteristics
of the ecosystem. The benefits people
obtain from cultural services depend
upon experiences during actual visits to
the area, indirect experiences derived
from an ecosystem (e.g. through nature
movies), and more abstract cultural and
moral considerations (see e.g. Aldred,
1994). Assessment of cultural services
requires assessment of the numbers of
people benefiting from the service, and
the type of interaction they have with
the ecosystem involved.
22
United Nations Development Programme – Global Environment Facility | Global Support Unit (GSU) : http://www.gsu.co.za/
TOOL KIT
Environmental Economics
Tool 3
Category
Provisioning
services
Regulation
services
Key goods and services provided
l Food
l Fodder (including grass from
pastures)
l Fuel (including wood and dung)
l Timber, fibers and other raw
materials
l Biochemical and medicinal
resources
l Genetic resources
l Ornamentals
l Carbon sequestration
l Climate regulation through control
of albedo, temperature and rainfall
patterns
Potential indicators
l For all provisioning services: amount of product harvested per year; Inputs
required for harvesting (time, equipment, etc.); Total inputs and outputs in case
the good is used as input in a production process
l Carbon contents of the above and below ground biomass, and in terms of soil
organic matter; exchange of carbon between these three compartments and the
atmosphere
l Appropriate indicator for vegetation cover, e.g. Leaf Area Index or total crown
cover; role of vegetation in determining moisture fluxes and temperature,
resulting impacts on local and regional circulation and moisture conditions, etc.
Table 6. Indicators for the biophysical assessment of ecosystem services

23
United Nations Development Programme – Global Environment Facility | Global Support Unit (GSU) : http://www.gsu.co.za/
TOOL KIT
Environmental Economics
Tool 3
l Impact of vegetation on water flow, as a function of the topography, peak flows,
vegetation cover, absorbing capacity of the soil, infiltration rates, etc. (see e.g.
Bosch and Hewitt, 1982; and the case study below).
l Storm protective capacity depends on vegetation structure, topography, and
length and width of the vegetation belt.
l Control of erosion and sedimentation depends on the ground cover of the
vegetation, and is further a function of rainfall erosivity and soil erodibility
(slope characteristics, texture, organic matter contents, etc.)
l Nursery function depends on habitat characteristics (vegetation structure,
topography) in relation to the reproduction requirements of the species
involved. It can be measured in terms of numbers of juveniles produced per
area unit.
l In particular wetland ecosystems have the capacity to filter water and recycle
plant nutrients and, to some extent, absorb inorganic pollutants. The function
depends on the retention time of water in the ecosystem, the temperatures
affecting plant growth rates, vegetation structure, etc. It can be measured in
terms of the difference in pollutant concentrations between water flowing in,
and water flowing out of the system
l Natural vegetation may support pollination of external agricultural fields by
providing a habitat for pollinators, especially bees but also other insects, bats,
etc. The impact may be measured by comparing crop yields in areas with
adequate pollination with crop yields in areas without adequate pollination (see
e.g. the Case study below).
l Ecosystems may contribute to the control of certain pests and pathogens by
harboring populations of species that control such pests. The impact may be
measured by comparing crop yields in areas with and without such control, or
health impacts in areas with an without such control.
l Ecosystems, or rows of trees, may act as windbreaks preventing wind erosion
and limiting losses of crops and infrastructure from storms. This may be
measured by analyzing impacts of past storms, or by modeling of erosion
processes.
l Hydrological service: regulation of
the timing and volume of river flows
l Protection against floods by coastal
or riparian systems
l Control of erosion and
sedimentation
l Nursery service: regulation of
species reproduction
l Breakdown of excess nutrients and
pollution
l Pollination
l Regulation of pests and pathogens
l Protection against storms

24
United Nations Development Programme – Global Environment Facility | Global Support Unit (GSU) : http://www.gsu.co.za/
TOOL KIT
Environmental Economics
Tool 3
Cultural services
l Protection against noise and dust
l Biological nitrogen fixation (BNF)
l Provision of cultural, historical and
religious heritage (e.g. a historical
landscape or a sacred forests)
l Scientific and educational
information
l Opportunities for recreation and
tourism
l Amenity service: provision of attractive
housing and living conditions
l Habitat service: provision of a habitat
for wild plant and animal species
l Vegetation belts along highways or around industrial zones can filter air and
improve air quality with regards to dust and noise. The biophysical impacts
can be assessed by comparing noise levels, particulate matter levels, and
concentrations of specific pollutants (e.g. NOx, S) on either side of the
vegetation belt.
l Through fixation of atmospheric nitrogen, leguminous plants can enhance
soil fertility. Their impact can be measured in terms of soil organic matter
contents.
l For all services: amount of people benefiting from the service; type of
benefits people obtain.
l For the habitat service: number of species; number of red list species;
hectares of ecosystem, ecosystem quality versus ecosystem in natural
state, biodiversity indices.

Step 3.2 Quantitative analysisof ecosystem services
The techniques required to analyze
services in biophysical terms depend
entirely on the services that have been
selected for the assessment. It should
be noted that, in particular for
regulation services, the quantification
of the service is often at least as time
and data consuming as the subsequent
economic analysis. In addition, every
service, in every economic,
environmental and social context will
require a specific approach with respect
to the data and required approach for
analysis. In the sections below, guidance
is provided on approaches that can be
taken for each service category.
Provisioning services. For
provisioning services, surveys can reveal
the flows of products harvested from
the ecosystem, for instance expressed
as kilograms of fruits or tons of timber
harvested per time unit. It should also
be examined if this flow can be
extracted every year, of if this is a one
time harvest in order to establish the
future supply of ecosystem services. In
addition, it is required to consider if the
use of one service may impair the use
of other ecosystem services in the
future, as in the case of clearfelling of a
forest.
The survey also needs to cover the
efforts required to extract the products
from the ecosystem. In the case of
harvesting in natural forests, this relates
to labor and possibly tools or
equipment required for harvesting. In
case the products are obtained from
cultivated agricultural land, valuation
should consider the inputs in the
production process required to obtain
the produce (as elaborated in tool 4
Valuation). This includes not only labor
and equipment, but also land, fertilizers,
pesticides, seeds, etc.
Regulation services. In the case of
regulation services, it is important to
consider the precise nature of the
service supplied as well as its spatial
and temporal dimensions. Table 7
provides a list of potential indicators
that can be used to measure the
service. The precise indicators will
depend on the objective and scale of
the assessment as well as the
availability of data. Spatial and temporal
dimensions also need to be considered.
For instance, the hydrological service
can be expressed as both a reduction in
peak flows, and a increase in low season
flow depending on the area under
consideration (flood risk versus risks of
seasonal water shortages). In particular
the flood risk has a distinct spatial
component, the flood risk will decrease
with increasing distances from the
water bed, depending on the
topography of the valley.
Spatially explicit analysis normally
requires GIS (see for examples
Geoghegan et al., 1997 and Voinov et
al., 1999). The spatial variation of
ecological services has been elaborately
studied, for instance in the fields of eco-
hydrological models (e.g. Pieterse et al.,
2002), and erosion and soil transport
models (e.g. Schoorl et al., 2002). In
general, data requirements are high for
a spatially explicit approach. Initial
conditions, processes, and implications
of decision variables need to specified
for each distinguished spatial unit. This
means that assessment of spatially
heterogeneous services will normally
require GIS analysis, with corresponding
time and budget implications.
In addition, temporal dynamics may
need to be considered. For instance, the
service carbon sequestration depends
on the building up of carbon in either
above ground biomass or as soil
organic matter. Uptake depends on the
growth of the vegetation, and tends to
25
United Nations Development Programme – Global Environment Facility | Global Support Unit (GSU) : http://www.gsu.co.za/
TOOL KIT
Environmental Economics
Tool 3

26
United Nations Development Programme – Global Environment Facility | Global Support Unit (GSU) : http://www.gsu.co.za/
TOOL KIT
Environmental Economics
Tool 3
Table 7.
Regulation services
Carbon sequestration
Climate regulation through regulation of
albedo, temperature and rainfall patterns
Regulation of the timing and volume
of river and ground water flows
Protection against floods by coastal
or riparian ecosystems
Regulation of erosion and sedimentation
Regulation of species reproduction
(nursery service)
Breakdown of excess nutrients and
pollution
Pollination (for most plants)
Regulation of pests and pathogens
Protection against storms
Protection against noise and dust
Control of run-off
Assessment method
Modeling of carbon flows in the ecosystem
Regional climate models
GIS models including run off and river flow as a function of, among others, plant cover and
land management
Modeling of flood risks with different vegetation cover; alternatively comparison of impacts of
past floods in protected and non-protected areas.
Erosion model following USLE or other models to determine erosion rates. Analysis of
sedimentation rates requires catchment models of run-off and erosion, transport and
deposition of sediment particles.
Model of species reproduction, based on juveniles per successful breeding or spawning effort
and the factors determining the success of reproduction (e.g. water quality, vegetation cover,
etc.)
Denitrification rates and phosphate absorbtion rates based on literature (these rates vary as
a function of retention time, oxygen, iron concentrations, temperature, etc.)
Pollination rates for agricultural crops can be found in literature, for non-cultivated species
data is much scarcer.
Information availability strongly dependent on the pests or pathogen involved, for some pests
literature is available indicating the factors determining the chance of, and severity of
outbreaks.
Simple models can be used to calculate the reduction in wind speed as a function of e.g. tree
cover and surface roughness. These can be translated into the wind’s capacity to detach and
transport particles.
Literature is available in order to make rough estimates of the impacts of vegetation belts on
dust and air quality.
USLE and other models provide indications of infiltration rates under different types of plant
cover and land management (see also Bosch and Hewitt, 1982).
Bio-physical assessment methods for regulation services

decrease as newly planted forests or
plantations develop into mature forest
stands, where there is high recycling of
CO2 but much more limited net
sequestration, depending on the type
of forest and climatic conditions
involved.
Cultural services. Cultural services
are strongly dependent on the cultural
backgrounds of the people that receive
the service. This cultural background
involves religious, moral, ethical and
aesthetical motives, and they vary
substantially between different
societies. Ranging from indigenous to
industrial societies, there are striking
differences in the way cultural and
amenity services are perceived,
experienced, and valued by different
cultures. In order to quantify the
service, it is both the type of interaction
and the numbers of people involved
that are relevant indicators. The type of
interaction ranges from frequent or
occasional visits to more passive types
of benefiting from the presence of a
certain ecosystem, e.g. from simply
knowing that the ecosystem is
maintained and preserved. Prior to
valuation of the service, both the type
of interactions and the amount of
people involved need to be analyzed.
Habitat service. In the last decades,
a large number of ecological methods
to quantify biodiversity and other
ecological values have been developed.
Wathern et al. (1986) mention that over
100 of these techniques have been
described in literature. The most widely
used criteria for ecological value relate
to the species richness of the
ecosystem, and the rarity of the species
it contains, see Table 8.
27
United Nations Development Programme – Global Environment Facility | Global Support Unit (GSU) : http://www.gsu.co.za/
TOOL KIT
Environmental Economics
Tool 3
Number of studies
8
7
7
6
6
4
2
2
Table 8. Criteria used to measure the habitat service in 10 Ecological assessments.
Indicator
Diversity (including species and habitat diversity)
Rarity
Naturalness
Area
Threat of human interference
Representativeness
Uniqueness
Substitutability
Source: Margules and Usher, 1981.

The Alternatives to Slash and Burn consortium developed a framework for comparing the impacts of different types oftropical land use on the supply of a range of ecosystems (Tomich et al., 1998). Table 9 presents the services suppliedby different types of land use in tropical forest margins in the lowlands of Sumatra, Indonesia. Whereas the table doesnot express all services in a monetary unit, quantitative assessment of key indicators allows for comparison of thebenefits supplied by different land use types. In addition, it is helpful to understand the interests of specificstakeholders. Whereas carbon storage and biodiversity are key services at the global scale, national policy makers mayalso be interested in the sustainability of the agricultural production capacity of the area and the returns to land,whereas local smallholder farmers will be specifically interested in the returns to labor and the household food securitygenerated by each system. Unfortunately, the study did not consider the employment generated by each system, whichwill be a major indicator at both the national and local scale.
28
United Nations Development Programme – Global Environment Facility | Global Support Unit (GSU) : http://www.gsu.co.za/
TOOL KIT
Environmental Economics
Tool 3
Table 9. Comparison of services from different land use types in Sumatra, Indonesia.
Carbon storage
(aboveground
tC/ha)
306
120
94
79
66
62
37
2
Nutrient export
(qualitative
scale)/1
0
0
0
0
-0.5
-0.5
-0.5
-1.0
Returns to labor
($/person-day)
4.77
0.78
1.67
2.25
4.74
1.47
1.78
Case study 2. Assessing the services supplied by forest margins
Key: /1: 0 indicates no difficulties, -0.5 minor difficulties and -1 indicates major difficulties./2 $ indicates that food has to be purchased on local markets and S indicates that food is supplied by the system. Note that it isnot guaranteed that the cash generating systems lead to income generation for local communities, in particular in the case theforest is logged by international companies.Source: MEA (2006)
Land use system
Forest
Community based forest
management
Selective logging
Extensive Rubber
agroforest
Industrial rubber forest
Oil palm
Upland rice / bush fallow
Cassava /
imperata
Aboveground
plant species
(# per standard
plot)
120
100
90
90
60
25
45
15
Returns from
crop yields
($/ha/year)
0
5
1080
1
878
114
62
60
Household food
security (means
of access)/2
$ + S
$
$
$
$
S
$ + S

29
United Nations Development Programme – Global Environment Facility | Global Support Unit (GSU) : http://www.gsu.co.za/
TOOL KIT
Environmental Economics
Tool 3
Hayashi et al. (2004) studied the impact of forest cover on sediment loads in the Jialingjiang River catchment (160,000square kilometers), a tributary of the Yangtze River. They used a spatially explicit run-off and erosion model which wasvalidated on the basis of observed daily flow rates and sediment loads of 1987. With the model, the effect of convertingfarmland to forest in steep slopes was examined with respect to the amount of sediment load produced in the catchment(Figure 4). Afforestation in areas in four grade classes were considered: >25%, >20%, >15%, and >10%. Farmlands witha slope value greater than 25%, 20%, 15%, and 10% cover 0.6%, 1.5%, 3.2%, and 6.3% of the Jialingjiang catchment,respectively. The assessment showed that the volume of sediment erosion decreased with afforestation, particularly forthe scenarios where more area was afforested, showing afforestation to be effective for the protection of sedimentproduction. The simulated annual total sediment loads from the whole catchment decreased up to 22% in the scenariowith largest afforestation (all slopes exceeding 10%). Interestingly, the impact of afforestation in steep slopes is notmuch different than that of afforestation in gentler slopes. This suggests that these areas produce comparable amountsof sediment. This may be explained by the catena of the landscape. Whereas the steepest slope produce more sediment,less of the sediment ends up in the river because part of it is deposited in gentler slopes downhill. Hence, afforestationof steep slopes further away from the river, and of less steep slopes close to the river may be equally effective, and arun-off model is required to determine the precise impacts of forest cover on sediment load in different zones of thecatchment.
Figure 4. Impact of afforestation on different slopes on sediment loading of the Jialingjiang River (Hayashi et al., 2004).
Case study 3. Erosion control by forest systems in Western China

Introduction
Following welfare economics, the
economic value of a resource can be
determined via individual preferences
as expressed by willingness to pay
(WTP) or willingness to accept (WTA)
for a change in the supply of that
resource 1 . Aggregation of individual
welfare impacts is required to obtain
the welfare impact on society. Where
relevant, this aggregation needs to
consider equity issues, for instance
where the interests of one stakeholder
group (e.g. traditional ecosystem users),
are considered to be more important
than those of other stakeholder groups.
The appropriate measure of economic
value is determined by the specific
context of the resources being
managed. Care needs to be taken that
the valuation method gives a proper
indication of the value of the service
involved, reflecting a true WTP or WTA,
and avoiding the double counting of
services or values. It is also important
that the user is aware of the concepts
of marginal and total value, where
marginal value reflects the value of an
incremental change in the supply of a
resource, and total value the overall
value of a resource.
There are several types of economic
value, and different authors have
provided different classifications for
these value types. Following the
Millennium Ecosystem Assessment
(2003) 2 , this Toolkit distinguishes the
following four types: (i) direct use value;
(ii) indirect use value; (iii) option value;
and (iv) non-use value. They are
elaborated in Table 10. The aggregated
economic value of an area, combining
these four value types, is often referred
30
Economic Valuation
United Nations Development Programme – Global Environment Facility | Global Support Unit (GSU) : http://www.gsu.co.za/
TOOL KIT
Environmental Economics
4TOOL
Tool 4
Value Type
Direct use value
Indirect use value
Option value
None-use value
Description
This value arises from the direct utilization of ecosystems, for example through the sale or consumption of a piece of
fruit. All provisioning servicess, and some cultural services (such as recreation) have direct use value.
This value stems from the indirect contribution of ecosystems to human welfare. Indirect use value reflects, in
particular, the type of benefits that regulation services provide to society.
Because people are unsure about their future demand for a service, they are normally willing to pay to keep the
option of using a resource in the future – insofar as they are, to some extent, risk averse. Option values may be
attributed to all services supplied by an ecosystem.
Non-use value is derived from knowing that an ecosystem or species is preserved without having the intention of
using it in any way. Kolstad (2000) distinguishes three types of non-use value: existence value (based on utility
derived from knowing that something exists), altruistic value (based on utility derived from knowing that somebody
else benefits) and bequest value (based on utility gained from future improvements in the well-being of one’s
descendants).1 For details on the concept of WTP and WTBC, and when they converge to the same value, the reader is referred to basic
environmental economics textbooks such Freeman (1993) or Perman et al. (1999).2 For different classifications of economic value types, the reader is referred to, for example, Hanley and Spash (1993) and
Kolstad (2000)
Table 10. Types of economic value.

to as Total Economic Value (TEV). Table
11 indicates the value type most
commonly associated with specific
ecosystem services.
Note that these different values may or
may not be reflected in a market value.
In most cases, a significant part of the
Direct Use Value will be reflected in
market transactions, but most of the
other value types will not. They may not
be reflected in market transactions
because, for instance, they have a public
goods character, or because a market
has not (yet) been established for the
service. Because of the economic
benefits they provide, the non-market
economic values also need to be
included in economic Cost-benefit
assessment. Furthermore, several
authors have discussed or analyzed the
non-economic value of ecosystems.
These non-economic values are
independent of any human use or
interaction with an ecosystem (“what is
the value of a tropical forest if there
were no people on the planet ?”). This is
expressed in figure 5. Although such
ecocentric values may exist, this Toolkit
includes only anthropocentric
economic values, including both market
and non-market values.
In case future and present benefits
have to be compared, discounting is
required. In some cases, in particular
31
United Nations Development Programme – Global Environment Facility | Global Support Unit (GSU) : http://www.gsu.co.za/
TOOL KIT
Environmental Economics
Tool 4
Table 11. Value types in relation to ecosystem services.Direct use valueFood
Fodder and grass from pastures
Fuel and other energy
Timber, fibers and raw materials
Biochemical and medicinal resources
Genetic resources
Ornamentals
Recreation
Scientific & education information
Indirect use valueClimate regulation and carbon
sequestration
Hydrological service
Protection against floods
Control of erosion and sedimentation
Nursery service
Breakdown of excess nutrients and
pollution
Pollination
Regulation of pests and pathogens
Protection against storms
Protection from noise & dust
Biological nitrogen fixation
Option valuePotential future uses
Future value of information
Non-use valuesHabitat service and
biodiversity
Cultural heritage
Source: adapted from Pearce and Turner (1990) and Barbier et al. (1997)

where a long time horizon is selected
for the assessment, the discount rate
can have a major impact on the
economic cost benefit analysis of land
management options. This is
particularly relevant where sustainable
approaches are promoted which may
lead to a higher supply of ecosystem
services in the future compared to
currently used land management
practices. In these cases, the selection of
the discount rate is a crucial factor in
the analysis, as discussed in Section 4.3
Purpose of the Tool
The purpose of this tool is to guide the
user in analyzing the total economic
value of the services supplied by an
ecosystem. The Tool presents the
different valuation techniques, and for
which services, and in which contexts,
the valuation techniques are
appropriate. The Tool also informs the
user of the various limitations of
economic valuation approach, and
provides guidance on the
interpretation of the outcomes of
valuation studies.
Contents of the Tool
The Tool contains three steps, dealing
with: (i) selection of the value indicator;
(ii) the selection of the actual economic
valuation technique; and (iii) choosing
the discount rate. In the second Step
(4.2), a description of the most
important economic valuation
methods is provided, and references are
provided where the user can find more
detailed information on each of the
valuation methods. Note that Appendix
2 provides an overview of useful
internet addresses, many of which also
provide information on economic
valuation techniques.
Step 4.1 Selection of valueindicators
According to welfare economics, the
welfare generated by an ecosystem
service, or the economic value of this
service, is the (weighted) sum of the
utility gained by all individuals as a
result of the provision of the ecosystem
service. Utility is gained by the person
consuming the ecosystem service (e.g.
by eating a piece of fruit or walking in a
national park). However, utility cannot
be measured directly. In order to
provide a common metric in which to
express the benefits of the widely
diverse variety of services provided by
ecosystems, the utilitarian approach
usually attempts to measure all services
in monetary terms (MEA, 2003).
Changes in welfare are reflected in
people’s willingness to pay (WTP) or
willingness to accept (WTA)
compensation for changes in their level
of use of a particular good or bundle of
goods (Hanemann 1991). Although
WTP and WTA are often treated as
interchangeable 3 , there are important
conceptual and empirical differences
between them. In general, WTP is
appropriate when beneficiaries do not
own the resource providing the service
or when service levels are being
32
United Nations Development Programme – Global Environment Facility | Global Support Unit (GSU) : http://www.gsu.co.za/
TOOL KIT
Environmental Economics
Tool 4
Ecocentric value (?)
Non-market economic value
Market value
Figure 5. Market versus non-marketvalues. This Toolkit focuses on marketand non-market economic values only.

increased, while WTA is appropriate
when beneficiaries own the resource
providing the service or when service
levels are being reduced. In practice,
WTA estimates tend to be higher than
WTP. In the case of private goods traded
in perfectly functioning markets, the
willingness-to-pay for a good is
reflected in the price paid for that good
on the market. However, clearly, most
ecosystem services are not traded in a
market, and other ways need to be
sought in order to reveal people’s
willingness-to-pay for the service (as
elaborated in Step 4.2).
In order to determine the societal value
of the service, it is required to analyze
the economic surplus generated by the
service. Whereas WTP for an increase in
ecosystem service supply may be low at
current supply levels, this WTP may
strongly increase in case of a shortage
of the service (compare the price of
water during a period with ample
supply with it’s price during a drought).
Two central concepts here are the
consumer and the producer surplus, as
described below.
(i) The consumer surplus. The
concept of consumer surplus was first
described by Dupuit and introduced to
the English speaking world by Marshall
(in 1920): ‘The excess of price which a
consumer would be willing to pay
rather than go without the thing, over
that what he actually pays is the
economic measure of this surplus of
satisfaction’ (Johansson, 1999). Hence,
the market price plus the consumer
surplus equals the utility of a specific
good for a certain consumer. Note that
the utility gained by the consumer from
an actual transaction also depends
upon a number of other factors, such as
transaction costs. Estimation of the
consumer surplus generally requires
the construction of a demand curve. For
more details, for instance on sources of
inconsistency in ordinary demand
curves and solutions for these
inconsistencies, see e.g. Willig (1976),
Freeman (1993) or Perman et al. (1999).
(ii) The producer surplus.The
producer surplus indicates the amount
of welfare a producer gains at a certain
production level and at certain price.
The estimation of the producer surplus
generally requires the construction of a
supply curve (see e.g. Perman et al.,
1999). In the short term, a producer’s
fixed costs can be considered foregone.
Hence, in micro-economics, the
individual producer surplus is defined
as total revenues minus variable costs
(Varian, 1993). In the valuation of
ecosystem services, the producer’s
surplus needs to be considered if there
are costs related to “producing” the
ecosystem good or service (Freeman,
1993; Hueting et al., 1998). In general, in
the case of private ecosystem good or
services, these costs relate to the costs
of harvesting or producing the
ecosystem good or service. The supply
curve will in many cases show a
relatively steep increase at higher
quantities of ecosystem service
supplied – e.g. the costs of providing
marginal cleaner water increase as
purity becomes higher (Hueting, 1980).
Whereas the WTP reflects the marginal
value of an ecosystem service,
consumer and producer surpluses
represent the total societal benefits
generated by an ecosystem service.
However, as data is not always available
to calculate these surpluses, other
33
United Nations Development Programme – Global Environment Facility | Global Support Unit (GSU) : http://www.gsu.co.za/
TOOL KIT
Environmental Economics
Tool 4
3 For details on the concept of WTP and WTBC, and when they converge to the same value, the reader is referred to basicenvironmental economics textbooks such Freeman (1993) or Perman et al. (1999).

indicators of economic value have also
been used in valuation studies.
Some studies have also suggested that
market value (price times quantity) of
certain products provide an indication
of the value. However, this approach is
not recommendable, as it does not
account for the investments that need
to be made in order to obtain the
produce involve (e.g. the costs of boats,
nets and labor of the fishermen).
For those services that can be
translated into a monetary value, a
choice needs to be made if the values
are expressed as benefits per year
(recommendable in case few changes
in services supply, and only limited
price increases or decreases can be
expected), or if the streams of benefits
are expressed as a Net Present Value,
which indicates the current present
value of the net present and discounted
future flows of services (see Box 2). In
the last case, the user has to select a
discount rate, as specified in Step 4.3
(‘Selection of the Discount rate’).
Step 4.2 Valuation
Following neo-classical welfare
economics, valuation requires analysis
and aggregation of the consumer and
producer surpluses (Freeman, 1993). In
the last 3 decades, a range of economic
valuation methods for ecosystem
services has been developed. They
differ for private and public goods.
(i) Valuation of private goods.
In the case of private goods or services
traded in the market, price is the
measure of marginal willingness to pay
and it can be used to derive an
estimate of the economic value of an
ecosystem service (Hufschmidt et al.,
1983; Freeman, 1993). The appropriate
demand and supply curves for the
service can - in principle - always be
constructed. However, in practice this is
often difficult, as (i) it is not always
known how people will respond to
large increases or decreases in the price
of the good, and (ii) it may be difficult
to assess when consumers will start
looking for substitute goods or services.
In case of substantial price distortions,
for example because of subsidies, taxes,
etc., an economic (shadow) price of the
good or service in question needs to be
constructed. In some cases, this can be
done on the basis of the world market
prices (Little and Mirrlees, 1974; Little
and Scott, 1976). In case the private
good is not traded in the market,
because it is bartered or used for auto-
consumption, shadow prices need to be
constructed on the basis of: (i) the costs
34
United Nations Development Programme – Global Environment Facility | Global Support Unit (GSU) : http://www.gsu.co.za/
TOOL KIT
Environmental Economics
Tool 4
The Net Present Value (NPV) depends on the flows of net benefits in year t, now and in the future (Ct), the discount periodconsidered (T) and the discount rate (r) according to the formula below. Note that discounting leads to a rapid decline in theimportance of future benefits, e.g. a dollar obtained 100 year from now is, at a 2% discount rate, worth only 0.14 centsnow. This means that discounting is not easily compatible with the notion of sustainable management, where the interestsof future generation are believed to be on par with our current interests. Therefore, in particular for longer term issues suchas climate change, simple discounting procedures are no longer favoured, and the use of zero discount rates, or discountrates that decrease over time towards zero, have been proposed (see e.g. Pearce et al., 1990 for more information).
BOX 2. Calculating the Net Present Value

of substitutes; or (ii) the derived benefit
of the good (Munasinghe and Schwab,
1993).
(ii) Valuation of public goods.
Two types of approaches have been
developed to obtain information about
the value of public ecosystem services:
the expressed and revealed preference
methods (Pearce and Howarth, 2000).
These methods have also been called
direct and indirect valuation methods,
respectively.
With expressed valuation methods,
either market prices or various types of
questionnaires are used to reveal the
willingness-to-pay of consumers for a
certain ecosystem service. The most
important direct approaches are the
Contingent Valuation Method (CVM)
and related methods. In the last
decades, CVM studies have been widely
applied (see e.g. Nunes and van den
Bergh, 2001 for an overview). It is the
only valuation method that can be used
to quantify the non-use values of an
ecosystem in monetary terms.
Information collected with well-
designed CVMs has been found
suitable for use in legal cases in the U.S.
- as in the case of the determination of
the amount of compensation to be
paid after the Exxon Valdez oil spills
(Arrow et al., 1993).
The revealed preference methods use a
link with a marketed good or service to
indicate the willingness-to-pay for the
service. There are two main types of
revealed preference methods:
mmPhysical linkages. Estimates of the
values of ecosystem services are
obtained by determining a physical
relationship between the service and
something that can be measured in
the market place. For instance, with
the damage-function (or dose-
response) approach, the damages
resulting from the reduced
availability of an ecosystem service
are used as an indication of the value
of the service (Johanson, 1999). This
method can be applied to value, for
instance, the hydrological service of
an ecosystem.
mmBehavioral linkages. In this case, the
value of an ecosystem service is
derived from linking the service to
human behavior – in particular the
making of expenditures to offset the
lack of a service, or to obtain a
service. An example of a behavioral
method is the Averting Behavior
Method (ABM). There are various
kinds of averting behavior: (i)
defensive expenditure (a water filter);
(ii) the purchase of environmental
surrogates (bottled water); and (iii)
relocation (OECD, 1995; Pearce and
Howarth, 2000). The travel cost
method and the hedonic pricing
method are other revealed
preference approaches using
behavioral linkages.
An overview of the main valuation
methods, and the value types they can
be used for, is presented in Table 12. The
remainder of this section provides a
detailed description of six main
ecosystem valuation techniques: (i)
replacement cost method; (ii) averting
behavior method; (iii) travel cost
method; (iv) production factor
approach; (v) hedonic pricing; and (vi)
contingent valuation (CVM). The first
five methods are revealed preference
valuation methods, the last (CVM) is a
stated preference valuation method.
In case there are no resources or data to
allow for an actual valuation of the
ecosystem services supplied by an area,
it is possible to use a so-called benefit
transfer approach, i.e. using value
indications from other areas as
35
United Nations Development Programme – Global Environment Facility | Global Support Unit (GSU) : http://www.gsu.co.za/
TOOL KIT
Environmental Economics
Tool 4

described in literature and transfer
these to the ecosystem under
consideration. Whereas this method is
is a fast method of obtaining economic
information on ecosystem services, it
has a number of important drawbacks,
in particular its high degree of
uncertainty. Box 3 provides further
information on the application of
benefit transfer techniques.
4.2.1 The Averting BehaviorMethods
The Averting Behavior Methods (ABM)
consider expenditures made to avert or
mitigate negative effects from
environmental degradation. ABM relies
on the assumption that people
perceive the negative effects of
environmental deterioration on their
welfare and that they are able to adapt
their behavior to avert or reduce these
effects. This means, for instance, that
36
United Nations Development Programme – Global Environment Facility | Global Support Unit (GSU) : http://www.gsu.co.za/
TOOL KIT
Environmental Economics
Tool 4
Table 12. Valuation methods and their applicability to different value types (Based upon Pearce and Turner, 1990; Hanley and Spash,1993; Munasinghe, 1993; Cummings and Harrison, 1995).
Applicable to services that relate to the
purification services of some ecosystems.
Can be used to value the recreation service.
Applicable where ecosystem services are an
input into a production process
Applicable where environmental amenities are
reflected in the prices of specific goods, in
particular property.
The use of CVM is limited to goods and
services that are easily to comprehend for
respondents – excluding most regulation
services
Ecosystem goods and services traded on the
market
direct use value
x
x
x
x
x
x
option value
x
x
x
indirect use value
x
x
x
x
non-use value
x
Value categoryValuation
method
Indirect methods:
1) averting
behavior
method
2) travel cost
method
3) production
factor
approach
4) hedonic
pricing
Direct methods:
5) CVM
6) market
valuation
Suitable for

people understand the negative effects
of ozone depletion and that they will
buy products such as hats and
suncream to prevent damage to their
health. The willingness to pay for a
clean environment is calculated on the
basis of people’s purchases of products
and services to avert the negative
effects of pollution.
The Averting Behavior Methods
comprises three different sets of
methods: (i) damage costs avoided; (ii)
preventive expenditure; and (iii)
replacement costs methods. For
example, people can respond to a
reduction in tap water quality by (i)
become sick and incur health costs; (ii)
installing a water filter at home; or (iii)
buy bottled water. Where the damage
costs or the preventive or replacement
expenditures are reflected in market
transactions, this method provides an
indirect way of analyzing
environmental benefits including the
supply of ecosystem services. Market
data can often relatively easily be
collected, and in this case data on
averting behavior of affected
stakeholders can and used to obtain
an estimate of the value of the service.
ABM is a cost-based method, using the
costs of purchased items to value
environmental qualities. However, the
social preferences for a healthy
environment may be much greater
than the expenditures on these
products and, since the market prices of
products are used to value the
environment, this method does not
capture the consumers’ surplus. Instead,
it is assumed that the costs of avoiding
damages or replacing natural assets or
their services provide useful estimates
of the value of these assets or services.
This is based on the assumption that, if
people incur costs to avoid damages
caused by lost ecosystem services, or to
replace the services of ecosystems, then
those services must be worth at least
what people paid to replace them. This
assumption may or may not be true.
However, in some cases it may be
reasonable to make such assumptions,
and measures of damage cost avoided
or replacement cost are generally much
easier to estimate than people’s
willingness to pay for certain ecosystem
services. In general, the methods are
most appropriately applied in cases
where damage avoidance or
replacement expenditures have actually
been, or will actually be, made.
Potential caveats
ABM presupposes that people are fully
aware of the potential impacts of
changes in environmental quality, and
that they have the option of
responding to this by their individual
behavior or through individual
decisions to purchase preventive
measures. However, often not all people
affected will fully inform themselves on
the potential impacts of a reduced
supply of ecosystem services or
environmental quality. Furthermore,
people may not react to small changes
in environmental quality, but respond
only when certain thresholds have
been passed.
Further reading
Pearce and Turner (1990) and Freeman
(1993) describe the theoretical aspects
of the ABM. Champ and Brown (2003)
provide an overview of applications,
and Young (2005) describes a number
of applications of ABM to value water
resources.
4.2.2 Travel Cost Method
The travel cost method is used to
estimate the economic use value of the
37
United Nations Development Programme – Global Environment Facility | Global Support Unit (GSU) : http://www.gsu.co.za/
TOOL KIT
Environmental Economics
Tool 4

recreation service of ecosystems. The
basic premise of the travel cost method
is that the time and travel cost
expenses that people incur to visit a
site is an indicator for the willingness to
pay of people to visit the site. The
method can be used to estimate the
economic benefits or costs resulting
from: (i) changes in access costs for a
recreational site ; (ii) elimination of an
existing recreational site; (iii) changes in
environmental quality at a recreational
site; or (iv) addition of a new
recreational site. There are two basic
approaches in applying the TCM. The
first is the simple zonal travel cost
approach, the second the individual
travel cost approach which uses a more
detailed survey of visitors.
Application of the Zonal Travel
Cost Approach.The zonal travel cost
method is the simplest and least
expensive approach. It is used to
estimate a value for recreational
services of the site as a whole. The
zonal travel cost method is applied by
collecting information on the number
of visits to the site from different
distances. In order to determine the
willingness to pay of visitors, distance
circles are drawn around the site. The
TCM assumes that people in all circles
have homogeneous preferences. This
information is used to construct the
demand function for the site, and
estimate the consumer surplus, or the
economic benefits, for the recreational
services of the site. The method consists
of 7 basic steps, see Table 13.
38
United Nations Development Programme – Global Environment Facility | Global Support Unit (GSU) : http://www.gsu.co.za/
TOOL KIT
Environmental Economics
Tool 4
Table 13. The zonal TCMStep Analysis1 Define a set of zones surrounding the site. These may be defined by concentric circles around the site, or by geographic divisions
such as metropolitan areas or counties surrounding the site at different distances.
2 Collect information on the number of visitors from each zone, and the number of visits made in the last year.
3 Calculate the visitation rates per 1000 population in each zone. This is simply the total visits per year from the zone, divided by the
zone’s population in thousands.
4 Calculate the average round-trip travel distance and travel time to the site for each zone. Assume that people in Zone 0 have zero
travel distance and time. Each other zone will have an increasing travel time and distance. Next, using average cost per kilometer
and per hour of travel time, calculate the average travel cost per trip per zone.
5 Estimate, using regression analysis, the equation that relates visits per capita to travel costs. From this, the researcher can esti-
mate the demand function for the average visitor.
6 Construct the demand function for visits to the site, using the results of the regression analysis. The first point on the demand
curve is the total visitors to the site at current access costs (assuming there is no entry fee for the site). The other points are found
by estimating the number of visitors with different hypothetical entrance fees (assuming that an entrance fee is viewed in the same
way as travel costs).
7 Estimate the total economic benefit of the site to visitors by calculating the consumer surplus, or the area under the demand curve.

Application of the Individual
Travel Cost Approach.The
individual travel cost approach is similar
to the zonal approach, but uses survey
data from individual visitors in the
statistical analysis, rather than data
from each zone. This method requires
more data collection and a slightly
more complicated analysis, but will give
more precise results because it allows
to correct for heterogeneity among
visitors within the distance circles.
Survey questions can include: (i)
location of the visitor’s home – how far
they traveled to the site; (ii) how many
times they visited the site in the past
year or season; (iii) the length of the
trip; (iv) the amount of time spent at
the site; (v) travel expenses; (vi) the
person’s income or other information
on the value of their time; (vii) other
socioeconomic characteristics of the
visitor; (viii) other locations visited
during the same trip, and amount of
time spent at each; (ix) other reasons for
the trip (is the only purpose of the trip
to visit the site, or are there additional
purposes)
Using the survey data, the researcher
can proceed in a similar way to the
zonal model, by estimating, using
regression analysis, the relationship
between number of visits and travel
costs and other relevant variables.
However, this time, the researcher uses
individual data rather than data for
each zone to estimate the demand
function. The regression equation yields
the demand function for the “average”
visitor to the site, and the area below
this demand curve gives the average
consumer surplus. This is multiplied by
the total relevant population (the
population in the region where visitors
come from) to estimate the total
consumer surplus for the site.
Potential caveats in application
of the TCM
The main advantage of the TCM is that
it provides a theoretically correct
approach to value recreational services
accruing to visitors of a site. Some
caveats are that it is sometimes difficult
to correct for multiple purpose travels,
when not all travel costs are made to
visit the site under consideration. In
addition, visitors to a park may stay in a
nearby holiday house, whereas part of
the reason for going to the holiday
house is the presence of the park. There
may also be a skewed distribution in
the demand function where parks in
developing countries attract both
national and international visitors (in
this case it is recommendable to
construct two different demand
functions).
Further reading
For more information on the theory of
the TCM, the reader is referred to, for
instance, Hanley and Spash (1993),
Haab and McConnell (2000) and Mäler
and Vincent (2005). Aylward and
Lindberg (1999) provide an application
of the TCM in Costa Rica to calculate the
price sensitiveness of visits to national
parks in the country. Seenprachawong
(2003) compares application of TCM
and Contingent Valuation to value coral
reefs in Thailand. In addition, the
website www.ecosystemvaluation.org
provides a detailed description plus a
case study of application of the TCM.
4.2.3 Production factormethods
Production factor methods have also
been called ‘factor income method’ or
‘productivity method’. They are used to
estimate the economic value of
ecosystem products or services that
contribute to the production of
commercially traded goods. The
39
United Nations Development Programme – Global Environment Facility | Global Support Unit (GSU) : http://www.gsu.co.za/
TOOL KIT
Environmental Economics
Tool 4

method can be applied when
ecosystem services, along with other
inputs, are used to produce a marketed
good. For example, the benefits of
supplying water for irrigation purposes
can be derived from the increased
production as a consequence of the
irrigation.
If a natural resource is a factor of
production, then changes in the
quantity or quality of the resource will
affect the production costs of the
marketed goods involved. This has two
welfare effects. First, if the quality or
price to consumers of the final good
changes, there will be changes in
consumer surplus. Second, if
productivity or production cost
changes, producers will be affected and
there will be changes in the producer
surplus. Hence, in principle, where
ecosystem services are used as input in
a production process, the economic
benefits from changes in ecosystem
services supply can be estimated using
changes in observable market data.
Application of Production Factor
Methods consists of a two-step
procedure. First, the physical effects of
changes in a biological resource or the
supply of an ecosystem service on an
economic activity need to be assessed.
Second, the impact of these
environmental changes should be
valued in terms of the corresponding
change in the marketed output of the
corresponding activity. This means data
must be collected on how changes in
the quantity or quality of the natural
resource affect (i) the costs of
production for the final good; (ii) the
supply and demand for the final good;
and (iii) the supply and demand for
other factors of production (e.g.
reduced irrigation water availability
may affect the demand for fertilizers).
This will normally involve the
construction of supply and demand
curves for the good involved. In this
way, the analysis reveals how changes
in ecosystem services supply affect the
consumer surplus (as a function of
lower or higher prices for the marketed
good) and/or the producer surplus (as a
function of the increased costs to
producers and their capacity to grow
alternative crops).
Note that it is not always necessary to
construct supply and demand curves, in
which case the application of the
method become much more
straightforward and much less data
intensive. For instance, if the method is
applied to value the supply of an
ecosystem service that affects only a
small part of the production of a certain
good traded on a market, it can be
assumed that the ecosystem service
does not affect the consumer surplus.
The specific condition here is that a
change in the supply of the ecosystem
service does not change the price (or
quantities) at which the good
concerned is available on the market.
For instance, if the pollination service is
valued, valuation of pollination at the
scale of the individual farm does not
need to consider any price effects and
consequent changes in consumer
surplus. If, on the other side, pollination
is valued at the scale of the country
(e.g. to estimate the importance of
pollination for national agriculture),
such price effects can be expected and
need to be calculated. In the ‘simple’
case of the individual farmer,
pollination effects the producer surplus
of the individual farmer only, and the
economic value can be calculated by
multiplying impacts on production
times the net farm-gate economic price.
A second example of when the method
is easily applied is where the ecosystem
service in question is a perfect
substitute for another input in the
40
United Nations Development Programme – Global Environment Facility | Global Support Unit (GSU) : http://www.gsu.co.za/
TOOL KIT
Environmental Economics
Tool 4

production process. For example,
increased water quality in a reservoir
may mean that less chlorine is needed
for treating the water. Thus, in this
example, the benefits of increased
water quality can be directly measured
by the decreased chlorination costs.
Note that if this would lead to large
changes in the market price of the final
product, there would be an additional
benefit to consumers and, hence, a
change in consumer surplus.
Hence, the method is highly useful to
estimate the wide range of ecosystem
services that provide an input in the
production process including various
provisioning services such as water,
timber, bamboo, etc. as well as
regulation services including
pollination and biological nitrogen
fixation. However, unless changes in the
supply of the ecosystem service do not
lead to changes in market prices in the
final product, the method is data
intensive as supply and demand curves
need to be constructed.
Potential caveats
A potential bias of the PFM is that
effects on production may have been
distorted by averting behavior. For
instance, producers will try to avert the
effects of reduced natural qualities by
undertaking prevention activities, such
as shifting to different crops or
products, adapting cultivation or
harvesting techniques. Because PFM is
based on dose-response relations
which involve a considerable amount of
ecological information and because it
requires economic data on natural
products as well, it has a large data
requirement, in particular if it is
necessary to account for demand and
supply dynamics in the valuation of
responses.
Further reading
Freeman (1993) gives an account of the
theoretical foundation underlying the
Production Factor Method. Ricketts et
al. (2004) provide a simple method to
calculate the value of the pollination
service at the local scale (as also
elaborated in Case Study 4). Southwick
and Southwick (1992) calculate the
consumer surplus related to the
pollination service with respect to crop
pollination in the USA, and Gordon and
Davis (2003) examined the producer
surplus of honey bee pollination in
relation to Australian agriculture. Cooke
(1998) examines local production
factors including ecosystem services on
agricultural production in Nepal.
4.2.4 The Hedonic PricingMethod (HPM)
The hedonic pricing method is used to
estimate economic values for those
ecosystems or ecosystem services that
directly affect market prices. Hedonic
pricing methods can be used to
estimate economic benefits or costs
associated with (i) environmental
quality, including air, water and noise
pollution; and (ii) environmental
amenities, such as aesthetic views or
proximity to recreational sites. However,
it is most often used to value
environmental amenities that affect the
price of residential properties. For
example, the price of a house in quiet
and beautiful surroundings is likely to
be higher than the price of the same
kind of house next to a highway. HPM
starts with a regression of house prices
against all their relevant characteristics.
This leads to a hedonic price function of
the following shape: Value(house) =
f(size, style, garden size, age,
environmental characteristics, etc.).
From this function one can calculate
the willingness to pay for a marginal
change in each of these explaining
41
United Nations Development Programme – Global Environment Facility | Global Support Unit (GSU) : http://www.gsu.co.za/
TOOL KIT
Environmental Economics
Tool 4

variables. This is the implicit price of the
amenity under investigation. From
these implicit prices, the demand curve
for a specific amenity can be derived.
The demand curve is then used for
estimating the economic value of an
amenity such as natural beauty.
HPM has a large data requirement
because both primary data
(characteristics of the surroundings)
and secondary data (market
transactions) need to be collected. For
instance, the value of a house or wage
depends on many factors: there are
social factors, such as employment
opportunities, taxes and accessibility,
and data need to be gathered for all
these factors.
Potential caveats
Since the number of explaining
variables can be numerous, there is a
risk that not all important variables are
included in the regression analysis. It is
also possible that there are several
amenities that influence the price of a
house in opposite directions. There
may, for example, be a positive
influence of a park nearby, but at the
same time two noxious facilities which
supply jobs. Finally, the house market
may be distorted due to governmental
interventions which leads to a bias in
the assessment of the economic value
of amenity ecosystem services as well
(Pearce and Markandya, 1989).
Further reading
Freeman (1993) examines the theories
behind hedonic pricing. Le Goffe (2000)
examines the application of HPM to
examine externalities of agriculture and
forestry in the USA, and Kim et al. (1998)
apply HPM to measure the benefits of
air quality improvement in the USA.
Two examples from developing
countries are Shanmugam (2000) who
estimates values of life and health,
using data from India, and Macedo
(1998) who examines the Belo Horizonte
housing market in Brazil with HPM.
4.2.5 The Contingent ValuationMethod (CVM)
CVM is a survey method in which
respondents are asked how much they
are willing to pay for the use or
conservation of an ecosystem service.
Their stated preferences are assumed to
be contingent upon the alternative
goods that are offered in a ‘hypothetical
market’. The three main elements of a
CVM are: (i) a description of the
ecosystem service to be valued; (ii) a
description of the payment vehicle; and
(iii) a description of the hypothetical
market (Ruijgrok, 2004). The payment
vehicle explains how and to whom the
money will be paid. One can pay for a
good in cash every time it is used or by
means of an increased income tax. The
description of the hypothetical market
should include an identification of who
will provide and who will pay for the
ecosystem service. It should be made
clear that the payment is a collective
action; everybody else will also pay,
otherwise respondents may refuse to
pay although they appreciate the good.
In order to prevent overestimates,
respondents should also be reminded
of the possibility of spending their
income on goods other than nature.
CVM measures benefit-based
preferences and it includes the
consumers’ surplus.
CVM, and related Choice experiments,
are the only methods available to value
non-use values of ecosystems, and they
can also be used for selected other
services and value types. In general,
CVM is an appropriate economic
valuation method for environmental
goods that have no indirect effects on
other goods. It is therefore suited for
42
United Nations Development Programme – Global Environment Facility | Global Support Unit (GSU) : http://www.gsu.co.za/
TOOL KIT
Environmental Economics
Tool 4

the valuation of amenities or other easy
to perceive aspects of nature, but not
for the valuation of natural processes,
such as climate regulation, where
effects on human welfare are difficult to
grasp for respondents to a
questionnaire. In general, CVM does not
produce valid measurements when it
concerns goods that people are not
familiar with. Nor does it work when
people reject responsibility for the
good in question. If people are asked,
for example, about their willingness to
pay for clean soil, they may state that it
is zero, because they feel the polluter
should pay. This does not mean that
they do not appreciate clean soil. One
may also remark here that it is better to
value goods that have an international
character on a cost basis, because in a
CVM-survey respondents will not know
what to answer if they realize that
reducing pollution in their own country
does not solve the global pollution
problem, if the other countries do not
make an effort too.
Choice experiments
Choice experiments are strongly related
to contingent valuation, in that it can
be used to estimate economic values
for a broad range of ecosystem services,
for both non-use and well as use
values. Like contingent valuation, it is a
hypothetical method – it asks people to
make choices based on a hypothetical
scenario. However, it differs from
contingent valuation because it does
not directly ask people to state their
values in dollars. Instead, values are
inferred from the hypothetical choices
or tradeoffs that people make. The
contingent choice method asks the
respondent to state a preference
between one group of environmental
services or characteristics, at a given
price or cost to the individual, and
another group of environmental
characteristics at a different price or
cost. Because it focuses on tradeoffs
among scenarios with different
characteristics, contingent choice is
especially suited to policy decisions
where a set of possible actions might
result in different impacts on natural
resources or environmental services. For
example, improved water quality in a
lake will improve the quality of several
services provided by the lake, such as
drinking water supply, fishing,
swimming, and biodiversity. In addition,
while contingent choice can be used to
estimate dollar values, the results may
also be used to simply rank options,
thout focusing on dollar values.
Potential caveats
There are two main points of criticism
against CVM. First, CV estimates are
sensitive to the order in which goods
are valued; the sum of the values
obtained for the individual components
of an ecosystem is often much higher
than the stated willingness-to-pay for
the ecosystem as a whole. Second, CV
often appears to overestimates
economic values because respondents
do not actually have to pay the amount
they express to be willing to pay for a
service (see e.g. Diamond and
Hausman, 1994 and Hanemann, 1995).
Further Reading
For more information on the theories of
the TCM, the reader is referred to, for
instance, Haab and McConnell (2000).
Diamond and Hausman (1994) present
an overview of the various critiques on
the CVM. Arrow et al. (1993) present the
well-known application of CVM to
support the damage claims following
the Exxon Valdez oil spills. Whittington
(1998) reviews the application of CVM
in developing countries. Finally, Boxall
et al. (1996) compares the different
approaches to CVM.
43
United Nations Development Programme – Global Environment Facility | Global Support Unit (GSU) : http://www.gsu.co.za/
TOOL KIT
Environmental Economics
Tool 4

44
United Nations Development Programme – Global Environment Facility | Global Support Unit (GSU) : http://www.gsu.co.za/
TOOL KIT
Environmental Economics
Tool 4
If few data are available for an ecosystem, crude estimates of the values of ecosystem services may be obtainedthrough ‘benefit transfer’ - the transfer of ecosystem values to settings other than those originally studied (Green etal., 1994; Willis and Garrod, 1995; and Brouwer et al., 1997). Costanza et al. (1997) and Pearce and Pearce (2001)provide indications of the values of a range of ecosystem services in selected ecosystems (see the table below).However, there are severe limitations with respect to the application of this methodology. The potential value of aservice varies widely as a function of the type of ecosystem involved and it’s socio-economic and bio-physical setting.This is reflected in the large spread in the values indicated in the table. The user is recommended to be cautious withthe use of benefit transfer, and use it only if there are reasonable assumptions to assume that the ecosystem type, and it’s socio-economic and bio-physical setting are comparable.
Ecosystem ServiceProvisioning services
Food
Raw materials
Regulation services
Carbon sequestration
Climate regulation through control of albedo, temperature and rainfall patterns
Hydrological service: regulation of the timing and volume of river discharges
Control of soil erosion and sedimentation
Nursery service
Breakdown of excess nutrients and pollution
Pollination
Regulation of pests and pathogens
Cultural services
Tourism and recreation
Cultural and historical heritage
Ammenity services including pleasant living conditions
Habitat service
Value range (US$/ha/year)
6–2761
6–1014
7–265
88–223
2–7500
10-250
142–195
50 – 20,000
14-25
2-78
2-3000
1-1500
75-10,300
3–1523
BOX 3. Benefit transfer
Value ranges for ecosystem services

Step 4.3 Selecting the discount rate
If the value of ecosystem services is
expressed as NPV (instead of as an
annual flow), the discount rate is a
crucial factor. Discounting is used to
compare present and future flows of
costs and benefits derived from the
ecosystem. Often, unsustainable
exploitation of ecosystems involves
high short term benefits (e.g. clear-cut
of the timber stands) whereas
sustainable management leads to a
more long term flow of benefits (e.g.
through a sustainable harvesting
regime). Selection of a high discount
rate implies that future costs and
benefits are not deemed very
important and, in this case, an
economic analysis may indicate that it
is efficient to immediately harvest all
stands of timber in a forest, even if this
would lead to an irreversible loss of
ecosystem services for future
generations.
The discount rate can be derived
following two approaches, on the basis
of (i) the consumption discount rate;
and (ii) the social opportunity costs of
capital (Pearce and Turner, 1990). The
consumption discount rate indicates,
among others, that most people prefer
immediate rather than future
consumption, and the social
opportunity costs of capital represent
the rate of return on capital. In a simple
economy with no taxes or inflation, and
perfect capital markets, the
consumption discount rate equals the
social opportunity costs of capital
equals the market interest rate (Lind,
1982; Varian, 1993). In reality, this is
usually not the case. For instance, due
to taxation and inflation, the market
interest rate is higher than the
consumption discount rate (Freeman,
1993; Hanley and Spash, 1993). Hence, a
choice needs to be made regarding the
discount rate to be used (Pearce and
Turner, 1990).
The discount rate to be used in
environmental cost-benefit analysis is
still subject to debate (e.g. Howarth and
Norgaard, 1993; Norgaard, 1996; Hanley,
1999). For instance, Freeman (1993)
indicates that the discount rate, based
upon the after- tax, real interest rate,
should be in the order of 2 to 3%
provided that the streams of benefits
and costs accrue to the same
generation, whereas Nordhaus (1994)
argued that a 6% discount rate is most
consistent with historical savings data.
In practice, in many valuation studies, a
5% discount rate has been used.
Note that discount rates in the order of
2 to 5% still lead to rapid depreciation
of future costs and benefits. At a
discount rate of 2%, the value of US$ 1
in 100 years amounts to not more than
14 cents. Hence, through discounting, a
much larger weight is attached to the
net benefits accruing to current
generations as compared to the
benefits for future generations.
Therefore, it is highly disputed if
discounting is appropriate for the
analysis of environmental issues with
large time lags between investments in
mitigation measures and positive
economic impacts such as climate change.
In general, the use of a high discount
rate will favor ecosystem management
options that lead to relatively fast
depletion of resources, whereas a low
discount rate will stress the economic
benefits of more sustainable
management options (Pearce and
Turner, 1990; Tietenberg, 2000).
45
United Nations Development Programme – Global Environment Facility | Global Support Unit (GSU) : http://www.gsu.co.za/
TOOL KIT
Environmental Economics
Tool 4

46
United Nations Development Programme – Global Environment Facility | Global Support Unit (GSU) : http://www.gsu.co.za/
TOOL KIT
Environmental Economics
Tool 4
Case study 4. Value of the pollination service in coffee plantations
The pollination service is an important regulation service supporting global agriculture. A number of recent studies haveattempted to measure the economic value of the service in different agro-ecological and economic settings. This casestudies deals with the local value of pollination in coffee cultivation. The case refers to C. arabica, which accounts forover 75% of the global coffee production. The contribution of pollination to coffee production has been shown in a rangeof studies. For instance, through statistical analysis of coffee yields before and after the introduction of African honeybee in the neotropics in the early 1980s, Roubik (2002) analyzed the impact of pollination on coffee production. Roubik(2002) estimates that pollination of coffee plants (all insects) increases global C. arabica yields by on average some36%. Furthermore, Klein et al. (2003) show that a loss of the pollination service led to a 12.3% lower yield in IndonesianC. arabica plantations. Ricketts et al. (2004) found that enhanced pollination of Costa Rican coffee plants near forestedges led to a 20.8% higher yield in comparison with coffee plants in the centre of the field.
Ricketts et al. (2004) provide a simple method to calculate the value of the pollination service for a large coffee producerin the Valle General, Costa Rica. The plantation comprises both sites located close to remaining patches of naturalforest, and sites further away form natural forest. The forest patches provide a habitat to non-native honey bees as wellas 10 native species of Meliponini stingless bees. Ricketts et al. (2004) show that the bees have difficulties reachingthe parts of the coffee plantation located farthest from the forest, and establish that bee pollination makes an importantcontribution to coffee yields. The formula that they use to calculate the economic benefits of the pollination service atthe local scale is:
with W = benefits for the farmer; S = area¢q = increase in production as a consequence of pollinationp = farm-gate coffee pricec = variable costs related to coffee harvest.
In the Costa Rican study, 480 ha of coffee fields (S) are close (<1 km) to two patches of forest that have been conservedon the plantation, the increase (¢q) in coffee is 20.8% x 14.240 kg/ha, the farm-gate price (p) is US$ 0.071 /kg, thelabor costs of harvesting (c) are US$ 0.028 /kg, and the resulting value (W) of the two patches of forest that maintainpollinator populations that cater the coffee plantation is US$ 62,000. This represents 7% of the annual income of theplantation (Ricketts et al., 2004). This example demonstrates that pollination can make an important economiccontribution at the scale of the individual plantation. Note that it does not provide sufficient guidance for themanagement of the pollination service, it can not be derived from this experiment how much forest patches need to bepreserved in order to maintain the pollination service in the plantation; either more (if not all coffee fields are sufficientlypollinated) or less (if populations could do with smaller habitats) forest patches could be optimal for the farmer.

47
United Nations Development Programme – Global Environment Facility | Global Support Unit (GSU) : http://www.gsu.co.za/
TOOL KIT
Environmental Economics
Tool 4
Case study 5. Valuation of the tourism serviceThe tourism service of ecosystems generates benefits for both visitors to areas of natural beauty and the tourism sectorincluding airline companies, hotels, local service providers and shops. The value of the service for visitors is representedby the consumer surplus they obtain from their trip. For the individual visitor, this is derived from the willingness to payfor the trip minus the costs of the trip. Through a Travel Cost method, the surplus for the visitor can be calculated. The benefits for the providers of tourism services can be divided in international and domestic benefits, and equals theproducer surplus obtained by these providers, i.e. the amount of income they receive minus the costs they incur foroffering the service. With respect to the conservation of biodiversity, it is these domestic revenues that are mostimportant, because they provide incentives for the maintenance of the biodiversity at the local and national levels. Table14 presents the domestic revenues for tourism revenues in a number of African countries. It is clear that there are largedifferences between countries, with South Africa and Kenya benefiting most from international tourism. Key factors inattracting tourists appear to be wildlife (in particular the ‘big five’ species), tourist facilities and ease of access to parks,and the stability and safety of the country (MEA, 2006).
Whereas income provides a first indicator for the value of the tourism service, two other factors play a role in determiningthe economic value of the tourism service. First, the amount of money that seeps away from the tourism sector (e.g.because international hotel chains purchase a substantial part of food, linnen and other commodities on theinternational rather than the domestic market, and because their profits are transferred to owners or shareholdersabroad). Second, the positive impact of tourism on other sectors (multiplier effect), e.g. through all kinds of localexpenditures of staff working in hotels or restaurants.
Table 14. Income from nature tourism in Africa.
Source: MEA (2006)

The fifth Tool involves a dynamic
assessment of the impact of land
degradation on the supply of
ecosystem services, and the resulting
economic damages. The Tool can also
be used to analyze the benefits of
enhancing or maintaining ecosystem
services supply through SLM. The Tool
depends on quantitative analysis of the
relation between (i) degradation or
SLM and ecosystem state; and (ii)
ecosystem state and supply of
ecosystem services. These two relations
can be assessed through basic
ecological economic modeling. As the
analysis may only involve a very limited
set of relations (e.g. erosion -> loss of
fertile topsoil -> loss of crop
production), they do often not require
specific software or complex modelling
skills. For instance, Excel can be used for
basic quantitative analyses.
Two key steps in the ecological-
economic assessment are (i) to link
drivers to environmental state, and (ii)
to link environmental state to
ecosystem services (see Figure 8). The
first steps requires analysis of which
environmental compartments will be
influenced by the drivers, and how
these compartments will change
following a change in the driver. The
second step involves the linking of
environmental compartments to
ecosystem services. For instance,
increased cropping intensity and
reduced fallow periods in a slash-and-
burn system reduce the fertility status
of the soil which reduces the regrowth
of vegetation and the supply of NTFPs.
If the dose-response curve is known, the
economic consequences of increased
cropping intensity can be assessed.
SLM issues tend to be complex,
involving a broad range of drivers and
management alternatives, and not all
drivers can be modeled and analyzed.
However, often, it is possible to identify
one or two key drivers, and to establish
the relation between these drivers and
ecosystem services supply. In these
cases, it can be made clear which
benefits can be obtained from
changing land use practices. By means
of an optimization approach, it is also
be possible to identify optimal
management strategies, i.e. the
management strategy that generates
the highest net benefits for society.
Purpose of the Tool
The purpose of this Tool is to guide the
user in the application of ecosystem
services modeling for SLM. It provides
a basic structure for ecological-
economic modeling of the relation
between land use change and
ecosystem services supply, as well as
guidance on the application of the Tool
through a case study.
How to use the Tool
The Tool provides a framework and
general guidelines that can be used to
model impacts of changes in
ecosystems on the supply of ecosystem
services. The tool allows the
identification of principal drivers, their
impact on the state of the ecosystem,
and the resulting impacts on the supply
of ecosystem services. In addition, in
Step 5.3, it is examined how optimal
ecosystem management strategies can
be identified on the basis of ecological-
economic modeling. As such a wide
range of processes and ecosystem
components can play a role, these
guidelines can only provide the general
approach, which will have to be fine-
tuned for every individual impact
assessment.
Step 5.1 Selection of relevantdrivers and processes
48
Assessing the costs & benefits of land use change
United Nations Development Programme – Global Environment Facility | Global Support Unit (GSU) : http://www.gsu.co.za/
TOOL KIT
Environmental Economics
5TOOL
Tool 5

Figure 8 presents a framework that can
be used to identify the main drivers and
processes that determine ecosystem
change and subsequent changes in
ecosystem services supply. The three
main drivers relate to: (i) the (over-)
harvesting of ecosystem services,
specifically provisioning services; (ii) the
impacts of pollutants on the system;
and (iii) direct interventions in the
ecosystem. This latter is a broad
category that comprises such different
interventions as construction of a road
through an ecosystem or reforestation.
The three drivers can cause changes in
the state of the ecosystem, which are
likely to affect the ecosystem’s capacity
to supply ecosystem services.
Note that the framework is fully
compatible with the DPSIR framework
and the Indicator Framework for SLM
specified in the GEF Project ‘Knowledge
from the Land’. The economic system
contains different drivers that may
result in pressures on the ecosystem in
the form of overharvesting of resources,
pollution or other impacts. This leads to
changes in the state of the ecosystem
(or land use system), with,
consequently, an impact on the supply
of ecosystem services. Society may
respond by reducing the pressures, or
accept (or adapt to) lower levels of
ecosystem services supply.
The framework presents a conceptual
outline of an ecological-economic model
or assessment. It is particularly suitable to
assess the temporal scales related to
ecosystem management.The framework,
as presented in figure 8, does not
distinguish between different spatial
scales of ecosystem management.
However, it can be adjusted in order to
49
United Nations Development Programme – Global Environment Facility | Global Support Unit (GSU) : http://www.gsu.co.za/
TOOL KIT
Environmental Economics
Tool 5
Time
Time Time
Time
Time
Time
Time
Time
Economic system
Economic system
Harvest/use levels
Ecosystem servicesProvisioning servicesRegulation servicesCultural services
production and consumption
Ecological Process
Pollution control levels
Intervention type / level
Pollution
EcosystemInterventions
Figure 8. Conceptual framework for the ecological-economic modeling of the management options for a dynamic ecosystem. The square boxes are labels for the flows between the two systems, and the diamonds represent the decision variables.

become more spatially explicit by
defining the relevant interactions at
different spatial scales. This requires
incorporation into a GIS system.
Application of the framework requires
(i) identification of the relevant drivers
and the potential management
options; (ii) the modeling of ecosystem
dynamics as a function of external
drivers and internal processes; (iii)
analysis of the costs of management
options and valuation of the ecosystem
services; and (iv) analysis of the
economic efficiency and sustainability
of management options. These four
steps are briefly described below.
(i) Identification of the drivers
and potential management
options. This step first involves the
identification of the interactions
between the ecosystem and the
economic system, including the current
management of the system and the
various services supplied by the
ecosystem. Subsequently, the potential
options to enhance the management
should be identified. This may include,
for instance, changing the harvest levels
of ecosystem services or the application
of pollution control technologies.
(ii) Modeling the dynamics of
the ecological-economic system.
This steps involves the modeling, in
physical terms, of the impacts of
management options on the
ecosystem, and the impact of changes
in ecosystem state on the system’s
capacity to supply ecosystem services.
For systems subject to complex
dynamics, it is important that these
dynamics are reflected in the model.
This requires the modeling of the main
ecosystem components and the
feedback mechanisms between them,
including relevant non-linear and/or
stochastic processes. In spite of the
large number of ecological processes
regulating the functioning of
ecosystems, recent insights suggest
that the main ecological structures are
often primarily regulated by a small set
of processes (Harris, 1999; Holling et al.,
2002). This indicates that inclusion of a
relatively small set of key components
and processes in the model may be
sufficient to accurately represent the
(complex) dynamics of the system. This
is further elaborated in Step 5.2
‘Modeling changes in ecosystem
services supply’ below.
(iii) Analysis of the costs of
management options and
valuation of the ecosystem
services. In this third step, the
physical flows need to be expressed in
a monetary measure. This involves both
examining the costs of the
management options, for example
through the establishment of a
pollution abatement cost curve, and the
valuation of changes in the supply of
ecosystem services following changes
in management. Appropriate valuation
methods differ per type of ecosystem
service, as described in Tool 4
(‘Economic Valuation’).
(iv) Analysis of the impacts of
ecosystem change and of the
management options. Once the
ecological-economic model has been
constructed, it can be used to assess the
impacts of the ecosystem change on
the supply of ecosystem services, as
well as of the efficiency and
sustainability of different ecosystem
management options. The efficiency of
ecosystem management can be
revealed through comparison of the
net welfare generated by the
ecosystem and the costs involved in
maintaining and managing the
ecosystem (e.g. Pearce and Turner,
1990). Through a simulation or
algebraic optimization approach,
50
United Nations Development Programme – Global Environment Facility | Global Support Unit (GSU) : http://www.gsu.co.za/
TOOL KIT
Environmental Economics
Tool 5

efficient management options, i.e.
management options that provide
maximum utility given a certain utility
function, can be identified. The
sustainability of management options
can be examined by analyzing their
long-term consequences for the state
of the ecosystem including its capacity
to supply ecosystem services (Pearce et
al., 1989; Barbier and Markandya, 1990).
Optimization procedures are described
in Step 5.3.
Step 5.2 Quantitativeassessment of ecosystemchange
Through dynamic systems modeling,
the ecological-economic model can be
specified. A systems modeling
approach is based upon the modeling
of a set of state (level) and flow (rate)
variables in order to capture the state
of the system, including relevant inputs,
throughputs and outputs, over time.
This may comprise a range of
theoretical, statistical or
methodological constructs, dependent
upon the requirements and limitations
of the model. The systems approach
can contain non-linear dynamic
processes, feedback mechanisms and
control strategies, and can therefore
deal in an integrated manner with
economic-ecological realities (Costanza
et al., 1993; Van den Bergh, 1996). Note
that these models are not necessarily
highly complex or require sophisticated
software. Simple spreadsheet models
capturing 2 to 4 key relations in
equations may be sufficient for the
quantitative assessment.
The modeler needs to identify the key
drivers, state indicators and processes,
and quantify the relations between
them in terms of flow and state
variables. For many ecosystem types,
these are ‘standard’ models that
indicate the general types of dynamics
that can be expected as a function of
drivers and pressures. Based on time-
series data for the specific ecosystem
involved, such general models can be
calibrated in order to yield a realistic
modeling of the system. Where more
detailed modeling or analysis is
required, specific software such as Stella
is available, but simple spreadsheet
programs may also be sufficient.
Step 5.3 Optimization ofecosystem management
Development of an ecological-
economic model allows the user to
calculate the impacts of a change in the
ecosystem on the supply of ecosystem
services. However, in addition, it allows
the user to identify the optimal
management approach to the
ecosystem. For instance in a situation
where pollution control costs money
related to investment in waste
treatment plants, and yields benefits in
relation to an enhanced supply of
ecosystem services from a clean lake,
the ecological model allows selection of
the most efficient pollution control
level.
In the context of dynamic systems
models, two approaches can be
followed to determine the value of the
decision variables that provides
maximum utility: (i) a simulation
(programming) approach and; (ii) an
algebraic, static or dynamic
optimization approach. In both cases an
ecological–economic model is first
developed, but the optimal solution is
found in different manners. In the
simulation approach, a model is
developed to represent modifications
in the ecosystem and the economic
system, and the key interactions as a
function of the decision variable(s). By
simulating the development of the
ecosystem for a range of values of the
51
United Nations Development Programme – Global Environment Facility | Global Support Unit (GSU) : http://www.gsu.co.za/
TOOL KIT
Environmental Economics
Tool 5

decision variables, optimal solutions
can be revealed - within the tested
range and under the tested conditions.
In the algebraic optimization approach,
optimal solutions are found in a
numerical or algebraic manner, through
the preparation of the Hamiltonian and
solving the first and second order
conditions (Chiang, 1992), as further
discussed below.
According to the framework presented
in figure 8, there are three principal
types of ecosystem management: (i)
changing the use level of ecosystem
services; (ii) the control of pollution
influxes; and (iii) direct interventions in
the ecosystem. Below, it is analyzed
how the efficiency of these three types
of measures can be assessed, and which
conditions need to be met to achieve
efficient management.
(i) Optimizing the extraction of
renewable resources. Efficient
resource extraction has been studied
since over a century. Early studies
focused on forestry (Faustmann, 1849)
whereas studies on fisheries
management (e.g. Gordon, 1954) and
grazing systems (e.g. Dillon and Burley,
1961) are more recent. The standard
models assume a logistic growth curve,
with low resource growth at low
population sizes and at population
sizes close to the carrying capacity. In
addition, these models may consider
quality and price changes, cost for
inputs and harvesting costs. Forest
management models have dealt with,
in particular, the choice of the optimal
rotation period, while in fisheries and
grazing systems, the key decision
variable is the harvest rate.
In a deterministic, dynamic, single
species model, the efficient stock and
harvest level depend upon the
marginal growth rate of the stock, and
the discount rate used (e.g. Tietenberg,
2000). The stock’s marginal growth rate
determines the rents that can be
obtained from the natural capital stock,
whereas the discount rate indicates the
rents that can be obtained from
depletion of the natural capital stock
and investing the benefits in man-made
capital. For instance, Clark (1976)
assumed fixed harvest costs (i.e. harvest
costs independent from the stock size)
and showed that if the reproduction
rate of the resource is lower than the
discount rate, it may be efficient, from a
utilitarian point of view, to harvest the
full stock. This situation does not
generally apply, as normally the harvest
costs will increase with decreasing
stock levels. Moreover, there may be a
range of hidden costs related to
overharvesting of particular species
through the disturbance of the
ecosystem, which may affect the whole
range of ecosystem services supplied
by the ecosystem (Jackson et al., 2001).
(ii) Efficient levels of nutrient
pollution control. Land
degradation may lead to run-off of
fertilisers or sediments into rivers and
other waterways. The optimal level of
nutrient pollution or sedimentation is
usually discussed in terms of the
intersection of the marginal damage
function and the marginal control cost
function (see e.g. Tietenberg, 2000). The
marginal damage function shows the
damage resulting from pollution as a
function of emissions of a particular
pollutant. The marginal control cost
function shows the cost of reducing
emissions of the pollutant below the
level that would occur in an
unregulated market economy. The
marginal damage function is composed
of a chain of functional relationships, as
depicted in Figure 9. Dispersion
processes and chemical transformations
may reduce local pollution loads. In
some types of ecosystems, time lags
52
United Nations Development Programme – Global Environment Facility | Global Support Unit (GSU) : http://www.gsu.co.za/
TOOL KIT
Environmental Economics
Tool 5

may play a role, for example if there are
buffers in the ecosystem that absorb
pollutants, and release them once the
input of pollutants has decreased
(Carpenter et al., 1999).
Ecological-economic modeling of
pollution control requires analysis of
four main elements: (i) the costs of
pollution control; (ii) the relation
between dispersal of pollution and the
build-up of pollution loads in the
ecosystem; (iii) the impact of pollution
loads on the capacity of the ecosystem
to provide goods and services; and (iv)
the benefits foregone as a result of a
loss of ecosystem services.
(iii) Optimization of ecosystem
intervention. In view of the diversity
of possible ecosystem interventions, the
efficient level of ecosystem
intervention can only be analyzed in
general terms in this section. If the
evaluation concerns only one, discrete
measure, the basic criterion in terms of
efficiency is whether the discounted
benefits of the measure exceed the
discounted costs of the measure, or not.
The benefits include the potential
impact of the measure on the supply of
all relevant ecosystem services, and the
costs include investment costs,
operation and maintenance costs, and
possible negative impacts on the
supply of other ecosystem services
(Hanley and Spash, 1993).
In case a range of measures is possible,
the efficient intervention level
corresponds to implementation of
those measures that minimize the sum
of the total costs of the measures and
the costs resulting from a loss of
environmental quality (see e.g. Hanley
and Spash, 1993). A loss of
environmental quality may cause a loss
of ecosystem services, and bring costs
for compensation payments to
stakeholders impacted by that loss
(Hueting, 1980). For concave benefit
and convex cost functions, the marginal
benefits of implementing the measure
equal the marginal costs of adverse
environmental quality at the point of
maximum efficiency (Tietenberg, 2000).
53
United Nations Development Programme – Global Environment Facility | Global Support Unit (GSU) : http://www.gsu.co.za/
TOOL KIT
Environmental Economics
Tool 5
Figure 9. Schematic overview of a marginal damage function
Emissions of apollutant
Dispersion of pollutants in theenvironment
Chemicaltransformations
Ambientconcentrations
Loss of socialwelfare
Loss of ecosystem goodsand services
Impacts onecosystem

54
United Nations Development Programme – Global Environment Facility | Global Support Unit (GSU) : http://www.gsu.co.za/
TOOL KIT
Environmental Economics
Tool 5
This case study (derived from Van der Pol and Traore, 1993) demonstrates how the costs of soil nutrient depletion canbe calculated with respect to agricultural production in Mali. First, the degree of soil mining by agricultural productionis assessed by calculating nutrient balances: differences between the amount of plant nutrients exported from thecultivated fields, and those added to the fields. Second, the costs of nutrient depletion are calculated.
Nutrient export processes include extraction by crops, losses due to leaching, to erosion, and to volatilization anddenitrification. Inputs include applications of fertilizer and manure, restitution of crop residues, nitrogen fixation,atmospheric deposition of nutrients in rain and dust, and enrichment by weathering of soil minerals. Nutrient balancesare calculated for N, P, K, Ca, and Mg. The resulting figures indicate large deficits for nitrogen, potassium andmagnesium. For the region as a whole, the calculated annual deficits are -25 kg N/ha, -20 kg K/ha, and -5 kg Mg/ha.Further, acidification is to be expected, in particular in areas where cotton is grown. The deficits are caused bytraditional cereal crops, but also by cotton and especially by groundnut. The latter two crops are fertilized, butinsufficiently. For phosphorus and calcium the balance of the region as a whole appears to be about in equilibrium,but locally large variations may occur. Furthermore, erosion and denitrification are important causes of nutrient loss,accounting respectively for 17 and 22% of total nitrogen exports. Atmospheric deposition and weathering of mineralsin the soil are still important nutrient inputs that contribute as much nutrients as organic and mineral fertilizercombined. Hence, nutrient depletion is very large in comparison to the amount of fertilizer applied. Drastic options,such as doubling the application of fertilizer or manure, or halving erosion losses, even if feasible, would still not beenough to make up for the calculated deficits.
In the second step, the costs of nutrient depletion are calculated. This is done following a basic Replacement Costmethod (one of the Averting Behavior Methods described in Section 4.2.1). The economic value of nutrient deficitsand surpluses has been calculated on the basis of prices which farmers had to pay for fertilizers (financial prices) in1989. In line with the preceding physical considerations, the economic evaluation shows a considerable contributionof soil nutrient depletion to farmer's income. Average nutrient deficit per hectare values around FCFA 15,000 (US$62/ha) in 1989. Compared to income from agricultural activities this represents a substantial proportion. Evaluatingall harvested products, including cereals, at 1989 market prices, the average gross margin from agricultural activitiesin the study region amounts to FCFA 34,200/ha (US$ 134/ha). Thus, in 1989, soil nutrient depletion represented asmuch as 44% of the average farmer's income (Van der Pol and Traore, 1993).
Case study 6. Costs of soil nutrient depletion in Southern Mali

55
United Nations Development Programme – Global Environment Facility | Global Support Unit (GSU) : http://www.gsu.co.za/
TOOL KIT
Environmental Economics
Tool 5
This case study demonstrates how ecosystem services valuation can be applied in a dynamic context in order todefine optimal ecosystem management options. It is based on a recent, more elaborate study by Hein (2006) onwater management in the ‘De Wieden’ wetlands in the Netherlands. The case study compares the costs and benefitsof eutrophication control measures, given that eutrophication control leads to enhanced water quality and anenhanced supply of ecosystem services by the lakes of De Wieden. Eutrophication of the lakes is caused byagricultural run-off from exces fertilizer use in surrounding farmland.
The study considers water quality in four lakes with a total area of 1640 ha and an average water depth of only 1.8meter. The ecosystem services provided by the lakes are nature conservation and recreation, reed cutting andfisheries. For the study, an ecological-economic model was developed that describes the response of the ecosystem toeutrophication control measures. Total-P concentrations are used as the control variable of the models because P isthe main limiting nutrient in the lakes. The various steps included in the model are presented in figure 10. Thebenefits of the transition to clear water are expressed as net present value (NPV) in order to compare them with thecosts of eutrophication control measures.
The three main steps of the model deal with:(i) the costs and impacts of mitigationmeasures; (ii) the modeling of the responseof the ecosystem to eutrophication controlmeasures; and (iii) analysis of the benefits ofclear water. Subsequently, (iv) the costs andbenefits of the measures can be compared.These steps are described below.
(i) Costs and impacts of mitigation measures.Potential measures available to reduce theinflow of phosphorus in the De Wiedenwetland have been examined by the localwaterboard. In collaboration with the mainstakeholders in the area (natureconservationists, farmers, representativesfrom the tourist sector), they have identifiedthe most feasible measures in terms of cost-
effectiveness and acceptance for local stakeholders. This includes such measures as enhanced sewage treatmentfacilities or enhanced connection of remote houses to the sewage system.
(ii) Modeling the response of the ecosystem to eutrophication control measures. The model analyses how a reductionP-loading leads to a reduction in the steady state concentration of P in the lakes, and how this changes algae growthand, subsequently, turbidity, macrophyte water plant growth and the parts of the lake with clear water. The model also contains a threshold in lake water turbidity; in line with ecological models of shallow lake dynamics (Scheffer, 1998), itis assumed that at a certain threshold water plants will start growing, reducing sediment resuspension, providing ahabitat for Daphnia (waterflees) and bringing changes in the fish community (from bream to a more diversecommunity dominated by pike). The model contains six formula that capture the response o the ecosystem to nutrient
Case study 7. Efficient nutrient pollution control in the De Wieden wetlands
Figure 10. Model lay out (see text for explanation).
Eutrophication controlmeasures
Benefits of clear water
P-loading
P-concentration
Algae growth
Turbidity
Macrophyte growth
Lake clearness
Net benefits of eutrophication control
impacts
costs
benefits

56
United Nations Development Programme – Global Environment Facility | Global Support Unit (GSU) : http://www.gsu.co.za/
TOOL KIT
Environmental Economics
Tool 5
loading. They deal with phophorus inflow, algae growth, chlorophyl contents and water transparency. The have beenconstructed on the basis of ecological theory, and calibrated with local data on nutrient loading and water quality.These guidelines can not present the formulas themselves, for which the reader is referred to Hein (2006).
(iii) Analyzing the benefits of a switch to clear water. Only the two services nature conservation and recreation willbenefit from a switch to clear water in De Wieden. Regarding nature conservation, a range of threatened species isexpected to benefit from a switch to clear water, and there are no rare or threatened species that would decline fromsuch a shift. As for the recreation service, especially swimmers but also sailors and surfers appreciate clear water,provided that waterplants do not hamper the access of the boats to the lakes. Fisheries and reed cutting will probablynot significantly benefit from a transition to clear water. For local fisheries, the most important species is eel, which isrelatively insensitive to modest changes in P concentrations or a potential shift to clear water. Reed growth also doesnot respond to such changes.
The monetary benefits of a switch to clear water resulting from increased tourism and nature conservation are difficultto quantify. Therefore, the model calculates the net benefits of a reduction in total-P loading for a range of assumedvalues of the increased supply of the nature conservation and recreation service following a switch to clear water. Inother words, the net benefits of eutrophication control measures are calculated as a function of both (i) the level ofeutrophication control and the type of measures implemented (without or with biomanipulation); and (ii) the assumedvalue of the marginal increase in the supply of the two ecosystem services.
(iv) Comparison of the costs and benefits of eutrophication control measures. Figure 11 shows the economicefficiency of reducing the inflow of P in De Wieden for benefits of enhanced recreation and nature conservationvalued at 1 million euro per year. There is a bimodal distribution; there is a local maximum efficiency at zero reductionin P-loading, and a – higher – maximum for a reduction in P-loading of 2 ton/year. The second local maximum
corresponds to the minimum P inflowreduction at which the complete lakechanges from the current turbid waterstate to a clear water state. This Pconcentration is 0.09 mg/l. The modelshows that if the annual marginalbenefits provided by clear water(through enhanced biodiversityprotection and better opportunities forrecreation) are valued at at least 0.2million euro, it is economically efficientto reduce the inflow of total-P with 2ton/year in order to obtain clear water.The model presented in this case studyis now being used by the localWaterboard to analyze the economicimpacts of eutrophication controlmeasures (Hein, 2006).
Figure 11. Net benefits of reducing P loading.
Case study 7. (cont.)

57
United Nations Development Programme – Global Environment Facility | Global Support Unit (GSU) : http://www.gsu.co.za/
TOOL KIT
Environmental Economics
Tool 5
As a consequence of higher sea water temperatures due to global warming and anomalies in El Niño events (whichmay also be related to global warming), the last decade has witnessed unprecedented coral bleaching world-wide.Coral reefs are highly vulnerable to changes in water temperature, which may induce them to excrete their symbioticalgae. The corals change color (the “bleaching”) and will die after several weeks to months. In the Indian Ocean, coralbleaching was particularly severe in 1997 and 1998, which were among the warmest years on record and whichwitnessed strong El Niño events. In some parts of the Indian Ocean, water temperatures rose as much as 4 oC abovethe long term average (Westmacott et al., 2001).
The warm seawater temperatures in the Indian Ocean had a devastating impact on coral reefs throughout the region.Mortality rates went up to 95% in parts of India, Sri Lanka, Maldives, Kenya, Tanzania and the Seychelles. Mostbleaching occurred in water < 15 meter depth but, unlike most other bleaching events, this time also corals in up to50 meter deep water were heavily affected. Furthermore, not only fast growing coral species, but all species of coralwere affected (Wilkinson et al., 1999).
The bleaching and subsequent dying of corals has a number of important ecological impacts. A dead coral is likely tobreak down and form a bed of rubble within a few years. Besides the corals themselves, large numbers of fish,invertebrate and plant species will be affected. This also brings changes in the ecological dynamics of the system. Incase a major part of the coral is damaged, algae may start occupying space on the reef, preventing the return of coral. There are also significant economic effects. Mass coral death may affect local fisheries, tourism and coastalprotection. These impacts and costs are summarized below, with respect to three main ecosystem services providedby coral reefs: (i) fisheries, (ii) tourism, (iii) storm protection. Note that coral reefs may provide a range of otherproducts and services as well, such as the supply of aquarium fish, medicinal compounds, etc. (Moberg and Folke, 1999).
Impacts on fisheries. Reefs generate a variety of seafood products such as fish, mussels, crustaceans, sea cucumbersand seaweeds. Reef-related fisheries constitute approximately 9–12% of the world’s total fisheries, and in some partsof the Indo-Pacific region, the reef fishery constitutes up to 25% of the total fish catch (Cesar, 1996). In the shortterm, few impacts of coral bleaching on local fisheries were noted in two case studies in Kenya and Tanzania(Westmacott et al., 2001). After a year, dead corals were still standing and there was no significant change incommercial fish species, except for a small increase in herbivorous fish that benefited from more abundant algae.However, in the longer term, bleaching significantly reduces the productivity of coral reefs, in particular once the reefsphysically collapse. An indication of the potential costs of a loss of fisheries after such a collapse of the coral isprovided by Cesar (1996), who estimates that large scale physical damage (due to coral mining) in Indonesia causeseconomic losses due to lost fishing opportunities in the order of $94,000 per year per sq km of reef.
Impacts on tourism. For many countries around the Indian Ocean, tourism is a key economic asset. Tourism is thebiggest sector in many of the small island states in the region including the Maldives, Mauritius, the Comores and theSeychelles. For many tourists, diving and snorkeling are among the main reasons to visit these island states (e.g. inthe Maldives, 45% of all tourists dive). Westmacott et al. (2001) showed that coral bleaching reduces the interest ofvisitors in diving, and also reduces the interests of tourists to visit the islands. Hence, coral bleaching reduces boththe expenditure of tourists and the number of tourist arrivals. The economic damage costs of coral bleaching due to aloss of tourism are shown, for selected islands, in Table 15. The losses represent the damage costs for the islandsonly, the loss of welfare for tourists is not included in the figures.
Case study 8. Costs of coral bleaching in the Indian Ocean

58
United Nations Development Programme – Global Environment Facility | Global Support Unit (GSU) : http://www.gsu.co.za/
TOOL KIT
Environmental Economics
Tool 5
Costs of a loss of storm protection. The importance of coral reefs for coastal protection depend on a range of factors,including the proximity of the corals to the coast, the size and depth of the coral reefs and the presence or absence ofother protective systems (such as mangroves). Hence, there is large variation in the importance of this ecosystemservice supplied by coral reefs. The following studies present an indicative estimate of the storm protection value ofcoral reefs. Berg et al. (1998) use the cost of land loss as a proxy for the annual cost of coastal erosion due to coralmining in Sri Lanka. Depending on land price and use, these costs are between US$ 160,000 and US$ 172,000 perkm of reef per year. Cesar (1996) uses a combination of the value of agricultural land, costs of coastal infrastructureand houses to arrive at value for the storm protection service in Indonesia of between US$ 90,000 and US$ 110,000per km of reef per year.
Table 15. Economic costs of tourism losses due to coral bleachingArea / Country Economic damage from loss of tourism due to coral bleaching (US$ million per year)
Zanzibar 4
Mombassa 17
Maldives 3
Case study 8. (cont.)
Source: Westmacott et al. (2001)

Conclusions The Toolkit presents three main approaches that can be followed to analyze and value the economic costs of land
degradation and the benefits of sustainable land management. These approaches are: (i) partial valuation; (ii) total
valuation; and (iii) impact assessment. Partial valuation can be used to analyze the importance of ecosystems, or the
benefits of sustainable management, in relation to the provision of a limited set of ecosystem services. Total valuation
involves valuing all services provided by an ecosystem, and can be used, for instance, to compare the costs and benefits of
different types of land use options (e.g. sustainable versus non-sustainable land use). Impact assessment is a more dynamic
approach that allows analyzing the economic impacts of gradual changes in land management, for instance because of the
adoption of SLM.
In general, there is a high potential to use ecosystem services valuation to support promotion of SLM in developing
countries. In a developing country setting, there are often less financial resources to spend on conservation of natural
resources for the sake of the natural resource in itself. At the same time, there is a high dependency of the national
population on natural resources, in particular in those countries where agriculture and other resources provide the main
source of income for large parts of the population. In these circumstances, sustainable provision of ecosystem services
often makes an important to the income and livelihood of local people, even though these benefits are not always fully
reflected in market transactions. Economic valuation of these services allows therefore obtaining a proper understanding
of these various benefits, and of the need to consider them in land and environmental management decisions in order to
maintain welfare of the local population.
Payment for Ecosystem Services (PES) schemes can make an additional contribution to environmental management,
although caution needs to be taken as their effectiveness strongly depends on the socio-economic setting involved. For
instance, poverty may restrict the effectiveness of PES. Poor stakeholders can not be expected to start paying for ecosystem
services they earlier received for free. In addition, transaction costs may be high, as there is a need to monitor the supply
of the ecosystem service over time, and as a trustworthy mechanism has to be set up to organize the transfer of payments
among stakeholders.
A number of general recommendations can be provided for the economic analysis of land degradation and SLM. First, the
objective of the study needs to be clear, as the objective determines the scale and the system boundaries, the appropriate
valuation methods, and the data requirements. Second, care needs to be taken to analyze both the ecological and the
economic aspects of the ecosystem services involved. In particular for the regulation services, it is often as time-consuming
to quantify the service in ecological or biophysical terms (Tool 3) as it is to conduct the actual valuation itself (Tool 4).Third,
the uncertainties in the analysis need to be discussed, the impact of the study will depend on the amount of credit it will
obtain and it is important to communicate how reliable the study’s outcomes are. Fourth, valuation studies require an
interdisciplinary approach involving economists, ecologists, hydrologist, sociologists, etc., depending on the functions and
environmental setting to be studied.
In view of the general importance of economic arguments in decision making on land use, it is anticipated that this Toolkit
can support the design and implementation of land use policies. Often, there is a much smaller difference between
economic efficient and sustainable land use than generally perceived.
59
United Nations Development Programme – Global Environment Facility | Global Support Unit (GSU) : http://www.gsu.co.za/
Con
clu
sion
s &
rec
omm
end
atio
ns

60
United Nations Development Programme – Global Environment Facility | Global Support Unit (GSU) : http://www.gsu.co.za/
Ref
eren
ces Aldred, J. 1994. Existence value, welfare and altruism. Environmental Values 3 : 381-402.
Arrow, K., R. Solow, P.R. Portney, E.E. Learner, R. Radner, H. Schuman, 1993. Report of the NOAA Panel on Contingent
Valuation. Federal Reg. 58, Washington, DC
Aylward, B. and K. Lindberg, 1999. Price Responsiveness in the Developing Country Nature Tourism Context: Review and
Costa Rican Case Study. Journal of Leisure Research, Vol. 31, 1999.
Barbier, E.B., M. Acreman and D. Knowler, 1997. Economic valuation of wetlands; a guide for policy makers and planners.
Ramsar Convention Bureau, Gland, Switzerland.
Barbier, E.B. and A. Markandya, 1990. The conditions for achieving environmentally sustainable development. European
Economic Review 34: 659-669.
Becker, C.D. and E. Ostrom, 1995. Human ecology and resource sustainability: the importance of institutional diversity.
Annual Review of Ecology and Systematics, 26: 113-133.
Berg, H., Öhman, M. C., Troeng, S., & Lindén, O., 1998. Environmental Economics of Coral Reef Destruction in Sri Lanka.
AMBIO, Vol. 27, No. 8, pp. 627–634.
Berkes F, and C. Folke, 1998. Linking Social and Ecological Systems. Management practices and social mechanisms for
building resilience. Cambridge, UK: Cambridge University Press, 1998.
Blum, E., 1993. Making biodiversity profitable: A case study of the Merck/INBio agreement. Environment 35: 17-45
Bosch, J.M., Hewitt, J.D., 1982. A review of catchment experiments to determine the effect of vegetation changes on water
yield and evapotranspiration. Journal of Hydrology 55, 3 – 23.
Boxall, Peter C. et al., 1996. A Comparison of Stated Preference Methods for Environmental Valuation, Ecological Economics
18, 243- 53.
Brander, L.M., R. Florax and J. Vermaat, 2004. The Empirics of Wetland Valuation: A Comprehensive Summary and a Meta-
Analysis of the Literature. Report Institute for Environmental Studies (IVM), Vrije Universiteit, Amsterdam, The
Netherlands.
Brouwer, R., Langford, I.H., Bateman, I.J. and Turner, R.K., 1997. A meta-analysis of wetland contingent valuation studies.
CSERGE Working Paper, University of East Anglia, Norwich, UK.
Carpenter, R.S., D. Ludwig and W.A. Brock, 1999. Management of eutrophication for lakes subject to potentially irreversible
change. Ecological applications 9: 751-771.
Cash, D.W. and S.C. Moser, 1998: Cross-scale interactions in assessments, information systems, and decision-making. In:
Critical Evaluation of Global Environmental Assessments, Global Environmental Assessment Project, Harvard
University, Cambridge, MA.
Cesar, H. S. J., 1996. Economic analysis of Indonesian coral reefs. Working Paper Series “Work in Progress”, World Bank,
Washington DC. 97 pp.
Champ, P., K. Boyle and T.C. Brown, 2003. A Primer on Nonmarket Valuation. Kluwer Academic Publishers, Dordrecht, the
Netherlands
Chiang, A.C., 1992. Elements of dynamic optimization. McGraw-Hill Inc., Singapore.
Clark, C.W. 1976. Mathematical Bioeconomics: the optimal management of renewable resources. Wiley-Interscience 1976,
New York pp18-21 and 42-44.
References

61
United Nations Development Programme – Global Environment Facility | Global Support Unit (GSU) : http://www.gsu.co.za/
Ref
eren
ces
ReferencesCostanza, R., R. d’Arge, R.S. de Groot, S. Farber, M. Grasso, B. Hannon, K. Limburg, S. Naeem, R.V. O'Neill, J. Paruelo, R.G. Raskin,
P. Sutton and M. van den Belt, 1997a: The value of the world’s ecosystem services and natural capital. Nature 387: 253-
260.
Cooke, P.A., 1998. The effect of environmental good scarcity on own-farm labor allocation: the case of agricultural
households in rural Nepal. Environment and Development Economics, 3: 443-469
Cummings, R.G. and G.W. Harrison, 1995. The measurement and decomposition of nonuse values: a critical review.
Environmental and Resource Economics 5: 225-47.
Dasgupta, P., 1993. Natural resources in an age of substitutability. In A.V. Kneese and J.L. Sweeney (eds.) Handbook of Natural
Resource and Energy Economics, Vol 3. Elsevier, Amserdam
De Groot, R.S., M. A.Wilson and R.M.J. Bouman, 2002: A typology for the classification, description and valuation of ecosystem
functions, goods and services. Ecological Economics: 393-408.
Diamond, P.A., and J.A. Hausman, 1994. Contingent valuation: is some number better than no number? Journal of Economic
Perspectives 8: 45-66
Dillon, John L. /Burley, H.T., 1961. A note on the economics of grazing and its experimental investigation. Australian Journal
of Agricultural Economics 5: 123-132.
Ehrlich, P. and A. Ehrlich, 1981. Extinction: the causes and consequences of the disappearance of species. Random House,
New York.
EPA, 2006. Ecological Risk Assessment in Superfund - Glossary of Terms. Environmental Protection Agency, Ecological
Technical Center, Chicago.
FAO, 2005. Conference Roceedings of the FAO/Netherlands 2005 Water for Food and Ecosystems Conference. January 2005,
The Hague, the Netherlands.
Faustmann, M., 1849. On the determination of the value which forestland and immature stands pose for forestry. Reprinted
in Journal for Forest Economics 1: 7-44.
Freeman, A. M., 1993. The measurement of environmental values and resources: theory and methods. Resources for the
Future, Washington D.C.
Geoghegan, J., L. Wainger, and N. Bockstael, 1997. Spatial landscape indices in a hedonic framework: An ecological
economics analysis using GIS. Ecological Economics 23: 251–264
Gordon, H.S., 1954. The economic theory of a common property resource. Journal of Political Economy 62: 124-142
Gordon, J. and Davis, L., 2003, Valuing honeybee pollination, Rural Industries Research and Development Corporation
(RIRDC), Project No. CIE-15A, Pub No. 03/077.
Green, C., Tunstall, S., Garner, J., Ketteridge, A-M., 1994. Benefit transfer: rivers and coasts. Paper prepared for the CEGB
meeting on benefit transfer, Flood Hazard Research Centre, Middlesex University, UK, H.M. Treasury, Publication No.231.
Haab, Timothy, and Kenneth McConnell. Valuing Environmental and Natural Resources: The Econometrics of Non-Market
Valuation . Cheltenham, UK: Edward Elgar, 2002, 326 pp.
Hanley, N., and Spash, C.L., 1993. Cost-Benefit Analysis and the Environment. Edward Elgar, Vermont, USA.
Hayashi, S., S. Murakami, and M.Watanabe, 2004: Simulation of water runoff using estimated global precipitation data:Taking
the upper reaches of the Changjiang River as an example. Journal of Geographical Sciences, 59, 125–135.
Hanemann, W.M., 1995. Contingent valuation and economics. In: K. Willis and J. Corkindale (eds.). Environmental valuation:
new perspectives. CAB International, Wallingford, UK. pp. 79-117.

62
United Nations Development Programme – Global Environment Facility | Global Support Unit (GSU) : http://www.gsu.co.za/
Ref
eren
ces Hanley, N., and Spash, C.L., 1993. Cost-Benefit Analysis and the Environment. Edward Elgar, Vermont, USA.
Hanley, P., 1999. Cost-benefit analysis of environmental policy and management. In: J.C.J.M. van de Bergh (ed.), 1999:
Handbook of Environmental Resource Economics. Edward Elgar, Cheltenham, UK, pp. 824-836.
Harris, G., 1999. This is not the end of limnology (or of science): the world may be a lot simpler than we think. Freswater
Biology 42: 689-706.
Hein, L., K. van Koppen, R.S. de Groot and E.C. van Ierland, 2006. Spatial scales, stakeholders and the valuation of ecosystem
services. Ecological Economics 57, 209-228.
Hein, L., 2006. Cost-efficient eutrophication control in a shallow lake ecosystem subject to two steady states. Ecological
Economics 59, 429-439.
Holling, C.S., 1992. Cross-scale morphology, geometry and dynamics of ecosystems. Ecological Monographs 62: 447-502.
Holling, C.S., L.H. Gunderson and G.D. Peterson, 2002. Sustainability and Panarchies. In: Gunderson, L.H. and C.S. Holling (eds.),
2002: Panarchy, Understanding Transformations in Human and Natural Systems. Island Press, Washington, London, pp.
63-103.
Howarth, R.B and R.B. Norgaard, 1993. ‘Intergenerational transfers and the social discount rate’. Environmental and Natural
Resource Economics 3: 337-358
Howarth, R.B., 1996. Discount rates and sustainable development. Ecological Modeling 92: 263-270.
Hueting, R., 1980. New scarcity and economic growth. Agon-Elsevier, Amsterdam/New York, 1980.
Hueting, R., L. Reijnders, B. de Boer, J. Lambooy and H. Jansen, 1998.The concept of environmental function and its valuation.
Ecological Economics 25: 31-35
Hufschmidt, M.M, James, D.E., Meister, A.D., Bower, B.T. and Dixon, J.A., 1983. Environment, natural systems and development,
An economic valuation guide. The John Hopkins university press, London.
Infield, M., 2001. Cultural values: a forgotten strategy for building community support for protected areas in Africa.
Conservation Biology 15: 800-802.
Jackson, J.B.C., M. X. Kirby, W. H. Berger, K. A. Bjorndal, L.W. Botsford, B. J. Bourque, R. H. Bradbury, and R. Cooke, 2001. Historical
Overfishing and the Recent Collapse of Coastal Ecosystems. Science 293: 629-637.
Johansson, P., 1999. Theory of economic valuation of environmental goods and services. In: Handbook of Environmental
Resource Economics. J.C.J.M. van de Bergh (ed), 1999. Edward Elgar, Cheltenham, UK, pp. 747-754.
Kim, C. W., T. Phipps, and L. Anselin (1998) "Measuring the benefits of air quality improvement: A spatial hedonic approach,"
American Journal of Agricultural Economics, 80 (5), 1183-1183.
Klein, A.M., I. Steffan-Dewenter and T.Tscharntke, 2003. Bee pollination and fruit set of C. arabica and C. canephora. American
Journal of Botany 90, 153-157.
Kolstad, C.D., 2000. Environmental economics. Oxford University Press, New York, Oxford.
Kotey, E.N.A., Francois, J., Owusu J.G.K., Yeboah, R., Amanor, K. and Antwi, L. 1998. Place. Policy that works for forests and
people series no.4. Ghana. IIED, London.
Kramer, R.A., N. Sharma, and M. Munasinghe, 1995. Valuing tropical forests. Methodology and case study for Madagascar.
World Bank Environment Paper 13. World bank. Washington, DC.
Le Goffe, P. (2000) "Hedonic pricing of agriculture and forestry externalities," Environmental & Resource Economics, 15 (4),
397-401.
Levin, S.A., 1992. The problem of pattern and scale in ecology. Ecology 73: 1943-1967.
References

63
United Nations Development Programme – Global Environment Facility | Global Support Unit (GSU) : http://www.gsu.co.za/
Ref
eren
ces
ReferencesLittle, I.M.D. and J.A. Mirrlees, 1974. Project appraisal and planning for developing countries. Heinemann, London.
Little, I.M.D. and M.F. Scott, 1976. Using shadow prices. Heinemann, London.
Macedo, Paulo Brigido Rocha, "Hedonic Price Models with Spatial Effects: An Application to the Housing Market of Belo
Horizonte, Brazil," Revista Brasileira de Economia; 52(1), Jan. March 1998, pages 63-81.
Mäler, K.G. and Jeffrey R. Vincent Handbook of Environmental Economics, Volume 2 : Valuing Environmental Changes
(Handbooks in Economics). North Holland, Amsterdam.
Martinez-Alier, J., G. Munda and J. O'Neill. 1998. Weak comparability of values as a foundation for ecological economics.
Ecological Economics, 26(3): 277-286.
Millennium Ecosystem Assessment, 2003. Ecosystems and human well-being: a framework for assessment. Report of the
conceptual framework working group of the Millennium Ecosystem Assessment. Island Press, Washington, DC.
Millennium Ecosystem Assessment, 2005. Ecosystems & Human Well-Being; a global Assessment.Volume 1 to 4. Island Press,
Washington, DC.
Moberg, F. and C. Folke, 1999. Ecological goods and services of coral reef ecosystems. Ecological Economics 29, 215–233.
Munasinghe, M. and A. Schwab, 1993. Environmental economics and natural resource management in developing countries.
World Bank, Washington, DC.
Munda, G. 2004. Social multi-criteria evaluation (SMCE): methodological foundations and operational consequences.
European Journal of Operational Research. 158 (3): 662-677.
Nordhaus, W.D., 1994. Managing the global commons: the economics of climate change. MIT Press, Cambridge, USA.
Nunes, P.A.L.D. and J.C.J.M. van den Bergh, 2001. Economic valuation of biodiversity: sense or nonsense ? Ecological
Economics 39: 203-222.
OECD, 1995. The economic appraisal of environmental projects and policies, a practical guide. OECD, Paris.
OECD, 2006. Sustainable Development, Sustainable Development's glossary. OECD, Paris.
O’Neill, R.V. and A.W. King, 1998. Hommage to St Michael: or why are there so many books on scale ? In: D.L. Peterson and V.T.
Parker (editors) Ecological scale: theory and applications. Columbia University Press, New York, pp 3-15.
O’Neill, J. 2001. ‘Representing People, Representing Nature, Representing the World’, Environment and Planning C:
Government and Policy, 19: 483-500.
O’Riordan,T., C. Cooper, A. Jordan, S. Rayner, K Richards, P. Runci and S.Yoffe, 1998. Institutional frameworks for political action.
In: Human choice and climate change, Vol. 1: The societal framework. Battelle Press, Columbus, OH, pp. 345-439.
Pagiola, S. and G. Platais. 2002. Market-based Mechanisms for Conservation and Development:The Simple Logic of Payments
for Environmental Services. In Environmental Matters–Annual Review, July 2001–June 2002 (FY 2002). Washington, DC:
World Bank’s Environment Department.
Pearce, D.W., A. Markandya, and E.B. Barbier, 1989. Blueprint for a green economy. Earthscan, London.
Pearce, D., E.B. Barbier, A Markandya. 1990. Sustainable Development: Economics and Environment in the Third World.
Edward Elgar, London.
Pearce, D.W., and R.K.Turner, 1990. Economics of natural resources and the environment. Harvester Wheatsheaf, Herfordshire,
UK.
Pearce, D.W. and C.G.T. Pearce, 2001. The value of forest ecosystems. A report to the Secretariat of the Convention on
Biological Diversity, Montreal, Canada

64
United Nations Development Programme – Global Environment Facility | Global Support Unit (GSU) : http://www.gsu.co.za/
Ref
eren
ces Perman, R., Ma, Y., McGilvray, J. and Common, M., 1999. Natural resource and environmental economics, 2nd edition.
Longman, London/New York.
Pieterse, N.M., W. Bleuten and S.E. Jorgensen, 2002. Contribution of diffuse sources to nitrogen and phophorus loads in
lowland river tributaries. Journal of Hydrology 271: 231-225.
Posey, D.A., 1999. Cultural and spiritual values of biodiversity. A complementary contribution to the Global Biodiversity
Assessment. Intermediate Technology Publications, London.
Ricketts, T. H.; Daily, G. C.; Ehrlich, P. R.; Michener, C. D. (2004) Economic value of tropical forest to coffee production.
Proceedings of the National Academy of Sciences of the United States of America, 101: 12579 -12582.
Roubik, D.W., 2002.The value of bees to the coffee harvest. Nature 417 (13 June 2002).
Ruijgrok, E, 2004. Valuation of Nature and Environment; a historical overview of Dutch socio-economic valuation studies.
Witteveen and Bos Consultancy, Rotterdam.
Scheffer, M., 1998 Ecology of shallow lakes. Kluwer Academin Publishers, Dordrecht, the Netherlands.
Scheffer, M., W. Brock, and F. Westley, 2000: Socio-economic mechanisms preventing optimum use of ecosystem services: an
interdisciplinary theoretical analysis. Ecosystems 3: 451-471.
Schmeer, Kammi. 1999. Guidelines for Conducting a Stakeholder Analysis. November 1999. Bethesda, MD: Partnerships for
Health Reform, Abt Associates Inc.
Schoorl, J.M., A.Veldkamp and J.Bouma. 2002. Modeling water and soil redistribution in a dynamic landscape context. Soil
Science Society of America Journal 66: 1610-1619.
Seenprachawong, U., 2003. Economic valuation of coral reefs at Phi Phi Islands, Thailand. International Journal of Global
Environmental Issues 3, 104-114
Shanmugam, K. R. (2000) "Valuations of life and injury risks - Empirical evidence from India," Environmental & Resource
Economics, 16 (4), 379-389.
Southwick, E.E., & Southwick L., 1992. Estimating the economic value of honey bees (Hymenoptera: Apidae) as agricultural
pollinators in the United States. Journal of Economic Entomology 85: 621-633.
Swanson, T., 1997. Global action for biodiversity. Earthscan, London
Tansley, A.G., 1935: The use and abuse of vegetational terms and concepts. Ecology 16: 284–307.
Terborgh, J.W., 1999. Requiem for nature. Island Press, Washington.
Tietenberg,T.H., 2000. Environmental and Natural Resource Economics (5th edition). Addison Wesley Longman, Inc., Reading,
Massachusetts, USA.
Tomich,T.P., van Noordwijk, M., Budidarsono, S., Gillison, A., Kusumanto,T., and Murdiyarso, D. 1998. Alternatives to slash-and-
burn in Indonesia: Summary Report and Synthesis of Phase II. ICRAF, Bogor, Indonesia.
Turner, R.K., C.J.M. van den Bergh, T. Soderqvist, A. Barendregt, J. van der Straaten, E. Maltby, E.C. van Ierland, 2000: Ecological-
economic analysis of wetlands: scientific integration for management and policy. Ecological Economics 35: 7-23.
UNEP, 2005. Discussion Paper Multilateral Environmental Agreements and Pro-Poor Markets for Ecosystem Services. UNEP,
Nairobi (19 pp).
Van Beukering, P.J.H., H.S.J. Cesara and M.A. Janssen, 2003. Economic valuation of the Leuser National Park on Sumatra,
Indonesia. Ecological Economics 44: 43-62
Varian, H.R., 1993. Intermediate micro-economics. 3rd editionW.W. Norton & Company, New York.
References

65
United Nations Development Programme – Global Environment Facility | Global Support Unit (GSU) : http://www.gsu.co.za/
Ref
eren
ces
ReferencesVan den Bergh, J.C.J.M., 1996. Ecological economics and sustainable development – theories, methods and applications.
Edward Elgar, Cheltenham, UK.
Van der Pol, F. and B. Traore, 1993. Soil nutrient depletion by agricultural production in Southern Mali. Nutrient Cycling in
Agroecosystems 36, 79 – 90.
Voinov, A., R. Costanza, L. Wainger, R. Boumans, F. Villa, T. Maxwell and H. Voinov, 1999. Patuxent landscape model: integrated
ecological economic modeling of a watershed. Environmental Modeling and Software 14: 473-491.
Wathern, P., S.N.Young, I.W. Brown and D.A. Roberts, 1986. Ecological evaluation tecniques. Landscape Planning 12: 403-420.
Westmacott, S:., H.S.J. Cesar, L. Petsoede and O. Linden, 2001. Coral Bleaching in the Indian Ocean: Socio-Economic
Assessment of Effects.
Whittington, D., 1998. Administering Contingent Valuation Surveys in Developing Countries.World Development,Vol. 26, No.
1, pp. 21-30, 1998
Willig, R., 1976. consumer’s surplus without apology. American Economic Review 66: 589-97.
Willis, K.G. and Garrod, G.D., 1995. Transferability of benefit estimates. In: Willis, K.G. and Corkindale, J.T., Editors, 1995.
Environmental valuation: new perspectives, CAB International, Wallingford, UK.
Wilkinson, C. R., Lindén, O., Cesar, H. S. J., Hodgson, G., Rubens, J., & Strong, A. E., 1999. Ecological and socioeconomic impacts
of the 1998 coral mortality in the Indian Ocean: An Enso impact and a warning of future change?. Ambio 28: 188–196.
Young, R.A., 2005. Determining the economic value of water : concepts and methods. Resources for the Future, Washington
D.C. .

66
United Nations Development Programme – Global Environment Facility | Global Support Unit (GSU) : http://www.gsu.co.za/
Ap
pen
dix
Appendix 1. Glossary
Agro-ecosystem: a dynamic association of crops, pastures, livestock, other flora and fauna, atmosphere, soils, and water.Agroecosystems are contained within larger landscapes that include uncultivated land, drainage networks, ruralcommunities, and wildlife.
Bequest Value: the value that people derive from knowing that their off spring will be able to benefit from an ecosystemservice.
Biomass: the total weight of a designated group of organisms in a particular area.
Consumer surplus: the difference between the price actually paid for a good, and the maximum amount that anindividual is willing to pay for it. For instance, if a person is willing to pay up to $10 for something, but the market price is$4, then the consumer surplus for that item is $6.
Compensating variation: the amount of money that leaves a person as well off as he was before a change. Thus, itmeasures the amount of money required to maintain a person’s satisfaction, or economic welfare, at the level it was atbefore the change.
Contingent Valuation: a formal survey technique that requires respondents to specify their preferences for differentgoods or services and how much they would pay to obtain them.
Cost-benefit analysis: a comparison of economic benefits and costs to society of a policy, program, or action.
Cultural services: the benefits people obtain from ecosystems through recreation, cognitive development, relaxation, andspiritual reflection. In this Toolkit, the habitat service (i.e. the benefits people derive from the protection of biodiversityand nature for the sake of nature itself ) is also included as a cultural service.
Demand curve: the graphical representation of the demand function. The demand curve indicates how many units of agood will be purchased at a certain price. In general, at higher prices, less will be purchased, so the demand curve slopesdownward. The market demand function is calculated by adding up all of the individual consumers’ demand functions.
Discount rate: the rate used to reduce future benefits and costs to their present time equivalent.
Economic efficiency: the allocation of goods or services to their highest relative economic value.
Ecological processes: the physical, chemical, and biological processes that maintain and support the functioning of theecosystem. Examples of ecosystem processes are denitrification, primary production, and evapotranspiration.
Ecosystem approach: the ecosystem approach is a strategy for the integrated management of land, water and livingresources that promotes conservation and sustainable use in an equitable way. An ecosystem approach is based on theapplication of appropriate scientific methodologies focused on levels of biological organization, which encompass theessential structure, processes, functions and interactions among organisms and their environment.
Ecosystem function: the capacity of an ecosystem to provide goods and services that satisfy human needs, directly orindirectly. Ecosystem functions depend upon the state and the functioning of the ecosystem. For instance, the function‘production of firewood’ is based on a range of ecological processes involving the growth of plants and trees that usesolar energy to convert water, plant nutrients and CO2 to biomass.
Ecosystem services: the goods or services provided by the ecosystem to society. In order for an ecosystem to provideservices to humans, some interaction with, or demand from, people for the good or service concerned is required.
Appendix

67
United Nations Development Programme – Global Environment Facility | Global Support Unit (GSU) : http://www.gsu.co.za/
Ap
pen
dix
AppendixEquivalent variation: the amount of money that leaves a person as well off as they would be after a change. Thus, itmeasures the amount of money required to maintain a person’s satisfaction, or economic welfare, at the level it would beat after a change.
Eutrophication: The process by which a body of water accumulates nutrients, particularly nitrates and phosphates. Thisprocess can be accelerated by nutrient-rich runoff or seepage from agricultural land or from sewage outfalls, leading torapid and excessive growth of algae and aquatic plants and undesirable changes in water quality.
Existence value: the value that people place on knowing that something exists, even if they will never see it or use it.
Externalities: uncompensated side effects of human actions. For example, if a stream is polluted by runoff fromagricultural land, the people downstream experience a negative externality.
Fixed costs: production costs that are not related to the level of production; also referred to as overhead costs.
Geographical Information System (GIS): a computer mapping system that links databases of geographically-basedinformation to maps that display the information.
Habitat: The place where a population of plants or animals and its surroundings are located, including both living andnon-living components.
LDC: Least Developed Country
Market failure: the inability of markets to reflect the full social costs or benefits of a good, service, or state of the world.Therefore, markets will not result in the most efficient or beneficial allocation of resources.
Net economic benefit: the net economic benefit is the total economic benefit received from a change in the state of agood or service, measured by the sum of consumer surplus plus producer surplus, less any costs associated with thechange.
Net Present Value (NPV): the sum of the present and discounted future flows of net benefits (expressed as e.g. US$/ha).A discount rate is used to reduce future benefits and costs to their present time equivalent.
Non-use values: values that are not associated with actual use, or even the option to use a good or service.
Opportunity cost: the value of the best alternative to a given choice, or the value of resources in their next best use. Forinstance, the opportunity costs of a natural park may be the value that could be derived from converting the area toagricultural land use. The opportunity costs may be higher or lower than the value of the resource under presentmanagement.
Option value: the value that people place on having the option to enjoy something in the future, although they may notcurrently use it.
Producer surplus: the difference between the total amount earned from a good (price times quantity sold) and theproduction costs.
Provisioning services: the goods and services extracted from an ecosystem, either through harvesting (collecting apiece of fruit in a forest), or through extensive or intensive agriculture. Valuation of these services always needs toconsider the amount of effort (i.e. costs) required to obtain or produce the good or service.
Public goods: In the case of public goods, the availability of a good to one individual does not reduce its availability toothers (non-rivalry) and the supplier of the good cannot exclude anybody from consuming it (non-excludability). Forexample, safety provided by dykes is a pure public good.

Regression analysis: a statistical process for fitting a line through a set of data points. It gives the intercept and slope(s)of the “best fitting” line. Thus it tells how much one variable (the dependent variable) will change when other variables(the independent, or explanatory, variables) change.
Regulation services: services provided by the ecosystem involving the regulation of climate, hydrological and bio-chemical cycles, earth surface processes, and biological processes.
Renewable resource: a resource that is capable of being replenished through natural processes (e.g., the hydrologicalcycle) or its own reproduction, generally within a time-span that does not exceed a few decades. Technically, metal-bearing ores are not renewable, although metals themselves can be recycled.
Shadow price: price adjusted to eliminate any distortions caused by politics or market imperfections in order to reflectthe true willingness to pay.
SIDS: Small Island Developing State
Substitute goods: goods that you might purchase instead of a particular good. For example, different types of bread aresubstitutes for each other.
Supply Function : the mathematical function that relates price and quantity supplied for goods or services. The supplyfunction tells how many units of a good that producers are willing to produce and sell at a given price.
Supply Curve: the graphical representation of the supply function. Because producers would like to sell more at higherprices, the supply function slopes upward.
Sustainable development: development that meets the needs of the present without compromising the ability of futuregenerations to meet their own needs
Total economic value: the sum of the direct use, indirect use, option and non-use values for a good or service.
Threshold: when used in reference to a species, an ecosystem, or another natural system, it refers to the level beyondwhich further deterioration is likely to precipitate a sudden adverse, and possibly irreversible, change.
Use value: value derived from actual use of a good or service. Uses may include indirect uses. For example, the bufferingimpact of upstream forests on downstream water flows provides an indirect use value of the forest for downstream waterusers.
Variable costs: production costs that change when the level of production changes, so that when more is produced thecosts increase; as opposed to fixed costs.
Wetlands: lands where water saturation is the dominant factor in determining the nature of soil development and thetypes of plant and animal communities
Willingness to Pay: the amount of money (or goods or services) that a person is willing to give up to obtain a particulargood or service.
68
United Nations Development Programme – Global Environment Facility | Global Support Unit (GSU) : http://www.gsu.co.za/
Ap
pen
dix
Appendix

Appendix 2. Useful references on the internet
Association of Environmental and Resource Economists http://www.aere.org/
Ecosystem Services Project http://www.ecosystemservicesproject.org Various publications on methods and
applications in the field of ecosystem services valuation, with a focus on Australia.
Ecosystem Valuation Website : www.ecosystemvaluation.org Detailed information on valuation methods.
ENVALUE: http://www.epa.nsw.gov.au/envalue/ A searchable, global environmental valuation database developed by the
NSW EPA (Australia). Systematic collection of environmental valuation studies presented in an on-line database.
Summaries and results reported in the database were subject to a process of peer review.
Environmental Valuation & Cost-Benefit News : http://envirovaluation.org/ Empirical cost-benefit and environmental
value estimates
Environmental Valuation Reference Inventory (EVRI) http://www.evri.ec.gc.ca/evri/
Searchable storehouse of over 800 empirical studies on the economic value of environmental benefits. Information in the
EVRI is available to subscribers only
International Society for Ecological Economics http://www.ecologicaleconomics.org/
OECD : www.oecd.org. Statistical information plus technical reports in the field of environmental economics and
sustainable development.
Resources for the Future http://www.rff.org/ Home page for Resources for the Future, a nonprofit organization that
conducts research on environmental and natural resource issues
World Bank Environmental Valuation http://wbln0018.worldbank.org/environment/EEI.nsf/all/ General overview of
economic valuation of environmental impacts including detailed information and links to case studies and applications.
69
United Nations Development Programme – Global Environment Facility | Global Support Unit (GSU) : http://www.gsu.co.za/
Ap
pen
dix
Appendix