Embed Size (px)
Citation preview

Environmental Domains of Antarctica Version 2.0 Final Report Fraser Morgan Landcare Research Private Bag 92-170 Auckland New Zealand Gary Barker, Craig Briggs, Robbie Price Landcare Research Private Bag 3127 Hamilton New Zealand Harry Keys Department of Conservation Turangi Landcare Research Contract Report: LC0708/055 PREPARED FOR: Antarctica New Zealand Department of Conservation DATE: November 2007

2
Reviewed by: Approved for release by:
Gary Barker Alison Collins Scientist Science Manager Landcare Research Landcare Research
© Landcare Research New Zealand Ltd 2007 No part of this work covered by copyright may be reproduced or copied in any form or by any means (graphic, electronic or mechanical, including photocopying, recording, taping, information retrieval systems, or otherwise) without the written permission of the publisher.
Disclaimer The findings in this report are specific to this project. Landcare Research accepts no responsibility where information in the report is used for any other purpose, and will not be liable for any loss or damage suffered as a result of such other use.
Landcare Research

3
Landcare Research
Contents
1. Introduction .................................................................................................................... 5
2. Background .................................................................................................................... 6
2.1. Antarctic Treaty .................................................................................................. 6 2.2. Environmental Domains ..................................................................................... 6 2.3. Classifications within Antarctica ........................................................................ 7 2.4. Phases of Classification Development ............................................................... 7
3. Methods ........................................................................................................................ 10
3.1. Classification overview .................................................................................... 10 3.2. Environmental distance .................................................................................... 11 3.3. Changes within Version 2.0 of the continental scale classification ................. 13 3.4. Creation of Data Layers – Climate ................................................................... 13
Air temperatures ............................................................................................... 13 Mean annual air temperature ............................................................................ 16 Seasonal air temperature range ......................................................................... 17 Wind ................................................................................................................. 18 Mean annual wind speed .................................................................................. 20 Estimated solar radiation at top of atmosphere ................................................ 21 Period of year with normal diurnal pattern ....................................................... 22
3.5. Creation of Data Layers – Land/Ice ................................................................. 23 Slope (with square root transformation) ........................................................... 23 Land (Ice) Cover ............................................................................................... 24 Geology ............................................................................................................ 25
3.6. Classification Process ....................................................................................... 29 Data preparation ............................................................................................... 29 Non-hierarchical classification ......................................................................... 29 Hierarchical classification ................................................................................ 29
3.7. Classification raster dataset .............................................................................. 30 3.8. ASPA/ASMA Analysis .................................................................................... 30
4. Results .......................................................................................................................... 31
4.1. Environment Labels .......................................................................................... 32 Environment A – Antarctic Peninsula northern geologic ................................. 38 Environment B – Antarctic Peninsula mid-northern latitudes geologic ........... 40 Environment C – Antarctic Peninsula southern geologic ................................. 42 Environment D – East Antarctic coastal geologic ............................................ 44 Environment E – Antarctic Peninsula and Alexander Island main ice fields ... 46 Environment F – Larsen Ice Shelf .................................................................... 48 Environment G – Antarctic Peninsula offshore island geologic ...................... 50 Environment H – East Antarctic low latitude glacier tongues ......................... 52 Environment I – East Antarctic ice shelves ...................................................... 54 Environment J – Southern latitude coastal fringe ice shelves .......................... 56 Environment K – Northern latitude ice shelves ................................................ 58 Environment L – Continental coastal-zone ice sheet ....................................... 60 Environment M – Continental mid-latitude sloping ice ................................... 62 Environment N – East Antarctic inland ice sheet ............................................. 64 Environment O – West Antarctic Ice Sheet ...................................................... 66 Environment P – Ross and Ronne-Filchner ice shelves ................................... 68 Environment Q – East Antarctic high interior ice sheet ................................... 70

4
Landcare Research
Environment R – Transantarctic Mountains geologic ...................................... 72 Environment S – McMurdo – South Victoria Land geologic .......................... 74 Environment T – Inland continental geologic .................................................. 76 Environment U – North Victoria Land geologic .............................................. 78
5. Conclusions and Recommendations ............................................................................. 80
5.1. Heterogeneity of the classification ................................................................... 80 5.2. Spatial location of Environments ..................................................................... 80 5.3. Future Directions .............................................................................................. 82
6. Acknowledgements ...................................................................................................... 83
7. References .................................................................................................................... 84
Appendices ................................................................................................................... 85

5
Landcare Research
1. Introduction
Antarctica is an internationally managed, natural reserve devoted to peace and science, designated as such by the Antarctic Treaty. As a party to the Protocol on Environmental Protection (1991) and to the Antarctic Treaty (1959), New Zealand has committed itself to the comprehensive protection of Antarctica and its dependent and associated ecosystems.
New Zealand’s commitment to the Antarctic was confirmed in the Government’s Revised New Zealand Statement of Strategic Intent, released by the Antarctic Policy Unit of the Ministry of Foreign Affairs and Trade (May 2002). Antarctica New Zealand produced ‘Ross Sea region 2001: A State of the Environment Report for the Ross Sea region of Antarctica’ (Waterhouse 2001). This report was a major achievement for Antarctica New Zealand, the New Zealand Government and the Antarctic Science community, and has been extremely well received internationally (Walton 2002).
Findings of the report noted by Walton (2002) include “the indication that many potentially valuable data are either not collected systematically or are not easily available to assess the extent and importance of human pressures at a regional level”. The Ross Sea region Report (Waterhouse 2001) identified the need for a regionally based approach to environmental management.
To contribute to this need, the authors of the present report have developed a physical environment-based classification for the whole Antarctic Continent. This classification built on the success Landcare Research scientists have achieved in developing a classification of New Zealand’s terrestrial environments (Land Environments of New Zealand or LENZ – Leathwick et al. 2002b). The classification was designed to provide a data-derived, spatially explicit delineation of environmental variables in Antarctica, to be used for a range of management activities including identification of priority sites for protection, environmental monitoring, and assessment of risks associated with human activities.
After attempting a pilot study in the Dry Valley region of South Victoria Land (McMurdo Dry Valleys) a classification for the whole Antarctic Continent was commenced. Agencies of the New Zealand Government (Antarctica New Zealand, Department of Conservation, Ministry of Foreign Affairs and Trade, Ministry for the Environment), commissioned Landcare Research to validate and develop the classification further in three distinct directions:
• a physical environment-based classification of the whole Antarctic continent
• a dual-purpose review of the Antarctic Specially Protected Areas (ASPA) and Antarctic Specially Managed Areas (ASMA) network;
• creation of a regional subset of the classification for the Larsemann Hills region in East Antarctica
Over the 3 years of development work put into the classification, a number of corrections, data quality and quantity improvements and methodological decisions were made and included in the updated version of the Environmental Domains of Antarctic classification, hereafter designated EDA Version 2.0. Consequently, this report intends to be a provisional guide to users of the classification, explaining the changes and work that has been done to improve the classification. The report aims to provide more detail about the classification than just the brief domain descriptions and touch on more advanced issues such as potential uses along with concepts such as heterogeneity, spatial error, classification limitations, and an explanation of the hierarchal dendrogram, which is a key component to understand the classification.
6
Landcare Research
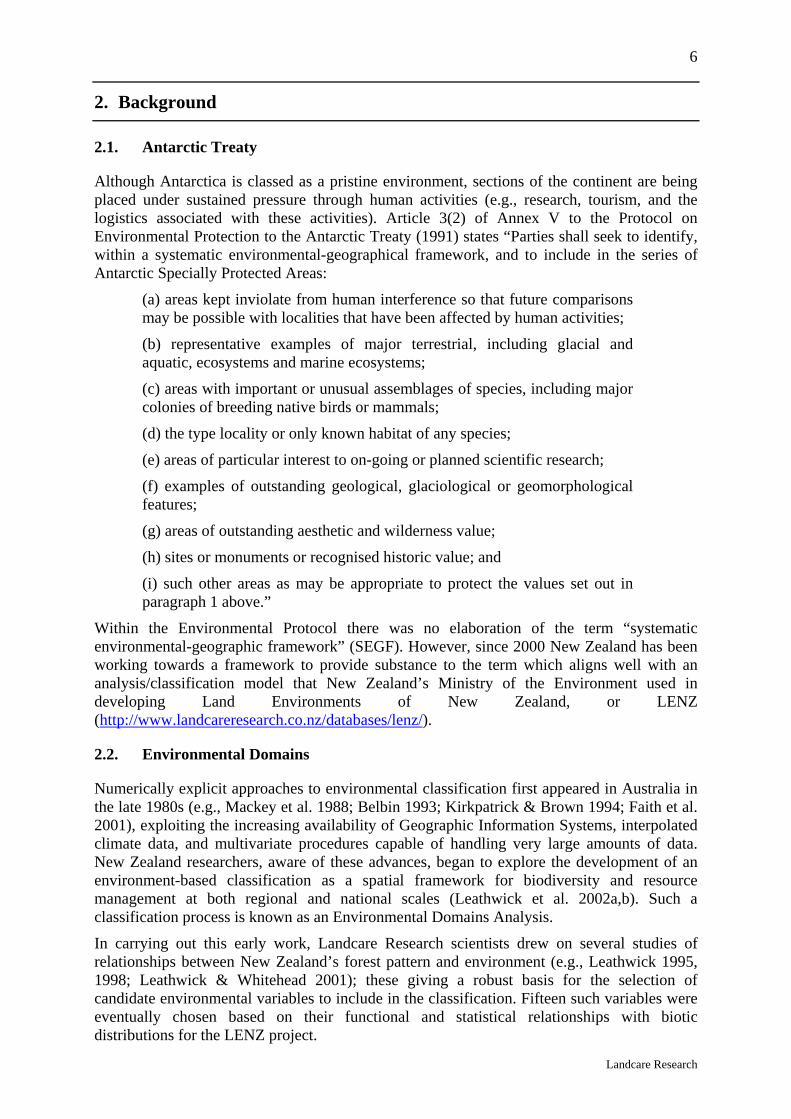
2. Background
2.1. Antarctic Treaty
Although Antarctica is classed as a pristine environment, sections of the continent are being placed under sustained pressure through human activities (e.g., research, tourism, and the logistics associated with these activities). Article 3(2) of Annex V to the Protocol on Environmental Protection to the Antarctic Treaty (1991) states “Parties shall seek to identify, within a systematic environmental-geographical framework, and to include in the series of Antarctic Specially Protected Areas:
(a) areas kept inviolate from human interference so that future comparisons may be possible with localities that have been affected by human activities;
(b) representative examples of major terrestrial, including glacial and aquatic, ecosystems and marine ecosystems;
(c) areas with important or unusual assemblages of species, including major colonies of breeding native birds or mammals;
(d) the type locality or only known habitat of any species;
(e) areas of particular interest to on-going or planned scientific research;
(f) examples of outstanding geological, glaciological or geomorphological features;
(g) areas of outstanding aesthetic and wilderness value;
(h) sites or monuments or recognised historic value; and
(i) such other areas as may be appropriate to protect the values set out in paragraph 1 above.”
Within the Environmental Protocol there was no elaboration of the term “systematic environmental-geographic framework” (SEGF). However, since 2000 New Zealand has been working towards a framework to provide substance to the term which aligns well with an analysis/classification model that New Zealand’s Ministry of the Environment used in developing Land Environments of New Zealand, or LENZ (http://www.landcareresearch.co.nz/databases/lenz/).
2.2. Environmental Domains
Numerically explicit approaches to environmental classification first appeared in Australia in the late 1980s (e.g., Mackey et al. 1988; Belbin 1993; Kirkpatrick & Brown 1994; Faith et al. 2001), exploiting the increasing availability of Geographic Information Systems, interpolated climate data, and multivariate procedures capable of handling very large amounts of data. New Zealand researchers, aware of these advances, began to explore the development of an environment-based classification as a spatial framework for biodiversity and resource management at both regional and national scales (Leathwick et al. 2002a,b). Such a classification process is known as an Environmental Domains Analysis.
In carrying out this early work, Landcare Research scientists drew on several studies of relationships between New Zealand’s forest pattern and environment (e.g., Leathwick 1995, 1998; Leathwick & Whitehead 2001); these giving a robust basis for the selection of candidate environmental variables to include in the classification. Fifteen such variables were eventually chosen based on their functional and statistical relationships with biotic distributions for the LENZ project.

7
Landcare Research
These variables consisted of seven climate variables describing various aspects of air temperature, solar radiation, and water supply and demand, and seven soil-related variables describing chemical and physical drivers of and/or limitations to plant growth and finally slope. All fifteen variables were assembled as 100-m resolution raster or grid layers, which were subsequently classified using a two-stage multivariate procedure. Four levels of classification detail containing 20, 100, 200 and 500 groups respectively were selected for documentation, and to allow application at varying spatial scales.
After discussions with Antarctica New Zealand and the Department of Conservation, we realised the approach we had developed to environment-based classification in LENZ was also directly applicable to the management of activities across Antarctica, as well as answering a number of the SEGF issues.
In reporting the development and progress of this work, New Zealand presented papers at previous meetings of the Committee for Environmental Protection (CEP) in 2003 (CEP VI – Working Paper 20, Information Paper 1), 2004 (CEP VII – WP 24), 2005 (CEP VIII – WP 2, IP 44), 2006 (CEP IX – WP 32) and 2007 (CEP X – WP 12, IP 41) for the Antarctic community. These papers followed the New Zealand Working Paper 12 at CEP III in 2000 following inter-sessional work coordinated by New Zealand on Antarctic Protected Areas.
2.3. Classifications within Antarctica
While the idea of an environmental classification for Antarctica is not new, the ability to create a data-derived and thus objective classification at the continent scale has come about in the last 5 years. Reports on environmental zoning, planning units and biogeographical definitions within Antarctica (Udvardy 1975; Keage 1987) have been discussed in the context of the SEGF but these classifications were recognised as subjective, based on what the authors thought were key areas of difference within Antarctica. Two main features can distinguish the classification used in the current EDA approach. First, numerical data layers are used to describe various fundamental aspects of Antarctica’s climate, ice cover and geology. The second point of difference is use of a computerised classification procedure that allows similar environments (including small distinctive environments that are otherwise easily overlooked at the continental scale) to be grouped based on their environmental character regardless of their geographical location. While the classification process has some elements of subjectivity, such as the choice of variables for inclusion and their respective weightings, the EDA approach is less subjective than the previous attempts to categorise Antarctica.
2.4. Phases of Classification Development
Environmental Domains Analysis for the Antarctic Continent
Landcare Research Contract Report – LC0405/106
Within this report a trial of an Environmental Domains Analysis was performed for the Antarctic continent. The report outlined the approach taken with the development of a pilot analysis on the Antarctic Continent with a goal to provide a systematic environmental geographic framework for use as a basis for conservation and environmental management.
Classification – Version 1.0
Original release of data based upon decisions made in 2004/2005. Environmental descriptions for this version of the classification can be found in the original report, titled "Environmental Domains Analysis for the Antarctic Continent" (Landcare Research Contract Report – LC0405/106)

8
Landcare Research
Analysis of the Antarctic Specially Protected and Managed Areas: Comparison to Environmental Domains of Antarctica
Landcare Research Contract Report – LC0506/108
The project’s objective was two fold. First, to provide an analysis of the representativeness and comprehensiveness of the present ASPA network compared with the Environmental Domains of Antarctica classification. The second objective was to review the ability of the EDA to predict environmental conditions prevailing at specific locations such as those within ASPA and ASMA. The results of the analysis confirm the conventional knowledge that conservation/protection efforts in Antarctica, while successful, have been biased towards particular types of environments. In this case the analysis confirms that the areas of high human contact have the highest amount of protection, such as the Antarctic Peninsula and the McMurdo Dry Valleys. Conversely, areas that have little or no human contact have either very little or no area protected; specifically, the environments in and around the Central Antarctic ice sheet do not have a single ASPA or ASMA.
Environmental Domains of Antarctica: Regional Dataset of the Larsemann Hills
Landcare Research Contract Report – LC0607/040
After the creation of an environmental domains analysis for the Antarctic continent (Morgan et al. 2005), the funding partners commissioned Landcare Research to investigate the creation of a regional subset of the continental classification focusing on the Larsemann Hills region in East Antarctica.
This report documented the process followed in the creation of the regional dataset and detailed the development of the data layers, the classification procedure, and evaluation of the classification. The report also describes the environments identified/depicted within the Larsemann Hills study area, and provides the supporting tabulation of the underlying data for each environment.
Classification – Version 1.1
Shortly after the presentation of the Environmental Domains of Antarctica (EDA) at ATCM XXVIII/CEPVIII (Morgan et al. 2005) a number of comments were forwarded to the project team and reviewed. One of the main issues was the lack of an “ice free” layer within the classification (James Bockheim, University of Wisconsin-Madison, pers. comm.). This was readdressed with the inclusion of a continent-wide ice-free layer from the Antarctic Digital Database and the entire continental classification re-run. This approach (the addition of a new underlying data layer focusing on the ice-free areas) has introduced some changes to the continental classification which required a new version number.
Environmental Domains of Antarctica: Version 2.0 Final Report
Landcare Research Contract Report – LC0708/055
This report intends to be a provisional guide to users of the classification, explaining the work that has been done. The report aims to extend the brief domain descriptions and touch on more advanced issues such as the potential uses along with concepts such as heterogeneity, spatial error, classification limitations and an explanation of the hierarchal dendrogram, which is a key component of the classification.
Classification – Version 2.0
The latest release of the data incorporates version 1.1 and changes the implementation of geology within the classification process. Geology in the previous versions was

9
Landcare Research
based upon the digitisation of an Antarctic wide geological map (Geologic Map of Antarctica, 1:5 000 000, American Geographical Society 1971). It became apparent through the two previous iterations that the inclusion of ‘suspected’ geology that was assumed to be based on expert opinion created artificial environmental boundaries that the classification incorporated. Environmental descriptions for this version of the classification can be found in this report. It is recommended that this version is used as the main layer from the report's release to minimise the risk that confusion could occur when looking at two separate layers.
10
Landcare Research
3. Methods
This section will describe the creation of EDA version 2.0, outline the reasons why the decisions were made, and the creation of the underlying data layers for the analysis, and conclude with a discussion on the process in creating an environmental domains analysis.
Three main processes are used in the creation of an EDA: the initial assembly of the data to be used in the classification process; the classification process itself; and the creation of the documentation surrounding the classification. We have selected data that differentiate the physical environment within Antarctica. Ideally, for biodiversity prediction, the EDA should be based on data that have both functional relationships and demonstrable statistical correlation with biotic distributions (as used in LENZ). For Antarctica, the paucity of life across much of the continent, and the relative lack of quantitative information about relationships between its biotic distribution and the environment, prevented such an approach. Furthermore, we recognise that applications other than biodiversity prediction (such as environmental monitoring) demand a robust environmental classification.
When we started this project, we began on the same path as LENZ in that we started with the same basic three-group structure for the spatial data layers – Climate, Slope and Landform. However, in addition to these, we found it necessary to consider other types of data to improve the differentiation of environments.
This section of the report has been broken into eight parts:
• an overview of the classification process,
• an overview of the environmental distance concept which is a key concept in EDA,
• discussion about the revisions to the underlying data layers and the consequent effect on continental-scale classifications,
• the creation of the climate underlying data layers,
• the creation of the slope, geology and ice cover underlying data layers,
• detailed discussion of the three stage classification process,
• discussion on the conversion of the classification data into a spatial data layer,
• discussion on the ASPA/ASMA analysis.
3.1. Classification overview
A basic overview of the classification process is as follows, data (such as climate records) representing geographic differences are selected for use in the classification. In the classification process, data (such as climate records) are compiled that characterise geographic differences between regions. It is important to note that the selection of the data to be included within the classification is one of the most influential aspects on the end result. (To use a cooking metaphor, poor or inappropriate ingredients will result in a poor meal). The data are then created into a series of underlying data layers, all at a uniform cell size with the same spatial projection. After the layers are all complete, a systematic sample of data points are exported to be analysed in two sequential stages (which are explained in detail in section 3.6):
• Non-hierarchical classification to identify a number of different environments within Antarctica (with a 400-environment maximum which is determined by the software).
• Hierarchical classification to define inter-environment relationships between all the environment centroids identified by the non-hierarchical classification.

11
Landcare Research
After the classification process is complete, the values of all the underlying data layers for each grid cell are then compared with the environmental space centroids from the non-hierarchical classification and this cell then mapped to its ‘closest’ environment (in environmental space). At the end of this process, a raster layer for Antarctica is created that contains 400 environments that are identified in the non-hierarchical classification phase. Within a geographic information system, the hierarchical classification is then used to view the environments at any level (i.e. any number of different environmental domains) from 2 environments up to the maximum of 400 environments.
3.2. Environmental distance
Appreciating the conceptual difference between geographic and environmental space is crucial to understanding how the Antarctic environments are created. Imagine starting with a set of sample points representing the area of interest (image A in Figure 1). On a conventional map, these sample points are located in a geographic space defined by coordinates such as latitude and longitude. Geographic distances between these points can be measured using simple geometric calculations, and these can be used to define groups of adjacent points.
Now imagine an environmental space defined not by latitude and longitude but by environmental variables such as air temperature, slope, and geology. The points from our geographic space can be mapped into this three-dimensional space using estimates of their air temperature, solar radiation and, in the example below, water deficit (image B in Figure 1). Environmental distances between the sample points can then be measured as in geographic space using similar geometric methods.
For the EDA, the distance between any two points along each environmental axis is expressed as a proportion (from 0 to 1) of the range of that variable across the entire set of data. The overall environmental distance between points is then calculated as the average of the differences along each of the underlying data layers. As a consequence, the final distance is the average distance from the eight underlying data layers (5 climate, 1 slope, 1 land cover, 1 geology). Finally, we can use an automatic classification procedure that uses calculated environmental distances to identify groups of points that are located close to each in this environmental space (colours of the points in image B in Figure 1). Having grouped points together, we can then construct maps that show the geographic distribution of groups that occupy similar positions in environmental space (image C in Figure 1).

12
Landcare Research
(A)
(B)
(C)
Figure 1: Classification via environmental space

13
Landcare Research
3.3. Changes within Version 2.0 of the continental scale classification
This section describes changes made since releasing EDA version 1.0 in 2005. Two of the changes are fundamental and have resulted in substantial differences:
1. Shortly after the presentation of the Environmental Domains of Antarctica (EDA) at ATCM XXVIII/CEPVIII (Morgan et al. 2005) a number of comments were forwarded to the project team and reviewed. One of the main issues was the lack of an ‘ice free’ layer within the classification (James Bockheim, University of Wisconsin-Madison, pers. comm.). This omission was re-addressed with the inclusion of a continent-wide ice-free layer from the Antarctic Digital Database, and the entire continental classification was re-run. The resulting classification placed heightened emphasis on the areas that were ‘ice free’, which is in line with the areas of interest within the Antarctic Continent.
2. The second change was the restriction of geological information to the areas that were classed as ‘ice free’. A number of erroneous environments appeared within EDA version 1.1 because of the substantial amount of ‘estimated’ geology the map contained. The geological data from the map created seemingly erroneous environments in the resulting surface because the boundaries of some geological units included large areas of ice (e.g., a large unit of geology mapped extending from the McMurdo Dry Valleys to the polar plateau) that were extrapolated based on best guesses. This reduction of geologic information improved the environmental ‘fit’ for the areas that did contain geologic information – i.e. the ‘ice free’ areas.
3. New longer run meteorological data was used to confirm the initial meteorological records and validate climate surfaces fitted to the data.
4. The revisions to the Antarctic Digital Database (ADD – http://www.add.scar.org/) were incorporated into the underlying data layers to ensure the most accurate representations of the five classes of land cover within the classification.
All these changes, from our perspective, have improved the classification and made it more applicable to the ‘on the ground’ conditions within Antarctica. This therefore makes if more useful for the policy and scientific community to use and include in future work.
3.4. Creation of Data Layers – Climate
Air temperatures
Estimates of air temperature for the entire continent were derived by fitting a thin-plate spline surface that allows the spatial interpolation from sparsely and irregularly distributed meteorological stations (Hutchinson & Gessler 1994). Fitting of this climate surface, implemented in ANUSPLIN v. 4.2 (CRES, Australian National University), required the collation of long-run average meteorological records from as many stations as possible, with geographic location and elevation. Meteorological records were summarised as long-run monthly averaged mean daily air temperatures.
The air temperature was fitted to the meteorological data points, using the station location (grid easting and northing) and elevation as predictors. Fitting involved an iterative cross-validation procedure in which each station was omitted in turn, and a surface fitted to the remaining stations. Progressive refinement of the surface proceeded until no further improvement can be made. Summary statistics for the final surface indicate the average cross-validation error of the fitted values, the average predictive error of the surface at the

14
Landcare Research
geographic location of the input data, and an estimate of the wider predictive error of the surface when predictions are made for new locations.
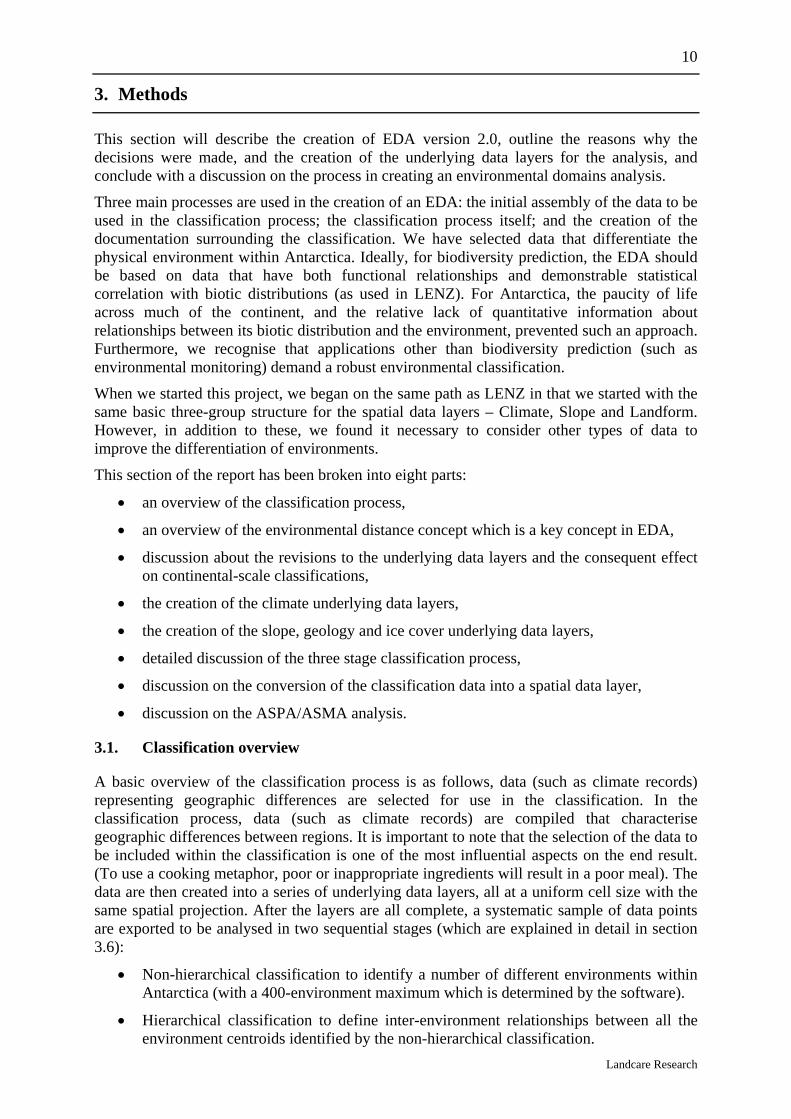
We then explored the feasibility of fitting continent-wide surfaces, for which we were able to obtain data for a much larger set of stations (n = 106 see Figure 2 for the spatial distribution of climate stations used), although only air temperature was recorded consistently at many of these. Fitting of a thin-plate spline surface to these data was much more straightforward, reflecting the much stronger signal the data set provided for broad-scale variation in air temperatures. Average monthly values for the mean air temperature, used as input to the surface, varied from –6.4ºC in summer to –27.2ºC in late winter (Table 1). Spatial variation in air temperature was most pronounced in early winter, with standard deviations about the mean values in early winter nearly twice those in early summer. While the average cross-validation error taken across all months is 2.79ºC, there was pronounced variation seasonally, with errors in winter approximately three times larger than those in late spring and in summer.
Table 1: Statistics for the Antarctic-wide air temperature surface based on data from 114 stations. Cell
values indicate both the average and standard deviation of the input data, and cross validation and predictive standard errors for the fitted surface
Observed Fitted Surface Statistics
Month Average air temperature (°C)
Standard deviation Root GCV Root MSE
Jan –6.4 8.37 1.37 0.34 Feb –11.2 10.65 1.58 0.30 Mar –18.4 13.35 2.48 0.46 Apr –22.8 14.16 3.32 0.54 May –24.9 14.17 3.82 0.84 Jun –24.9 13.09 3.78 0.86 Jul –26.3 13.21 4.22 1.35 Aug –27.2 13.45 4.19 1.29 Sep –25.3 13.51 3.92 1.11 Oct –19.9 12.07 2.13 0.30 Nov –11.9 9.67 1.31 0.10 Dec –6.4 8.00 1.39 0.47
Average –18.8 11.98 2.79 0.66
(GCV = generalized cross validation, MSE = mean squared error)
15
Landcare Research
Figure 2: Locations of the Meteorological Stations used to create the air temperature climate surfaces (Mean annual air temperature and Seasonal Range)

16
Landcare Research
Mean annual air temperature
The EDA surface describing mean annual air temperature was derived directly from a thin-plate spline surface fitted to data from 106 stations. Following conventions used in the calculation of climate summary statistics, the values used to fit the surface consisted of the mean of the 12-monthly average for daily average air temperature. The climate stations used as the base data were a compilation from four sources:
• Automatic Weather Stations Project (AWS) and Antarctic Meteorological Research Center (AMRC), Space Science and Engineering Center, University of Wisconsin-Madison (http://uwamrc.ssec.wisc.edu/aws.html)
• Antarctic Climate Data, Results From The SCAR READER Project (http://www.antarctica.ac.uk/met/READER/)
• The McMurdo Dry Valleys Long-Term Ecological Research programme (http://huey.colorado.edu/LTER/)
• The United States Department of Agriculture, Natural Resources Conservation Service, National Soil Survey Center (USDA NRCS NSSC), Climate Station Data, which was supplied directly to us from researchers within the USDA. (http://soils.usda.gov/survey/scan/)
Figure 3: Mean annual air temperature (Note: Average temperature depicted here in 6 classes, but
surface is continuous)

17
Landcare Research
Seasonal air temperature range
Seasonal air temperature range was calculated on the difference in mean air temperature between the coldest (August), and warmest (January) months. The seasonal range in air temperature was generally greatest at higher elevations and at inland areas, where there is little moderation of air temperature, which occurs at more coastal locations. These two individual monthly air temperature layers were created as part of the Mean Annual Air Temperature layer described above. As in the creation of the mean annual air temperature layer, the same organisations contributed to this seasonal range layer:
• Automatic Weather Stations Project (AWS) and Antarctic Meteorological Research Center (AMRC), Space Science and Engineering Center, University of Wisconsin-Madison (http://uwamrc.ssec.wisc.edu/aws.html)
• Antarctic Climate Data, Results From the SCAR READER Project (http://www.antarctica.ac.uk/met/READER/)
• The McMurdo Dry Valleys Long-Term Ecological Research programme (http://huey.colorado.edu/LTER/)
• The United States Department of Agriculture, Natural Resources Conservation Service, National Soil Survey Center (USDA NRCS NSSC), Climate Station Data, which was supplied directly to us from researchers within the USDA (http://soils.usda.gov/survey/scan/)
Figure 4: Seasonal air temperature range (Note: depicted here in 6 classes, but surface is continuous)

18
Landcare Research
Wind
Estimates of wind speed were derived from a thin-plate spline surface fitted to data from 75 stations (see Figure 5 for the spatial distribution of meteorological stations), with easting, northing and elevation as predictor variables. Lowest average wind speeds occurred in December and January (Table 2), and winter was the windiest season. Predictive errors for the fitted surface varied in a similar fashion, i.e. they are lower in summer than in winter.
Table 2: Statistics for the Antarctic-wide air temperature surface based on data from 75 stations. Cell values indicate both the average and standard deviation of the input values, and cross validation and
predictive standard errors for the fitted surface
Observed Fitted Surface Statistics
Month Average Speed (meters per second)
Standard deviation Root GCV Root
MSE Jan 10.21 3.68 3.19 1.51 Feb 11.98 4.72 4.11 1.88 Mar 13.39 5.97 5.32 2.47 Apr 13.61 6.22 5.65 2.64 May 13.67 6.15 5.72 2.58 Jun 14.13 6.25 5.75 2.62 Jul 13.99 6.14 5.75 2.62 Aug 14.07 6.17 6.00 2.55 Sep 13.98 5.91 5.69 2.38 Oct 13.63 5.31 4.91 2.26 Nov 12.35 4.44 3.83 1.91 Dec 10.28 3.61 3.10 1.44
Average 12.94 5.38 4.92 2.24
(GCV = generalized cross validation, MSE = mean squared error)

19
Landcare Research
Figure 5: Locations of the Meteorological Stations used to create the wind speed surface
20
Landcare Research
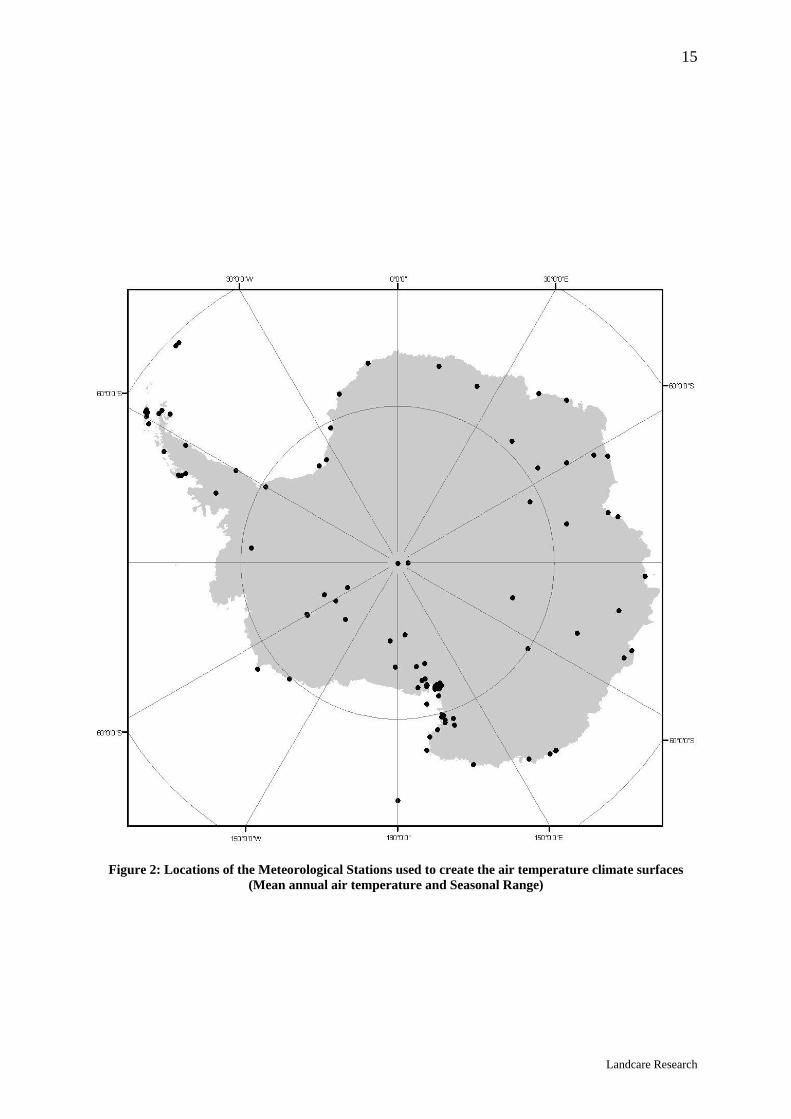
Mean annual wind speed
The EDA surface describing mean annual wind speed was derived directly from a thin-plate spline surface fitted to data from 75 stations.
Again the data were collated from the same compiled dataset as was used in the mean annual air temperature layer:
• Automatic Weather Stations Project (AWS) and Antarctic Meteorological Research Center (AMRC), Space Science and Engineering Center, University of Wisconsin-Madison (http://uwamrc.ssec.wisc.edu/aws.html)
• Antarctic Climate Data, Results From the SCAR READER Project (http://www.antarctica.ac.uk/met/READER/)
• The McMurdo Dry Valleys Long-Term Ecological Research programme (http://huey.colorado.edu/LTER/)
• The United States Department of Agriculture, Natural Resources Conservation Service, National Soil Survey Center (USDA NRCS NSSC), Climate Station Data, which was supplied directly to us from researchers within the USDA (http://soils.usda.gov/survey/scan/)
Figure 6: Mean annual wind speed (Note: depicted here in 5 classes based on the Beaufort scale, but
surface is continuous)

21
Landcare Research
Estimated solar radiation at top of atmosphere
This surface was included because differences in the potential solar radiation will affect ablation, including melting of ice and snow. Unfortunately, as the number of climate stations for which comprehensive solar radiation measurements were available was minimal, we were unable to use interpolation to create a robust surface from measured solar radiation data. Because of the importance of this layer to Antarctic environments we calculated likely monthly solar radiation inputs using standard solar geometry equations. Values were calculated for the top of the atmosphere for 300 points in a radial pattern covering the Antarctic continent. The estimates were then interpolated into a grid using the Spatial Analyst extension within ESRI’s ArcGIS 8.3. It should be noted that this layer does not take into account the effects of topography, elevation or cloud on the solar radiation experienced at the earth’s surface, i.e. values are those expected in the upper atmosphere, and radiation at the earth’s surface can be expected to be approximately 50% lower. While this simplification is less than desirable, it provided the most efficient approach to including solar radiation in the EDA.
Figure 7: Estimated solar radiation at top of atmosphere (Note: depicted here in 6 classes, but surface is
continuous)
22
Landcare Research
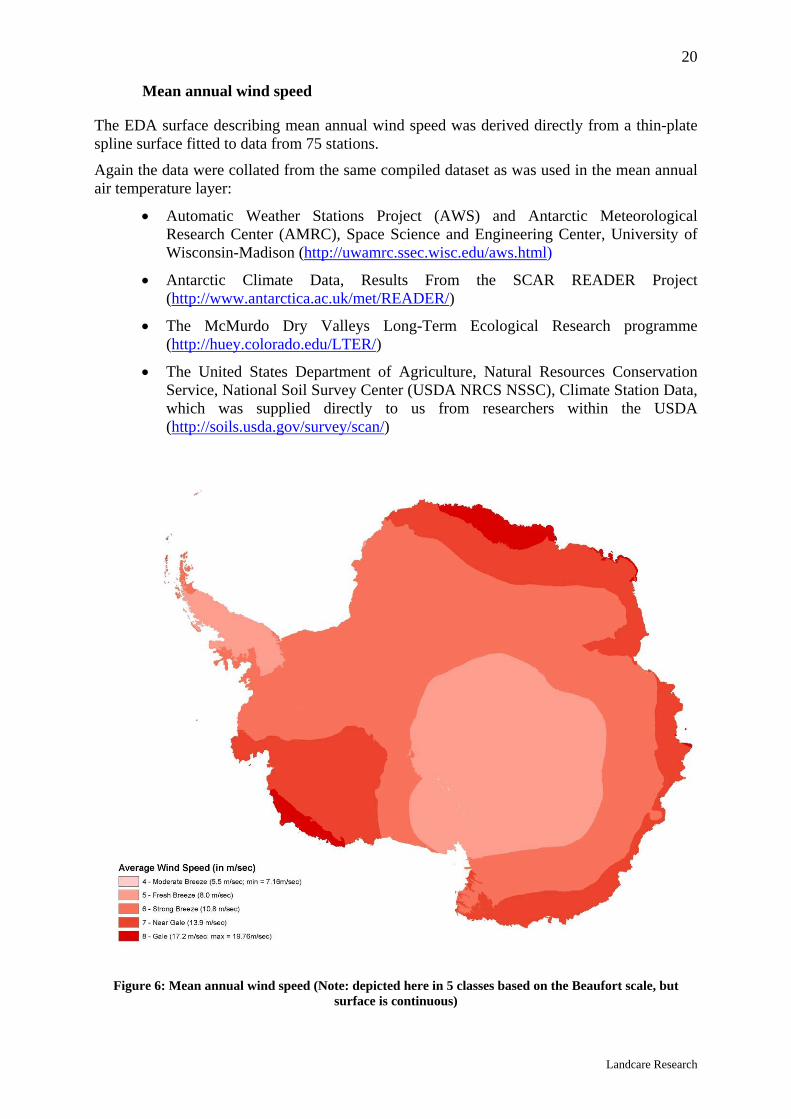
Period of year with normal diurnal pattern
With sunlight or lack of it being a key environmental factor in Antarctica, a surface was included that describes variation in the length of the period for which there is a diurnal pattern of light and dark. The units of the layer are in days, and if the sun fully sets and rises within a day, the day is considered to have a diurnal pattern. This layer is interpolated directly off the latitude and longitude and does not take elevation into account. As a basic rule of thumb, the closer to the pole, the lower the number of days that have a regular day-night pattern. This directly correlates to the number of days that have continuous daylight and darkness. Future iterations could improve this layer by focusing on the length of days that have some daylight rather than the approach used here. The layer was created through a basic latitude and longitude calculation for 300 points in a radial pattern that covered the Antarctic continent. This calculation is based on the same standard solar geometry equations used in the estimated solar radiation at top of atmosphere above. This point layer was then interpolated into a grid using the Spatial Analyst extension in ESRI’s ArcGIS 8.3. This created a layer that matches the other underlying data layers used in the classification.
Figure 8: Diurnal length (Note: depicted here in 7 classes but surface is continuous)

23
Landcare Research
3.5. Creation of Data Layers – Land/Ice
Slope (with square root transformation)
The slope layer used in the EDA was created from a 1-km digital elevation model sourced from the National Snow and Ice Data Center in Boulder, Colorado (Liu et al. 2001). The 1-km digital elevation model was converted into a slope layer using the Spatial Analyst extension in ESRI’s ArcGIS 9.2. Before the classification process, a square root transformation was applied to the slope layer to reflect the much greater significance of small changes in slope on flatter sites when compared with a change of the same magnitude on steeper terrain.
Figure 9: Square root of slope (Note: depicted here in 6 classes but surface is continuous)

24
Landcare Research
Land (Ice) Cover
This layer was created from the landform data sourced from the Antarctic Digital Database (ADD) website (http://www.add.scar.org/ version 4.1). The ADD data were used to differentiate five types of distinctive ice-related landforms – Snow and Ice (including glaciers), Ice Free, Ice Shelf, Ice Tongue, and Rumple (although the latter very rarely appears within the ADD). To create a combined layer, two ADD datasets were used, the polygon COAST layer which differentiated ice shelves, ice tongues, land and rumples, and the polygon ROCK layer which delineated the exposed rock areas. The ROCK layer was mutually exclusive with the COAST layer’s land attribute and when joined, the COAST layer’s land attribute was split into Snow and Ice, and Ice Free. Given the dynamic nature of many ice fronts, there are several discrepancies between previously mapped and present ice fronts. The most obvious discrepancy is due to the 2002 collapse of most of the Larsen B Ice Shelf between Robertson Island and Jason Peninsula (see Environment F below)
Figure 10: Land Cover

25
Landcare Research
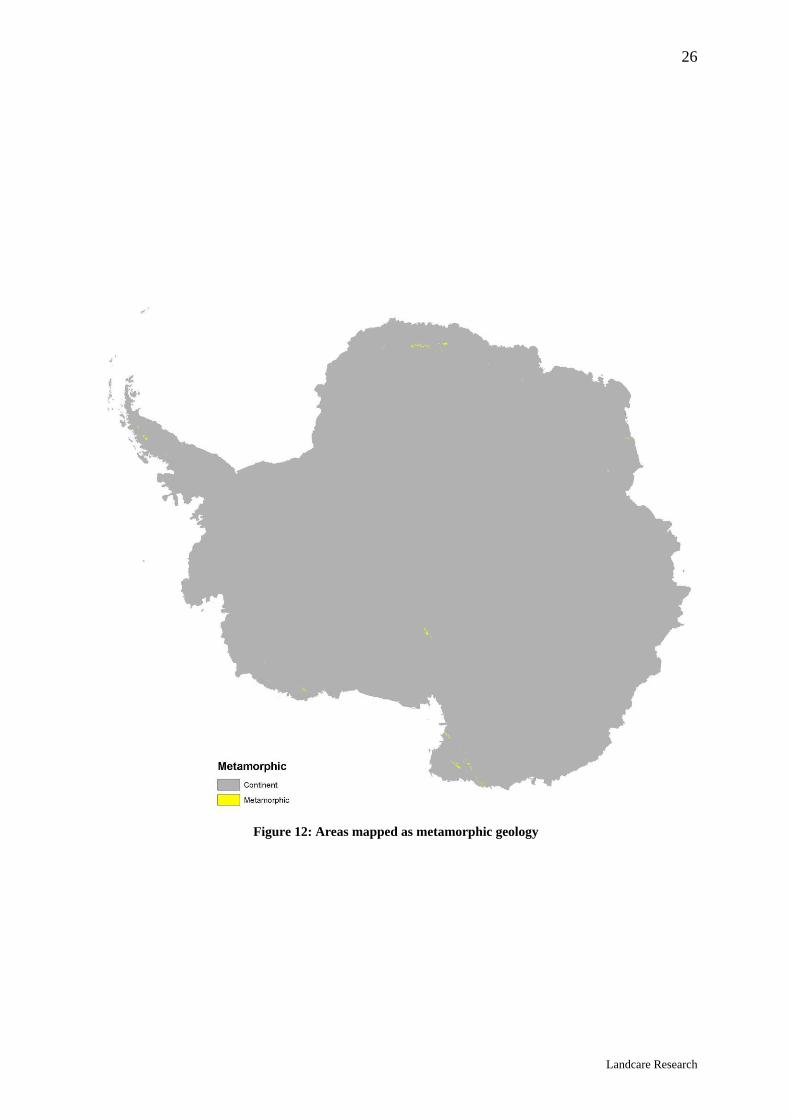
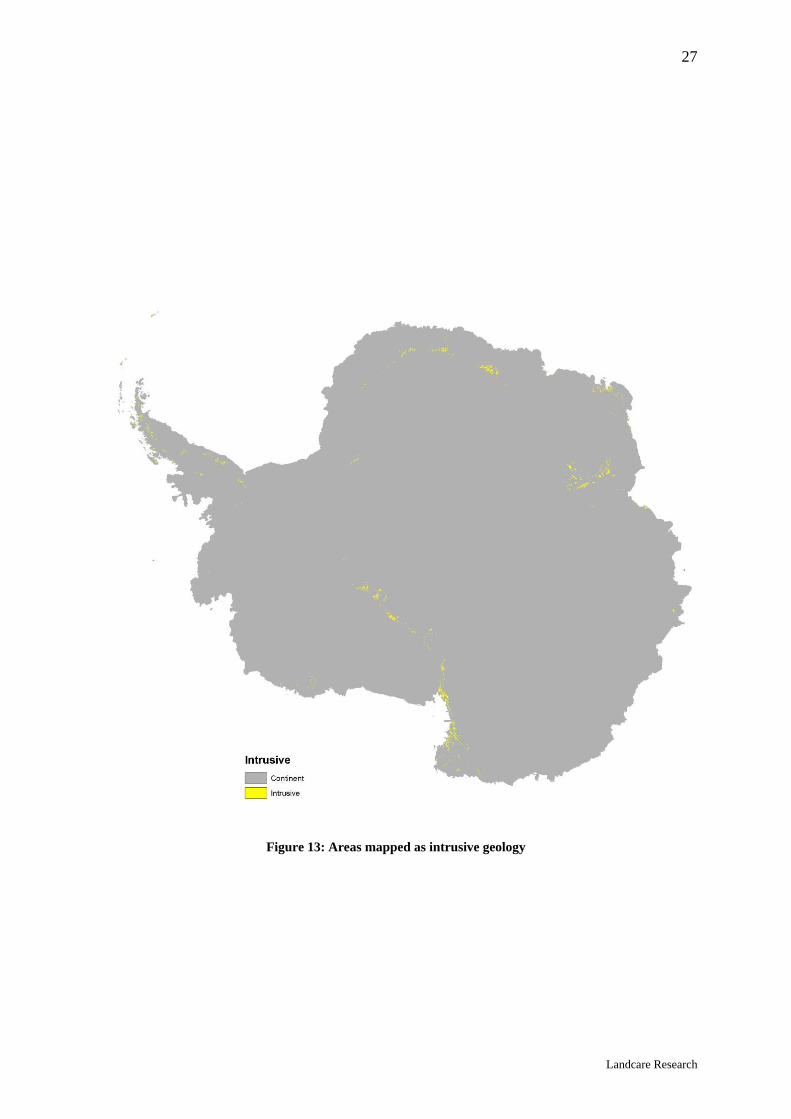
Geology
The geological data set was created through the digitisation of an Antarctic wide geological map (Geologic Map of Antarctica, 1:5 000 000, American Geographical Society 1971). For digitising, rock types were grouped into the four main geological groups identified on the map – Sedimentary and Meta-Sedimentary, Intrusive Igneous, Igneous Metamorphic basement complex, and Volcanic. The map only classified the geology in ice-free areas or areas in which the confidence in the geology was high. As discussed previously, a development decision was made before the creation of EDA version 2.0 that all geological information would be restricted to those areas classified as ‘ice free’ within the Antarctic Digital Database’s ‘ice free’ layer. The continental scale map of geology was not improved with detailed local scale maps of geology, as we required a map at a consistent scale that covered the entire continent. As geology has been clipped to areas of ice free terrain there is a distinct correlation between these two attributes (i.e. if a location has no geological information it cannot be ice free and vice versa). This approach has achieved the requirement to represent ice free areas in as much detail as could be achieved at the continental scale.
Figure 11: Areas mapped as sedimentary geology
26
Landcare Research
Figure 12: Areas mapped as metamorphic geology
27
Landcare Research
Figure 13: Areas mapped as intrusive geology

28
Landcare Research
Figure 14: Areas mapped as volcanic geology

29
Landcare Research
3.6. Classification Process
Data preparation
There were 13 676 808 cells in the underlying dataset available for analysis. To reduce computational requirements, a 25% sub-sample of these cells was taken by extracting data from every second column and every second row of the raster datasets. This resulted in a dataset containing 3 419 240 data points. Any transformations required were applied to the raster datasets before they were exported for classification. PATN (Belbin 1995) was run using the batch command process. This required creating input files that contained the required options for each stage of the analysis and was done using VBA (Visual Basic for Applications) scripts written in an Access database.
Non-hierarchical classification
Because of the large number of data points used in the analysis, the classification was performed in two stages. An initial non-hierarchical classification (ALOB) was used to group together similar points, with the average values or centroids of the resulting groups then classified using a conventional hierarchical classification procedure. We used the Gower Metric, a range-standardised distance measure to measure environmental distance in ALOB; the same measure as was used in the development of the LENZ classification for New Zealand (Leathwick et al. 2002a). The eight units for Geology and Ice Cover were extracted into individual binary raster layers (1 = unit present / 0 = unit absent). These categorical layers were then given a combined weighting in the classification equivalent to the weighting of each of the six climate, radiation, and slope layers when running the ALOB and GASO modules in PATN using GAS files to define the group memberships, and thus weighting (Belbin 1995).
We grouped the data into 400 groups – the maximum number of groups available with this method (ALOB). ALOB uses an iterative algorithm to group the data and stop the process either in the event that a specified number of attempts, or that a minimum number of changes to group membership, occur on any given iteration. We selected 1000 iterations as the maximum number, and zero (0) reallocations as the minimum number to force a break. No record of the number of iterations is made by PATN during this process, but toward the completion of 1000 iterations there were still over 100 reallocations being made per iteration (when compared with the total number of cells, this constitutes only 0.0007% and therefore is statistically negligible).
Hierarchical classification
The outputs of the ALOB process were used as the inputs for a new PATN analysis to create a group hierarchy definition. A distance association was calculated for the 400 groups using the PATN function GASO. As in ALOB, the Gower Metric was chosen as the distance measure. Agglomerative group fusion was done using Flexible UPGMA (Unweighted Pair Group Method with Arithmetic Mean) sorting in PATN using the FUSE module. A Beta value of –0.1 was chosen to be consistent with the methodology of LENZ (Leathwick et al. 2002a). The outputs from this classification were then imported into an Access database to create a hierarchy definition. From this, specific group centroids could be exported using purpose-written code allowing lookup tables to be joined to the classification raster data layer that is described in the next section.

30
Landcare Research
3.7. Classification raster dataset
The results from ALOB were exported from PATN as a table containing the average values for each of the underlying data layers (group centroid values) for each of the 400 groups. This table was imported into Access where fieldnames (names of the underlying datasets) were added. Purpose-written C++ code was then used to combine this table with the original underlying raster data layers to create a new raster data layer indicating the geographic distribution of each of the 400 environments created in the first phase of the classification. This was achieved by calculating the environmental distance to each of the 400 ALOB environments for each raster cell, with the cell then allocated to the environment to which it was most closely associated. The program used to perform this operation was based on that developed for the LENZ project. Finally, the raster classification layer showing the geographic distribution of environments was combined with a summary table showing the order in which the input groups were progressively combined to form one large group. A visual representation of this is the environmental distance dendrogram which can be seen in Figure 40 (p. 81).
3.8. ASPA/ASMA Analysis
Spatial and aspatial datasets for the Analysis were primarily obtained from the Antarctic Protected Areas Information Archive (abbreviated to APAIA). A number of country-specific datasets were also used to confirm the locations obtained from the APAIA source. The latitude and longitude coordinates were converted to GIS layers for comparative analysis with Version 2.0 of the classification. The numeric indicators for each ASPA and ASMA are as was found on the APAIA website. As the layer of ASPAs and ASMAs was created in mid 2005 it only includes up to number 164, and does not include the three ASPAs and two ASMAs added since then. A list of the ASPAs and ASMAs included along with the numerical identifier is given in the appendix (List 1). Spatial extents for ASPA and ASMA point data were converted to shapefiles using ArcGIS 9.2. Where three or more points were available to define an area, these points were digitised as Polygon data. In some rare cases, where an ASPA/ASMA point was known to be larger than the point given on the APAIA site, a buffer was created around the point at a distance that reflected the indicated size of the ASPA/ASMA. All points, circular buffers, and polygons were converted to 1-km2 raster layers using ArcGIS 9.2 for use in the combinatorial analysis.
A combinatorial analysis was run using the ASPA and AMSA data described above versus Version 2.0 of the classification. This technique involves creating a raster layer and lookup table for the all unique combinations of values in the data layers. The software used in this analysis was a purpose-written C++ program that has several advantages over the standard version available in ArcView 3.2 and ArcGIS 9.2. Some ASPA/ASMAs are located exclusively over water bodies, which was outside the terrestrial mandate of the classification and therefore are not included within the comparison. In addition, the classification focused on the main continent, and although a large number of islands were included in the classification some Antarctic islands were excluded where the island’s area was below 500 m2. In the creation of the underlying data layers for the EDA, a cell size that was both relevant and computationally feasible at a continent-wide scale was required. Initial tests showed that a 1-km2 cell fitted these criteria, although this level of detail meant that areas of coastline and islands that cover less than 500 m2 of a cell are not counted as land but as sea. Consequently, some ASPAs that are located on small islands are not represented within EDA. It is important to note that the selection of ASPA/ASMAs has generally not been on the basis of environmental representativeness, but on unique features that are generally local in nature. It is unrealistic for a broad-scale environmental classification to predict local-scale ecosystem or biodiversity character. The comparisons in this report only verify the ability of the classification to predict the macro-scale environmental conditions, not the local scale processes of the ASPA/ASMA.

31
Landcare Research
4. Results
The classification process produced a number of spatial data layers. The main layer is the classification that in this case details 400 environments across the Antarctic continent. While a layer with all 400 groups may be useful in a research context, it is too fragmented for most science and management purposes. As with LENZ, there is a need to standardise a level that consists of fewer environments to suit the purposes of a SEGF. In the LENZ case the number of environments fell into place along the lines of arbitrary management guidelines in New Zealand’s governmental structure (Basic National Overview – 20 groups, National – 100 groups, Regional – 200 groups, and Local – 500 groups).
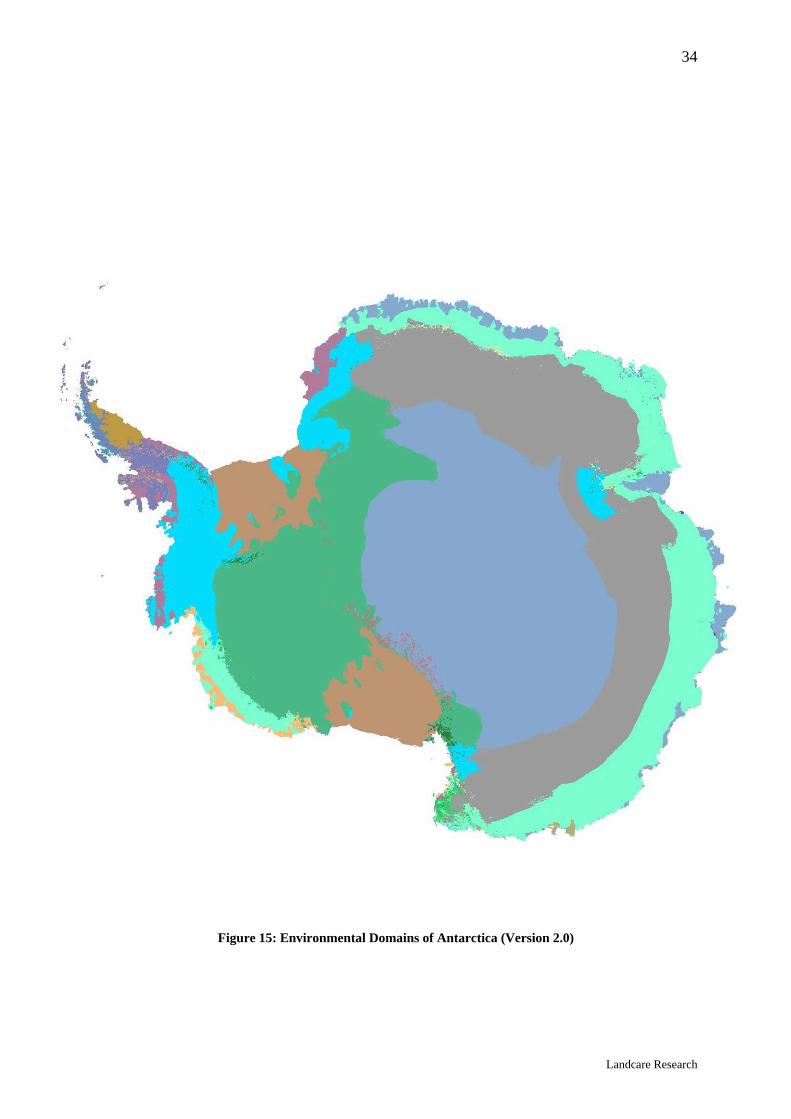
It was decided by the wider steering committee that for this report we would consolidate the classification by describing 20 environments across the continent. The initial report (LC0405/106) commented that the selection of 20 environments allows “both New Zealand and wider international agencies to review the premise and outcomes of the classification” (Morgan et al. 2005). The intervening 2 years since that report have indicated that the 20 environment level seems appropriate for most New Zealand and international agencies. For EDA version 2.0, the combination of environments from 21 to 20 happened at the same time as 20 to 19 (i.e. we cannot show 20 groups, only 19 or 21 groups). Consequently, we have made the decision to detail 21 environments in this version (2.0) of the classification. The new environment follows the existing labelling convention and is labelled “U”. As with EDA version 1.0, there are basic themes running through the 20 group classification and those themes align well with previous subjective classifications (Udvardy 1975; Keage 1987), in that six main types of environments can be seen within the classification. By location and ice cover these ‘broad brush’ environments are:
• Central Antarctic ice sheet (Environments N, O and Q) • Coastal-continental margin (Environments D, L and M) • Ice Shelf and other floating glaciers (Environments F, H, I, J, K and P) • Mountainous – Ice free rock (Environments R, S, T and U) • Antarctic Peninsula and off shore islands (Environments A, B, C, E and G).
The layout of this section follows the results section within the original report (LC0405/106). The review of each environment will cover two pages; the first contains a brief textual description of the environment and then a tabular description of the values for all of the underlying data layers. The tabular description is based on an averaged value for each of the underlying data layers used in the creation of the EDA in both an integer (climate and slope) and percentage (geology and ice cover) formats. An example, Environment N’s wind speed for the entire spatial area of Environment N is 12.81 metres per second; while there will be areas within Environment N that will contain higher or lower wind speeds, this is the average for the extent of Environment N. An example of the percentage calculation is that for Environment U: 52% of the cells contain an area of ‘ice free’ terrain.
The second page contains a large image of the environment for reference along with a table which lists the ASPA/ASMAs that overlap or are within this environment. Delineating each of these environments on a paper image that contains 20 different colours is extremely difficult, so discerning where each environment is located on the 20 Group map below is not always clear. As a consequence, each environmental description has a plain grey/colour environment map allowing the reader to focus on the location of each environment within the continent. The colour used on each map is the same colour that is represented within the classification (Figure 15). If the environment is small and hard to identify, a bounding box and a close-up of the main area where it is present is also shown on the image. If readers wish to explore the classification in further detail, the authors would recommend looking at the

32
Landcare Research
classification within a GIS such as ESRI’s ArcGIS 9.2, which would allow more functionality and ease of identification than just examining an image.
The ASPA/ASMA comparison table is based upon the comparison process described within the previous report (Morgan et al. 2006 – LC0506/108). Using the previously created raster ASPA/ASMA information that was converted to 1-km2 Raster Layers, a Combinatorial Analysis is run creating a raster layer and look-up table for all the unique combinations of values in the data layers. The analysis was run using the ASPA and AMSA data described above compared with version 2.0 of the EDA. A complete ASPA/ASMA table is included within the appendix (Table 26).
For comparative purposes, two tables are included within the appendix, the standard environmental descriptor table, which details the average values for the underlying data layers for each environment across the Antarctic Continent, and the tabular results of the combinatorial analysis of ASPA/ASMA layer.
4.1. Environment Labels
Descriptive labels have been assigned to each environment classified within the resulting raster data layer. The reason for this is that at this level (21 groups) the environments are more suited to be given a descriptive label rather than the alphabetical descriptor used within the modeling process. The names are as follows;
A. Antarctic Peninsula northern geologic B. Antarctic Peninsula mid-northern latitudes geologic C. Antarctic Peninsula southern geologic D. East Antarctic coastal geologic E. Antarctic Peninsula and Alexander Island main ice fields and glaciers F. Larsen Ice Shelf G. Antarctic Peninsula offshore island geologic H. East Antarctic low latitude glacier tongues I. East Antarctic ice shelves J. Southern latitude coastal fringe ice shelves and floating glaciers K. Northern latitude ice shelves L. Continental coastal-zone ice sheet M. Continental mid-latitude sloping ice N. East Antarctic inland ice sheet O. West Antarctic Ice Sheet P. Ross and Ronne-Filchner ice shelves Q. East Antarctic high interior ice sheet R. Transantarctic Mountains geologic S. McMurdo – South Victoria Land geologic T. Inland continental geologic U. North Victoria Land geologic
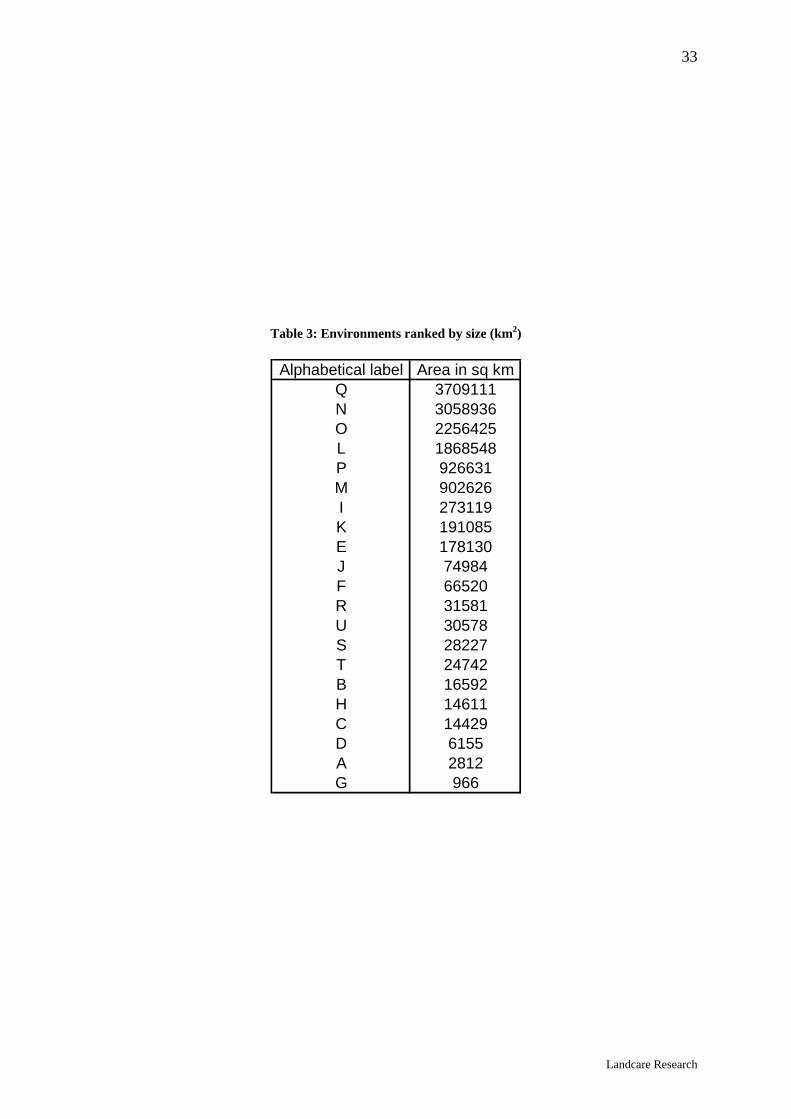
The sizes of the environments are extremely varied – from 3.7 million square kilometres down to a comparatively small 966 square kilometres. Table 3 shows all the environments after being ranked by size.
33
Landcare Research
Table 3: Environments ranked by size (km2)
Alphabetical label Area in sq kmQ 3709111N 3058936O 2256425L 1868548P 926631M 902626I 273119K 191085E 178130J 74984F 66520R 31581U 30578S 28227T 24742B 16592H 14611C 14429D 6155A 2812G 966
34
Landcare Research
Figure 15: Environmental Domains of Antarctica (Version 2.0)

35
Landcare Research
Figure 16: Enlarged view of the Antarctic Peninsula (Version 2.0)

36
Landcare Research
Figure 17: Enlarged view of the Ross Sea Region (Version 2.0)

37
Landcare Research
Figure 18: Enlarged view of the Mac Robertson-Princess Elizabeth Land area including Larsemann Hills (Version 2.0)

38
Landcare Research
Environment A – Antarctic Peninsula northern geologic
Environment A is a small terrestrial environment around the northern Antarctic Peninsula.
The size of the environment (2812 km2) is very small compared with the other environments
(only environment G is smaller). The environment consists entirely of ice-free land cover and
sedimentary geology. Climatically the environment is warm in comparison with the other
environments. Environment A is ranked third warmest in average air temperature (–10.33°C),
second smallest in seasonal range (–11.68 °C) and second highest in the amount of solar
radiation (10.28 MJ/m2/day). The average wind speed within the environment is moderate,
ranking eleventh out of the 21 environments (12.22 m/sec). It is a steep environment with an
average slope of 24.35°, making it the fourth steepest environment within the continent. Well-
known locations the environment covers include most of Seymour Island, parts of ice-free
peninsulas on Snow Hill Island, most of Hurd Peninsula on Livingston Island, Hope Bay and
other ice free parts of Trinity Peninsula and Nordenskjold Coast (e.g., Sobral Peninsula), and
other ice free locations on Graham Land as far south as latitude 66°S (inland from Jason
Peninsula).
Group Number 1 Alphabet label A Area in sq km 2812
EDA Type Environments and extended descriptors Antarctic Peninsula northern geologic
Average Temp (°C) –10.33 Seasonal Range (°C) –11.68
Average Solar Radiation (MJ/m2/day) 10.28
Diurnal Length (Days) 364.97 Average Wind Speed (m/sec) 12.22
Slope (°) 24.35 Ice Free 100%
Ice Sheet 0% Ice Shelf 0%
Ice Tongues 0% Rumples 0%
Sedimentary 100% Metamorphic 0%
Intrusive 0% Volcanic 0%

39
Landcare Research
Figure 19: Environment A
Table 4: Antarctic Specially Protected Areas (ASPA) and Managed Areas (ASMA) that either partially or
completely contain Environment A
ASPAASPA 111
ASPA 128
ASPA 151
A x x x
ASMAASMA
1A x

40
Landcare Research
Environment B – Antarctic Peninsula mid-northern latitudes geologic
Environment B is a small terrestrial environment focused around the Antarctic Peninsula. The
size of the environment is very small (16 592 km2 – sixth smallest), consists entirely of ice-
free land cover, and contains a combination of three geological units – metamorphic (4%),
intrusive (21%) and volcanic (20%). Climatically the environment is warm with the fourth
warmest average air temperature (–11.15°C), third smallest seasonal range (–13.00°C) and
third highest level of solar radiation (10.05 MJ/m2/day). The average wind speed within the
environment is moderate at 10.70 m/sec, but it is an extremely steep environment with an
average slope of 29.44° making it the second steepest environment within the continent. Well-
known locations the environment covers include Seal Nunataks, much of Vega and Smith
Islands, parts of Snow Hill, Deception, Brabant, Anvers and Adelaide Islands, and ice-free
western and eastern parts of the Antarctic Peninsula south to Marguerite Bay and Wilkins
Coast to latitude 69° 30’S.
Group Number 17 Alphabet label B Area in sq km 16592
EDA Type Environments and extended descriptors
Antarctic Peninsula mid-northern latitudes geologic
Average Temp (°C) –11.15 Seasonal Range (°C) –13.00
Average Solar Radiation (MJ/m2/day) 10.05
Diurnal Length (Days) 359.81 Average Wind Speed (m/sec) 10.70
Slope (°) 29.44 Ice Free 100%
Ice Sheet 0% Ice Shelf 0%
Ice Tongues 0% Rumples 0%
Sedimentary 0% Metamorphic 4%
Intrusive 21% Volcanic 20%

41
Landcare Research
Figure 20: Environment B
Table 5: Antarctic Specially Protected Areas (ASPA) and Managed Areas (ASMA) that either partially or
completely contain Environment B
ASPAASPA 108
ASPA 115
ASPA 134
ASPA 140
ASPA 153
B x x x x x
ASMAASMA
4B x

42
Landcare Research
Environment C – Antarctic Peninsula southern geologic
Environment C is a small terrestrial environment focused around the mid to southern
Antarctic Peninsula south of 68°S inland from Marguerite Bay to 73°S south of Voilant Bay,
inland Lassiter Coast on Palmer Land. The environment is the fourth smallest at only 14 429
km2. It consists entirely of ice free land cover and contains two types of geology –
sedimentary (11% of the area) and intrusive (13% of the area). Approximately 76% of the
environment does not have any mapped geology. The environment is cool when compared
with the other environments. Environment C has an average air temperature of –16.03 °C
(eleventh warmest) and is ranked sixth smallest in seasonal range (–16.23 °C). The average
wind speed within the environment is 9.79 m/sec, making it the calmest of all 21
environments. It is a steep environment with an average slope of 21.73°, making it the seventh
steepest environment within the continent. Well-known locations the environment covers
include the ice free parts of Alexander Island and the east coast of George VI Sound.
Group Number 7 Alphabet label C Area in sq km 14429
EDA Type Environments and extended descriptors Antarctic Peninsula southern geologic
Average Temp (°C) –16.03 Seasonal Range (°C) –16.23
Average Solar Radiation (MJ/m2/day) 9.75
Diurnal Length (Days) 258.11 Average Wind Speed (m/sec) 9.79
Slope (°) 21.73 Ice Free 100%
Ice Sheet 0% Ice Shelf 0%
Ice Tongues 0% Rumples 0%
Sedimentary 11% Metamorphic 0%
Intrusive 13% Volcanic 0%

43
Landcare Research
Figure 21: Environment C
Table 6: Antarctic Specially Protected Areas (ASPA) and Managed Areas (ASMA) that either partially or
completely contain Environment C
ASMAASMA
2C x
44
Landcare Research
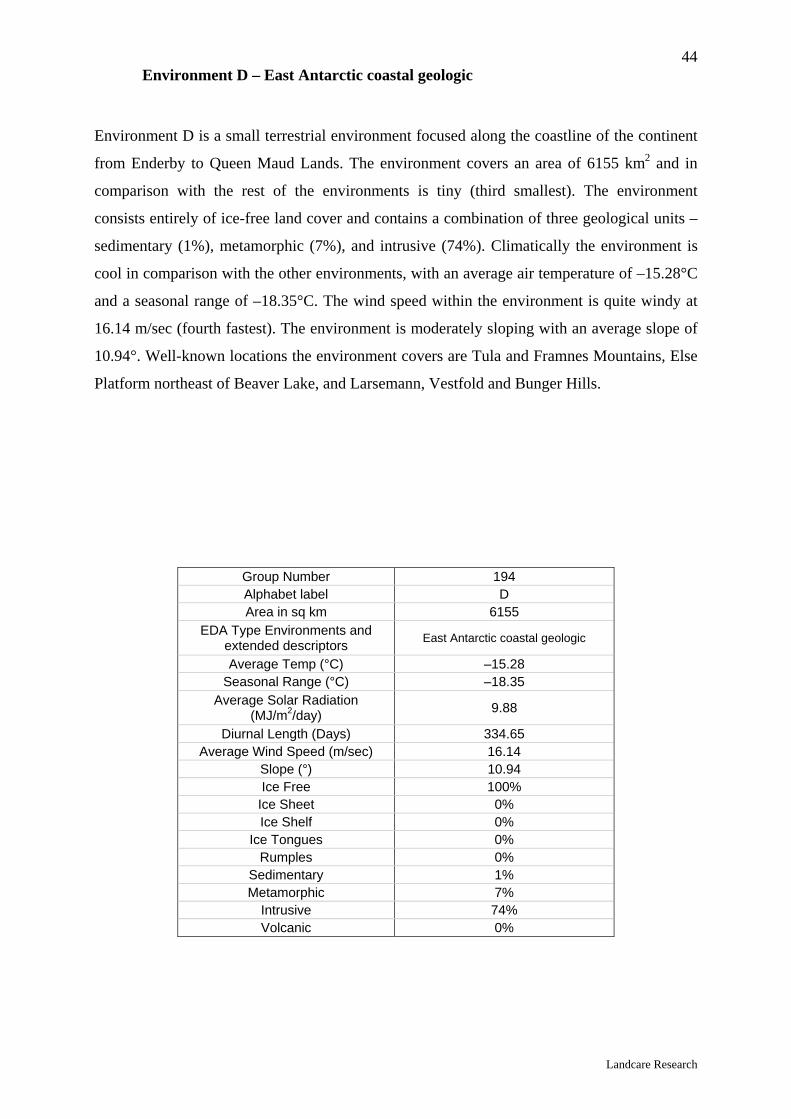
Environment D – East Antarctic coastal geologic
Environment D is a small terrestrial environment focused along the coastline of the continent
from Enderby to Queen Maud Lands. The environment covers an area of 6155 km2 and in
comparison with the rest of the environments is tiny (third smallest). The environment
consists entirely of ice-free land cover and contains a combination of three geological units –
sedimentary (1%), metamorphic (7%), and intrusive (74%). Climatically the environment is
cool in comparison with the other environments, with an average air temperature of –15.28°C
and a seasonal range of –18.35°C. The wind speed within the environment is quite windy at
16.14 m/sec (fourth fastest). The environment is moderately sloping with an average slope of
10.94°. Well-known locations the environment covers are Tula and Framnes Mountains, Else
Platform northeast of Beaver Lake, and Larsemann, Vestfold and Bunger Hills.
Group Number 194 Alphabet label D Area in sq km 6155
EDA Type Environments and extended descriptors East Antarctic coastal geologic
Average Temp (°C) –15.28 Seasonal Range (°C) –18.35
Average Solar Radiation (MJ/m2/day) 9.88
Diurnal Length (Days) 334.65 Average Wind Speed (m/sec) 16.14
Slope (°) 10.94 Ice Free 100%
Ice Sheet 0% Ice Shelf 0%
Ice Tongues 0% Rumples 0%
Sedimentary 1% Metamorphic 7%
Intrusive 74% Volcanic 0%
45
Landcare Research
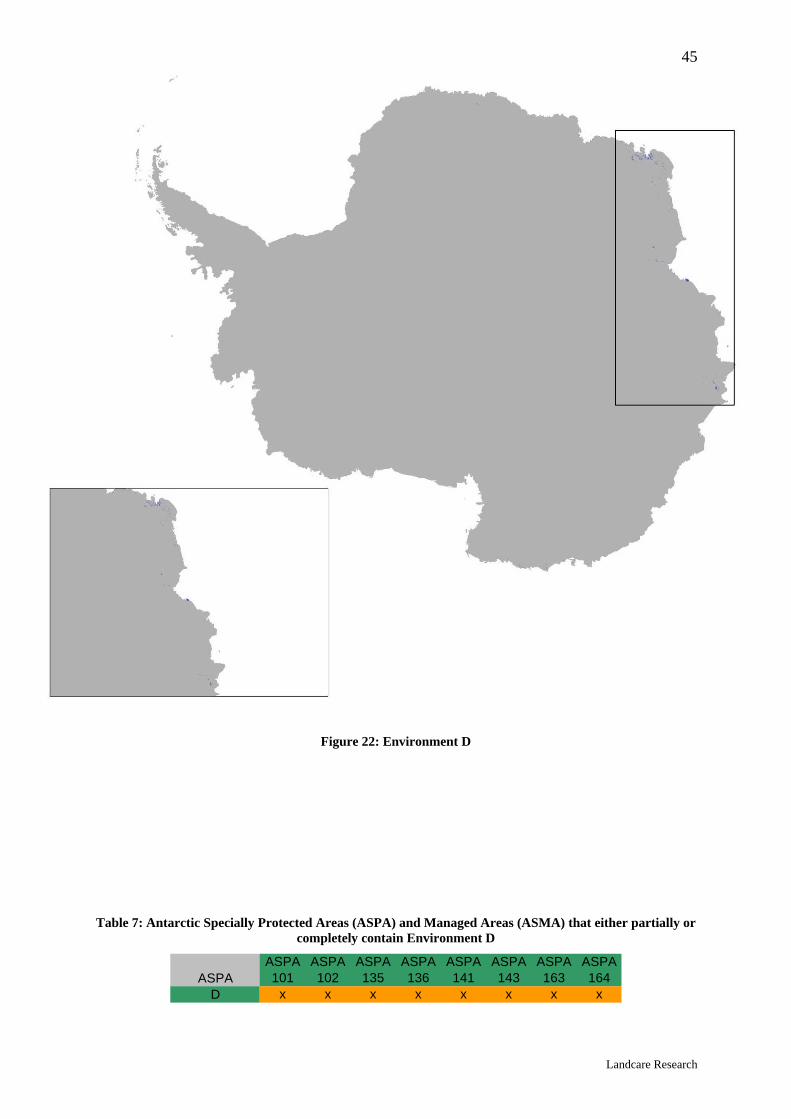
Figure 22: Environment D
Table 7: Antarctic Specially Protected Areas (ASPA) and Managed Areas (ASMA) that either partially or
completely contain Environment D
ASPAASPA 101
ASPA 102
ASPA 135
ASPA 136
ASPA 141
ASPA 143
ASPA 163
ASPA 164
D x x x x x x x x
46
Landcare Research
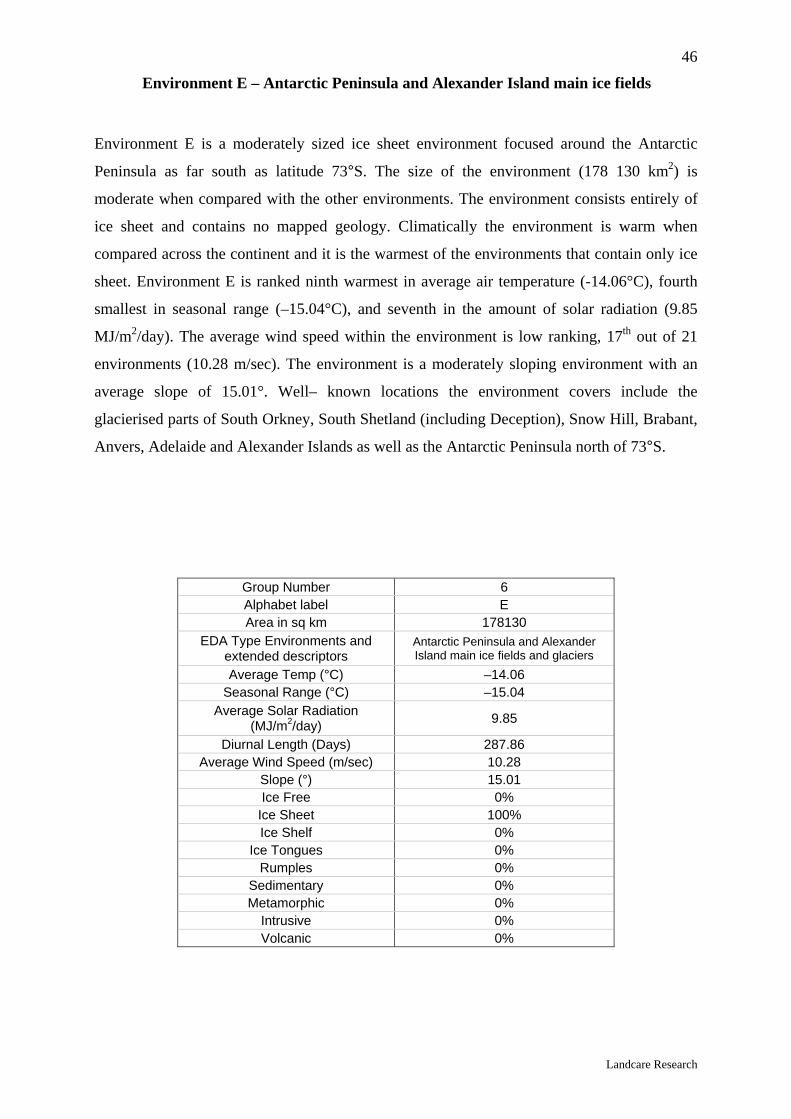
Environment E – Antarctic Peninsula and Alexander Island main ice fields
Environment E is a moderately sized ice sheet environment focused around the Antarctic
Peninsula as far south as latitude 73°S. The size of the environment (178 130 km2) is
moderate when compared with the other environments. The environment consists entirely of
ice sheet and contains no mapped geology. Climatically the environment is warm when
compared across the continent and it is the warmest of the environments that contain only ice
sheet. Environment E is ranked ninth warmest in average air temperature (-14.06°C), fourth
smallest in seasonal range (–15.04°C), and seventh in the amount of solar radiation (9.85
MJ/m2/day). The average wind speed within the environment is low ranking, 17th out of 21
environments (10.28 m/sec). The environment is a moderately sloping environment with an
average slope of 15.01°. Well– known locations the environment covers include the
glacierised parts of South Orkney, South Shetland (including Deception), Snow Hill, Brabant,
Anvers, Adelaide and Alexander Islands as well as the Antarctic Peninsula north of 73°S.
Group Number 6 Alphabet label E Area in sq km 178130
EDA Type Environments and extended descriptors
Antarctic Peninsula and Alexander Island main ice fields and glaciers
Average Temp (°C) –14.06 Seasonal Range (°C) –15.04
Average Solar Radiation (MJ/m2/day) 9.85
Diurnal Length (Days) 287.86 Average Wind Speed (m/sec) 10.28
Slope (°) 15.01 Ice Free 0%
Ice Sheet 100% Ice Shelf 0%
Ice Tongues 0% Rumples 0%
Sedimentary 0% Metamorphic 0%
Intrusive 0% Volcanic 0%

47
Landcare Research
Figure 23: Environment E
Table 8: Antarctic Specially Protected Areas (ASPA) and Managed Areas (ASMA) that either partially or
completely contain Environment E
ASPAASPA 113
ASPA 114
ASPA 117
ASPA 126
ASPA 128
ASPA 129
ASPA 133
ASPA 134
ASPA 139
ASPA 147
ASPA 149
ASPA 152
E x x x x x x x x x x x x
ASMAASMA
1ASMA
4E x x

48
Landcare Research
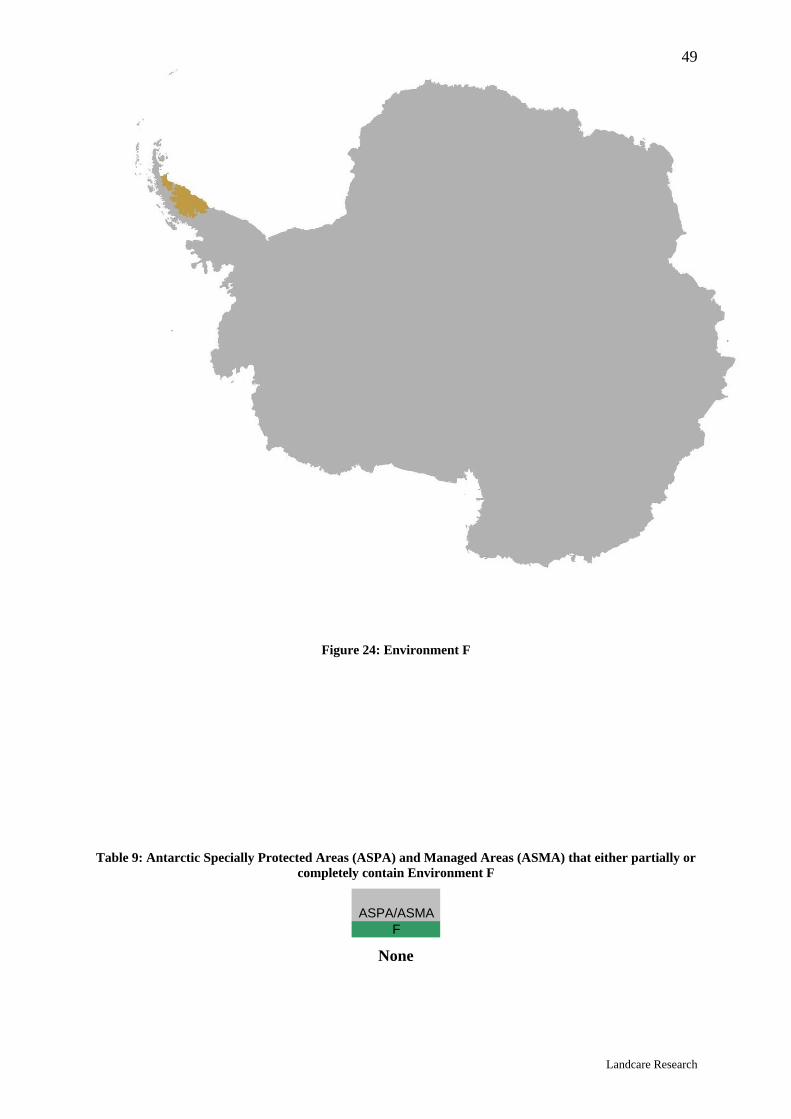
Environment F – Larsen Ice Shelf
Environment F is an ice shelf environment mainly on the east side of the Antarctic Peninsula,
in particular the Larsen C and remnants of the ice shelves to the north of it, plus small ice
shelves on the western side of the peninsula on the Graham and Loubet Coasts. At only 66
520 km2, the environment is small in the context of the Antarctic continent. It consists entirely
of ice-shelf land cover and therefore contains no geology. Climatically the environment is
warm in comparison with the other environments. Environment F is a warm environment with
the second warmest average air temperature (–10.29 °C) but only the eighth smallest seasonal
range (–17.87 °C). The wind speed within the environment is calm, with an average speed of
10.29 m/sec. As one would expect in an ice shelf environment the slope is almost non-existent
at only 2.17°, making it the second flattest environment on the continent. Well-known
locations the environment currently covers include a remnant of the Prince Gustav Channel
ice shelf at 64° 30’S on the southwestern side of Snow Hill Island, remnants of Larsen B Ice
Shelf remaining after its recent catastrophic collapse in January–March 2003 (Figure 24
shows Larsen B before the collapse), Larsen Ice Shelf from 65° to 69° 30’S at Hearst Island,
and Muller Ice Shelf on the west coast at 67° 15’S in Lallemand Fiord on the northern side of
Arrowsmith Peninsula.
Group Number 20 Alphabet label F Area in sq km 66520
EDA Type Environments and extended descriptors Larsen Ice Shelf
Average Temp (°C) –10.29 Seasonal Range (°C) –17.87
Average Solar Radiation (MJ/m2/day) 9.92
Diurnal Length (Days) 346.34 Average Wind Speed (m/sec) 10.29
Slope (°) 2.17 Ice Free 0%
Ice Sheet 0% Ice Shelf 100%
Ice Tongues 0% Rumples 0%
Sedimentary 0% Metamorphic 0%
Intrusive 0% Volcanic 0%
49
Landcare Research
Figure 24: Environment F
Table 9: Antarctic Specially Protected Areas (ASPA) and Managed Areas (ASMA) that either partially or
completely contain Environment F
ASPA/ASMAF
None

50
Landcare Research
Environment G – Antarctic Peninsula offshore island geologic
Environment G is a very small terrestrial environment focused around the Antarctic Peninsula
and associated offshore islands such as Deception Island. At 966 km2 it is by far the smallest
environment within the classification. The environment consists entirely of ice-free land cover
and contains a combination of three geological units – sedimentary (2%), intrusive (24%), and
volcanic (28%). Climatically the environment is the warmest in the classification with an
average air temperature of only –3.29°C, has the smallest seasonal range at –8.82°C, and
receives the highest level of solar radiation at 10.64 MJ/m2/day. The average wind speed
within the environment is moderate, at 13.86 m/sec. The environment is moderately sloping
with an average slope of 13.41°. Well-known locations the environment covers include parts
of ice free areas on South Shetland Islands such as Fildes Peninsula on King George Island,
and small points on the Antarctic Peninsula along Davis Coast.
Group Number 31 Alphabet label G Area in sq km 966
EDA Type Environments and extended descriptors Antarctic Peninsula offshore islands
Average Temp (°C) –3.29 Seasonal Range (°C) –8.82
Average Solar Radiation (MJ/m2/day) 10.64
Diurnal Length (Days) 364.28 Average Wind Speed (m/sec) 13.86
Slope (°) 13.41 Ice Free 100%
Ice Sheet 0% Ice Shelf 0%
Ice Tongues 0% Rumples 0%
Sedimentary 2% Metamorphic 0%
Intrusive 24% Volcanic 28%

51
Landcare Research
Figure 25: Environment G
Table 10: Antarctic Specially Protected Areas (ASPA) and Managed Areas (ASMA) that either partially
or completely contain Environment G
ASPAASPA 109
ASPA 111
ASPA 112
ASPA 114
ASPA 125
ASPA 126
ASPA 128
ASPA 132
ASPA 140
ASPA 145
ASPA 149
ASPA 150
ASPA 152
G x x x x x x x x x x x x x
ASMAASMA
1ASMA
4G x x

52
Landcare Research
Environment H – East Antarctic low latitude glacier tongues
Environment H is a small ice tongue environment focused around the Oates and George V
Coasts between 144° and 162°E within latitudes 66° 40’S to 73°S. The size of the
environment (14 611 km2) is small, and when compared with the other environments it is the
fifth smallest. The environment consists entirely of ice tongue and contains no mapped
geology. Climatically the environment is warm in comparison to the other environments.
Environment H is ranked sixth warmest in average air temperature (–12.57°C), fifth smallest
in seasonal range (–16.08°C), and fifth in the amount of solar radiation (9.88 MJ/m2/day). The
environment is windy, with an average wind speed of 16.58 m/sec which makes it the third
fastest environment. As one would expect with an environment consisting entirely of ice
tongues, the average slope is a low 3.31°, making it the fifth flattest environment. The largest
ice tongues contained within this environment are Mertz, Ninnis and Rennick Glacier
tongues.
Group Number 3 Alphabet label H Area in sq km 14611
EDA Type Environments and extended descriptors
East Antarctic low latitude glacier tongues
Average Temp (°C) –12.57 Seasonal Range (°C) –16.08
Average Solar Radiation (MJ/m2/day) 9.88
Diurnal Length (Days) 337.96 Average Wind Speed (m/sec) 16.58
Slope (°) 3.31 Ice Free 0%
Ice Sheet 0% Ice Shelf 0%
Ice Tongues 100% Rumples 0%
Sedimentary 0% Metamorphic 0%
Intrusive 0% Volcanic 0%

53
Landcare Research
Figure 26: Environment H
Table 11: Antarctic Specially Protected Areas (ASPA) and Managed Areas (ASMA) that either partially
or completely contain Environment H
ASPA/ASMAH
None

54
Landcare Research
Environment I – East Antarctic ice shelves
Environment I is a moderately sized ice shelf environment spread around the coast of East
Antarctica from Kapp Norwegia (12°W) to Moubray Bay (170°E). The environment covers
273 119 km2, which makes it the seventh largest. The environment consists entirely of ice
shelves and therefore contains no geology. Climatically the environment is warm in
comparison to the other environments, based upon its coastal location. It is ranked fifth
warmest in average air temperature (–11.74°C), seventh smallest in seasonal range (–17.70°C)
and eighth in the level of solar radiation (9.83 MJ/m2/day). The environment is windy with an
average wind speed of 16.66 m/sec (second fastest). As one would expect in an ice shelf
environment the slope is almost non-existent at only 2.50°, making it the third flattest
environment on the continent. Well-known locations the environment covers are Fimbulisen,
Amery, West, Shackleton and Cook Ice Shelves. The Shackleton, West and small ice shelves
on BANZARE and Wilkes Coasts extend north to between latitudes 66° 30’S and 65°S and
are the northernmost outside the Antarctic Peninsula.
Group Number 157 Alphabet label I Area in sq km 273119
EDA Type Environments and extended descriptors East Antarctic ice shelves
Average Temp (°C) –11.74 Seasonal Range (°C) –17.70
Average Solar Radiation (MJ/m2/day) 9.83
Diurnal Length (Days) 291.82 Average Wind Speed (m/sec) 16.66
Slope (°) 2.50 Ice Free 0%
Ice Sheet 0% Ice Shelf 100%
Ice Tongues 0% Rumples 0%
Sedimentary 0% Metamorphic 0%
Intrusive 0% Volcanic 0%

55
Landcare Research
Figure 27: Environment I
Table 12: Antarctic Specially Protected Areas (ASPA) and Managed Areas (ASMA) that either partially
or completely contain Environment I
ASPAASPA 163
I x
56
Landcare Research
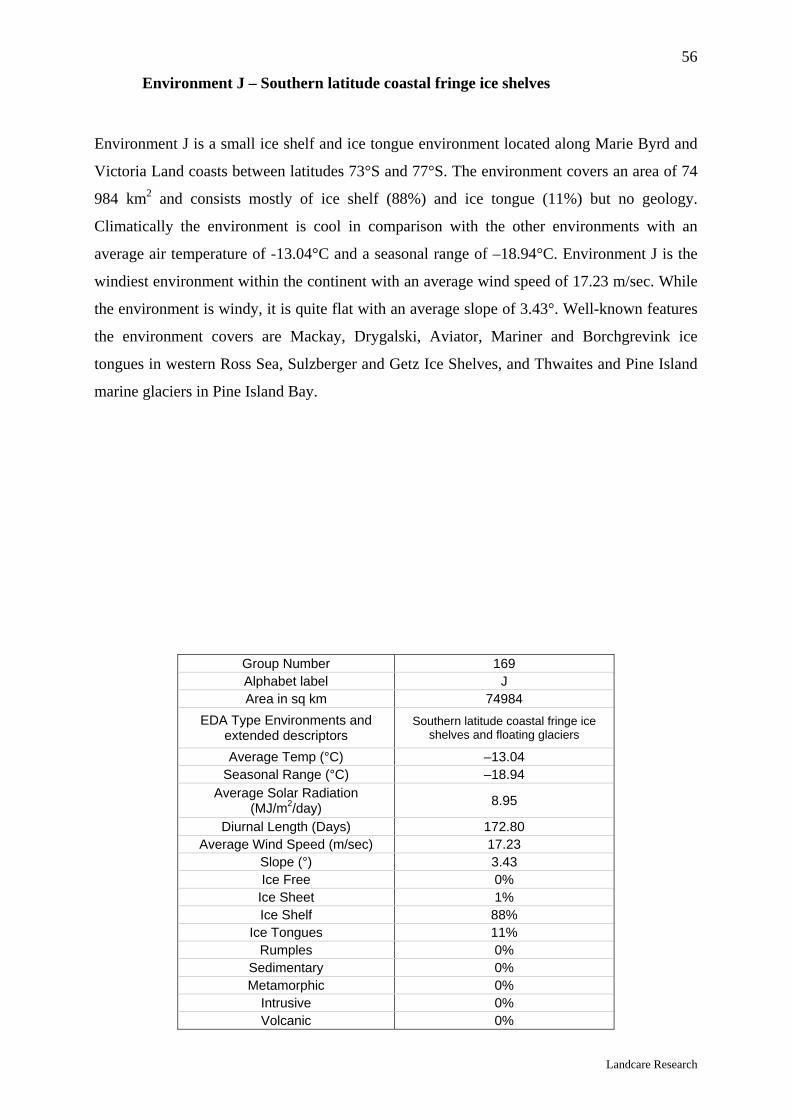
Environment J – Southern latitude coastal fringe ice shelves
Environment J is a small ice shelf and ice tongue environment located along Marie Byrd and
Victoria Land coasts between latitudes 73°S and 77°S. The environment covers an area of 74
984 km2 and consists mostly of ice shelf (88%) and ice tongue (11%) but no geology.
Climatically the environment is cool in comparison with the other environments with an
average air temperature of -13.04°C and a seasonal range of –18.94°C. Environment J is the
windiest environment within the continent with an average wind speed of 17.23 m/sec. While
the environment is windy, it is quite flat with an average slope of 3.43°. Well-known features
the environment covers are Mackay, Drygalski, Aviator, Mariner and Borchgrevink ice
tongues in western Ross Sea, Sulzberger and Getz Ice Shelves, and Thwaites and Pine Island
marine glaciers in Pine Island Bay.
Group Number 169 Alphabet label J Area in sq km 74984
EDA Type Environments and extended descriptors
Southern latitude coastal fringe ice shelves and floating glaciers
Average Temp (°C) –13.04 Seasonal Range (°C) –18.94
Average Solar Radiation (MJ/m2/day) 8.95
Diurnal Length (Days) 172.80 Average Wind Speed (m/sec) 17.23
Slope (°) 3.43 Ice Free 0%
Ice Sheet 1% Ice Shelf 88%
Ice Tongues 11% Rumples 0%
Sedimentary 0% Metamorphic 0%
Intrusive 0% Volcanic 0%

57
Landcare Research
Figure 28: Environment J
Table 13: Antarctic Specially Protected Areas (ASPA) and Managed Areas (ASMA) that either partially
or completely contain Environment J
ASPA/ASMAJ
None

58
Landcare Research
Environment K – Northern latitude ice shelves
Environment K is a moderately sized ice shelf environment located in four key areas around
the continent, along Victoria Land coast, Eights Coast, southern Antarctic Peninsula and
southwest and east coasts of Weddell Sea between latitudes 70°S and 76°S. The environment
covers an area of 191 085 km2, consists entirely of ice shelf, and contains no mapped geology.
Climatically the environment is cool with an average air temperature of –13.48°C and has the
ninth largest seasonal range at –19.54°C. The average wind speed in the environment is
moderate at 12.00 m/sec. As one would expect in an ice shelf environment the slope is almost
non-existent at only 2.79°, making it the fourth flattest environment on the continent. Well-
known features included in the environment are Tucker Glacier and Nansen Ice Shelf in
western Ross Sea, Abbot, George VI, Wilkins, Bach, Wordie Ice Shelves, narrow ice shelves
fringing Black and Lassiter Coasts, and Brunt Ice Shelf and Riser-Larsenisen.
Group Number 222 Alphabet label K Area in sq km 191085
EDA Type Environments and extended descriptors Northern latitude ice shelves
Average Temp (°C) –13.48 Seasonal Range (°C) –19.54
Average Solar Radiation (MJ/m2/day) 9.33
Diurnal Length (Days) 207.41 Average Wind Speed (m/sec) 12.00
Slope (°) 2.79 Ice Free 0%
Ice Sheet 0% Ice Shelf 100%
Ice Tongues 0% Rumples 0%
Sedimentary 0% Metamorphic 0%
Intrusive 0% Volcanic 0%

59
Landcare Research
Figure 29: Environment K
Table 14: Antarctic Specially Protected Areas (ASPA) and Managed Areas (ASMA) that either partially
or completely contain Environment K
ASPAASPA 147
K x
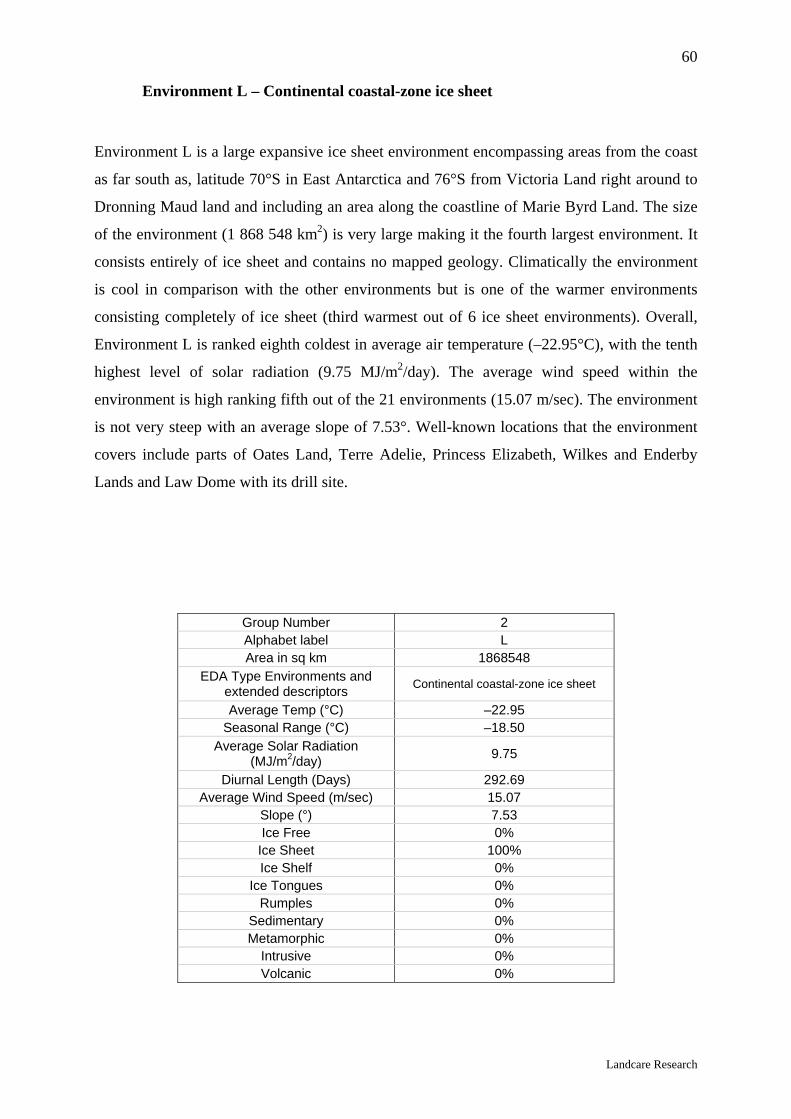
60
Landcare Research
Environment L – Continental coastal-zone ice sheet
Environment L is a large expansive ice sheet environment encompassing areas from the coast
as far south as, latitude 70°S in East Antarctica and 76°S from Victoria Land right around to
Dronning Maud land and including an area along the coastline of Marie Byrd Land. The size
of the environment (1 868 548 km2) is very large making it the fourth largest environment. It
consists entirely of ice sheet and contains no mapped geology. Climatically the environment
is cool in comparison with the other environments but is one of the warmer environments
consisting completely of ice sheet (third warmest out of 6 ice sheet environments). Overall,
Environment L is ranked eighth coldest in average air temperature (–22.95°C), with the tenth
highest level of solar radiation (9.75 MJ/m2/day). The average wind speed within the
environment is high ranking fifth out of the 21 environments (15.07 m/sec). The environment
is not very steep with an average slope of 7.53°. Well-known locations that the environment
covers include parts of Oates Land, Terre Adelie, Princess Elizabeth, Wilkes and Enderby
Lands and Law Dome with its drill site.
Group Number 2 Alphabet label L Area in sq km 1868548
EDA Type Environments and extended descriptors Continental coastal-zone ice sheet
Average Temp (°C) –22.95 Seasonal Range (°C) –18.50
Average Solar Radiation (MJ/m2/day) 9.75
Diurnal Length (Days) 292.69 Average Wind Speed (m/sec) 15.07
Slope (°) 7.53 Ice Free 0%
Ice Sheet 100% Ice Shelf 0%
Ice Tongues 0% Rumples 0%
Sedimentary 0% Metamorphic 0%
Intrusive 0% Volcanic 0%

61
Landcare Research
Figure 30: Environment L
Table 15: Antarctic Specially Protected Areas (ASPA) and Managed Areas (ASMA) that either partially
or completely contain Environment L
ASPA
ASPA 102
ASPA 103
ASPA 127
ASPA 136
ASPA 164
L x x x x x
ASMAASMA
3L x
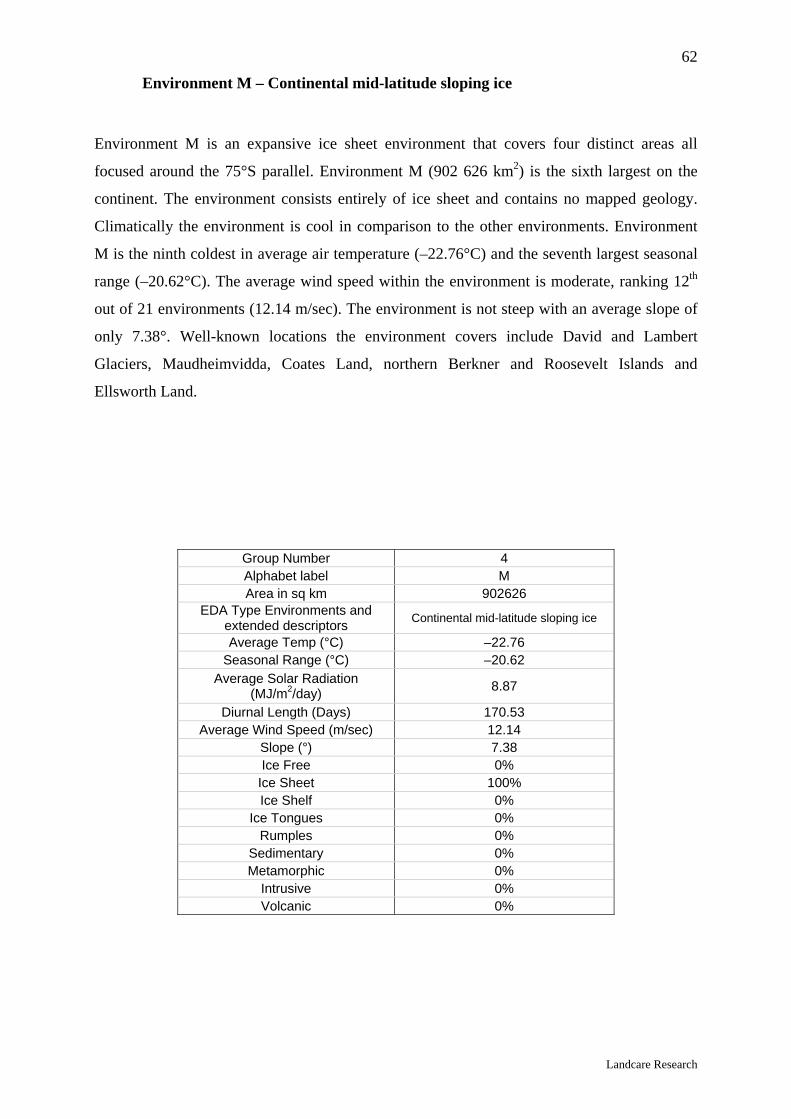
62
Landcare Research
Environment M – Continental mid-latitude sloping ice
Environment M is an expansive ice sheet environment that covers four distinct areas all
focused around the 75°S parallel. Environment M (902 626 km2) is the sixth largest on the
continent. The environment consists entirely of ice sheet and contains no mapped geology.
Climatically the environment is cool in comparison to the other environments. Environment
M is the ninth coldest in average air temperature (–22.76°C) and the seventh largest seasonal
range (–20.62°C). The average wind speed within the environment is moderate, ranking 12th
out of 21 environments (12.14 m/sec). The environment is not steep with an average slope of
only 7.38°. Well-known locations the environment covers include David and Lambert
Glaciers, Maudheimvidda, Coates Land, northern Berkner and Roosevelt Islands and
Ellsworth Land.
Group Number 4 Alphabet label M Area in sq km 902626
EDA Type Environments and extended descriptors Continental mid-latitude sloping ice
Average Temp (°C) –22.76 Seasonal Range (°C) –20.62
Average Solar Radiation (MJ/m2/day) 8.87
Diurnal Length (Days) 170.53 Average Wind Speed (m/sec) 12.14
Slope (°) 7.38 Ice Free 0%
Ice Sheet 100% Ice Shelf 0%
Ice Tongues 0% Rumples 0%
Sedimentary 0% Metamorphic 0%
Intrusive 0% Volcanic 0%
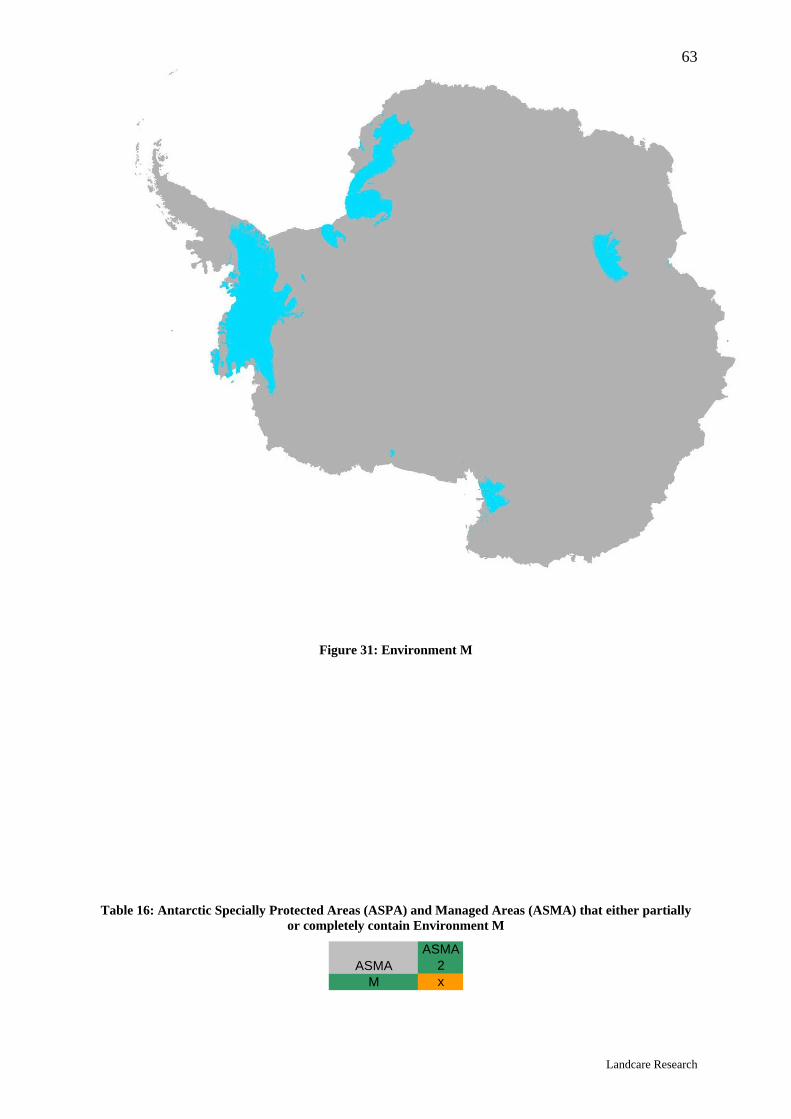
63
Landcare Research
Figure 31: Environment M
Table 16: Antarctic Specially Protected Areas (ASPA) and Managed Areas (ASMA) that either partially
or completely contain Environment M
ASMAASMA
2M x

64
Landcare Research
Environment N – East Antarctic inland ice sheet
Environment N is an immense ice sheet environment that covers a large swath of the
continent between the 70°S and 76°S parallels from Victoria to Dronning Maud Lands. The
size of the environment is enormous at 3 058 936 km2, and only environment I is larger. The
environment consists entirely of ice sheet land cover and contains no mapped geology.
Climatically the environment is extremely cold with an average air temperature of –39.25°C
(second coldest) and a seasonal range of –22.82°C (fifth largest). The average wind speed
within the environment is moderate at 12.81 m/sec. The environment is mostly flat with an
average slope of 4.09°. Well-known locations the environment covers are the EPICA DML,
Dome Fuji and Dome Talos drill holes.
Group Number 94 Alphabet label N Area in sq km 3058936
EDA Type Environments and extended descriptors East Antarctic inland ice sheet
Average Temp (°C) –39.25 Seasonal Range (°C) –22.82
Average Solar Radiation (MJ/m2/day) 9.35
Diurnal Length (Days) 210.64 Average Wind Speed (m/sec) 12.81
Slope (°) 4.09 Ice Free 0%
Ice Sheet 100% Ice Shelf 0%
Ice Tongues 0% Rumples 0%
Sedimentary 0% Metamorphic 0%
Intrusive 0% Volcanic 0%

65
Landcare Research
Figure 32: Environment N
Table 17: Antarctic Specially Protected Areas (ASPA) and Managed Areas (ASMA) that either partially
or completely contain Environment N
ASPAASPA 142
N x

66
Landcare Research
Environment O – West Antarctic Ice Sheet
Environment O is a large, expansive ice sheet environment which encompasses areas as far
north as latitude 77°S to 87°S mostly in West Antarctica. At 2 256 425 km2 it is the third
largest environment within the continent. The environment consists entirely of ice sheet and
contains no mapped geology. Climatically the environment is cold with an average air
temperature of –28.60°C (fourth coldest) and the second lowest level of solar radiation (7.48
MJ/m2/day). The average wind speed within the environment is average, ranking ninth fastest
(13.38 m/sec). The environment is quite flat with an average slope of 4.93°. Well-known
locations the environment includes are most of Ross Island, southern Roosevelt and Berkner
Islands, Crary and Henry Ice Rises, Edward VII Peninsula to Ellsworth Land then east across
the southern Trans Antarctic Mountains and north to eastern Coates Land and upper parts of
the East Antarctic Ice Sheet that feed Byrd, Skelton and Mackay Glaciers, plus the drill holes
at Byrd, Siple and Taylor Dome.
Group Number 9 Alphabet label O Area in sq km 2256425
EDA Type Environments and extended descriptors West Antarctic Ice Sheet
Average Temp (°C) –28.60 Seasonal Range (°C) –22.74
Average Solar Radiation (MJ/m2/day) 7.48
Diurnal Length (Days) 98.60 Average Wind Speed (m/sec) 13.38
Slope (°) 4.93 Ice Free 0%
Ice Sheet 100% Ice Shelf 0%
Ice Tongues 0% Rumples 0%
Sedimentary 0% Metamorphic 0%
Intrusive 0% Volcanic 0%

67
Landcare Research
Figure 33: Environment O
Table 18: Antarctic Specially Protected Areas (ASPA) and Managed Areas (ASMA) that either partially
or completely contain Environment O
ASPAASPA 119
ASPA 123
ASPA 137
ASPA 156
O x x x x
ASMAASMA
2O x

68
Landcare Research
Environment P – Ross and Ronne-Filchner ice shelves
Environment P is a large ice shelf environment that encompasses the two largest ice shelves
on the continent, the Ross and the Ronne-Filchner ice shelves. At 926 631 km2 it is the fifth
largest environment. It consists entirely of ice shelf land cover, apart from the only mapped
area of rumples (known as Doake Ice Rumples) located on southern Ronne Ice Shelf. The
environment contains no mapped geology. Climatically the environment is cold when
compared with other environments with an average air temperature of –22.23°C and the third
largest seasonal range at –26.39°C. The wind speed for the environment is moderate at 11.70
m/sec. As one would expect within this large ice shelf environment the slope is quite flat at an
average slope across 926 631 km2 of only 0.97°, making it the flattest environment on the
continent.
Group Number 223 Alphabet label P Area in sq km 926631
EDA Type Environments and extended descriptors Ross and Ronne-Filchner ice shelves
Average Temp (°C) –22.23 Seasonal Range (°C) –26.39
Average Solar Radiation (MJ/m2/day) 7.83
Diurnal Length (Days) 113.03 Average Wind Speed (m/sec) 11.70
Slope (°) 0.97 Ice Free 0%
Ice Sheet 0.67% Ice Shelf 99%
Ice Tongues 0% Rumples 0.33%
Sedimentary 0% Metamorphic 0%
Intrusive 0% Volcanic 0%

69
Landcare Research
Figure 34: Environment P
Table 19: Antarctic Specially Protected Areas (ASPA) and Managed Areas (ASMA) that either partially
or completely contain Environment P
ASPAASPA 121
ASPA 124
ASPA 137
ASPA 157
P x x x x
ASMAASMA
2P x

70
Landcare Research
Environment Q – East Antarctic high interior ice sheet
Environment Q is a large environment focused around the South Pole. The size of the
environment (3 709 111 km2) is immense and is the largest environment within the
classification (by 650 000 km2). The environment consists entirely of ice sheet land cover.
Climatically the environment is extremely cold, and holds a number of distinctions: it
contains the coldest annual air temperature (–47.64°C) and largest seasonal range (–29.50°C).
The environment also has the third lowest level of solar radiation (7.56 MJ/m2/day). The
average wind speed (9.99 m/sec) is quite calm in comparison with the other environments. It
is also quite flat, with an average slope of only 3.10°. Well-known locations the environment
covers include the South Pole, Vostok and Dome C station areas and drill holes.
Group Number 14 Alphabet label Q Area in sq km 3709111
EDA Type Environments and extended descriptors East Antarctic high interior ice sheet
Average Temp (°C) –47.64 Seasonal Range (°C) –29.50
Average Solar Radiation (MJ/m2/day) 7.56
Diurnal Length (Days) 105.19 Average Wind Speed (m/sec) 9.99
Slope (°) 3.10 Ice Free 0%
Ice Sheet 100% Ice Shelf 0%
Ice Tongues 0% Rumples 0%
Sedimentary 0% Metamorphic 0%
Intrusive 0% Volcanic 0%

71
Landcare Research
Figure 35: Environment Q
Table 20: Antarctic Specially Protected Areas (ASPA) and Managed Areas (ASMA) that either partially
or completely contain Environment Q
ASMAASMA
2Q x

72
Landcare Research
Environment R – Transantarctic Mountains geologic
Environment R is a small environment focused along the Transantarctic Mountains mostly
south of 80°S. The size of the environment (31 581 km2) is small when compared with some
of the larger environments. It consists mostly of ice-free land cover (98%) and contains a
combination of all four geological units – sedimentary (65%), metamorphic (2%), intrusive
(24%), and volcanic (3%). Climatically the environment is extremely cold, reaching an
average air temperature of –34.79°C (third coldest) along with the second largest in seasonal
range (–26.43°C). The average wind speed within the environment is very calm at 10.24
m/sec (third calmest). The environment is a very steep one with an average slope of 27.90°,
making it the third steepest environment on the continent. Well-known locations the
environment covers extend from the Britannia to Shackleton Ranges, including Queen Maud,
Theil and Theron Mountains.
Group Number 13 Alphabet label R Area in sq km 31581
EDA Type Environments and extended descriptors Transantarctic Mountains geologic
Average Temp (°C) –34.79 Seasonal Range (°C) –26.43
Average Solar Radiation (MJ/m2/day) 6.70
Diurnal Length (Days) 66.14 Average Wind Speed (m/sec) 10.24
Slope (°) 27.90 Ice Free 98%
Ice Sheet 2% Ice Shelf 0%
Ice Tongues 0% Rumples 0%
Sedimentary 65% Metamorphic 2%
Intrusive 24% Volcanic 3%

73
Landcare Research
Figure 36: Environment R
Table 21: Antarctic Specially Protected Areas (ASPA) and Managed Areas (ASMA) that either partially
or completely contain Environment R
ASPAASPA 119
R x

74
Landcare Research
Environment S – McMurdo – South Victoria Land geologic
Environment S is a small environment which is focused around the McMurdo Dry Valleys,
plus Ellsworth Mountains, mountains west of Ronne Ice Shelf and in southern Mac Robertson
Land. It is a small environment (28 227 km2) compared with most of the other environments.
The environment consists mostly of ice-free land cover (98%) and contains a combination of
three geological units – sedimentary (47%), intrusive (24%), and volcanic (8%). Climatically
the environment is cold with an average temperature of –26.21°C (fifth coldest) and a
seasonal range of –23.00°C (fourth largest). The average wind speed for the environment is
calm, at only 10.26 m/sec, but it is a very steep environment with an average slope of 24.12°
making it the fifth steepest environment within the continent. Well-known locations the
environment covers are Erebus Volcano and other ice-free areas on Ross Island, most of
Inexpressible Island, Mt Joyce, Ricker and Allen Hills, Brimstone Peak, Royal Society and
Warren Ranges and other ranges and nunataks in central and South Victoria Land, the Vinson
Massif, and Mt Borland in southern Prince Charles Mountains.
Group Number 15 Alphabet label S Area in sq km 28227
EDA Type Environments and extended descriptors
McMurdo –- South Victoria Land geologic
Average Temp (°C) –26.21 Seasonal Range (°C) –23.00
Average Solar Radiation (MJ/m2/day) 8.52
Diurnal Length (Days) 150.58 Average Wind Speed (m/sec) 10.26
Slope (°) 24.12 Ice Free 98%
Ice Sheet 2% Ice Shelf 0%
Ice Tongues 0% Rumples 0%
Sedimentary 47% Metamorphic 0%
Intrusive 24% Volcanic 8%

75
Landcare Research
Figure 37: Environment S
Table 22: Antarctic Specially Protected Areas (ASPA) and Managed Areas (ASMA) that either partially
or completely contain Environment S
ASPAASPA 105
ASPA 121
ASPA 122
ASPA 123
ASPA 124
ASPA 131
ASPA 137
ASPA 138
ASPA 154
ASPA 155
ASPA 156
ASPA 161
S x x x x x x x x x x x x
ASMAASMA
2S x

76
Landcare Research
Environment T – Inland continental geologic
Environment T is a small but extensive terrestrial environment which encompasses a number
of locations around the continent, in particular in North Victoria, Mac Robertson and
Dronning Maud Lands and a small part of northwest Marie Byrd Land. While the
environment is diverse, it covers only 24 742 km2. Interestingly, a common thread among the
environments is their location between the 70°S and 75°S parallels. The environment consists
entirely of ice free land cover and contains a combination of all four geological units –
sedimentary (11%), metamorphic (14%), intrusive (71%), and volcanic (1%). The
environment is cold, with it ranked the sixth coldest at an average air temperature of –
25.98°C, and the eighth largest in seasonal range at –19.64 °C. The average wind speed
within the environment is above average at 14.95 m/sec (sixth fastest). Environment T is a
steep environment with an average slope of 23.53° making it the sixth steepest environment
within the continent. Well-known locations the environment covers are Deep Freeze Range,
USARP and Grove Mountains, Mawson Escarpment, Sor Rondane and Ford Range.
Group Number 46 Alphabet label T Area in sq km 24742
EDA Type Environments and extended descriptors Inland continental geologic
Average Temp (°C) –25.98 Seasonal Range (°C) –19.64
Average Solar Radiation (MJ/m2/day) 9.39
Diurnal Length (Days) 212.37 Average Wind Speed (m/sec) 14.95
Slope (°) 23.53 Ice Free 100%
Ice Sheet 0% Ice Shelf 0%
Ice Tongues 0% Rumples 0%
Sedimentary 11% Metamorphic 14%
Intrusive 71% Volcanic 1%
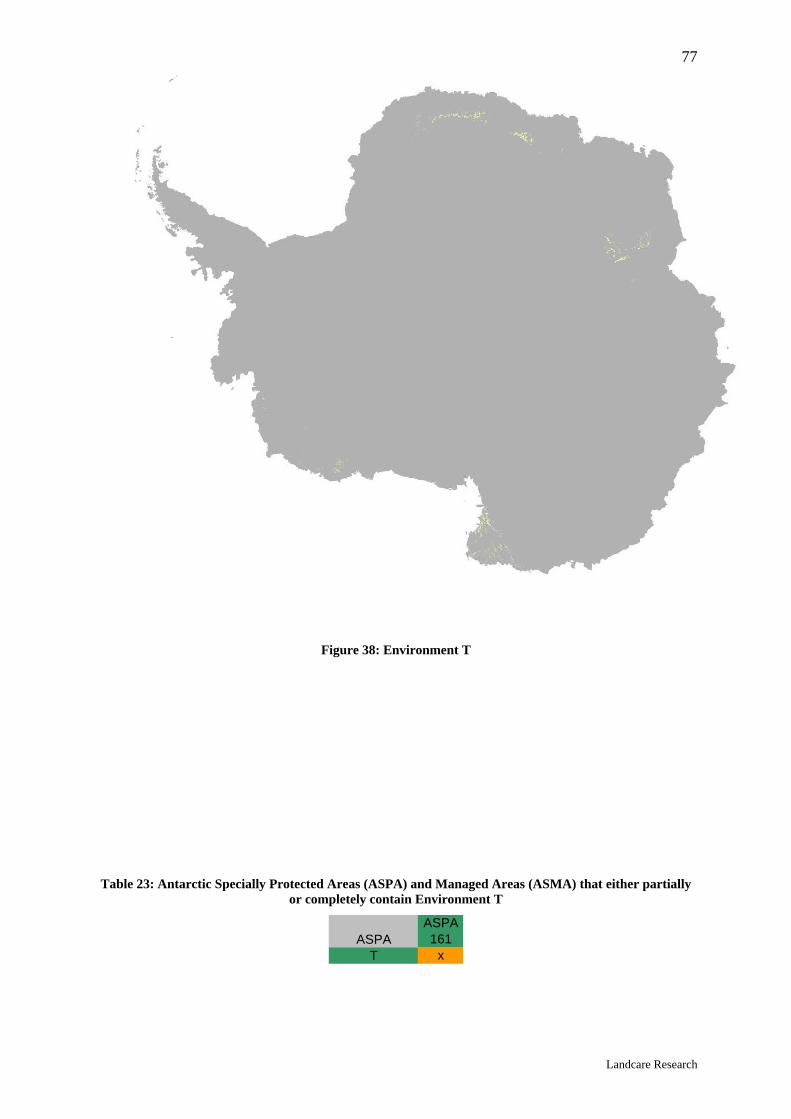
77
Landcare Research
Figure 38: Environment T
Table 23: Antarctic Specially Protected Areas (ASPA) and Managed Areas (ASMA) that either partially
or completely contain Environment T
ASPAASPA 161
T x
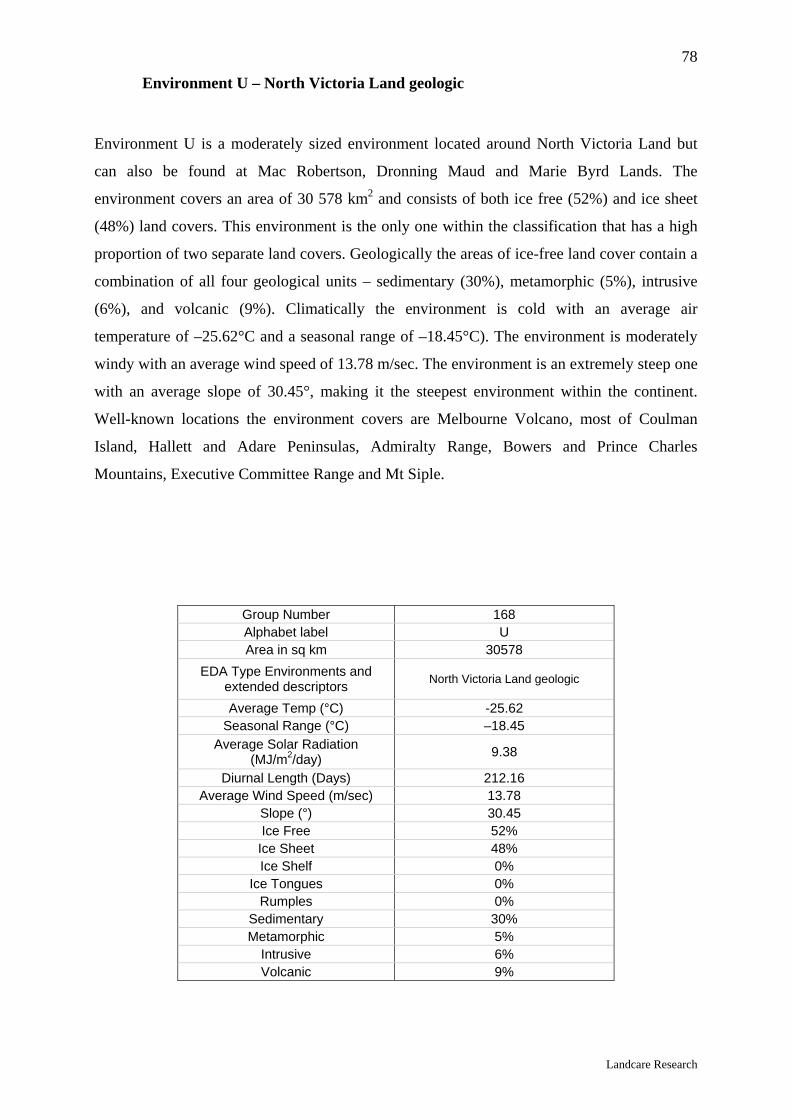
78
Landcare Research
Environment U – North Victoria Land geologic
Environment U is a moderately sized environment located around North Victoria Land but
can also be found at Mac Robertson, Dronning Maud and Marie Byrd Lands. The
environment covers an area of 30 578 km2 and consists of both ice free (52%) and ice sheet
(48%) land covers. This environment is the only one within the classification that has a high
proportion of two separate land covers. Geologically the areas of ice-free land cover contain a
combination of all four geological units – sedimentary (30%), metamorphic (5%), intrusive
(6%), and volcanic (9%). Climatically the environment is cold with an average air
temperature of –25.62°C and a seasonal range of –18.45°C). The environment is moderately
windy with an average wind speed of 13.78 m/sec. The environment is an extremely steep one
with an average slope of 30.45°, making it the steepest environment within the continent.
Well-known locations the environment covers are Melbourne Volcano, most of Coulman
Island, Hallett and Adare Peninsulas, Admiralty Range, Bowers and Prince Charles
Mountains, Executive Committee Range and Mt Siple.
Group Number 168 Alphabet label U Area in sq km 30578
EDA Type Environments and extended descriptors North Victoria Land geologic
Average Temp (°C) -25.62 Seasonal Range (°C) –18.45
Average Solar Radiation (MJ/m2/day) 9.38
Diurnal Length (Days) 212.16 Average Wind Speed (m/sec) 13.78
Slope (°) 30.45 Ice Free 52%
Ice Sheet 48% Ice Shelf 0%
Ice Tongues 0% Rumples 0%
Sedimentary 30% Metamorphic 5%
Intrusive 6% Volcanic 9%

79
Landcare Research
Figure 39: Environment U
Table 24: Antarctic Specially Protected Areas (ASPA) and Managed Areas (ASMA) that either partially
or completely contain Environment U
ASPAASPA 118
U x

80
Landcare Research
5. Conclusions and Recommendations
The above classification is the culmination of 4 years of work, and in our opinion represents the best available environmental classification for the Antarctic Continent. The classification has been revised and refined based on comments and assistance from Antarctica New Zealand and the international Antarctic community. In saying this, the classification will invariably be improved with more data.
We believe the Environmental classification outlined in this report is a robust framework for a systematic environmental geographic framework that will achieve most purposes described in Article 3(2) of Annex V to the Protocol on Environmental Protection to the Antarctic Treaty (1991). However, application of the classification will still benefit from further review and refinement of the environmental layers used to define the analysis, and in some cases from a greater consideration of the level of classification detail required for different management purposes.
5.1. Heterogeneity of the classification
One of the greatest benefits within the approach employed within this classification is its hierarchical nature. The dendrogram (Figure 40), produced within the classification process, highlights how each environment is related. The tree-like structure of the dendrogram shows the order in which the classification has progressively combined similar environments to form larger groups. For example, Figure 40 shows that there are 21 environments listed from A to U along the left hand side. Following the dendrogram for environment L, for example, shows that it is most similar to a small group of environments that contain M and N. Those three environments are closely related to environments O, P and Q. The next step in the tree shows that this group is then related to environments R, S, T and U. The final step shows a similarity with the remaining 11 environments.
How closely related the environments are can be seen where they join. The smaller the environmental distance, i.e. the closer each vertical line joining the environments is to the left-hand side of the dendrogram, the more similar the environments are. In the dendrogram (Figure 40) and at this level of classification, environments T and U are the most similar in nature, followed closely by environments M and N.
All comparisons and discussions about the similarity of environments should be done while examining the dendrogram to understand how similar or dissimilar the environments are.
5.2. Spatial location of Environments
Overall, the classification process fits with current ideas on how the Antarctic environment should be categorised. As in EDA version 1.0 of the classification there are a few unusual features based on the extreme Euclidean distance and the distinctive geography of Antarctica (i.e. areas of similar environments based around a central pole). As one might expect, areas of similar latitude are more likely to be combined because of the air temperature, wind speed, estimated solar radiation at top of atmosphere, and diurnal length layers, which are generally more strongly aligned with latitude. The delineation of the ice-free areas is more succinct because of the restriction of geological information to ice-free areas only.

81
Landcare Research
Figure 40: 21 Group Dendrogram for Version 2.0

82
Landcare Research
Working down from the top of the dendrogram (Figure 40) environments A (Antarctic Peninsula northern geologic) and B (Antarctic Peninsula mid-northern latitudes geologic) are closely related. Joining these two environments is a group consisting of environment C (Antarctic Peninsula southern geologic) and D (East Antarctic coastal geologic). This group almost completely covers the Antarctic Peninsula. The next two environments to fold into this group are environment E (Antarctic Peninsula and Alexander Island main) and F (Larsen Ice Shelf). These two environments contain more ice (both sheet and shelf) than the previous environments but because the climate attributes are so similar they fold into this large group, which is focused on the Antarctic Peninsula. Environment G (Antarctic Peninsula offshore islands) is loosely joined to this large group but is a distinct outlier.
Environments J (Southern latitude coastal fringe ice shelves and floating glaciers) and K (Northern latitude ice shelves) are closely related. While some parts of these environments are geographically disparate, their similar latitude makes them close climatically. These two environments join with environment I (East Antarctic ice shelves) to form a group consisting of the three geographic locations of ice shelves along latitude 67º S. Environment H (East Antarctic low latitude glacier tongues) joins this group as a small outlier because of the difference in ice cover.
Environments L (Continental coastal-zone ice sheet), M (Continental mid-latitude sloping ice) and N (East Antarctic inland ice sheet) are another closely related group based around latitudes relatively close to the coastline of Antarctica. This group, along with environments O (West Antarctic Ice Sheet), P (Ross and Ronne-Filchner ice shelves) and Q (East Antarctic high interior ice sheet), form a large group based around ice sheet or shelf areas that include some of the coldest locations on the continent.
The two remaining groups are geologic in nature. The first contains environment R (Transantarctic Mountains geologic) and S (McMurdo – South Victoria Land geologic) focused on the more southern ice free and geologic areas. The second, consisting of environments T (Inland continental geologic) and U (North Victoria Land geologic), centres on the northern (and warmer) geologic outcrops surrounding Victoria Land. Both these groups are closely related.
5.3. Future Directions
EDA Version 2.0 is the end of the active development work on the project. While every effort has been made to use the most up-to-date climate, geological and ice cover data, there will continue to be additional research which will contribute to the existing store of knowledge. If eventually included, such research will improve the classification. Additional high-quality climate readings could improve the classification immensely. Projects such as the International Polar Year research project COMPASS, which aims to create a comprehensive metrological dataset for scientific and applied studies, could allow the creation of much more accurate air temperature, wind speed and solar radiation data layers for the classification. Additional geological work, such as the permafrost research being compiled by Jim Bockheim within the Wright Valley, could eventually be developed into a continental geologic map that could be used within the classification. As previously discussed, the resulting classification relies heavily on the underlying data layers. Any improvement in these layers therefore will result in improvements in the classification.

83
Landcare Research
6. Acknowledgements
We acknowledge the support of Antarctica New Zealand, the Ministry of Foreign Affairs and Trade, the Ministry of the Environment and the Department of Conservation, who together funded this report and the previous reports in relation to this work.
We also acknowledge the following organisations that directly supplied or made available data on the Internet for use in or assistance with the classification, both in Version 2.0 and all the previous versions:
• The Automatic Weather Stations programme recompiled by the British Antarctic Survey on their READER website.
• Automatic Weather Stations Project (AWS) and Antarctic Meteorological Research Center (AMRC), Space Science and Engineering Center, University of Wisconsin-Madison (http://uwamrc.ssec.wisc.edu/aws.html).
• Antarctic Climate Data, Results From the SCAR READER Project http://www.antarctica.ac.uk/met/READER/).
• The McMurdo Dry Valleys Long-Term Ecological Research programme (http://huey.colorado.edu/LTER/).
• The United States Department of Agriculture, Natural Resources Conservation Service, National Soil Survey Center (USDA NRCS NSSC), Climate Station Data, which was supplied directly to us from researchers within the USDA. (http://soils.usda.gov/survey/scan/)
• Antarctic Digital Database (ADD) site, version 4.1 (http://www.add.scar.org/).
• VALMAP (Valleys in Antarctica: Layered Mapping, Analysis, and Planning) run by Mike Prentice from the University of New Hampshire (http://www.valmap.unh.edu/).
• The Antarctic Atlas created and maintained by the United States Antarctic Resource Center (USARC) from the United States Geological Survey (USGS) http://usarc.usgs.gov/antarctic_atlas/).
• The Australian Antarctic Data Centre, run by the Australian Antarctic Division (http://aadc-maps.aad.gov.au/aadc/portal/).
• Arctic and Antarctic Research Institute (AARI) run by the Federal Service for Hydrometeorology and Environmental Monitoring of Russian Federation (Roshydromet) (http://www.aari.nw.ru/)
• Committee for Environmental Protection (CEP) (http://www.cep.aq)
• Scientific Community on Antarctic Research (SCAR) (http://www.scar.org/)
The authors wish to acknowledge the comments and review of this report by Gary Barker from Landcare Research.
Finally, the authors wish to acknowledge the contribution towards this report from Neil Gilbert (Antarctica New Zealand) and Jackie Aislabie, Robert Gibb, Malcolm McLeod, Janice Willoughby, and Anne Austin (Landcare Research).

84
Landcare Research
7. References
Belbin L 1993. Environmental representativeness: regional partitioning and reserve selection. Biological Conservation 66: 223–230. Belbin, L 1995. PATN Pattern Analysis Package: Technical Reference. Division of Wildlife and Ecology, CSIRO, Australia. Committee for Environmental Protection. Antarctic Protected Areas Information Archive 2005. (http://www.cep.aq/apa/index.html) Faith DP, Nix HA, Margules CR, Hutchinson MF, Walker PA, West J, Stein JL, Kesteven JL, Allison A, Natera G 2001. The BioRap biodiversity assessment and planning study for Papua New Guinea. Pacific Conservation Biology 6: 325–343. Hutchinson MF, Gessler PE 1994. Splines – more than just a smooth interpolator. Geoderma 62: 45–67. Keage P 1987. Environmental zones and planning units – a basis for an Antarctic terrestrial protected area network. In: Dingwell PR ed. Conserving the natural heritage of the Antarctic realm. Gland, IUCN. Pp. 135–140. Kirkpatrick JB, Brown MJ 1994. A comparison of direct and environmental domain approaches to planning reservation of forest higher plant communities and species in Tasmania. Conservation Biology 8: 217–224. Leathwick JR 1995. Climatic relationships of some New Zealand forest tree species. Journal of Vegetation Science 6: 237–248. Leathwick JR 1998. Are New Zealand’s Nothofagus species in equilibrium with their environment? Journal of Vegetation Science 9: 719–732. Leathwick JR, Whitehead D 2001. Soil and atmospheric water deficits and the distributions of New Zealand’s indigenous tree species. Functional Ecology 15: 233–242. Leathwick JR, Morgan F, Wilson G, Rutledge D, McLeod M, Johnston K 2002a. Land environments of New Zealand: A technical guide. Wellington, Ministry for the Environment. 237 p. Leathwick JR, Wilson G, Rutledge D, Wardle P, Morgan F, Johnston K, McLeod M, Kirkpatrick R 2002b. Land environments of New Zealand. Auckland, David Bateman. 183 p. Liu H, Jezek K, Li B, Zhao Z 2001. Radarsat Antarctic Mapping Project digital elevation model Version 2. Boulder, CO, National Snow and Ice Data Center. Mackey BG, Nix HA, Hutchinson MF, McMahon JP, Fleming PM 1988. Assessing representativeness of places for conservation reservation and heritage listing. Environmental Management 12: 501–514. Morgan F, Leathwick J, Price R, Keys H 2005. Environmental Domains Analysis for the Antarctic continent. Landcare Research New Zealand, ATCM XXVIII/CEPVIII Information Paper 2. 57 p. Morgan F, Price R, Briggs C 2006. Analysis of the Antarctic Specially Protected and Managed Areas: Comparison to Environmental Domains of Antarctica. Landcare Research New Zealand Contract Report LC0506/108. 25 p. Udvardy MDF 1975. A classification of the biogeographical provinces of the world. Occasional Paper 18. Gland, IUCN. Walton DHM 2002. Editorial. How do we know that the Antarctic environment is fine? Antarctic Science 14: 113. Waterhouse EJ ed. 2001. Ross Sea region 2001. A State of the Environment Report for the Ross Sea region of Antarctica. Christchurch, New Zealand Antarctic Institute.
85
Landcare Research
Appendices
Table 25: Climate, Land Cover and Geology attributes for each environment
Table 26: ASPA and ASMA comparison table
List 1: List of ASPAs and ASMAs used in comparison

86
Landcare Research
Table 25: Climate, Land Cover and Geology attributes for each environment
Aver
age
Tem
p (°
C)
Seas
onal
R
ange
(°C
)
Aver
age
Sol
ar
Rad
iatio
n (M
J/m
2/D
ay)
Diu
rnal
Le
ngth
(D
ays)
Ave
rage
W
ind
Spee
d (m
/sec
)Sq
Roo
t of
Slop
e (°
)Ic
e Fr
eeIc
e Sh
eet
Ice
Shel
fIc
e To
ngue
sR
umpl
esSe
dim
enta
ryM
etam
orph
icIn
trusi
veV
olca
nic
Labe
lAr
ea in
sq
kmM
ean
Mea
nM
ean
Mea
nM
ean
Mea
nPe
rcen
tage
Perc
enta
geP
erce
ntag
ePe
rcen
tage
Perc
enta
gePe
rcen
tage
Perc
enta
gePe
rcen
tage
Perc
enta
geA
2812
-10.
33-1
1.68
10.2
836
4.97
12.2
224
.35
100%
0%0%
0%0.
00%
100%
0%0%
0%B
1659
2-1
1.15
-13.
0010
.05
359.
8110
.70
29.4
410
0%0%
0%0%
0.00
%0%
4%21
%20
%C
1442
9-1
6.03
-16.
239.
7525
8.11
9.79
21.7
310
0%0%
0%0%
0.00
%11
%0%
13%
0%D
6155
-15.
28-1
8.35
9.88
334.
6516
.14
10.9
410
0%0%
0%0%
0.00
%1%
7%74
%0%
E17
8130
-14.
06-1
5.04
9.85
287.
8610
.28
15.0
10%
100%
0%0%
0.00
%0%
0%0%
0%F
6652
0-1
0.29
-17.
879.
9234
6.34
10.2
92.
170%
0%10
0%0%
0.00
%0%
0%0%
0%G
966
-3.2
9-8
.82
10.6
436
4.28
13.8
613
.41
100%
0%0%
0%0.
00%
2%0%
24%
28%
H14
611
-12.
57-1
6.08
9.88
337.
9616
.58
3.31
0%0%
0%10
0%0.
00%
0%0%
0%0%
I27
3119
-11.
74-1
7.70
9.83
291.
8216
.66
2.50
0%0%
100%
0%0.
00%
0%0%
0%0%
J74
984
-13.
04-1
8.94
8.95
172.
8017
.23
3.43
0%1%
88%
11%
0.00
%0%
0%0%
0%K
1910
85-1
3.48
-19.
549.
3320
7.41
12.0
02.
790%
0%10
0%0%
0.01
%0%
0%0%
0%L
1868
548
-22.
95-1
8.50
9.75
292.
6915
.07
7.53
0%10
0%0%
0%0.
00%
0%0%
0%0%
M90
2626
-22.
76-2
0.62
8.87
170.
5312
.14
7.38
0%10
0%0%
0%0.
00%
0%0%
0%0%
N30
5893
6-3
9.25
-22.
829.
3521
0.64
12.8
14.
090%
100%
0%0%
0.00
%0%
0%0%
0%O
2256
425
-28.
60-2
2.74
7.48
98.6
013
.38
4.93
0%10
0%0%
0%0.
01%
0%0%
0%0%
P92
6631
-22.
23-2
6.39
7.83
113.
0311
.70
0.97
0%1%
99%
0%0.
33%
0%0%
0%0%
Q37
0911
1-4
7.64
-29.
507.
5610
5.19
9.99
3.10
0%10
0%0%
0%0.
00%
0%0%
0%0%
R31
581
-34.
79-2
6.43
6.70
66.1
410
.24
27.9
098
%2%
0%0%
0.00
%65
%2%
24%
3%S
2822
7-2
6.21
-23.
008.
5215
0.58
10.2
624
.12
98%
2%0%
0%0.
00%
47%
0%24
%8%
T24
742
-25.
98-1
9.64
9.39
212.
3714
.95
23.5
310
0%0%
0%0%
0.00
%11
%14
%71
%1%
U30
578
-25.
62-1
8.45
9.38
212.
1613
.78
30.4
552
%48
%0%
0%0.
00%
30%
5%6%
9%

87
Landcare Research
Table 26: ASPA and ASMA comparison table
ASPA/AMSA A B C D E F G H I J K L M N O P Q R S T U Environment
ASPA 101 x DASPA 102 x x D, LASPA 103 x LASPA 105 x SASPA 108 x BASPA 109 x GASPA 111 x x A, GASPA 112 x GASPA 113 x EASPA 114 x x E, GASPA 115 x BASPA 117 x EASPA 118 x UASPA 119 x x O, RASPA 121 x x P, SASPA 122 x SASPA 123 x x O, SASPA 124 x x P, SASPA 125 x GASPA 126 x x E, GASPA 127 x LASPA 128 x x x A, E, GASPA 129 x EASPA 131 x SASPA 132 x GASPA 133 x EASPA 134 x x B, EASPA 135 x DASPA 136 x x D, LASPA 137 x x x O, P, SASPA 138 x SASPA 139 x EASPA 140 x x B, GASPA 141 x DASPA 142 x NASPA 143 x DASPA 145 x GASPA 147 x x E, KASPA 149 x x E, GASPA 150 x GASPA 151 x AASPA 152 x x E, GASPA 153 x BASPA 154 x SASPA 155 x SASPA 156 x x O, SASPA 157 x PASPA 161 x x S, TASPA 163 x x D, IASPA 164 x x D, LTOTALS 3 5 0 8 12 0 13 0 1 0 1 5 0 1 4 4 0 1 12 1 1
ASPA/AMSA A B C D E F G H I J K L M N O P Q R S T U EnvironmentASMA 1 x x x A, E, GASMA 2 x x x x x x C, M, O, P, Q, SASMA 3 x LASMA 4 x x x B, E, GTOTALS 1 1 1 0 2 0 2 0 0 0 0 1 1 0 1 1 1 0 1 0 0

88
Landcare Research
List 1: List of ASPAs and ASMAs used in comparison
Antarctic Specially Protected Areas (ASPA) 101 – Taylor Rookery, Mac Robertson Land
102 – Rookery Islands, Holme Bay, Mac Robertson Land
103 – Ardery Island and Odbert Island, Budd Coast
104 – Sabrina Island, Balleny Islands
105 – Beaufort Island, Ross Sea
106 – Cape Hallett, Victoria Land
107 – Emperor Island, Dion Islands, Marguerite Bay, Antarctic Peninsula
108 – Green Island, Berthelot Islands, Antarctic Peninsula
109 – Moe Island, South Orkney Islands
110 – Lynch Island, South Orkney Islands
111 – Southern Powell Island and adjacent islands, South Orkney Islands
112 – Coppermine Peninsula, Robert Island, South Shetland Islands
113 – Litchfield Island, Arthur Harbour, Anvers Island, Palmer Archipelago
114 – Northern Coronation Island, South Orkney Islands
115 – Lagotellerie Island, Marguerite Bay, Antarctic Peninsula
116 – 'New College Valley', Caughley Beach, Cape Bird, Ross Island
117 – Avian Island, off Adelaide Island, Antarctic Peninsula
118 – Summit of Mount Melbourne, Victoria Land (incorporating 'Cryptogam Ridge')
119 – Forlidas Pond and Davis Valley ponds, Dufek Massif
120 – 'Pointe-Géologie Archipelego', Terre Adélie
121 – Cape Royds, Ross Island
122 – Arrival Heights, Hut Point Peninsula, Ross Island
123 – Barwick and Balham Valleys, Victoria Land
124 – Cape Crozier, Ross Island
125 – Fildes Peninsula, King George Island, South Shetland Islands
126 – Byers Peninsula, Livingston Island, South Shetland Islands
127 – Haswell Island
128 – Western shore of Admiralty Bay, King George Island
129 – Rothera Point, Adelaide Island
130 – 'Tramway Ridge', Mount Erebus, Ross Island
131 – Canada Glacier, Lake Fryxell, Taylor Valley, Victoria Land
132 – Potter Peninsula, '25 de Mayo' (King George) Island, South Shetland Islands
133 – Harmony Point, west coast of Nelson Island, South Shetland Islands
134 – Cierva Point and offshore islands, Danco Coast, Antarctic Peninsula
135 – North-eastern Bailey Peninsula, Budd Coast, Wilkes Land

89
Landcare Research
136 – Clark Peninsula, Budd Coast, Wilkes Land
137 – Northwest White Island, McMurdo Sound
138 – Linnaeus Terrace, Asgard Range, Victoria Land
139 – Biscoe Point, Anvers Island
140 – Parts of Deception Island, South Shetland Islands
141 – 'Yukidori Valley', Langhovde, Lützow-Holmbukta
142 – Svarthamaren, Mühlig-Hofmannfjella, Dronning Maud Land
143 – Marine Plain, Mule Peninsula,Vestfold Hills, Princess Elizabeth Land
144 – 'Chile Bay' (Discovery Bay), Greenwich Island, South Shetland Islands
145 – Port Foster, Deception Island, South Shetland Islands
146 – South Bay, Doumer Island, Palmer Archipelago
147 – Ablation Valley-Ganymede Heights, Alexander Island
148 – Mount Flora, Hope Bay, Antarctic Peninsula
149 – Cape Shirreff, Livingston Island, South Shetland Islands
150 – Ardley Island, Maxwell Bay, King George Island
151 – Lions Rump, King George Island, South Shetland Islands
152 – Western Bransfield Strait off Low Island, South Shetland Islands
153 – Eastern Dallmann Bay off Brabant Island, Palmer Archipelago
154 – Botany Bay, Cape Geology, Victoria Land
155 – Cape Evans, Ross Island
156 – Lewis Bay, Mount Erebus, Ross Island
157 – Backdoor Bay, Cape Royds, Ross Island
158 – Hut Point, Ross Island
159 – Cape Adare, Borchgrevink Coast
160 – Frazier Islands, Wilkes Land, East Antarctica
161 – Terra Nova Bay, Ross Sea
162 – Mawson's Huts, Commonwealth Bay, George V Land, East Antarctica
163 – Dakshin Gangotri Glacier, Dronning Maud Land
164 – Scullin and Murray Monoliths, Mac Robertson Land, East Antarctica
Antarctic Specially Managed Areas (ASMA) 1 – Admiralty Bay, King George Island, South Shetland Islands
2 – McMurdo Dry Valleys, Southern Victoria Land
3 – Cape Denison, Commonwealth Bay, George V Land
4 – Deception Island